Potential outcomes and propensity score methods for hospital performance comparisons Patrick Graham, University of Otago, Christchurch

Welcome message from author
This document is posted to help you gain knowledge. Please leave a comment to let me know what you think about it! Share it to your friends and learn new things together.
Transcript
Potential outcomes and propensity score methods for hospital performance comparisons
Patrick Graham,University of Otago, Christchurch

Acknowledgements
• Research team includes:
Phil Hider, Zhaojing Gong
– University of Otago, Christchurch
Jackie Cumming, Antony Raymont, - Health Services Research Centre , Victoria
University of Wellington
Mary Finlayson, Gregor Coster,
- University of Auckland
• Funded by HRC

Context
• Study of variation in NZ public hospital outcomes• Data Source: NMDS – Public Hospital Discharge
Database, linked to mortality data by NZHIS.• Outcomes: Several outcomes developed by AHRQ ;
10+ in first study, 20-30 in second study.• Multiple analysts involved – range of statistical
experience• Ideally, would like to jointly model performance on
multiple outcomes.
Statistical Contributions to Hospital Performance Comparisons
• “Institutional Performance” , “Provider Profiling”• Spiegelhalter (e.g. Goldstein & Spiegelhalter, JRSSA, 1996)• Normand (e.g. Normand et al JASA, 1997)• Gatsonis (e.g. Daniels & Gatsonis, JASA 1999)• Howley & Gibberd (e.g Howley & Gibberd, 2003)
Role of Bayesian Methods
• Hierarchical Bayes methods prominent -- shrinkage, pooling
• Good use made of posterior distributions, e.g.
Pr(risk for hospital h > 1.5 x median risk | data) (Normand, 1997)
Pr(risk for hospital h in upper quartile of risks | data)
Hospital performance and causal inference
• Adequate control for case-mix variation is critical to valid comparisons of hospital performance.
• In discussion of Goldstein & Spiegelhalter (1996) Draper comments :
“Statistical adjustment is causal inference in disguise.” • Here I remove the disguise by locating hospital
performance comparisons within the framework of Potential Outcomes models.
Potential Outcomes Framework
• Neyman (1923), Rubin (1978). • Key idea is that, in place of a single outcome variable,
we imagine a vector of potential outcomes corresponding to the possible exposure levels.
• Causal effects can then be defined in terms of contrasts between potential outcomes.
• Counterfactual because only observe one response – the fundamental inferential problem
Application of potential outcomes to hospital performance comparisons - notation
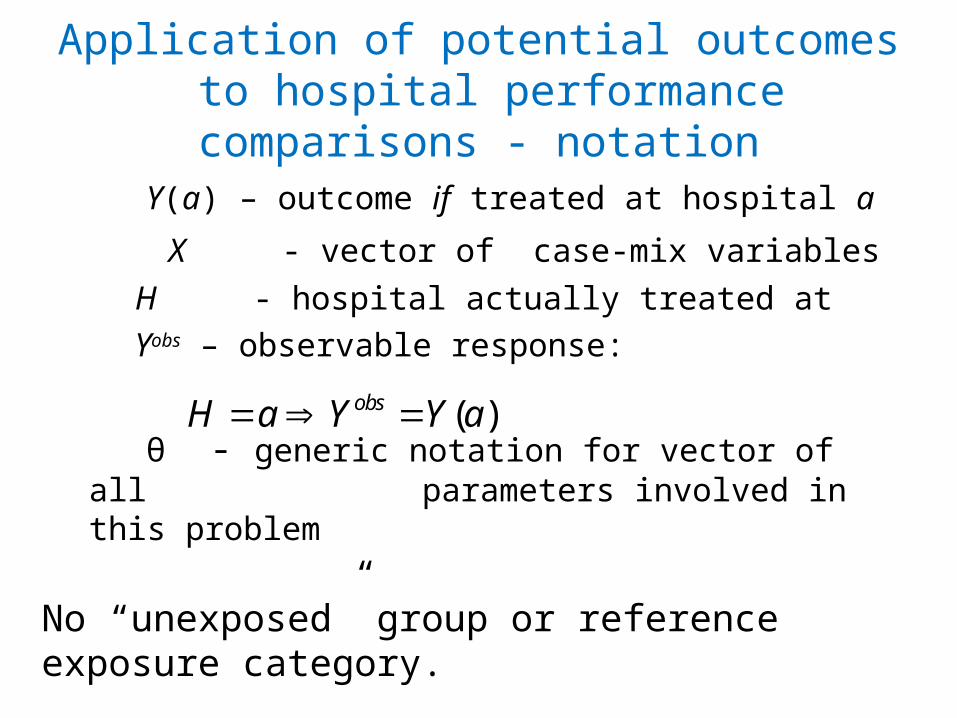
Y(a) – outcome if treated at hospital a
X - vector of case-mix variables
H - hospital actually treated at
Yobs – observable response:
θ - generic notation for vector of all parameters involved in this problem
( )obsH a Y Y a
No “unexposed” group or reference exposure category.
Application of Potential Outcomes to hospital performance – key ideas
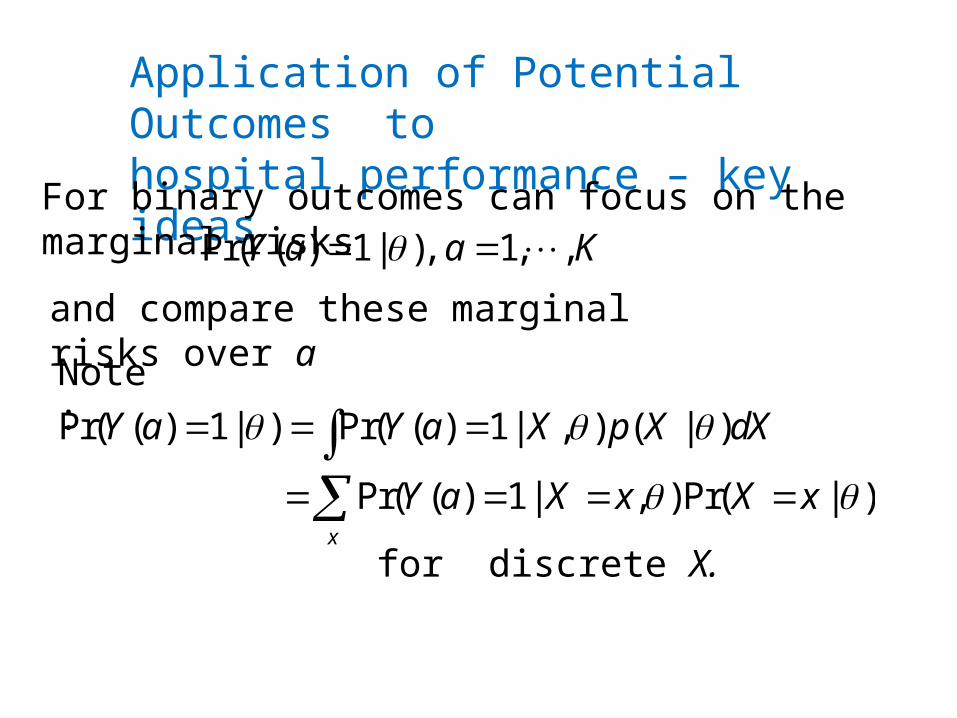
Pr( ( ) 1| ), 1 ,, KY a a For binary outcomes can focus on the marginal risks
and compare these marginal risks over a
Note:
Pr( ( ) 1| ) Pr( ( ) 1| , ) ( | )
Pr( ( ) 1| , )Pr( | )x
Y a Y a X p X dX
Y a X x X x
for discrete X.
Ignorability
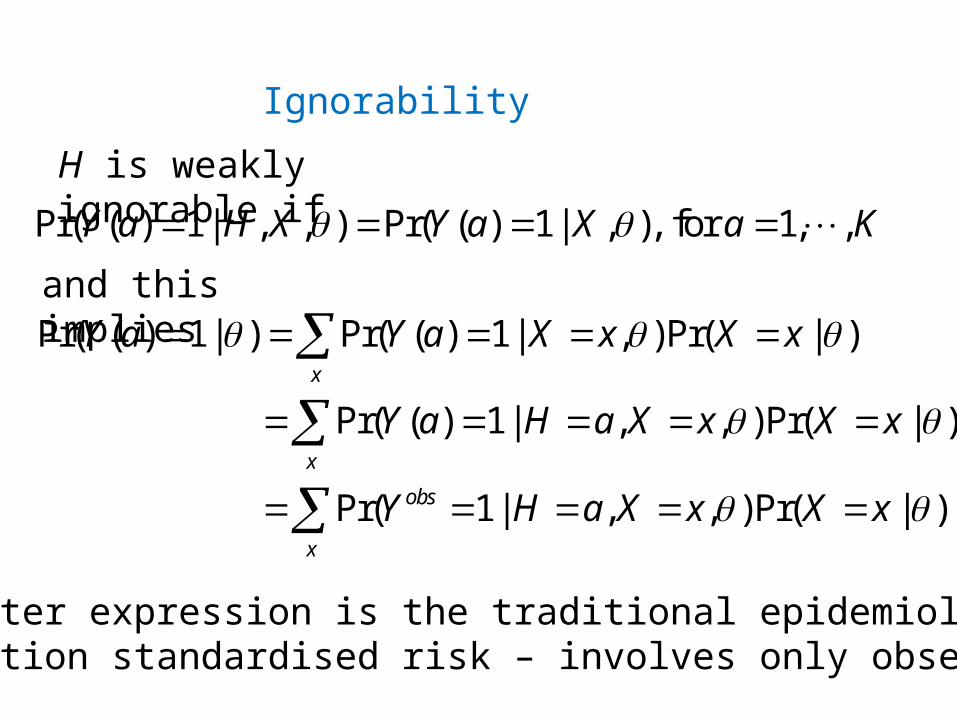
H is weakly ignorable if
Pr( ( ) 1| , , ) Pr( ( ) 1| , ), for 1 ,,Y a H X Y a X a K
and this impliesPr( ( ) 1| ) Pr( ( ) 1| , )Pr( | )
Pr( ( ) 1| , , )Pr( | )
Pr( 1| , , )Pr( | )
x
x
obs
x
Y a Y a X x X x
Y a H a X x X x
Y H a X x X x
The latter expression is the traditional epidemiological population standardised risk – involves only observables
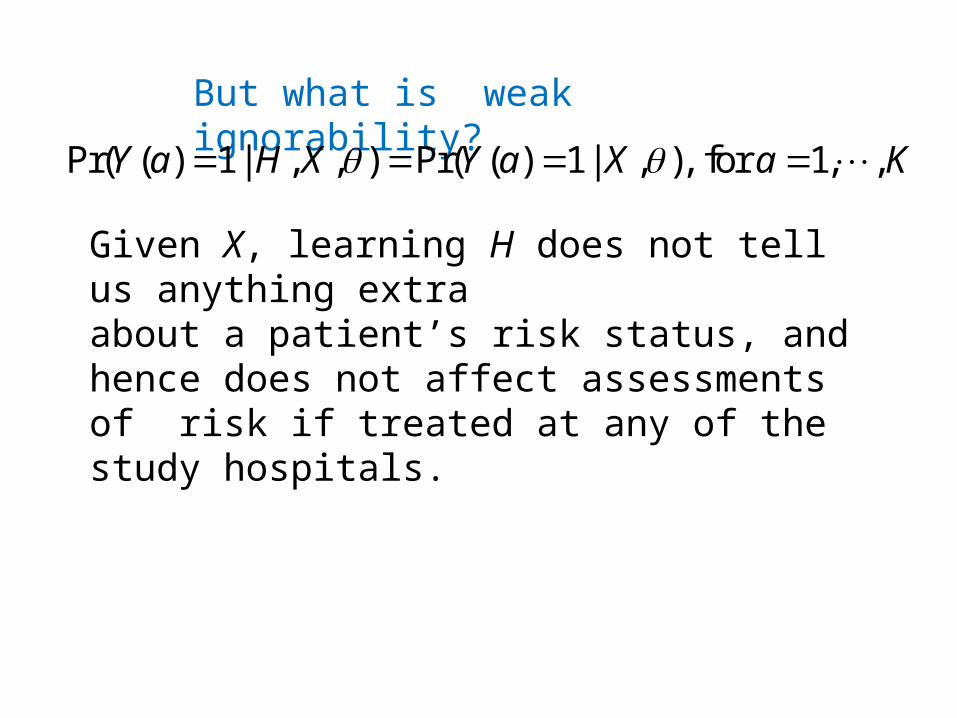
But what is weak ignorability?
Pr( ( ) 1| , , ) Pr( ( ) 1| , ), for 1 ,,Y a H X Y a X a K
Given X, learning H does not tell us anything extra about a patient’s risk status, and hence does not affect assessments of risk if treated at any of the study hospitals.
Two examples of non-ignorability
• Hospitals select low risk patients and good measures of risk are not included in X.
• High risk patients select particular hospitals and good measures of risk are not included in X.

Practicalities
If weak ignorability holds, we need only consider models for the observable outcomes.
For example, a hierarchical logistic model with hospital specific parameters linked by a prior model which depends on hospital characteristics.
Practicalities (2)
• Many case-mix factors (X) to control; age, sex, ethnicity, deprivation, 30 comorbidities, 1 – 3 severity indicators.
• Tens of thousands of patients.
• Full Bayesian model-fitting via MCMC can be impractical for large models and datasets.
• With large number of case-mix factors overlap in covariate distributions between hospitals may be insufficient for credible standard statistical adjustment.
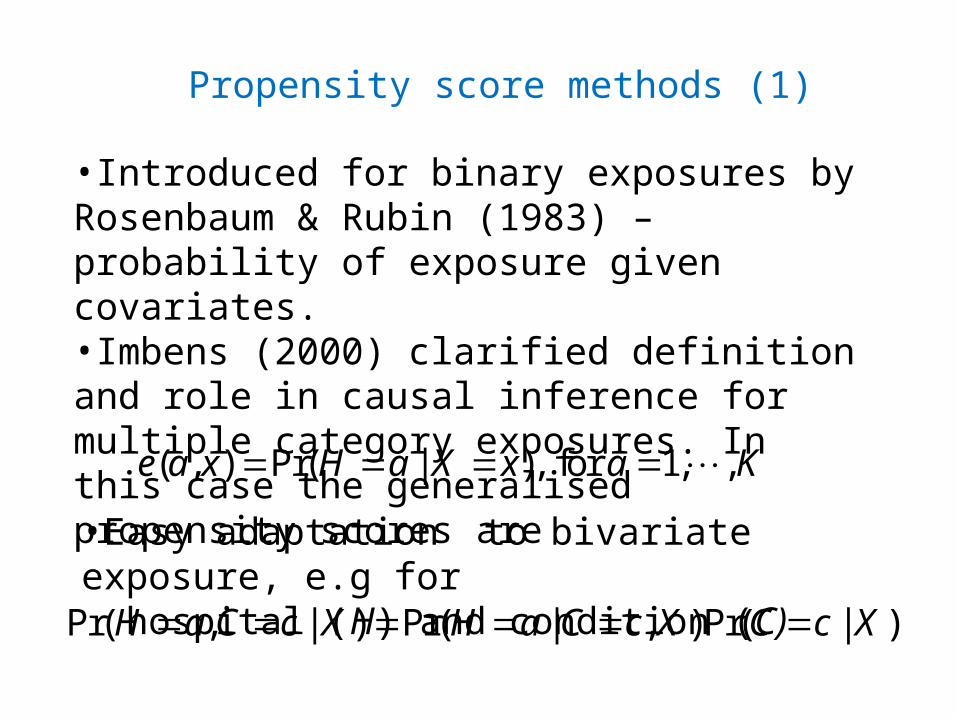
Propensity score methods (1)
•Introduced for binary exposures by Rosenbaum & Rubin (1983) – probability of exposure given covariates.•Imbens (2000) clarified definition and role in causal inference for multiple category exposures. In this case the generalised propensity scores are
( , ) Pr( | ), for 1, ,e a x H a X x a K
•Easy adaptation to bivariate exposure, e.g for hospital (H) and condition (C)
Pr( , | ) Pr( | , )Pr( | )H a C c X H a C c X C c X
Propensity score methods (2)
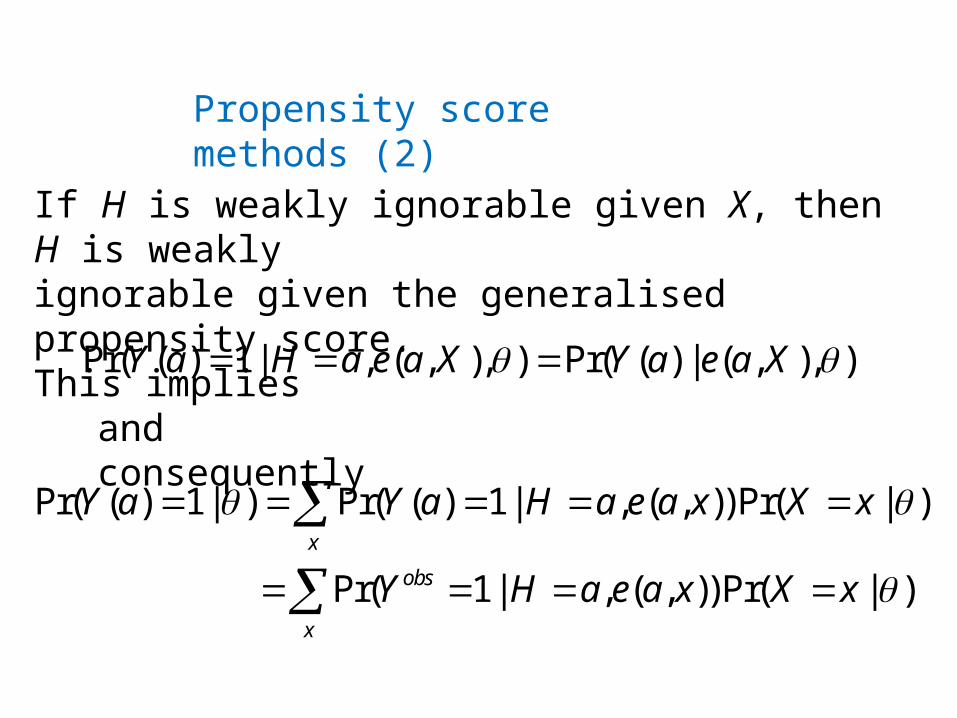
If H is weakly ignorable given X, then H is weakly ignorable given the generalised propensity score.This implies
Pr( ( ) 1| , ( , ), ) Pr( ( ) | ( , ), )Y a H a e a X Y a e a X
and consequently
Pr( ( ) 1| ) Pr( ( ) 1| , ( , ))Pr( | )
Pr( 1| , ( , ))Pr( | )
x
obs
x
Y a Y a H a e a x X x
Y H a e a x X x
Propensity score methods (3)
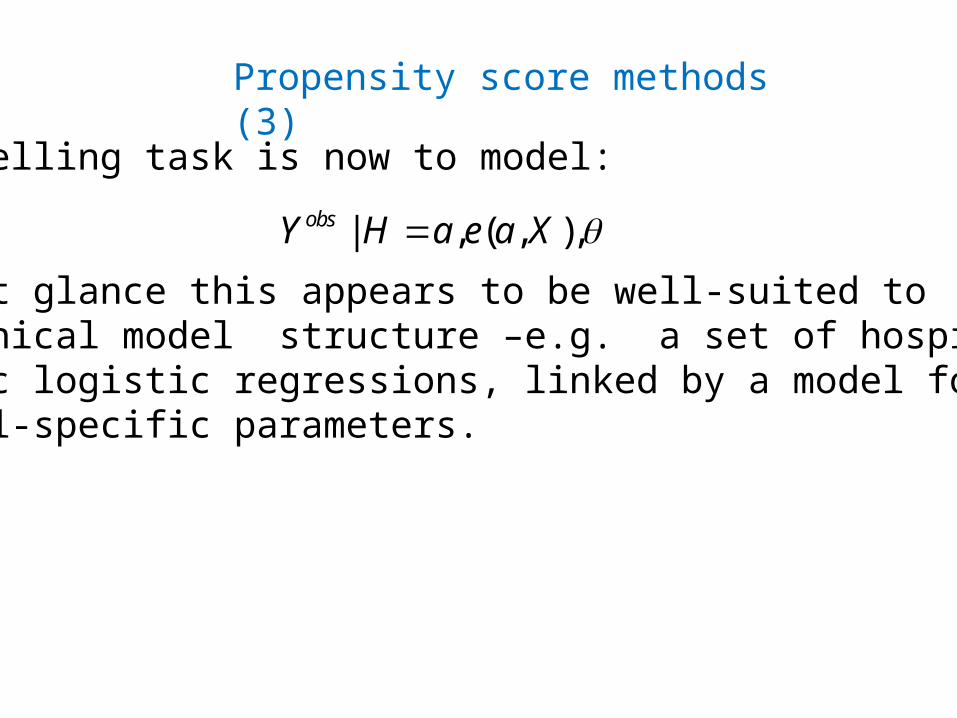
The modelling task is now to model:
At first glance this appears to be well-suited to ahierarchical model structure –e.g. a set of hospital specific logistic regressions, linked by a model for the hospital-specific parameters.
| , ( , ),obsY H a e a X
Propensity score methods (4)
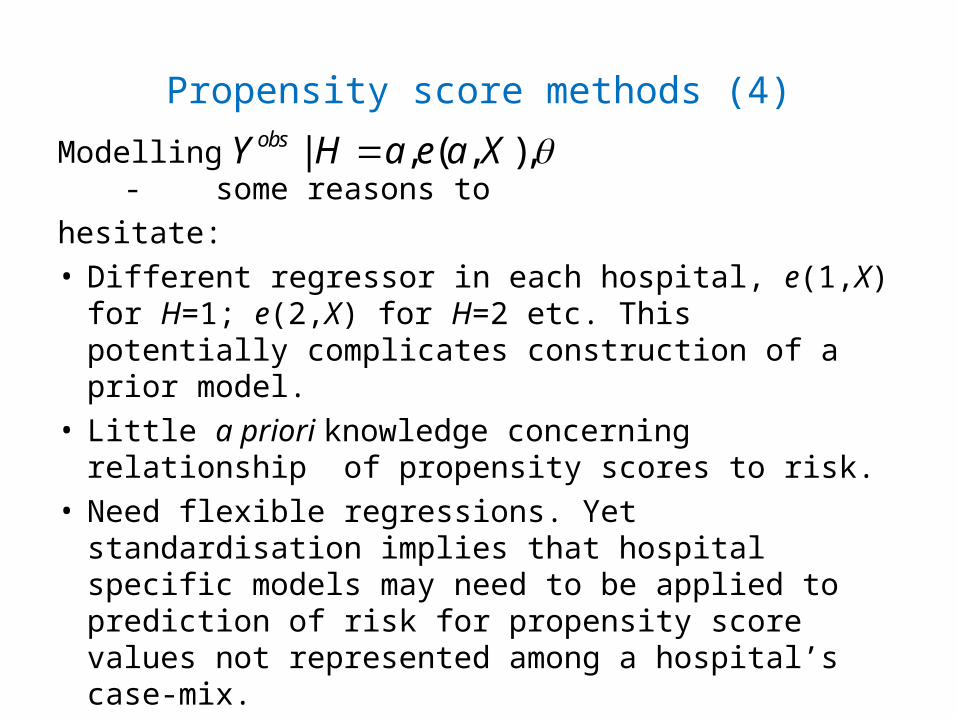
Modelling - some reasons to
hesitate:
• Different regressor in each hospital, e(1,X) for H=1; e(2,X) for H=2 etc. This potentially complicates construction of a prior model.
• Little a priori knowledge concerning relationship of propensity scores to risk.
• Need flexible regressions. Yet standardisation implies that hospital specific models may need to be applied to prediction of risk for propensity score values not represented among a hospital’s case-mix.
| , ( , ),obsY H a e a X
Propensity score methods (5): Stratification on propensity scores followed by smoothing
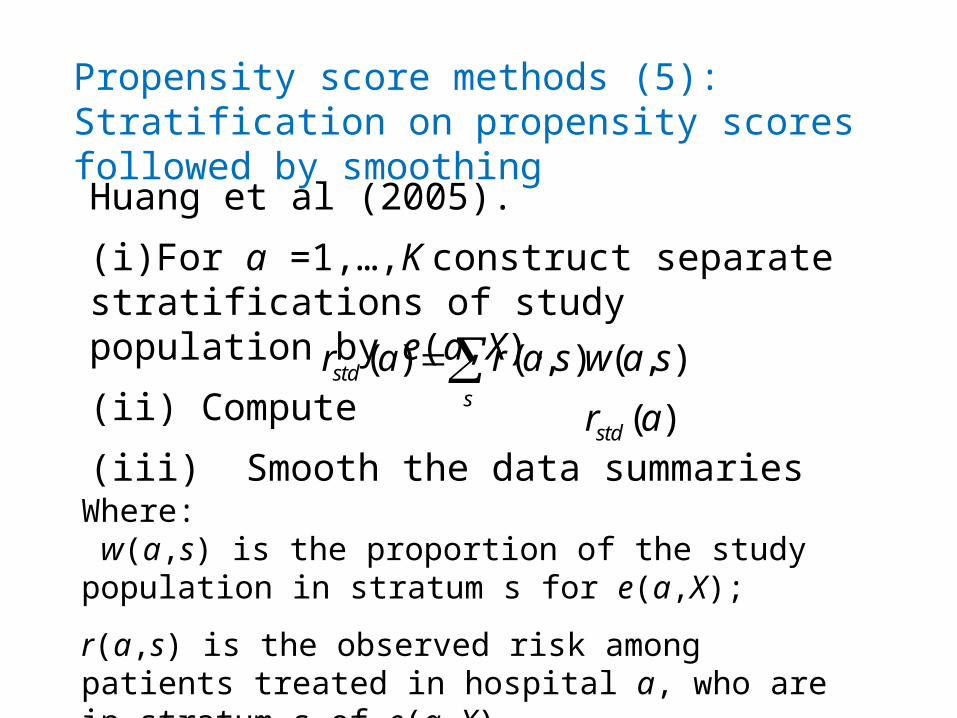
Huang et al (2005).
(i)For a =1,…,K construct separate stratifications of study population by e(a,X).
(ii) Compute
(iii) Smooth the data summaries
( ) ( , ) ( , )stds
r a r a s w a s
Where: w(a,s) is the proportion of the study population in stratum s for e(a,X);
r(a,s) is the observed risk among patients treated in hospital a, who are in stratum s of e(a,X).
( )stdr a

Joint modelling of standardised risks for multiple conditions.
Compute non-parametric estimates of standardised risks for each condition and hospital, rstd(a,c)
, , ,
,
1,
[logit( ( , )) | ] ~ ( , ), 1,
~ ( , ), independently for a = 1,
( , ) ~ ()
assumed known (set to de
, ; 1,
lta esti
2,
(
ma )
) ,
te
indep
std a c a c a c
aa
a c
aC
K c C
K
r a c N v a
MVN Z
p
v
A hierarchical multivariate normal model.
Inference based on joint posterior for μ
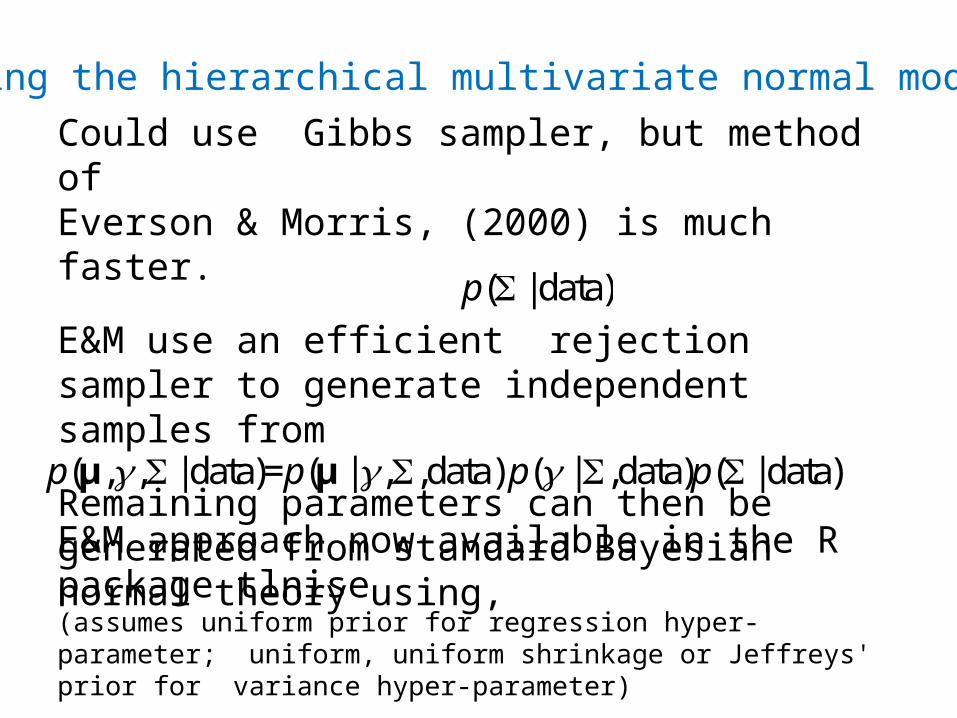
Fitting the hierarchical multivariate normal model.
Could use Gibbs sampler, but method of Everson & Morris, (2000) is much faster.
E&M use an efficient rejection sampler to generate independent samples from
Remaining parameters can then be generated from standard Bayesian normal theory using,
( | data)p
( , , | data)= ( | , ,data) ( | ,data) ( | data)p p p p μ μ
E&M approach now available in the R package tlnise(assumes uniform prior for regression hyper-parameter; uniform, uniform shrinkage or Jeffreys' prior for variance hyper-parameter)
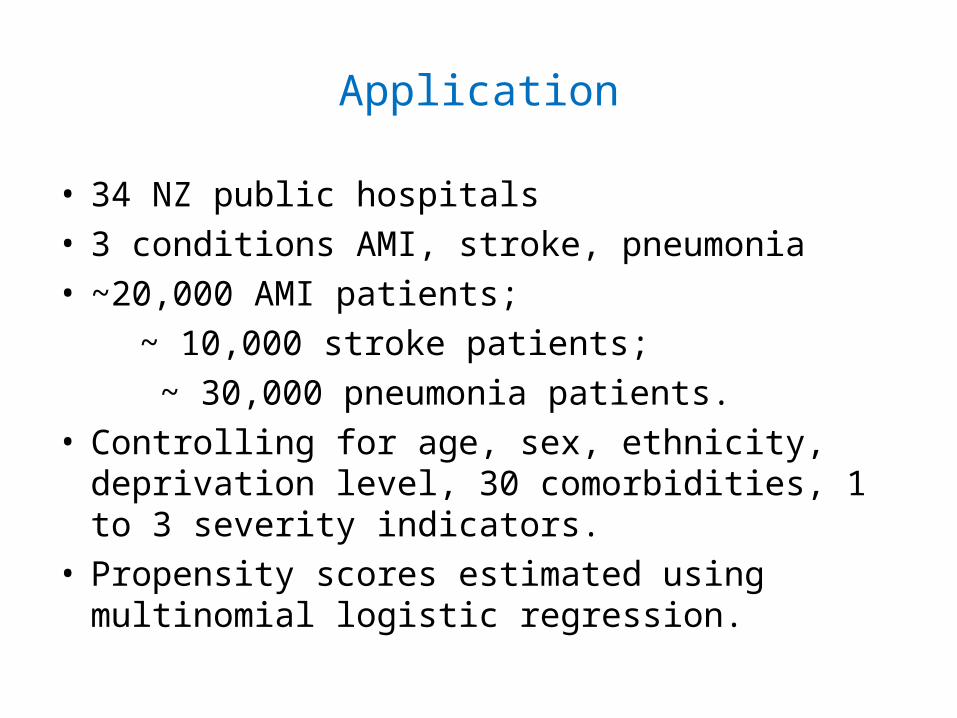
Application
• 34 NZ public hospitals
• 3 conditions AMI, stroke, pneumonia
• ~20,000 AMI patients;
~ 10,000 stroke patients;
~ 30,000 pneumonia patients.
• Controlling for age, sex, ethnicity, deprivation level, 30 comorbidities, 1 to 3 severity indicators.
• Propensity scores estimated using multinomial logistic regression.
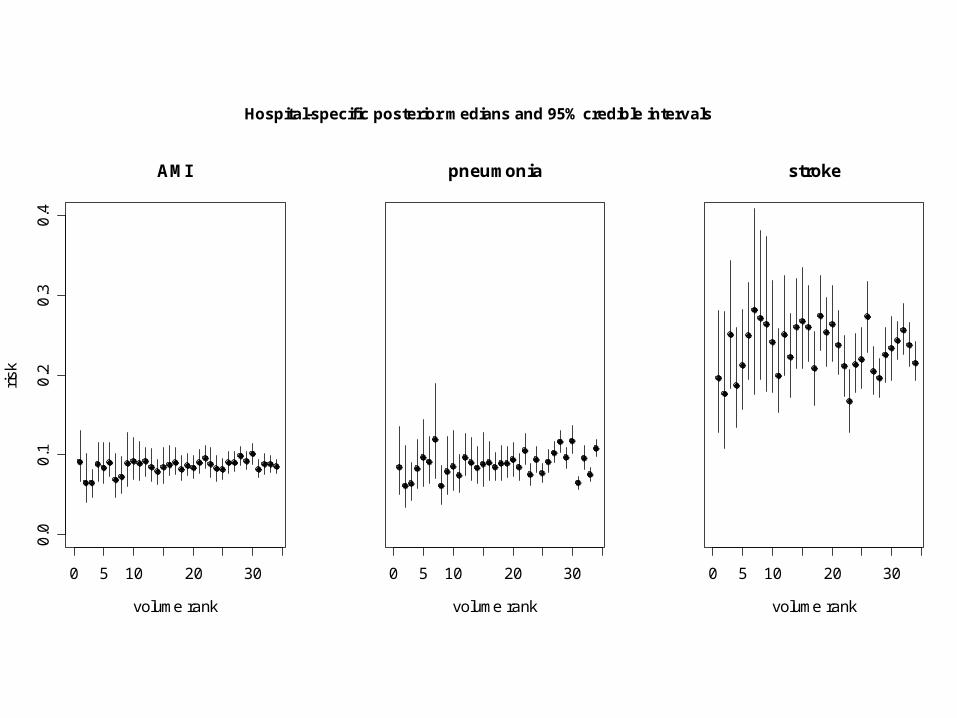
0 5 10 20 30
0.0
0.1
0.2
0.3
0.4
AMI
volume rank
risk
0 5 10 20 30
pneumonia
volume rank
0 5 10 20 30
stroke
volume rank
Hospital-specific posterior medians and 95% credible intervals
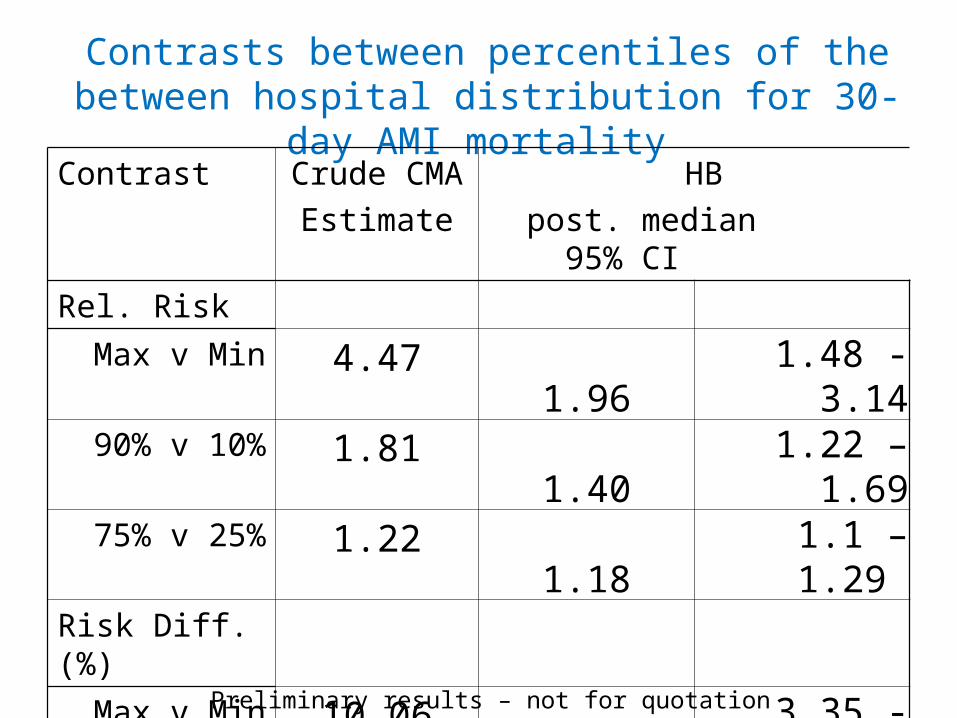
Contrasts between percentiles of the between hospital distribution for 30-day AMI mortality
Contrast Crude CMA
Estimate
HB
post. median 95% CI
Rel. Risk
Max v Min 4.47 1.96 1.48 - 3.1490% v 10% 1.81 1.40 1.22 – 1.6975% v 25% 1.22 1.18 1.1 – 1.29
Risk Diff.(%)
Max v Min 10.06 5.43 3.35 - 8.7990% v 10% 5.37 2.86 1.76 – 4.2975% v 25% 1.77 1.43 0.8 - 2.17 Preliminary results – not for quotation
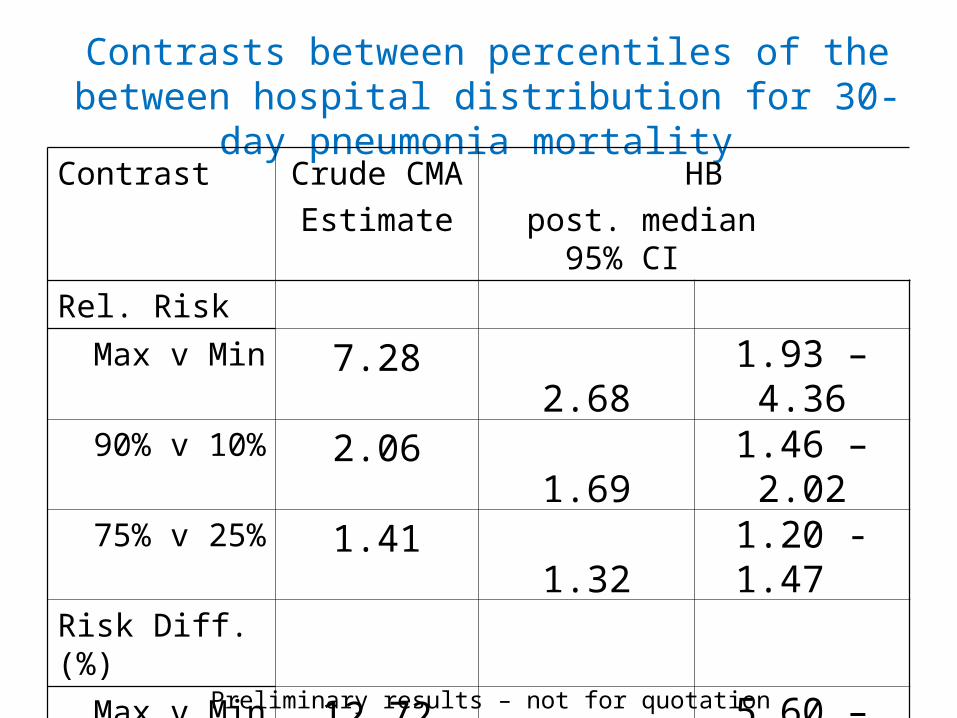
Contrasts between percentiles of the between hospital distribution for 30-day pneumonia mortality
Contrast Crude CMA
Estimate
HB
post. median 95% CI
Rel. Risk
Max v Min 7.28 2.68 1.93 – 4.3690% v 10% 2.06 1.69 1.46 – 2.0275% v 25% 1.41 1.32 1.20 -1.47
Risk Diff.(%)
Max v Min 12.72 8.27 5.60 – 13.9190% v 10% 6.37 4.57 3.39- 6.13 75% v 25% 3.07 2.45 1.60 – 3.39 Preliminary results – not for quotation
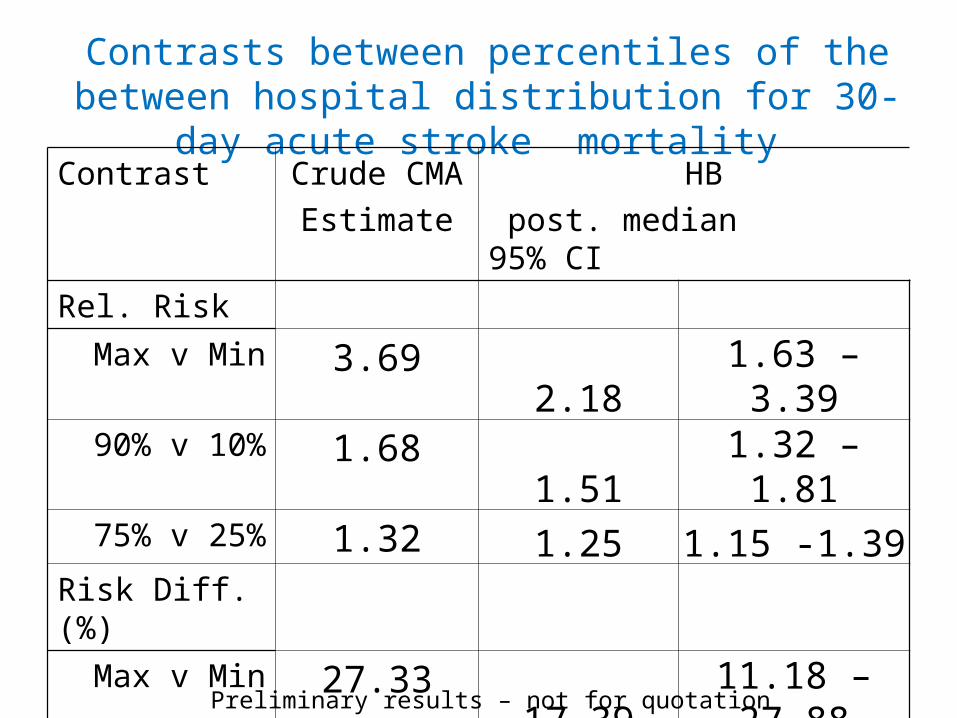
Contrasts between percentiles of the between hospital distribution for 30-day acute stroke mortality
Contrast Crude CMA
Estimate
HB
post. median 95% CI
Rel. Risk
Max v Min 3.69 2.18 1.63 – 3.3990% v 10% 1.68 1.51 1.32 – 1.8175% v 25% 1.32 1.25 1.15 -1.39
Risk Diff.(%)
Max v Min 27.33 17.39 11.18 – 27.8890% v 10% 12.53 9.56 6.37 – 13.4375% v 25% 6.54 5.19 3.25 – 7.88
Preliminary results – not for quotation
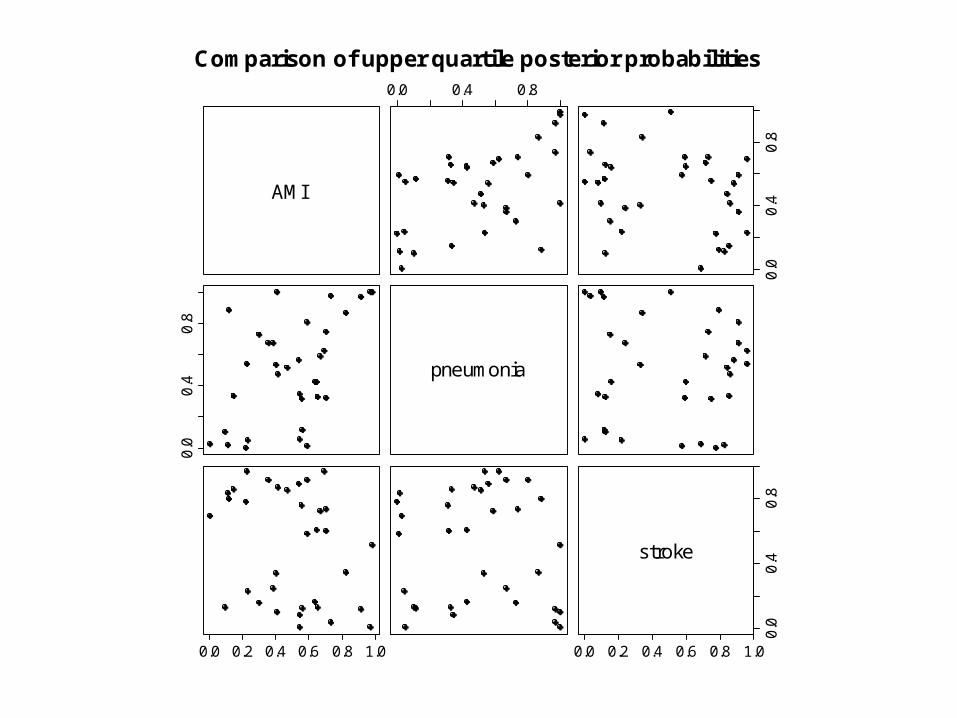
AMI
0.0 0.4 0.8
0.0
0.4
0.8
0.0
0.4
0.8
pneumonia
0.0 0.2 0.4 0.6 0.8 1.0 0.0 0.2 0.4 0.6 0.8 1.0
0.0
0.4
0.8
stroke
Comparison of upper quartile posterior probabilities
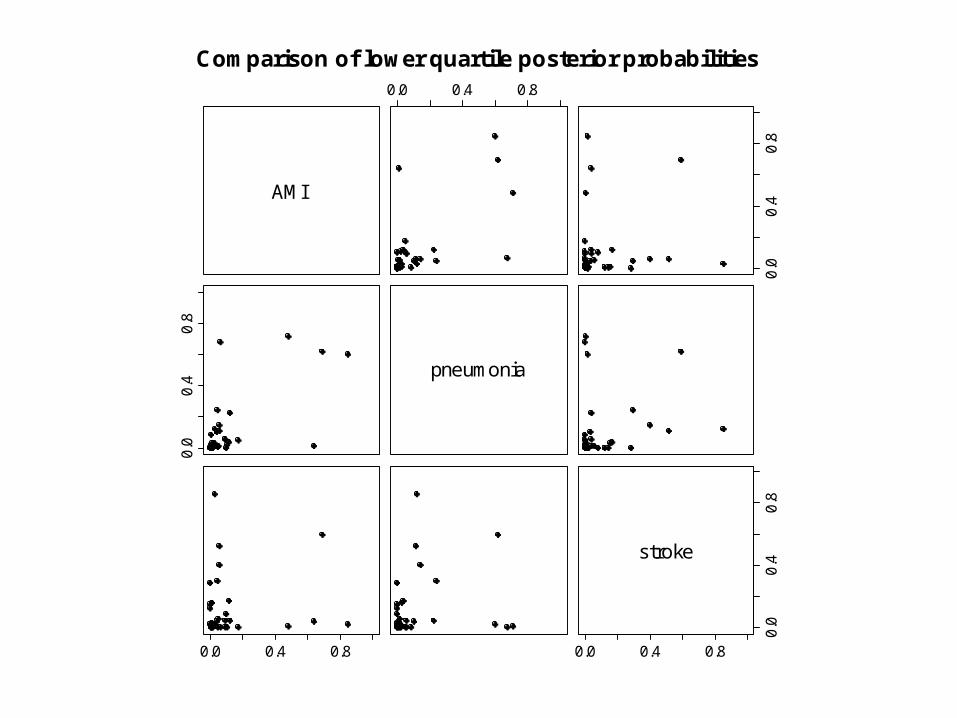
AMI
0.0 0.4 0.8
0.0
0.4
0.8
0.0
0.4
0.8
pneumonia
0.0 0.4 0.8 0.0 0.4 0.8
0.0
0.4
0.8
stroke
Comparison of lower quartile posterior probabilities
Summary
• Imperfect methodology
- likelihood approximation
- stratification
• Nevertheless, the approach focusses attention on the key issue of case mix adjustment.
• Computing time is minutes rather than many, many hours for full Bayesian modelling.
Discussion
• Propensity score theory is worked out assuming known propensity scores.
• In practice propensity scores are estimated, but uncertainty concerning propensity scores is not reflected in analysis.
• Recent work by McCandless et al (2009a, 2009b) allows for uncertain propensity scores but results are unconvincing as to merits of this approach, even though it appears Bayesianly correct.
• When exploring sensitivity to unmeasured confounders the propensity score is inevitably uncertain.
• An interesting puzzle which needs more work.
Discussion cont’d
• What do we gain from potential outcomes framework?
- focus on ignorability assumption and hence adequacy of case-mix adjustment . - propensity score methodology
• Nevertheless, could arrive at the analysis methodology, – nonparametric standardisation followed by smoothing, by some other route.
Related Documents