Potential of the electronic-nose for the diagnosis of bacterial and fungal diseases in fruit trees* F. Spinelli 1 , M. Noferini 1 , J. L. Vanneste 2 and G. Costa 1 1 University of Bologna, Dipartimento di Colture Arboree, viale Fanin 46 – 40127, Bologna (Italy); e-mail: [email protected] 2 HortResearch, Ruakura Research Centre, Private Bag 3123, Hamilton (New Zealand) The electronic-nose instrumentation has advanced rapidly during the past decade, as the need for highly sensitive, fast and accurate analytical measurements have considerably stimulated the interest in developing these sensors as diagnostic tools. Given that the pathogen-induced plant responses also include changes in emission of volatiles, the electronic-nose may represent a powerful and operator- friendly alternative for rapid and reliable screening of asymptomatic plant material. In the present study, the electronic nose EOS 835 (Sacmi, Imola, Italy), based on metal oxide semiconductors, was used. EOS 835 was able to detect asymptomatic apple and pear plants experimentally infected with Erwinia amylovora (fire blight). The electronic nose was also successfully tested for discriminating Botrytis and Sclerotinia rots on both green and yellow kiwifruits. Even if the electronic-nose can be successfully used in experimental conditions for early diagnosis of both pre- and post-harvest diseases, its practical application in open fields, nurseries and packing houses still requires further studies. Introduction Plants accumulate a diverse array of natural products, which are thought to be involved in their interactions with the environment. These chemicals play a role in interactions with microbes, ani- mals, and even other plants, as well as protecting the plant from ultraviolet radiation and oxidants. Many of these compounds have been referred to as ‘secondary metabolites’ to distinguish them from the ‘primary metabolites’ required for the growth of all plants (Theis & Lerdau, 2003). These secondary metabolites, are likely to be essential for plants successful competition or reproduction. Among the secondary metabolites, a relevant role is played by volatile organic compounds (VOCs). The importance of these compounds can be deduced by the considerable amount of photo- assimilated carbon released back into the atmosphere as VOCs (Holopainen, 2004). While many plants contain large amounts of stored VOCs, others do not synthesize and emit them until a stimulus (such as pathogen infection) is perceived (Alborn et al. , 1997; Holopainen, 2004; Pare ´ et al., 2005). Induced volatiles (IVOCs) may be emitted hours or days after an attack, both from the site of injury as well as systemically from undamaged plant leaves (Pare ´ & Tumlinson, 1997, 1999; Mattiacci et al. , 2001). Recent research showed that specific volatiles are produced during the plant pathogen interactions (Turner & Magan, 2004). Therefore the profiling of the IVOCs emission by infected plants or fruits was considered to represent a novel approach for disease diagnosis (Spinelli et al. , 2006). However, the techniques, such as the gas chromatography- mass spectroscopy, currently used for characterizing the VOCs contributing to the olfactory profile of a specimen are expensive, time consuming and require highly specialized personnel (Heinzle, 1992; Saevels et al., 2003a, 2003b, 2004; Turner & Magan, 2004). An interesting alternative to these analytical techniques is represented by the electronic-nose (e-nose). The e-nose, by mimicking the mammalian smell sensor, is an instrument able to detect the olfactory fingerprint of a specimen (Pearce, 1997; Pavlou & Turner, 2000). In contrast with gas chro- matography-mass spectroscopy, the data obtained using an e-nose consists of olfactory fingerprints; therefore the analysis of the odour profile is only comparative rather than quantitative (Tothill, 2001). The e-nose is typically made of three elements: a sensor array which is exposed to the volatiles, the converter of signals to a readable format and the software-based data analyser to produce characteristic outputs related to the odour encountered (Stetter, 1986; Aishima, 1991; Pearce et al., 1993; Magan & Evans, 2000; Baratto et al. , 2005). A variety of sensors are available for use in e-nose systems. The most common types are metal oxide or conducting polymer based (Magan & Evans, 2000). To discriminate between samples, the output from the sensor array may be interpreted via a variety of methods such as pattern recognition algorithms, principal component analysis (PCA), discriminant function analysis, cluster analysis or artificial neural network. The qualitative discrimination power of e-nose often has an uncanny resemblance to the subjective discrimination of odours *Paper presented at the EPPO Conference on Diagnostics, organized in cooper- ation with the Food and Environment Research Agency (Fera), York, GB, 2009-05-10 ⁄ 15. ª 2010 The Authors. Journal compilation ª 2010 OEPP/EPPO, Bulletin OEPP/EPPO Bulletin 40, 59–67 59

Welcome message from author
This document is posted to help you gain knowledge. Please leave a comment to let me know what you think about it! Share it to your friends and learn new things together.
Transcript

Potential of the electronic-nose for the diagnosis of bacterial andfungal diseases in fruit trees*
F. Spinelli1, M. Noferini1, J. L. Vanneste2 and G. Costa1
1University of Bologna, Dipartimento di Colture Arboree, viale Fanin 46 – 40127, Bologna (Italy); e-mail: [email protected], Ruakura Research Centre, Private Bag 3123, Hamilton (New Zealand)
*Paper presented at the EPPO Conference
ation with the Food and Environment R
2009-05-10 ⁄ 15.
ª 2010 The Authors. Journal compila
The electronic-nose instrumentation has advanced rapidly during the past decade, as the need for
highly sensitive, fast and accurate analytical measurements have considerably stimulated the interest
in developing these sensors as diagnostic tools. Given that the pathogen-induced plant responses also
include changes in emission of volatiles, the electronic-nose may represent a powerful and operator-
friendly alternative for rapid and reliable screening of asymptomatic plant material. In the present
study, the electronic nose EOS835 (Sacmi, Imola, Italy), based on metal oxide semiconductors, was
used. EOS835 was able to detect asymptomatic apple and pear plants experimentally infected with
Erwinia amylovora (fire blight). The electronic nose was also successfully tested for discriminating
Botrytis and Sclerotinia rots on both green and yellow kiwifruits. Even if the electronic-nose can
be successfully used in experimental conditions for early diagnosis of both pre- and post-harvest
diseases, its practical application in open fields, nurseries and packing houses still requires further
studies.
Introduction
Plants accumulate a diverse array of natural products, which are
thought to be involved in their interactions with the environment.
These chemicals play a role in interactions with microbes, ani-
mals, and even other plants, as well as protecting the plant from
ultraviolet radiation and oxidants. Many of these compounds
have been referred to as ‘secondary metabolites’ to distinguish
them from the ‘primary metabolites’ required for the growth of
all plants (Theis & Lerdau, 2003). These secondary metabolites,
are likely to be essential for plants successful competition or
reproduction.
Among the secondary metabolites, a relevant role is played by
volatile organic compounds (VOCs). The importance of these
compounds can be deduced by the considerable amount of photo-
assimilated carbon released back into the atmosphere as VOCs
(Holopainen, 2004). While many plants contain large amounts of
stored VOCs, others do not synthesize and emit them until a
stimulus (such as pathogen infection) is perceived (Alborn et al.,
1997; Holopainen, 2004; Pare et al., 2005). Induced volatiles
(IVOCs) may be emitted hours or days after an attack, both from
the site of injury as well as systemically from undamaged plant
leaves (Pare & Tumlinson, 1997, 1999; Mattiacci et al., 2001).
Recent research showed that specific volatiles are produced
during the plant pathogen interactions (Turner & Magan, 2004).
Therefore the profiling of the IVOCs emission by infected plants
on Diagnostics, organized in cooper-
esearch Agency (Fera), York, GB,
tion ª 2010 OEPP/EPPO, Bulletin OEP
or fruits was considered to represent a novel approach for disease
diagnosis (Spinelli et al., 2006).
However, the techniques, such as the gas chromatography-
mass spectroscopy, currently used for characterizing the VOCs
contributing to the olfactory profile of a specimen are expensive,
time consuming and require highly specialized personnel
(Heinzle, 1992; Saevels et al., 2003a, 2003b, 2004; Turner &
Magan, 2004). An interesting alternative to these analytical
techniques is represented by the electronic-nose (e-nose).
The e-nose, by mimicking the mammalian smell sensor, is an
instrument able to detect the olfactory fingerprint of a specimen
(Pearce, 1997; Pavlou & Turner, 2000). In contrast with gas chro-
matography-mass spectroscopy, the data obtained using an
e-nose consists of olfactory fingerprints; therefore the analysis of
the odour profile is only comparative rather than quantitative
(Tothill, 2001).
The e-nose is typically made of three elements: a sensor array
which is exposed to the volatiles, the converter of signals to a
readable format and the software-based data analyser to produce
characteristic outputs related to the odour encountered (Stetter,
1986; Aishima, 1991; Pearce et al., 1993; Magan & Evans,
2000; Baratto et al., 2005). A variety of sensors are available for
use in e-nose systems. The most common types are metal oxide
or conducting polymer based (Magan & Evans, 2000).
To discriminate between samples, the output from the sensor
array may be interpreted via a variety of methods such as pattern
recognition algorithms, principal component analysis (PCA),
discriminant function analysis, cluster analysis or artificial neural
network.
The qualitative discrimination power of e-nose often has an
uncanny resemblance to the subjective discrimination of odours
P/EPPO Bulletin 40, 59–67 59

60 F. Spinelli et al.
by the human nose (Pearce, 1997; McEntegart et al., 2000;
Pavlou & Turner, 2000; Baratto et al., 2005).
In addition, the e-nose has some important advantages com-
pared to a biological nose: it used detect toxic or otherwise haz-
ardous situations, it can detect substances odourless for biological
nose (e.g. toxic CO), it is suited for repetitive and boring tasks
which the biological nose get accustomed to (Stetter & Penrose,
2001).
The majority of e-nose applications are within foods and
drinks industry (Gardner & Bartlett, 1992), detection of microbial
contamination (bacteria, fungi and yeast), or measure of authen-
ticity (beverages, coffee and meat) (Gardner et al., 1992; Anklam
et al., 1998). However, recently some novel microbiological
applications have been reported, such as the characterisation of
fungi (Keshri et al., 1998; Keshri & Magan, 2000), bacteria (Gib-
son et al., 1997; Gardner et al., 1998; McEntegart et al., 2000;
Momol et al., 2004) and the discrimination between Helicobact-
er pylori and other gastroesophageal isolates (Pavlou et al.,
2001).
In fact, e-nose based approaches are an ideal alternative for
rapid screening of infectious diseases because the results can be
obtained in minutes, rather than the days taken by traditional
techniques (Turner & Magan, 2004; Gardner & Bartlett 1999;
Dickinson et al., 1998).
Many of the instrumentations developed to date for the
medical diagnostics market can be adapted for the agri-food field
(Tothill, 2001).
For example, e-nose can be used to assess fruit quality (Brez-
mes et al., 2001), ripeness (Llobet et al., 1999; Di Natale et al.,
2001), biological and physical damages to fruits (Di Natale et al.,
2001; Tan et al., 2003) and to forecast the optimal harvesting
time (Saevels et al., 2003a, 2003b, 2004) and to monitor the
plant physiological state (Baratto et al., 2005).
In the present study, the e-nose EOS835 (SACMI Inc., Imola,
Italy) has been tested for its efficacy in discriminating asymptom-
atic fire blight infected plants. In addition, EOS835 was also chal-
lenged for the diagnosis of two of the main fungal diseases of
kiwifruits during storage (the grey mould by Botrytis cinerea and
the Sclerotinia sclerotiorum rot).
Material and methods
E-nose equipment and sampling apparatus
The olfactory fingerprints were collected with the e-nose EOS835
developed by SACMI Inc., Imola, Italy (figure 1A). EOS835 is
based on an array of six different sensors constituted of metal-
oxides semiconductors (MOS). These sensors are made by a
heated ceramic core coated by a semiconducting film. The semi-
conductor sensors can detect volatiles by monitoring changes in
the conductance during the oxidative reaction of the molecules
present in the gas phase. The gas samples were collected at a
flow rate of 180 mL min)1. To minimize the influence due to the
possible odors in the external air, the experiments were per-
formed using gas-chromatographic air as a reference. To adjust
the relative humidity of the reference air to levels comparable to
ª 2010 The Authors. Journal co
the sampling chamber, it was fluxed through a porous stone bub-
bling in a jar of sterile water. Air filtered by multiple passages
through active charcoal and silica gel was used as an alternative
to gas-chromatographic air.
The e-nose readings were set according to the following
parameters: ‘Warm Up’: 0 min, ‘Wait’: 0 min, ‘Before’:
0.6 min, ‘During’: 1 min, ‘After’: 0.8 min, ‘Clean End’: 0 min.
Before the e-nose readings, the plant material was enclosed in
an appropriate sampling chamber to allow the headspace to build
up.
Fire blight diagnosis
Preliminary small scale experiments were performed on apple
and pear microcuttings (figure 1B). Apple (cv. Gala) and pear
plants (Abbe Fetel) were grown on Murashige and Skoog and
Quoring Lepoivre medium, respectively. Experimental inocula-
tion was performed by pinching a leaf with tweezers dipped in a
suspension of E. amylovora 1540 (5 · 107 cfu mL)1). Plants
wounded by sterile tweezers were used as control. The precise
bacterial concentration was successively determined by sequen-
tial dilution and plating on Luria Agar Petri dishes that were
successively incubated at 27�C for 24–48 h.
Before the e-nose readings, the vials containing the microcut-
tings were flushed for 5 min with sterile, odourless air (180 mL
min)1) and incubated for 30 min to allow the headspace to build
up.
Further experiments were performed on 2-year old potted
plants enclosed in a Teflon chamber designed for the volatile col-
lection (figure 1C) or in a plastic bag for the e-nose readings
(figure 1D). A constant air flux (12 L min)1) was maintained
inside the enclosed chamber. The plants were kept in field condi-
tions under a shelter to protect them from excessive sunlight and
heating. The photon flux density in the photosynthetically-active
wavelength range, the air temperature, the CO2 assimilation and
the transpiration rate were constantly monitored (data not shown).
Standard cultural management was applied.
The plants were inoculated by cutting all the leaf tips with
infested scissors previously dipped in a bacterial suspension
(5 · 107 cfu mL)1) of a local strain of E. amylovora
(EaDCA289 ⁄ 01). Plants with leaf tips cut with scissors dipped in
sterile water were used as control. Each treatment consisted of
three plants. The e-nose readings were performed until develop-
ment of symptoms.
Botrytis and Sclerotinia rots diagnosis
The e-nose was used at daily intervals to study the olfactory pro-
files of green and yellow-flesh kiwifruits infected with B. cinerea
and S. sclerotiorum. Green kiwifruits ‘Hayward’ and ‘Summer-
kiwi 3373’ were collected at harvest maturity from the experi-
mental vineyard of the Dipartimento Colture Arboree, Universita
di Bologna. The yellow kiwifruits ‘ZESPRI� GOLD’ were
obtained from a private vineyard in Faenza. Before the experi-
mental inoculation, the fruits were maintained at 4�C for 21 days
to simulate storage conditions.
mpilation ª 2010 OEPP/EPPO, Bulletin OEPP/EPPO Bulletin 40, 59–67

A B
C D
Fig. 1 Electronic nose equipment, EOS835 (A) and sampling chambers for the fire blight diagnosis on entire plants (B–D). Small scale experiment on pear
microcuttings (B), medium scale experiment for VOCs sampling and characterization by GC-MS (C) and open field experiment carried out on scions under nursery
conditions (D).
Potential of the electronic nose 61
The pure fungal strains were obtained by DSMZ (Germany)
and grown on malt agar at 22�C for about 5 days. For the inocu-
lation, a 5 mm plug of malt agar was taken from the edge of an
active growing culture and placed on the freshly cut fruit pedicel.
Fruits inoculated with a sterile agar plug were used as control.
After inoculation, the fruits were maintained at room temperature
(20–22�C) for 14 days. Thirty minutes before the e-nose readings
the fruits were enclosed in 500 mL glass jars to allow the head-
space to build up. The glass jars were previously washed several
times in purified water and then dried in an oven at 90�C for
48 h. The heat treatment aimed to minimize the presence of vola-
tile pollutants inside the jars. The olfactory profiles of control and
infected plants were monitored, at 24 h intervals, until symptom
development.
At the same time also the ethylene production was also moni-
tored according to the methodology published by Bregoli et al.,
2005 (data not shown).
Statistical analysis
The olfactory profiles were elaborated using the Nose Pattern
Editor Program (v. 2.6.0) developed by SACMI. Different mathe-
matical algorithms (Classical, Fourier, Single Point, Many Points)
ª 2010 The Authors. Journal compilation ª 2010 OEPP/EPPO, Bulletin OEP
were used. The Many Points algorithm was generally used for
the analysis where a limited number (up to 4) of thesis were
involved.
The transformed data were successively processed by means
of PCA (Principal Component Analysis) using the MATLAB 6.5
software (MathWorks Inc., Natick, MA, US).
Results and discussion
Fire blight diagnosis
On pear plants, the e-nose clearly discriminated between control
and infected microcuttings (Fig. 2A). The medium scale experi-
ments performed on potted plants confirmed the results obtained
with microcuttings (Figure 2B).
Similar results were obtained also on apple microcuttings (data
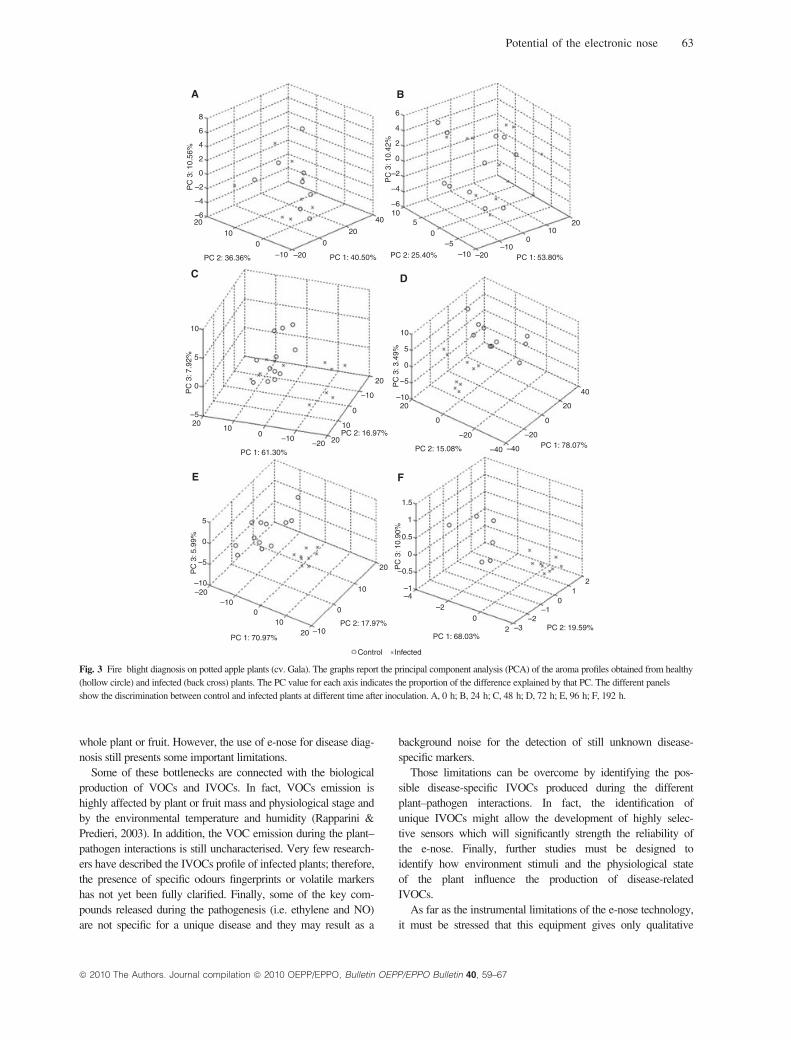
not shown) and potted plants (Fig. 3). The olfactory profiles of
infected apple plants changed during the time, thus infected plants
become completely distinct from the control ones after only 72 h
from the inoculation (Fig. 3D). At the symptoms appearance
(192 h after the inoculation), the differences among the olfactory
profiles of infected plants drastically decreased and they grouped
in a close cluster (Fig. 3F). This observation might suggest that a
P/EPPO Bulletin 40, 59–67

10
5
0
–5–20
–100
1020 –5
0
5
10
6
4
2
0
–2
–4
–6–20
–100
1020 –10
0
10
PC 1: 77.31%
PC
3: 7
.45%
PC
3: 5
.11%
PC 2: 13.01%PC 1: 67.91%
PC 2: 24.0%
Control Infected
A B
Fig. 2 Fire blight diagnosis on pear microcuttings (A) and potted plants (cv. Abbe Fetel) (B). The graphs report the principal component analysis (PCA) of the
aroma profiles obtained from healthy (hollow circle) and infected (back cross) plants. The PC value for each axis indicates the proportion of the difference explained
by that PC.
62 F. Spinelli et al.
pathogenesis-related IVOCs emission plays a major role in deter-
mining the olfactory fingerprint of symptomatic plants.
Botrytis and Sclerotinia rots diagnosis
The e-nose was effective in detecting green kiwifruits infected by
B. cinerea and S. sclerotiorum (Figs 4–5). On ‘Hayward’ kiwi-
fruits, the e-nose analysis was able to clearly discriminate the dis-
eased fruits after 168 h from the experimental inoculation
(Fig. 4C). In fact, 72 h after the inoculation, the olfactory profiles
of healthy and infected fruits did not show any differentiation
(Fig. 4A) and only after 144 h a partial discrimination was
observed (Fig. 4B). However, the olfactory fingerprints of the
control fruits changed with the progression of ripening and aging
and the differences among them greatly increased. Thus, after
192 h, the distances among the different olfactory profiles of
healthy fruits rose so extensively, that they were no longer distin-
guishable from the infected ones. On the contrary, the differences
among the odorous profiles of infected fruits did not increase and
even after 192 h, all the infected fruits grouped in a quite com-
pact cluster (Fig. 4D). On the base of this observation, we
hypothesized that the VOCs released upon infection gave a stron-
ger contribution than the ones related to ripening to the fruit’s
olfactory fingerprint. Finally, the e-nose was not able to discrimi-
nate between Botrytis or Sclerotinia infected fruits.
The experiment was repeated also on another green flesh kiwi-
fruit variety (‘Summer 3373’). On this cultivar, the e-nose dis-
crimination among healthy and infected fruits was not so clear
and only a partial and transient differentiation between control
and Sclerotinia infected fruits was observed (Fig. 5B). Also in
this experiment, the Botrytis and Sclerotinia infected fruits were
not discriminated by the e-nose.
On yellow flesh kiwifruit ‘ZESPRI GOLD�’, starting from
24 h after the inoculation, the e-nose was able to distinguish
between control and Sclerotinia infected fruits (Fig. 6A). As far
as the Botrytis infected fruits is concerned, the e-nose discrimi-
nated them from the control fruits only after 48 h (Fig. 6B). In
ª 2010 The Authors. Journal co
this case, the e-nose only partially distinguished between Botrytis
or Sclerotinia infected fruits.
Ethylene is a key signal in modulating the emissions of other vol-
atiles during fruit ripening and plant defences (O’Donnell et al.,
1996; Lurie et al., 2002; Botondi et al., 2003). Since, metal-oxide
sensors are able to detect ethylene, particularly the SnO2 sensors
employed in EOS835 (Baratto et al., 2005; Defilippi et al., 2009), a
simpleexperimentwasperformed to test the influenceof fruit ethyl-
ene production in shaping the e-nose analysis. For this purpose, in
parallel with the e-nose readings, the ethylene production by Botry-
tis infected kiwifruits was quantified at daily interval (data not
shown). Successively, on a second set of healthy fruits, treated with
water or 1-methylcyclopropene (1-MCP), ethylene was applied at
the same amount produced by infected fruits during the first 72 h
after inoculation (when the olfactory profiles of healthy and
infected fruits start to differentiate). 1-MCP was used since it has
been reported to be a non-toxic antagonist of ethylene action that
blocks the physiological action of ethylene (Sisler et al., 1996).
The same day of the ethylene treatment, half of the untreated
fruits were inoculated with B. cinerea. The e-nose was chal-
lenged for differentiating between the olfactory fingerprints of
ethylene-treated fruits and infected ones (Fig. 7).
The PCA analysis of these fruits clearly showed that the addi-
tion of ethylene to fruits previously treated with 1-MCP does not
significantly influence the e-nose readings. On the other hand, the
cluster of fruit treated with ethylene overlaps with the one of
Botrytis infected fruits (Fig. 7). This observation demonstrates
that, even if ethylene itself is perceived by the e-nose, its concen-
tration in the headspace is only partially responsible for the differ-
entiation of olfactory profiles. However, the olfactory fingerprint
of diseased fruits is mainly shaped by the ethylene-mediated pro-
duction of volatiles and therefore is not strictly pathogen-related.
Conclusions
Our results indicated the e-nose as a possible, effective, fast and
non-destructive tool for early disease diagnosis directly on the
mpilation ª 2010 OEPP/EPPO, Bulletin OEPP/EPPO Bulletin 40, 59–67
A B
DC
E F
4
6
8
2
–2
–4
–620
10
10
5
–520
–20–20 –20
00
–40 –4020
20 20
4020
10
10
5
0
–5
–10
0
10–10
–10
0
0
0 0
5
–5
–10
10
10
20
20
1.5
0.5
–0.5
–1–4
–2
–2–3
–10
0
2
21
1
0
–10
–10
–20
0
10
–10–10
100
–20
205
–50
0 0
20
40
–10 –20
0
4
6
2
–2
–4
–6
0
PC
3: 1
0.56
%
PC 1: 40.50%
PC 2: 16.97%
PC 1: 70.97%
PC 2: 17.97%
PC 1: 68.03%PC 2: 19.59%
Control Infected
PC 1: 61.30% PC 2: 15.08% PC 1: 78.07%
PC 2: 25.40% PC 1: 53.80%PC 2: 36.36%
PC
3: 7
.92%
PC
3: 5
.99%
PC
3: 1
0.90
%P
C 3
: 3.4
9%P
C 3
: 10.
42%
Fig. 3 Fire blight diagnosis on potted apple plants (cv. Gala). The graphs report the principal component analysis (PCA) of the aroma profiles obtained from healthy
(hollow circle) and infected (back cross) plants. The PC value for each axis indicates the proportion of the difference explained by that PC. The different panels
show the discrimination between control and infected plants at different time after inoculation. A, 0 h; B, 24 h; C, 48 h; D, 72 h; E, 96 h; F, 192 h.
Potential of the electronic nose 63
whole plant or fruit. However, the use of e-nose for disease diag-
nosis still presents some important limitations.
Some of these bottlenecks are connected with the biological
production of VOCs and IVOCs. In fact, VOCs emission is
highly affected by plant or fruit mass and physiological stage and
by the environmental temperature and humidity (Rapparini &
Predieri, 2003). In addition, the VOC emission during the plant–
pathogen interactions is still uncharacterised. Very few research-
ers have described the IVOCs profile of infected plants; therefore,
the presence of specific odours fingerprints or volatile markers
has not yet been fully clarified. Finally, some of the key com-
pounds released during the pathogenesis (i.e. ethylene and NO)
are not specific for a unique disease and they may result as a
ª 2010 The Authors. Journal compilation ª 2010 OEPP/EPPO, Bulletin OEP
background noise for the detection of still unknown disease-
specific markers.
Those limitations can be overcome by identifying the pos-
sible disease-specific IVOCs produced during the different
plant–pathogen interactions. In fact, the identification of
unique IVOCs might allow the development of highly selec-
tive sensors which will significantly strength the reliability of
the e-nose. Finally, further studies must be designed to
identify how environment stimuli and the physiological state
of the plant influence the production of disease-related
IVOCs.
As far as the instrumental limitations of the e-nose technology,
it must be stressed that this equipment gives only qualitative
P/EPPO Bulletin 40, 59–67

2
15
10
5
5
–5
–10
–10
–15
1020
20
40
0 0
0
0
–5
–10–1040
–40
200
20–20
–20
–20 –20
0
10
2
1
0
00
5
6
4
2
0
–2
–4–20
–100 0
24
6
1020 –4
–2
–2
–2
–3
–4 –5
–1
PC
3: 1
5.01
%P
C 3
: 3.4
9%
PC
3: 9
.46%
PC
3: 5
.11%
PC 2: 18.99% PC 1: 48.82%
PC 2: 26.86%
Control B. cinerea S. sclerotiorum
PC 1: 56.05%PC 2: 24.79%PC 1: 65.33%
PC 1: 63.42%PC 2: 19.02%
A B
C D
Fig. 4 Diagnosis of Botrytis and Sclerotinia rot on green flesh kiwifruits (cv. Hayward). The graphs report the principal component analysis (PCA) of the aroma
profiles obtained from healthy (hollow circle), Botrytis (back cross) and Sclerotinia (grey asterisk) infected fruits. The PC value for each axis indicates the proportion
of the difference explained by that PC. The different panels show the discrimination between control and infected plants at different time after inoculation. A, 72 h;
B, 144 h; C, 168 h; D, 192 h.
10
5
0
0
0
0
20
20
20
20
20
1020
40
40
–40
–5
–20
–20
–20
–20
–10
–10
–10
–10
10
10
0 0
PC 1: 47.60% PC 2: 20.23%
Control B. cinerea S. sclerotiorumPC 1: 46.71%
PC 2: 23.84%
PC
3: 1
0.11
%
PC
3: 1
2.39
%
A B
Fig. 5 Diagnosis of Botrytis and Sclerotinia rot on green flesh kiwifruits (cv. Summerkiwi 3373). The graphs report the principal component analysis (PCA) of the
aroma profiles obtained from healthy (hollow circle), Botrytis (back cross) and Sclerotinia (grey asterisk) infected fruits. The PC value for each axis indicates the
proportion of the difference explained by that PC. The different panels show the discrimination between control and infected plants at different time after inoculation.
A, 0 h; B, 3 h.
64 F. Spinelli et al.
results and it cannot identify and quantify the single volatile mol-
ecules forming the characteristic aroma of infected plants. For
this reason, the data obtained by e-nose are mainly comparative:
the fingerprint of the infected plant material needs to be com-
pared with a healthy reference and, possibly, with the fingerprint
of other suspected diseases. Finally, the MOS sensors sensitivity
ª 2010 The Authors. Journal co
is also influenced by the changes in relative humidity (RH) and
temperature. On the account of all these consideration, the analy-
sis of the olfactory profile of plants or fruits should be performed
on comparable material kept in standardized conditions. The gas
sample system developed for the analysis by controlling the
temperature and RH, minimizes their influence on the VOCs
mpilation ª 2010 OEPP/EPPO, Bulletin OEPP/EPPO Bulletin 40, 59–67

4
2
0
–2
–4
–6
–8
4
2
0
–2–10
–3–2–2
–10
–20
–10
–10
0
10
20–100
–50
–20
–10
0
10
20
0
50
–10–5
05
10
0
10
20
–10
–5
0
5
10
12
–5
0
0
10
20
5 10
50
–5
–10
3
PC
3: 1
0.04
%
PC 2: 13.76%PC 1: 67.30%
PC 1: 79.65%PC 2: 10.26%
PC 2: 20.00%PC 1: 66.29%PC 2: 6.31%
PC 1: 86.61%
PC
3: 4
.51%
PC
3: 8
.75%
PC
3: 5
.48%
Control B. cinerea S. sclerotiorum
A B
DC
Fig. 6 Diagnosis of Botrytis and Sclerotinia rot on yellow flesh kiwifruits (cv. ZESPRI GOLD�). The graphs report the principal component analysis (PCA) of the
aroma profiles obtained from healthy (hollow circle), Botrytis (back cross) and Sclerotinia (grey asterisk) infected fruits. The PC value for each axis indicates the
proportion of the difference explained by that PC. The different panels show the discrimination between control and infected plants at different time after inoculation.
A, 24 h; B, 48 h; C, 148 h; D, 192 h.
0.4
0.2
0
–0.2
–0.4
–0.62
1
0
–1
–2 –4–2
02
4
PC 2: 6.05%
PC
3: 1
.77%
PC 1: 91.70%Control B. cinerea Ethylene 1-MCP + Ethylene
Fig. 7 Influence of ethylene on the e-nose diagnosis of Botrytis infected
green flesh kiwifruits (cv. Hayward). The healthy fruits were divided in
two groups: the fist one was treated with water, the second with 1-MCP.
These fruits were successively treated with the same amount ethylene
produced by infected fruit. Control fruits: (hollow circle), infected fruits
(back cross), healthy fruits treated with 1-MCP and ethylene (hollow
square) or water and ethylene (grey asterisk).
Potential of the electronic nose 65
ª 2010 The Authors. Journal compilation ª 2010 OEPP/EPPO, Bulletin OEP
emission and sensors sensitivity. Long term gas sampling by
means of solid phase micro-extraction (SPME) fibres, which can
concentrate IVOCs, might overcome the need of standardized
conditions.
Therefore, further technological and methodological develop-
ments are needed for the practical application of the e-nose diag-
nosis in commercial nurseries and packing houses.
Utilisation potentielle du nez electroniquepour le diagnostic de maladies bacterienneset fongiques des arbres fruitiers
Les instruments de nez electronique ont progresse rapidement
au cours de la derniere decade, car le besoin de mesures tres
sensibles, rapides et precises a considerablement stimule le
developpement de ces capteurs en tant qu’outils de diagnostic.
Etant donne que les reponses induites dans la plante par l’agent
pathogene comprennent aussi des changements dans l’emission
de composes volatiles, le nez electronique peut representer une
alternative puissante et facile a utiliser pour le depistage rapide
et fiable de materiel vegetal asymptomatique. Dans cette etude,
le nez electronique EOS835 (Sacmi, Imola - Italie), base sur
des semiconducteurs a metal-oxyde, a ete utilise. EOS835 a pu
detecter des pommiers et poiriers asymptomatiques infectes
experimentalement avec Erwinia amylovora (feu bacterien). Le
P/EPPO Bulletin 40, 59–67

66 F. Spinelli et al.
nez electronique a aussi ete teste avec succes pour distinguer
des pourritures a Botrytis et Sclerotinia sur des kiwis verts et
jaunes.
Meme si le nez electronique peut etre utilise avec succes en
conditions experimentales pour le diagnostic precoce des mala-
dies avant et apres la recolte, son application pratique en plein
champ, dans des pepinieres et des stations d’emballage demande
encore d’autres etudes.
References
Aishima T (1991) Aroma discrimination by pattern recognition analysis of
responses from a semiconductor gas sensor array. Journal of Agricultural
and Food Chemistry 39, 752–756.
Alborn HT, Turlings TCJ, Jones TH, Stenhagen G, Loughrin JH & Tumlinson
JH (1997) An elicitor of plant volatiles from beet armyworm oral secretion.
Science 276, 945–949.
Anklam E, Lipp M, Radovic B, Chiavaro E & Palla G (1998) Characterisation
of Italian vinegar by pyrolysis-mass spectrometry and a sensor device
(Electronic nose). Food Chemistry 61, 243–248.
Baratto C, Faglia G, Pardo M, Vezzoli M, Boarino L, Maffei M, Bossi S &
Sberveglieri G (2005) Monitoring plants health in greenhouse for space
missions. Sensors and Actuators B 108, 278–284.
Botondi R, DeSantis D, Bellicontro A, Konstantinos V & Mencarelli F (2003)
Influence of ethylene inhibition by 1-methylcyclopropene on apricot quality,
volatile production, and glycosidase activity of low- and high-aroma
ª 2010 The Authors. Journal co
varieties of apricots. Journal of Agricultural and Food Chemistry 51,
1189–1200.
Bregoli AM, Ziosi V, Biondi S, Rasori A, Ciccioni M, Costa G &
Torrigiani P (2005) Postharvest 1-methylcyclopropene application in
ripening control of ‘Stark Red Gold’ nectarines: temperature-dependent
effects on ethylene production and biosynthetic gene expression, fruit
quality, and polyamine levels. Postharvest Biology and Technology
37, 111–121.
Brezmes J, Llobet E, Vilanova X, Orts J, Saiz G & Correig X (2001)
Correlation between electronic nose signals and fruit quality indicators on
shelf-life measurements with pinklady apples. Sensors and Actuators B 80,
41–50.
Defilippi BG, San Juan W, Vald H, Moya-Leon MA, Infanted R & Campos-
Vargas R (2009) The aroma development during storage of Castlebrite
apricots as evaluated by gas chromatography, electronic nose, and sensory
analysis. Postharvest Biology and Technology 51, 212–219.
Di Natale C, Macagnano A, Paolesse R & D’Amico A (2001) Artificial
olfaction systems in food analysis. Biotechnology, Agronomy, Society and
Environment 5, 159–165.
Dickinson TA, White J, Kauer JS & Walt DR (1998) Current trends in
‘artificial nose’ technology. Trends in Biotechnology 16, 250–258.
Gardner JW, Shurmer HV & Tan TT (1992) Application of an electronic nose
to the discrimination of coffees. Sensors and Actuators B 6, 71–75.
Gardner JW & Bartlett PN (1992) Sensors and sensory systems for an
electronic nose. Kluwer Academic Publishers, Dordrecht (DE).
Gardner JW & Bartlett PN (1999) Electronic noses: principles and
applications (eds Gardner JW & Barttett). 245 pp. Oxford University Press,
Oxford (GB).
Gardner JW, Craven M, Dow C & Hines EL (1998) The prediction of
bacteria type and culture growth phase by an electronic nose with a
multi-layer perception network. Measurement Science and Technology
9, 120–127.
Gibson TD, Prosser O, Hulbert JN, Marshall RW, Corcoran P, Lowery P,
Ruck-Keene EA & Heron S (1997) Detection and simultaneous
identification of microorganisms from headspace samples using an
electronic nose. Sensors and Actuators B 44, 413–422.
Heinzle E (1992) Present and potential applications of mass spectrometry
for bioprocess research and control. Journal of Biotechnology 16,
250–258.
Holopainen JK (2004) Multiple functions of inducible plant volatiles. Trends
in Plant Science 9, 529–533.
Keshri G & Magan N (2000) Detection and differentiation between
mycotoxigenic and non-mycotixogenic strains of Fusarium spp using
volatile production profiles and hydrolytic enzymes. Journal of Applied
Microbiology 89, 825–833.
Keshri G, Magan N & Voysey P (1998) Use of an electronic nose for early
detection and differentiation between spoilage fungi. Letters in Applied
Microbiology 27, 261–264.
Llobet E, Hines EL, Gardner JW & Franco S (1999) Non-destructive banana
ripeness determination using a neural network-based electronic nose.
Measurement Science and Technology 10, 538–548.
Lurie S, Pre-aymard C, Ravid U, Larkov O & Fallik E (2002) Effect of
1-Methylcyclopropene on volatile emission and aroma in cv Anna apples.
Journal of Agricultural and Food Chemistry 50, 4251–4256.
Magan N & Evans P (2000) Volatiles as an indicator of fungal activity and
differentiation between species, and the potential use of electronic nose
technology for early detection of grain spoilage. Journal of Stored
Products Research 36, 319–340.
Mattiacci L, Rocca BA, Scascighini N, D’Alessandro M, Hern A & Dorn S
(2001) Systemically induced plant volatiles emitted at the time of
‘‘Danger’’. Journal Of Chemical Ecology 27, 2233–2252.
McEntegart CM, Penrose WR, Strathmann S & Stetter JR (2000) Detection
and discrimination of coliform bacteria with gas sensor arrays. Sensors and
Actuators B 70, 170–176.
mpilation ª 2010 OEPP/EPPO, Bulletin OEPP/EPPO Bulletin 40, 59–67

Potential of the electronic nose 67
Momol MT, Balaban MO, Korel F, Odabasi A, Momol EA, Folkes G & Jones
JB (2004) Discrimination of plant pathogenic bacteria using an electronic
nose. Plant Health Progress, doi: 10.1094/PHP-2004-0405-01-HN
O’Donnell PJ, Calvert C, Atzorn R, Wasternack C, Leyser HMO & Bowles DJ
(1996) Ethylene as a signal mediating the wound response of tomato plants.
Science 274, 1914–1917.
Pare PW & Tumlinson JH (1999) Plant volatiles as a defense against insect
herbivores. Plant Physiology 121, 325–331.
Pare PW & Tumlinson JH (1997) De novo biosynthesis of volatiles induced by
insect herbivory in cotton plants. Plant Physiology 114, 1161–1167.
Pare PW, Farag MA, Krishnamachari V, Zhang H, Ryu CM & Kloepper JW
(2005) Elicitors and priming agents initiate plant defense responses.
Photosynthesis Research 85, 149–159.
Pavlou AK, Magan N, Turner APF, Sharp D, Brown J & Barr H (2001) An in
vitro rapid odour recognition model in discrimination of Helicobacter pylori
and other gastroesophageal pathogens. Biosensors and Bioelectronics 15,
333–342.
Pavlou AK & Turner APF (2000) Sniffing out the truth: clinical diagnosis
using the electronic nose. Clinical Chemistry and Laboratory Medicine
38, 99–112.
Pearce TC (1997) Computational parallels between the biological olfactory
pathway and its analogue ‘the electronic nose’: part II Sensor-base machine
olfaction. Biosystems 41, 69–90.
Pearce TC, Gardner JW & Friel S (1993) Machine olfaction: intelligent sensing
of odours. International conference on system, man, cybernetics, 1993
‘Systems engineering in the service of humans’ 5, 165–170.
Rapparini F & Predieri S (2003) Pear Fruit Volatiles. Horticultural Reviews
28, 237–324.
ª 2010 The Authors. Journal compilation ª 2010 OEPP/EPPO, Bulletin OEP
Saevels S, Lammertyn J, Berna AZ, Veraverbeke EA, Di Natale C & Nicolaı
BM (2003a) Electronic nose as a non-destructive tool to evaluate the optimal
harvest date of apples. Postharvest Biology and Technology 30, 3–14.
Saevels S, Lammertyn J, Berna AZ, Veraverbeke EA, Di Natale C & Nicolai
BM (2004) An electronic nose and a mass spectrometry-based electronic
nose for assessing apple quality during shelf life. Postharvest Biology and
Technology 31, 9–19.
Sisler EC, Dupille E & Serek M (1996) Effects of 1-methylcyclopropene and
methylcyclopropene on ethylene binding and ethylene action on cut
carnation. Plant Growth Regulators 18, 79–86.
Spinelli F, Noferini M & Costa G (2006) Near Infrared spectroscopy (NIRs):
perspective of fire blight detection in asymptomatic plant material. Acta
Horticulturae 704, 87–91.
Stetter JR (1986) Electrochemical sensors, sensor arrays and computer
algorithms In: Fundamentals and Applications of Chemical Sensors (eds
Shuetzle D & Hammerle R), ACS Symposium Series 309, 299–307.
Stetter JR & Penrose WP (2001) The electrochemical nose. Electrochemistry
Encyclopaedia, http://electrochem.cwru.edu/encycl/art-n01-nose.htm
Tan ES, Slaughter DC & Thompson JF (2003) Freeze damage detection in
oranges using gas sensors. Postharvest Biology and Technology 35,
177–182.
Theis N & Lerdau M (2003) The evolution of function in plant secondary
metabolites. International Journal of Plant Science 164, 93–102.
Tothill IE (2001) Biosensors developments and potential applications in the
agricultural diagnosis sector. Computers and Electronics in Agriculture
30, 205–218.
Turner APF & Magan N (2004) Electronic noses and disease diagnostics.
Nature Reviews Microbiology 2, 161–166.
P/EPPO Bulletin 40, 59–67
Related Documents