ME 18.5 •A34 0. DOT -TSC-NHTSA- 79-41 D0T-HS-805 240 no. DOT- TSC- NMTSA- 70-4I POTENTIAL OF DIESEL ENGINE, DIESEL ENGINE DESIGN CONCEPTS, CONTROL STRATEGY AND IMPLEMENTATION I DhPARTMtN ' j ^ | jj 0 L> 1 2r tooO T . Trel 1 a T. Shen U . S . Department of Transportation Research and Special Programs Administration Transportation Systems Center Cambridge MA 02142 * Of 1£/)a. MARCH 1980 FINAL REPORT DOCUMENT IS AVAILABLE TO THE PUBLIC THROUGH THE NATIONAL TECHNICAL INFORMATION SE R V I CE , SPR I N GF I E LD, VIRGINIA 22161 Prepared for U.S. DEPARTMENT OF TRANSPORTATION NATIONAL HIGHWAY TRAFFIC SAFETY ADMINISTRATION Office of Research and Development Washington DC 20590

Welcome message from author
This document is posted to help you gain knowledge. Please leave a comment to let me know what you think about it! Share it to your friends and learn new things together.
Transcript
ME18.5•A34 0. DOT -TSC-NHTSA- 79-41 D0T-HS-805 240no.DOT-TSC-NMTSA-70-4I
POTENTIAL OF DIESEL ENGINE,
DIESEL ENGINE DESIGN CONCEPTS, CONTROL
STRATEGY AND IMPLEMENTATION
IDhPARTMtN
'
j ^
|
jj 0 L> 12r tooO
T . Trel 1 a
T. Shen
U . S . Department of TransportationResearch and Special Programs Administration
Transportation Systems CenterCambridge MA 02142
* Of 1£/)a.
MARCH 1980
FINAL REPORT
DOCUMENT IS AVAILABLE TO THE PUBLICTHROUGH THE NATIONAL TECHNICALINFORMATION SE R V I CE
,SPR I N GF I E LD,
VIRGINIA 22161
Prepared for
U.S. DEPARTMENT OF TRANSPORTATIONNATIONAL HIGHWAY TRAFFIC SAFETY ADMINISTRATION
Office of Research and DevelopmentWashington DC 20590

(
NOTICE
This document is disseminated under the sponsorshipof the Department of Transportation in the interestof information exchange. The United States Govern-ment assumes no liability for its contents or usethereof
.
NOTICE
The United States Government does not endorse pro-ducts or manufacturers. Trade or manufacturer'snames appear herein solely because they are con-sidered essential to the object of this report.
NOTICE
The views and conclus ions contained in the documentare those of the author(s) and should not be inter-pr et ed as necessarily representing the off ic ialpo 1 i c ies or opinions
,
either expressed or implied
,
of the Department of Transportation.

,-7^0 '
~t)6T-1'SC- /J- 7?-f/ Technical Report Documentation Page
1 . Report No.
DOT - HS - 8 0 5 2 40
2. Government Accession Nc 3. Recipient s Catalog No.
4. Title ond Subtitle
POTENTIAL OF DIESEL ENGINE, DIESEL ENGINEDESIGN CONCEPTS, CONTROL STRATEGY, ANDIMPLEMENTATION
5. Report Date
March 19806. Performing. Orgoni zotion Code
7. Authors)
T. Trella and T. Shen
8. Performing Orgamzotion Report No.
DOT- TSC- NHTSA- 79-419. Performing Organization Name ond Address
^U. S .^Department of TransportationResearch and Special Programs Administration
^Transportation Systems CenterCambridge MA 02142
10. Work Unit No. (TRAIS)
HS027/R040411. Contract or Grant No.
13. Type of Report and Period Covered
12. Sponsoring Agency Name ond Address
U.S. Department of TransportationNational Highway Traffic Safety AdministrationOffice of Research and DevelopmentWashington DC 20590
Final Report
14. Sponsoring Agency Code
15. Supplementary Notes
16. Abstract
Diesel engine design concepts and control system strategies aresurveyed with application to passenger cars and light trucks. Theobjective of the study is to indicate the fuel economy potential ofthe technologies investigated. The engine design parameters discussedare related to the engine configuration, combustion process, valving,friction, compression ratio, and heat transfer. Various engine con-trol strategies and control implementation are considered.
| DEPARTMENT OFj
I TRANSPORTATION I
00 1 * 4 I3C
LIBRARY
17. Key Words
DieselEngineAutomobileLight truckControls
Control StrategyFuel EconomyEngine designparameters
19. Security Classif. (of this report)
Unclassified
18. Distribution Statement
DOCUMENT IS AVAILABLE TO THE PUBLICTHROUGH THE NATIONAL TECHNICALINFORMATION SE R VICE
,SPR INGF I E LD.
VIRGINIA 22161
20. Security Classif. (of this page)
Unclassified
21- No. of P ages
61
22. Price
Form DOT F 1700.7 (8-72) Reproduction of completed page authorized


PREFACE
This report, DOT-TSC-NHTSA-79-41,
is one of a series of four
companion reports to DOT-TSC-NHTSA-79-38 "Potential of Diesel
Engine, 1979 Summary Source Document.”* It assesses the fuel
economy potential of design improvements to diesel engines. The
authors wish to acknowledge the assistance of Giorgio Cornetti,
Fiat Central Research, Torino, Italy.
This report is a deliverable under PPA HS-027 "Support for
Research and Analysis in Auto Fuel Economy and Related Areas."
*"Potential of Diesel Engine, 1979 Summary Source Document," byT. Trella, Report No. DOT-TSC-NHTSA-79-38, March, 1980.
iii
metric
conversion
factors
1«e
ikti -.v* S a* » * i"«"t
| |§ •
III Ii .it
.i1
1
Hit! iiii Ill iiilH *
£ t-
f s
« B
! I .. |
lilt!
M
s ~ - - 1«•«-•<*» *“ fi„. i
• « - ^Mmgg
e
- a
f.li| ! 1 2III;
iiil
lletS Vi i i
8.IK »
t i
? ?i! «
ill mill
la:i
i!
1 Vi
»5 —
•
.
‘•2
« a IS|0*
SI 91 L\ ti 91 >1 SI St II 01 s • L 9 % 9 s t i
*3
iiiiLii Hiiliiii lllllllllllllllllll
1
111111111 lllllllll llJlIII iJim lllllllll lllllllll lllllllll lllllllll lllllllll Jim Jim iiiiiiii
1
lllllllll lllllllll lllllllll llllllIU mini iiilini Jill)
TIT TIT TIT TIT TITMill I III l|l| I
T|* T|T
s s «
s
V.-m s KCi E E
! I 5
! ! i I
I . . iMiliff!.
ml ill
• r « * *
ill Hlliiillli
_
° - s
£* 8 ® • • §<*••»•• j#
*- £mM4«
o»
a
hi! .*. . 1 a
fill iiil! iii1
Ixtl "I’kVi i •
> £ • e b m «i ©
ill -it
ifmilii
t j c » ft S S's'V
?
Sia
IV

TABLE OF CONTENTS
Section Page
1. INTRODUCTION 1
2. ENGINE DESIGN PARAMETERS 3
2.1 Parameters or Operations Related toCombustion Processes 3
2.1.1 Injection Operation 3
2. 1.1.1 High Speed DirectInjection 3
2. 1.1. 2 Indirect Injection 7
2.1.2 Turbulent Evaporation 7
2.1.3 Hot Wall Evaporation - MAN System... 8
2.2 Engine Configuration Related Parameters.... 10
2.2.1 Rotary Engine Configuration 102.2.2 ’Squish Lip’ Piston Design 122.2.3 Engine Sizing 18
2 . 3 Valving 192.4 Compression Ratio 242.5 Adiabatic Wall and Turbocompound Concept... 262.6 Friction 31
3. ENGINE CONTROL STRATEGIES 34
4. IMPLEMENTATION OF ENGINE CONTROL 41
4.1 General 414.2 Aftertreatment Devices 414.3 Fuel Injection Systems 424.4 Electronic 454.5 Exhaust Gas Recirculation 464.6 Electronic Control System 484.7 Turbocharging 48
REFERENCES 51
v

LIST OF ILLUSTRATIONS
Figure Page
2-1 SCHEMATIC OF INJECTION SYSTEM 5
2-2 SCHEMATIC DIAGRAMS OF RICARDO ’COMET’SWIRL CHAMBER AND DAIMLER-BENZ PRE-CHAMBER. 6
2-3 CROSS-SECTION OF 6-CYL. 4.4 x 5.5-INPRODUCTION ENGINE, 200 HP. MAX. OUTPUT(supercharged) AT 2300 RPM. . 9
2-4 SFC CHARACTERISTICS IN RELATION TO ENGINESPEED AND MEN AND FULL -LOAD POWER CURVEFOR 6-CYL., D 1246 M ENGINE WITH NATURALASPIRATION 11
2-5 INFLUENCE OF DIRECTION OF FUEL SPRAY UPONEXHAUST SMOKE. INJECTION WELL BELOW PLANEOF CHAMBER FORMAT 11
2-6 2 -STAGE DESIGN WITH TWO ROTORS 13
2-7 PREFERRED COMBUSTION SYSTEM 13
2-8 STEPPED APEX SEAL 14
2-9 PERFORMANCE OF A ROTARY ENGINE WITH ANAIR/FUEL RATIO OF 30:1 14
2-10 STANDARD COMBUSTION CHAMBER AND VARIOUSRE-ENTRANT CONFIGURATIONS 15
2-11 EFFECT OF INJECTION TIMING, STANDARD OPENCHAMBER, AND RE-ENTRANT CHAMBER, ENGINESPEED 1400 REV/MIN
,EQUIVALENCE RATIO 16
2-12 EFFECT OF THROAT DIAMETER ON SMOKE, SFC, ANDNO EMISSIONS, ENGINE SPEED 1400 REV/MIN,EQUIVALENCE RATIO 17
2-13 VOLUMETRIC EFFICIENCY WITH SEVERAL INLET-VALVE SIZES, LIFTS, AND SHAPES: b - cylinderbore; D - : VALVE OUTSIDE DIAMETER: s =
MEAN PISTON SPEED; a = VELOCITY OF SOUND ATINLET TEMPERATURE; CFR 3.25 x 4.5 inCYLINDER: 4 - 4.92 22
vi

LIST OF ILLUSTRATIONS (CONT)
Figure Page
2-14 THE EFFECT OF VOLUMENTRIC EFFICIENCY OFVARYING INLET VALVE CLOSING ON A 3.6LITER ' COMET * ENGINE 23
2-15 EFFECT OF COMPRESSION RATIO ON SMOKE,SFC AND NO EMISSIONS, ENGINE SPEED 1400REV/MIN
,EQUIVALENCE RATIO 2 5
2-16 MULTI -CYLINDER ENGINE TRANSIENTACCELERATION SMOKE TEST 2 7
2-17 TYPICAL ENERGY BALANCE OF DIESEL ENGINE 2 8
2-18 TOTAL ENERGY RECOVERY VIA CUMMINSADIABATIC TURBOCOMPOUND ENGINE 28
2-19 SCHEMATIC OF A RANKINE BOTTOMING CYCLE ONAN ADIABATIC DIESEL ENGINE SHOW-THERMODYNAMIC STATE POINTS AND NUMBERS 2 9
2-20 WI LLIANS- LINE 33
2-
21 BREAK-DOWN OF 100% OF MECHANICAL LOSSES 33
3-
1 3000 lb I.W. 3.2 REAR AXLE RATIOSENSITIVITY MAP OF HC EMISSION 36
3-2 3000 lb I.W. 3.2 REAR AXLE RATIOSENSITIVITY OF CO EMISSION 37
3-3 3000 lb I.W. 3.2 REAR AXLE RATIOSENSITIVITY MAP OF NOx EMISSION 38
vii
LIST OF TABLES
Table Page
2-1 COMPARISON OF IDI PRODUCTION ENGINE WITHDI SUBSTITUTE 4
2-2 PREDICTED PERFORMANCE FOR 250 BHP STANDARDAND INSULATED NATURALLY ASPIRATED DIESEL ENGINE 30
2-
3 DIESEL CYCLE SIMULATION RESULTS OF VARIOUSADVANCED DIESEL BASED POWER PLANT 30
3-
1 IMPACT OF VEHICLE MODIFICATIONS ON EXHAUSTEMISSION LEVELS 39
viii

1. INTRODUCTION
With increasing demand for energy conservation in transporta-
tion, diesel powered vehicles have become more and more popular
because of their superior fuel economy in comparison with the spark
ignition engines. Good engine performance is based upon a more
comprehensive understanding of the engine’s basic design concepts
as well as an understanding of their control during the vehicle’s
operation. This document presents some basic aspects of engine
design concepts and control strategies.
The traditional disadvantages of the diesel engine have
always caused it to be considered unacceptable for wide use in
vehicles. Drawbacks such as a lower power-to-weight ratio, higher
idle noise and vibration, a higher initial cost coupled with a
lower maximum speed are problems which have always seemed in-
surmountable. For this reason the use of diesel engines has been
confined mostly to heavy duty operations.
Today’s diesel engine has the following advantages:
greater fuel economy (about 25 percent);
comparable cost to the spark ignition engine;
substantially lower regulated emissions (as low as
0.41/3.4/2.0 grams/mile of HC/CO/NO ).
These advantages make the Light Duty diesel engine preferable
to the spark ignition engine. Thus, a diesel would seem to be
the prefered power plant for passenger car and light truck vehi-
cles .
Future NO emission levels of 1.5 grams/mile in 1981 and 1
gram per mile at a subsequent date, and the proposed particulate
levels of 0.6 gram/mile for 1981 model year vehicles and the later
0.20 gram/mile particulate standard beginning with 1983 model
year vehicles, have recently put the possibility of diesel engine
implementation into discussion.
In this document, various injection methods, preparation of
1

the air-fuel mixture and size are described and the influence of
engine configuration and size on overall performance is discussed.
The effects of several other engine design variables on performance
are also examined, which include valving, compression ratio, heat
loss and friction. Information on various strategies for control
of emissions and fuel economy is also integrated in this report.
2
2. ENGINE DESIGN PARAMETERS
Engine design parameters in this section include the design
of parts of the engine which are related to the engine cyclinder
and its direct auxiliaries. Generally speaking, the engine
cylinder is the heart of the engine which produces power as well
as emissions. Thus, a good design is extremely critical. The
combustion processes which occur in the cylinder provide large
influence on engine performance and is directly influenced in
many cylinder design parameters. Some of these cylinder design
parameters include valving operation, compression ratio, degree of
heat transfer through the wall, and frictional power loss. This
section provides some introductory remarks on these parameters.
2.1 PARAMETERS OR OPERATIONS RELATED TO COMBUSTION PROCESSES
2.1.1 Injection Operation
2. 1.1.1 - High Speed Direct Injection - Direct injection diesels
are currently used almost exclusively in all types of automotive
applications apart from the light duty automobile and truck. In
general, direct injection offers better starting, lower heat losses,
lower thermal loadings and better fuel economy with an advantage
of 8-10 percent compared to indirect injection. Table 2-1 shows
a performance comparison of Mercedes Benz - 220D, with both in-
direct and direct fuel injection systems. The comparison shows
that the performance of the direct injection engine is much better
than the comparable indirect injection engine.
The schematic diagram of a typical unit injection system is
shown in Figure 2-1. It basically contains a plunger and nozzle
combination and the camshaft driving mechanism together with the
fuel supply and connecting pipings. The unit injection system re-
sults in maximum power saving for delivering fuel into the cylinder.
Furthermore, because of the simplicity of the mechanism, it can
control more precisely the injection quantity and the injection
3

TABLE
2-1.
COMPARISON
OF
IDI
PRODUCTION
ENGINE
WITH
DI
SUBSTITUTE
CD
Ud
4-> CD
d d i—i o\°
0) <D O OU^H ooC< Mh \ +CD • r-4 1—
1
D<DP
CD CD
+-) t-H
•H Uto VO (N1
o u ^ •
CD i M to
E CD CD ro toO h ECJ CD '—
'
Pu
1 -H (/) O *dj"
4-> CD CO CD *dt toC D EH •
aj cts bo-H o oCu i
'—' E
o oX CO CD dt *3-
O E rH •
2 M-H rH r—
i
V ' £
\^ LOw cd ro o
O E rH •
O bO-H rH rH' £
\ / \
m cd On) (XI
U E rH •
X CuO-H o o£
ton d K) rohH *H rH rHU
o3
•H +J
o od CD) C-r o oCD *r X LO LOC CD i—
i
to tol"H ^
do•H+D
CJ 1—
1
CD CD Q dh•r-, CD i-h adf-H H
in
CD CD
t—
H
Xfu CD -K Q
•H CJ MDd d d OCD CD CD <si
> s pq o)
oCD
m
00
XCDE
oLO
O•M
O<d
udCO
EJh
oMhdCD
CD
doH+->
cC
dCD
i—
(
CD
oo<•tc
4

FIGURE 2-1. SCHEMATIC OF INJECTION SYSTEM

Ricardo Comet swirl chamber Oaimler-Benz pre -chamber
FIGURE 2-2. SCHEMATIC DIAGRAMS OF RICARDO 'COMET'SWIRL CHAMBER AND DAIMLER-BENZ PRE-CHAMBER
6

timing; less mechanism also means less injection equipment noise.
By increasing the injection pressure, high atomization conditions
can be obtained, which result in quick mixing suitable for high
speed diesel operation.
AVL (Austalt fur Verbrennungsmotoren,Prof. Dr. h.c. Hans
2List) installed a direct injection system in a converted 2.2
liter Daimler Benz diesel engine. See Table 2-1. It obtained
20 percent better fuel economy than current light duty diesel en-
gines at equal output and equal gaseous emissions, almost instant
unaided cold starting, low particulate emissions, practically no
visible emissions, and less exhaust odor and irritancy than current
I.D.I. diesel engines.
Currently, the D.I. system is not yet fully developed for the
high speed diesel engines which are needed for light vehicles.
2. 1.1. 2 Indirect Injection - This is an earlier version of a fuel
injection system for the diesel engine. It contains a prechamber
(or swirl chamber) in addition to
Fuel is first injected into the pr
evaporation and mixing. The swirl
chamber geometry, enhances the mix
fuel supply is still most commonly
diesel vehicles. Figure 2-2 shows
typical indirect injection systems
Benz. The former is an example of
latter is the prechamber one. IDI
lower pressure.
the main combustion chamber,
echamber to allow more time for
,introduced by specially designed
ing mechanism. This version of
used in all the light duty
a schematic diagram of two
- Ricardo's "Comet" and Daimler-
the swirl chamber type and the
requires an injection pump with
2.1.2 Turbulent Evaporation
This is a process that precedes combustion in the cylinder.
In diesel, the requirement is different from that in spark ignition
engines. In the diesel case, an appropriate amount of fuel must be
evaporated and mixed before ignition occurs. As to the gasoline
engine it appears that the closer to the completion of evaporation
and mixing, the better would be the performance.
7

In open chamber diesel engines, the main chamber swirl is
mainly used to promote the fuel evaporation and fuel-air mixing.
For the divided chamber diesel, the initial preparation of the
mixture is mainly done in the pre- or swirl ing- chamber
.
Swirl and turbulence are frequently induced from the
specially designed cylinder configuration. Specifically, for
induced primary swirl, i.e., the swirl before combustion process,
any of the following methods can be used:
(i) Orient the angle of the inlet ports such that they
deviate from the radial direction.
(ii) Use a masked valve. Here, a part of the flow area
is blocked by a circular arc on the inlet valve.
(iii) Use a masked port. By masking a part of the flow area
with a shelf or projection in the passageway, the air
flow is diverted away from the shelf side of the port,
(iv) Use a directed inlet port. Here, the passageway is
laid out to direct the inflowing air in the desired
tangential direction.
(v) Use a vortex port. Here, the incoming air is made
to rotate around the valve stem before entering the
cylinder. The induced swirl motion, together with
the air motion induced because of the internal configu-
ration of the piston and cylinder, such as squish,
toroidal, or jet (from prechamber), will generate
strong turbulence in the cylinder.
2.1.3 Hot Wall Evaporation - MAN System
Hot wall evaporation is one kind of mechanism which dispenses
and evaporates the fuel mainly through heat and no other mechanism
during the pre- combust ion period. It was first designed and
tested by Maschinenf abr ik Augsburg Niirnberg company; it is called
MAN system or sometimes, M-system. Figure 2-3 shows a schematic
diagram of the M-engine. Basically, it contains an injection
system with injection pressure at about 2500 psia and a piston
with bowl shaped top. During the injection period, most of the
8
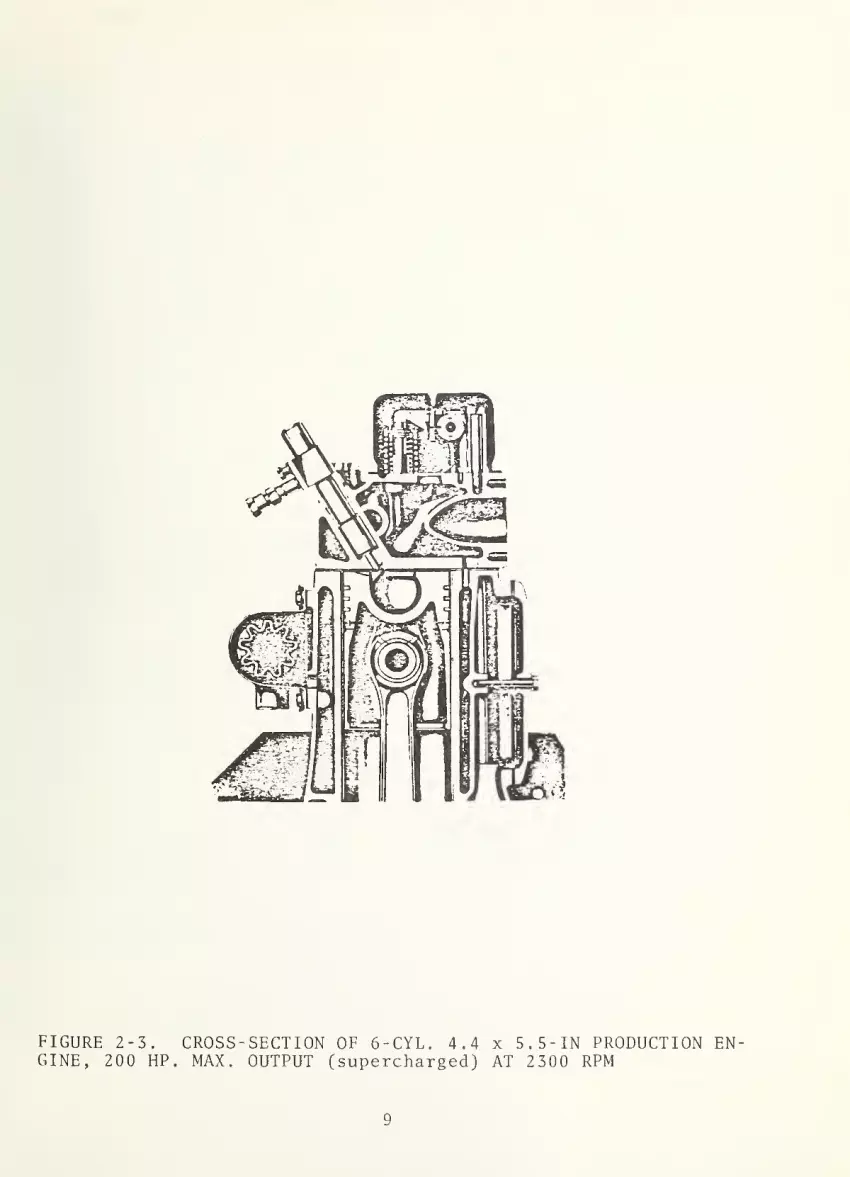
FIGURE 2-3. CROSS-SECTION OF 6-CYL. 4.4 x 5.5-IN PRODUCTION EN-GINE, 200 HP. MAX. OUTPUT (supercharged) AT 2300 RPM
9
injected fuel (almost 95 percent according to Meurer^) will
impinge on the hot combustion chamber wall to form a thin fuel
film. Meanwhile, because of the thermal effect of the wall, fuel
films are evaporated, decomposed and mixed with high-speed air
swirl. With the appropriate time table, a reduced exhaust smoke
level and low specific fuel consumption can be obtained over a
wide speed range. The MAN group has conducted extensive test
programs. The results are amazing. In particular, the typical
diesel type auto - ignit ion knocking has disappeared over the entire
speed range, even during idling and starting of the cold engine;
this has been obtained without sacrificing specific output or
fuel economy. Figure 2-4 shows some BSFC results of a 6-cylinder
naturally aspirated M-engine. The curves of iso-BSFC extend over
wide speed and map ranges. The turbocharged version of the same
engine has a peak output of 200 hp and its BSFC is less than 0.37
lb per BHP-hr over wide speed and map ranges. Exhaust smoke level
is influenced by the injection direction. Typical results are
shown in Figure 2-5. It can be seen that as the injection is
directed towards the wall, the smoke level remains low for the
whole speed range. This behavior is related to the minimization
of the initial auto- ignit ion fuel quantity.
Finally, this engine concept is used in heavy trucks and has
not yet received attention fof automobile and light truck applica-
tions .
2.2 ENGINE CONFIGURATION RELATED PARAMETERS
2.2.1 Rotary Engine Configuration
Rotary diesel engines currently have the following development
problems
:
1) the difficulty of obtaining a high enough compression ratio,
2) a high sur face/volume ratio at TDC,
3) a shallow and elongated combustion space,
4) a special gas sealing system, which contains single element
with line contact.
10

FIGURE 2-4. SFC CHARACTERISTICS IN RELATION TO ENGINE SPEED ANDMEN AND FULL-LOAD POWER CURVE FOR 6-CYL., D 1246 M ENGINE WITHNATURAL ASPIRATION
FIGURE 2-5. INFLUENCE OF DIRECTION OF FUEL SPRAY UPON EXHAUSTSMOKE. INJECTION WELL BELOW PLANE OF CHAMBER FORMAT
11
To overcome these difficulties, one of the methods is to use
a two stage rotary engine. To demonstrate its practical feasibility,
Research Rotary Engines, Rolls-Royce, Ltd., has conducted research
programs since 1964. The major achievement of this development
program was the development of an engine with tremendous compact-
ness. Figure 2-6 shows a schematic diagram of the typical two-
g-j-£g 0 rotary engine. The basic principle is to compress and ex
punge the gas medium in two successive rotating cylinders connected
by passages. Gas intake and exhaust occur at low pressure cylinder
and burn occurs in high pressure cylinder. Different fuel injector
positions have been tested. Optimized injector position is found as
shown in Figure 2-7. The combustion chamber is constructed in such
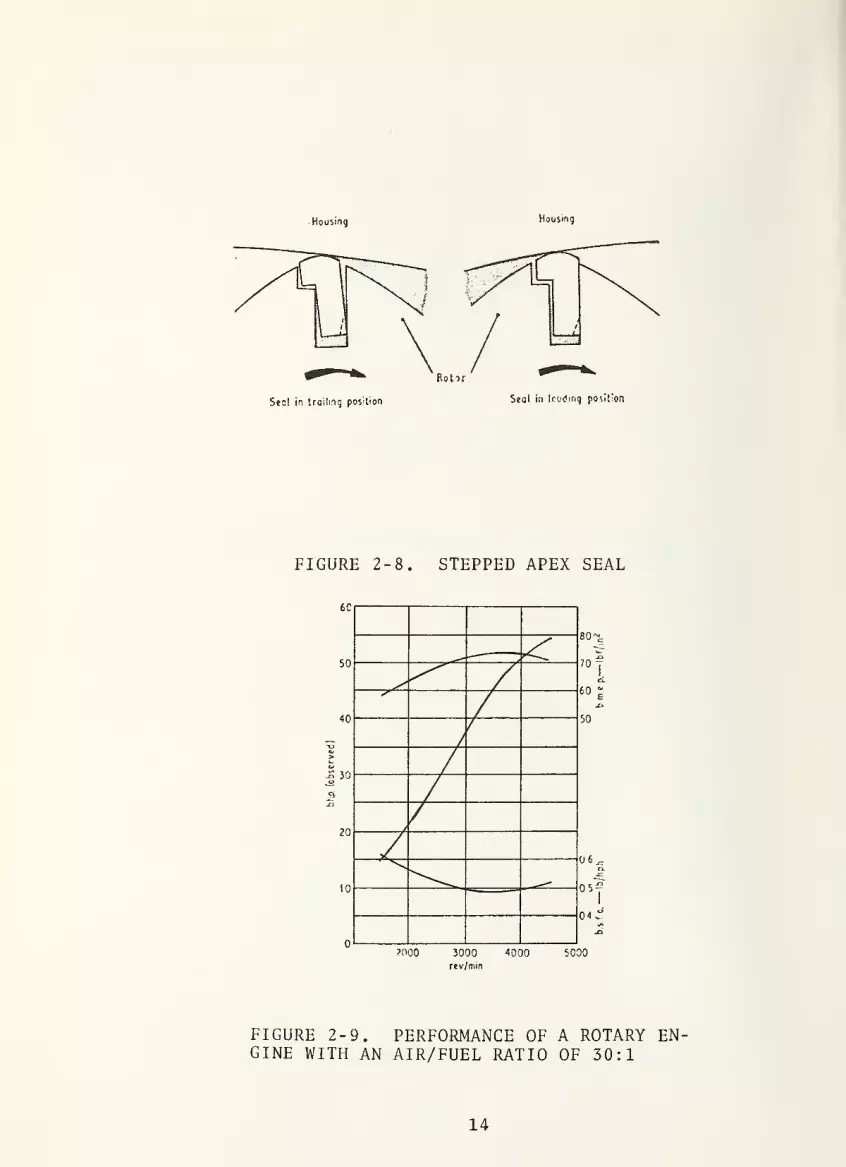
a way that air swirl can be induced. A set of stepped Apex seals,
Figure 2-8, having the advantage of reduced mass, was developed
and the desired operation was achieved. Figure 2-9 shows some
typical results. No emission data are available.
2.2.2 'Squish Lip' Piston Design
It is well known that the interior cylinder configuration
design influences the engine performance as well as emissions a
great deal. Here is a specific example, developed by the Perkins
Engine Group Ltd in England.^ In this program, a series of direct
injected diesel engines with bowled pistons were tested. The pur-
pose was to find a low emission combustion system without sacri-
ficing fuel economy. The bowl configuration was systematically
varied for different tests. The major test parameters were throat
diameter, bowl volume, flank angle, lip shape, and central pip.
Totally, fourteen different piston bowl configurations were used
as shown in Figure 2-10. Figure 2-11 shows some typical performance
and emission data of an optimized piston configuration with a com-
parison to the results of a standard open chamber engine. It is
clear that both smoke level and BSFC are improved, yet the NOX
level gets worse because of the increased combustion rate and peak
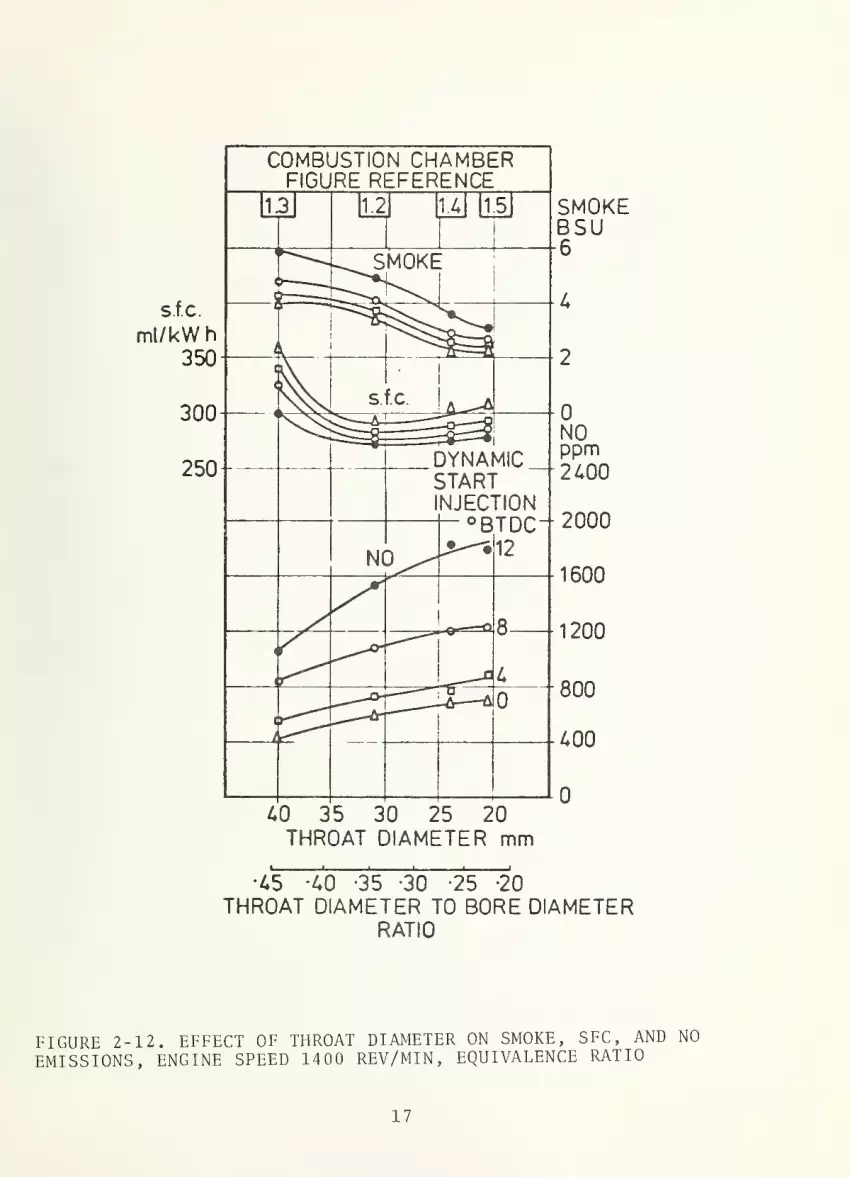
temperature. For the various specific test series, smaller throat
diameter gives lower smoke level and higher NO level due to the
improved combustion rate. Yet, the BSFC was optimized at moderate
12
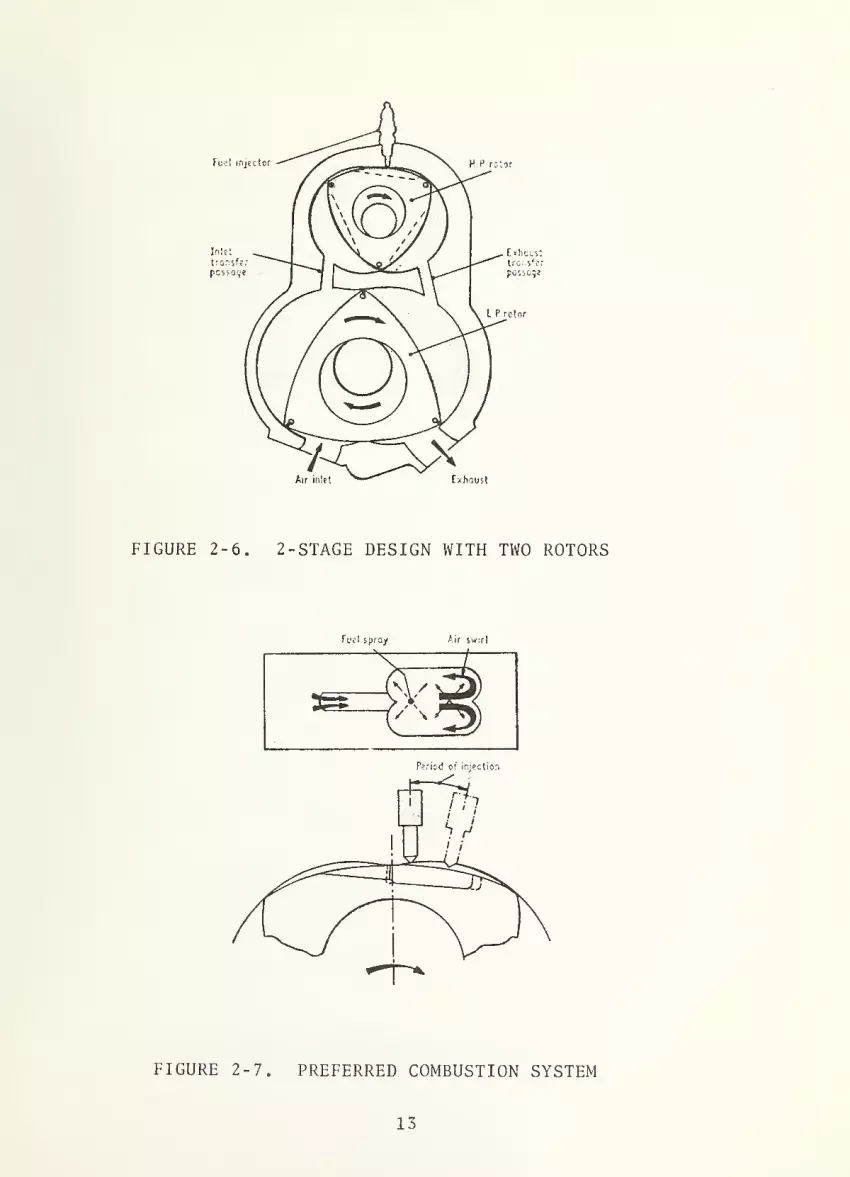
FIGURE 2-6. 2-STAGE DESIGN WITH TWO ROTORS
FIGURE 2-7. PREFERRED COMBUSTION SYSTEM
13
Housing Housing
FIGURE 2-8. STEPPED APEX SEAL
FIGURE 2-9. PERFORMANCE OF A ROTARY EN-GINE WITH AN AIR/FUEL RATIO OF 30:1
14
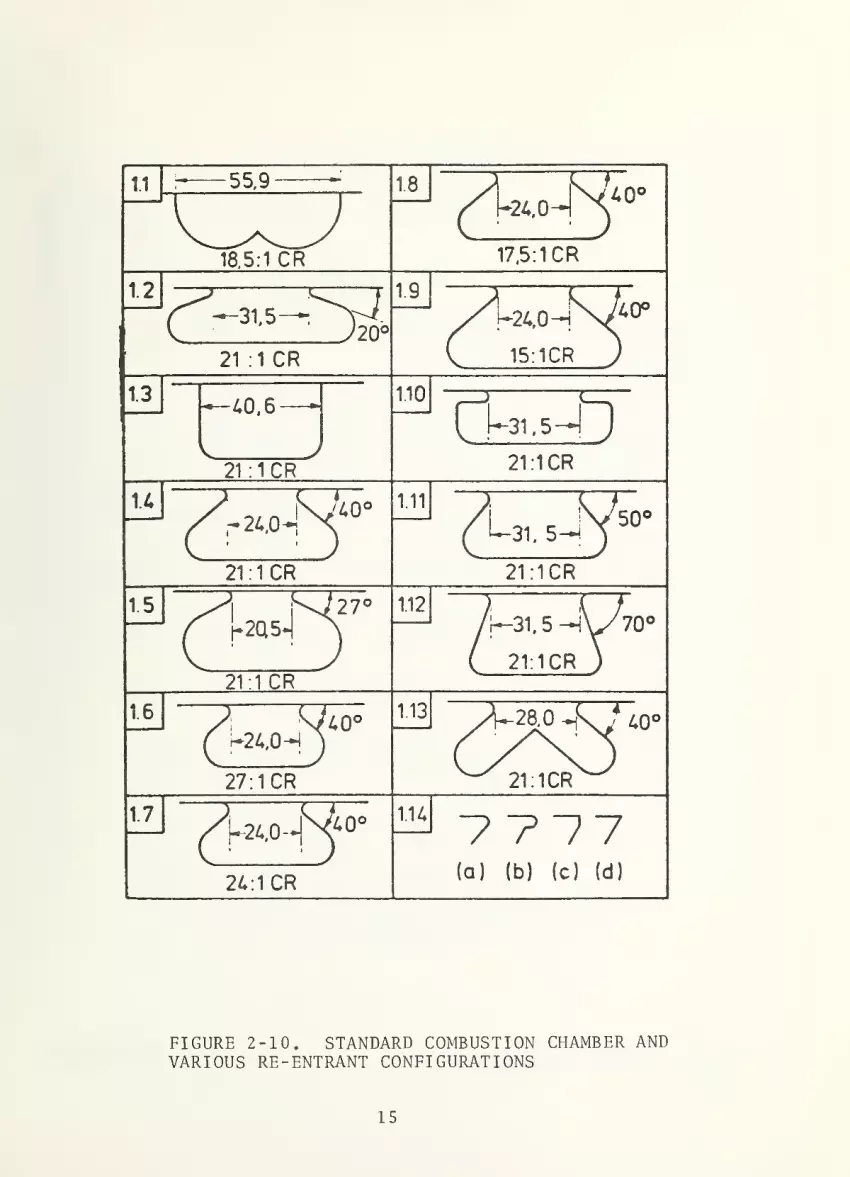
FIGURE 2-10. STANDARD COMBUSTION CHAMBER ANDVARIOUS RE-ENTRANT CONFIGURATIONS
15

DYNAMIC START OF INJECTION °BTDC
FIGURE 2-11. EFFECT OF INJECTION TIMING, STANDARD OPEN CHAMBER,AND RE-ENTRANT CHAMBER, ENGINE SPEED 1400 REV/MIN
,EQUIVALENCE
RATIO
16
•45 *40 -35 *30 -25 -20
THROAT DIAMETER TO BORE DIAMETERRATIO
FIGURE 2-12. EFFECT OF THROAT DIAMETER ON SMOKE, SFC, AND NO
EMISSIONS, ENGINE SPEED 1400 REV/MIN ,EQUIVALENCE RATIO
17

throat diameter as shown in Figure 2-12. It is possible that with
a very small throat diameter, turbulence velocity is too large so
as to cause large friction loss and heat loss, which results in
high BSFC. The various bowl volume tests indicate that as bowl
volume decreases, both ignition delay time and turbulence levels
were reduced, which results in higher smoke level, lower BSFC, and
lower NO level. Flank angle tests indicate that the optimized
angle range is around 20 to 40 degrees. Bowls with central pip
yield slightly better BSFC’s than those without.
2.2.3 Engine Sizing
Diesel engines are built with piston diameters of 2 to 37
inches, and with speeds ranging from 100 to 4,400 rpm while
delivering from 1.5 to 33,400 bhp on one crankshaft . With such
a wide range in engine size, a basic understanding of the effect
of cylinder size on engine performance is important. In a group
of cylinders of similar design and the same materials of construc-
tion, Taylor summarized the effects of differing cylinder size
as follows
:
1) Stresses due to gas pressure and inertia of the cylinder
assembly are the same at the same crank angle, provided
(a) mean piston speed is the same, (b) indicator diagrams
are the same and (c) there is not serious vibration on the
engine structure.
2) When inlet and exhaust conditions and fuel-air ratio are
the same, similar cylinders will have the same indicator
diagrams at the same piston speed and the same friction
mean effective pressure. Under these conditions brake
power is proportional to bore squared or to piston area.
3) Since the weight of a cylinder is proportional to the bore
cubed or to the total piston displacement, when the mean
pressure and piston speed are the same, the weight per
horsepower increases directly with the bore,
4) The temperature of the parts exposed to hot gases will
increase as cylinder size increases.
18

5) In diesel engines, as the cylinder bore increases speed of
revolution is reduced; it becomes easier to control maximum
cylinder pressures and maximum rates of pressure rise.
Consequently, fuels of lower ignition quality can be used.
6) As the cylinder bore increases, wear damage in a given
period of time decreases; that is, the engine lasts longer
between overhauls or parts replacement.
7) With the same fuel, fuel-air ratio, and compression ratio,
efficiency tends to increase with increasing cylinder size
because of reduced direct heat loss.
In general, engine size can correlate with many parameters.2
In practice, bmep, piston linear speed, specific output (bhp/in
of piston area) and ignition delay time appear to tend to fall
slowly as cylinder bore increases. Relative to engine performance,
(except for very small engines) as the bore increases, the engine
indicated thermal efficiency increases slightly, as does the
specific fuel consumption. Tests on cylinders of less than 2-in
bore usually show very poor brake thermal efficiency because of
the relatively large heat loss and friction loss.
2.3 VALVING
Valves control the inlet and exhaust of the engine. Valve
geometry, timing, duration and lift will all influence engine
performance. Basically, the valve geometry, together with intake
duct and cylinder design, relates to the intake air swirl and
turbulence, their pattern and levels, and the valve timing, dura-
tion, and lift directly control the cylinder and volumetric effi-
ciency. Certain operations of valves, such as the valve overlap,
will also influence the intake air composition and physical condi-
tions .
Currently, a universally accepted valve used in 4-cycle
engines is the poppet valve. None of the other types, such as
sleeve, piston and rotary valves, etc. can compete with it. The
poppet valve has the following features:
19
1 ) It can give larger values of valve-flow area to piston area
than most other types,
2) excellent flow coefficient,
3) low manufacturing cost,
4) very little friction so that it requires less lubrication,
and
5) needs cooling on exhaust valves.
Poppet-valve design must achieve satisfactory results in
respect to the amount of gas flow, cooling and heating flow, struc-
tural strength, lubrication and wear and provision for repair and
replacement
.
An extensive parametric study of the influence of valve opera-
tions on volumetric efficiency has been made. 5Figure 2-13 shows
the correlation of the volumetric efficiency and the (^) |- where:
b is the cylinder bore; D is the valve outside diameter; s is the
mean piston speed; and a is sound velocity at inlet temperature.
This conclusion indicates that the volumetric efficiency decreases
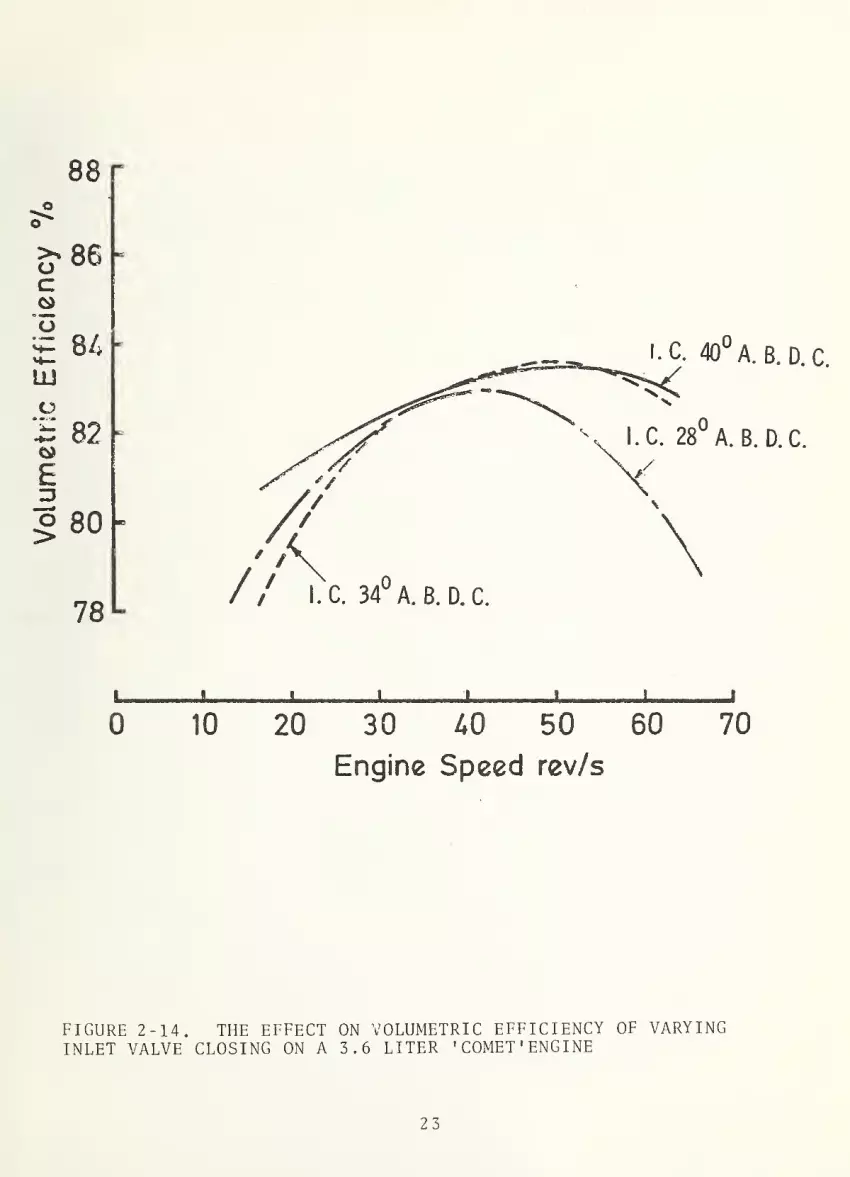
as D increases, which we would expect. Figure 2-14 presents some
of Ricardo’s test data on the valve closing effect on volumetric
efficiency. It can be seen that there is an optimized engine speed
for maximum volumetric efficiency, and valve closing time has a
significant effect on volumetric efficiency at either high or low
engine speeds.
As mentioned above, exhaust valve cooling is a very important
problem. Ordinarily, valves are made of austenitic steels, EV3
to EV11. In regard to the cooling problem, a relatively large stem
diameter, plenty of material in the valve head, minimum exposure,
of the stem to hot gas, coolant passages all around the seat and
stem, and a minimum length of heat paths to coolant are considered.
For valves of more than about 2-inches, internal cooling becomes
necessary. Sodium is used frequently for internal cooling material.
420

FIGURE 2-13. POPPET-VALVE SCHEMATIC DIAGRAM
21

\ Lift
v-. X n\ 0.238 0.262Design
(in) V1.050 /j o
0.9)0 + X
0.830 V > A >
1.050 0 B
FIGURE 2-13. VOLUMETRIC EFFICIENCY WITH SEVERAL INLET-VALVE
SIZES, LIFTS, AND SHAPES: b = cylinder bore; D = : VALVE OUTSIDE
DIAMETER: s = MEAN PISTON SPEED; a = VELOCITY OF SOUND AT INLET
TEMPREATURE; CFR 3.25 x 4.5 in. CYLINDER: 4 - 4.92.
22
88 r
o 86c2*
os- 84LU
o'5 82
I 80
78
i i i i j i
0 10 20 30 40 50 60 70
Engine Speed rev/s
FIGURE 2-14. THE EFFECT ON VOLUMETRIC EFFICIENCY OF VARYINGINLET VALVE CLOSING ON A 3.6 LITER ' COMET ' ENGINE
23
2.4 COMPRESSION RATIO
From a thermodynamic point of view, higher compression ratios
in general result in higher thermal efficiencies. Diesel engines
usually run at much higher compression ratios (12-24) than gasoline
engines (7-10) . This is one of the reasons that diesel engines
have better fuel economy than gasoline engines. However, as we
attempt to apply high compression ratios to an engine, we have to
be careful about the interaction among the compression ratio and
other important parameters which influence the combustion process.
Figure 2-15^ gives a vivid example. As the compression ratio7increases, we might expect, according to Hardenberg and Frankie
that the engine thermal efficiency increases (relfected by the
BSFC behavior), smoke level decreases, and NO level increasesX
accompanying the decrease of ignition delay time. Yet, the actual
test data, as shown in Figure 2-15, indicate that all the behaviors
are the opposite of what would be expected. Because of the increase
of compression ratio, the turbulence level in the cylinder is also
greatly reduced; in consequence, the mixing is poor even after
ignition, combustion is incomplete, and peak temperature is low.
Therefore, a lower thermal efficiency (higher BSFC), a higher smoke
level, and a low NO level are obtained.’ x
The minimum compression ratio of diesel engines depends on
the cetane number of the fuel used as well as on the cetane number
requirement of the engine. This limitation basically relates to
the aut o- ignitabil ity of the compressed fuel-air medium in a
diesel cylinder. Cetane number is the index which characterizes
the auto-ignitability of the fuel. The maximum compression ratio
of a diesel engine depends on the engine stress condition, the
manufacturing limitation (for high compression ratio, the cylinder
clearance becomes small so the precision requirement becomes
relatively high), and the power used for compression. It is not
always true that the higher the compression ratio, the better (as
illustrated above) the performance of the engine. Hence, some8investigators study the variable compression ratio (VCR) concept
to optimize engine operation in terms of compression ratio effect.
This particular paper describes programs to reduce the peak trans-

FIGURE 2-15. EFFECT OF COMPRESSION RATIO ON SMOKE, SFC AND NOEMISSIONS, ENGINE SPEED 1400 REV/MIN
, EQUIVALENCE RATIO
25

ient smoke burst to acceptable levels. They used a 1360 dis-
placement volume, 12-cylinder engine as their test apparatus. The
cylinder clearance is varied by adjusting the piston head volume.
The compression ratio is varied from 16 to 9, from low to high
engine power range. The actual thermal efficiency of the AVCR
1360-2 is higher than what would initially be assumed for an engine
employing a 9.1 compression ratio. With optimized components, the
test engine smoke level (Figure 2-16) is greatly reduced in compar-
ison with that of a standard engine.
2.5 ADIABATIC WALL AND TURBOCOMPOUND CONCEPT
By looking at a typical energy balance diagram of the diesel
engine, as shown in Figure 2-17, it is clear that almost 2/3 of
the energy input is wasted either through the coolant or by the
outgoing exhaust gas. To recover that amount of energy it is
natural to think of using an adiabatic wall surrounding the com-
bustion chamber and some power producing device downstream of the
engine exhaust. The U.S. Army Tank-Automot ive Research and
Development Command (TARADCOM) and Cummins Engine Company have9
jointly explored the adiabatic wall concept. Figure 2-18 shows a
schematic diagram of an adiabatic turbocompound engine. As shown,
both the engine and the exhaust turbine produce power for the
engine flywheel. Figure 2-19 shows another assembly diagram which
contains a Rankine bottoming cycle on an adiabatic diesel engine.
The adiabatic engine is supplied with turbocharged air through an
aftercooler. The exhaust gas, flowing through an exhaust turbine,
is used to generate vapor. The vapor generated in the boiler is
used to turn an expander to produce power. The performance of
an insulated naturally aspirated diesel engine has also been pre-
dicted. The comparison with a standard diesel is shown in Table
2-2. From the listed value, it appears that little is gained by
insulating the engine alone since more energy is exhausted. This
situation leads to testing the insulation, together with a
turbocompound (or Rankine cycle or both) mechanism. Table 2-3
shows some predicted results of several combinations and their
comparison. It is clear that by using adiabatic, turbocompound and
26

ENGINE
speed—
rpm
instantaneous
net
bhp
ORIGINAL WJITI-CfLINCER TEST WITH S TANDARO COMPONENTS
MULTI CYLINDER T£ST AITH SMOKE REDUCTION COMPONENTS
Figure 2-16. MULTI - CYLINDER ENGINE TRANSIENTACCELERATION SMOKE TEST
27
SMOAt
%
OPACITY

FIGURE 2-17. TYPICAL ENERGY BALANCE OF DIESEL ENGINE
FIGURE 2-18. TOTAL ENERGY RECOVERY VIACUMMINS ADIABATIC TURBOCOMPOUND ENGINE
28

2io°fExhaust
Pump
FIGURE 2-19. SCHEMATIC OF A RANKINE BOTTOMING CYCLE ON AN ADIA-BATIC DIESEL ENGINE SHOW- THERMODYNAMI C STATE POINTS AND NUMBERS
29
ffItt

TABLE 2-2. PREDICTED PERFORMANCE FOR 250 BHP STANDARDAND INSULATED NATURALLY ASPIRATED DIESEL ENGINE
Standard Insulated
Engine Speed, rpm 2100 2100
Intake Manifold Pressure, psia 14.1 14.1
Exhaust Manifold Pressure, psia 15.0 15.0
Exhaust Temperature, °F 1280 1860
Volumetric Efficiency, °F 0 . 843 0 . 680
Heat Projection Rate, Btu/min 5842 556
Start of Heat Release, °CA 340 340
BSFC,lb/BHP -HR 0.400 0 . 398
Installed BSFC, lb/BHP-HR 0.415 0.398
BSNC^,Grams/BHP-HR 5.0 5.0
TABLE 2-3. DIESEL CYCLE SIMULATION RESULTS OFVARIOUS ADVANCED DIESEL BASED POWER PLANT
Turbo-compound(cooled)
AdiabaticTurbo -
compound(Insulated)
AdiabaticRankine
n R = 0.158
AdiabaticTurbocompound
Rankinen R = 0.158
SPECIFICATIONS
Engine RPM/AirFue 1
Peciprocator
,
2100/28 2100/28 2100/28 2100/28
BMFP 177.8 177 183 117
PERFORMANCE
Peciprocator
,
BHP403. 2 401 .
8
415.1 401.8
Turbine, BHP 40.8 109.6 - 109.6Rankine
,BHP - - 77 .
6
64.4Total, BHP 444.0 511.4 492.7 575.8
EFFICIENCIES
Peciprocator
,
BSEC0.341 0.363 0.323 0.366
Overall 0.300 0.285 0.272 0.255
EMISSION
BSNO 2 ,Grams/
BHP -HP5.0 5.0 5 . 5 4.4
30

Rankine cycle together, significant gains in fuel economy and
emission level may be achieved.
2.6 FRICTION
Frictional loss stands for the unavoidable part of power loss
from diesel engine. By definition, it represents the difference
between the indicated and brake power output. Frictional loss
mainly consists of mechanical friction loss, pumping power loss,
compressor power loss, auxiliary power loss, etc. Important types
of mechanical friction may be divided into four classes, i.e.,
fluid-film friction, partial-film friction, rolling friction, and
dry friction. Under normal operating conditions, all the rubbing
parts of an engine are supposedly operated under fluid-film friction.
So, the partial-film friction, like dry friction, is of little im-
portance as a contributor to engine friction. Fluid-film friction
depends heavily on fluid thickness, and surface shape. ^ ^
The above parameters can be regrouped into dimensionless form
so that the dimensionless frictional coefficient can be expressed
as Reynolds number as well as those dimensionless parameters
characterizing the surface geometry. Rolling friction associates
with ball and roller bearings and with cam-follower and tappet
rollers. These bearings have a coefficient of friction which is
nearly independent of load and speed. The frictional force is due
partly to the fact that the roller is continuously "climbing" the
face of a small depression in the track created by the contact
surfaces as they deflect under the load. Hence, the elastic
property, such as Young’s modules of the surface material, will
influence the magnitude of the rolling friction. Frictional loss
is ordinarily expressed as frictional mean effective pressure
(FMEP - lb^/in ). In practice, one of the methods for evaluating
FMEP is to use so-called Willans Line, i.e., a curve recording the
relation between fuel-energy input and BMEP. FMEP can be estimated
by extrapolating the Willans Line towards the negative MEP-axis
direction until it intercepts the MEP axis. The magnitude between
the intercept point and the origin on the MEP axis is presumably
31
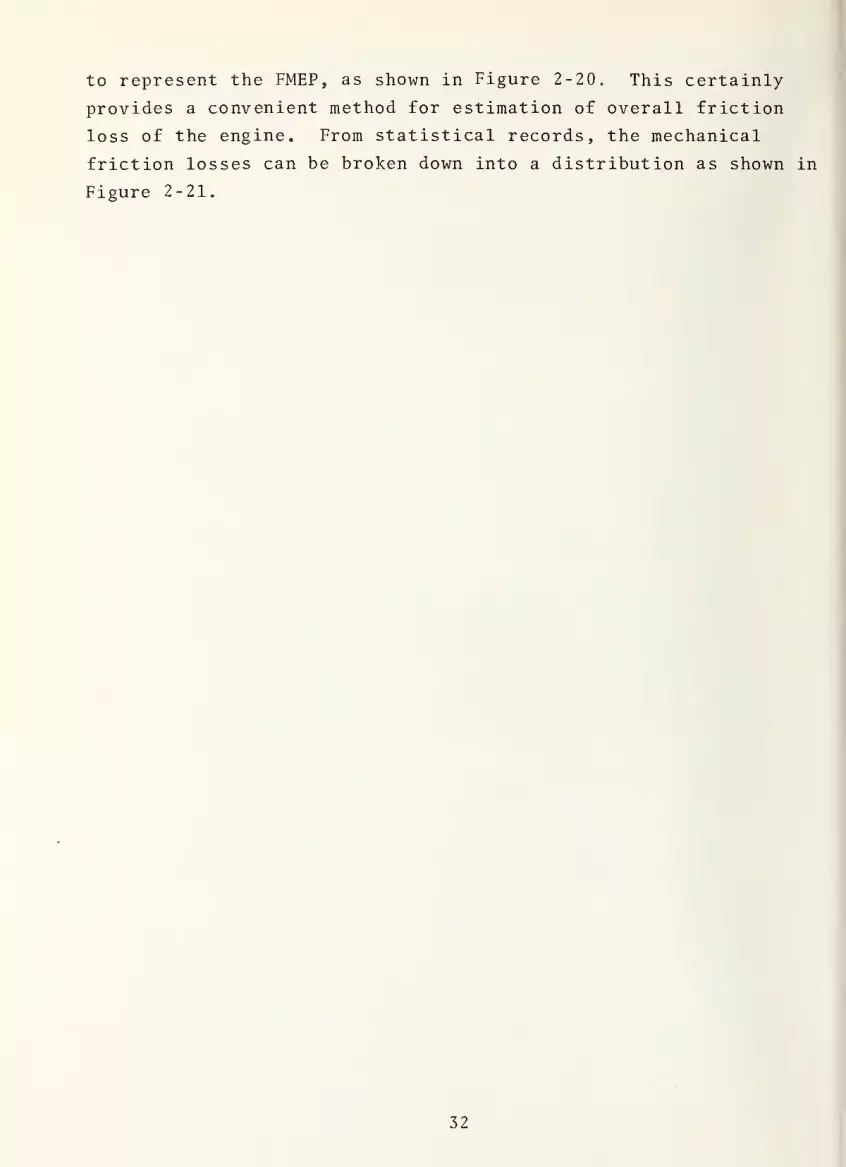
to represent the FMEP, as shown in Figure 2-
provides a convenient method for estimation
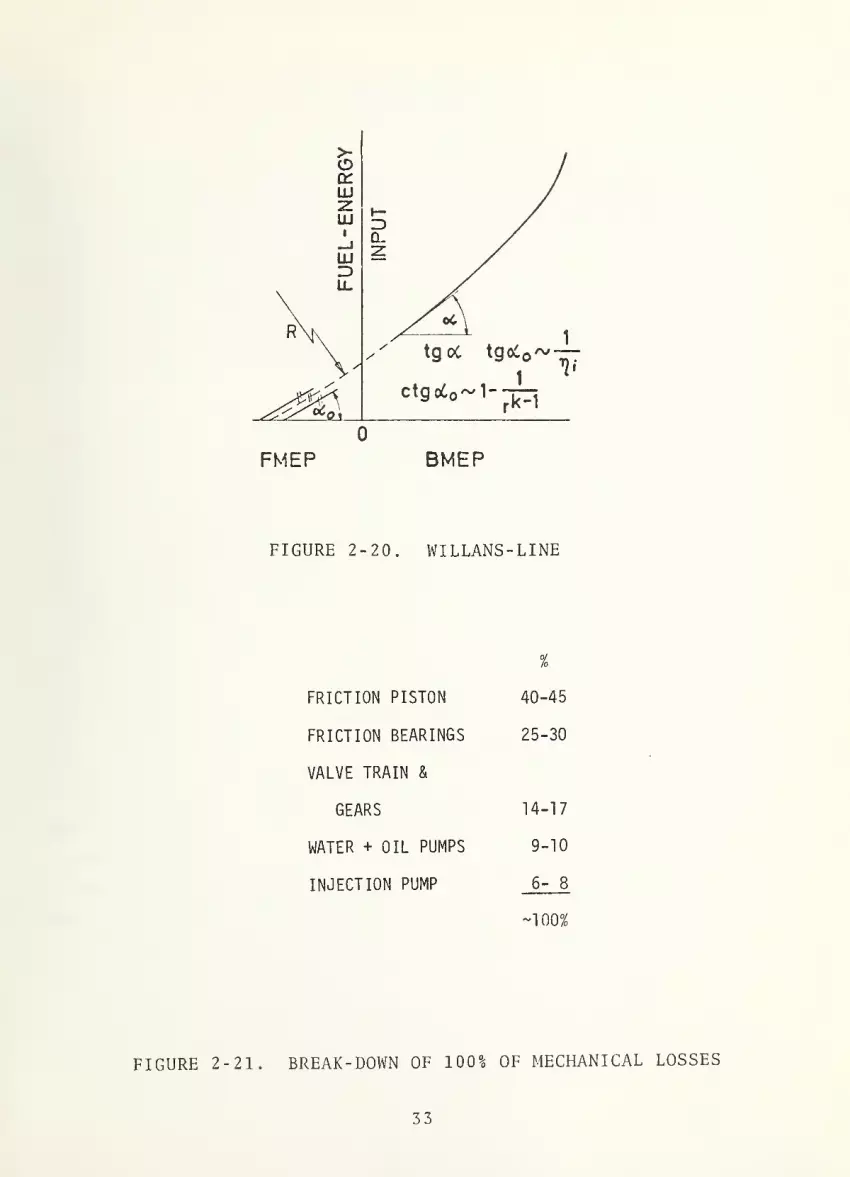
loss of the engine. From statistical record
friction losses can be broken down into a di
Figure 2-21.
20. This certainly
of overall friction
s, the mechanical
stribution as shown in
32
l L
0
FMEP BMEP
FIGURE 2-20. WILLANS-LINE
%
FRICTION PISTON 40-45
FRICTION BEARINGS 25-30
VALVE TRAIN &
GEARS 14-17
WATER + OIL PUMPS 9-10
INJECTION PUMP 6- 8
~1 00%
FIGURE 2-21. BREAK-DOWN OF 100% OF MECHANICAL LOSSES
33

3. ENGINE CONTROL STRATEGIES
Until recently, the task of calibrating a given engine/power
train configuration was simply an iterative procedure of testing,
adjusting the parameters of the injection system (mainly fuel
delivery and injection timing) and then re-testing. The objective
was to obtain good performance, low fuel consumption, low smoke,
and low noise. As the number of control variables grew, and as the
complexity of the ways of controlling emissions increased due to
more stringent emission limits evaluated under transient running
conditions, the task became overwhelming.
Mathematical models are used to compute the 1975 FTP cycle
emissions and fuel economy on steady state bench data. A good
correlation exists with chassis dynamometer tests. In fact, for
diesel engines, any transient condition can be assumed as quasi-
steady because the fuel is directly injected into the combustion
chamber. Therefore, if the emission (HC/CO/NO ) concentrationX
and fuel consumption maps (in grams per hour) are given, modal
emission and fuel economy characteristics can be calculated as
follows. Main data requested for performing program are: vehicle
weight; wheel, transmission and engine inertia; gear ratios; tire
sizes; vehicle frontal area; air and rolling drag; transmission
efficiency. The cycle is divided into one second intervals. The
program calculates, for each interval, average speed and accelera-
tion of the vehicle and then the power needed to perform the cycle.
The program supposes that the engine runs at constant speed and
load for every one second interval. According to the tire and
total transmission ratio, the program calculates a correspondence
between the engine speed and the actual vehicle speed. From these
data (engine speed and power) the program reads, on the steady
state maps, fuel consumption and HC/CO/NO emission at each secondA
of the cycle. By summing all the calculated values, total fuel
consumption and emissions (in grams) emitted during the cycle are
obtained. The final value of the pollutant and fuel consumption
(grams/mile) is computed dividing the previous value by total
mileage
.
34
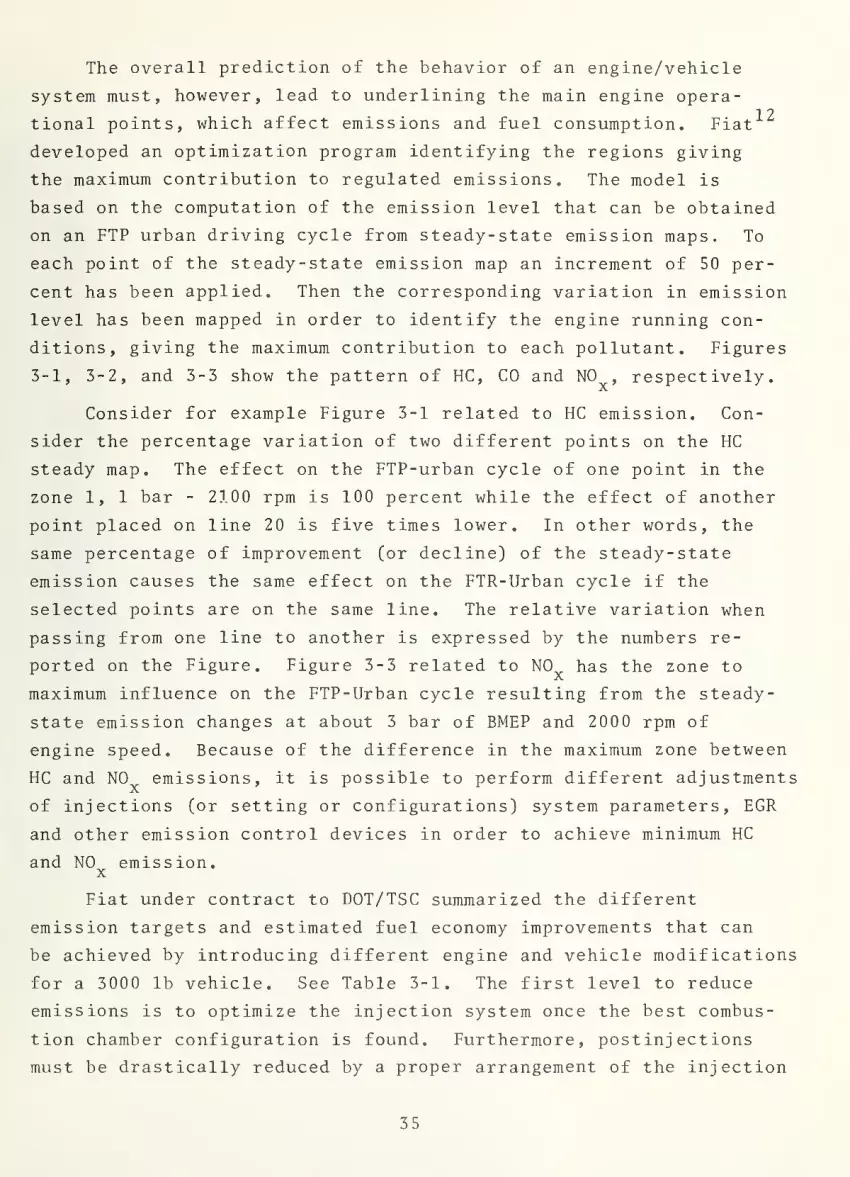
The overall prediction of the behavior of an engine/vehicle
system must, however, lead to underlining the main engine opera-1
2
tional points, which affect emissions and fuel consumption. Fiat
developed an optimization program identifying the regions giving
the maximum contribution to regulated emissions. The model is
based on the computation of the emission level that can be obtained
on an FTP urban driving cycle from steady-state emission maps. To
each point of the steady-state emission map an increment of 50 per-
cent has been applied. Then the corresponding variation in emission
level has been mapped in order to identify the engine running con-
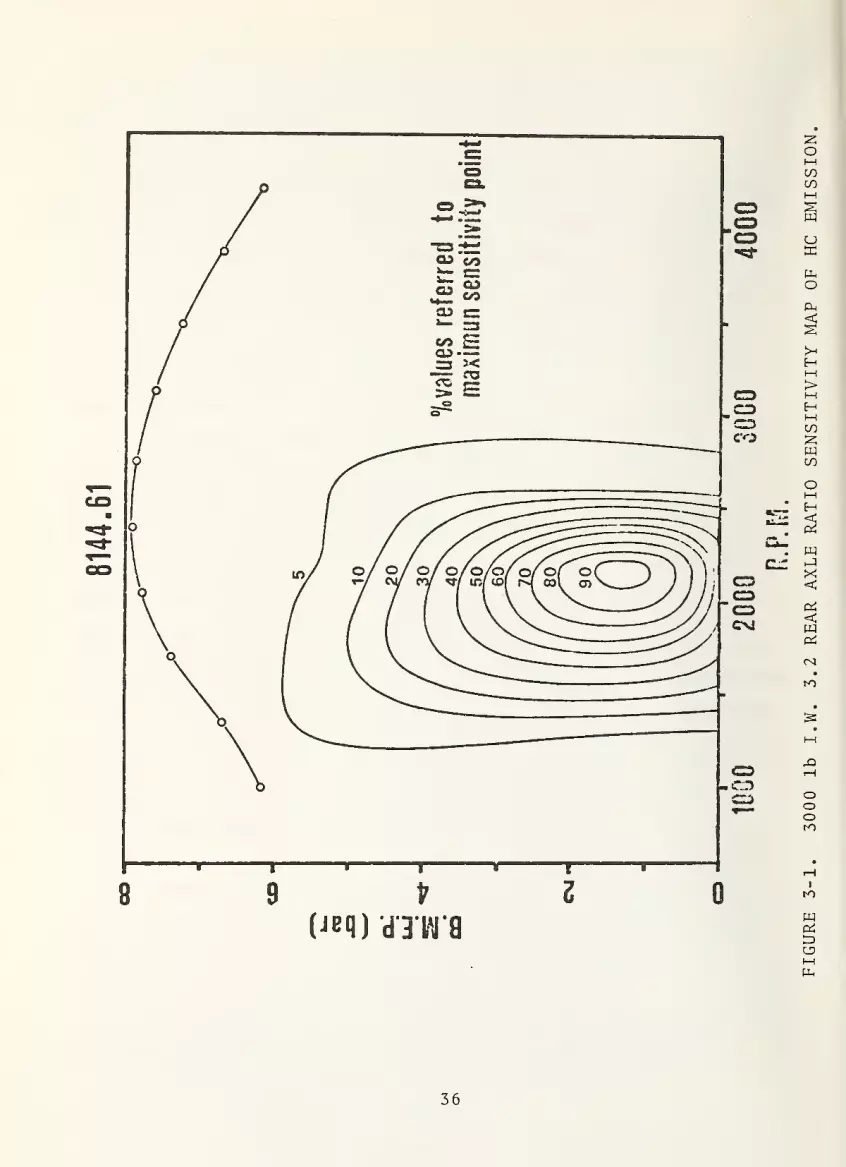
ditions, giving the maximum contribution to each pollutant. Figures
3-1, 3-2, and 3-3 show the pattern of HC, CO and NO, respectively.
Consider for example Figure 3-1 related to HC emission. Con-
sider the percentage variation of two different points on the HC
steady map. The effect on the FTP-urban cycle of one point in the
zone 1, 1 bar - 2100 rpm is 100 percent while the effect of another
point placed on line 20 is five times lower. In other words, the
same percentage of improvement (or decline) of the steady-state
emission causes the same effect on the FTR-Urban cycle if the
selected points are on the same line. The relative variation when
passing from one line to another is expressed by the numbers re-
ported on the Figure. Figure 3-3 related to NO has the zone to
maximum influence on the FTP-Urban cycle resulting from the steady-
state emission changes at about 3 bar of BMEP and 2000 rpm of
engine speed. Because of the difference in the maximum zone between
HC and NO emissions, it is possible to perform different adjustments
of injections (or setting or configurations) system parameters, EGR
and other emission control devices in order to achieve minimum HC
and NO emission,x
Fiat under contract to DOT/TSC summarized the different
emission targets and estimated fuel economy improvements that can
be achieved by introducing different engine and vehicle modifications
for a 3000 lb vehicle. See Table 3-1. The first level to reduce
emissions is to optimize the injection system once the best combus-
tion chamber configuration is found. Furthermore, pos t inj ec t ions
must be drastically reduced by a proper arrangement of the injection
35
8144.61
8 9 tr
(je q) diwa
z o
36
FIGURE
3-1.
3000
lb
I.W.
3.2
REAR
AXLE
RATIO
SENSITIVITY
MAP
OF
HC
EMISSION
8144.61
8 9 t
(Jeq) d JW'9
0
37
FIGURE
3-2.
3000
lb
I.W.
3.2
REAR
AXLE
RATIO
SENSITIVITY
OF
CO
EMISSION

8144.61
g g y
(JBq) d 3 W a
0
38
1000
2000
3000
4000
R.P.M.
FIGURE
3-3.
3000
lb
I.W.
3.2
REAR
AXLE
RATIO
SENSITIVITY
MAP
OF
NO
EMISSION

TABLE
3-1.
IMPACT
OF
VEHICLE
MODIFICATIONS
ON
EXHAUST
EMISSION
LEVELS
O>•H o\° ©\=>
+-> O LOcO (XI r—
H
^ £CL) O 33 33PC (3 ©No o\° (3 13
o 1 o o 40 oj oj
out/) T—
H
WW 4 + + LO ocO W) r-H rH^ H C + +O O cO
> 3 43 (3 £< 14 43 O O
O o3= 4=
4 4->
O OP3 «
1
U CD
•H -M 43 43 40 CXI CXI
4 CO • • z • • •
J-H T—
1
o c o o ocO 33 V V A V A(4
* 4:
* 4C * *X o o O lO o o LA
O • • z • • •
2 ru Osl rH r-H <Xj rH r-H
A V V V
o • • z * • •
u hO tn tO to fOV V V V V
rH rH r—
H
rH r—
H
u XL xf2 • • z • • •
o O O O OA V A V V
+(3 •
13 + PCO o O •
•H • •ri ,
—
N 43+-> \—
l
4-> • • •
3! • a3 > u Wf—
1
14 u •
O v—
'
+ -4 + H +m S3 4-1
O (3 • »H • •
4-> •H O O 30 o 33 • o(3 4-> -H • o • <u SO U 4> 4H S —
1
be •1—
1
'/) O CO * • 4 > •
o •f—i N 14 O 14 aJ 144 (3 -H rH r—
\
2 +o C4 i-i £= + u • + U +13 • rH *H ^ O O
•r—l • r-H -M • 43 • • 43 • •
40 < O Ph < O > < U H F—1 43(3 • 33 o • > 33 •
P3 2 (4 2 2 W E—' E-H E—1
"=} CVl
O OU Uc cO CD
4 4O 0)
4-1 4-1
0) OPC D
i
tn v)
43 43
O OO Ou~i ln
csi Ki
o o
r—i OcO lt>
3 r~-
cr ~
0) c\i
f-> eo o
4<3 4-1
cO
43 bO+-> (3
•H10 U)to (3
cu CO
r-t 4
+-> +->
43 43bC bt>
•pH • pH
<D o£ £
CO *HrH CO
4. 4CL) OC 13
'H *rH
O <L)
r-H f“H
u u•H • H43 43o cu
> >
4 4o o(4 |4K *
*
39
system and nozzle "sac” volume of the injectors reduced. In this
way low HC levels are obtained and the injection timing can be
retarded for achieving low NO in those cycle zones that giveX
maximum contribution to the grams per miles of NO emission. Thus,
injection timing has to be controlled against engine speed and load.
Vehicle modifications (i.e., rear axle ratio) are important
in order to achieve better fuel economy without unacceptable loss1
2
in performance. At the same time slight reduction in NO isX
obtained. Lower inertia weight is another important factor to1
2
attain better fuel economy and lower NO . EGR prototypes and
oxidation catalysts have been tested to achieve lower NO andx
lower HC levels, respectively. A system to control the engine
particulate emission is turbocharging. Fiat has shown that par-
ticulate levels can be as much as 35 percent of that obtained with12 13
the naturally aspirated version * and fuel economy can be
improved too. Unfortunately, EGR has to be used to obtaih lower
levels of NO (lgm/mi) . EGR studies till now^ cause a strong
increase in particulate (up to two times). Thus, the present
technology emission level of 0.41/3.4/1.5/0.6 gms/mi of HC/CO/NO /
particulate can be achieved with very good fuel economy while the
lower emission level of 0.41/3.4/1.0/0.20 will be the subject of
future research.
40

4. IMPLEMENTATION OF ENGINE CONTROL
4.1 GENERAL
The use of indirect injection and direct injection light duty
diesels in passenger cars and light trucks is a subject under
discussion.^ The basic issue is particulates (or better carbon
formation) and their associated compounds. Some examples of
particulate reductions have been cited in the previous section.
Particulates may be controlled through aftertreatment devices,
for example, particulate traps and oxidation catalysts. However,
these devices are in the early stages of development. Electronic
control of EGR, turbocharging and injection timing offer added
potentials to reduce particulate emissions. Finally, fuels of
suitable characteristics for passenger cars and light truck diesels
require explorations.
4.2 AFTERTREATMENT DEVICES
Diesel engine oxidation catalysts must satisfy more demanding
requirements than present day catalysts used for spark ignition
engines. The minimum, average and maximum gas temperatures in the
exhaust manifold of a Naturally Aspirated Light-Duty LDT Diesel
engine are about 120, 200 and 550°C respectively during the 1975
FTP. These values are much lower than that of a gasoline powered
vehicle. Therefore, an oxidation catalyst with good efficiency at
lower temperature has to be used, for example, the platinum
oxidation catalyst.
The variability in air/fuel ratio (a catalyst works well in
the range of 30 and 70 percent maximum load) also requires atten-
tion. HC and CO reduction of 50 and 65 percent respectively were12 16
found when using a platinum oxidation catalyst. ’ Other tests
at DOE-Bartlesville showed a PNA reduction. In particular B(a)P
decreased to 40 percent under steady state low temperature condi-
tions .
Exhaust particulate trap systems which use the available lead
41

trap technology are being studied. Tests have been made on a 5
cylinder Mercedes 300-D with automatic transmission at the 4000
pound weight. A particulate reduction of something greater than
50 percent was found when a alumina-coated steel wool trap was
used. The efficiency was negligible after 3000 miles. A substan-
tial reduction in odor was also found. Not only was there less
odor intensity, but there was a different quality. Hydrocarbons
were substantially less (40 percent) while there was no change in
the other regulated emissions nor in economy. Sulfates were
sensibly low (90 percent when trap was new and 60 percent at the
end of the test) and Benz (a) Pyrene was half of the base value.
It appears that the trap acts as a catalyst while HC and PNA first
and later particulate are aborted effectively, usually through an
upstream catalyst system and a downstream trap (DOE-Bartlesville
:
tests on stationary diesel power plants) . Since these data re-
present initial findings, however, further research still remains
in order to find effective aftertreatment systems (catalyst and/or
traps) for diesel engines.
4.3 FUEL INJECTION SYSTEMS
Historically, injection systems are designed to satisfy
power, consumption and exhaust emission requirements.
A diesel engine injection system consists of an injection
pump, a flow adjustment system and the same number of injectors
as the engine cylinders. The injection pump is either of the
"in-line” or "rotary piston and distributor" type. An in-line
pump consists essentially of the same number of pumping elements
as the engine cylinders. Each element is actuated by a cam
mechanism, the eccentric motion of which gives high pressure of
fuel inside the pumping element. The fuel, under high pressure,
actuates the injector needle valve and is atomized inside the
combustion chamber through the injectors.
Unlike the Bosch gr. "P" MW in-line pumps, the Bosch "VE"
and CAV "DPA" distributor and rotating piston pumps are provided
with a distributor that opens as many openings as the engine cyl-
42
inders. These pumps are commonly mounted on prechamber engines,
mainly because of their small size but also because injection
pressure and duration are not so important as for the direct in-
jection engine.
Nozzle type holes are used for direct injection engines due
to the configuration of the engine head and the need to send fuel
directly to the combustion chamber. Pre-and swirl chamber engines
can more easily use pintle-nozzle.
The need to provide lower emission engines has recently
prompted studies into the injection system features in order to
identify the main major controlling parameters. (Typical examples
are elimination of the after- inj ect ion of fuel which does not
affect performance and consumption but which drastically alter the
emission of HC, as shall be seen later.)
The parameters for emission by engine type can thus be shown.
D. I . Eng ines
1) Injection pressure : Increased injection pressure does
not alter the values of NO and HC substantially, while
particulate can be reduced without increasing fuel con-. • 17sumption
.
2) Timing: Delaying injection reduces N0__ and HC by aboutX
(10/12 percent) /degree but increases consumption by
1 percent per degree, particulate by (10/15 percent)/
degree and exhaust gas temperature by about (1 0° C) /degree
Decrease of HC is voided and changes trend when timing
is close to T.D.C. (-4 and 5° B .T.D.
C
. ).
^
Speed and
load changes at the above rate show marked variations of
emission levels. Trend inversion occurs from 2 to 8
1
8
degrees of timing before top dead center.
3) Post-inj ection : The parameters chosen for a certain in-
jection system (speed, load, timing and type of nozzle)
can create pressure waves in the piping so as to form
post - inj ect ions which tend to increase HC emission and
43

even consumption. This can be eliminated by reducing the
internal diameter of pressure piping, increasing the
delivery valve retraction volume or by adding a reserve
flow throttle valve on the piping from the pump to the. . . 16mj ector
.
4) Injection duration : Faster injection together with tim-
ing adjusted to load and speed reduce NO and HC. Inter-X
esting results were obtained by using the FIAT DRF exper-
imental pump with high injection speed that can be19coupled with an electronic timing adjuster.
5) Nozzles : HC emissions are reduced by reducing nozzle
sac volume. Interestingly, HC emission per cycle is about
20 percent of sac content. If the nozzle is inclined on
the engine head with respect to the cylinder center line,
sac reduction is greatly limited. Reduction of nozzle
holes, together with higher pressure adjustment and in-
jection pressure, reduce particulates."^
Prechamber and Swirl Chamber Engines
1) Injection Pressure : The effect of injection pressure on
emissions is relatively negligible, though it varies
according to the type of swirl chamber or prechamber.
2) Timing : Particulates are reduced by delaying timing,
which is not true with D.I. engines. Reduction of NOx
emission is to the order of about (5 percent) /degree,HC
decreases by the same amount down to 6° - 8° of timing
in respect to T.D.C. The trend then changes and values
increase markedly. Optimum timing at minimum HC must
thus be established. Timing adjustment must be made as a
function of load besides speed.
1
7
HC increases by 100 percent from 50 to 100 percent of load
on a 2.9771. swirl chamber engine at 2000 r.p.m.
3) Po s t - in j ect ion : Research on an engine of the type men-
tioned above has led to the conclusion that shortening
44
the nozzle throttle length by 50 percent (to decrease the
residual pressure and the peak pressure in the injection
pipe) and adopting a reverse flow damping valve for
damping the reflected pressure in the injection pipe
decreases pos t - inj ect ion from 90 to 6 percent, reduces
HC emission by 80 percent and CO by 40 percent.
4) Injection duratio n: The effects of injection duration on
HC and NO emissions are relatively scant. It can be-A.
said, however, that with a shorter injection time, injec-
tion delay can be chosen so as to obtain a minimum level
of NO before HC increases.A
5) Nozzl e : No real sac exists on pintle nozzles but noxious
volumes can be reduced in this case too by properly de-
signing the pintle shape. Volume reductions of 0.8 to
0.3 mm^ have shown as much as 30 percent and 40 percent
HC and CO emission reduction respectively. 17
Great importance should be attributed to the position of the
nozzle inside the swirl chamber. HC emission can in fact be
reduced 50 percent by moving the jet towards the swirl chamber
center. The jet should be towards the wall to obtain lower NO
i16
Xvalues
.
4.4 ELECTRONIC
Small and medium displacement engine injection adjustment
systems are currently based on centrifugal mass mechanical adjust-
ers. Injection timers are either mechanical (with in-line pumps)
or hydraulic (with rotating pumps).
The need to adjust timing more precisely to further reduce
emissions requires more sophisticated adjustment. Injection pump
manufacturers are producing adjustment systems based on electrical
or hydraulic actuators slaved to a logically present electronic
center. Such a type of adjustment system was designed by Fiat on
the DRF18
45
pump
.
4.5 EXHAUST GAS RECIRCULATION
Exhaust gas recirculation has so far been studied as a means
to reduce NO emissions, at the expense of a slight HC increase.X
EGR actually increases particulates, and leads to corrosion of the
first piston ring found in durability tests. It is thus important
to have an EGR system with extremely precise control.
An EGR system capable
well as partial control of21developed by Bosch. The
of precisely controlling air flow as
load, by the air/fuel ratio, has been
main components of the system are:
- mixture- control unit, consisting of air-flow sensor and
fuel-flow sensor.
- throttle valve with actuator for the control of the
recirculated exhaust gas.
- The air-flow sensor consists of an air funnel and an air-
flow sensor plate which can move within it and which is
mounted on a lever. A hydraulic plunger acts on this
lever so that the air-flow sensor plate is loaded with an
essentially constant force against the direction of the
flow of the air. The position of the air-flow sensor plate
is a measure of the rate of air flow. The fuel which is
fed to the engine passes through a slit throttle the section
of which can be altered by the displacement of a plunger.
A different pressure valve regulates the pressure drop at
this throttle to a constant value. With a constant pressure
drop - i.e., with a constant stroke of the diaphragm of
the differential pressure valve - the position of the
plunger is a measure of the rate of fuel flow. The throttle
valve is fitted at the end of the exhaust gas recirculation
pipe in the intake manifold of the engine. The position of
the throttle valve determines the quantity of exhaust gas
recirculated. The valve can both close the exhaust gas pipe
and reduce the section of the intake manifold. It is
hydraulically operated by an actuator. The actuator is
acted upon on the one side by a variable pressure, and on
the other side by a spring.
46

The individual components work together as follows: the
position of the throttle valve determines the air-exhaust gas
ratio of the cylinder charge. The throttle valve is regulated
by the mixture - contro 1 unit so that a set air-fuel ratio is
maintained. In the mixture- control unit the air-flow sensor and
the fuel-flow sensor are connected by means of a lever, so that
when the travel of the air-flow sensor plate in the air-flow
sensor increases, the cross-section of the variable slit throttle
of the fuel-flow sensor is increased. The air-flow sensor is now
tuned with the fuel-flow sensor so that, when the desired air-fuel
ratio is reached, there is a constant pressure drop at the slit
throttle for each chosen quantity of fuel. This tuning is
achieved by shaping the air funnel of the air-flow sensor. In
this condition the diaphragm in the differential pressure valve
of the fuel - flow sensor opens a certain cross-section, through
which a pump forces fuel which flows back to the fuel tank via a
restriction in the actuator. In this way a pressure p ?is set up
between the differential pressure valve and the restriction, which
balances the spring force at the actuator. The resulting position
of the throttle valve ensures that the quantity of fuel and the
quantity of air are in the desired ratio.
If, for example, the rate of fuel flow of the engine is
increased, then there is a greater pressure drop at the slit
throttle of the fuel-flow sensor. The diaphragm of the fuel-flow
sensor opens a larger cross-section. In this way the pressure at
the actuator is _ increased . The throttle valve is now opened until
the rate of air flow of the engine has again reached the level
assigned to the new quantity of fuel.
Another EGR system has been tested on a 3 liter 4 cylinder
Toyota engine. Relatively low emissions have been obtained, but
not within limits fixed. The following values have been obtained
by adding a catalytic exhaust muffler:
47

HCgm/mile
0.30
0.30
COgm/mile
N0Xgm/mile
0.75 0.50
0.95 0.75
Inertia weightlb
2250
3500
Toyota’s EGR system consists of varying the percentage of EGR
versus the vacuum created by an engine driven pump. A valve
adjusts passage of exhaust gases and maximum value is set by a
calibrated aperture on the manifold.
^
Volkswagen has carried out in-depth research work on emissions2 2
from diesel powered light vehicles. Their work is summarized
below.
Inertia Weight Eng ine HC CO NOx
1750 N. A. + EGR 0.45 2.5 0.4
2000 f ? 0.45 2.5 0.46
2250 n 0.40 2.5 0.47
4.6 ELECTRONIC CONTROL SYSTEM
Emission limits also require more precise and sophisticated
controls than currently available. There is an urgent need to
know all parameters involving emissions by means of electronic con-
trol which monitors injection pump adjustment, turbocharging, EGR,
etc. It is unknown whether prototype systems exist which can sat-
isfy the above requirements.
4.7 TURBOCHARGING
Turbocharging has been applied extensively in heavy duty
diesels to increase rated power. Turbocharging has recently been
considered for light duty vehicles to increase engine delivery
and vehicle fuel economy because of more favorable working condi-
tions .
Turbocharging does, however, pose some problems:
1) Duration, because of increased heat
2) High combustion chamber pressure
48

3) High levels of smoke at low r.p.m.
Several solutions have been studied, the main being:
1) Piston cooling : with oil under pressure to a cavity in
the inside face of the piston top.
2) Inter cooling : with a heat exchanger.
3) Waste gate : by reducing gas flow to the turbine at high
r.p.m. where excess air is produced, to ensure air flow
at low r.p.m. This requires exact adjustment of fuel
inj ection.
4) LDA : pump pressure adjustment versus the inlet manifold
air turbocharging pressure has been adopted on Bosch VE
pumps
.
Air pressure acts on a membrane attached to a cam which
varies pump delivery.
The results obtained on HC/CO/NO emissions from a VWx
14engine can be summarized as follows:
HPEnginetype
HCgm/mi
COgm/mi
N0Xgm/mi
50 NA 0.16 1.0 1.2
70 TC 0.11 0.8 0.9
Particular attention should be given to fuel economy. A14
gain of some 10 percent is in fact obtained with turbocharging.
The main advantage, however, is reduced particulates, the mechanism
of which is not yet well know.
Particulate reductions have been obtained by VW as follows:
HPEnginetype
Partic. Emissionsgm/mi
50 NA 0.35
70 TC 0.2
1
2
A 35 percent reduction has also been obtained on a 2.5 liter Fiat
engine. Particulate levels increase again from 0.35 to 0.45 g/mile
when E612 (turbocharged versus naturally aspirated) is used with
turbocharging
.
49/50


REFERENCES
1. French, C.C.J., "The Diesel is 'The' Engine for High Annual
Mileage Light Duty Vehicles," D.P. 77/943, Ricardo Consulting
Engineers, July 1977.
2. "Description of AVL ' s Background and Activities," AVL Graz/
Austria, June 17, 1977.
3. Obert, E.F., "Internal Combustion Engines and Air Pollution,"
In text Educational Publishers, p.584-585.
4. Meurer,J.S., "Evaluation of Reaction Kinetics Eliminates
Diesel Knock - The M-Combustion System of MAN," SAE Trans-
actions, Volume 64, 1956, pp 250-272.
5. Taylor, C.F., "The Internal Combustion Engine in Theory and
Practice," Volume 2, pp. 521-523.
6. Middlemiss, I.D., Characteristics of the Perkins 'Squish Lip'
Direct Injection Combustion System," SAE paper, No. 780113.
7. Hardenberg, H. ,Frankie, G. "Investigations on the Reduction
in the Cetane Requirement of Direct Injection Diesel Engines
With Particular Reference to Output, Multi-Fuel Ability and
Environmental Protection," 10th International Congress on
Combustion Engines.
8. Grundy, J.R., Kiley, L.R., and Brerick, E.A., "AVCR 1360-2
High Specific Output -Variable Compression Ratio Diesel
Engine," SAE paper, No. 760051.
9. Kamo, R. and Bryzik, W. "Adiabatic Turbocompound Engine Per-
formance Prediction," SAE paper, No. 780068.
10. Hersey, "Theory of Lubrication," Wiley NY, 1938.
11. Norton, "Lubrication," McGraw-Hill NY, 1942.
51

REFERENCES (continued)
12. Contract No. DOT-TSC 1424, "Data Base for Light-Weight Auto
motive Diesel Power plant," FIAT S.P.A. (November, 1977-
Sept ember ,1979).
13. DOT, DOE and EPA, "Unregulated Diesel Emissions and Their
Potential Health Effects," Washington DC, April 27-28, 1978
14. Contract No. DOT-TSC 1193, "Data Base for Light-Weight
Automotive Diesel Power Plant," Volkswagenwerk AG (June,
1976 - February, 1978).
15. Barth, D.S. and Blacker, S.M., "EPA's Program to Assess the
Public Health Significance of Diesel Emissions", Speech
presented to the Air Pollution Control Association, Houston
TX, June 28, 1978.
16. Amano,
M.,Sami, H., Nakagawa, S., and Yioshizaki, H.,
"Approaches to Low Emission Levels for Light-Duty Diesel
Vehicles," SAE paper 760211.
17. Bosch, "Many Works Carried Out on D.I. and I.D.I. Diesel
Engines," 1977.
18. Grigg, H.C., "The Role of Fuel Injection Equipment in
Reducing Four-Stroke Diesel Engine Emissions," SAE paper
760126.
19. Zimmermann, K.D., "New Robert Bosch Developments for Diesel
Fuel Injection," SAE paper 760127
20. Montanari, V., Antonucci, A., Rivolo, P.F., and Lombardi, C
"A New Diesel Injection Pump with High Injection Rate,
Its Influence on Smoke and Emissions," SAE paper 780774.
21. Stumpp, G. and Banzhaf, F.W., "An Exhaust Gas Recirculation
System for Diesel Engines," SAE paper 780222.
52

"0 H ZEa o *1 mH>- C* CD
CD vD )
—* —C/> D I—* 00CD n- 0) C2 •
i—, i_i. • X on0) H
CD i—* H co •
Z3 IT 2> >ifi _rv. 1 L.-\

*r-
2 o
S =» D« >
5 2•* *
MSs
Si
I 3>
sic »
5 8
15o ;c *fn V>
£ ix
> Z
w a
g F> (/)
» •
O O* mz >o aers
amO>
2m
3 O* ""© _l© 2» *> >2 Z0) V)
> *0
o o53Z >Cfl Ha 5> zoz
T T> Ca «r
5 £z **
-< >0 *<x O•4 Xi
a «"
> £z rr a3 51 5
—I
5z


DOT LIBRARY
Related Documents