ce-center.be CIRCULAR ECONOMY POLICY RESEARCH CENTER CE CENTER OVAM WE MAKE TOMORROW BEAUTIFUL DEPARTMENT OF ECONOMY SCIENCE & INNOVATION Circular economy and the energy transition – potential of a Flemish circularity hub for EV Li-ion batteries PUB. N° 17

Welcome message from author
This document is posted to help you gain knowledge. Please leave a comment to let me know what you think about it! Share it to your friends and learn new things together.
Transcript

ce-center.be
CIRCULAR ECONOMYPOLICY RESEARCHCENTER
CE CENTER
OVAMWE MAKE
TOMORROWB E AUT I FUL
DEPARTMENT OFECONOMYSCIENCE &INNOVATION
Circular economy and the energy transition – potential of a Flemish circularity hub for EV Li-ion batteries
PUB. N°
17

CIRCULAR ECONOMYPOLICY RESEARCHCENTER
CE CENTER
PUB. N°
17
Contact information:
Luc Alaertsmanager Policy Research Center [email protected] +32 16 324 969
Karel Van Ackerpromoter Policy Research Center [email protected] +32 16 321 271
Circular economy and the energy transition – potential of a Flemish circularity hub for EV Li-ion batteries
Jeroen GillabelYoko DamsIve Vanderreydt
VITOBoeretang 200, 2400 Mol, Belgium
September 2021
CE Center publication N° 17
!

2
Abstract ENGLISH This short-term assignment aims to illustrate the insights that policy makers can obtain from applying a “strategic stock management” perspective to the problem of assessing the potential of circular strategies to address the challenge of critical raw materials risks and impacts at regional macro-economic level. The future economic and environmental potential of a Flemish Circularity Hub for li-ion batteries from electric vehicles is explored as a case study with high policy relevance. First, a qualitative analysis of the value chains of electric vehicles (EV) and stationary energy storage (SES) li-ion batteries (LIB) shows the limited role of Flanders in the supply chain of these products at present, with some notable exceptions in the battery material production and EV LIB assembly activities. Here, Flemish industrial activity takes up key roles in the further development of circular EV LIB value chains. The main strategic strength for Flanders, however, lies in the collection, dismantling, remanufacturing and recycling parts of the value chain. However, the Flemish value chain is firmly embedded in a broader European and even global context. For this reason, building on this strength requires the creation of the right conditions for companies to choose to invest in materials production and recycling in Flanders instead of in other European regions. These conditions are linked to the further evolution of battery legislation, innovation support for remanufacturing and recycling, and the positioning of EV Original Equipment Manufacturers (OEMs) in terms of control over EV batteries after their first life. Making use of quantitative future scenario analysis, different possible future developments for the supply of EV LIB towards remanufacturing or recycling as well as for demand for stationary energy storage in Flanders are explored. The results of this first scenario analysis indicate that the differences in the rate of growth of the EV market and SES market will be crucial to determine the potential for EV LIB remanufacturing in Flanders. If the SES market demand booms too soon, the more slowly developing inflow of EV LIB for remanufacturing will lead to the SES market being saturated with virgin SES LIB. These LIB need to be imported and create relatively low local added value. However, if this is how the future develops, then a focus on stimulating recycling activities for EV (and SES) LIB in Flanders will be the best way to keep as much of the material value embedded in Flemish LIB stocks in the local economy. In a second step, two Circularity Hub scenarios are developed: one in which EV LIB are recycled, and another one in which EV LIB are remanufactured to satisfy SES demand. These scenarios are applied to the potential future in which the SES market does not develop too fast in Flanders, and EV LIB supplies grow at a fast pace. The analysis shows that in such a future, developing local remanufacturing capacity for EV LIB would bring clear economic and environmental benefits. Economically, remanufacturing creates local added value whereas virgin SES LIB are produced elsewhere. Also, remanufactured EV LIB have a much higher value than the residual material value in LIB going to recycling. While remanufacturing would delay the inflow of EV LIB to recycling in time, the material composition of remanufactured EV LIB

3
would be more beneficial for the recycling business case than that of virgin SES LIB. Furthermore, a Remanufacturing Hub has significant potential to create net environmental benefits compared to recycling alone, due to the avoided production of virgin SES LIB. Finally, the report reflects on the limitations of the static approach of the analysis used and makes the case for adopting strategic monitoring capability for (selected) product and material stock developments in Flanders. Such capability consists of (semi-)continuous data gathering, consistent and robust stock-flow modeling and trend analysis, and policy supportive reporting. Especially in the context of circular economy, in which continuously evolving customer demands need to be met based on equally continuously evolving resource supplies from stocks built in the past, strategic resource monitoring would provide much stronger policy support than isolated, one-off static analyses.
4
NEDERLANDS Deze korte-termijn-opdracht illustreert de inzichten die beleidsmakers kunnen verwerven door het toepassen van een "strategisch voorraadbeheer"-perspectief op het beoordelen van het potentieel van circulaire strategieën in het beheersen van kritieke grondstoffenrisico's en -impacts op regionaal macro-economisch niveau. Het toekomstige economische en milieu-potentieel van een Vlaamse Circularity Hub voor lithium-ionbatterijen (LIB) uit elektrische voertuigen (EV) werd aan de hand van deze methodiek onderzocht als een case study met hoge beleidsrelevantie. In een eerste kwalitatieve analyse van de huidige waardeketens van LIB voor EV en stationaire energie-opslag (SES) wordt aangetoond dat de rol van Vlaanderen in de toeleveringsketen van deze producten op dit moment beperkt is, met enkele opmerkelijke uitzonderingen in de batterijmateriaalproductie en EV LIB assemblageactiviteiten. Hier neemt de Vlaamse industriële activiteit een sleutelpositie in bij de verdere ontwikkeling van circulaire EV LIB waardeketens. De belangrijkste strategische sterkte voor Vlaanderen ligt echter in de stappen van de waardeketen na de gebruiksfase: inzameling, ontmanteling, remanufacturing en recyclage. Omdat de Vlaamse waardeketen stevig is ingebed in een bredere Europese en zelfs mondiale context, zal deze strategische sterkte enkel benut kunnen worden indien de juiste voorwaarden worden gecreëerd voor bedrijven om te kiezen voor investeringen in materiaalproductie en recyclage in Vlaanderen in plaats van in andere Europese regio's. Deze voorwaarden relateren eveneens aan de verdere evolutie van de batterijwetgeving, innovatiesteun voor remanufacturing en recyclage, en de positionering die fabrikanten van EV zullen innemen ten opzichte van het eigenaarschap van EV-batterijen op het einde van hun eerste leven. Aan de hand van een kwantitatieve toekomstscenario-analyse worden verschillende mogelijke toekomstige ontwikkelingen onderzocht voor het aanbod van EV LIB in de richting van remanufacturing of recyclage, alsook voor de vraag naar stationaire energieopslag in Vlaanderen. De resultaten van een eerste scenario-analyse geven aan dat de verschillen in het groeitempo van de EV-markt en de SES-markt cruciaal zullen zijn om het potentieel voor EV LIB-remanufacturing in Vlaanderen te bepalen. Als de marktvraag voor SES te snel stijgt, zal een trager op gang komende instroom van EV LIB voor remanufacturing ertoe leiden dat de SES-markt verzadigd raakt met SES LIB van primaire materialen. Deze LIB moeten worden ingevoerd en creëren een relatief lage lokale toegevoegde waarde. Als de toekomst zich zo zou ontwikkelen, is een focus op het stimuleren van recyclageactiviteiten voor EV (en SES) LIB in Vlaanderen de beste manier om zoveel mogelijk van de materiaalwaarde die in Vlaamse LIB-voorraden besloten ligt, in de lokale economie te houden. In een tweede stap worden twee Circularity Hub scenario's ontwikkeld: één waarin EV LIB worden gerecycleerd, en één waarin EV LIB worden geremanufactured om aan de SES vraag te voldoen. Deze scenario's werden losgelaten op een mogelijke toekomst waarin de SES markt zich niet (te) snel ontwikkelt in Vlaanderen, en het aanbod van EV LIB wel snel toeneemt. De analyse toont aan dat in een dergelijke toekomst de ontwikkeling van lokale remanufacturing-capaciteit voor EV LIB duidelijke economische en milieuvoordelen zou opleveren. Economisch gezien creëert remanufacturing lokale toegevoegde waarde, terwijl EV LIB uit primaire materialen elders worden geproduceerd. Geremanufacturede EV LIB hebben ook een veel hogere intrinsieke waarde vergeleken met de restmateriaalwaarde bij recyclage van deze LIB.

5
Hoewel door remanufacturing de instroom van EV LIB naar recyclage in de tijd zou worden uitgesteld, is de materiaalsamenstelling van geremanufacturede EV LIB economisch gunstiger voor de recyclage business case dan die van nieuwe SES LIB. Bovendien heeft een remanufacturing hub een aanzienlijk potentieel om netto milieuvoordelen te creëren in vergelijking met recyclage alleen, door de vermeden productie van SES LIB uit primaire materialen. Tot slot wordt in het rapport stilgestaan bij de beperkingen van de statische benadering van de gebruikte analyse en wordt gepleit voor de invoering van een strategische monitoringcapaciteit voor (geselecteerde) product- en materiaalvoorraadontwikkelingen in Vlaanderen. Een dergelijke aanpak zou in het ideale geval moeten bestaan uit (semi-)continue dataverzameling, consistente en robuuste stock-flow modellering en trendanalyse, en beleidsondersteunende rapportering. Vooral in de context van de circulaire economie, waarin aan de voortdurend evoluerende vraag van de klant moet worden voldaan op basis van een even voortdurend evoluerende bevoorrading met hulpbronnen uit in het verleden aangelegde voorraden, zou strategische monitoring van hulpbronnen een veel sterkere beleidsondersteuning bieden dan geïsoleerde, eenmalige statische analyses.

6
Table of contents
Abstract .........................................................................................................................................2
Table of contents ...........................................................................................................................6
Introduction ...................................................................................................................................7
Context ......................................................................................................................................7
Goal and scope of this case study .......................................................................................... 10
Flemish Li-ion battery value chain.............................................................................................. 15
Introduction ............................................................................................................................ 15
Critical raw material mining and LIB material production ..................................................... 16
LIB production ........................................................................................................................ 20
Production and import of EV .................................................................................................. 22
Production and import of SES LIB........................................................................................... 26
End-of-life collection of LIB .................................................................................................... 28
Recycling and remanufacturing .............................................................................................. 30
Conclusions ............................................................................................................................. 32
Circularity Hub for EV LIB in Flanders – scenario analysis.......................................................... 34
Scope and approach ............................................................................................................... 34
Supply of EV LIB versus demand of SES.................................................................................. 35
Circularity Hub scenarios ........................................................................................................ 43
Conclusions ................................................................................................................................. 51
Annex – Methodology ................................................................................................................ 53
SES demand scenarios ............................................................................................................ 53
SES market product value ...................................................................................................... 54
LIB material value ................................................................................................................... 55
References .................................................................................................................................. 59

7
Introduction
Context Recently, there has been extensive attention for the implications of the energy transition on the demand for materials in general, and critical raw materials in particular. Earlier this year, the International Energy Agency published a report on the role of critical minerals in the energy transition, concluding that the economy of the future will shift from being oil-dependent to being materials-dependent (Figure 1). In 2020, The European Commission published a foresight report with demand projections for critical raw materials needed in several strategic technology sectors, including renewable energy technologies. The report showed that demand for all critical raw materials is projected to increase several orders of magnitude and highlighted the supply chain risks Europe faces for meeting this demand (Figure 2).
Figure 1 Renewable energy technologies require more and a wider diversity of materials than fossil energy
technologies.(Source [1])

8
Figure 2 Use of raw materials in different technologies and sectors, and the supply risks for the European Union. (Source [2])
To tackle these geostrategic challenges, the response from European policy makers and industry largely centers around two pillars: securing supply of virgin critical raw materials through stimulation of new or renewed mining activities, and stimulating recovery of secondary critical raw materials through recycling [3], [4]. The use of technologies such as wind power, solar power, battery energy storage and electric mobility is increasing in Belgium and Flanders as well and will continue to do so under the impetus of climate and environmental policies. Critical material needs have also been calculated for the Belgian and Flemish energy transition [5], [6]. The overall conclusion from these reports is that critical material demands will increase significantly, with ranges determined by the adoption rate of renewable technologies as well as by technology evolutions. To illustrate this, Figure 3 shows the increasing demand for Neodymium, a rare earth metal used in permanent magnets, under three different renewable energy adoption scenarios [5]. With Flanders lacking its own virgin resource reserves and having little strategic influence on the use of critical raw materials in the technologies it will need for the energy transition, the question arises how Flanders should position itself in the European and global critical raw materials policy and industry scene. How can Flanders decrease its resource and environmental pressure created by the shift to a materials-intensive renewable energy future? And can this be achieved together with the creation of economic value by creating local industrial added value? A logical response would be to use the historically strong position in waste management and recycling to create economic and environmental value from the material stocks that will be built up in Flanders because of the energy transition. The increasing material stocks can be regarded as the “mines” of the future, a perspective that is already being applied by local policy makers

9
and the waste collection and recycling industry. Moreover, the potential value to be captured is not limited to the value of materials alone but can be found in products as well. In a circular economy, activities like reuse, repair or remanufacturing can decrease the need for virgin raw materials by extending the lifetime of the products that contain these materials, while creating local economic value. In general, developing local “circularity hubs” that use products and materials previously built up in the economy as inputs to create local economic value, could be a smart way to differentiate Flanders in the global critical raw materials context, and decrease environmental pressures simultaneously. Such circularity hubs operate within a framework of ‘stock management’, rather than resource demand and waste generation.
Figure 3 Demand evolution for Neodymium in the Belgian energy market, for three scenarios with different renewable energy uptake assumptions. The upper range is without recycling, the lower range takes into account estimated recycling rates. (Source[5])
Although the general strategic orientation for Flanders in the European or global critical raw materials context seems logic, the question remains how large the potential for specific sectors, product categories or materials could be. To assess the economic and environmental potential of such circularity hubs, it is key to create insights into the composition and growth rate of product and material stocks that can serve as input for circular activities, together with insights in the evolution of the demand for the resulting outputs. Stock-flow modeling and scenario analysis are useful tools in this context. Stock-flow modeling, taking into account information about product sales, the average residence time of products, and fate of products after use, enables to estimate the potential supply of products (and their materials) for recycling, or remanufacturing. As we live in a rapidly evolving world (both technological and societal), the parameters needed in stock-flow models include considerable uncertainty. Scenario analysis can help dealing with this uncertainty. Possible futures can be ‘designed’ by selecting different parameter values along uncertainty ranges (e.g. low adoption rate versus high adoption rate, change in use of a specific material in a technology, etc.). The resulting model outputs using different parameter choices then represent the likely results for different potential futures (e.g.

10
a high build-up of product stocks combined with a low demand for outputs of the circular industrial activities making use of these stocks). Policy makers can use the outcomes of such analysis to design policies in such a way that the intended goals are maximally realized irrespective of how the world evolves. Industry actors can become more resilient by using such results to prepare strategic innovation and investment strategies fit for different futures.
Goal and scope of this case study This short-term assignment aims to illustrate the insights that can be gained from applying a “strategic stock management” perspective to the problem of assessing the potential of circular strategies to address the challenge of critical raw materials risks and impacts at regional macro-economic level. To achieve this aim, Li-ion batteries (LIB) in electric vehicles (EV) and stationary energy storage (SES) is selected as the focus product for our case study, for the following reasons.
LIB contain several critical raw materials Currently, different types of LIB are used in EV, with differences mainly due to the choice of materials used in the cathode (see Figure 4). All battery types contain lithium and graphite, two materials marked as critical by the European Commission. Several chemistries use the critical raw material cobalt as a material for the cathode. Moreover, two key industrial metals are present in LIB as well: nickel, which is used in the cathode of different battery chemistries, as well as copper which is used as current collector in all battery types. It is worth noting that batteries used for stationary energy storage commonly are of the LFP type, containing less economically valuable materials compared to the other chemistries. As can be seen in Figure 5, the LIB supply chain is dominated by China, with only limited presence of European players in the cathode and anode (material) production, underpinning the ‘criticality’ of materials needed for LIB production.

11
Figure 4 Indicative battery composition for some of the main chemistries used in electric vehicles. (Source [7])
Figure 5 Overview of supply risks, bottlenecks and key players along the LIB supply chain. (Source [2])

12
The demand for EV and SES LIB in Flanders will drastically increase in the future While the market share of EV (plug-in or fully electric) is still limited in Belgium, a sharp increase can be seen in EV sales since 2020 (Figure 6). With the current policy goals to stimulate electrification of the mobility system, these growth rates are expected to remain high for the coming years. While Stationary Energy Storage (SES) was until recently dominated by lead-acid batteries, LIB is rapidly taking over as the dominant technology. With policy stimuli for residential battery storage for PV owners, and large-scale storage being needed for grid stability, demand for SES LIB will increase drastically in the coming decade.
Figure 6 Evolution of vehicle sales in Belgium, for different types of engine technology. Source: FEBIAC

13
LIB from EV have potential to be valorized by several circular strategies A first circular strategy for LIB is recycling, in which several metals are recovered and can re-enter the battery value chain. Different technologies exist today to recycle LIB, with different metal recovery yields. However, LIB today is mainly limited to portable LIB from electronics as well as EV LIB production scrap, mainly because of a lack of sizeable inflow of end-of-life EV. Additionally, while in principle all materials contained in a battery can be recycled from a technological perspective, several materials are not economically attractive to recycle because of too low market prices. This is currently the case for lithium, for example. With increasing recycling targets in European waste regulations (a new Battery Regulation is currently being negotiated at EU level), the case for LIB recycling will become stronger in the near future. However, EV LIB remanufacturing presents an additional circular strategy with considerable potential. End-of-life EV LIB usually still have enough capacity left to serve as SES (Figure 7). If EV LIB can be dismantled and integrated in a battery system for stationary storage, they can be repurposed for the SES market. In principle, EV LIB could also be reused in EV after remanufacturing, but at present the automotive industry has not yet built enough know-how and scale to make this operation economically interesting compared to integrating new EV LIB.
Figure 7 Indicative battery capacity left for EV LIB at different battery ages. (Source: [8])
Based on this preliminary analysis, EV LIB and SES LIB value chains together with remanufacturing and recycling as basis for a circularity hub, were selected as a case study to apply strategic stock management as a tool to explore the economic and environmental potential of using circular strategies to address critical raw materials challenges in Flanders. The central research question for this report is: Which role can Flanders play in the “strategic stock management” of EV and SES LIB, both at product and material level? To answer this question, the report:
explores the Flemish value chain today, and its position in a European context (chapter 2),

14
calculates scenarios for the buildup of EV LIB stock, and demand for SES storage in Flanders (chapter 3),
explores the economic and environmental potential of recycling and remanufacturing of EV and SES LIB in Flanders, for one of the supply/demand scenarios (chapter 3),
draws conclusions on the opportunities and barriers for a Flemish Circularity Hub for EV LIB, and on the use of stock-flow modeling and scenario analysis as a tool to support circular economy policy and innovation decision making (Conclusions chapter).

15
Flemish Li-ion battery value chain Introduction In this chapter, we provide a brief overview of the EV and SES LIB value chain from a Flemish perspective. What are the main stages, from raw material mining to end-of-life recycling? How are Flemish actors involved in the different stages? Which actors control the flow and fate of the products and materials? And which drivers are influencing the evolution of the value chain? The purpose of this chapter is not to provide an exhaustive and detailed account of each stage of the value chain, but to highlight the role of Flanders and Flemish actors in this value chain. A simplified, visual overview of the LIB value chain is shown in
Figure 8. The value chain starts with the mining of critical (and other) raw materials needed in the production of LIB. In the remainder of the report, we will limit the focus on the following materials: cobalt, lithium, nickel, copper, and graphite. These represent the critical raw materials present in LIB (cobalt, lithium, graphite), as well as two economically important industrial metals (copper, nickel). In a next step, the raw materials are processed into materials and components for LIB, such as cathode and anode materials, electrolyte, casing, etc. After that, LIB are manufactured by producing individual battery cells, putting them together into modules, and then integrating those modules into battery packs. Here, the value chain splits, as LIB modules can be integrated into battery packs specifically designed for EV, or into battery packs designed for stationary energy storage. EV LIB are integrated into EV during EV manufacturing, and then sold on the market. SES LIB are sold as battery units and installed on the premises of the customer. After the use phase, EV LIB are dismantled from the vehicles, while SES LIB are taken back by waste collectors. Both actions are regulated by EU waste legislation. After collection and dismantling, LIB are sent to recycling facilities, where several materials are recovered and injected into the supply chain of LIB material production (or other supply chains) again. Today, several materials are still lost during recycling (e.g. graphite or electrolyte materials), while others are downcycled into slags that are used for construction works. For EV LIB, another possible pathway after collection is to remanufacture them into SES LIB, after which they enter the SES value chain as an alternative to ‘virgin’ SES LIB. Today, this is not (yet) happing at industrial scale.

16
Figure 8 Overview of the LIB value chain. Stages in yellow are stages before the use phase, while stages in green are after the use phase. Arrows indicate flows of materials and products. EV: electric vehicle; LIB: Li-ion battery; SES: stationary energy storage; CRM: critical raw materials.
Critical raw material mining and LIB material production
Cobalt Cobalt is a key critical raw material in the LIB value chain. The main reason cobalt is considered of strategic “criticality”, can be seen in Figure 9. Nearly all cobalt is mined in the Democratic Republic of Congo (DRC). Within Europe, Finland is the only country with (very limited) cobalt mining, connected to nickel mining. Finland is also the major supplier to the EU of refined cobalt, the form of cobalt that is used in downstream industries (Figure 9, left panel). Besides the strong geographical concentration of cobalt mining, the negative social impacts of mining activities in the DRC (artisanal mining operations characterized by child labor and bad labor conditions) provide another argument to consider cobalt as a critical raw material. The “criticality” of cobalt is reflected in its market price, which has experienced a high peak in 2018 due to concerns in the market about the predicted global surge in LIB manufacturing and shortfalls in cobalt supplies (Figure 10). Most cobalt is produced as a byproduct of nickel or copper mining, which makes it difficult for cobalt production to be adjusted to cobalt market demand. With Umicore, Flanders has a world leader in cobalt refining. This is reflected in the fact that Belgium appears in the top 5 global exporting countries of cobalt ore and concentrates, and it also accounts for 7% of the supply to the EU of refined cobalt (Figure 9). This is due to the cobalt refining activities of Umicore, in which cobalt ores imported from the DRC are further refined. The refined cobalt produced by Umicore is used in a variety of markets [9], but a prominent focus of the cobalt refining activities of the company is geared towards in-house production of LIB cathode materials [10].

17
Figure 9 Source countries of refined cobalt imports to the EU (left), and top 5 global exporting countries of cobalt ore and concentrate (right). (Source: [11])
Figure 10 Cobalt market price volatility during the past years. (Source: [11])
18
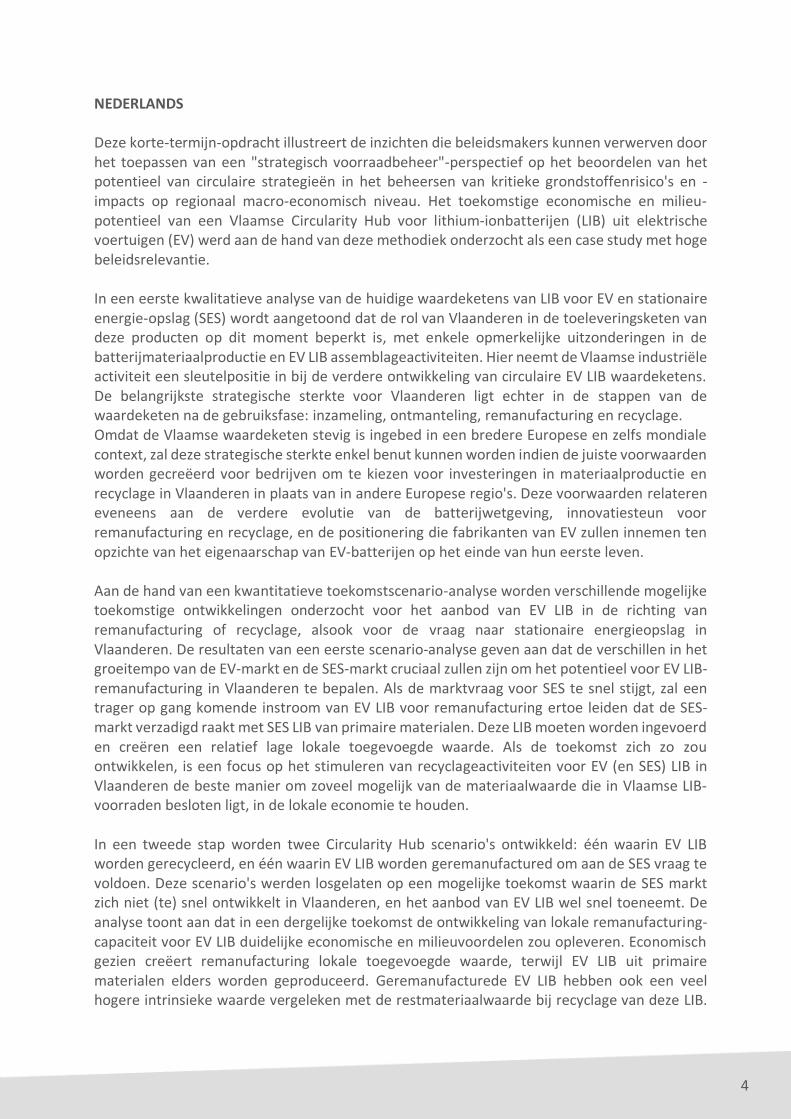
Lithium As the name suggests, lithium is a core material used in Lithium-ion batteries. But lithium has many different other end uses as well: in glass and ceramics, lubricants, polymers, plastics production or pharmaceutical products. In recent years, rechargeable batteries have become the main end use for lithium at a global level (Figure 11, left panel). In Europe, however, batteries only account for 1% of total lithium consumption (Figure 11, right panel). Although the data available in the CRM factsheets is somewhat outdated, this reflects the lack of European LIB production.
Figure 11 Global end uses of lithium in 2015 (left panel), and EU end uses of lithium in 2012 (right panel). (Source: [11])
Lithium mining is largely concentrated in Chile and Australia. EU sourcing of lithium concentrates is mainly from Australia (89%), with the remainder being sourced in Portugal [11]. Three quarters of the EU sourcing of refined lithium is provided by Chile. Like cobalt, lithium is a critical raw material for the EU due to the high import dependency, as well as due to high global consumption resulting in price volatility. Lithium prices peaked in 2018, but increased mining capacities and a lower growth of the Chinese EV market has released prices pressures again in the years after. However, lithium prices are expected to keep on increasing due to the global and European growth in LIB manufacturing capacity in coming years. Belgium has no relevant role in lithium production or processing, but apparently serves as a major player in global trade of refined lithium compounds and lithium batteries [11].

19
Figure 12 Lithium carbonate and lithium hydroxide monthly price trend. (Source: [11])
Other raw materials and battery materials production Next to the previous key critical raw materials, natural graphite is a third LIB material on the list of critical raw materials of the European Commission. Natural graphite is used in the anode of LIB, and is mainly supplied by China [11]. No relevant natural graphite processing activities could be identified in Belgium. Copper and nickel are two industrial metals with relevance for LIB production. The Belgian metallurgy sector has considerable activities in processing of these metals, but without focus on the LIB value chain. The relevance of Flanders in the production of LIB materials and components (cathodes, anodes) is, just like for Europe in general, very limited. There is one exception, however, as Umicore not only produces refined cobalt as a raw material, but also focuses on production of cobalt-containing cathode materials. The company invests heavily in research and development and innovation in rechargeable battery materials [12].

20
LIB production Production of Li-ion batteries starts with manufacturing of individual battery cells, which are then packed into modules and battery packs depending on the application specifications (portable use, stationary energy storage, mobility). Until recently, no LIB cell production capacity was available in Europe, with most LIB cell producers being concentrated in Asia (Figure 13). However, the global balance is shifting rapidly as several companies have started or announced LIB cell production, with total announced production capacities in the EU expected to exceed demand in coming years (Figure 14). While LIB cell production will be developed in several neighboring countries like France or Germany, no factories are planned in Belgium (Figure 16).
Figure 13 Global LIB market players in 2015. (Source: [13])
Currently, it is not possible to obtain a clear view on the amount of LIB cells, modules or packs being imported or exported to/from Flanders. Trade statistics contain one code for ‘Li-ion accumulators’ (CN 8507600), which is a general term for rechargeable batteries using Li-ion chemistries, including all applications. Considering the very high numbers of Li-ion accumulators imported to Flanders (Figure 15), these data most likely reflect the LIB used for a wide spectrum of portable devices (smartphones, laptops, gardening equipment, e-bikes, but also replaceable batteries for any small appliance). Nevertheless, the rise in import over the past five years clearly indicates an increasing dependence of import from outside Europe for LIB in general. Export of LIB has increased as well, mainly to other EU countries.

21
Figure 14 LIB cell supply and demand prognosis in Europe. (Source: [14])
Figure 15 Import and export of new LIB in Flanders (CN8507600). ROW: rest of the world. (Source: stat.nbb.be)

22
Figure 16 Overview of planned battery production factories in Europe. (Source: [14])
Production and import of EV Integration of LIB in electric vehicles is a brand- and even model-specific operation. Different original equipment manufacturers (OEMs) not only make use of different LIB cell chemistries, they also employ different design strategies towards the specific lay-out of the battery modules and packs integrated in the vehicle. These strategies are linked to the degree of control each OEM has over battery cell, module and pack design. Some OEMs completely outsource LIB manufacturing, while others choose for a fully in-house operation (Figure 17). The result of this varied landscape is a high variability in the types and forms of EV LIB eventually entering the market. The coming years, the landscape will rapidly evolve depending on the OEM strategic positioning related to electrification, and cooperation with cell producers.

23
Because EV LIB are components that are integral to the car design, and not just plug-and-play parts, the final EV LIB pack manufacturing is usually located at or near the EV factory.
Figure 17 Different strategies towards LIB manufacturing of EV manufacturers. (Source: [13])
Belgian assembly of passenger EV in 2020 amounted to 48799 full EV, 36918 plug-in hybrid, and 24244 hybrid cars [15]. This represented 46% of total Belgian passenger car assembly, indicating the importance of EV production in the automotive sector in Belgium. In Flanders, there is only one car manufacturing site left (Volvo Cars in Ghent), but this site is being transformed to a key EV manufacturing plant, including a battery pack assembly line [16]. As part of Volvo Car’s global partnership with CATL and LG Chem, the LIB cells will be sourced from Chinese resp. South-Korean LIB cell manufacturers. In 2020, a total of 62134 electric vehicles were put on the market in Belgium [17], consisting of 15102 fully electric cars, 35813 plug-in hybrid cars and 11219 hybrid cars. Comparing the sales data for new passenger cars with import/export data indicates that a large amount of trade is occurring. Import and export of electric vehicles is shown in Figure 18. Overall, imports are increasing, and roughly equally divided over EU, other European countries (non-EU) and other continents (ROW). Exports are in the same order of magnitude, but mainly to other EU countries. Figures Figure 19Figure 20Figure 21 show import/export data for the fully electric, hybrid and plug-in hybrid vehicles separately, showing that the EV market is still dominated by ‘classic’ hybrid vehicles, but 2020 showed a sharp increase in plug-in hybrid and fully electric vehicle trade.

24
Figure 18 Import and export of new EV in Flanders (total of hybrid, plug-in hybrid, and full battery electric vehicles). ROW: rest of the world. (Source: stat.nbb.be)
Figure 19 Import and export of new full battery electric vehicles in Flanders ROW: rest of the world. (Source: stat.nbb.be)

25
Figure 20 Import and export of new hybrid electric vehicles in Flanders ROW: rest of the world. (Source: stat.nbb.be)
Figure 21 Import and export of plug-in hybrid electric vehicles in Flanders ROW: rest of the world. (Source: stat.nbb.be)

26
Production and import of SES LIB The use cases for LIB in stationary energy storage (SES) are plentiful (Figure 22). In this report, the focus is on the renewable energy transition. Here, SES can play a role to increase self-consumption of solar energy at household, community or industrial level, by storing power generated during the day for use at night. At grid level, SES provides balancing capacity to match energy demand with fluctuating energy production. SES for increasing self-consumption is still in its infancy in Flanders. At the end of 2020, only 337 residential SES batteries had been notified with Fluvius, the grid operator, for a capacity of 1.3 MWh on a total of 23.6 MWh total battery capacity (including larger, non-residential installations) [18]. Assuming 1 kWh of battery storage capacity per kW solar power capacity, this means that 0.08% of the Flemish residential solar power capacity was connected to local battery storage in 2020. At the same time, 143 new subsidy requests had been received in 2020, representing an additional capacity of 1.3 MWh, covering 0.22% of new solar power installations in 2020. The arrival of the digital energy meter, and subsidies for residential SES for owners of solar power installations (Table 1) seem to have initiated a possible breakthrough in the residential SES market. However, currently the market for solar power seems to be slowing down due to negative perceptions of the business case for solar power because of the end of net-metering for new solar power installations.
Figure 22 Overview of potential battery use cases. (Source: [7])

27
Table 1 Current subsidies for installation of residential stationary energy storage connected to a solar power installation. (Source: [19]
Just as for LIB cells, no relevant manufacturing capacities exist in Flanders for SES LIB packs. Table 2 provides a non-exhaustive list of installers of residential SES LIB active in Flanders, based on a Google search in May 2021. Most installers are either solar panel contractors or energy service providers. A wide variety of SES LIB brands is offered, with most of the offerings consisting of the LFP battery chemistry (Table 3). iLumen and Belivert have their own brand of SES LIB, which means they probably buy LIB battery modules and integrate those with their own battery management system and packaging. Publicly available market prices are in the range of 637 to 1000 €/kWh but are difficult to compare as some offerings include the inverter, while others don’t. Table 2 SES LIB installation companies serving the Flemish residential SES market.
Company Type Battery brand €/kWh
IZEN solar panel contractor Pylontech 757,7
Engie energy service provider LG; Solax 637,9
Solarpro solar panel contractor LG; Huawei; SolarEdge; Enphase 1000,0
Solar batteries solar panel contractor Solax 844,8
iLumen solar panel contractor iLubat
Telcom solar panel contractor LG; Alpha ESS; Solax, BYD
Planet-eco solar panel contractor LG
Belivert solar panel contractor BYD; LG; Pylontech; Belistorage
WOPA energy service provider LG; BYD; Huawei
Belgian Solar solar panel contractor wide range of brands
Soloya solar panel contractor BYD; Huawei; LG
Q-home smart home installations BYD; LG
Luminus energy service provider Huawei

28
Table 3 SES LIB manufacturers supplying the Flemish residential SES market.
Manufacturer Countries Battery type
Pylontech China LFP
iLubat Belgium LFP
LG Chem RESU South-Korea NMC
Solax Triple Power China LFP
BYD battery box China LFP
Belistorage Belgium LFP
Sonnen ECO Germany LFP
Tesla Powerwall USA NMC
Panasonic Japan
Huawei China LFP
In 2020, the known grid-scale SES LIB capacity was 76.45 MWh, divided over 5 installations (Table 4). One of these installations was built from remanufactured EV LIB: Umicore cooperated with Engie to set up a 1.2 MW battery system making use of 48 Renault Kangoo EV LIB [20]. Table 4 Overview of grid-scale LIB energy storage systems in Flanders. (Source: [21])
City Facility Name Facility Status
Date of com-missioning
Operator Power Capacity
(MW)
Energy Capacity (MWh)
Drogenbos Drogenbos Operational 2017 Engie 7 20
Olen Olen Umicore BAT
Operational 08/10/2019 Engie 1,2 0,75
Puurs Peleman Industries
Operational 2018 Eneco 2 2
Ruien Ruien Energy Storage
Announced 31/12/2020 EVN AG 25 32
Terhills Terhills Operational 31/12/2018 Tesla 18,2 21,7 Total 53,4 76,45
End-of-life collection of LIB After the use phase, EV as well as SES systems can be collected through the extended producer responsibility (EPR) schemes that implement the obligation for producers or importers of EV or LIB to take back their products when they have become waste. In Flanders, Bebat is the organization accredited for the collection and processing of waste batteries, such as the SES LIB [22]. For LIB from EV, both Bebat and Febelauto (the EPR organization for end-of-life vehicles in Flanders) are accredited [23]. EPR organizations act on the OEM’s behalf to take care of the administrative obligations (data reporting), and optionally also all operations such as waste logistics and processing. Most EV OEMs make use of the collective EPR system. In 2020, Febelauto had an agreement with 17 OEMs and importers representing 89.5% of the Belgian EV market, with the majority of them choosing to hand over all operational duties to Febelauto

29
[24]. One OEM had an agreement with Bebat. As LIB have the risk to catch fire or explode when they are not properly handled, waste logistics for (EV) LIB is particularly challenging, and a task in which the EPR organizations can provide added value to OEMs by organizing this collectively. Currently, the outflow of end-of-life EV in Flanders is still very small, reflecting the very young EV market and relatively long lifetime of vehicles. In 2020, Febelauto reported to have collected 451 EV LIB, representing a weight of 38 tonnes [24]. As with internal combustion engine vehicles, import and export of used vehicles are potential routes for EV (and thus EV LIB) as well. However, until today, the amount of EV exported is very small (Figure 23) compared to the total EV market. The exports towards “rest of the world” represent a specific outlier of hybrid electric vehicles that is difficult to explain. Most other export is full electric vehicles towards other EU countries. As charging infrastructure is a critical prerequisite for the use case of plug-in hybrid or full electric vehicles, the lack of export outside of the EU is quite logical and will remain low for years to come. For SES LIB, no specific data on waste collection are available, but as this market has only recently started to develop (see previous section), the amount of waste will be negligible.
Figure 23 Import and export of used electric vehicles in Flanders ROW: rest of the world. (Source: stat.nbb.be)

30
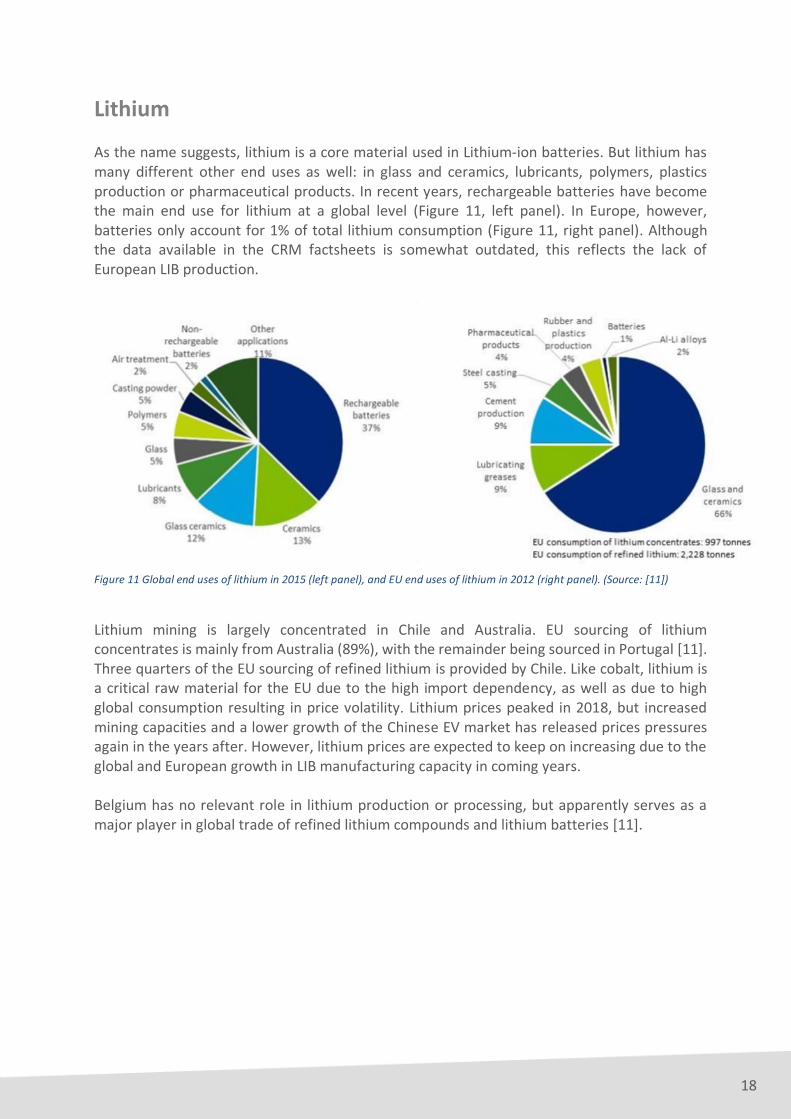
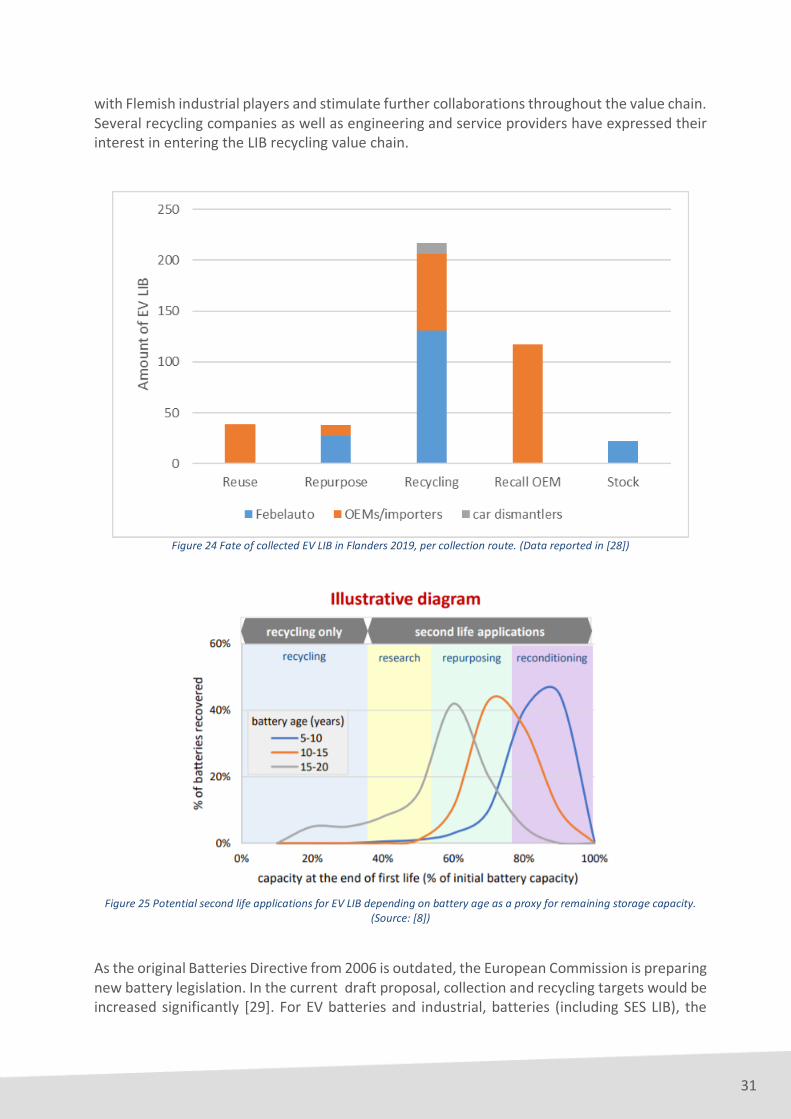
Recycling and remanufacturing The EU Batteries Directive puts forward collection and recycling efficiency targets for countries to adhere to [25]. The current Directive has a collection target for all batteries of 45%, and recycling efficiency targets for “other batteries” (which includes LIB and excludes lead-acid batteries and nickel-cadmium batteries) of 50% by weight. The existing legislation has stimulated the development of battery recycling activities in Europe over the past decade. Recycling technologies for Li-ion batteries have been introduced by several companies in Europe, with Umicore being a prominent leader. Other relevant players in LIB recycling are SNAM in France, and Accurec in Germany. Currently, LIB recycling at industrial scale is predominantly driven by portable LIB waste streams. EV and industrial LIB recycling is yet to grow as waste volumes from these applications are still very low. The extent to which specific materials such as cobalt or lithium are effectively recycled to the level that they can be re-introduced in the battery value chain, depends on the combination of different pyro- and hydrometallurgy processed being used. As current legislation does not contain material-specific recycling targets, recyclers focus on recovering the most economically attractive metals such as cobalt, while other materials (such as graphite) are lost in the process. Today, lithium is not recycled to battery-grade lithium because of economic constraints. Besides material value, collected EV LIB can also have product value. Batteries in good technical condition and with enough remaining storage capacity can be reused in vehicles or can be repurposed to serve as stationary energy storage (Figure 25). Remanufacturing of EV LIB for reuse or repurposing is a prominent R&D activity for both OEMs and EPR organizations. This can be seen in the data from EV LIB collection in Flanders. In 2020, almost 60% of the collected EV LIB in Flanders was sent to some form of further processing: for R&D, testing, remanufacturing or recycling. The remaining waste EV LIB are currently stored, because of recycling capacity issues due to COVID-19 or batch sizes too small to be transported in an economical way [24]. For 2019, more detailed data are available (Figure 24). Of the 433 collected EV LIB, 56% was collected by OEMs/importers directly, indicating the interest of OEMs to keep control over EV LIBs after use. Febelauto collected 42% of the total flow, and car dismantlers covering the remainder. Overall, 50% of collected EV LIB were sent to recycling, but the other half was either reused by OEMs (10%), repurposed for SES (10%, mainly by Febelauto), taken back by OEMs for research purposes (27%), or stored by Febelauto awaiting further processing (5%). Next to repurposing efforts by OEMs directly, also Febelauto has positioned itself as a key player in the remanufacturing of EV LIB for repurposing in SES with the development of the Watt4Ever consortium [26]. The mission of Watt4Ever is to maximize the residual value of EV LIB by repurposing them in SES battery packs for residential and industrial users. Despite several use cases in practice, the further upscaling of remanufacturing is still hampered by technical and economic barriers. End-of-life EV LIB exist in a wide variety of chemistries and form factors, making dismantling and remanufacturing operations difficult to standardize. Moreover, the inflow of EV LIB for remanufacturing is still very low, further impeding economies of scale. To support the creation of a Flemish EV LIB remanufacturing and recycling value chain, several research organizations and industry intermediates have initiated the Re2Live collaborative research project, funded by VLAIO [27]. The purpose of this project is to gather knowledge on logistics, dismantling, remanufacturing and recycling for EV LIB, and to share this knowledge
31
with Flemish industrial players and stimulate further collaborations throughout the value chain. Several recycling companies as well as engineering and service providers have expressed their interest in entering the LIB recycling value chain.
Figure 24 Fate of collected EV LIB in Flanders 2019, per collection route. (Data reported in [28])
Figure 25 Potential second life applications for EV LIB depending on battery age as a proxy for remaining storage capacity.
(Source: [8])
As the original Batteries Directive from 2006 is outdated, the European Commission is preparing new battery legislation. In the current draft proposal, collection and recycling targets would be increased significantly [29]. For EV batteries and industrial, batteries (including SES LIB), the

32
collection target would be 100%. LIB recycling efficiency would need to achieve 65% in 2025 and 70% in 2030, with specific recovery targets introduced for cobalt, copper, lithium and nickel as well. Additionally, targets for recycled content in new batteries would be introduced. Although the proposal is not yet adopted, and calculation rules for these efficiencies still need to be developed, EU legislation will continue to provide stimulus for LIB recycling in Europe, especially if material-specific recovery targets would be put in place. The business model for recycling companies is built on the creation of revenues from selling recycled materials, which need to be complemented by gate fees if those revenues do not cover the costs of the process. This means the business model for LIB recycling depends on the materials market prices as well as on policy measures that guide waste flows towards recycling. The business model for repurposing EV LIB for SES is determined by the costs for dismantling and remanufacturing of the batteries on the one hand, and the market price for SES solutions on the other. As market prices for LIB continue to decrease over time due to the learning curve, the potential margins for EV LIB remanufacturing will be relatively slim if remanufacturing costs can’t be kept limited. Policy drivers are currently less prominent for remanufacturing, as there is no reuse or remanufacturing target or obligation. However, remanufacturing could potentially generate more local economic value than recycling, as high transport costs for EV LIB will stimulate decentralized dismantling and pre-processing hubs as a precursor for recycling itself. Connecting remanufacturing activities to these dismantling and pre-processing hubs could then create local jobs for production of SES LIB. EV LIB not suitable for repurposing can be further pre-processed and transported more cost-efficiently to large-scale recycling plants that are not necessarily located within the region. Additionally, policy measures that regulate industrial production in general (transport regulations, labor regulations, environmental regulations, …) have an impact on the viability of recycling or remanufacturing activities as well.
Conclusions Based on the brief overview of the li-ion battery value chain sketched in this chapter, Flanders – and Flemish industry – plays a small role overall. However, at specific points in the value chain, Flanders is represented by strategic players and/or pioneering activities with high relevance for the future.
In the production as well as recycling of specific materials for LIB, Flanders harbors an internationally leading industrial and innovation actor, Umicore. A key strength is the connection between metals recycling from LIB with LIB cathode material production. However, both LIB materials production and metals recycling develop in a highly international context, leaving companies active in materials production and recycling with different options to position their activities in Flanders or abroad.
While car manufacturing has been decreasing sharply in Flanders over the last decades, the remaining manufacturing activities do play a strategic role in the electrification strategy of OEMs, with Volvo Cars in Ghent as a prominent player.
Thanks to a leading position in waste policy, waste collection and recycling in general, Flanders is home to some of the most advanced EPR ecosystems. Although the OEMs will hold the most power to determine what happens with end-of-life EV LIB in the future, the EPR organizations Febelauto and Bebat have positioned themselves to play a key role in the transition towards a more circular EV LIB value chain. Febelauto is taking the lead in pioneering the remanufacturing of EV LIB for stationary storage, potentially

33
acting as a third-party remanufacturer next to OEM-specific reuse and repurposing operations.
The strategic position of Flemish EPR organizations in the local collection of EV LIB at end-of-life can be an asset in the development of local economic value based on remanufacturing, especially because such activities are much more difficult to outsource to other regions, due to the high cost of EV LIB transport. However, cooperation with OEMs will be crucial, not only because OEMs remain responsible for their end-of-life LIB, but also because they possess the knowledge of battery design and functioning. Furthermore, labor cost is likely to be a barrier for the growth of remanufacturing without supporting policy measures.
The potential for local remanufacturing of EV LIB also depends on the market demand for stationary energy storage solutions, which itself depends on the further evolution of the energy transition in Flanders and in the EU.

34
Circularity Hub for EV LIB in Flanders – scenario analysis
Scope and approach Based on the value chain analysis in the previous chapter, it is clear that the strategic strengths of Flanders in the LIB value chain are mainly to be found in the use and post-use phases, rather than in the supply chain of virgin LIB. Taking into account that the energy transition will lead to the buildup in Flanders of significant stocks of EV LIB and SES LIB over time, it is worthwhile exploring how Flanders can use these as an asset to create sustainable economic value from EV LIB products and materials. To assess the economic and sustainability potential of a regional “Circularity Hub” for EV LIB in Flanders, the following approach is used:
1. Future scenarios for potential supply of end-of-life EV LIB as inflow to the Circularity Hub are compared to scenarios for demand of SES, providing a first indication of the overall potential of repurposing EV LIB for SES in Flanders in the coming ten years;
2. One supply – demand scenario combination is selected for which two Circularity Hub future scenarios (remanufacturing + recycling versus recycling alone) are developed and compared in terms of potential economic and environmental value creation
The development of the EV LIB value chain, as well as the energy transition in general, are complex societal processes. Future scenarios do not claim to predict the future but are a tool to get a grip on the complexity of systems change by providing a “what if?” perspective. This approach is particularly useful for this exploratory case study, as we want to assess the combined effect of two separate evolutions: the evolution of the EV market on the one hand, and the evolution of the SES market on the other. Both are highly unpredictable today, as they are driven by technological innovation, policy interventions, and consumer behavior. Future scenarios make use of reasonable estimates for key parameters such as average product lifetimes, market demand, or material composition, as well as for their evolution through time. Details on the calculations and parameter values used can be found in the Annex – Methodology. It is important to note, however, that the purpose of these scenarios is to provide insight in what the consequences would be if the future evolves according to a certain scenario, and do not claim to be market predictions. The scope of the analysis is Flanders, excluding import and export of end-of-life EV LIB or LIB for recycling. The time horizon for the future scenarios is 2030. For the estimation of recycling value, the time horizon is extended to 2040, to take into account the average lifetime of SES LIB creating a time delay before effects on recycling inflow become apparent. As explained in the previous chapter, EV LIB can in principle be valorized via three different routes:

35
Remanufacturing of EV LIB to reuse them in EV again Remanufacturing of EV LIB to repurpose them for SES Recycling of EV LIB to recover materials as input for new products
In the scenario analysis, we do not include the remanufacturing for reuse route. Today, reuse of EV LIB is not implemented by OEMs, and although it is being investigated, it is currently unclear to what extent this practice will become industrially relevant in the future. EV and EV LIB design is evolving at a high pace. Current EV LIB systems lack status and health monitoring, which are crucial to assess the feasibility of reusing an EV LIB after a car crash, for example. If EV LIB reuse would become relevant in the near future, it will decrease the inflow of EV LIB suitable for repurposing and delay the inflow of EV LIB to recycling.
Supply of EV LIB versus demand of SES In this section, two types of future scenarios are developed, that provide insights into the following questions (Figure 26):
1. How many EV LIB will become end-of-life in Flanders during the next ten years, what is their composition, and how much storage capacity is left that could be considered for repurposing into SES?
2. How will the demand for SES LIB in Flanders evolve during the next ten years in the residential, industrial and grid-scale stationary storage markets?
For both supply and demand scenarios, two variations are calculated reflecting high versus low future growth. Comparing supply and demand scenarios then allows to provide a first picture of the potential for an EV LIB Circularity Hub in Flanders depending on how these markets evolve.
Figure 26 LIB value chains within the scope of the case study, with indication of the supply and demand flows being the focus of the scenarios.

36
1. Supply of end of life EV LIB Recently, a stock-flow model of the Flemish car fleet was built by OVAM and VITO in order to evaluate the material stock and the related flows such as vehicle renewal over time [30]. The main objective of the model is to provide a tool for long-term policy analysis. An extensive scenario analysis was carried out to evaluate how fast material stocks from the car fleet change due to technological development. Next to the conventional internal combustion engine vehicles (ICEV), the model includes “newer” technologies, such as hybrid electric vehicles (HEV), plugin hybrid electric vehicles (PHEV) and battery electric vehicles (EV). For each of these types, the model separates between battery types (NMC, NCA, etc.), which evolve over time (in the past and for the future). Two scenarios, as developed for CE Center in 2019 [31], have been used for this analysis:
BAU (business as usual) - This scenario serves as a reference and is comparable to the BAU scenario as defined in the Flemish Climate Policy Plan. Current trends continue: more cars, more kilometers driven, very limited growth in number of EV, PHEV, HEV vehicles;
TEC - This scenario assumes that by 2030 only electric vehicles (i.e. type EV) are sold. The linear increase starts in 2020.
In the context of this study, the BAU scenario can be regarded as a low-supply scenario, as the current evolution of the Flemish car fleet is considered to be higher than the BAU scenario assumptions (personal communication with FEBIAC). The TEC scenario, on the other hand, can be regarded as a high-supply scenario, as a 100% EV car market by 2030 remains ambitious. Figure 27 shows the amount of EV LIB (separated in different age cohorts) that would become available in each year. In both scenarios, most of the end-of-life EV LIB are available for remanufacturing into stationary storage, and these quantities increase over the next 10 years. However, under the TEC scenario the growth by 2030 is roughly tenfold higher than under the BAU scenario. Most of the batteries collected from end of life EVs do not perform at full capacity. Figure 7 provides remaining capacities as a function of the age of the battery and varying between different fates:
- All batteries younger than 11 years are considered for a second life application. Depending on how this second life is fulfilled (reconditioning, repurposing or used for supporting research) capacities left vary from 58% to 90%;70% of all batteries between 11 and 15 years old could still be put in second life applications. Capacity losses vary between 15% and 44%. The remaining 30% will be recycled;
- 40% of the batteries between 16 and 20 years old will be reused. Capacity losses vary between 18% and 52%. The majority (60%) are recycled;
- All batteries older than 20 years are recycled. Figure 28 shows the yearly available storage capacity from end-of-life EV LIB, for the batteries that can be considered for remanufacturing into SES, and the battery capacity that is considered not feasible for remanufacturing and consequently is sent to recycling.

37
Figure 27 Amount of end-of-life EV LIB considered for second life application, yearly available, at different battery ages in the BAU scenario (upper) and the TEC scenario (lower).
0
1000
2000
3000
4000
5000
6000
7000
8000
2015 2016 2017 2018 2019 2020 2021 2022 2023 2024 2025 2026 2027 2028 2029 2030
< 11 years 11-15 years 16-20 years

38
Figure 28 Capacities left from end of life EV LIB considered for second life application and for recycling as yearly available in the BAU scenario (upper) and the TEC scenario (lower)
2. SES demand scenarios Future scenarios for the Flemish demand for stationary energy storage were created for the following three market segments (see Annex – Methodology for more details):
Residential: SES connected to residential solar power installations <10kW Commercial/industrial: SES connected to solar power installations >10kW Grid: large scale SES directly connected to the grid
For each market segment, the annual demand in MWh until 2030 was estimated for two scenarios:
High Demand: in this scenario, growth in residential and commercial/industrial SES follows growth in solar power capacity, with all solar power plants assumed to be

39
connected to a local storage system by 2030. Grid scale SES follows the “High Doubling” scenario of IRENA [32].
Low Demand: growth in residential and commercial/industrial SES follows a less optimistic growth path compared to solar power capacity growth. Grid scale SES follows the “Low Reference” scenario of IRENA.
Yearly demand for both scenarios and different market segments is shown in Figure 29. Overall, residential SES storage is the largest contributor to SES storage demand, with grid scale storage the lowest. This is largely the result of a higher installed base in 2020 for residential solar power, as well as a higher planned growth rate for this market compared to the others in the Flemish Solar Plan, which provides the basis for the projections in solar capacity growth [33].
Figure 29 Annual demand for stationary energy storage in Flanders for three market segments, according to the High Demand scenario (upper panel) and Low Demand scenario (lower panel).

40
In the High Demand scenario, there is a sharp increase in annual demand near the middle of the decade, which is caused by the end of the exemption period for owners of residential solar power installations to install a digital electricity meter in 2024, and the assumption that all owners of solar power plants will decide to install a SES system in the two years following the end of this exemption. In the Low Demand scenario, there is a much more gradual uptake of SES storage, which in the end is also lower than in the High Demand Scenario. In general, the High Demand is representative for a future in which demand for SES grows quickly and sharply, while the Low Demand scenario represents a situation in which the initial growth in SES demand is more gradual and does not follow the assumption that SES will be fully integrated into the energy system in Flanders by 2030.
3. Comparing supply and demand In Figure 30, the results for all four scenarios are plotted together as aggregated capacity until 2030. Based on the difference in aggregated capacities in 2030, we can conclude that if EV LIB supply follows the BAU scenario, the potential for supplying the SES market from remanufactured EV LIB will be very limited – the aggregated supply is ten times lower than the lowest capacity demand scenario. The TEC supply scenario, however, would provide capacities in the same order of magnitude as the High Demand scenario, and even more capacities than needed in the Low Demand scenario by 2030.
Figure 30 Aggregated SES capacity demand and EV LIB capacity supply for both supply scenarios and both demand scenarios.
Next to the availability in terms of aggregated stocks by 2030, also the evolution through time of both supply and demand curves is important to compare. Here, we see that although the TEC supply would provide large amounts of capacities by 2030, the rate at which these capacities build up in the first years is much lower than the High Demand growth rate, and lower than the Low Demand growth rate. This reveals a key factor to the potential of EV LIB remanufacturing in Flanders: if SES demand grows a lot faster than growth in EV LIB supplies, then a large part of

41
the SES market will be saturated with virgin SES LIB, decreasing the market size for years to come as SES LIB have expected lifetimes of 10 to 15 years. Plots of the annual EV LIB capacity supply as the percentage of annual SES demand and compared to SES market shares in each year (Figure 31) indicate that in the Low Demand scenario the BAU scenario would provide sufficient capacity to cater the grid SES market, and while the TEC scenario would already be able to cover the full Commercial/industrial and Grid markets by 2023. From 2027 on, there would be more than enough EV LIB capacity to cover the full SES market demand under both SES Demand scenarios.
Figure 31 Yearly EV LIB capacity supply expressed as percentage of yearly SES demand capacity (lines), in comparison with market shares of the three simulated SES market segments (bars). Upper panel: High Demand scenario, Lower panel: Low
Demand scenario.

42
Figure 32 summarizes the four different combinations of supply and demand scenarios, and their consequences for the potential of a Circularity Hub focusing on remanufacturing. In all potential futures, recycling will be a viable option as all EV LIB and SES LIB eventually will need to be recycled. But to what extent can remanufacturing of EV LIB into SES be viable? If the supply of EV LIB during the next ten years remains low, and demand for SES surges (upper left), the most logical focus for a Flemish Circularity Hub would be on the recycling of EV and SES LIB. While remanufacturing of the relatively small stock of EV LIB could be absorbed by the SES market, the lack of economies of scale compared to the virgin SES LIB market would make the viability of remanufacturing highly unlikely. In a future where high SES demand is accompanied by a rapidly growing supply of EV LIB (upper right), there is considerable potential for a Circularity Hub with focus on remanufacturing. However, as SES LIB have a quite long expected lifetime, a key challenge here is that the supply of remanufactured EV LIB to the SES market needs to scale up quickly enough to avoid that large shares of the rapidly expanding SES market would already be covered by virgin SES LIB. If demand for SES in the next ten years grows at a slower pace, and supply of EV LIB remains low as well (lower left), the overall potential for EV LIB remanufacturing remains relatively low. However, due to the slow growth in SES demand, there could be opportunities to address specific markets such as the grid-scale market. Finally, a future in which low SES demand over the next years is accompanied by high EV LIB supplies (lower right) would provide a promising set of circumstances to develop a Circularity Hub based on remanufacturing in Flanders. In the next chapter, this future will be taken as the context to further explore the economic and environmental potential of EV LIB remanufacturing and recycling in Flanders.
Figure 32 Four different potential futures based on EV LIB supply and SES demand scenarios.

43
Circularity Hub scenarios In this chapter, two Circularity Hub scenarios for EV LIB in Flanders are constructed and compared to explore the economic and environmental potential of remanufacturing and recycling the EV (and SES) LIB stock building up in Flanders during the next decade. The TEC supply curve is used as EV LIB supply, and the Low Demand curve is used as SES market demand. Again, the scenarios developed in the previous chapter represent possible futures, not necessarily the most likely to occur. The results of this chapter should therefore be interpreted in the context of the Low demand – high supply future scenario elaborated in the previous chapter. The two explored Circularity Hub scenarios are:
Recycling Only (Figure 33): In this scenario, all EV LIB dismantled from EV that become end-of-life in Flanders are sent to recycling in Flanders. The market demand for SES is addressed by virgin SES LIB. Those LIB are sent to recycling as well, after an average lifetime of 15 years.
Remanufacturing First (Figure 34): In this scenario, the SES market demand is maximally addressed by remanufactured EV LIB. In years where the supply of EV LIB for remanufacturing is lower than SES market demand, the remaining demand is addressed by virgin SES LIB. In years where EV LIB supply is higher than SES market demand, the residual EV LIB supply is sent directly to recycling. SES LIB are sent to recycling after an average lifetime of 15 years (virgin SES) or 8 years (remanufactured SES).
For each scenario, the potential market value for SES and material value for recycling are calculated (details can be found in Annex – Methodology). Furthermore, differences in environmental impacts between both scenarios are estimated as well. The number of parameters in the analysis has purposely been kept limited, to keep comparisons between the scenarios explainable. More detailed analyses considering inherently uncertain factors, such as technological and market price evolutions, can be the focus of future research.
Figure 33 Recycling Only scenario

44
Figure 34 Remanufacturing First scenario
1. SES market product value In the Recycling Only scenario, the SES market is fully covered by new SES LIB, as no remanufacturing is taking place. Assuming a SES LIB market price of 1000 €/kWh in 2020, decreasing to 720 €/kWh in 2030, the aggregated market value for SES would amount to 5.7 billion euro by 2030 (Figure 35). As there is no SES LIB manufacturing happening in Flanders, most of this value will be going outside Flanders. Assuming installation costs are 10% of total system costs, the added value for Flemish companies (installers) would be limited to 570 million euro.
Figure 35 Cumulative market value for SES LIB in the Recycling Only scenario.
In the Remanufacturing First scenario, that same total market value is divided over new SES LIB and remanufactured EV LIB (Figure 36). Before 2025, most of the SES market demand is supplied by new LIB, but after that the share of remanufactured EV LIB rapidly increases. Overall, 80% of the total market value is taken up by remanufactured EV LIB by 2030. Assuming

45
remanufacturing operations happen inside Flanders, this means that a much larger share of the value remains in Flanders: 4.7 billion euro.
Figure 36 Cumulative market value for SES LIB in the Remanufacturing First scenario, split up over new LIB and remanufactured EV LIB. Percentages indicate the share of remanufactured LIB in the total market value.
2. Material recycling value To estimate the material recycling value in both scenarios, the material composition of the SES LIB and EV LIB needs to be estimated, which is determined by the distribution of different battery chemistries and the material content of each battery chemistry. The distribution of battery chemistries in the annual SES market is shown in Figure 37 (for calculation details, see Annex – Methodology). In the Recycling Only scenario, the SES LIB market is dominated by the LFP type batteries, with only later in the decade a small increase in chemistries that contain cobalt and are thus more interesting in terms of recycling value. In the Remanufacturing First scenario, LFP batteries are still the dominant battery type in the first years, but as the share of remanufactured EV LIB increases over the years, different cobalt-containing battery types dominate the inflow into the SES market.

46
Figure 37 Annual weight of SES LIB put on the market in the Recycling Only scenario (upper panel) and Remanufacturing First scenario (lower panel), per battery chemistry.
These differences in material composition of SES LIB are reflected in the estimated yearly recycling input material value that can potentially be extracted from end-of-life SES LIB (Figure 38, upper panel). The value that can potentially be extracted by material recycling when SES LIB have reached their end-of-life peaks around 2035 in the Remanufacturing First scenario, and is 7 times higher than the potential value in the same year of the Recycling Only scenario, making the SES LIB stocks in the Remanufacturing First scenario significantly more economically interesting for recycling than the SES LIB stocks built up in the Recycling Only scenario. When comparing the potential recycling input material value from SES LIB with that of EV LIB going directly to recycling (Figure 38, lower panel), the value from EV LIB is much higher than from SES LIB. This reflects the much larger market size of EV compared to SES in the scenarios used for this analysis. Furthermore, the effect of remanufacturing on recycling can be seen in

47
this figure as well. The inflow to recycling from EV LIB is delayed in time since EV LIB are kept in use as SES for an average of 8 years.
Figure 38 Yearly recycling input material value from SES LIB (upper panel) and EV LIB (lower panel) in both scenarios.
Aggregating the annual material value estimates until 2030, and assuming all material recycling operations would take place in Flanders, provides an estimate of the potential recycling market value. This results in a potential material recycling value of 260 million euro in the Recycling Only scenario, versus 137 million euro in the Remanufacturing First scenario. This does not mean that the overall material value in the latter scenario would in fact be lower. It just means that the timing of this value is shifted further into the future, as all LIB will eventually become available for recycling. While the material value from SES LIB is significantly larger in the Remanufacturing First scenario compared to the Recycling Only scenario, it remains much lower than the value from EV LIB (Figure 39).

48
Figure 39 Potential cumulative recycling input material value by 2030 for both scenarios, separated into value from SES LIB and value from EV LIB.
3. Comparing product and material value Figure 40 summarizes the cumulative product and material value by 2030 for both scenarios. When looking at total value potential, the Recycling Only scenario would create a marginally higher value potential than Remanufacturing First, which is entirely explained due to the time delay effect of remanufacturing products. Calculating values over a longer timeframe would further decrease this difference in value. However, timing is important, as recycling companies would prefer to capture this value sooner rather than later. On the other hand, the inflow to recycling from SES LIB would be of higher value in the Remanufacturing First scenario due to a higher value material composition of remanufactured EV LIB. When looking at the Flemish value potential, however, the Remanufacturing First scenario creates much more local value compared to the Recycling Only scenario. This is because new SES LIB need to be imported from abroad, leaving only installation costs as revenues for local companies, while remanufacturing is assumed to take place in Flanders. For recycling, the assumption that all value will remain in Flanders is too optimistic. Already today, LIB recycling is not happening entirely in Flanders, and future investments could as well be focused in other countries if companies decide to locate recycling close to battery production facilities.

49
Figure 40 Potential cumulative product and recycling input material value by 2030 for both scenarios.
4. Environmental impact savings A Circularity Hub should not only provide economic value, but environmental value as well. To estimate the differences in environmental impact between both Circularity Hub scenarios, two impact savings are relevant.
Remanufacturing EV LIB avoids the production of SES LIB. Table 5 indicates that by 2030, a total of 625 thousand tonnes of CO2-equivalents would be avoided in the Remanufacturing First scenario compared to the Recycling Only scenario.
Assuming recycling EV LIB saves greenhouse gas emissions, the consequence of delaying recycling of (part of the) EV LIB in the Remanufacturing First scenario is that some of these impact savings will not have occurred by 2030. These missed out impact savings are calculated in Table 6, and amount to 9 thousand tonnes of CO2-equivalents.
So overall, the net result is still overwhelmingly positive for the Remanufacturing First scenario, as the avoided SES LIB production is significantly higher than the EV LIB recycling that has not taken place. Moreover, this EV LIB recycling will eventually take place later in time, so overall the net result is even more supportive of remanufacturing. Estimating the environmental impact of the remanufacturing activities themselves was not possible within this project. However, the results of our analysis provide an estimate of how high the “impact budget” of remanufacturing activities can be to result in a net-positive outcome. Considering that the production of new LIB includes mining activities for raw materials, and a global supply chain, while remanufacturing will be done locally and entails

50
mainly disassembly and re-assembly operations as well as adding some additional components, it is safe to assume that reaching a net-positive outcome is realistic. Table 5 Impact savings resulting from SES LIB production that has been avoided in the Remanufacturing Scenario
Impact savings due to avoided SES LIB production
Battery type
Avoided battery production (kg)
Avoided impact (kg CO2 eq/kg) [34]
Total avoided impact (ton CO2 eq)
LFP 29083306 15,1 439158
NMC811 3585486 22,2 79598
NMC622 3187099 22,2 70754
NMC523 1541262 21,8 33600
NMC111 86525 21,8 1886
TOTAL 624995
Table 6 Impact savings that have not been realized by 2030 in the Remanufacturing First scenario because EV LIB recycling has been delayed
Impact savings not realized due to delayed EV LIB recycling
Battery type
Battery weight not recycled by 2030 (kg)
Impact savings per recycled weight (kg CO2 eq/kg) [35]
Impact savings not realized (ton CO2 eq)
NMC622 24978532 0,2 4996
NMC811 8643514 0,2 1729
NMC955 1518350 0,2 304
NCA 10856406 0,15 1628
TOTAL 8657

51
Conclusions In this report, the future economic and environmental potential of a Flemish Circularity Hub for li-ion batteries from electric vehicles has been explored using future scenario analysis. First, a qualitative analysis of the value chains of EV and SES LIB showed the limited role of Flanders in the supply chain of these products, with some notable exceptions in the battery material production and EV LIB assembly activities, where Flemish industrial activity takes up key roles in the further development of circular EV LIB value chains. The main strategic strength for Flanders, however, lies in the collection, dismantling, remanufacturing and recycling parts of the value chain. However, the Flemish value chain is firmly embedded in a broader European and even global context. For this reason, building on this strength requires the creation of the right conditions for companies to choose to invest in materials production and recycling in Flanders instead of in other European regions. These conditions are linked to the further evolution of battery legislation, innovation support for remanufacturing and recycling, and the positioning of EV OEMs in terms of control over EV batteries after their first life. Making use of quantitative future scenario analysis, different possible future developments for the supply of EV LIB towards remanufacturing or recycling as well as for demand for stationary energy storage in Flanders have been explored. The results of this first scenario analysis indicate that the differences in the rate of growth of the EV market and SES market will be crucial to determine the potential for EV LIB remanufacturing in Flanders. If the SES market demand booms too soon, the more slowly developing inflow of EV LIB for remanufacturing will lead to the SES market being saturated with virgin SES LIB. These LIB need to be imported and create relatively low local added value. However, if this is how the future develops, then a focus on stimulating recycling activities for EV (and SES) LIB in Flanders will be the best way to keep as much of the material value embedded in Flemish LIB stocks in the local economy. In a second step, two Circularity Hub scenarios were developed: one in which EV LIB are recycled, and another one in which EV LIB are remanufactured to satisfy SES demand. These scenarios were applied to the potential future in which the SES market does not develop too fast in Flanders, and EV LIB supplies grow at a fast pace. The analysis showed that in such a future, developing local remanufacturing capacity for EV LIB would bring clear economic and environmental benefits. Economically, remanufacturing creates local added value whereas virgin SES LIB are produced elsewhere. Also, remanufactured EV LIB have a much higher value than the residual material value in LIB going to recycling. While remanufacturing would delay the inflow of EV LIB to recycling in time, the material composition of remanufactured EV LIB would be more beneficial for the recycling business case than that of virgin SES LIB. Furthermore, a Remanufacturing Hub has significant potential to create net environmental benefits compared to recycling alone, due to the avoided production of virgin SES LIB. Predicting what the future will be is impossible. The results of the scenario analysis in the report do not give an accurate view of the future of EV LIB stocks and value. Nevertheless, while

52
modeling results for individual scenarios mainly reflect how the future would look like if it would continue to develop as we experience the world today, it is the combination of different, alternate future scenarios that makes future scenario analysis a useful tool to identify which factors shape the future, and what the implications would be of those factors evolving in a specific direction. In a wealthy region with high rates of consumption like Flanders, all kinds of product and material stocks build up over time. These stocks can be the source of value creation, both economic and environmental. However, making the right strategic policy decisions and innovation investments to capture this value is challenging, as it requires a much better view on where and how stocks build up, what their value is and how it can be captured, than is possible today. A static modeling exercise such as presented in this report provides some guidance on how to prepare for different futures. Investing in a local remanufacturing hub can pay dividends, although the chance of success will depend on the evolution of EV markets, business strategies of OEMs, and the timing and location of investments in industrial capacity by recycling companies and battery manufacturers. Going beyond merely understanding the driving factors, and influence those driving factors by making information-based decisions, requires the development of strategic monitoring capability for (selected) product and material stock developments in Flanders. Such capability consists of (semi-)continuous data gathering, consistent and robust stock-flow modeling and trend analysis, and policy supportive reporting. Especially in the context of circular economy, in which continuously evolving customer demands need to be met based on equally continuously evolving resource supplies from stocks built in the past, strategic resource monitoring would provide much stronger policy support than isolated, one-off static analyses. With the ‘stock & flow model’ for vehicles commissioned by OVAM, a first limited example of such consistent modeling approach is available today focused on materials in one product category. This approach could be a starting point for a continuous monitoring system of flows and stocks in Flanders of products as well as materials, focusing on several product categories that contain substantial amounts of critical raw materials. This would require the development of structured data input flows, modeling of products as well as materials, and the development of interactive monitoring dashboards to make the resulting insights available for policy makers and other stakeholders. Over time, such modeling approaches could lead to a strategic resource observatory, capable of analyzing different policy scenarios providing support to policy makers as well as industry actors.

53
Annex – Methodology
SES demand scenarios The SES demand scenarios were developed by estimating the growth of SES use for three market segments:
Residential: SES LIB connected to solar power installations <10kW The use case for this market segment is day/night shifting of solar power
consumption, increasing self-consumption to decrease costs of using power from the grid. With the advent of digital energy meters, this use case becomes economically viable in Flanders.
The installed photovoltaic (PV) capacity in Flanders in 2020, retrieved from [36], was used as the baseline for further growth.
PV capacity growth rate until 2030 was taken from the Flemish solar power policy plan [33].
PV power capacities were converted to battery storage capacities by assuming that 1,5 kWh battery capacity would be installed per kW PV capacity.
Separate adoption rates were used for installing integrated PV + battery installations, for retrofit of PV installations existing prior to 2021, and for retrofit of new PV installations from 2021 on that did not have a battery installed at the time of PV installation.
Commercial/Industrial: SES LIB connected to solar power installations >10kW A similar use case exists as for the residential segment, but this market segment
currently has a tariff system in which power consumed is charged per 15 minutes, and power put on the grid can be valorized.
The same logic and assumptions were used to create a demand curve as for the residential segment, without considering a possible effect of the installation of digital meters on the adoption rate of SES.
Grid: large scale SES LIB systems directly connected to the grid The use case for this market segment is the provision of grid-balancing services,
helping to control frequency fluctuations and providing temporary storage for excess renewable power.
The known installed capacity in 2020 (Table 4) was used as the baseline for further growth.
Growth rates for utility-scale battery energy storage until 2030 were taken from [32].
To account for uncertainty in the growth rates of SES use, two scenarios were designed for each market segment:
High Demand scenario: by 2030, all solar power installations are connected to SES, and grid-scale SES grows according to high estimates of global growth.
o Residential:

54
the adoption rate for retrofitting PV installations existing prior to 2021 with SES starts at 0.08% in 2020 (based on installed SES capacity – see chapter 2), remains low (1% to 5%) in 2021-2025 because of the exemption of PV owners to install a digital meter until the end of 2024, and then rises to 100% in 2026 to remain at full adoption until 2030.
The adoption rate for retrofitting PV installations existing prior to 2021 that already have a digital meter (about 101000 installations) starts at 0.22% in 2020 and rises appr. linearly to 100% in 2025.
The adoption rate of SES at new PV installations increases from 0.22% in 2020 to 100% in 2025 as well, but the increase in adoption rate follows a slower growth rate during the first few years, to increase strongly in 2023 and 2024.
o Commercial/Industrial: Retrofit: the adoption rate starts at 1.5% in 2020 and doubles every year
to reach 100% in 2027. New: adoption rate starts at 1.5% in 2020 and follows the same growth
evolution as for new PV installations in the residential market segment. o Grid: the “Doubling High” growth rate for 2030 (factor 19) was used from [32],
with a linear increase between 2020 and 2030. Low Demand scenario: a lower and slower adoption of SES in general.
o Residential: the adoption rate for retrofitting PV installations existing prior to 2021
with SES (with and without digital meter installed in 2020) only rises to 10% in 2026 to remain constant until 2030.
The adoption rate of SES at new PV installations increases from 0.22% in 2020 to 80% in 2027 and remains constant after that.
o Commercial/Industrial: Retrofit: the adoption rate follows the same trajectory as for residential
retrofit. New: the adoption rate follows the same trajectory as for new
installations in the residential market segment. o Grid: the “Reference Low” growth rate for 2030 (factor 4) was used from [32],
with a linear increase between 2020 and 2030.
SES market product value The potential market value of the SES LIB market was estimated by converting the SES demand curve in MWh to a cost curve making use of a unit price per kWh battery capacity. The baseline cost price was estimated to be 1000 €/kWh, reflecting values found in different reports, on websites of installers as well as in the simulator of the Flemish Energy Agency to calculate the Return-on-Investment of buying residential SES. A decrease in SES price was taken into account, by making the unit price decrease linearly until a level of 72% of the baseline price in 2030 [37]. The cost price for remanufactured EV LIB was assumed to be the same as for virgin SES, reflecting the need for remanufactured EV LIB to be on par with market prices for virgin SES.

55
The resulting market value represents the money that buyers would transfer to installers. As installers in the Recycling Only scenario need to import SES LIB, a large part of the market value will be transferred to parties outside of Flanders. To estimate the value that remains local, a 10% share of the total cost was allocated to installation costs, based on [37]. In the Remanufacturing First scenario, 80% of the market value was calculated to be delivered through remanufactured LIB. For these LIB, all value was assumed to remain in Flanders, as remanufacturing was assumed to take place locally. For the remaining 20% virgin SES LIB, the same calculations were used as in the Recycling Only scenario.
LIB material value To estimate the material value of LIB that are sent to recycling, the following steps were taken:
Convert the data in energy capacity to battery weight per battery chemistry Transfer the weights of SES put on market to end-of-life making use of Weibull
distributions Estimate the amount of different key materials in the waste streams and convert to
value using market prices.
1. Capacity to weight conversion For virgin SES LIB, the market demand data in MWh were converted to mass of different battery chemistries making use of the battery chemistry distribution and energy density data in Table 7. For EV LIB, the original parameters in the stock-flow model that generated the EV LIB supply curve in MWh were used to convert to mass of different EV LIB chemistries [30]. Table 7 Distribution of different battery chemistries in the virgin SES LIB market over time, and energy density evolution for LFP and NMC type batteries. Source: [6]
Battery types 2020 2021 2022 2023 2024 2025 2026 2027 2028 2029 2030
LFP 95% 91% 86% 82% 77% 73% 68% 64% 59% 55% 50%
NMC811 0% 2% 4% 5% 7% 9% 11% 13% 14% 16% 18%
NMC622 0% 2% 3% 5% 6% 8% 10% 11% 13% 14% 16%
NMC523 4% 4% 4% 5% 5% 5% 5% 5% 6% 6% 6%
NMC111 1% 1% 1% 1% 1% 1% 0% 0% 0% 0% 0%
Energy density 2020 2021 2022 2023 2024 2025 2026 2027 2028 2029 2030
LFP (Wh/kg) 100 103 106 109 113 116 119 123 127 130 134
NMC (Wh/kg) 150 156 162 169 175 182 190 197 205 213 222
2. Convert weight put on market to end-of-life weight The demand curve represents the weight of SES LIB taken in use in each year. To estimate the evolution through time of end-of-life SES LIB available for recycling, an estimated lifetime of the

56
batteries is needed. This was modeled using a Weibull statistical distribution (Figure 41). For virgin SES LIB, an average lifetime of 15 years was used, and a shape parameter of 8. For remanufactured EV LIB, the average lifetime in the SES market was taken as 8 years, with a shape parameter of 4.5.
Figure 41 Weibull distributions used to estimate end-of-life distributions of SES LIB.
3. Estimate weights of individual materials and their value To obtain an estimate of the material value embedded in end-of-life LIB, first the weights of 5 key materials contained in LIB were obtained by converting the total battery weights with the material content data in Table 8 for virgin SES LIB, and in Table 9 for EV LIB. Next, publicly available raw material market prices were used to convert the weights into monetary value ( Table 10). The resulting material value represents the maximum value that can theoretically be extracted from the LIB, if all considered materials would be recycled for 100% and if the output materials would be of the quality required for the resource markets used to collect price data. Furthermore, material composition as well as market prices were assumed constant over time. A more detailed assessment of recycling value would need to consider recycling efficiencies, material composition evolutions as well as resource price evolutions. Those factors are highly uncertain and would make a more detailed assessment overly complicated for the purpose of the analysis presented here. However, because the material value calculated here represents a theoretical maximum, and this value is much lower than the product value we compare it with in the analysis, the overall conclusions about material value relative to product value are robust.

57
Table 8 Content of 5 key materials in different battery chemistries included in the scenario analysis for virgin SES.
Virgin SES material content
Ni Li Co Cu Graphite
LFP 0,96% 1,07% 0,00% 8,17% 7,28%
NMC811 8,32% 1,07% 0,91% 9,18% 8,18%
NMC622 6,51% 1,07% 1,82% 9,18% 8,18%
NMC532 5,61% 1,07% 1,82% 9,16% 8,17%
NMC111 4,07% 1,07% 3,00% 9,20% 8,20%
Table 9 Content of 5 key materials in different battery chemistries included in the scenario analysis for EV LIB.
EV LIB material content
Ni Li Co Cu Graphite
HEV
NiMH 49,87% 0,06% 1,01% 3,90% 2,38%
NMC111 3,44% 1,18% 3,30% 23,21% 10,24%
NMC622 6,06% 1,16% 1,98% 23,21% 10,24%
NMC811 8,00% 1,16% 0,99% 23,21% 10,24%
NMC955 8,97% 1,16% 0,49% 23,21% 10,24%
LMO 0,15% 0,67% 0,00% 23,78% 7,29%
LFP 0,17% 0,68% 0,00% 24,26% 9,06%
PHEV
NMC111 4,63% 1,62% 4,53% 18,84% 13,89%
NMC622 8,24% 1,60% 2,72% 18,84% 13,89%
NMC811 10,91% 1,59% 1,35% 18,84% 13,89%
NMC955 12,23% 1,59% 0,68% 18,84% 13,89%
LMO 0,12% 1,03% 0,00% 17,31% 11,01%
LFP 0,13% 0,90% 0,00% 17,20% 11,86%
EV
NCA 5,85% 0,66% 0,67% 9,81% 8,74%
NMC111 4,07% 1,07% 3,00% 9,20% 8,20%
NMC622 6,51% 1,07% 1,82% 9,18% 8,18%
NMC811 8,32% 1,07% 0,91% 9,18% 8,18%
NMC955 9,23% 1,07% 0,45% 9,17% 8,18%
LMO 0,84% 1,31% 0,00% 7,12% 6,34%
LFP 0,96% 1,07% 0,00% 8,17% 7,28%
NMC532 5,61% 1,07% 1,82% 9,16% 8,17%
LCO 1,08% 1,07% 9,10% 9,17% 8,17%

58
Table 10 Raw material market prices used to estimate material value embedded in end-of-life LIB. Source for Ni, Li, Co Cu: [38], consulted on 28/05/2021. Source for Graphite: [39]
Raw material price (€/kg)
Ni Li Co Cu Graphite
14,66 11,473 35,828 8,316 1,929

59
References [1] IEA, “The Role of Critical Minerals in Clean Energy Transitions,” 2021. [Online]. Available:
https://iea.blob.core.windows.net/assets/24d5dfbb-a77a-4647-abcc-667867207f74/TheRoleofCriticalMineralsinCleanEnergyTransitions.pdf
[2] European Commission. Directorate General for Internal Market, Industry, Entrepreneurship and SMEs., Critical raw materials for strategic technologies and sectors in the EU: a foresight study. LU: Publications Office, 2020. Accessed: Jul. 01, 2021. [Online]. Available: https://data.europa.eu/doi/10.2873/58081
[3] “Commission announces actions on Critical Raw Materials,” European Commission - European Commission. https://ec.europa.eu/commission/presscorner/detail/en/ip_20_1542 (accessed Jul. 01, 2021).
[4] “European Raw Materials Alliance (ERMA),” European Raw Materials Alliance (ERMA). https://erma.eu/ (accessed Jul. 01, 2021).
[5] K. Breemersch and M. Riemersma, “Grondstofvraag voor een koolstofarme samenleving: Scenario’s voor een rechtvaardige Belgische energietransitie,” Profundo en VITO, Amsterdam, 2019.
[6] K. Breemersch, A. Vercalsteren, B. Mantels, and T. Rommens, “Kritieke materialen in de Vlaamse energietransitie: circulaire economie en klimaat,” OVAM, 2020. Accessed: Jul. 01, 2021. [Online]. Available: https://www.ovam.be/sites/default/files/atoms/files/Rapport_kritieke_materialen_Vlaamse_energietransitie.pdf
[7] European Commission. Joint Research Centre. and Ricardo Energy & Environment., Circular economy perspectives for the management of batteries used in electric vehicles. LU: Publications Office, 2019. Accessed: Jul. 01, 2021. [Online]. Available: https://data.europa.eu/doi/10.2760/537140
[8] Element Energy, “Batteries on wheels: the role of battery electric cars in the EU power system and beyond - Technical Annex,” 2019.
[9] “Umicore | Cobalt & Specialty Materials.” https://csm.umicore.com/ (accessed Jul. 02, 2021).
[10] “Umicore | Rechargeable Battery Materials.” https://rbm.umicore.com/ (accessed Jul. 02, 2021).
[11] European Commission. Directorate General for Internal Market, Industry, Entrepreneurship and SMEs., Study on the EU’s list of critical raw materials (2020): critical raw materials factsheets. LU: Publications Office, 2020. Accessed: Jul. 02, 2021. [Online]. Available: https://data.europa.eu/doi/10.2873/92480
[12] “Umicore and BASF enter into a patent cross-license agreement.” https://www.umicore.com/en/newsroom/umicore-and-basf-enter-into-a-patent-cross-license-agreement/ (accessed Jul. 02, 2021).
[13] European Commission. Joint Research Centre., Lithium ion battery value chain and related opportunities for Europe. LU: Publications Office, 2016. Accessed: Jul. 02, 2021. [Online]. Available: https://data.europa.eu/doi/10.2760/601635
[14] Transport & Environment, “From dirty oil to clean batteries,” 2021. [15] FEBIAC, “Automotive Pocket Guide België,” 2021.

60
[16] “Volvo Car Gent - Volvo Cars opent nieuwe batterijfabriek in Gentse productievestiging,” Volvo Car Gent. https://www.volvocargent.be/nieuws/volvo-cars-opent-nieuwe-batterijfabriek-in-gentse-productievestiging (accessed Jul. 05, 2021).
[17] “Analyse van de Belgische automarkt in 2020.” https://www.febiac.be/public/pressreleases.aspx?ID=1323&lang=NL (accessed Jul. 05, 2021).
[18] Z. Demir, “Schriftelijke vraag Subsidie Thuisbatterijen.” 2021. [19] “Premie voor de aankoop of leasing van een thuisbatterij voor zelf…,”
www.vlaanderen.be. https://www.vlaanderen.be/premie-voor-de-aankoop-of-leasing-van-een-thuisbatterij-voor-zelf-opgewekte-energie (accessed Jul. 05, 2021).
[20] “ENGIE en Umicore zorgen voor primeur in België: 48 batterijen van elektrische wagens vormen ‘second life’ batterijsysteem op de site van Umicore in Olen,” ENGIE. https://corporate.engie.be/nl/press/release/engie-en-umicore-zorgen-voor-primeur-belgie-48-batterijen-van-elektrische-wagens (accessed Jul. 05, 2021).
[21] “Database of the European energy storage technologies and facilities - Data Europa EU.” https://data.europa.eu/data/datasets/database-of-the-european-energy-storage-technologies-and-facilities?locale=en (accessed Jul. 05, 2021).
[22] Vlaamse Regering, “Milieubeleidsovereenkomst betreffende de aanvaardingsplicht voor afgedankte batterijen en accu’s.” 2018. Accessed: Jul. 05, 2021. [Online]. Available: https://cms.bebat.be/sites/default/files/2019-03/MBO%20Vlaanderen%2015-06-2018.pdf
[23] Vlaamse Regering, “Milieubeleidsovereenkomst (mbo) over batterijen voor de aandrijving van hybride en elektrische voertuigen (HEV) voor het Vlaamse Gewest.” 2018. Accessed: Jul. 05, 2021. [Online]. Available: https://www.febelauto.be/public/MBO-Febelauto-BS-4-okt-2018.pdf
[24] “Jaarverslag 2020 | Febelauto,” Febelauto Jaarverslag 2020. https://www.febelauto.be/jaarverslag2020/nl (accessed Jul. 05, 2021).
[25] EU, Directive 2006/66/EC of the European Parliament and of the Council of 6 September 2006 on batteries and accumulators and waste batteries and accumulators and repealing Directive 91/157/EEC. 2006.
[26] “Watt4Ever : de energieopslagoplossing voor bedrijven.” https://watt4ever.be/nl/homepage/ (accessed Jul. 06, 2021).
[27] “Re2LiVe Project.” http://re2live.be/ (accessed Jul. 06, 2021). [28] OVAM, “Evaluatierapport 2018-2019 MBO HEV batterijen.pdf,” 2020. Accessed: Jul. 06,
2021. [Online]. Available: https://www.ovam.be/sites/default/files/atoms/files/Evaluatierapport%202018-2019%20MBO%20HEV%20batterijen.pdf
[29] European Commission, “Proposal for a REGULATION OF THE EUROPEAN PARLIAMENT AND OF THE COUNCIL concerning batteries and waste batteries, repealing Directive 2006/66/EC and amending Regulation (EU) No 2019/1020.” 2020.
[30] Y. Dams, A. Van der Linden, M. Vervaet, K. Smeets, L. Verlinden, and J. Wante, “Toekomstscenario’s van het Vlaamse voertuigenpark : effecten op klimaat en metaalvoorraden,” 2020. Accessed: Jul. 07, 2021. [Online]. Available: https://www.ovam.be/sites/default/files/atoms/files/Rapport%20Toekomstscenario%20s%20van%20het%20Vlaams%20voertuigenpark%20-%20Effecten%20op%20klimaat%20en%20metaalvoorraden_0.pdf

61
[31] M. Christis and A. Vercalsteren, “Impact of Circular Economy on achieving the climate targets: case mobility,” 6, 2019.
[32] IRENA, “Electricity Storage and Renewables: Costs and Markets to 2030,” International Renewable Energy Agency, 2017.
[33] Z. Demir, “Visienota Zonneplan 2025.” 2020. Accessed: Jul. 07, 2021. [Online]. Available: https://www.energiesparen.be/sites/default/files/atoms/files/Zonneplan2025.pdf
[34] M. L. Carvalho, A. Temporelli, and P. Girardi, “Life Cycle Assessment of Stationary Storage Systems within the Italian Electric Network,” Energies, vol. 14, no. 8, p. 2047, Apr. 2021, doi: 10.3390/en14082047.
[35] Y. Meihan, X. Siqin, and M. Xiaoming, “Life-cycle environmental and economic assessment of electric vehicle lithium-ion batteries using different recycling methods in a closed loop supply chain,” 2019. Accessed: Jul. 09, 2021. [Online]. Available: http://uest.ntua.gr/heraklion2019/proceedings/pdf/HERAKLION2019_Meihan_etal.pdf
[36] VEKA, “Energiekaart,” 2021. https://www.energiesparen.be/energiekaart (accessed Jul. 08, 2021).
[37] European Commission. Joint Research Centre., Li-ion batteries for mobility and stationary storage applications: scenarios for costs and market growth. LU: Publications Office, 2018. Accessed: Jun. 29, 2021. [Online]. Available: https://data.europa.eu/doi/10.2760/87175
[38] “London Metal Exchange: Metals.” https://www.lme.com/en-GB/Metals (accessed Jul. 08, 2021).
[39] “Industrial Minerals.” https://www.indmin.com/Article/3991540/Graphite/GLOBAL-GRAPHITE-SNAPSHOT-Tight-supply-supports-large-flake-cif-Europe-prices.html (accessed Jul. 08, 2021).

ce-center.be
CIRCULAR ECONOMYPOLICY RESEARCHCENTRE
OVAMWE MAKE
TOMORROWB E AU T I FU L
DEPARTMENT OFECONOMYSCIENCE &INNOVATIONOVAM
WE MAKETOMORROWB E AU T I FU L
DEPARTMENT OFECONOMYSCIENCE &INNOVATION
CIRCULAR ECONOMYPOLICY RESEARCHCENTRE
CE CENTER
Disclaimer:This publication reflects the views only of the authors, and the Flemish Government cannot be heldresponsible for any use which may be made of the information contained therein.
Related Documents


