Sea Level Rise Potential Impact on Developing Countries Authors Susmita Dasgupta Benoit Laplante Craig Meisner David Wheeler Jianping Yan Development Research Group The World Bank

Welcome message from author
This document is posted to help you gain knowledge. Please leave a comment to let me know what you think about it! Share it to your friends and learn new things together.
Transcript
Sea Level RisePotential Impact on Developing Countries
Authors
Susmita DasguptaBenoit Laplante Craig MeisnerDavid WheelerJianping Yan
Development Research GroupThe World Bank
Presentation Topics
1.Prospects for sea-level rise
3. Illustrative Cases
2.Exposure Assessment: PopulationEconomic activityAgricultureUrban areaEnvironment

IPCC Forecast (2000)
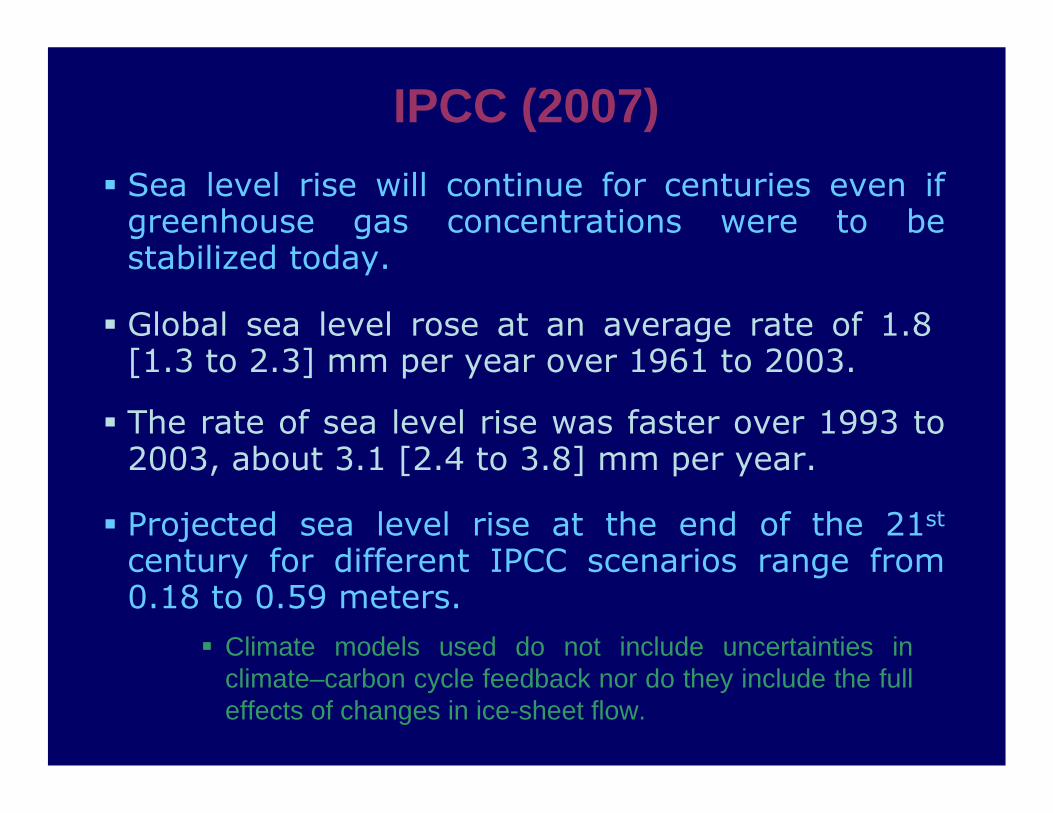
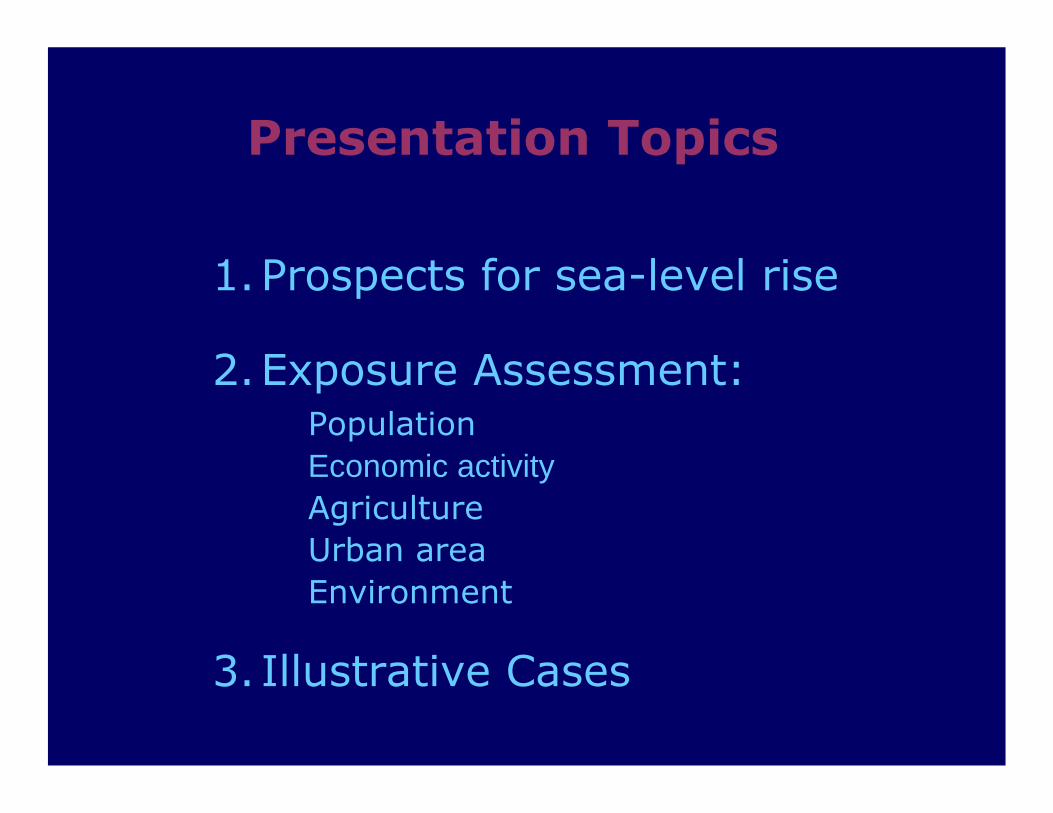
IPCC (2007)
Sea level rise will continue for centuries even if greenhouse gas concentrations were to be stabilized today.
Global sea level rose at an average rate of 1.8 [1.3 to 2.3] mm per year over 1961 to 2003.
The rate of sea level rise was faster over 1993 to 2003, about 3.1 [2.4 to 3.8] mm per year.
Projected sea level rise at the end of the 21st
century for different IPCC scenarios range from 0.18 to 0.59 meters.
Climate models used do not include uncertainties in climate–carbon cycle feedback nor do they include the full effects of changes in ice-sheet flow.

Recent Scientific Evidence
Since 1990 the sea level has been rising faster than projected by climate models.
The satellite data show a linear trend of 3.3mm/year (1993-2006), while the IPCC:2001 projected a best estimate rise of less than 2mm/year.
- Rahmstorf et al., Science Express, February 2007
In 2100 sea level is projected to rise 0.5m to 1.4m above the 1990 level.
This projection has applied a proportionality constant of 3.4mm/year/°c (a good approximation from the changes in the 20th century) to the future warming scenarios of the IPCC.
- Rahmstorf et al., Science, January 2007
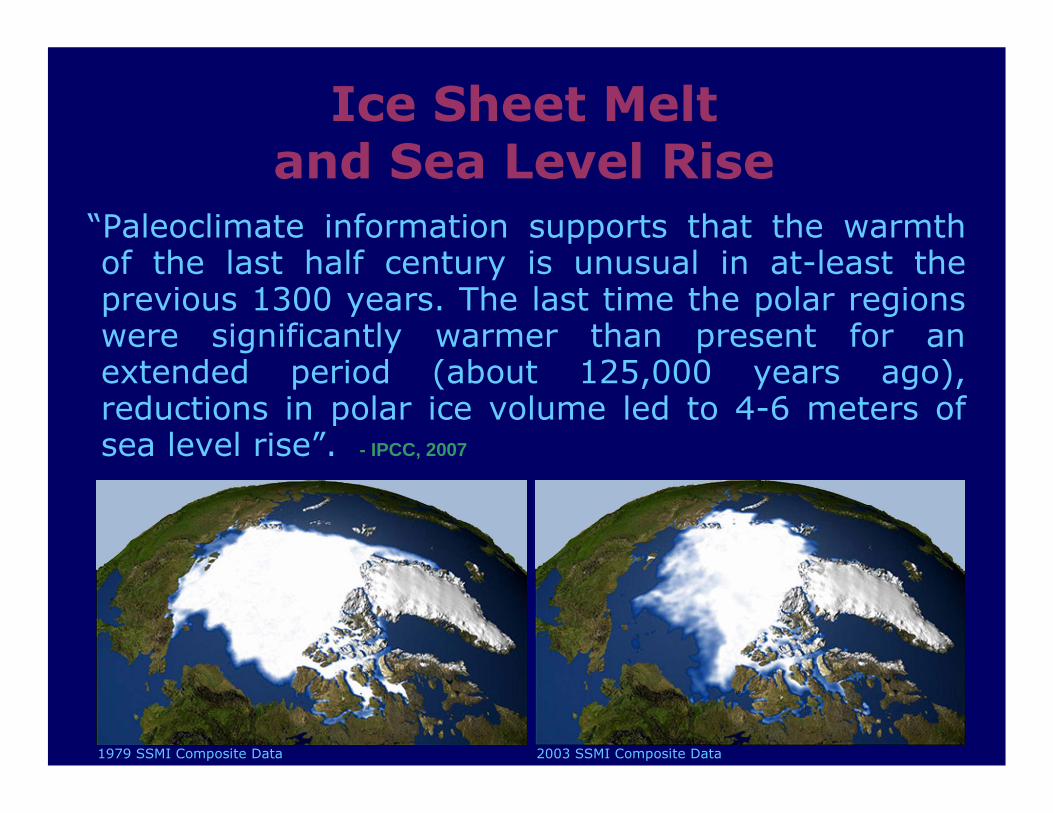
“Paleoclimate information supports that the warmth of the last half century is unusual in at-least the previous 1300 years. The last time the polar regions were significantly warmer than present for an extended period (about 125,000 years ago), reductions in polar ice volume led to 4-6 meters of sea level rise”. - IPCC, 2007
Ice Sheet Meltand Sea Level Rise
1979 SSMI Composite Data 2003 SSMI Composite Data

Greenland Ice Sheet and Sea Level RiseThe Greenland ice cap is disintegrating far faster than previously predicted.
Surface melt on Greenland due to global warming is going into moulins, vertical shafts carrying water to ice sheet base, lubricating the ground and increasing movement of ice down-slope to the ocean.Satellite measurements show that Greenland glaciers are moving at an accelerated rate – some 3 times faster than previously thought.Greenland is losing at least 200 km3 of ice per year.
The implication of rising sea levels could be dramatic: Greenland holds enough ice to raise global sea levels by 7 meters.- Hansen, J., 2005, 2006
Greenland is dumping twice as much ice into the sea as it was five years ago.
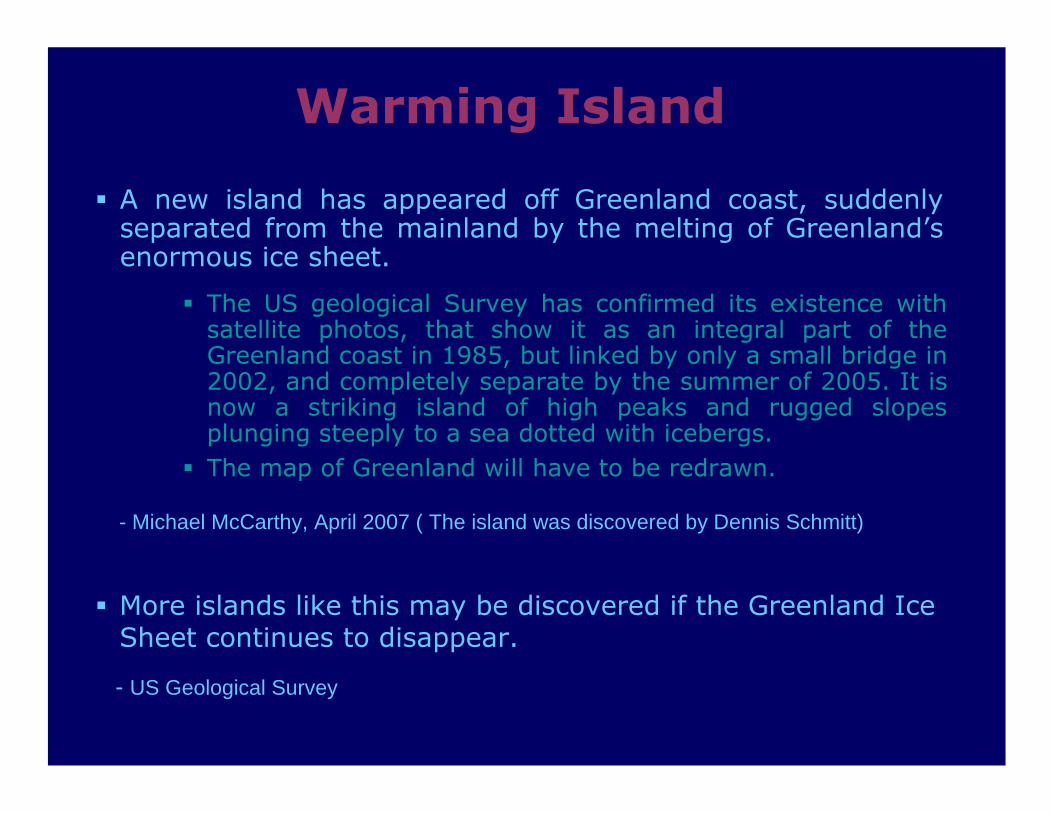
Warming Island
A new island has appeared off Greenland coast, suddenly separated from the mainland by the melting of Greenland’s enormous ice sheet.
More islands like this may be discovered if the Greenland Ice Sheet continues to disappear.
- US Geological Survey
The US geological Survey has confirmed its existence with satellite photos, that show it as an integral part of the Greenland coast in 1985, but linked by only a small bridge in 2002, and completely separate by the summer of 2005. It is now a striking island of high peaks and rugged slopes plunging steeply to a sea dotted with icebergs. The map of Greenland will have to be redrawn.
- Michael McCarthy, April 2007 ( The island was discovered by Dennis Schmitt)

West Antarctic Ice Sheet and Sea level Rise
Source: Science Express, March 2, 2006: Measurements of Time-Variable Gravity Show Mass Loss in Antarctica, Isabella Velicogna and John Wahr
Ice Mass Changes, 2002-2005
Melting instead of stable, as previously thought
Current Antarctic loss rate: 152 ± 80 km3 / yr.

Ice Sheet Melt: On the Edge
“Ice sheets have contributed meters above modern sea level in response to modest warming, with peak rates of sea level rise possibly exceeding 1m/ century. Current knowledge cannot rule out a return to such conditions in response to continued GHG emissions. Moreover, a threshold triggering many meters of sea level rise could be crossed well before the end of this century.”
- Overpeck et al., Science, March 2006
“It takes time for an ice sheet to be softened up for cataclysmic collapse, but once it starts it is unstoppable. Some scientists believe that it may take centuries for ice sheets to collapse, but others, including me, believe that business-as-usual fossil fuel use would cause sea level rise measured in meters this century” .
- Hansen, J., 2006

Global Warming: Increase in Storm Intensities
Thomas R. Knutson and Robert E. Tuleya at NOAA's Geophysical Fluid Dynamics Laboratory (GFDL) http://www.gfdl.noaa.gov/~tk/glob_warm_hurr.html

Global Warming: Increase in Storm Intensities
Thomas R. Knutson and Robert E. Tuleya at NOAA's Geophysical Fluid Dynamics Laboratory (GFDL) http://www.gfdl.noaa.gov/~tk/glob_warm_hurr.html
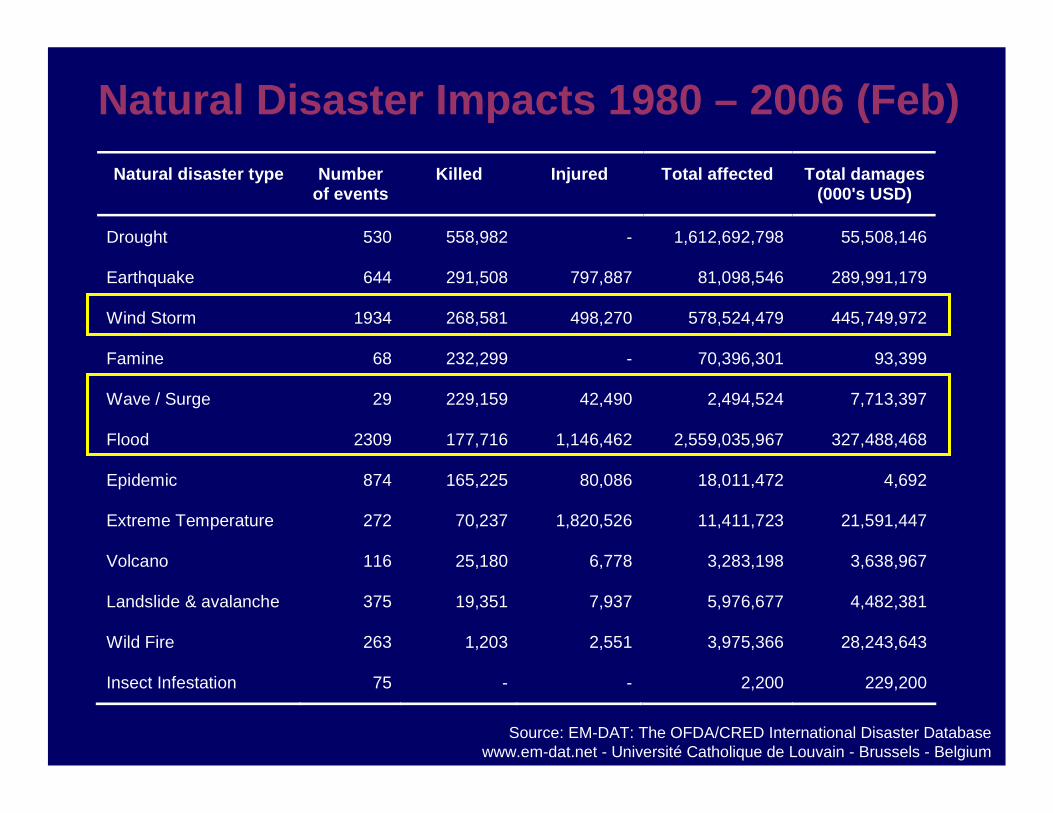
Source: EM-DAT: The OFDA/CRED International Disaster Database www.em-dat.net - Université Catholique de Louvain - Brussels - Belgium
Natural Disaster Impacts 1980 – 2006 (Feb)
Natural disaster type Number of events
Killed Injured Total affected Total damages (000's USD)
Drought 530 558,982 - 1,612,692,798 55,508,146
Earthquake 644 291,508 797,887 81,098,546 289,991,179
Wind Storm 1934 268,581 498,270 578,524,479 445,749,972
Famine 68 232,299 - 70,396,301 93,399
Wave / Surge 29 229,159 42,490 2,494,524 7,713,397
Flood 2309 177,716 1,146,462 2,559,035,967 327,488,468
Epidemic 874 165,225 80,086 18,011,472 4,692
Extreme Temperature 272 70,237 1,820,526 11,411,723 21,591,447
Volcano 116 25,180 6,778 3,283,198 3,638,967
Landslide & avalanche 375 19,351 7,937 5,976,677 4,482,381
Wild Fire 263 1,203 2,551 3,975,366 28,243,643
Insect Infestation 75 - - 2,200 229,200
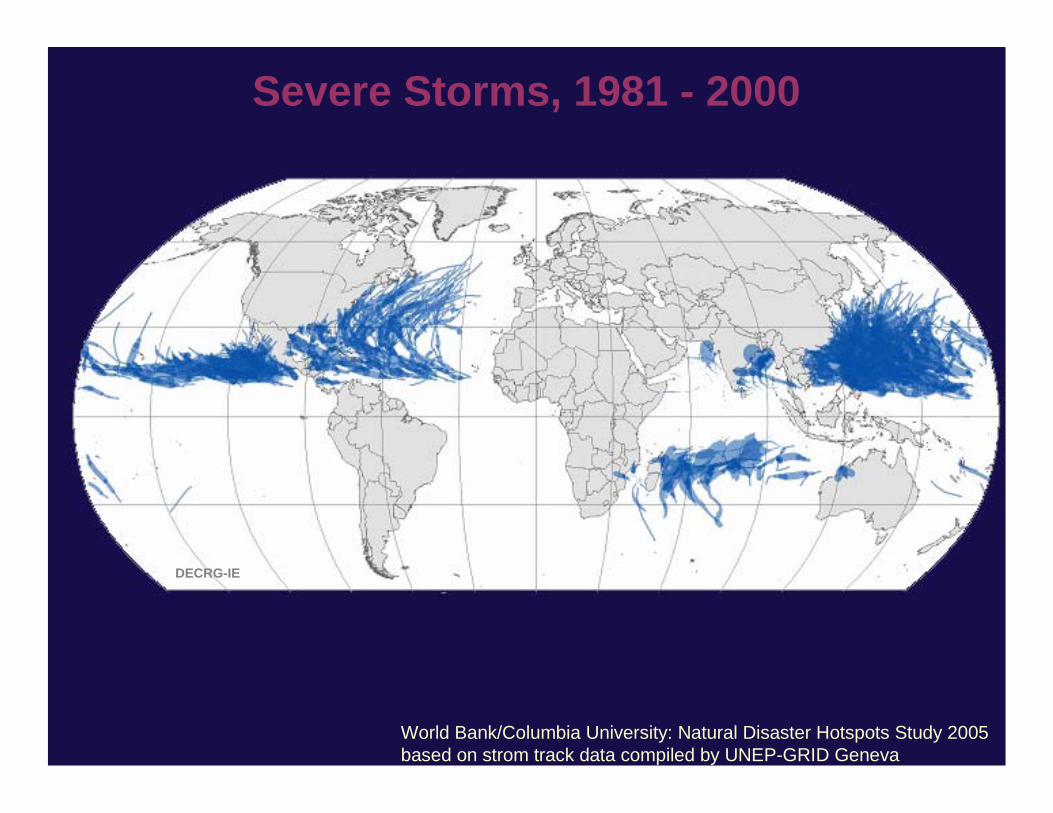
Severe Storms, 1981 - 2000
World Bank/Columbia University: Natural Disaster Hotspots Study 2005based on strom track data compiled by UNEP-GRID Geneva
DECRG-IE
Data Sources for estimating exposure:
• Elevation• Population and urban areas• GDP• Agricultural land• Environment: wetlands
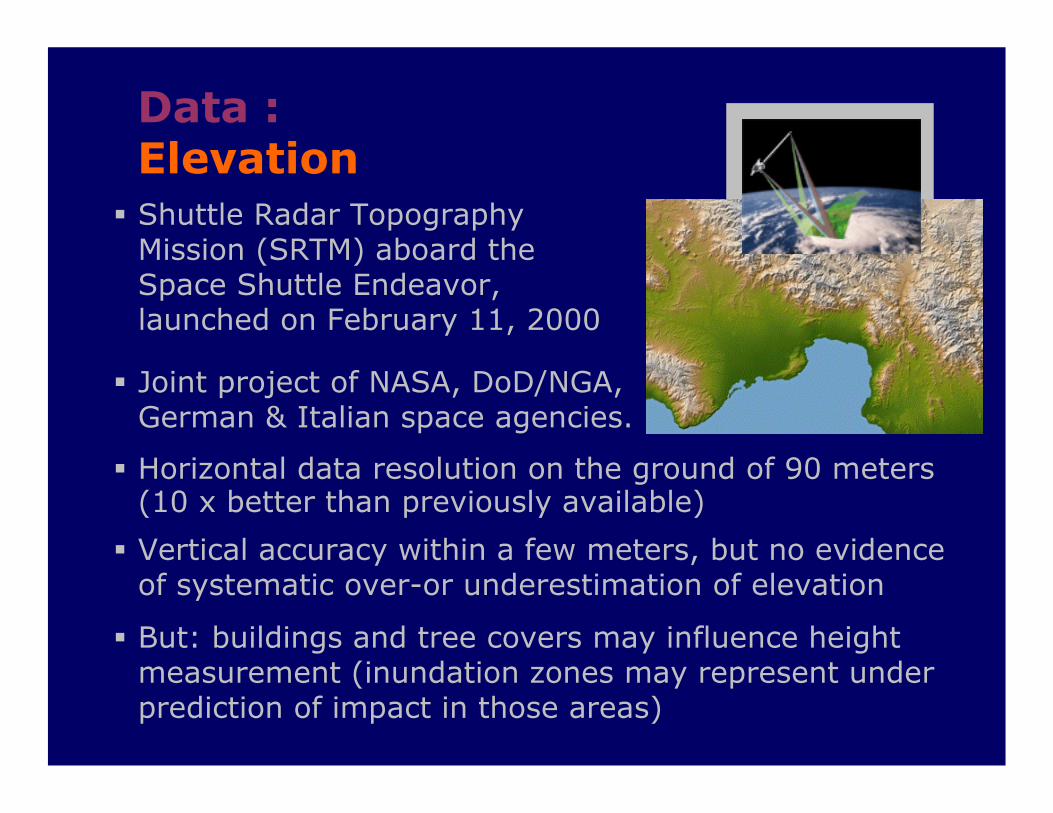
Data :ElevationShuttle Radar Topography Mission (SRTM) aboard the Space Shuttle Endeavor, launched on February 11, 2000
Horizontal data resolution on the ground of 90 meters (10 x better than previously available)
But: buildings and tree covers may influence height measurement (inundation zones may represent under prediction of impact in those areas)
Vertical accuracy within a few meters, but no evidence of systematic over-or underestimation of elevation
Joint project of NASA, DoD/NGA, German & Italian space agencies.
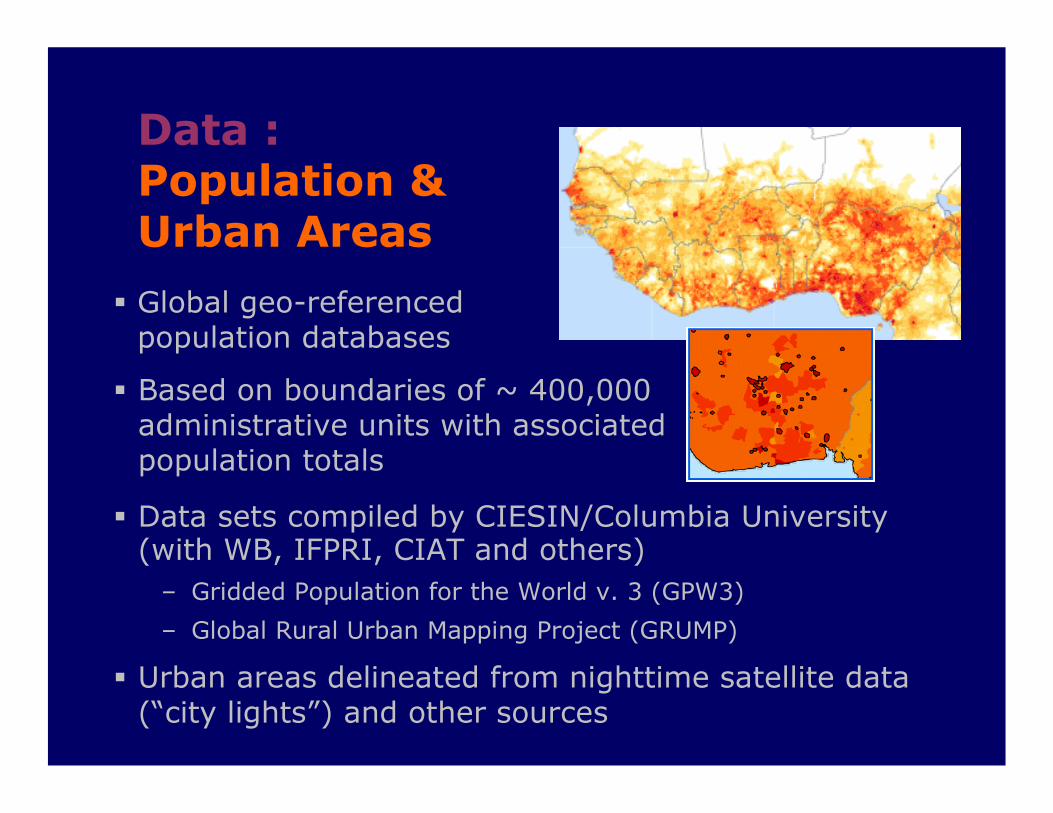
Data :Population & Urban Areas
Global geo-referenced population databases
Data sets compiled by CIESIN/Columbia University (with WB, IFPRI, CIAT and others)
– Gridded Population for the World v. 3 (GPW3)
– Global Rural Urban Mapping Project (GRUMP)
Urban areas delineated from nighttime satellite data (“city lights”) and other sources
Based on boundaries of ~ 400,000 administrative units with associated population totals

Data :GDPCompilation of subnational GDP where available, national totals everywhere else
Possible improvements: e.g., better/more subnational estimates, poverty maps
Total subnational GDP distributed on a per capita basis over population within administrative (or national) unit
Initially produced by DECRG for the World Bank/Columbia University Global Natural Disaster Hotspots Project
Subnational figures adjusted to match national WDI PPP figures
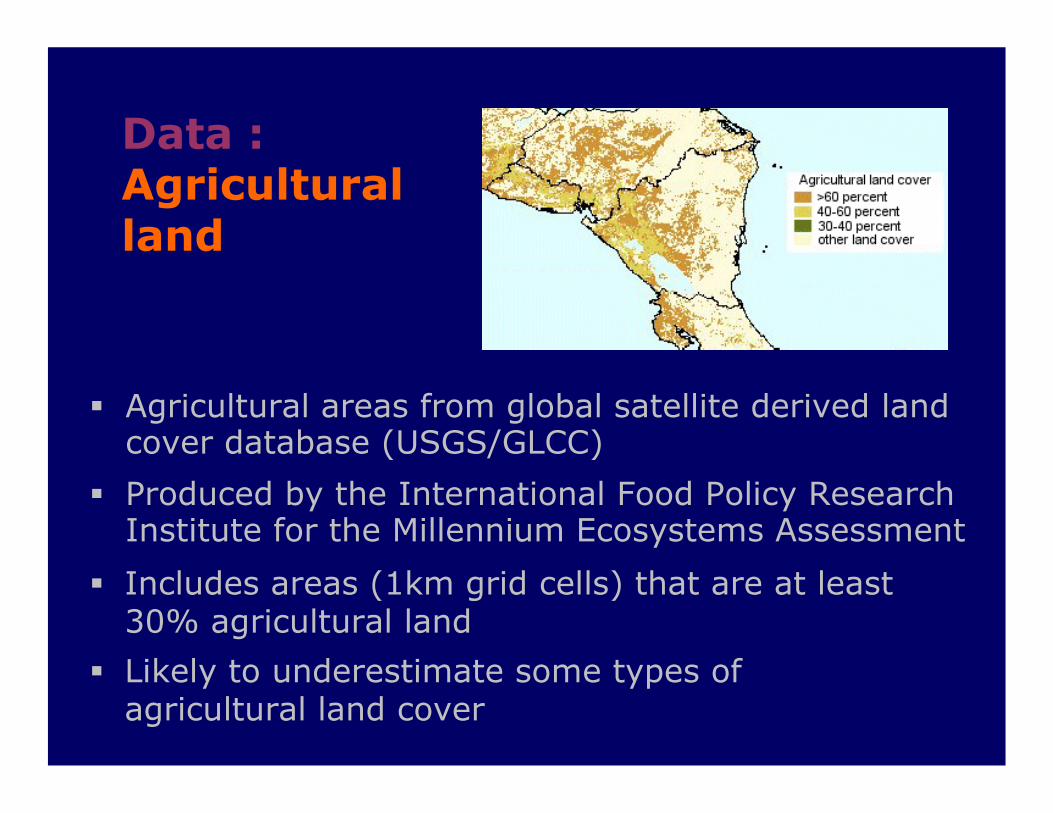
Data :Agricultural land
Produced by the International Food Policy Research Institute for the Millennium Ecosystems Assessment
Includes areas (1km grid cells) that are at least 30% agricultural land
Likely to underestimate some types ofagricultural land cover
Agricultural areas from global satellite derived land cover database (USGS/GLCC)
Data :Wetlands
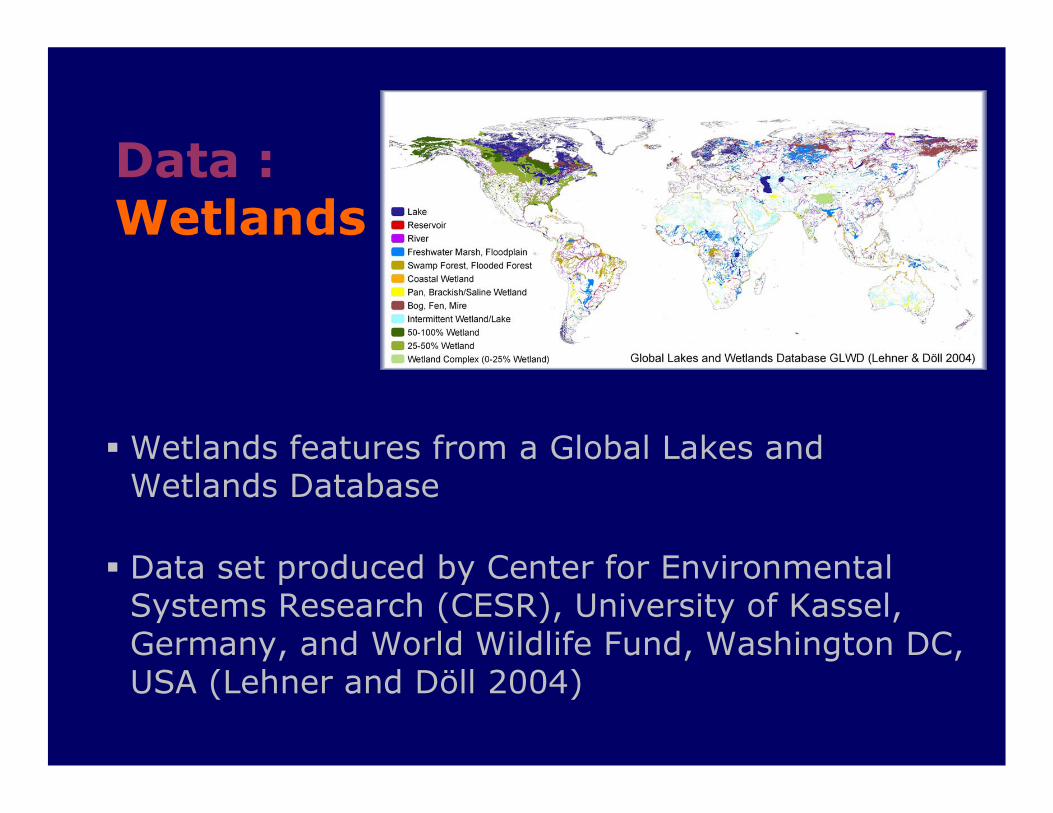
Wetlands features from a Global Lakes and Wetlands Database
Data set produced by Center for Environmental Systems Research (CESR), University of Kassel, Germany, and World Wildlife Fund, Washington DC, USA (Lehner and Döll 2004)
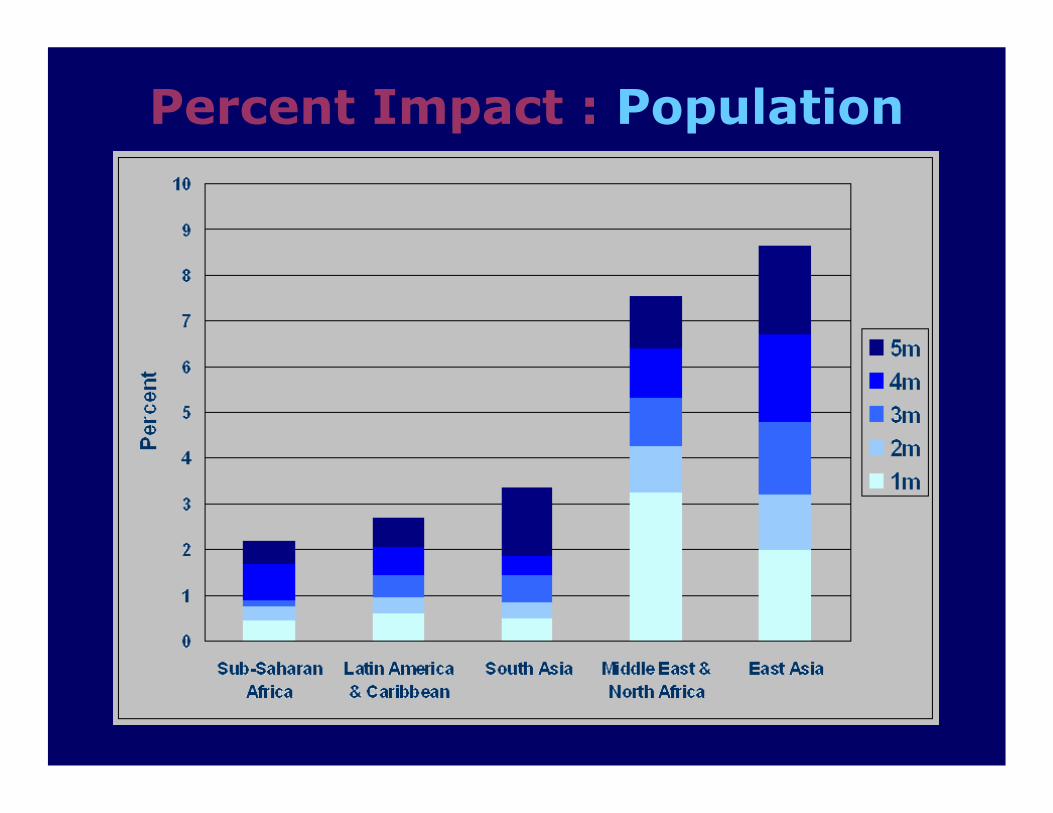
Percent Impact : Population

Percent Impact : GDP

Percent Impact : Agricultural Land

Percent Impact : Urban Areas

Percent Impact : Population
0
0.5
1
1.5
2
2.5
3
3.5
South Asia Sub-SaharanAfrica
LatinAmerica &Caribbean
East Asia Middle East& NorthAfrica
Per
cen
t1 Meter Sea Level Rise1 Meter Sea Level Rise
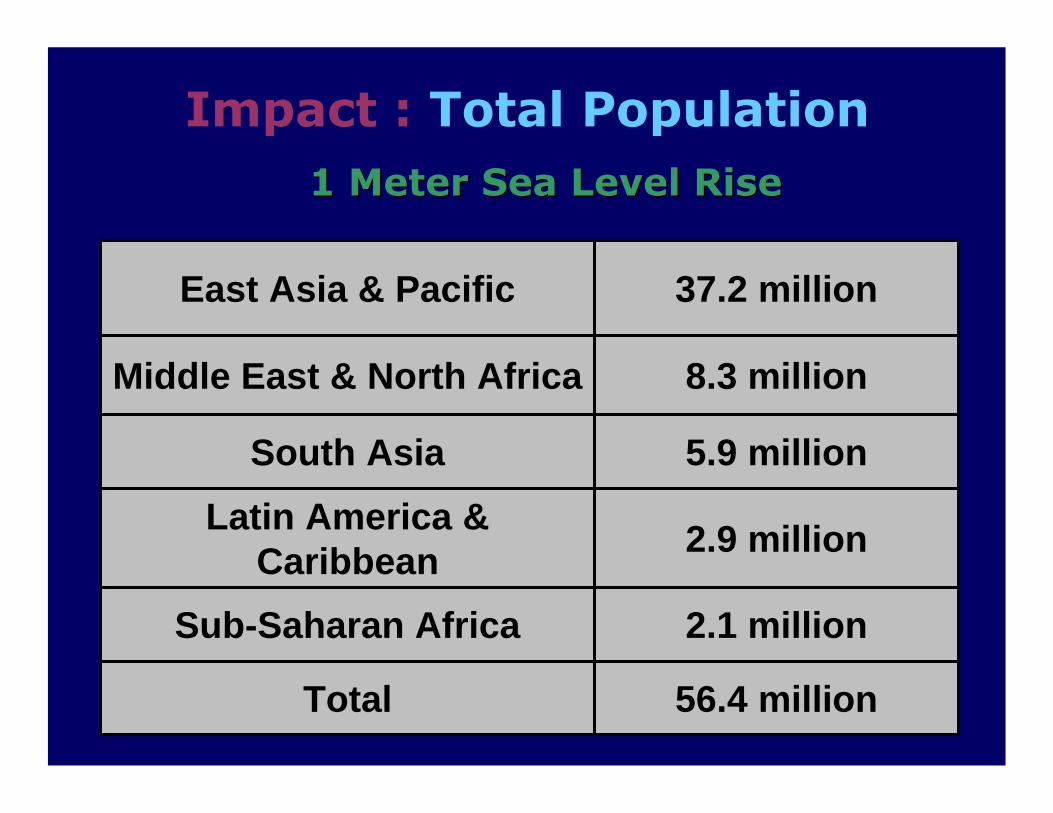
Impact : Total Population
56.4 millionTotal
2.1 millionSub-Saharan Africa
2.9 millionLatin America &
Caribbean
5.9 millionSouth Asia
8.3 millionMiddle East & North Africa
37.2 millionEast Asia & Pacific
1 Meter Sea Level Rise1 Meter Sea Level Rise

Percentage ImpactPercentage ImpactMiddle East & North Africa: PopulationMiddle East & North Africa: Population
0 1 2 3 4 5 6 7 8 9 10
Former Spanish Sahara
Algeria
I.R. Iran
Kuwait
Rep. of Yemen
Oman
Morocco
Qatar
Saudi Arabia
Libya
United Arab Emirates
Tunisia
A.R. Egypt
Percent
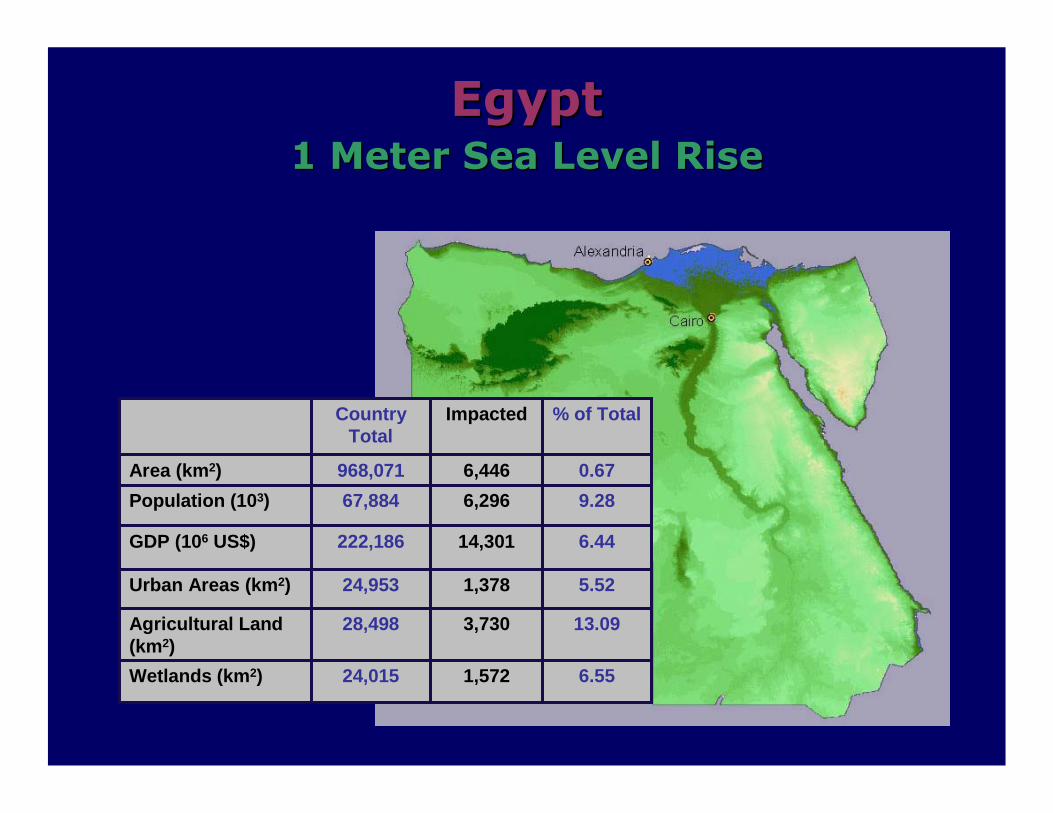
6.551,57224,015Wetlands (km2)
13.093,73028,498Agricultural Land (km2)
5.521,37824,953Urban Areas (km2)
6.4414,301222,186GDP (106 US$)
9.286,29667,884Population (103)
0.676,446968,071Area (km2)
% of TotalImpactedCountry Total
EgyptEgypt1 Meter Sea Level Rise1 Meter Sea Level Rise
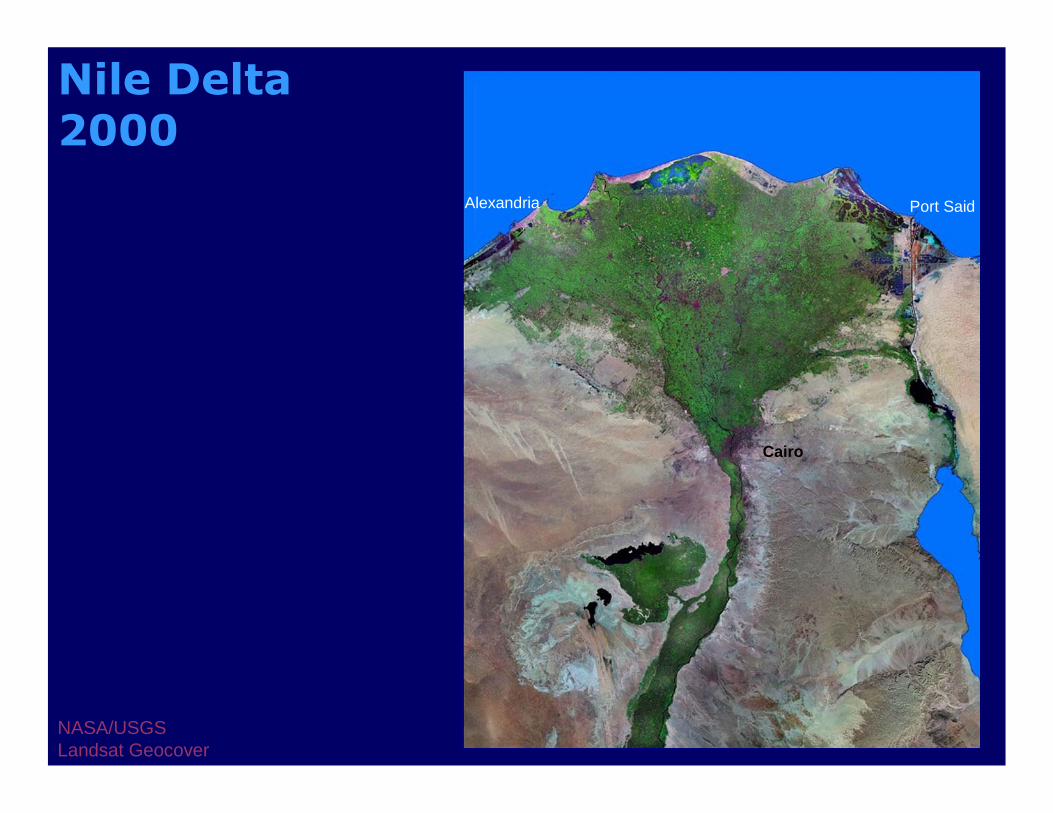
Cairo
Alexandria Port Said
NASA/USGSLandsat Geocover
Nile Delta2000
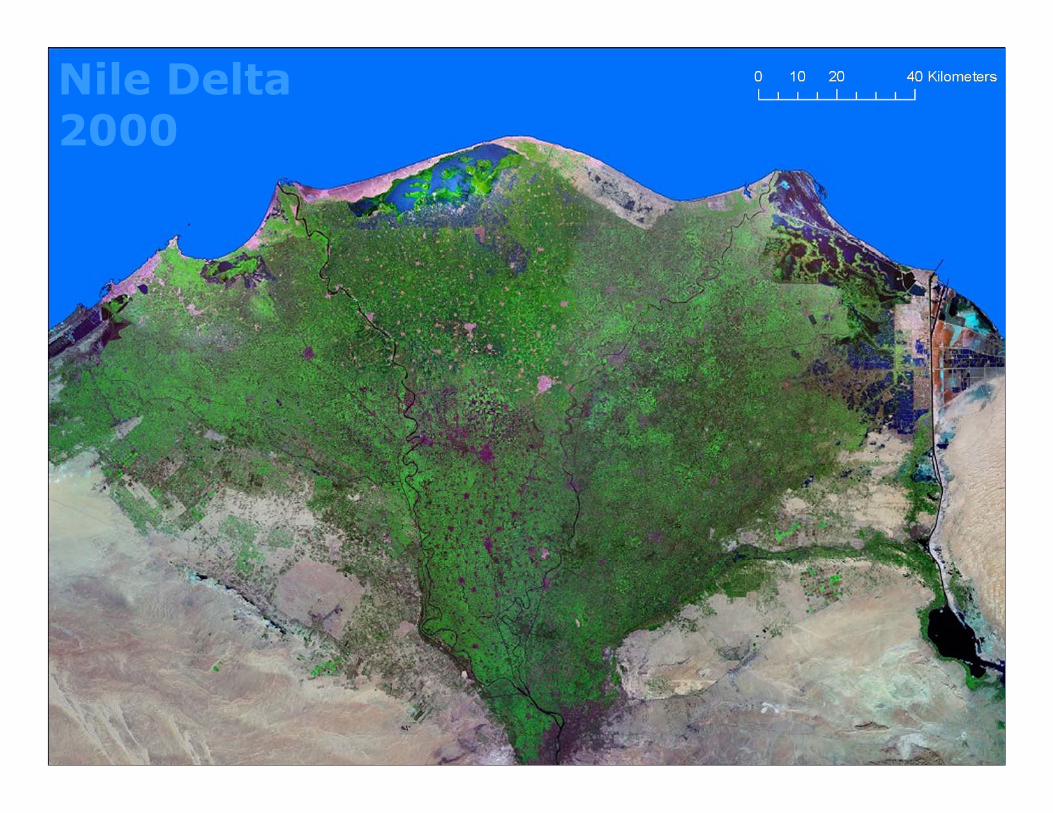
Nile Delta2000

Nile Delta1m Sea Level Rise
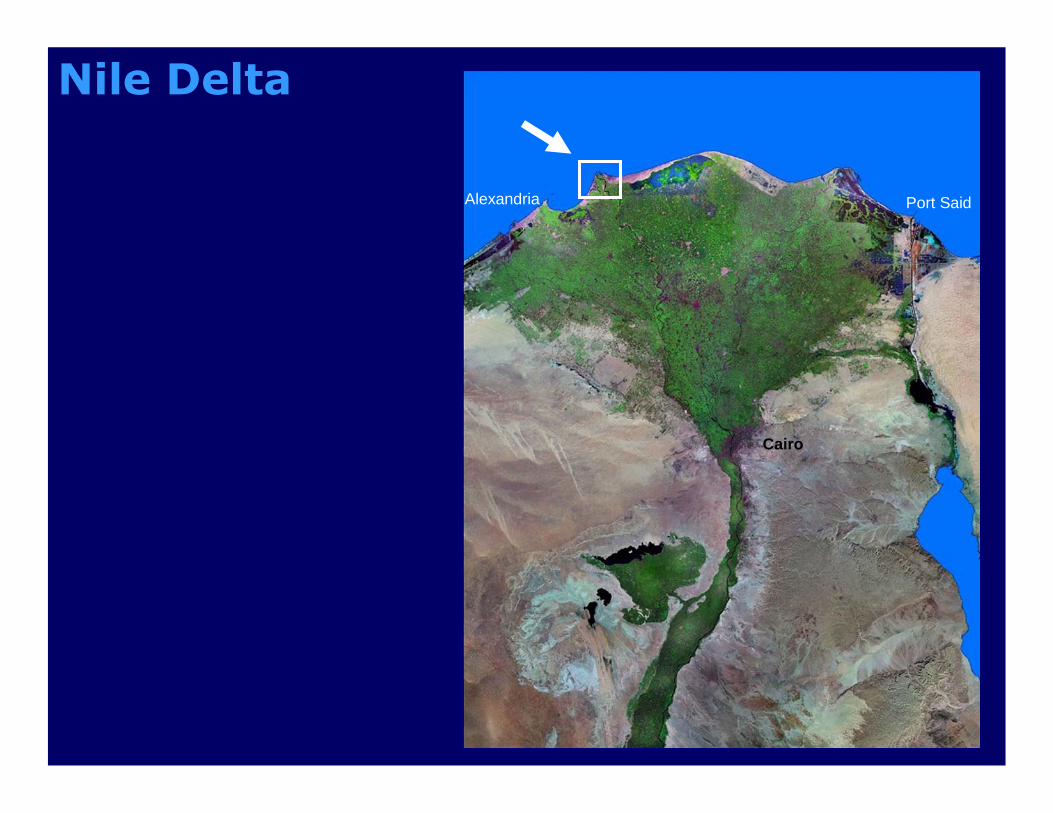
Cairo
Alexandria Port Said
Nile Delta
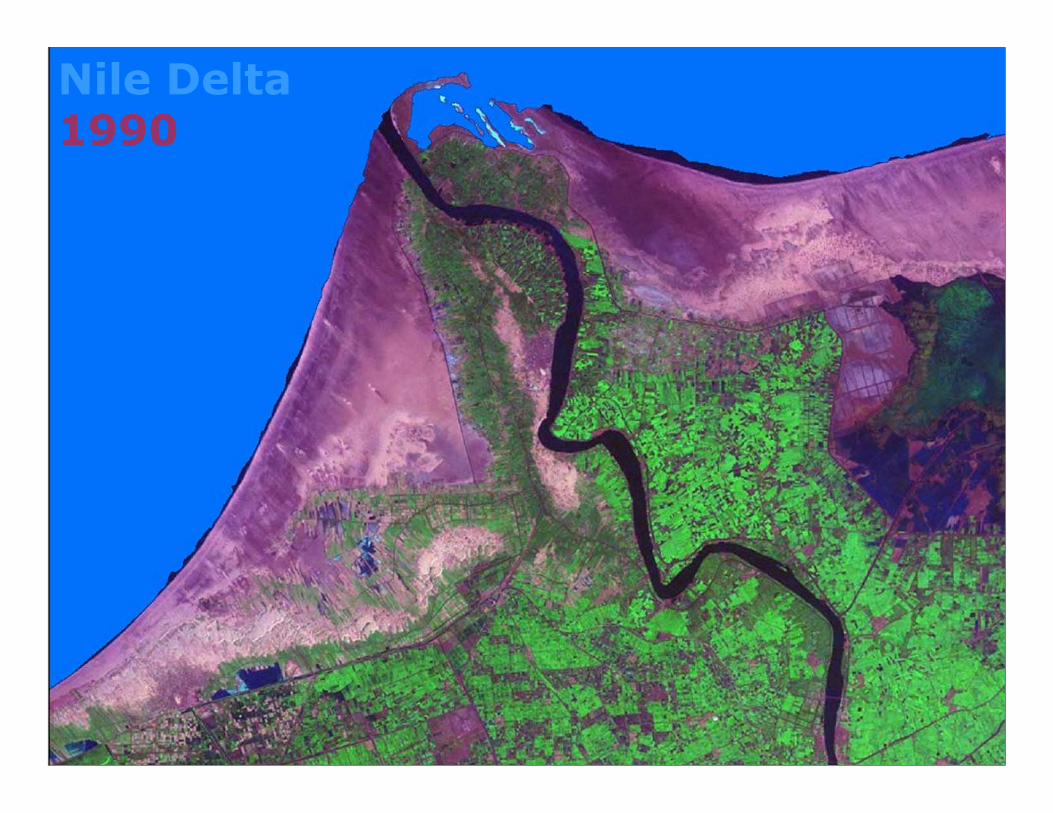
Nile Delta1990

Nile Delta2000

Nile Delta1m Sea Level Rise

10.188.726.55Wetlands (km2)
34.5024.9013.09Agricultural Land (km2)
11.588.725.52Urban Areas (km2)
16.3012.136.44GDP (106 US$)
20.8414.899.28Population (103)
1.581.160.67Area (km2)
5 meter3 meter1 meter
EgyptEgyptPercentage ImpactPercentage Impact

Nile Delta2000

Nile Delta3m Sea Level Rise
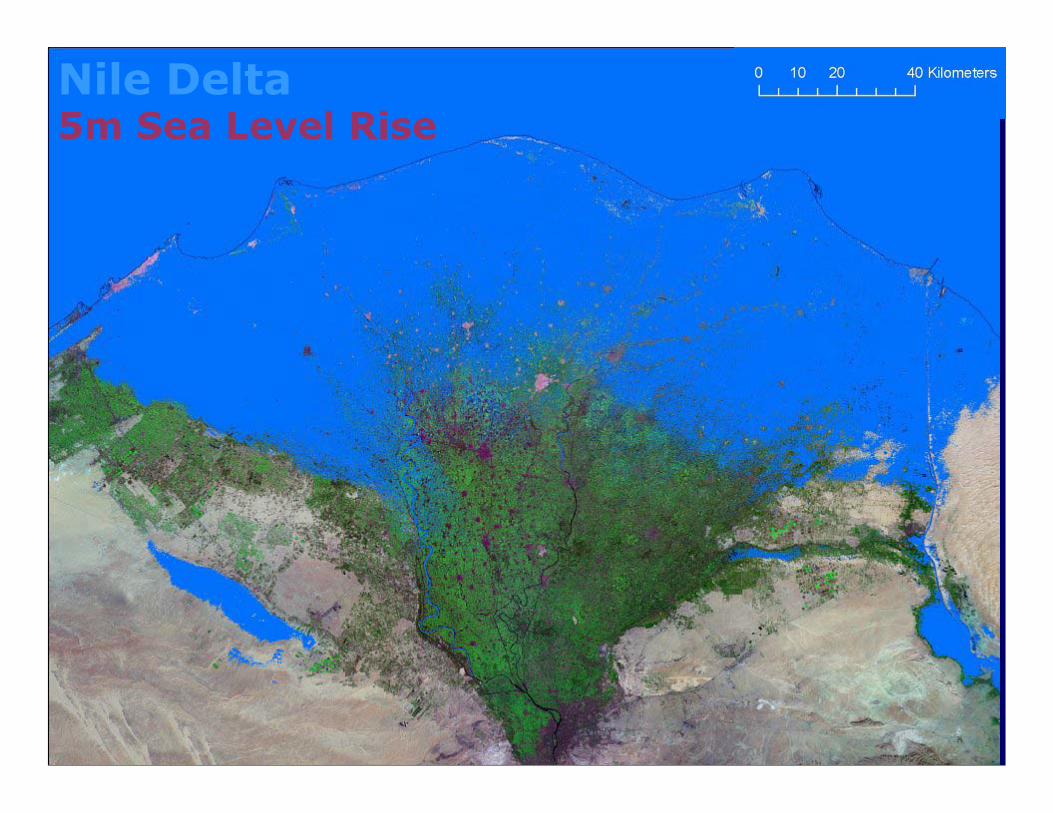
Nile Delta5m Sea Level Rise
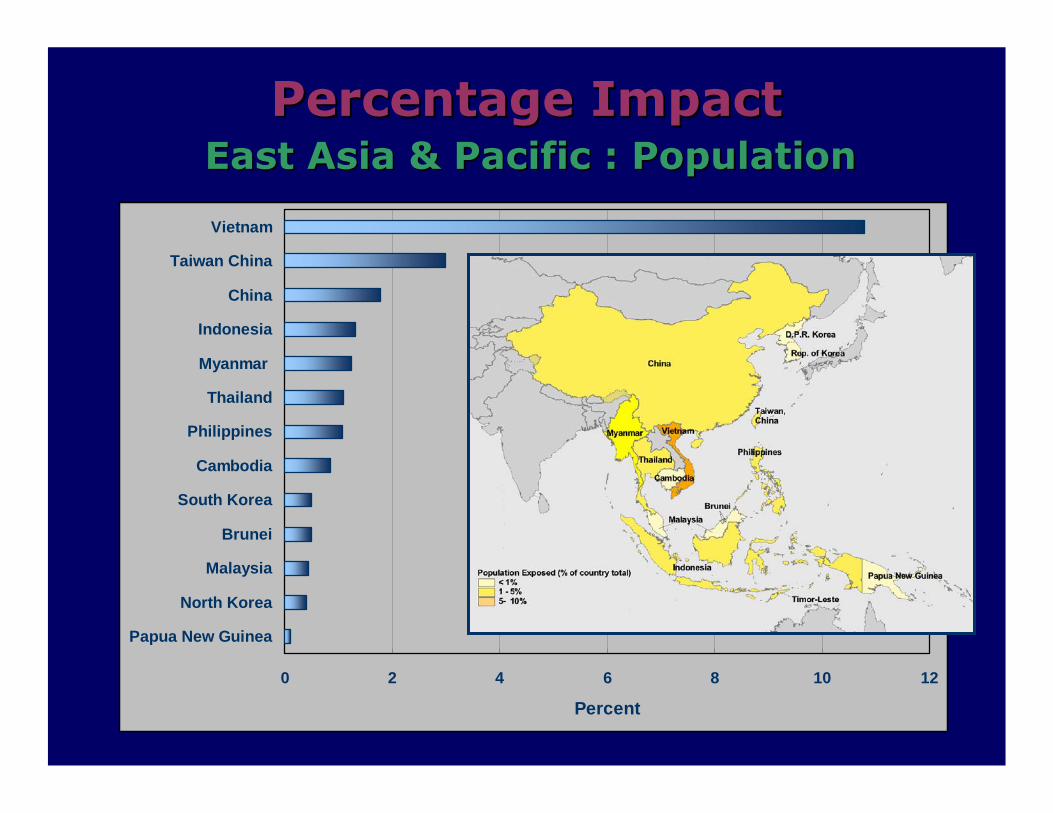
Percentage ImpactPercentage ImpactEast Asia & Pacific : PopulationEast Asia & Pacific : Population
0 2 4 6 8 10 12
Papua New Guinea
North Korea
Malaysia
Brunei
South Korea
Cambodia
Philippines
Thailand
Myanmar
Indonesia
China
Taiwan China
Vietnam
Percent

28.6713,24146,179Wetlands (km2)
7.1413,773192,816Agricultural Land (km2)
10.746345,904Urban Areas (km2)
10.2115,805154,787GDP (106 US$)
10.88,43778,137Population (103)
5.1716,977328,535Area (km2)
% of TotalImpactedCountry Total
VietnamVietnam1m Sea Level RiseAt Present

48.7822,52746,179Wetlands (km2)
12.2623,641192,816Agricultural Land (km2)
18.551,0955,904Urban Areas (km2)
16.4925,522154,787GDP (106 US$)
17.9614,03678,137Population (103)
8.5528,090328,535Area (km2)
% of TotalExposedCountry Total
VietnamVietnam2 Meter Sea Level Rise2 Meter Sea Level Rise
67.3331,09446,179Wetlands (km2)
17.1533,064192,816Agricultural Land (km2)
26.831,5845,904Urban Areas (km2)
24.1737,419154,787GDP (106 US$)
25.602,00378,137Population (103)
11.8328,860328,535Area (km2)
% of TotalExposedCountry Total
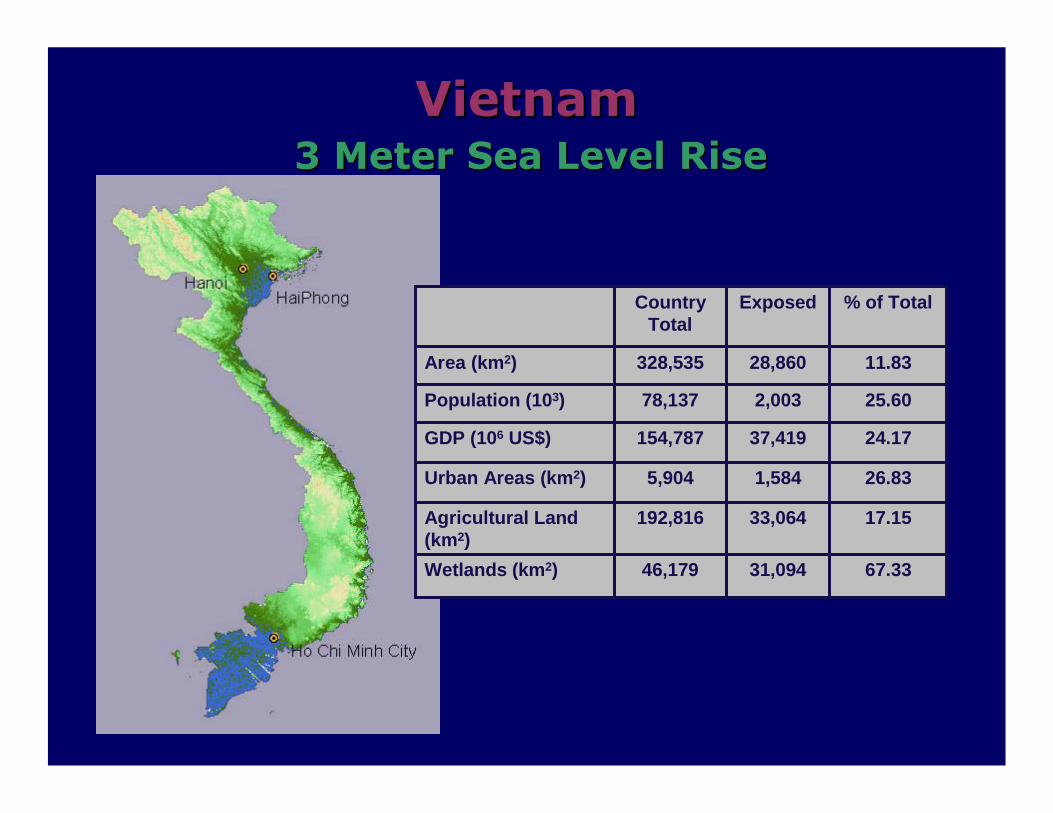
VietnamVietnam3 Meter Sea Level Rise3 Meter Sea Level Rise
79.7638,63146,179Wetlands (km2)
20.8540,207192,816Agricultural Land (km2)
34.652,0465,904Urban Areas (km2)
30.6947,509154,787GDP (106 US$)
32.4925,39078,137Population (103)
14.3347,080328,535Area (km2)
% of TotalExposedCountry Total
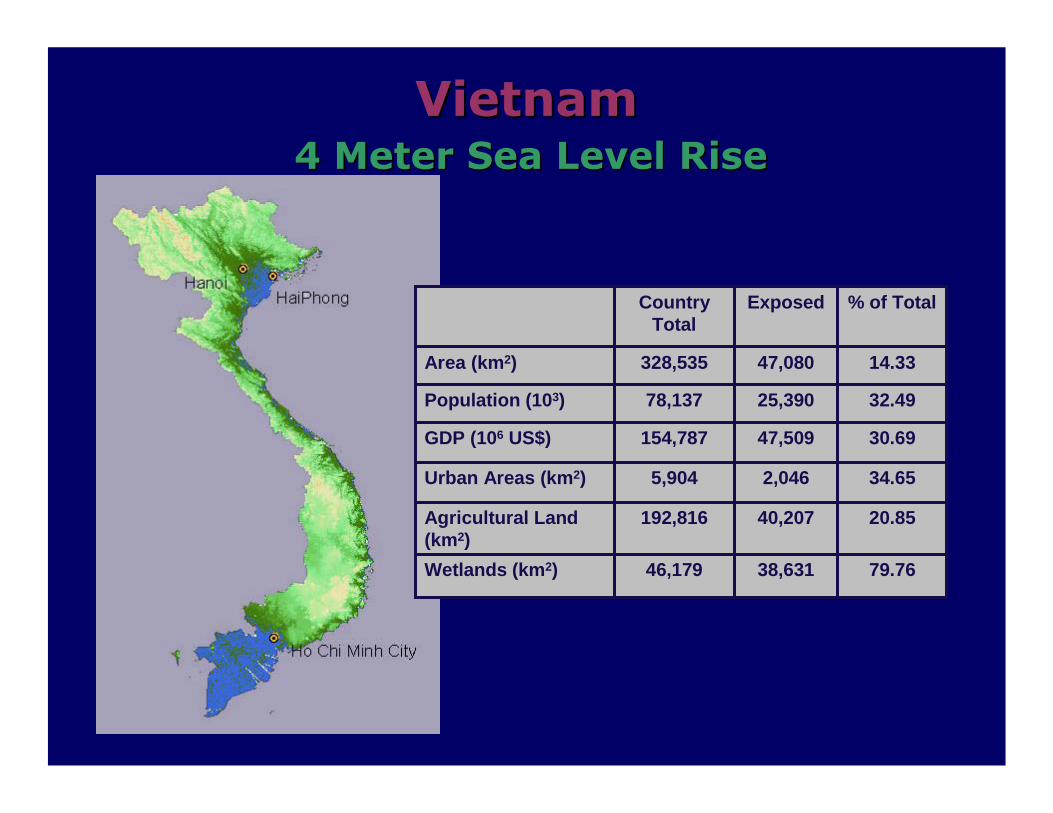
VietnamVietnam4 Meter Sea Level Rise4 Meter Sea Level Rise
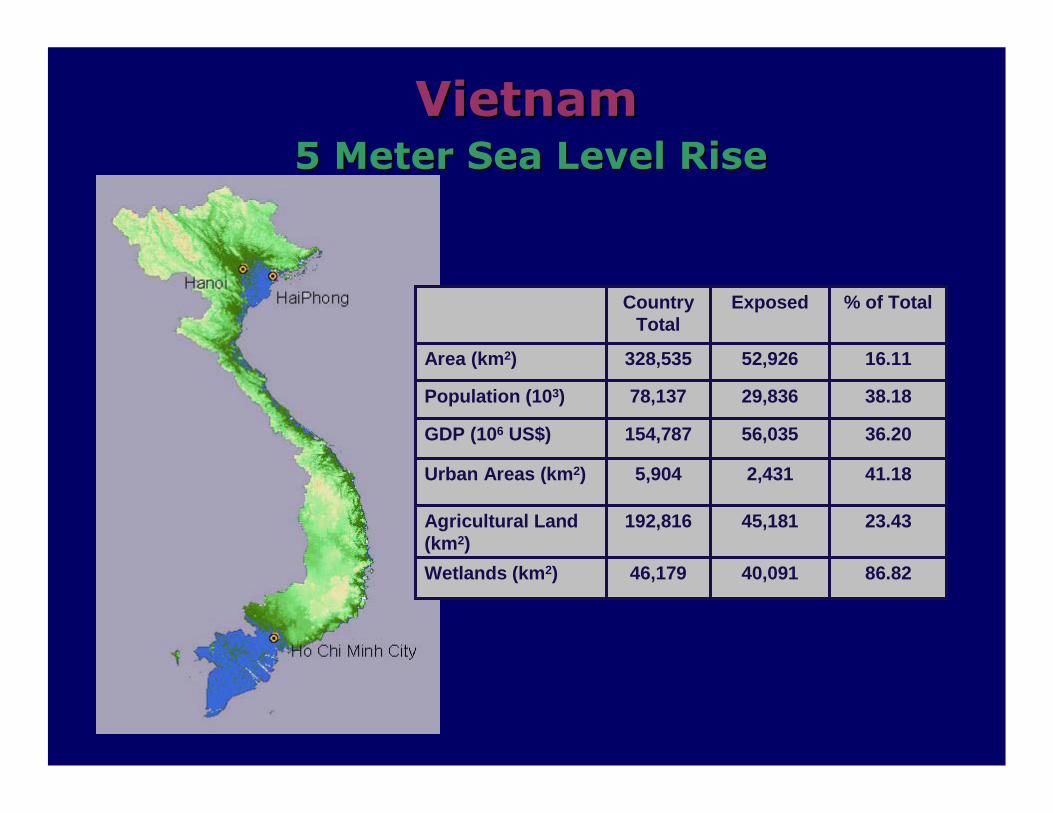
86.8240,09146,179Wetlands (km2)
23.4345,181192,816Agricultural Land (km2)
41.182,4315,904Urban Areas (km2)
36.2056,035154,787GDP (106 US$)
38.1829,83678,137Population (103)
16.1152,926328,535Area (km2)
% of TotalExposedCountry Total
VietnamVietnam5 Meter Sea Level Rise5 Meter Sea Level Rise
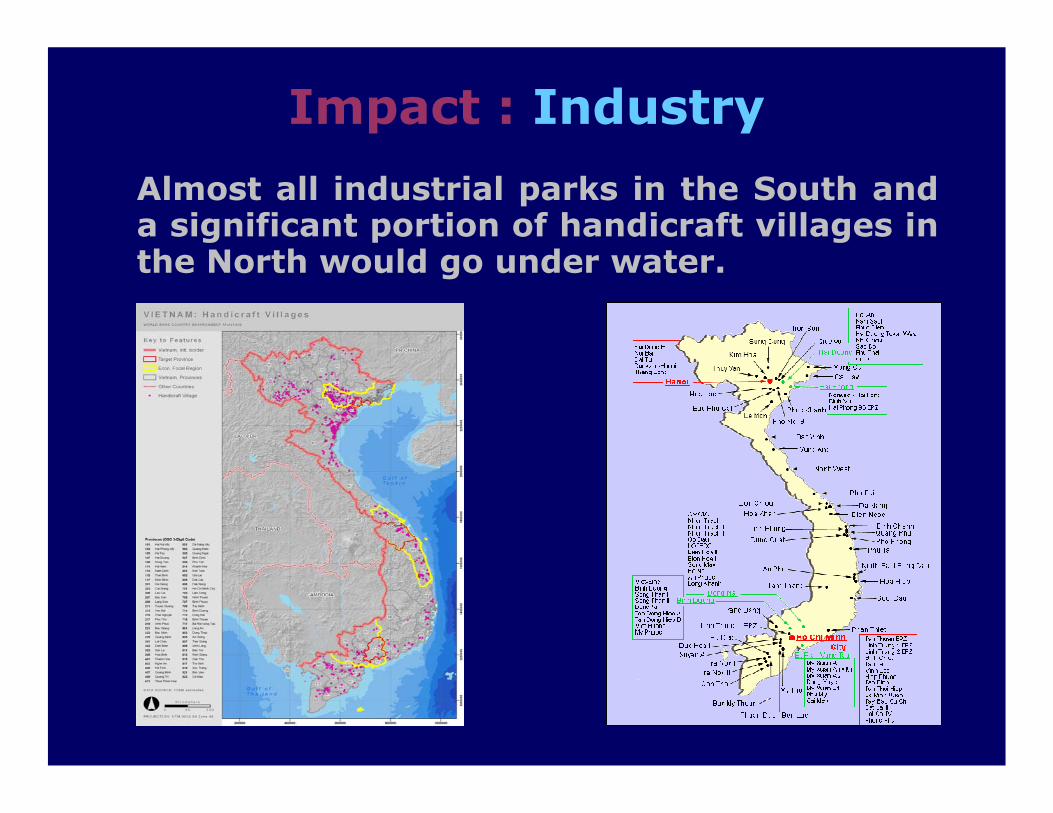
Impact : Industry
Almost all industrial parks in the South and a significant portion of handicraft villages in the North would go under water.

Percentage ImpactPercentage ImpactSouth Asia : PopulationSouth Asia : Population
0 0.2 0.4 0.6 0.8
Pakistan
India
Sri Lanka
Bangladesh
Percent
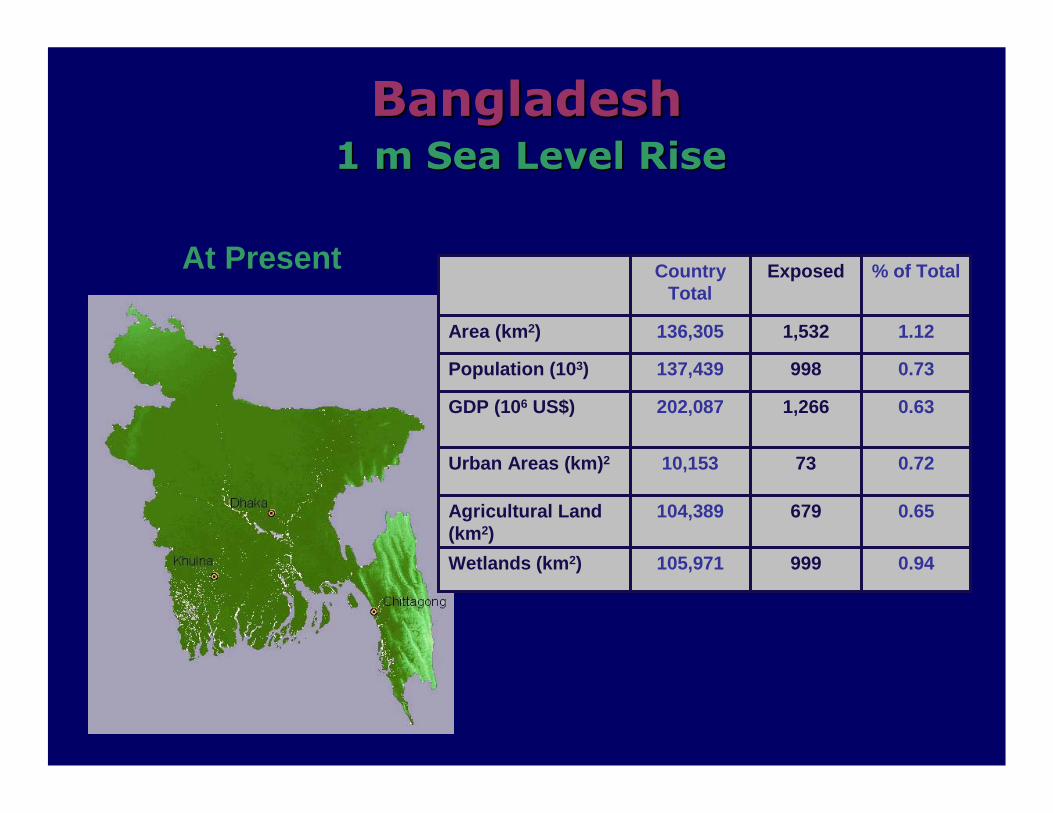
0.94999105,971Wetlands (km2)
0.65679104,389Agricultural Land (km2)
0.727310,153Urban Areas (km)2
0.631,266202,087GDP (106 US$)
0.73998137,439Population (103)
1.121,532136,305Area (km2)
% of TotalExposedCountry Total
BangladeshBangladesh1 m Sea Level Rise1 m Sea Level Rise
At Present

11.773.740.94Wetlands (km2)
10.033.330.65Agricultural Land (km2)
9.743.530.72Urban Areas (km2)
8.863.330.63GDP (106 US$)
9.143.140.73Population (103)
10.883.981.12Area (km2)
5 meter3 meter1 meter
BangladeshBangladeshPercent ImpactPercent Impact
5m Sea Level Rise
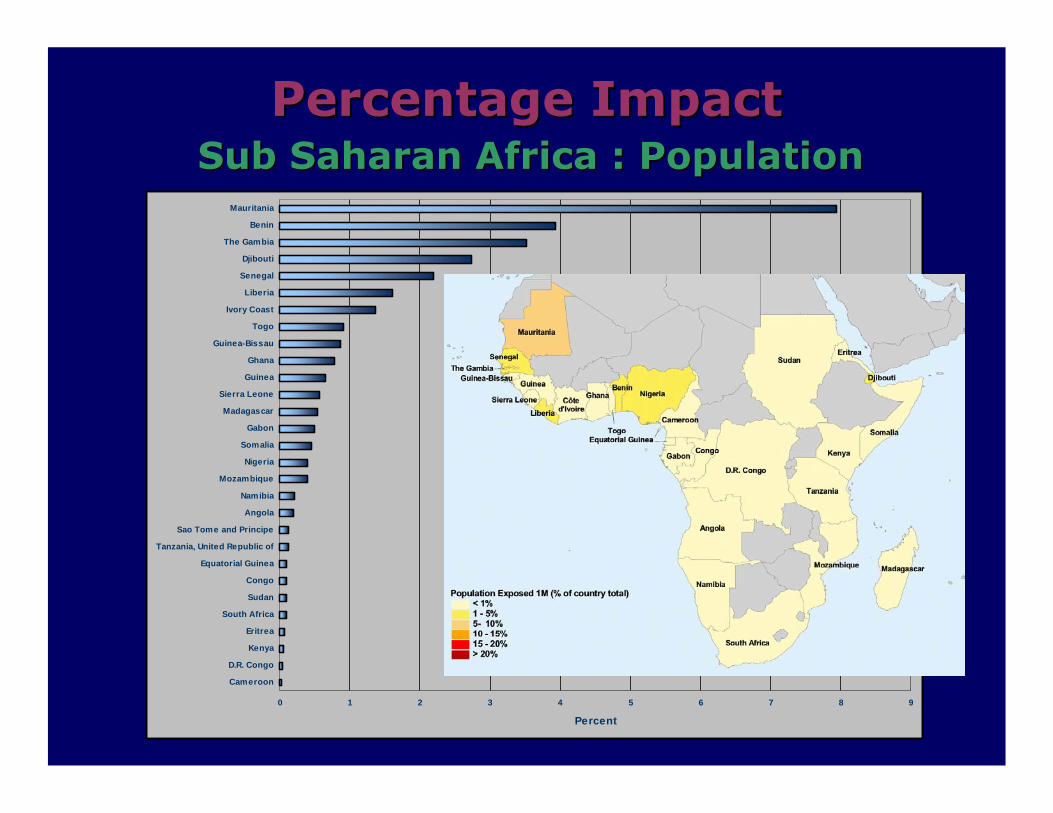
Percentage ImpactPercentage ImpactSub Saharan Africa : PopulationSub Saharan Africa : Population
0 1 2 3 4 5 6 7 8 9
Cameroon
D.R. Congo
Kenya
Eritrea
South Africa
Sudan
Congo
Equatorial Guinea
Tanzania, United Republic of
Sao Tome and Principe
Angola
Namibia
Mozambique
Nigeria
Somalia
Gabon
Madagascar
Sierra Leone
Guinea
Ghana
Guinea-Bissau
Togo
Ivory Coast
Liberia
Senegal
Djibouti
The Gambia
Benin
Mauritania
Percent
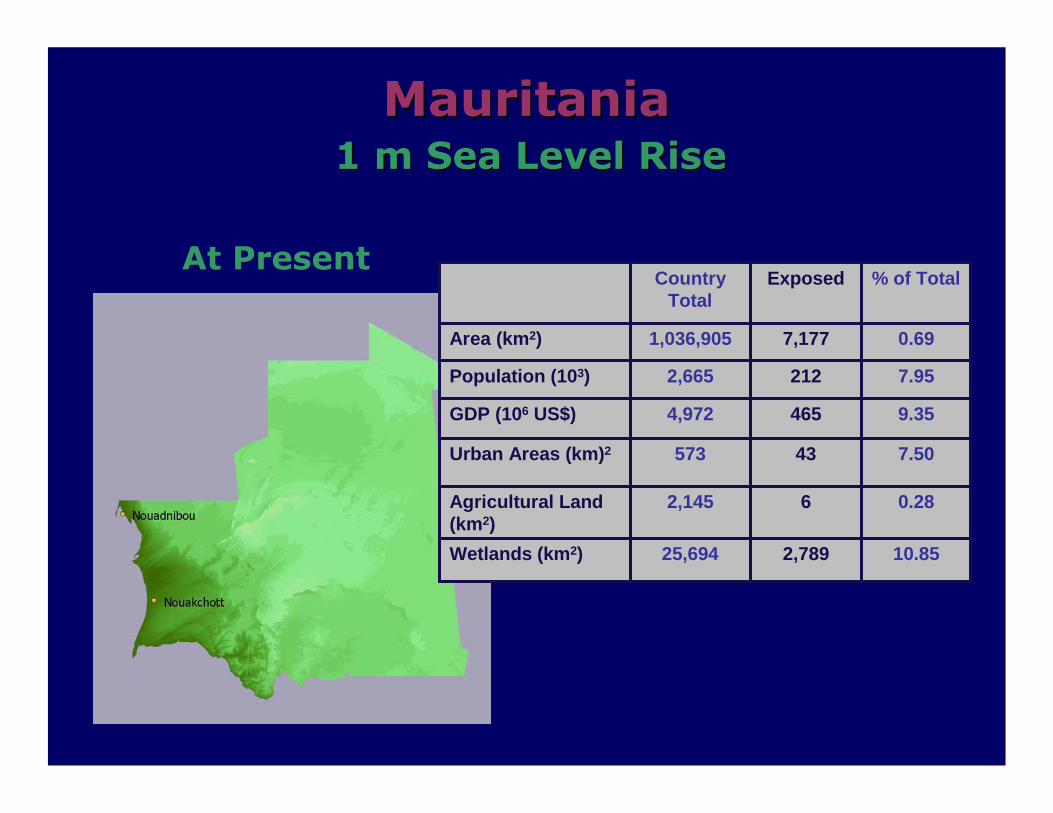
10.852,78925,694Wetlands (km2)
0.2862,145Agricultural Land (km2)
7.5043573Urban Areas (km)2
9.354654,972GDP (106 US$)
7.952122,665Population (103)
0.697,1771,036,905Area (km2)
% of TotalExposedCountry Total
MauritaniaMauritania1 m Sea Level Rise1 m Sea Level Rise
At Present
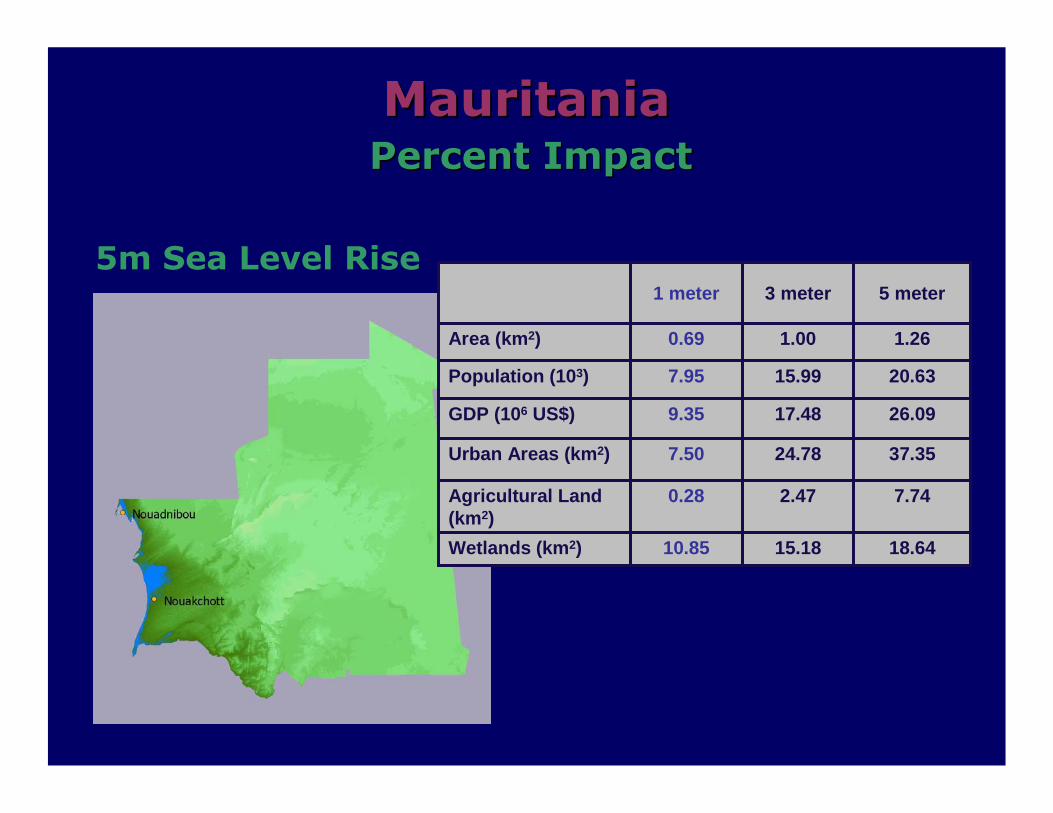
18.6415.1810.85Wetlands (km2)
7.742.470.28Agricultural Land (km2)
37.3524.787.50Urban Areas (km2)
26.0917.489.35GDP (106 US$)
20.6315.997.95Population (103)
1.261.000.69Area (km2)
5 meter3 meter1 meter
MauritaniaMauritaniaPercent ImpactPercent Impact
5m Sea Level Rise

Percentage ImpactPercentage ImpactLatin America & Caribbean : PopulationLatin America & Caribbean : Population
0 1 2 3 4 5 6 7 8
Guatemala
Honduras
Nicaragua
Costa Rica
Haiti
Peru
El Salvador
Chile
Dominican Republic
Colombia
Panama
Argentina
Mexico
Brazil
Cuba
Jamaica
R.B. de Venezuela
Ecuador
Belize
Uruguay
Puerto Rico
The Bahamas
French Guiana (Fr)
Guyana
Suriname
Percent

2.6961522,879Wetlands (km2)
5.603115,553Agricultural Land (km2)
4.2026619Urban Areas (km)2
6.35941,480GDP (106 US$)
7.0029.2417Population (103)
0.911,288141,133Area (km2)
% of TotalExposedCountry Total
SurinameSuriname1 m Sea Level Rise1 m Sea Level Rise
At Present

13.577.222.69Wetlands (km2)
23.7714.415.60Agricultural Land (km2)
47.8223.104.20Urban Areas (km2)
34.3219.806.35GDP (106 US$)
55.7630.677.00Population (103)
3.642.210.91Area (km2)
5 meter3 meter1 meter
SurinameSurinamePercent ImpactPercent Impact
5m Sea Level Rise
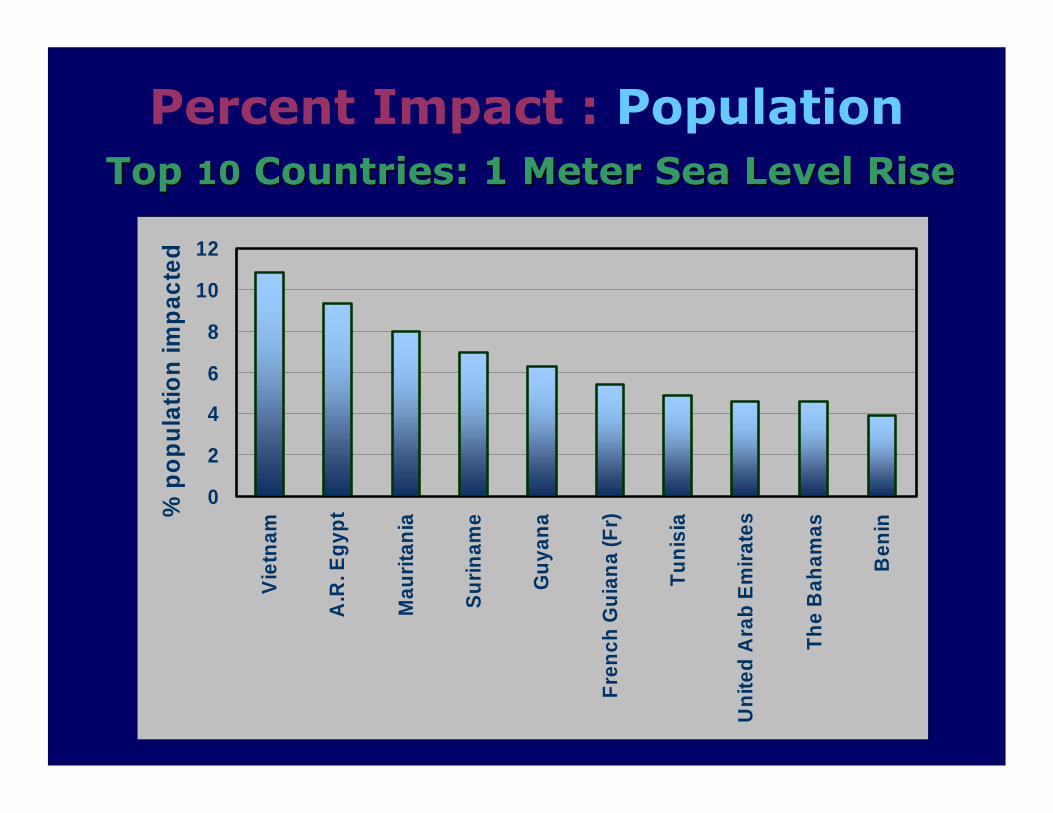
Percent Impact : PopulationTop Top 1010 Countries: 1 Meter Sea Level RiseCountries: 1 Meter Sea Level Rise
0
2
4
6
8
10
12V
ietn
am
A.R
. Eg
ypt
Mau
rita
nia
Su
rin
ame
Gu
yan
a
Fre
nch
Gu
ian
a (F
r)
Tu
nis
ia
Un
ited
Ara
b E
mir
ates
Th
e B
aham
as
Ben
in
% p
op
ula
tion
imp
acte
d
ConclusionsEven if greenhouse gas emissions were stabilized in the near future the sea level would continue to rise for many decades.
Millions of people in the developing world are likely to be displaced by sea level rise within this century and accompanying economic and ecological damage will severe for many.
Impacts are unevenly distributed across coastal countries with severe impacts limited to a few countries.
Immediate planning for adaptation would avoid big losses later.

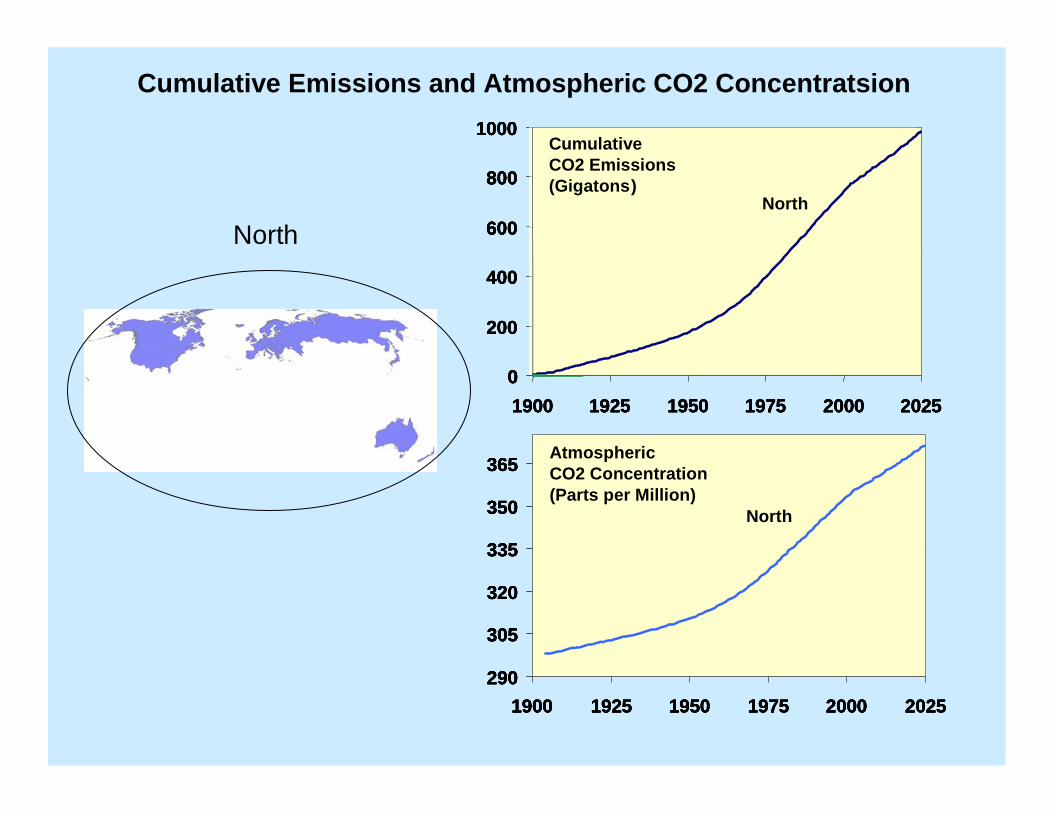
Global Stakes:CO2 Emissions and Atmospheric Concentration
1900 - 2002
Common View: It’s the North’s problem; the North should fix it
“South”
“North”

290
310
330
350
370
390
1900 1925 1950 1975 2000 2025
0
200
400
600
800
1000
1200
1900 1925 1950 1975 2000 2025
CumulativeCO2 Emissions(Gigatons)
AtmosphericCO2 Concentration(ppm)
Global CO2 Emissions and Atmospheric Concentration1900 - 2002

290
310
330
350
370
390
1900 1925 1950 1975 2000 2025
0
200
400
600
800
1000
1200
1900 1925 1950 1975 2000 2025
CumulativeCO2 Emissions(Gigatons)
AtmosphericCO2 Concentration(ppm)
290
315
340
365
390
0 200 400 600 800 1,000
Cumulative Emissions
CO
2 C
on
cen
trat
ion
Global CO2 Emissions and Atmospheric Concentration1900 - 2002
290
305
320
335
350
365
1900 1925 1950 1975 2000 2025
0
200
400
600
800
1000
1900 1925 1950 1975 2000 2025
CumulativeCO2 Emissions(Gigatons)
AtmosphericCO2 Concentration(Parts per Million)
Northworld
Northworld
Southworld
290
305
320
335
350
365
1900 1925 1950 1975 2000 2025
0
200
400
600
800
1000
1900 1925 1950 1975 2000 2025
290
305
320
335
350
365
1900 1925 1950 1975 2000 2025
290
305
320
335
350
365
1900 1925 1950 1975 2000 2025
0
200
400
600
800
1000
1900 1925 1950 1975 2000 2025
0
200
400
600
800
1000
1900 1925 1950 1975 2000 2025
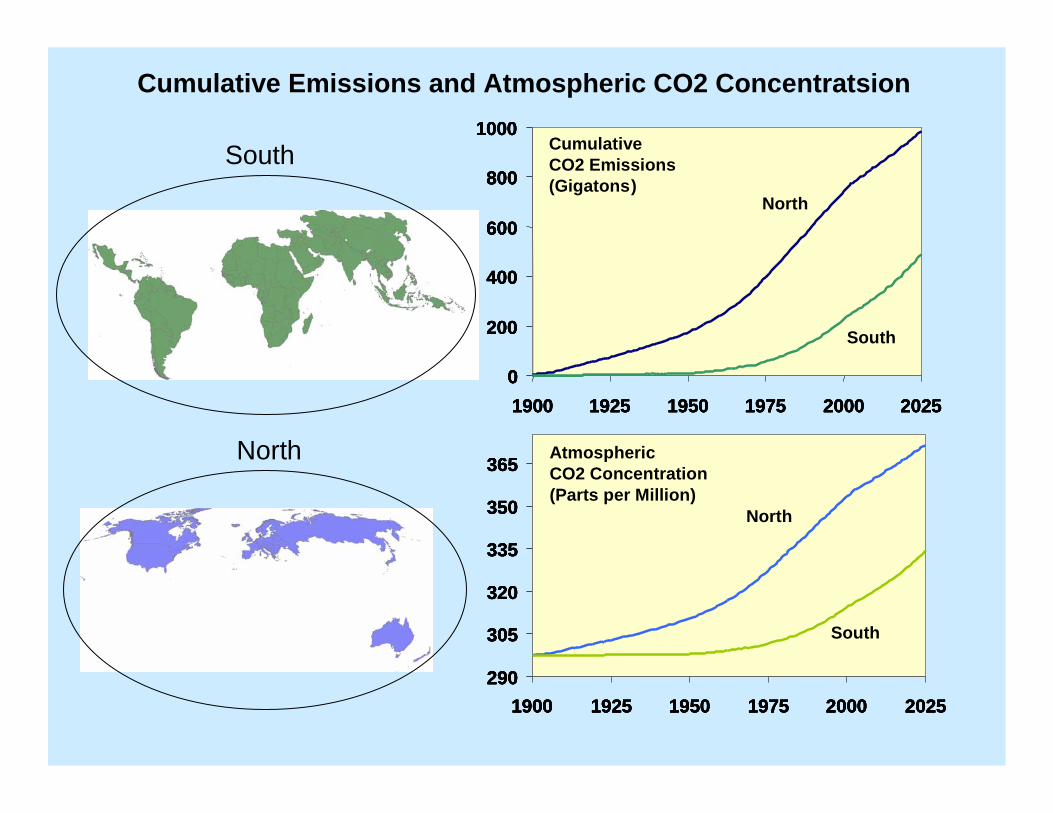
CumulativeCO2 Emissions(Gigatons)
AtmosphericCO2 Concentration(Parts per Million)
North
North
Cumulative Emissions and Atmospheric CO2 Concentratsion
North
290
305
320
335
350
365
1900 1925 1950 1975 2000 2025
0
200
400
600
800
1000
1900 1925 1950 1975 2000 2025
CumulativeCO2 Emissions(Gigatons)
AtmosphericCO2 Concentration(Parts per Million)
Northworld
Southworld
Northworld
Southworld
290
305
320
335
350
365
1900 1925 1950 1975 2000 2025
0
200
400
600
800
1000
1900 1925 1950 1975 2000 2025
290
305
320
335
350
365
1900 1925 1950 1975 2000 2025
290
305
320
335
350
365
1900 1925 1950 1975 2000 2025
0
200
400
600
800
1000
1900 1925 1950 1975 2000 2025
0
200
400
600
800
1000
1900 1925 1950 1975 2000 2025
CumulativeCO2 Emissions(Gigatons)
AtmosphericCO2 Concentration(Parts per Million)
North
South
North
South
North
South
Cumulative Emissions and Atmospheric CO2 Concentratsion
290
305
320
335
350
365
1900 1925 1950 1975 2000 2025
0
200
400
600
800
1000
1900 1925 1950 1975 2000 2025
CumulativeCO2 Emissions(Gigatons)
AtmosphericCO2 Concentration(Parts per Million)
Northworld
Southworld
Northworld
Southworld
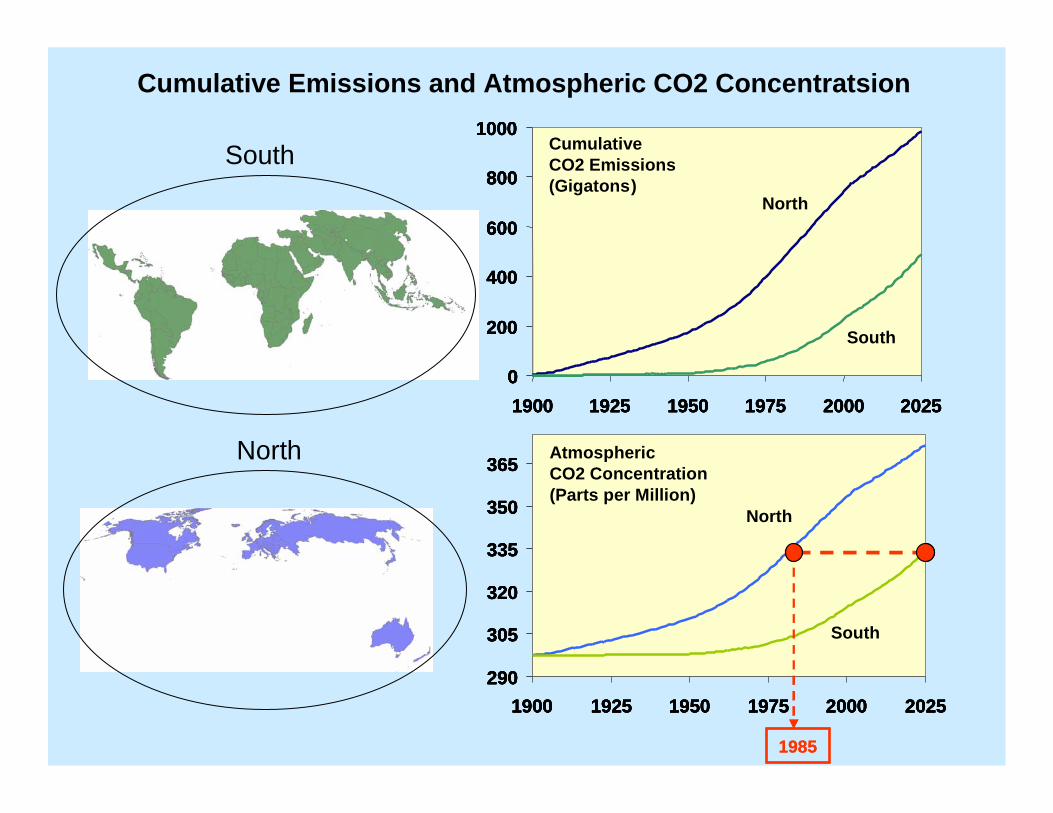
1985
290
305
320
335
350
365
1900 1925 1950 1975 2000 2025
0
200
400
600
800
1000
1900 1925 1950 1975 2000 2025
290
305
320
335
350
365
1900 1925 1950 1975 2000 2025
290
305
320
335
350
365
1900 1925 1950 1975 2000 2025
0
200
400
600
800
1000
1900 1925 1950 1975 2000 2025
0
200
400
600
800
1000
1900 1925 1950 1975 2000 2025
CumulativeCO2 Emissions(Gigatons)
AtmosphericCO2 Concentration(Parts per Million)
North
South
North
South
1985
North
South
Cumulative Emissions and Atmospheric CO2 Concentratsion

• Even if the developed North had never existed, the
developing South would be on the threshold of a planetary climate crisis in 2007.
• By 2025, if a solitary South continued burning fossilized carbon, it would face the same climate crisis that the world is facing now.
• The South should act now to reduce carbon emissions.
• The North should assist urgently, not as an act of charity but from stark necessity.
• This boat is going to sink unless we all start bailing.
Conclusions

Photographs have been downloaded from Google Images.
Related Documents