POTENTIAL IMPACT OF STLD POLICIES ON COVERAGE, PREMIUMS, FEDERAL SPENDING 1 Linda J. Blumberg, Matthew Buettgens, and Robin Wang February 2018 In Brief On February 20, 2018, the Departments of Treasury, Labor, and Health and Human Services released a proposed regulation that would increase the maximum length of short-term, limited-duration insurance policies to one year. These plans, sold to individuals and families, are not federally required to comply with the Affordable Care Act regulations that prohibit annual and lifetime benefit limits, require coverage of all essential health benefits, and otherwise prohibit insurers from setting premiums or choosing whether to sell coverage to particular people based on applicants’ health status and health history. As such, these plans do not meet minimum essential coverage standards under the law; thus, the Congressional Budget Office does not consider them private insurance. If implemented, the rule would permit these plans to compete against the ACA-compliant plans. Importantly, this change would be implemented on top of an array of other significant policy changes made since the beginning of 2017. We analyze the implications of the 2017 policy changes relative to the ACA as originally designed and implemented (prior law), in addition to the potential consequences of the proposed expansion of short-term limited-duration policies. In estimating the effects of these changes on insurance coverage, premiums, and federal spending, we take into account the variations in state circumstances and state-specific laws on short-term plans. HEALTH POLICY CENTER The Potential Impact of Short-Term Limited- Duration Policies on Insurance Coverage, Premiums, and Federal Spending

Welcome message from author
This document is posted to help you gain knowledge. Please leave a comment to let me know what you think about it! Share it to your friends and learn new things together.
Transcript
P O T E N T I A L I M P A C T O F S T L D P O L I C I E S O N C O V E R A G E , P R E M I U M S , F E D E R A L S P E N D I N G 1
Linda J. Blumberg, Matthew Buettgens, and Robin Wang
February 2018
In Brief
On February 20, 2018, the Departments of Treasury, Labor, and Health and Human
Services released a proposed regulation that would increase the maximum length of
short-term, limited-duration insurance policies to one year. These plans, sold to
individuals and families, are not federally required to comply with the Affordable Care
Act regulations that prohibit annual and lifetime benefit limits, require coverage of all
essential health benefits, and otherwise prohibit insurers from setting premiums or
choosing whether to sell coverage to particular people based on applicants’ health
status and health history. As such, these plans do not meet minimum essential coverage
standards under the law; thus, the Congressional Budget Office does not consider them
private insurance. If implemented, the rule would permit these plans to compete against
the ACA-compliant plans.
Importantly, this change would be implemented on top of an array of other significant policy
changes made since the beginning of 2017. We analyze the implications of the 2017 policy changes
relative to the ACA as originally designed and implemented (prior law), in addition to the potential
consequences of the proposed expansion of short-term limited-duration policies. In estimating the
effects of these changes on insurance coverage, premiums, and federal spending, we take into account
the variations in state circumstances and state-specific laws on short-term plans.
H E A L T H P O L I C Y C E N T E R
The Potential Impact of Short-Term Limited-Duration Policies on Insurance Coverage, Premiums, and Federal Spending

2 P O T E N T I A L I M P A C T O F S T L D P O L I C I E S O N C O V E R A G E , P R E M I U M S , F E D E R A L S P E N D I N G
Key findings include the following:
The elimination of the individual-mandate penalties and the other policy changes, such as the
withdrawal of cost-sharing reduction payments and the diminution of federal investments in
advertising and enrollment assistance during 2017 that affected the 2018 open enrollment
period, will lead to an additional 6.4 million people uninsured in 2019 compared with prior law
(12.5 percent of the nonelderly population uninsured compared with 10.2 percent).
The introduction of expanded short-term, limited-duration policies, consistent with proposed
regulations, would increase the number of people without minimum essential coverage by 2.5
million in 2019. Of the 36.9 million people without minimum essential coverage, 32.6 million
would have no coverage at all (completely uninsured), and 4.2 million would enroll in expanded
short-term limited-duration plans.
The combined effect of eliminating the individual-mandate penalties and expanding short-term
limited-duration policies would increase 2019 ACA-compliant nongroup insurance premiums
18.2 percent on average in the 43 states that do not prohibit or limit short-term plans.
Federal government spending in 2019 will be an estimated 9.3 percent higher than under prior
law, owing to the combined effect of expanding short-term limited-duration policies,
eliminating the individual-mandate penalties, and other recent policy changes. This increase in
federal spending is lower than the overall increase in premiums because of cost reductions
caused by decreases in enrollment.
Introduction The October 2017 executive order calls for the Departments of Treasury, Labor, and Health and Human
Services to consider new regulations that would increase the maximum length of short-term limited-
duration coverage. Such policies are not regulated by the Affordable Care Act’s (ACA’s) reform of the
private nongroup insurance market; as such, they are exempt from guaranteed issue, guaranteed
renewal, modified community rating, essential health benefit requirements, prohibitions on preexisting
condition exclusions, annual and lifetime limit prohibitions, and other protections. In addition, these
policies are not part of the ACA’s risk-adjustment system that spreads the costs associated with large
claims across all nongroup insurers in a state. Recently, enrollment in these policies has been limited by
two factors. First, someone buying a short-term policy without other coverage would not satisfy the
ACA’s individual responsibility requirement (the individual mandate) and would be subject to a financial
penalty. Second, regulations promulgated by the Departments of Labor, Treasury, and Health and
Human Services in 2016 prohibited short-term policies sold in April 2016 or later from coverage
exceeding three months. The regulations also required the companies selling short-term policies to
clearly warn potential purchasers that the policies do not satisfy the individual mandate.
The expansion of short-term, limited-duration policies would be implemented on top of other
significant changes to the ACA’s private nongroup insurance markets since early 2017. These include
P O T E N T I A L I M P A C T O F S T L D P O L I C I E S O N C O V E R A G E , P R E M I U M S , F E D E R A L S P E N D I N G 3
cessation of federal reimbursement for cost-sharing reductions, shortened open enrollment periods in
most states, substantially reduced federal funding for outreach and enrollment assistance, and the
elimination of the individual=mandate penalty beginning in 2019. If, consistent with the proposed rule
released on February 20, 2019,1 new regulations allow short-term policies to be sold for coverage
lasting as long as a year, these policies could compete as medically underwritten, largely unregulated
alternatives to the products sold in the ACA’s private nongroup insurance markets (both inside and
outside Marketplaces). In this way, they could pull healthier people out of the ACA-compliant nongroup
insurance market, leaving an enrollee population with higher average health care needs in the regulated
insurance pool. The elimination of the individual-mandate penalties must be accounted for when
assessing the potential impact of the expansion of short-term limited-duration policies, as these two
changes intrinsically interact. The state-specific implications of this policy change vary and should also
be taken into account, since some states have their own laws and regulations limiting sales of short-
term policies, and other states may be interested in developing some in response to the federal change
in policy.
We analyze the national and state-specific effects of ending the individual mandate and loosening
limits on short-term, limited-duration policies on insurance coverage, premiums in the ACA-compliant
nongroup insurance market, and federal spending in 2019. Our analysis relies on the Urban Institute’s
Health Insurance Policy Microsimulation Model (HIPSM), which is used extensively to estimate the cost
and coverage implications of the ACA, reforms to the ACA, and repeal and replace proposals. We
provide 2019 estimates of the coverage and costs under three scenarios:
1. the trend preceding the 2017 policy changes introduced by the current administration (prior-
law ACA);
2. the collective policy changes introduced by the current administration in 2017 that have
affected Marketplace and nongroup insurance enrollment in 2018 (as evidenced by enrollment
data and premium changes), as well as the elimination of penalties for the ACA’s individual
mandate (current-law ACA); and
3. current-law ACA plus the expansion of short-term limited-duration, or STLD, policies (current
law plus expansion of STLD).
Methodological Approach The Health Insurance Policy Simulation Model is a detailed microsimulation model of the health care
system designed to estimate the cost and coverage effects of proposed health care policy options.
HIPSM is based on two years of the American Community Survey, which provides a representative
sample of families that is large enough for us to produce estimates for individual states. The population
is aged to future years using projections from the Urban Institute’s Mapping America’s Futures
program. HIPSM is designed to incorporate timely, real-world data when they are available. As
described below, we regularly update the model to reflect published Medicaid and Marketplace
4 P O T E N T I A L I M P A C T O F S T L D P O L I C I E S O N C O V E R A G E , P R E M I U M S , F E D E R A L S P E N D I N G
enrollment and costs in each state. The enrollment experience in each state under current law affects
how the model simulates policy alternatives.
HIPSM is unique among microsimulation models of health coverage and costs because individual
and family decisions combine the two most common types of microsimulation decisionmaking: elasticity
and expected utility. Decisionmaking follows an expected-utility framework that captures factors such
as individual health risk, but we add a latent preference term for each observation that represents
factors involved in their observed choices that the expected-utility approach alone could not capture.
These terms are set so the model leads to each person in the data making the choice they reported in
the survey, and the distribution of latent preference terms is set so the model replicates premium
elasticity targets from the literature. This approach makes it easier to simulate novel policies
consistently while calibrating the model to a wide range of real-world data, such as Medicaid and
Marketplace enrollment.
Prior- and Current-Law ACA Scenarios
Our prior-law and current-law ACA simulations for 2019 are based on real-world snapshots of
Marketplace enrollment in each state under two different policy regimes: (1) that of the Obama
administration, culminating in the 2017 open enrollment period (OEP), and (2) that of the Trump
administration for the 2018 OEP. The current-law simulation also eliminates the ACA’s individual-
mandate penalties; the prior-law scenario includes them. The collective effect of the policy changes
implemented by the Trump administration are captured by benchmarking the current-law simulation to
2018 Marketplace enrollment, the most recent Medicaid enrollment data, and nongroup market
premium changes between 2017 and 2018. To simulate the effect of the individual mandate, we
compute eligibility for the most common mandate exemptions (income below the tax filing threshold,
lack of affordability of available premiums, undocumented status) and tax penalties for people without
exemptions if they were to become uninsured. Other exemptions, such as those for individual hardship
circumstances and religious conscience objections, cannot be modeled. However, our estimates of the
number of families paying the tax penalty are similar to published IRS estimates, so the missing
exemptions do not appear to affect our results substantially.
Based on the coverage gains resulting from the 2006 Massachusetts health reform law, we assume
that the mandate would have an impact larger than the dollar amount of the penalties would suggest.
Recent research using ACA-era data has confirmed that this assumption is appropriate (Salzman 2017).
To estimate the size of the nonfinancial effect of the mandate and the size of the nongroup market
outside the Marketplaces, we use the total reported nongroup enrollment in the 2017 National Health
Interview Survey (which is generally considered the most reliable national measure of enrollment in
major health coverage types) combined with reported Marketplace enrollment. Specifically, we
simulate health insurance coverage based on financial factors (premiums, expected out-of-pocket costs,
a measure of risk aversion, individual-mandate penalties) and other factors known to affect individual
and family coverage, and we compare the resulting levels of coverage to benchmarks based on
Marketplace enrollment and the National Health Interview Survey. The difference between coverage

P O T E N T I A L I M P A C T O F S T L D P O L I C I E S O N C O V E R A G E , P R E M I U M S , F E D E R A L S P E N D I N G 5
levels based on financial factors and the benchmarks is attributed to the nonfinancial effect of the
individual mandate, and the model’s simulated coverage is calibrated to hit those benchmarks in the
2017 prior-law scenario.
As of February 2018, no data are available on nongroup enrollment outside the Marketplaces in
2018, so this was simulated by HIPSM. The increases in nongroup premiums from 2017 to 2018 are
estimated to reduce enrollment among people not eligible for tax credits in 2018, an effect that
increases further in 2019 once the individual-mandate penalties are eliminated.
Short-Term Limited-Duration Policy Expansion
For our third simulation, we start with the current-law ACA framework described above, based on
evidence from 2018 coverage decisions and premiums plus the elimination of individual-mandate
penalties, and we assume that access to STLD plans is expanded. However, a change in federal
regulations to expand STLDs would not preempt state laws regarding such plans. Based on preliminary
analysis of state regulations by Georgetown University’s Center on Health Insurance Reforms (Lucia et
al., forthcoming), we categorize states into three groups: those that have regulations that would
effectively prohibit the expansion of STLD policies, those that would significantly reduce the expansion
of STLD policies but would not eliminate them, and those where the new regulations would effectively
allow STLD policies to compete with ACA-compliant policies without further state action.2
Massachusetts, New Jersey, New York, Oregon, Vermont, and Washington have laws that would
prevent an expansion of STLDs. Results for these six states are the same as in the current-law scenario.
Michigan and Nevada have laws that would limit STLD policy expansion. In these two states, we reduce
the incentives to choose STLDs by roughly half. The remaining states either have no regulations that
would substantially limit STLD policy expansion or have regulations that would allow sales, renewals, or
extensions of STLD policies for 12 months or more. Our second and third categories are primarily based
on duration limits of contract length and renewals. Many states have limits, but our categorization is
based on the ability of a person to enroll in and extend or renew a STLD plan for up to 12 months.3
Within HIPSM, in states whose laws would not prevent STLD plan expansion, people would now
have a choice between ACA-compliant nongroup coverage and STLD plans. We assume that full-year
STLD coverage would differ from ACA-compliant coverage because such coverage would have a lower
actuarial value (approximately 50 percent) and, in general, health status, gender rating, and broad age
rating variations would be allowed when setting premiums. STLD plans do not cover all ACA essential
health benefits, but we did not model benefit exclusions given the complexity involved. These
differences ensure that those who prefer STLD to ACA-compliant plans will tend to have lower
expected health care needs, since high premiums for those with greater needs as well as higher cost-
sharing requirements associated with STLD plans would dissuade enrollment by those with serious
health conditions. As more people enroll in STLD plans who would otherwise have chosen ACA-
compliant coverage, premiums for ACA-compliant policies will rise. These price increases lead to more
people choosing STLD policies, and HIPSM captures this adverse selection behavior until coverage and
premium changes stabilize in successive iterations.

6 P O T E N T I A L I M P A C T O F S T L D P O L I C I E S O N C O V E R A G E , P R E M I U M S , F E D E R A L S P E N D I N G
Short-term limited-duration plans would not meet the standards of minimum essential coverage.
The Congressional Budget Office’s definition of private insurance would not include these plans.4
Consequently, we group STLD purchasers with the completely uninsured (those with no coverage
whatsoever) as people without minimum essential coverage.
Results
National Distribution of Health Insurance Coverage
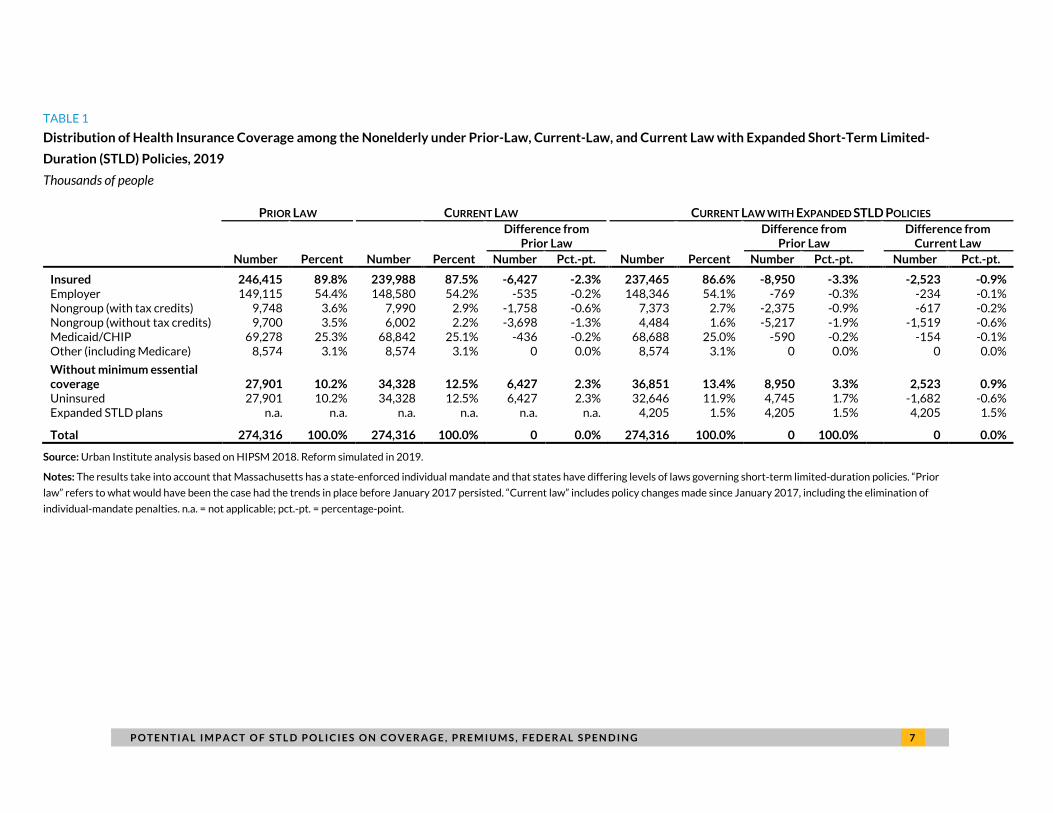
Table 1 shows the estimated 2019 national distribution of insurance coverage under prior law, current
law, and current law plus the expansion to the availability of STLD policies. We estimate that the
percentage of nonelderly people uninsured will be 2.3 percentage points higher in 2019 (12.5 percent
uninsured versus 10.2 percent uninsured) as a consequence of the combined 2017 policy changes as
well as elimination of the individual-mandate penalties. (Consumer confusion about whether the ACA is
still in place5 may also contribute to lower enrollment.) This is equivalent to an additional 6.4 million
uninsured people, with 3.7 million of that increase resulting from reduced nongroup coverage
purchased without tax credits, 1.8 million people fewer enrolling in nongroup coverage with tax credits,
and roughly 500,000 and 400,000 fewer people with employer-sponsored insurance coverage and
Medicaid/CHIP, respectively. The reduction in Medicaid/CHIP coverage is largely attributable to
reductions in coverage for children whose parents would, under prior law, learn of their children’s
eligibility for public insurance when applying for Marketplace coverage. Because fewer people would
apply for nongroup coverage, fewer would find out their children are eligible. The reduction in
employer-sponsored insurance is largely attributable to the elimination of the individual-mandate
penalties.
We estimate that once the rules limiting STLD policies are loosened, ACA-compliant nongroup
coverage would decrease by another 2.1 million people. About 70 percent of that decrease (1.5 million
people) comes from fewer people buying ACA-compliant coverage without a tax credit, and about 30
percent of the decrease (about 600,000 people) comes from fewer people buying nongroup insurance
with a tax credit. Employer coverage would fall by an additional 230,000 people and Medicaid/CHIP by
an additional 150,000 people. Approximately 36.9 million people would be without minimum essential
coverage, an increase of 9.0 million people over prior law and 2.5 million people over current law. Of
that number, 32.6 million people would be uninsured (no coverage at all) and 4.2 million people would
be enrolled in the expanded STLD policies. About 1.7 million of the people buying STLD policies would
have been uninsured (in the traditional sense) under current law, and 2.5 million STLD policy holders
would otherwise have had insurance of some type.
P O T E N T I A L I M P A C T O F S T L D P O L I C I E S O N C O V E R A G E , P R E M I U M S , F E D E R A L S P E N D I N G 7
TABLE 1
Distribution of Health Insurance Coverage among the Nonelderly under Prior-Law, Current-Law, and Current Law with Expanded Short-Term Limited-
Duration (STLD) Policies, 2019 Thousands of people
PRIOR LAW CURRENT LAW CURRENT LAW WITH EXPANDED STLD POLICIES
Number Percent Number Percent
Difference from Prior Law
Number Percent
Difference from Prior Law
Difference from Current Law
Number Pct.-pt. Number Pct.-pt. Number Pct.-pt.
Insured 246,415 89.8% 239,988 87.5% -6,427 -2.3% 237,465 86.6% -8,950 -3.3% -2,523 -0.9% Employer 149,115 54.4% 148,580 54.2% -535 -0.2% 148,346 54.1% -769 -0.3% -234 -0.1% Nongroup (with tax credits) 9,748 3.6% 7,990 2.9% -1,758 -0.6% 7,373 2.7% -2,375 -0.9% -617 -0.2% Nongroup (without tax credits) 9,700 3.5% 6,002 2.2% -3,698 -1.3% 4,484 1.6% -5,217 -1.9% -1,519 -0.6% Medicaid/CHIP 69,278 25.3% 68,842 25.1% -436 -0.2% 68,688 25.0% -590 -0.2% -154 -0.1% Other (including Medicare) 8,574 3.1% 8,574 3.1% 0 0.0% 8,574 3.1% 0 0.0% 0 0.0%
Without minimum essential coverage 27,901 10.2% 34,328 12.5% 6,427 2.3% 36,851 13.4% 8,950 3.3% 2,523 0.9% Uninsured 27,901 10.2% 34,328 12.5% 6,427 2.3% 32,646 11.9% 4,745 1.7% -1,682 -0.6% Expanded STLD plans n.a. n.a. n.a. n.a. n.a. n.a. 4,205 1.5% 4,205 1.5% 4,205 1.5%
Total 274,316 100.0% 274,316 100.0% 0 0.0% 274,316 100.0% 0 100.0% 0 0.0%
Source: Urban Institute analysis based on HIPSM 2018. Reform simulated in 2019.
Notes: The results take into account that Massachusetts has a state-enforced individual mandate and that states have differing levels of laws governing short-term limited-duration policies. “Prior
law” refers to what would have been the case had the trends in place before January 2017 persisted. “Current law” includes policy changes made since January 2017, including the elimination of
individual-mandate penalties. n.a. = not applicable; pct.-pt. = percentage-point.
8 P O T E N T I A L I M P A C T O F S T L D P O L I C I E S O N C O V E R A G E , P R E M I U M S , F E D E R A L S P E N D I N G
State-by-State Findings
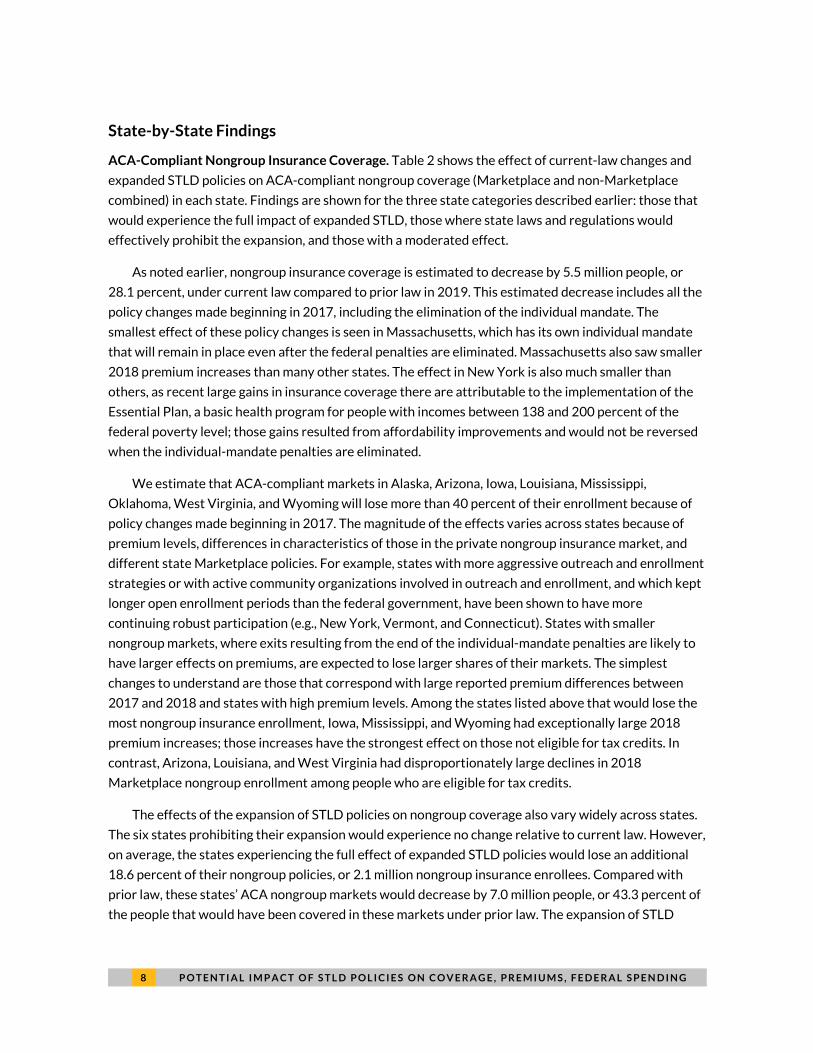
ACA-Compliant Nongroup Insurance Coverage. Table 2 shows the effect of current-law changes and
expanded STLD policies on ACA-compliant nongroup coverage (Marketplace and non-Marketplace
combined) in each state. Findings are shown for the three state categories described earlier: those that
would experience the full impact of expanded STLD, those where state laws and regulations would
effectively prohibit the expansion, and those with a moderated effect.
As noted earlier, nongroup insurance coverage is estimated to decrease by 5.5 million people, or
28.1 percent, under current law compared to prior law in 2019. This estimated decrease includes all the
policy changes made beginning in 2017, including the elimination of the individual mandate. The
smallest effect of these policy changes is seen in Massachusetts, which has its own individual mandate
that will remain in place even after the federal penalties are eliminated. Massachusetts also saw smaller
2018 premium increases than many other states. The effect in New York is also much smaller than
others, as recent large gains in insurance coverage there are attributable to the implementation of the
Essential Plan, a basic health program for people with incomes between 138 and 200 percent of the
federal poverty level; those gains resulted from affordability improvements and would not be reversed
when the individual-mandate penalties are eliminated.
We estimate that ACA-compliant markets in Alaska, Arizona, Iowa, Louisiana, Mississippi,
Oklahoma, West Virginia, and Wyoming will lose more than 40 percent of their enrollment because of
policy changes made beginning in 2017. The magnitude of the effects varies across states because of
premium levels, differences in characteristics of those in the private nongroup insurance market, and
different state Marketplace policies. For example, states with more aggressive outreach and enrollment
strategies or with active community organizations involved in outreach and enrollment, and which kept
longer open enrollment periods than the federal government, have been shown to have more
continuing robust participation (e.g., New York, Vermont, and Connecticut). States with smaller
nongroup markets, where exits resulting from the end of the individual-mandate penalties are likely to
have larger effects on premiums, are expected to lose larger shares of their markets. The simplest
changes to understand are those that correspond with large reported premium differences between
2017 and 2018 and states with high premium levels. Among the states listed above that would lose the
most nongroup insurance enrollment, Iowa, Mississippi, and Wyoming had exceptionally large 2018
premium increases; those increases have the strongest effect on those not eligible for tax credits. In
contrast, Arizona, Louisiana, and West Virginia had disproportionately large declines in 2018
Marketplace nongroup enrollment among people who are eligible for tax credits.
The effects of the expansion of STLD policies on nongroup coverage also vary widely across states.
The six states prohibiting their expansion would experience no change relative to current law. However,
on average, the states experiencing the full effect of expanded STLD policies would lose an additional
18.6 percent of their nongroup policies, or 2.1 million nongroup insurance enrollees. Compared with
prior law, these states’ ACA nongroup markets would decrease by 7.0 million people, or 43.3 percent of
the people that would have been covered in these markets under prior law. The expansion of STLD

P O T E N T I A L I M P A C T O F S T L D P O L I C I E S O N C O V E R A G E , P R E M I U M S , F E D E R A L S P E N D I N G 9
policies alone would reduce the Washington, DC, nongroup market 30.5 percent and the Arkansas
nongroup market 25.0 percent, absent city- or state-specific legal changes to prevent such a reduction.
We estimate expanded STLD policies would reduce nongroup coverage by only 10.8 percent in
Michigan and 13.2 percent in Nevada because of some moderating state laws in each.
1 0 P O T E N T I A L I M P A C T O F S T L D P O L I C I E S O N C O V E R A G E , P R E M I U M S , F E D E R A L S P E N D I N G
TABLE 2
ACA-Compliant Nongroup Coverage by State under Prior Law, Current Law, and Expansion of Short-Term Limited-Duration (STLD) Policies, 2019
Thousands of people
State
PRIOR LAW CURRENT LAW CURRENT LAW PLUS EXPANDED STLD POLICIES Number with
compliant nongroup insurance
Number with compliant nongroup insurance
Change from Prior Law Number with
compliant nongroup insurance
Change from Prior Law Change from Current Law
Number Percent Number Percent Number Percent
Full-impact states 16,091 11,209 -4,882 -30.3% 9,127 -6,963 -43.3% -2,081 -18.6% Alabama 266 176 -90 -33.7% 145 -121 -45.4% -31 -17.6% Alaska 32 15 -17 -53.4% 12 -21 -64.0% -3 -22.8% Arizona 318 180 -138 -43.4% 128 -190 -59.7% -52 -28.8% Arkansas 120 75 -44 -37.1% 57 -63 -52.8% -19 -25.0% California 2,514 1,843 -671 -26.7% 1,456 -1,058 -42.1% -387 -21.0% Colorado 283 191 -92 -32.4% 142 -141 -49.8% -49 -25.7% Connecticut 178 143 -34 -19.4% 112 -66 -36.9% -31 -21.8% Delaware 42 27 -15 -36.3% 21 -21 -49.5% -6 -20.7% District of Columbia 25 17 -9 -35.0% 11 -14 -54.8% -5 -30.5% Florida 2,166 1,729 -437 -20.2% 1,461 -705 -32.6% -268 -15.5% Georgia 697 458 -240 -34.4% 388 -309 -44.3% -69 -15.1% Hawaii 50 37 -13 -26.2% 30 -20 -40.0% -7 -18.7% Idaho 154 113 -41 -26.9% 91 -63 -40.7% -21 -18.8% Illinois 662 497 -165 -25.0% 403 -259 -39.1% -94 -18.9% Indiana 306 194 -112 -36.5% 155 -151 -49.2% -39 -20.0% Iowa 135 79 -56 -41.6% 63 -71 -52.9% -15 -19.4% Kansas 176 126 -50 -28.2% 101 -75 -42.8% -26 -20.4% Kentucky 132 106 -26 -19.7% 84 -48 -36.3% -22 -20.6% Louisiana 243 139 -103 -42.6% 109 -133 -54.9% -30 -21.6% Maine 94 68 -25 -27.2% 61 -32 -34.4% -7 -9.9% Maryland 276 221 -56 -20.1% 181 -96 -34.7% -40 -18.3% Minnesota 282 170 -112 -39.8% 132 -150 -53.3% -38 -22.5% Mississippi 129 75 -53 -41.6% 59 -69 -53.8% -16 -21.0% Missouri 365 253 -113 -30.9% 209 -157 -42.9% -44 -17.4% Montana 76 51 -25 -33.3% 41 -35 -46.0% -10 -19.1% Nebraska 151 105 -46 -30.3% 89 -61 -40.8% -16 -15.0% New Hampshire 69 48 -22 -31.2% 40 -30 -42.8% -8 -16.9% New Mexico 77 51 -26 -34.4% 40 -37 -48.6% -11 -21.6%

P O T E N T I A L I M P A C T O F S T L D P O L I C I E S O N C O V E R A G E , P R E M I U M S , F E D E R A L S P E N D I N G 1 1
State
PRIOR LAW CURRENT LAW CURRENT LAW PLUS EXPANDED STLD POLICIES Number with
compliant nongroup insurance
Number with compliant nongroup insurance
Change from Prior Law Number with
compliant nongroup insurance
Change from Prior Law Change from Current Law
Number Percent Number Percent Number Percent North Carolina 758 496 -263 -34.6% 418 -340 -44.8% -77 -15.6% North Dakota 51 40 -11 -22.0% 30 -21 -40.8% -10 -24.1% Ohio 445 305 -141 -31.6% 242 -203 -45.6% -62 -20.5% Oklahoma 227 135 -93 -40.7% 113 -114 -50.4% -22 -16.3% Pennsylvania 688 480 -209 -30.3% 392 -296 -43.0% -87 -18.2% Rhode Island 51 42 -9 -17.5% 34 -17 -33.1% -8 -18.9% South Carolina 307 198 -109 -35.6% 165 -142 -46.1% -32 -16.4% South Dakota 66 42 -24 -36.3% 32 -34 -51.0% -10 -23.0% Tennessee 373 244 -128 -34.5% 198 -175 -47.0% -47 -19.2% Texas 1,737 1,095 -642 -37.0% 884 -854 -49.1% -211 -19.3% Utah 291 221 -70 -24.0% 178 -113 -38.9% -43 -19.7% Virginia 615 418 -197 -32.1% 355 -260 -42.2% -62 -14.9% West Virginia 50 26 -24 -47.9% 22 -28 -55.9% -4 -15.4% Wisconsin 368 258 -110 -29.8% 220 -147 -40.1% -38 -14.6% Wyoming 45 24 -21 -47.0% 20 -25 -54.9% -4 -15.0%
States prohibiting STLD plans 2,656 2,303 -353 -13.3% 2,303 -353 -13.3% 0 0.0% Massachusetts 380 367 -13 -3.3% 367 -13 -3.3% 0 0.0% New Jersey 456 350 -106 -23.2% 350 -106 -23.2% 0 0.0% New York 1,240 1,168 -72 -5.8% 1,168 -72 -5.8% 0 0.0% Oregon 216 158 -58 -26.8% 158 -58 -26.8% 0 0.0% Vermont 38 34 -5 -12.4% 34 -5 -12.4% 0 0.0% Washington 326 226 -100 -30.6% 226 -100 -30.6% 0 0.0%
States with moderate STLD impact 701 480 -221 -31.5% 426 -275 -39.2% -54 -11.3% Michigan 551 383 -168 -30.5% 342 -209 -38.0% -41 -10.8% Nevada 150 97 -53 -35.2% 85 -66 -43.8% -13 -13.2%
Total 19,448 13,992 -5,456 -28.1% 11,857 -7,592 -39.0% -2,136 -15.3%
Source: Urban Institute analysis using HIPSM 2018. Reform simulated in 2019.
Notes: The results take into account that Massachusetts has a state-enforced individual mandate and that states have differing laws governing STLD policies. “Prior law” refers to what
would have been the case had the trends in place before January 2017 persisted. “Current law” includes policy changes made since January 2017, including the elimination of individual-
mandate penalties. The District of Columbia is considered a state in this analysis.

1 2 P O T E N T I A L I M P A C T O F S T L D P O L I C I E S O N C O V E R A G E , P R E M I U M S , F E D E R A L S P E N D I N G
Those without Minimum Essential Coverage. Table 3 shows the number of uninsured (those with no
coverage at all) in each state under prior law, current law, and current law with expansions of STLD
policies. In the third scenario, we also show the number of people with short-term, limited-duration
policies—a group, as explained earlier, that does not meet the current Congressional Budget Office
definition of private health insurance because the coverage does not meet minimum essential coverage
standards. We estimate that the number of people uninsured under current law in 2019 will increase by
23 percent on average compared with prior law. The percentage increases in the uninsured will be
above 10 percent in all but six states, with the largest effects in states that had the biggest decreases in
2018 Marketplace enrollment and the largest 2018 nongroup premium increases.
Once STLD plans are expanded, 8.3 million fewer people would have insurance compared with prior
law, and 2.5 million fewer people would have insurance compared with current law in the 43 states that
do not prohibit or limit STLD plan expansion. The STLD expansion alone would decrease the number of
those completely uninsured by 5.4 percent in these states (1.7 million people) compared with current
law, although these new purchasers would have significantly narrower coverage than that offered in the
ACA-compliant nongroup insurance market. Enrollment in the short-term limited-duration plans would
total 4.1 million people in those states. The isolated effect of the STLD expansion compared with
current law in the states fully affected ranges from a 4.4 percent increase in those without minimum
essential coverage in Texas (a state with a high current-law uninsurance rate) to a 23.4 percent effect in
North Dakota (a state with a particularly extreme mixture of young adults and older, higher-risk adults).
States with the largest effects will tend to be those with high unsubsidized ACA-compliant premiums
and those with low Marketplace participation. Health status and socioeconomic characteristic
differences also affect the ability of state residents to enroll in STLD plans and their preferences for
doing so.
States with the largest absolute numbers of enrollees in STLD plans have the largest populations,
including 620,000 people in California, 421,000 people in Texas, and 394,000 people in Florida. These
totals include people who would otherwise be uninsured, an even larger number of people opting for
these policies instead of enrolling in ACA compliant nongroup insurance, and a considerably small
number of people enrolling in the plans instead of employer-sponsored insurance.

P O T E N T I A L I M P A C T O F S T L D P O L I C I E S O N C O V E R A G E , P R E M I U M S , F E D E R A L S P E N D I N G 1 3
TABLE 3
People without Minimum Essential Coverage by State, under Prior Law, Current Law, and Current Law Plus Expanded Short-Term Limited-Duration
(STLD) Policies, 2019 Thousands of people
State
PRIOR
LAW CURRENT LAW CURRENT LAW PLUS EXPANDED STLD POLICIES
Uninsured Uninsured
Change from Prior Law STLD
policies Uninsured
Total without
MEC
Change from Prior Law
Change from Current Law
Number Percent Number Percent Number Percent
Full-impact states 24,415 30,238 5,823 23.9% 4,127 28,581 32,707 8,293 34.0% 2,470 8.2% Alabama 510 715 206 40.4% 90 677 767 258 50.6% 52 7.3% Alaska 97 94 -3 -3.3% 30 77 107 10 9.8% 13 13.6% Arizona 717 841 124 17.3% 167 772 939 222 31.0% 98 11.6% Arkansas 160 285 125 78.1% 36 271 307 147 91.6% 22 7.6% California 2,972 4,626 1,654 55.7% 620 4,439 5,059 2,087 70.2% 433 9.4% Colorado 390 484 94 24.1% 108 433 540 150 38.4% 56 11.6% Connecticut 159 193 34 21.1% 52 176 228 69 43.5% 36 18.5% Delaware 61 70 9 15.5% 9 67 76 15 25.4% 6 8.6% District of Columbia 26 34 8 32.3% 5 34 38 13 49.3% 4 12.9% Florida 2,220 2,532 312 14.1% 394 2,435 2,829 609 27.4% 297 11.7% Georgia 1,619 1,778 159 9.9% 172 1,689 1,861 242 15.0% 83 4.7% Hawaii 93 104 11 12.0% 12 99 111 19 20.0% 7 7.2% Idaho 177 213 36 20.1% 39 199 238 60 34.1% 25 11.7% Illinois 961 1,193 233 24.2% 157 1,131 1,288 327 34.1% 94 7.9% Indiana 482 663 181 37.5% 74 628 702 220 45.6% 39 5.9% Iowa 151 206 54 35.8% 41 182 223 71 47.2% 17 8.4% Kansas 313 363 50 16.0% 50 343 393 80 25.5% 30 8.2% Kentucky 200 222 22 11.0% 38 208 246 46 23.2% 24 10.9% Louisiana 325 434 109 33.6% 64 403 467 143 43.9% 33 7.7% Maine 77 120 42 55.0% 22 106 128 51 66.0% 9 7.1% Maryland 355 407 52 14.7% 63 384 447 92 26.0% 40 9.8% Minnesota 325 411 85 26.3% 97 365 463 137 42.2% 52 12.6% Mississippi 383 448 65 17.0% 47 425 472 89 23.2% 24 5.4% Missouri 556 723 167 30.0% 96 683 779 223 40.2% 57 7.8% Montana 74 87 13 17.8% 21 79 100 26 35.0% 13 14.6% Nebraska 159 197 38 23.7% 43 172 216 57 35.5% 19 9.5% New Hampshire 58 80 21 36.9% 18 70 87 29 49.9% 8 9.5% New Mexico 169 200 31 18.4% 20 192 211 42 25.0% 11 5.5%

1 4 P O T E N T I A L I M P A C T O F S T L D P O L I C I E S O N C O V E R A G E , P R E M I U M S , F E D E R A L S P E N D I N G
State
PRIOR
LAW CURRENT LAW CURRENT LAW PLUS EXPANDED STLD POLICIES
Uninsured Uninsured
Change from Prior Law STLD
policies Uninsured
Total without
MEC
Change from Prior Law
Change from Current Law
Number Percent Number Percent Number Percent North Carolina 1,144 1,430 287 25.1% 221 1,325 1,546 402 35.1% 115 8.1% North Dakota 43 46 3 7.3% 15 41 57 14 32.4% 11 23.4% Ohio 576 713 137 23.7% 116 661 776 200 34.7% 63 8.9% Oklahoma 561 668 107 19.1% 70 633 703 142 25.3% 35 5.2% Pennsylvania 542 702 160 29.6% 165 644 810 268 49.5% 108 15.4% Rhode Island 47 51 4 7.9% 11 48 60 12 26.2% 9 17.0% South Carolina 549 660 111 20.1% 76 627 704 154 28.1% 44 6.6% South Dakota 85 109 24 27.9% 23 98 121 36 42.0% 12 11.0% Tennessee 653 769 115 17.7% 120 713 833 180 27.5% 64 8.4% Texas 4,731 5,304 573 12.1% 421 5,117 5,538 807 17.1% 234 4.4% Utah 298 373 75 25.3% 67 352 419 121 40.6% 46 12.3% Virginia 912 1,069 157 17.2% 137 1,003 1,141 229 25.1% 72 6.7% West Virginia 74 101 27 36.5% 21 91 112 38 51.6% 11 11.1% Wisconsin 348 441 93 26.8% 58 420 478 130 37.5% 37 8.5% Wyoming 61 78 17 27.5% 19 67 86 24 39.6% 7 9.5%
States prohibiting STLD plans 2,643 3,040 397 15.0% 0 3,040 3,040 397 15.0% 0 0.0% Massachusetts 96 103 7 7.5% 0 103 103 7 7.5% 0 0.0% New Jersey 589 681 92 15.6% 0 681 681 92 15.6% 0 0.0% New York 1,222 1,315 94 7.7% 0 1,315 1,315 94 7.7% 0 0.0% Oregon 241 293 52 21.8% 0 293 293 52 21.8% 0 0.0% Vermont 24 43 19 78.8% 0 43 43 19 78.8% 0 0.0% Washington 473 605 133 28.1% 0 605 605 133 28.1% 0 0.0%
States with moderate STLD impact 843 1,050 207 24.6% 78 1,025 1,103 261 30.9% 54 5.1% Michigan 497 662 165 33.2% 54 646 700 203 40.9% 38 5.8% Nevada 346 388 42 12.1% 25 379 403 57 16.5% 15 4.0%
Total 27,901 34,328 6,427 23.0% 4,205 32,646 36,851 8,950 32.1% 2,523 7.4%
Source: Urban Institute analysis using HIPSM 2018. Reform simulated in 2019.
Notes: The results take into account that Massachusetts has a state-enforced individual mandate and that states have differing levels of laws governing STLD policies. “Prior law” refers to what
would have been the case had the trends in place before January 2017 persisted. “Current law” includes policy changes made since January 2017, including the elimination of individual-
mandate penalties. Minimum essential coverage (or MEC) refers to any insurance plan that satisfies the ACA’s requirement to have health insurance coverage. STLD plans do not meet that
standard and are thus not considered private insurance coverage by the Congressional Budget Office. The District of Columbia is considered a state in this analysis.

P O T E N T I A L I M P A C T O F S T L D P O L I C I E S O N C O V E R A G E , P R E M I U M S , F E D E R A L S P E N D I N G 1 5
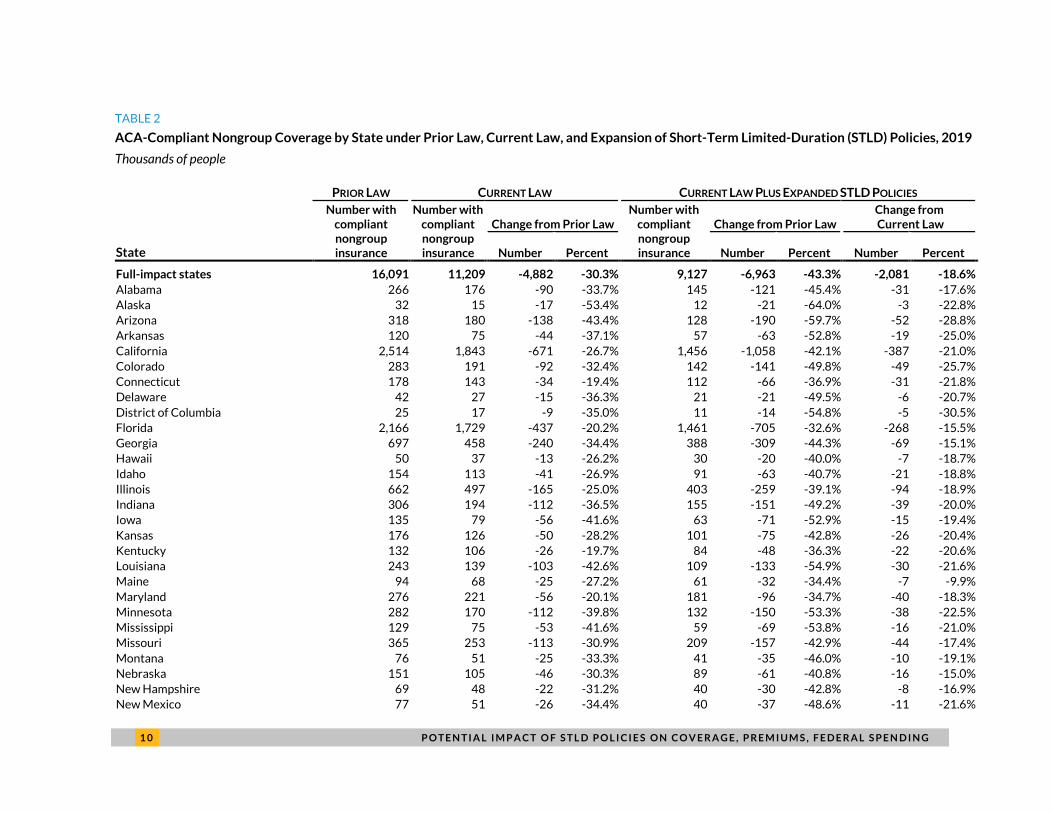
Effect of Expanded STLD Plans on Premiums in the ACA-Compliant Nongroup Insurance Market. We
estimate that average premiums in the ACA-compliant nongroup insurance market would increase
approximately 18 percent in the states that do not prohibit or limit expanded STLD plans (table 4). This
premium increase includes the expansion of the STLD plans and the elimination of the individual-
mandate penalties. The premium effect varies modestly across states, with the clear majority falling in
the 17 to 21 percent range. States like Alaska and Minnesota that have reinsurance mechanisms in
place in the ACA-compliant market, would experience still significant (but smaller premium) increases.
The same is true for Michigan and Nevada (12.2 and 15.2 percent increases, respectively), where state
law would significantly limit enrollment in STLD plans. Massachusetts is the only state with its own
individual mandate and effective prohibitions on expansions of STLD policies and thus no measurable
premium effect. The premium effects in the other five states prohibiting STLD plan expansion are
attributable to the elimination of the individual-mandate penalties alone.
1 6 P O T E N T I A L I M P A C T O F S T L D P O L I C I E S O N C O V E R A G E , P R E M I U M S , F E D E R A L S P E N D I N G
TABLE 4
Percent Change in ACA-Compliant Premiums because of Expanded Short-Term Limited-Duration
(STLD) Policies and Loss of Individual Mandate, 2019
State Change State Change
Full-impact states 18.2% Full-impact states (cont’d) Alabama 21.6% New Mexico 9.1% Alaska 8.5% North Carolina 17.8% Arizona 20.6% North Dakota 20.8% Arkansas 18.8% Ohio 16.8% California 17.8% Oklahoma 18.7% Colorado 18.3% Pennsylvania 19.2% Connecticut 16.5% Rhode Island 20.7% Delaware 19.9% South Carolina 17.2% District of Columbia 13.6% South Dakota 21.7% Florida 16.9% Tennessee 18.1% Georgia 19.5% Texas 20.2% Hawaii 17.5% Utah 18.5% Idaho 17.5% Virginia 19.1% Illinois 19.4% West Virginia 20.0% Indiana 19.6% Wisconsin 20.0% Iowa 15.8% Wyoming 18.6% Kansas 19.2% States prohibiting STLD plans 8.3% Kentucky 18.7% Massachusetts 0.0% Louisiana 14.0% New Jersey 10.9% Maine 15.9% New York 8.8% Maryland 18.4% Oregon 9.1% Minnesota 11.1% Vermont 12.2% Mississippi 17.2% Washington 13.6% Missouri 18.3% States with moderate STLD impact 12.8% Montana 19.8% Michigan 12.2% Nebraska 20.4% Nevada 15.2% New Hampshire 19.6% Total 16.4%
Source: Urban Institute analysis using HIPSM 2018. Reform simulated in 2019.
Notes: The results take into account that Massachusetts has a state-enforced individual mandate and that states have differing
laws governing STLD policies. The District of Columbia is considered a state in this analysis.
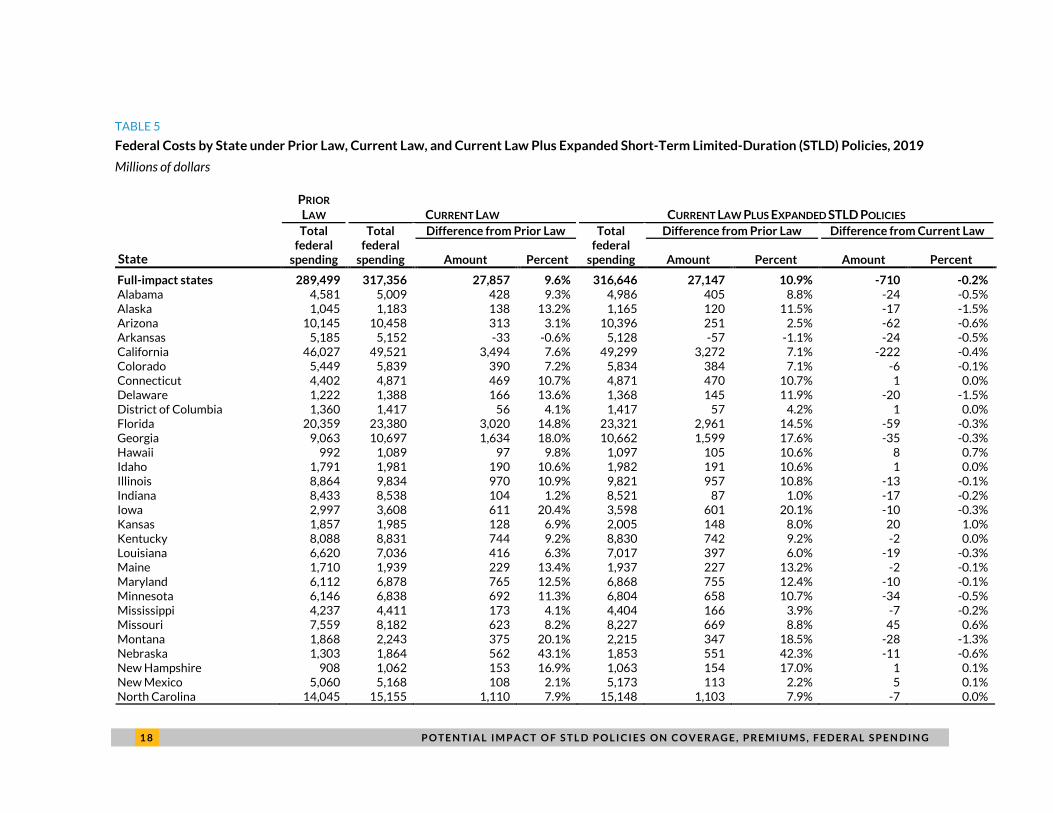
Federal Health Care Spending. Table 5 provides estimates of federal health care spending (acute care
spending for the nonelderly through Medicaid and CHIP plus Marketplace premium tax credits) in each
state under prior law, current law, and current law plus the expanded STLD plans in 2019. The largest
effect on federal spending is attributable to the policy changes made since early 2017, particularly the
elimination of the individual-mandate penalties. The federal spending effect of the expanded STLD
policies alone is negligible, a decrease of roughly 0.2 percent, or $686 million, in 2019. This stability in
federal spending is the consequence of the offsetting effects of reducing the number of people receiving
ACA premium tax credits by about 600,000 while increasing private nongroup premiums approximately
16 percent on average nationally. With the expanded STLD policies in place, however, federal spending
is estimated to be 9.3 percent or $33.3 billion higher than under prior law. This higher spending takes

P O T E N T I A L I M P A C T O F S T L D P O L I C I E S O N C O V E R A G E , P R E M I U M S , F E D E R A L S P E N D I N G 1 7
into account lower enrollment in subsidized Marketplace coverage and Medicaid along with higher
Marketplace premiums stemming from a worsened nongroup insurance risk pool caused the individual-
mandate penalties being eliminated and other 2017 policy changes. The higher average-cost insurance
pool leads to significantly higher premium tax credits per enrollee.
Variation across states in the federal spending effects of expanded STLD policies alone is driven by
interactions between reductions in Marketplace subsidized enrollment and premium increases. For
example, Virginia has more modest losses of nongroup coverage than many other states; as such, the
increase in average premium tax credits received by Virginia residents due to higher premiums
significantly outweighs the federal savings from reduced enrollment. In Arkansas, however, the federal
savings from larger reductions in Marketplace enrollment create small net reductions in federal
spending even in the face of premium increases.
1 8 P O T E N T I A L I M P A C T O F S T L D P O L I C I E S O N C O V E R A G E , P R E M I U M S , F E D E R A L S P E N D I N G
TABLE 5
Federal Costs by State under Prior Law, Current Law, and Current Law Plus Expanded Short-Term Limited-Duration (STLD) Policies, 2019
Millions of dollars
State
PRIOR
LAW CURRENT LAW CURRENT LAW PLUS EXPANDED STLD POLICIES Total
federal spending
Total federal
spending
Difference from Prior Law Total federal
spending
Difference from Prior Law Difference from Current Law
Amount Percent Amount Percent Amount Percent
Full-impact states 289,499 317,356 27,857 9.6% 316,646 27,147 10.9% -710 -0.2% Alabama 4,581 5,009 428 9.3% 4,986 405 8.8% -24 -0.5% Alaska 1,045 1,183 138 13.2% 1,165 120 11.5% -17 -1.5% Arizona 10,145 10,458 313 3.1% 10,396 251 2.5% -62 -0.6% Arkansas 5,185 5,152 -33 -0.6% 5,128 -57 -1.1% -24 -0.5% California 46,027 49,521 3,494 7.6% 49,299 3,272 7.1% -222 -0.4% Colorado 5,449 5,839 390 7.2% 5,834 384 7.1% -6 -0.1% Connecticut 4,402 4,871 469 10.7% 4,871 470 10.7% 1 0.0% Delaware 1,222 1,388 166 13.6% 1,368 145 11.9% -20 -1.5% District of Columbia 1,360 1,417 56 4.1% 1,417 57 4.2% 1 0.0% Florida 20,359 23,380 3,020 14.8% 23,321 2,961 14.5% -59 -0.3% Georgia 9,063 10,697 1,634 18.0% 10,662 1,599 17.6% -35 -0.3% Hawaii 992 1,089 97 9.8% 1,097 105 10.6% 8 0.7% Idaho 1,791 1,981 190 10.6% 1,982 191 10.6% 1 0.0% Illinois 8,864 9,834 970 10.9% 9,821 957 10.8% -13 -0.1% Indiana 8,433 8,538 104 1.2% 8,521 87 1.0% -17 -0.2% Iowa 2,997 3,608 611 20.4% 3,598 601 20.1% -10 -0.3% Kansas 1,857 1,985 128 6.9% 2,005 148 8.0% 20 1.0% Kentucky 8,088 8,831 744 9.2% 8,830 742 9.2% -2 0.0% Louisiana 6,620 7,036 416 6.3% 7,017 397 6.0% -19 -0.3% Maine 1,710 1,939 229 13.4% 1,937 227 13.2% -2 -0.1% Maryland 6,112 6,878 765 12.5% 6,868 755 12.4% -10 -0.1% Minnesota 6,146 6,838 692 11.3% 6,804 658 10.7% -34 -0.5% Mississippi 4,237 4,411 173 4.1% 4,404 166 3.9% -7 -0.2% Missouri 7,559 8,182 623 8.2% 8,227 669 8.8% 45 0.6% Montana 1,868 2,243 375 20.1% 2,215 347 18.5% -28 -1.3% Nebraska 1,303 1,864 562 43.1% 1,853 551 42.3% -11 -0.6% New Hampshire 908 1,062 153 16.9% 1,063 154 17.0% 1 0.1% New Mexico 5,060 5,168 108 2.1% 5,173 113 2.2% 5 0.1% North Carolina 14,045 15,155 1,110 7.9% 15,148 1,103 7.9% -7 0.0%

P O T E N T I A L I M P A C T O F S T L D P O L I C I E S O N C O V E R A G E , P R E M I U M S , F E D E R A L S P E N D I N G 1 9
State
PRIOR
LAW CURRENT LAW CURRENT LAW PLUS EXPANDED STLD POLICIES Total
federal spending
Total federal
spending
Difference from Prior Law Total federal
spending
Difference from Prior Law Difference from Current Law
Amount Percent Amount Percent Amount Percent North Dakota 514 558 45 8.7% 561 47 9.2% 3 0.5% Ohio 14,021 14,697 676 4.8% 14,716 695 5.0% 19 0.1% Oklahoma 4,046 4,724 678 16.8% 4,658 612 15.1% -66 -1.4% Pennsylvania 14,848 16,507 1,659 11.2% 16,414 1,566 10.5% -93 -0.6% Rhode Island 1,100 1,234 133 12.1% 1,232 132 12.0% -2 -0.2% South Carolina 4,812 5,185 373 7.7% 5,208 396 8.2% 23 0.4% South Dakota 683 784 101 14.8% 785 102 14.9% 1 0.2% Tennessee 8,390 9,541 1,151 13.7% 9,585 1,194 14.2% 43 0.5% Texas 27,340 29,219 1,878 6.9% 29,234 1,893 6.9% 15 0.1% Utah 2,819 3,618 799 28.4% 3,588 769 27.3% -30 -0.8% Virginia 5,448 6,852 1,404 25.8% 6,854 1,406 25.8% 2 0.0% West Virginia 2,850 2,959 109 3.8% 2,907 57 2.0% -52 -1.8% Wisconsin 4,729 5,355 626 13.2% 5,329 600 12.7% -26 -0.5% Wyoming 467 567 100 21.5% 567 100 21.5% 0 0.0%
States prohibiting STLD plans 52,461 57,310 4,849 9.2% 57,310 4,849 10.0% 0 0.0% Massachusetts 6,971 6,530 -441 -6.3% 6,530 -441 -6.3% 0 0.0% New Jersey 6,719 6,995 276 4.1% 6,995 276 4.1% 0 0.0% New York 23,970 28,110 4,140 17.3% 28,110 4,140 17.3% 0 0.0% Oregon 5,693 6,217 525 9.2% 6,217 525 9.2% 0 0.0% Vermont 1,207 1,261 55 4.5% 1,261 55 4.5% 0 0.0% Washington 7,902 8,197 294 3.7% 8,197 294 3.7% 0 0.0%
States with moderate STLD impact 16,175 17,440 1,265 7.8% 17,464 1,289 8.6% 24 0.1% Michigan 13,109 14,180 1,071 8.2% 14,206 1,096 8.4% 25 0.2% Nevada 3,066 3,260 194 6.3% 3,258 193 6.3% -2 -0.1%
Total 358,135 392,106 33,971 9.5% 391,420 33,285 9.3% -686 -0.2%
Source: Urban Institute analysis using HIPSM 2018. Reform simulated in 2019.
Notes: The results take into account that Massachusetts has a state-enforced individual mandate and that states have differing laws governing STLD policies. “Prior law” refers to
what would have been the case had the trends in place before January 2017 persisted. “Current law” includes policy changes made since January 2017, including the elimination of
individual-mandate penalties. The District of Columbia is considered a state in this analysis.

2 0 P O T E N T I A L I M P A C T O F S T L D P O L I C I E S O N C O V E R A G E , P R E M I U M S , F E D E R A L S P E N D I N G
Discussion The expansion of short-term limited-duration policies implied in the current administration’s proposed
rule has significant implications, particularly for insurance coverage and premiums in the remaining
ACA-compliant insurance market. We estimate that ACA-compliant private nongroup coverage would
fall by 2.1 million people in 2019 from the expansion of STLD policies alone, exacerbating the nongroup
market decline of 5.5 million people already anticipated in 2019 because of the elimination of the
individual-mandate penalties and other policy changes made since early 2017. The effects will vary
across the states given differences in state laws and regulations as well as differences in health care
costs and population characteristics. In the 43 states most affected, premiums in the ACA-compliant
nongroup insurance market would increase 18 percent on average owing both to the expansion of the
short-term plans and elimination of the individual-mandate penalties. This premium effect would be 20
percent or higher in nine states. Those affected by these large premium increases would be
disproportionately middle-income people with health problems because they prefer health insurance
that covers essential health benefits, are unlikely to have access to medically underwritten short-term
limited-duration policies, and are not financially protected by the ACA’s premium tax credits. For people
who have ACA-compliant coverage and are eligible for premium tax credits, these higher premiums
translate into higher premium tax credits per enrollee paid by the federal government. In total, 9.0
million fewer people would have insurance (minimum essential coverage) compared with prior law.
Several issues cannot be captured through a microsimulation analysis. First, as the ACA-compliant
nongroup insurance markets decrease and as healthier enrollees exit for short-term plans, insurers will
by necessity reexamine the profitability of remaining in the compliant markets. This may well lead to
more insurer exits from the compliant markets in the next years, reducing choice for the people
remaining and ultimately making the markets difficult to maintain. Second, STLD policies are generally
not subject to the ACA’s medical loss ratio requirements,6 and therefore the companies that sell them
can pay higher commissions to their brokers than they can for ACA-compliant plans. As a result, brokers
are likely to market these plans very aggressively, and consumers may purchase them without
understanding how they differ from compliant plans. If this is the case, more people may be pulled out of
the compliant market than we have estimated here, increasing the effects of the policy change. Third,
some people buying the narrower STLD polices will incur serious health problems once enrolled, and
find that their plans do not meet their medical needs. This could lead to increases in unmet medical need
and uncompensated care. Finally, states can impose regulations that would limit the types of short-term
plans that could be sold, and they can effectively prohibit them. While only a small number of states
have done so thus far, more could make such legal and/or regulatory changes and thereby significantly
reduce or even eliminate the effects estimated here.

P O T E N T I A L I M P A C T O F S T L D P O L I C I E S O N C O V E R A G E , P R E M I U M S , F E D E R A L S P E N D I N G 2 1
Notes1 “A Proposed Rule by the Internal Revenue Service, the Employee Benefits Security Administration, and the
Health and Human Services Department,” 83 Fed. Reg. 7437 (Feb. 21, 2018).
2 Our three categories differ from the five categories that the Center on Health Insurance Reforms developed. We use the detailed information in their analysis to assess the practical outcome of state regulatory approaches.
3 For example, Minnesota limits the duration of these policies to 185-day contracts, but they can be renewed for as many as 365 days of coverage in a 555-day period (Dania Palanker, Kevin Lucia, Sabrina Corlette, and Maanasa Kona, “Proposed Federal Changes to Short-Term Health Coverage Leave Regulation to States,” To the Point (blog), The Commonwealth Fund, February 20, 2018, http://www.commonwealthfund.org/publications/blog/2018/feb/short-term-health-plan-proposed-changes.
4 Jared Maeda and Susan Yeh Beyer, “How Does CBO Define and Estimate Health Insurance Coverage for People under Age 65?” Congressional Budget Office blog, December 20, 2016, https://www.cbo.gov/publication/52352.
5 Harriet Sinclair, “Trump Claims Obamacare is ‘Dead’ and ‘You Shouldn’t Even Mention It’,” Newsweek, October 16, 2017, http://www.newsweek.com/trump-claims-obamacare-dead-686219.
6 The one exception seems to be Rhode Island.
References Lucia, Kevin, Justin Giovannelli, Sabrina Corlette, JoAnn Volk, Dania Palanker, Maanasa Kona and Emily Curran.
Forthcoming. “State Regulation of Coverage Options Outside of the Affordable Care Act: Limiting the Risk to the Individual Market.” New York: Commonwealth Fund.
Salzman, Evan. 2017. “Demand for Health Insurance: Evidence from the California and Washington ACA Marketplaces.” Health Care Management Papers. Philadelphia: University of Pennsylvania, The Wharton School.
Errata This brief was updated February 26, 2018. The title and notes for table 4 were altered to remove
references to current law that had been inadvertently copied from tables 1–3.
About the Authors Linda J. Blumberg is an Institute fellow in the Health Policy Center at the Urban
Institute. She is an expert on private health insurance (employer and nongroup), health
care financing, and health system reform. Her recent work includes extensive research
related to the ACA; in particular, providing technical assistance to states, tracking
policy decisionmaking and implementation at the state and federal levels, interpreting
and analyzing the implications of particular policies, and estimating the implications of
repeal and replace proposals. She codirects a large, multiyear project using qualitative
and quantitative methods to monitor and evaluate ACA implementation in states and
nationally. Examples of her research include several analyses of competition in
nongroup Marketplaces, an array of studies on the implications of the King v. Burwell
Supreme Court case, analysis of the remaining uninsured, and codirecting 22 state case
2 2 P O T E N T I A L I M P A C T O F S T L D P O L I C I E S O N C O V E R A G E , P R E M I U M S , F E D E R A L S P E N D I N G
studies of stakeholder perspectives on ACA implementation. She also led the
quantitative analysis supporting the development of a “Roadmap to Universal
Coverage” in Massachusetts, a project with her Urban colleagues that informed the
2006 comprehensive reforms in that state. Blumberg received her PhD in economics
from the University of Michigan.
Matthew Buettgens is a senior research associate in the Health Policy Center, where
he is the mathematician leading the development of Urban’s Health Insurance Policy
Simulation Model. The model has been used to provide technical assistance for health
reform implementation in Massachusetts, Missouri, New York, Virginia, and
Washington as well as to the federal government. His recent work includes a number of
research papers analyzing various aspects of national health insurance reform, both
nationally and state by state. Research topics have included the costs and coverage
implications of Medicaid expansion for both federal and state governments, small firm
self-insurance under the ACA and its effect on the fully insured market, state-by-state
analysis of changes in health insurance coverage and the remaining uninsured, the
effect of reform on employers, the affordability of coverage under health insurance
exchanges, and the implications of age rating for the affordability of coverage.
Robin Wang is a research associate in the Health Policy Center, where he helps
develop Urban’s Health Insurance Policy Simulation Model. Previously, Wang
researched health policy, long-term care insurance schemes, and pay-for-success
models and had professional engagements with the UK House of Commons and the
European Parliament. Wang is an MPA graduate of the London School of Economics
and Political Science.
P O T E N T I A L I M P A C T O F S T L D P O L I C I E S O N C O V E R A G E , P R E M I U M S , F E D E R A L S P E N D I N G 2 3
Acknowledgments Support for this research was provided by the Robert Wood Johnson Foundation. The views expressed
here do not necessarily reflect the views of the Foundation.
The views expressed are those of the authors and should not be attributed to the Urban Institute,
its trustees, or its funders. Funders do not determine research findings or the insights and
recommendations of Urban experts. Further information on the Urban Institute’s funding principles is
available at urban.org/fundingprinciples.
The authors are appreciative of comments from and discussions with Sabrina Corlette, John
Holahan, Genevieve Kenney, Maanasa Kona, Kevin Lucia, Dania Palanker, and Stephen Zuckerman, and
copyediting by Fiona Blackshaw.
ABOUT THE URBAN INSTITUTE The nonprofit Urban Institute is a leading research organization dedicated to developing evidence-based insights that improve people’s lives and strengthen communities. For 50 years, Urban has been the trusted source for rigorous analysis of complex social and economic issues; strategic advice to policymakers, philanthropists, and practitioners; and new, promising ideas that expand opportunities for all. Our work inspires effective decisions that advance fairness and enhance the well-being of people and places.
Copyright © February 2018. Urban Institute. Permission is granted for reproduction of this file, with attribution to the Urban Institute.
2100 M Street NW Washington, DC 20037
www.urban.org
Related Documents