September 2007 CD4CDM Working Paper Series WORKING PAPER NO. 3 end-use energy efficiency under programmatic CDM Potentials and barriers for Christiana Figueres Francisco Avendaño With Chia-Chin Cheng Xianli Zhu Jørgen Fenhann Miriam Hinostroza

Welcome message from author
This document is posted to help you gain knowledge. Please leave a comment to let me know what you think about it! Share it to your friends and learn new things together.
Transcript

September 2007
CD4CDM Working Paper Series WORKING PAPER NO. 3
end-use energy efficiency under programmatic CDM
Potentials and barriers for
Christiana Figueres Francisco Avendaño
With
Chia-Chin Cheng Xianli Zhu
Jørgen Fenhann
Miriam Hinostroza

FOREWORD
A well-functioning carbon market is going to feature prominently in the future global mitigation efforts, and the Clean Development Mechanism (CDM) is paving the way for this to happen. In order to fulfill the current political expectations it is, however, important that the rules and modalities governing the CDM are further developed to enhance its applications and efficiency.
One of the most promising areas for future CDM activities is programmatic CDM (pCDM), wherein the normal project-by-project approval process is aggregated into a broader program including many individual activities. As Yvo de Boor, Executive Secretary of the United Nations Framework Convention on Climate Change (UNFCCC) has said:
Programmatic CDM is expected to enormously enhance the chances of small and poor countries getting access to the CDM. In such countries, single projects are often too small to be commercially attractive. As a consequence, many small and poor countries are not benefiting from the CDM at the moment. The programmatic approach could dramatically change this.
This working paper analyzes the decision taken at the first Meeting of the Parties to the Kyoto Protocol (COP/MOP 1) to include programs in the CDM, and the June 2007 guidance provided by the Executive Board (EB) of the CDM. The paper identifies the potential and the niche for end-use energy efficiency (EE) projects under the new programmatic approach of the CDM. Furthermore, the paper presents the basic understanding of the emission reduction potential in EE and gives insights into how to handle the dispersed nature of most EE efforts. The paper then reviews the CDM portfolio, highlighting projects and baseline methodologies with programmatic characteristics and the challenges inherent to the programmatic approach. Finally, a case study applying the recent EB guidance for programmatic CDM shows the methodological issues of designing and registering EE programs while providing initial guidance to policy makers and project proponents for the identification and design of CDM programs of activities (PoAs).
This working paper is one of many analytical activities under the Capacity Development for the Clean Development Mechanism project (CD4CDM) implemented for the United Nations Environment Program (UNEP) by the UNEP Risø Centre (URC) and funded by the Dutch government. The CD4CDM has, for more than five years now, been building capacity to implement CDM with policy makers and stakeholders in around twenty developing countries. CD4CDM helps generate a broad understanding of the CDM in participating countries, and also helps build the necessary institutional and human capabilities to formulate and implement projects under the CDM.
URC keeps track of the evolving CDM rules and progress of the carbon market through its CDM activities. This working paper is a contribution to furthering the application of pCDM. The URC does, in addition to its CDM capacity development activities, have a large analytical CDM program addressing both specific policy issues and methodological barriers constraining the CDM. Under the CD4CDM, the Centre has prepared analytical material including a number of guidebooks and working papers. The Centre also has its web-based CDM project pipeline, which is a recognized global source of information on CDM projects and has recently, in collaboration with the UNFCCC Secretariat, launched a web-based CDM bazaar to facilitate a link between sellers and buyers in the CDM market.
This study was developed by the URC in collaboration with Francisco Avendaño from A2G Consultants in Peru, and Christiana Figueres, independent consultant and a member of the EB.1 Special thanks go to URC colleagues Sami Kamel and Adrian Lema for appreciable comments and suggestions to this working paper.
John Christensen
Head of UNEP Risø Centre
1 C. Figueres has contributed to the paper in her personal capacity. The paper does not represent the views or position of the CDM Executive Board.
1

Table of Contents Executive Summary..................................................................................................................................... 4 Introduction ................................................................................................................................................. 6 1. Strengthening the CDM: beyond stand-alone projects .......................................................................... 7 1.1 Eliminating the perverse incentive of the CDM ................................................................................... 7 1.2. Beyond stand-alone projects ................................................................................................................ 8 1.3 Policies and PoAs .................................................................................................................................. 9 1.4 Benefits of CDM programs ................................................................................................................. 12 2. Relevant pCDM-type projects and methodologies in the global CDM pipeline .................................. 15 2.1 Programmatic CDM-like projects in the pipeline .............................................................................. 15 2.2 Coordinating entity.............................................................................................................................. 18 2.3 CDM methodologies applied in existing pCDM-like projects............................................................ 20
2.3.1 Approved demand-side EE CDM methodologies..................................................................................... 21 2.3.2 New proposed large-scale methodologies with potential for pCDM application ..................................... 22
2.4 Demand-side EE CDM projects in the pipeline and the role of pCDM ............................................ 23 2.4.1 End-use EE for the industrial sector ......................................................................................................... 23 2.4.2 EE and renewable energy with direct participation by households .......................................................... 24 2.4.3 EE involving the service sector ................................................................................................................ 24 2.4.4 Demand-side EE under CDM—different solutions.................................................................................. 25
2.5 Programmatic CDM implementation using existing methodologies................................................. 25 2.5.1 Application of methodologies and technologies under pCDM................................................................. 26 2.5.2 Time taken for approval of new pCDM-like methodologies.................................................................... 27
3. Understanding end-use EE and its potential for pCDM...................................................................... 29 3.1 End-use energy in human society ....................................................................................................... 29 3.2 Barriers to end-use EE........................................................................................................................ 31
3.2.1. Financial barriers ..................................................................................................................................... 31 3.3 Characteristics of end-use EE that are essential for success............................................................. 33
3.3.1 Efficiency comes with quality .................................................................................................................. 33 3.3.2 Importance of new installations................................................................................................................ 33 3.3.3 Combined technology improvement is cheaper and more efficient.......................................................... 34 3.3.4. Incorporating soft measures with technological improvement gives the optimal gain............................ 34 3.3.5. Collective actions to realize potential for small end-users ...................................................................... 34
3.4 Potential for end-use EE programs .................................................................................................... 35 3.4.1 Residential energy efficiency ................................................................................................................... 35 3.4.2 EE in commercial and services sector ...................................................................................................... 37 3.4.3 Industrial EE............................................................................................................................................. 38 3.4.4 EE in the transportation and agricultural sectors ...................................................................................... 40
3.5 Niche sectors for EE projects and pCDM........................................................................................... 40 3.5.1. Programmatic CDM.................................................................................................................................... 40
3.5.2 Bundled CDM .......................................................................................................................................... 41 3.5.3 Stand-alone CDM..................................................................................................................................... 41
4. Case study: fuel-switching for EE improvements of industrial boilers in Peru.................................. 42 4.1 Introduction ......................................................................................................................................... 42 4.2 Options for CDM programs in Peru ................................................................................................... 42 4.3 Conceptual design of the program...................................................................................................... 45
4.3.1 Scenario one: PoA limited to one methodology and one technology ....................................................... 45
2

4.3.2 Scenario two: adding furnaces and roasters to the fuel switch program................................................... 50 4.3.3 Scenario three: envisioning an all-inclusive package for boilers.............................................................. 52
4.4 Monitoring a multimethodology/technology program ....................................................................... 55 5. Conclusions ........................................................................................................................................... 59 REFERENCES ......................................................................................................................................... 60
3

Executive Summary From the perspective of developing countries the purpose of the CDM is to contribute to national sustainable development and to the global stabilization of greenhouse gases (GHG) concentrations in the atmosphere. These goals can only be achieved through a transformative decarbonization of economic growth in developing countries and not through traditional CDM projects. Though these individual projects are GHG reduction opportunities, they have little or no impact on the carbon intensity of growth. Rather, the CDM must provide the incentive for the transformation of key sectors that have a major potential for GHG reduction.
End-use energy efficiency (EE) is one of the most promising sectors for reducing emissions of sustained growth and increasing energy security in developing countries. EE is, however, severely underrepresented in the CDM due in large part to its dispersed nature, which cannot be easily accommodated into traditional CDM modalities. The recent COP/MOP 1 decision to include program of activities (PoAs) in the CDM provides an interesting alternative for registering CDM activities that are distributed over space and time.
Traditional stand-alone CDM, which comprises the vast majority of CDM project activities to date, is suitable for individual project units that generally belong to a single owner. In the case of several similar CDM projects, the project proponents can use the option of bundling,2 which is appropriate in the case of a small number of medium to large units, or small units in large aggregation that belong to a limited number of owners and occur in a short period of time.
However, when a large number of small to medium units are geographically dispersed and occur over a period of time, such as in the case of end-use EE, pCDM is more appropriate. Typically there are a large number of potential owners, a number which may be unknown at the onset, who participate in the program. This type of emission reduction activity can occur in the long tail part of an end-use EE possibility if plotted against the volume of emissions reduction and is possible under pCDM.
A CDM PoA occurs at two levels: at the program level and at the activity level. At the program level, the PoA is the organizational and financial framework that provides structure to the effort, and is managed by a coordinating entity for a period of no longer than twenty-eight years. At the program activity level, a single measure or a set of measures to reduce GHGs is applied to many plants/installations of the same type over a period of time. Examples of PoAs could include a program to implement an EE standard, a demand-side management program, or a concerted effort to switch industrial facilities from fossil fuel to natural gas (NG). The guidance limits a PoA to the use of one single CDM baseline and monitoring methodology.
Prior to the pCDM decision, several pCDM-like projects had been presented, but due to the absence of the appropriate registration option they were structured as single site projects. The introduction of programmatic CDM is, however, expected to reshape the landscape of CDM implementation by allowing for the potential emission reductions of end-use EE to be tapped by the CDM through the application of any of the three approved small-scale (SSC), or a few of the relevant large-scale methodologies.
In order to illustrate a PoA and the implications of the new guidelines, a potential fuel-switching program in Peru is analyzed under three different scenarios:
1. A PoA limited to the application of one approved baseline methodology on one technology
2 For information on bundling, see section 1.3.
4

2. A PoA using a single baseline and monitoring methodology applied to several process elements/technologies of the same type
3. A PoA that would be a comprehensive program including several methodologies and several technologies
The case study shows that pCDM offers a promising framework to maximize sustainable development benefits through the inclusion of long tail residential/small business sectors in developing countries, and real incentives to promote EE improvements. The restriction to one methodology does, however, limit the possibility of catalyzing large-scale initiatives that involve system-wide efficiency improvements and integrated optimization.
5

Introduction There is no doubt that the CDM has helped industrialized countries move toward compliance of their Kyoto targets. If eighty-five percent of the 2037 CDM projects in the pipeline were registered, and assuming a continuation of the current issuance success of about eighty-three percent, a total of three billion certified emission reductions (CERs) would be available by the end of 2012. This is roughly equivalent to 600 million CERs available for each year of the first commitment period.3 The supply would likely be met since potential annual demand for Kyoto credits over 2008–12 is predicted to be around 600/tCO2e (Lewis 2007).4
However, from the perspective of developing countries the purpose of the CDM is to contribute to national sustainable development and to the global stabilization of GHG concentrations in the atmosphere. These goals can only be achieved through a transformative decarbonization of the economic growth in developing countries. It is evident that these goals cannot be reached on the basis of stand-alone GHG reduction projects alone.
Based on the current sectoral distribution of the CDM project pipeline, 37% of the CERs delivered by 2012 would come from industrial gas projects (HFC, PFC, and N20), whose contribution to sustainable development is questionable. By contrast, projects that do entail sustainable development, such as fuel-switching, renewable energy, and EE, are not very well represented in the pipeline. Seven percent of CERs expected by 2012 come from fuel-switching, twenty-two percent from renewable energy, and only nine percent from EE. Demand-side EE represents only one percent of the total.
Despite the paucity of projects in this sector, EE holds much promise for reducing emissions generated by sustained growth and increasing energy security in developing countries. Energy-efficient options are not common practice due to well-documented barriers such as lack of information on the part of consumers, absence of an appropriate policy framework, and most importantly, the split incentive barrier: Those who make the decision on EE investments are, most often, not the final users who pay the energy bill.
As a financial mechanism that provides an additional income flow, the CDM could help overcome some of these barriers, particularly if efficiency measures are pursued as PoAs. This paper seeks to guide the reader into pCDM by reviewing the evolution of the concept, explaining the rules and modalities, examining current methodologies and project pipelines that could accommodate programmatic EE activities, and investigating new potential project areas. The discussion concludes with a case study. Section one examines the treatment of policies in the CDM, and analyzes the COP/MOP 1 decision to include programs in the CDM. Section two examines the existing and proposed CDM methodologies and projects in the pipeline, and underscores difficulties in the current CDM stipulations for project realization. Section three reviews potential areas for EE improvements, the niche for pCDM and for other end-use EE projects. Finally, section four presents a case study in Peru that is used to illustrate and discuss the methodological issues involved in designing and implementing EE programs under the CDM.
3 All CDM project pipeline analysis and data is calculated based on URC CDM/JI Pipeline Analysis and Database – updated 11 June 2007, http://www.cdmpipeline.org/ 4 “Supply of and Demand for Kyoto Credits” Power Point presentation at Carbon Expo by Mark C. Lewis, from DB Commodities Research
6
1. Strengthening the CDM: beyond stand-alone projects
1.1 Eliminating the perverse incentive of the CDM From a climate change perspective, the sustainable development of developing countries depends on making their economies less dependent on carbon intensive fuels. In the past, economic growth has been based on increasing fossil fuel energy consumption and consequently increasing greenhouse gas (GHG) emissions. Future economic growth must reverse this trend. While growth must continue, the efficiency of energy consumption must improve, and the carbon intensity of production must decrease.
Decarbonization can only occur as the result of deliberate policies and measures. Ironically, over the past few years the CDM has acted as a perverse incentive for developing countries, actually motivating them to restrain from undertaking climate protecting policies and measures. Although it was never explicitly stated, for several years there was an underlying notion that the existence or introduction of a climate-friendly policy or regulation in a developing country would make a project in that sector nonadditional, and thus not eligible for the CDM. “This prevailing interpretation has refrained developing countries from enacting environmental friendly legislation and thus impaired some crucial institutional improvements of such countries in favor of sustainable development” (Sales and Kerlakian 2006).
In Latin America there are several examples of this pernicious effect. In 2003/2004, the Colombian Climate Change Mitigation Group (CCMG) held lengthy consultations with three sectors in which mitigation was deemed most effective—energy, forestry, and transportation—in order to define sector-specific work plans that would lead not only to the identification of specific CDM project activities, but also to the internalization of climate change considerations in the future planning of those sectors. However, in order to avoid the risk of losing additionality, climate-friendly policies were purposely kept in the plans-and-programs realm, without moving them into a regulatory framework. In effect, Colombia’s decarbonization potential was thwarted by the perverse interpretation of the additionality criterion in the CDM.
Fortunately, in November 2005, the EB rendered a decision that rectified this unreasonable situation:
As a general principle, national and/or sectoral policies and circumstances are to be taken into account in the establishment of a baseline scenario, without creating perverse incentives that may impact host Parties’ contributions to the ultimate objective of the Convention.5
For the purpose of implementing this principle, the EB also determined how two different types of policies are to be considered in the definition of a baseline.6
The EB has ruled that “national and/or sectoral policies or regulations that give comparative advantages to more emissions-intensive technologies or fuels over less emissions-intensive technologies or fuels” can only be taken into account when developing a baseline scenario if they were implemented before the adoption of the Kyoto Protocol in December 1997. If such policies were implemented since that date, the baseline scenario of a project activity should refer to a “hypothetical situation without the national and/or sectoral policies or regulations being in place.” This ruling removes the temptation for countries to institute, now or in the future, 5 See UNFCCC EB 22, Annex 3 “Additional Clarifications Regarding the Treatment of National/Sectoral Policies and Circumstances,” November 2005 6 The EB22 regulation on types of policies supersedes the previous EB16 regulation that differentiated Type E+ and Type E- from type L+ and type L- policies in determining a baseline scenario.
7

harmful policies that would inflate the emission reductions claimed by project activities that would also be detrimental to the atmosphere. In the future it is not unlikely that countries will decide to enact fiscal or regulatory policies that are harmful to the environment, but they will at least not do so motivated by the benefit they could get from the CDM.
In the case of “national and/or sectoral policies or regulations that give comparative advantages to less emissions-intensive technologies over more emissions-intensive technologies (e.g. public subsidies to promote the diffusion of renewable energy or to finance energy efficiency programs),” the EB determined that the baseline scenario need not take these policies into account if the policy was implemented since the adoption of the CDM Modalities and Procedures in November 2001 (i.e., the baseline scenario could refer to a hypothetical situation without the national and/or sectoral policies or regulations being in place). Closing the door to the perverse incentive of the CDM, this decision reassures developing countries that their CDM project activities will not be penalized due to climate-friendly policies that have been enacted by governments since 2001.
This decision ensures that the introduction of a policy reducing GHGs will not adversely affect the quantification of emission reductions in the project activity. This is a necessary but not sufficient ruling in the progress of the CDM as an effective instrument for the decarbonization of developing countries. The CDM also needs to accelerate adoption and implementation of climate-friendly policies throughout the developing world.
1.2. Beyond stand-alone projects The current practice of single site, or stand-alone, CDM projects will not suffice to curb emission trajectories in developing countries. Developing countries must go beyond these isolated efforts to include broader sectoral approaches to mitigation. The 2004 World Energy Outlook, published by the International Energy Agency, warns that “if governments stick with the policies in force as of mid-2004, the world’s energy needs would be almost sixty percent higher in 2030 than they are now” (IEA 2004, 24). Well over two-thirds of the projected increase in emissions would likely come from developing countries. Global energy trends could markedly improve if, under an alternative policy scenario, “countries around the world were to implement a set of policies and measures [emphasis added] that they are currently considering or might reasonably be expected to adopt” (IEA 2004, 37).
The need for broad climate-friendly policies introduced the topic of sectoral approaches to mitigation. Analysts, such as Samaniego and Figueres (2002), proposed the inclusion of sectoral approaches—otherwise known as Sectoral CDM (S-CDM)—in the market mechanisms:
Under the S-CDM, developing countries would be encouraged to develop regional, sectoral, sub-sectoral, or cross-sectoral project activities, which would be the result of specific sustainable development policies, measuring the attained reductions, and selling those on the international emission reduction market. Thus, a sectoral CDM project activity could be the modernization of the entire cement industry in a country as a result of a government policy, and a cross-sectoral CDM project activity could be achieving a certain efficiency standard in all industrial motors as a result of new standard setting.
The next few years saw a lively discussion regarding sectoral approaches to mitigation. Figueres (2005) once again used the term Sectoral CDM to refer to regional, sectoral, sub-sectoral, or cross-sectoral project activities that are the result of deliberate governmental policies.8 Cosbey
8 The highest impact could be attained in the intensely emitting sectors such as energy supply, transport, and cement production.
8

(et al. 2005) has differentiated between “policy-based CDM” (understood as public sector policies or standards where the policy itself is the CDM project and all emissions reductions that can be unambiguously attributed to the implementation or enforcement of this policy would be eligible as CERs), and “sectoral CDM” (in this usage, referring specifically to private sector initiatives that voluntarily establish a sectoral baseline and grant carbon credits to those companies that exceed the baseline performance). Sterk and Wittneben (2005) have also distinguished between “policy-based” government initiatives and private sector, or “clustered,” initiatives.
In order to reconcile the semantic differences and offer a concept that would include both public policy and private sector initiatives, Figueres, Haites, and Hoyt (2005) then suggested the concept of pCDM, wherein emission reductions are achieved by multiple actions executed over time as a result of either a government measure or a private sector initiative. pCDM was taken to the COP/MOP 1 in Montreal in November 2005, and was approved by the parties as an option for CDM projects in the first commitment period.
In terms of broader abatement outside of the current market mechanisms, the discussion of the relative merits of sectoral and policy-based mitigation activities is not over. It is likely that these concepts will be taken up again as important elements of the post-2012 regime, and will be the subject of further elaboration.
1.3 Policies and PoAs In Montreal, the proponents of pCDM argued that developing countries need an incentive to accelerate GHG-reducing policies and initiatives. The opponents held that such policies, which are the responsibility of developing countries, do not necessarily lead to actual reductions. After arduous negotiations the following compromise language was reached:
. . . a local/regional/national policy or standard cannot be considered as a clean development mechanism project activity, but project activities under a program of activities can be registered as a single clean development mechanism project activity. . . . provided that CDM methodological requirements are met. (Decision 7/CMP.1, paragraph 20)
In other words, the adoption of a policy or standard in and of itself cannot be submitted as a CDM project. This restriction was justified on two grounds. First, all too often policies, regulations, or standards are adopted but are not implemented, due to lack of enforcement capabilities, lack of access to financing, or even absence of the appropriate technology. Such an empty measure, while well intended, cannot be granted CERs. Second, even in the case that policies are enacted, there are difficulties in attributing an observed GHG reduction to a particular policy, as well as in measuring and verifying the corresponding GHG impact. Thus policies, at least for the time being, have been rendered ineligible under the CDM. However, if a policy is implemented by a concrete PoA directly achieving emission reductions that can be measured and are verifiable, the PoA is eligible under the CDM and can be submitted as a single CDM project activity.
During the twelve months following the COP/MOP 1 decision, the EB considered a wide array of issues inherent in the design and registration of PoAs. The first version of specific guidance on the matter was issued by the EB at its twenty-eighth meeting in December 2006. It was revised several times by the EB and finalized at the thirty-second meeting in June 2007. This paper takes that guidance as the basis for the discussion, in full awareness that the EB has stated that guidance on PoAs could be further adjusted in the future.
One of the most important issues addressed by the guidance on programs is the relationship between policies and programs. Programs that stem from mandatory policies and regulations are
9

permissible provided it is demonstrated that these policies and regulations are not systematically enforced. If they are enforced, the program must provide proof that it increases the enforcement beyond the mandatory level required.9
A CDM PoA is considered “a voluntary coordinated action by a private or public entity which coordinates and implements any policy/measure or stated goal (i.e., incentive schemes and voluntary programs), which leads to GHG emission reductions or increases net GHG removals by sinks that are additional to any that would occur in the absence of the PoA, via an unlimited number of CDM program activities (CPAs).”10 Examples could include a program to implement an EE standard, a demand-side management (DSM) program, or a concerted effort to switch industrial facilities from fossil fuel to NG.
A PoA must be additional to what would have occurred in its absence. In order to show its additionality, a PoA must demonstrate that in the absence of the CDM: (1) the proposed voluntary measure would not be implemented, (2) the mandatory policy or regulation would not be systematically enforced, or (3) that the PoA would lead to a greater level of enforcement of the existing mandatory policy or regulation.11 The additionality of the individual CPAs can be shown using the approved tool for the demonstration of additionality.
A CPA is identical to a traditional stand-alone CDM project in the sense that both must comply with all the procedures and modalities of the CDM and each must include activity that has a direct, real, and measurable impact on emission reductions. A PoA does, however, differ from a stand-alone CDM project in the following ways:
1. Multiplicity of activities to reduce GHG. The program is a deliberate effort that results in a multitude of GHG reduction activities occurring over time in multiple sites. The sites could be located within one or more city, region, or country, as long as each involved country submits a Letter of Approval (LoA).
2. Managing entity. The program is coordinated or managed by one entity, which can be private or public, and does not necessarily achieve the reductions but promotes others to do so. The entity must identify measures to ensure that all project activities under its program are neither registered as single CDM project activities nor as part of another registered program. The coordinating entity is responsible for making any arrangements for the distribution of CERs and for communicating with the EB.
3. CPAs. A program is implemented via an unlimited number of CPAs. A CPA is a single measure, or set of interrelated measures, designed to reduce GHG emissions within a predefined area. This area can include one or many locations, as long as they are of the same type. All CPAs in a program must apply one approved baseline and monitoring methodology. At registration, the program must define the type of information that is to be provided for each CPA to ensure that the CPA is eligible under the program and that the resulting emission reductions are real and measurable. As with all other project activities, the crediting period of a CPA is either a maximum of seven years, which may at most be renewed two times, or a maximum of ten years with no option of renewal.
4. Duration. The GHG-reducing activities do not necessarily occur at the same time. A program can have a duration of up to twenty-eight years (or sixty years for afforestation and reforestation). Although all actions respond to the same program, they can occur either simultaneously, or throughout the duration of the program. The managing entity can add a CPA to the program at any time during the duration of the PoA.
9 Annex 38, EB32 10 Annex 38, EB32 11 Annex 38, EB32
10

5. Monitoring and verification. The total volume of emission reductions to be achieved by a program may not be known at the time of registration. Each CPA shall be monitored according to the monitoring methodology that has been approved for that type of project activity. In cases where there are many small GHG reductions, statistically sound sampling may be proposed in the monitoring methodology submitted for approval. For purposes of verification, the DOE may also use sampling techniques as long as they ensure the accuracy of the emission reductions.
In order to capture the differences between the registration of traditional stand-alone projects and the registration of programs, the EB is creating the following new forms for submission of a program:
Program of Activities Design Document (PoA-DD) for the submission and registration of a program
Program Activity Design Document (CPA-DD) for the addition of every CPA to the registered program
It may be helpful to illustrate the characteristics of a CDM program with a few concrete examples. Table 1.1 shows the characteristics of a CDM program of activities and how these apply to either a city-wide efficient lighting program, or a national program to switch industrial boilers, furnaces, and roasters from fossil fuel to NG.
Table 1.1 Characteristics and application of a PoA Characteristics of
a PoA Examples
Implementation of an EE lighting program
Implementation of a fuel-switching program in industrial facilities
Deliberate program Replace incandescent bulbs with CFLs in all households in a city
Switch industrial facilities from residual fuel oil or diesel to NG
Voluntary No mandatory policy to replace incandescent bulbs
No mandatory policy for fuel-switching
One coordinating entity; Many implementers
Coordinator could be utility, energy efficiency agency, or an NGO Implemented by owners of households in program area
Coordinator could be NG provider, an NGO, or a private company Implemented by owners of industrial facilities
One type of facility All households All industrial facilities that currently use fuel oil or diesel
Multiple sites
The managing entity could divide the city into specific areas, making each area one CPA. Each CPA would have many locations (homes) where the bulbs are replaced
Fossil fuel burning furnaces, boilers, and roasters would be included in the program Each individual furnace/boiler or roaster is a CPA
Not simultaneous New efficient bulbs would be purchased or installed by individuals over period of time
Facility owners would be able to switch fuels only once they are connected to the gas pipeline
One methodology Each CPA (city area) applies the same CDM baseline and monitoring methodology
Each CPA (furnace/roaster) applies the same CDM methodology
Volume of GHG reductions not known at registration
Cannot predict ex-ante exactly which and how many households would join the program. The level of GHG reductions would only be known once the bulbs are installed and functioning CERs are not issued until verification has occurred
Cannot predict ex-ante exactly how many industrial facilities would switch to NG. The level of GHG reductions would only be known once the burners/furnaces are switched to NG and functioning CERs are not issued until verification has occurred
Monitoring
Each CPA (city area) is monitored The monitoring methodology would likely be based on sampling of homes within the CPA area
Each CPA (furnace/boiler) is monitored The monitoring methodology would be applied to each furnace
Verification Can include sampling Can include sampling
11

The COP/MOP 1 decision that allows for programs in the CDM also allows bundling of large-scale projects.12 Programs and bundles are fundamentally different options for registering CDM project activities. In a bundle, each activity could be undertaken individually as a CDM project activity (e.g., three wind farms) and the various project activities are only bundled together in order to reduce CDM-related transaction costs. In a program, the individual GHG-reducing activities are not, in and of themselves, CDM project activities, but rather the entire set of activities constitutes a single CDM project activity under the PoA. In a bundle the composition does not change over time and the exact type and site of each project activity must be identified ex-ante. In a program the project activity area is clearly delineated ex-ante, but the exact site and volume of the GHG emission reductions may not be confirmed until monitoring and verification have taken place. In a bundle each project participant achieves the GHG reductions through the project activity, though, as mentioned previously, a program’s managing entity is not necessarily responsible for achieving the reductions itself. Each entity participating in a bundle is a CDM project participant. In a program the entity running the program is a project participant but the multiple end-users achieving the reductions are not individual CDM project participants. Table 1.2 summarizes these differences.
Table 1.2 Differences between a bundle and a program BUNDLE PROGRAM
Sites Ex-ante identification of exact sites GHG reductions must be estimated ex-ante Exact sites may not be known, but type and maximum potential volume is known
Each single activity is represented by a CDM project participant
Only the entity implementing the program represents the project activity as a CDM project participant Project
participants Project participants are identical to entities achieving reductions
The project participant does not necessarily achieve the GHG-reducing activities, but rather promotes others to do so
Each activity in the bundle is an individual CDM project activity
The sum of all individual activities under the program is the CDM project activity
Composition does not change over time
No pre-fixed composition (uptake of an incentive could be unknown) Project
activities All projects in a bundle must be submitted and start at the same time
Program is validated and registered based on identification of targeted activities Actual reductions are not confirmed until verification, and that can be done by sampling
1.4 Benefits of CDM programs
The opening of the CDM to programs has several important benefits. The structure of CDM programs lends itself particularly well to EE projects, which is one of the most promising sectors for improving the adequacy and reliability of the power system, increasing energy security, and reducing emissions in developing countries. In fact, the World Energy Outlook estimates that EE could account for sixty-five percent of the energy-related emission reductions attainable through policies and measures currently under consideration in developing countries (IEA 2006). Yet this opportunity has not been captured by the CDM. Emission reduction activities in these areas are often dispersed, have high transaction costs, and relatively low credit flows. Out of the 2037 projects currently in the CDM pipeline (see Table 1.3 below), 288 are EE projects (mostly
12 COP/MOP1, Decision 7, paragraph 21
12

industrial efficiency). These represent only eight percent of the expected annual CERs on the market.13 Table 1.3 also shows that only 113 of these 283 projects are demand-side EE projects.
Table 1.3 The sectoral distribution of the CDM projects in the pipeline as of 11 June 2007 Type
Hydro 426 21% 176222 9%Biomass energy 411 20% 150350 7%Wind 238 12% 111235 6%Agriculture 177 9% 44375 2%EE own generation 154 8% 158230 8%Landfill gas 146 7% 185944 9%Biogas 115 6% 36370 2%EE Industry 94 5% 17237 1%Fossil fuel switch 68 3% 137355 7%N2O 38 2% 247046 12%Coal bed/mine methane 36 2% 107625 5%Cement 31 2% 32443 2%Fugitive 21 1% 77668 4%EE Supply side 20 1% 6314 0%HFCs 18 1% 504247 25%EE Service 11 1% 331 0%Geothermal 8 0% 10976 1%Solar 7 0% 1111 0%Afforestation & Reforestation 7 0% 5392 0%EE Households 4 0% 510 0%Transport 4 0% 2019 0%Energy distrib. 1 0% 655 0%PFCs 1 0% 542 0%Tidal 1 0% 1104 0%Total 2037 100% 2015299 100%HFCs, PFCs & N2O reduction 57 3% 751835 37%CH4 reduction & Cement & Coal mine/bed 411 20% 448054 22%Renewables 1206 59% 487368 24%Supply-side EE 175 8,6% 165199 8,2%Demand-side EE 113 5,5% 20096 1,0%Fuel switch 68 3,3% 137355 6,8%Afforestation & Reforestation 7 0,3% 5392 0,3%
2012 CERs (000)number
Source: URC CDM Pipeline Analysis and Database
Among these projects, four target end-use applications in the household sector and eleven in the service sector. Sixty-nine of the ninety-four demand-side EE industry projects are happening in heavy industries such as iron and steel, cement, and chemicals.(see Figure 1.1 below).
Figure 1.1 shows that the traditional structure of the CDM is geared toward stand-alone projects, and not toward projects that involve a large number of implementers in different sites over a period of time. The new possibility of structuring end-use EE projects as programs could significantly increase the representation of these projects in the CDM market. This potential is discussed in section two.
Second, programs could help to “democratize” the CDM. In the EE sector, improved technology deployment does not typically occur on an individual basis but rather on a gradually collective basis as the result of intentional programs. These programs are able to reach large numbers of individual households and smaller industrial firms, offering them improved technology (cooking
13 Calculated based on CDM Pipeline Analysis and Database at the CD4CDM website updated 11 June 2007, http://www.cd4cdm.org/
13

stoves, appliances, lighting, motors, air conditioners, etc.) installed according to the client’s purchasing power and willingness to pay.14 Thus CDM programs open the benefits of the CDM to many small users.
Number of EE industry projects in each sector
0
5
10
15
20
25
Iron
& st
eel
Cem
ent
Petro
chem
ical
s
Che
mic
als
Pape
r
Cok
e ov
en
Elec
troni
cs
Food
Build
ing
mat
eria
lsN
on-fe
rrou
sm
etal
s G
lass
Mac
hine
ry
Min
ing
Text
iles
Con
stru
ctio
n
Met
al p
rodu
cts
Woo
d
Fig. 1.1. Distribution of the demand-side EE projects in industry
Third, programs speak to the needs of small countries not yet participating in the CDM.15 In the absence of large emitting facilities, these countries could design CDM programs that involve many small users such as those described above. It should be said however, that countries with large populations will of course be equally able to benefit from PoAs and have the potential to put higher volumes of emission reductions on the market.
Fourth, a program approach promotes decarbonization of the respective sector. Traditional stand-alone projects tend to be individual efforts at a carbon upgrade within the limited boundary of a single facility or enterprise, and thus produce little to no transformational effect on the sector or economy. While such a project may well improve the GHG intensity of the facility, it makes little contribution—particularly if it is the only one of its kind—to decarbonizing production or consumption patterns. By contrast, a program approach could promote the much-needed transformation in the energy trends of developing countries.
Finally, and perhaps most importantly, CDM programs mark an important step in the meaningful participation of developing countries in global climate regime. By assigning a CER value to reductions achieved under a PoA, the regime is providing an incentive for developing countries to adopt and implement climate friendly policies and measures. In the short term this could increase the level of supply of CERs on the market for the period 2008–2012. In the medium term, it could help prepare developing countries for a broader participation in the future climate regime.
Having discussed the importance of pCDM, section two examines the existing and proposed CDM methodologies that could potentially be applicable for pCDM activities; reviews projects in the pipeline that have the characteristics of pCDM; and highlights some difficulties in realizing energy demand-side CDM projects.
14 Bundling is not appropriate for these cases where specific sites are unknown at registration. 15 The pipeline makes clear that there is an inequity in the geographic distribution of CDM projects. Sixty-nine percent of all CDM projects are hosted in Asia and twenty-seven percent in Latin America. Sub-Saharan Africa has only 1.4% of the projects. North Africa and the Middle East have 1.5% of the projects.
14

2. Relevant pCDM-type projects and methodologies in the global CDM pipeline
Due to the existence of enormous opportunities for emission reductions involving small actors, the introduction of pCDM is expected to reshape the landscape of CDM implementation by providing incentives for sector-wide transition to a low-carbon society and significantly increasing the emission reductions from CDM. It may also change the position of countries toward a post-2012 international climate regime, especially large developing countries with many policies and measures that could contribute to emission reduction. As an illustration of the potential, consider a case study of the Chinese transportation sector. They have estimated that policies and measures for effectively encouraging very small hybrid vehicles and promoting public transport could achieve a seventy-nine percent greater reduction in emissions by 2020 than business-as-usual (BAU) scenarios. This possible emission reduction, equaling eighty million tons of carbon, is equivalent to almost ten times the total emissions from cars in China in 2003 (Ng and Schipper 2005).
Since its formal introduction, pCDM has progressively become more defined with established rules. In June 2007, the EB produced detailed guidance and rules, but it was clear from the beginning that there was no institutional barrier to the implementation of CDM PoAs under the international regulatory framework (Figueres 2005). CDM projects with programmatic characteristics have, consequently, been implemented even before being formally conceptualized under PoAs.
Even preceding COP/MOP1, some early actors had already started to implement CDM beyond the single stand-alone projects and bundles of smaller single-site project activities. Attracted by the enormous potential of emission reduction involving small actors, some public and private entities had moved to the programmatic realm. Some of the early projects included pCDM features, such as the existence of a coordinating entity that provided incentives for emission reduction by households or small industrial or commercial energy users and the participation of multiple, in some cases, thousands of small actors.
Section two focuses on identifying existing projects in the international CDM pipeline with pCDM features and elements. It will probe into the progress that has been made and the barriers encountered in the course of pCDM implementation to date.
This section will not focus on supply-side EE due to the fact that most of these projects tend to involve large industrial installations and facilities that are usually more suitable for stand-alone CDM projects or bundles. A large share of the existing projects in the pipeline with programmatic characteristics is solar energy and biogas for households. In this section more emphasis is given to both renewable energy for households (distributed renewable energy supply) and demand-side EE.
2.1 Programmatic CDM-like projects in the pipeline
By the time of COP/MOP 1, ten CDM projects with programmatic features had reached at least the validation stage while four others were waiting for methodology approval (Figueres 2005; Fenhann 2005). Most of these early pCDM-type project activities did not explicitly indicate in their project design documents (PDDs) that they were programs, instead their PDDs were prepared as though they were stand-alone projects or bundles. This effectively closed the door to the possibility of adding subsequent emission reduction activities under the program during its duration (a feature currently envisioned for pCDM projects). In these projects the participants
15

indicated the emission actions to be covered under the program and the estimated emission reductions to be achieved.
As of 11 June 2007, 2037 projects (including fourteen rejected by the EB and five withdrawn by the project participants) exist in the CDM project pipeline. Among them there are twenty-one projects with pCDM characteristics. Table 2.1 shows, however, that among the ten registered pCDM-like projects in the pipeline, half are renewable energy supply for households and half are EE improvement. Among the five EE improvement projects, three are EE activities involving public buildings, one is energy efficiency for urban housing, and the other one is public rapid transit system. Other than the bus rapid transit (BRT) project, all the other nine are SSC. It is also worth noting that the BRT project focuses more on urban planning than on technology upgrade.
Table 2.1 also indicates that in addition to the ten projects already registered, another eleven have reached validation stage. Like the first ten projects, they are mostly SSC. Fourteen of the existing twenty-one projects (registered and in validation) are renewable energy projects, mainly solar and biogas for households. There are three SSC projects of electricity generation from renewable sources, including one small hydro promotion and two biomass-based power generation projects (one of which is rice husk-based and the other biomass gasifier-based). These can also be identified as renewable energy for local rural communities. There is only one project in the small industry sector: the Egyptian brick factory project. Regarding EE improvement, little progress has been made under the CDM in general. Only six of the twenty-one pCDM-like projects in the pipeline involve EE improvement. Figure 2.1 summarizes this discussion.
1 EE for transportation
1 fuel switch
3 EE for service
Public transit system 6 EE
2 EE for households 1 urban house energy upgrade
1 efficient cook stove (fuel switch)
EE for public buildings
Brick making1 fuel switch for industry
1 small hydro for rural areas
1 biomass-based electricity generation1 biomass-based mechanical energy for rice mills
5 Biogas
5 solar
10 RE for households
1 solar water heater 1 solar cooker 3 Solar PV
Fig. 2.1. The type of existing pCDM-like CDM projects in the UNFCCC pipeline
16

Table 2.1 Programmatic CDM-like projects on the UNFCCC website as of June 2007
PCDM-like projects Approved methodologies (AMs)
Emission reduction activities Type
Already Registered Kuyasa low-cost urban housing energy upgrade project, Khayelitsha (Cape Town, South Africa)
AMS-I.C. + AMS-II.C. + AMS-II.E.
Insulated ceilings, solar water heater installation and EE lighting
EE for household
Photovoltaic kits to light up rural households (7,7 MW), Morocco
AMS-I.A. Photovoltaic kits to light up rural households
Solar for households
Biogas Sector Partnership Nepal (6500 units) Activity One
AMS-I.C. Biogas digesters to households Biogas for households
Biogas Sector Partnership Nepal (6500 units) Activity Two
AMS-I.C. Biogas digesters to households Biogas for households
Bagepalli CDM Biogas Program (5500 units of 2 m3), Nepal
AMS-I.C. Biogas digesters for households Biogas for households
CDM Solar Cooker Project, Aceh One, Indonesia
AMS-I.C. Transfer and promote most advanced technologies of solar cookers and of heat retaining containers
Solar for households
Moldova Biomass Heating in Rural Communities, Project One
AMS-I.C. + AMS-II.E. + AMS-III.B.
Installation of new heating systems for a series of public buildings in rural area and rehabilitation measures related to the respective buildings
EE for buildings
Moldova Biomass Heating in Rural Communities, Project Two
AMS-I.C. + AMS-II.E. + AMS-III.B.
Installation of new heating systems for a series of public buildings in rural area and rehabilitation measures related to the respective buildings
EE for buildings
Moldova energy conservation and GHG emission reduction
AMS-II.E. +AMS-III.B.
Energy conservation measures in public buildings
EE in public buildings
BRT Bogotá, Colombia: TransMilenio Phase II to IV
AM31 Establish a sustainable mass urban transport system based on a Bus Rapid Transit (BRT) system
Public transit
Request review Egyptian Brick Factory GHG Reduction Project (request review)
ACM9 242 brick kilns switch from heavy oil to NG as their fuel
Fuel-switching for brick factories
In validation Marketing of low-cost irrigation devices in rural areas of Bihar and Uttar Pradesh, India
AMS-I.B. Facilitate the marketing of 20,000 low cost irrigation devices called treadle pumps (TPs) in rural areas
Mechanical energy for agriculture
CDM COOK STOVE PROJECT Kupang One, Indonesia (30,000 units)
AMS-I.C. Promote highly efficient biomass-fired cook stoves and heat retaining devices to households that use fossil fuel for cooking
EE for households
Installation of 30,000 Solar Home Systems (30-75Wp) in Rural Households
AMS-I.A. Spread Solar Home Systems among households with no access to grid, for displacing conventionally used fuel sources for lighting and operation of television and radio
Solar for households
Rice husk-based renewable energy generation through gasification for rice mills
AMS-I.B. Install rice husk-based gasifier systems power generation, thereby replacing existing diesel consumption in rice mills
Biomass-based power generation
Bagepalli CDM Solar Hot Water Heating Program (25,790 solar water heaters), Nepal
AMS-I.C. 25,790 solar hot water heaters installed for community and private hot water supply
Solar for households
Karnataka CDM Photovoltaic Lighting Program (10,000 LED home lighting systems)
AMS-I.A. + AMS-II.C.
Install 10,000 solar home systems and 200,000 LED home Systems in rural homes and community buildings, LED replacing incandescent fitting
Solar for households
One hundred village biomass AMS-I.A. Establish one hundred biomass gasification- Biomass-
17

gasifier-based power plants totalling 5.15 MW for Decentralized Energy Systems India Pvt Ltd. (DESI Power)
based power plants in various villages to provide power for microindustries, energy services, and water pumping in villages
based power supply
Micro-hydro Promotion by Alternative Energy Promotion Centre (AEPC)
AMS-I.A. 750 micro-hydro plants (MHPs) varying from 10 to 500 kW capacities would be installed for local communities and entrepreneurs, with support from government
Small hydro
Kolar District Biogas Project, India AMS-I.C. Set up 12,000 biogas plants (digesters) of 2 m3 capacity each for single households
Biogas for households
Vedaranniyam Biogas Project, India AMS-I.C. Set up 12,000 biogas plants (digesters) of 2 m3 capacity each for single households
Biogas for households
Source: See UNFCCC website, www.unfccc.int
2.2 Coordinating entity
A review of the coordinating entities of existing pCDM-like project activities and how they manage to overcome the various barriers to such activities under baseline scenarios indicates that the public sector’s support and participation has been of great importance and in some cases, indispensable to these projects. Out of the first twenty-one pCDM-like projects in the pipeline, many are directly coordinated by governmental agencies; more than half are getting public funding or subsidies in various forms. Increasingly some private businesses are, however, also coordinating pCDM-like activities with the support of CER sales revenues (see Table 2.2). An examination of the coordinating entities and the approaches they adopt to mobilize and enable the participation of small actors could shed light on the kinds of barriers to be addressed.
Coordinating entities play an important catalyzing role in pCDM. They offer funds, technical, and consulting support to the numerous small actors, significantly lowering the threshold for CDM participation. They also function as centers of excellence, are familiar with the international CDM rules, national policies, and relevant emission reduction technologies; and have greater access to funding.
The programmatic CDM opportunities can be generally categorized into two types: those whose costs can be covered by CER income and those whose implementation costs are higher than the potential CER income. An example of the first case could be a program for setting up household biomass digesters. To enable households to accept the digesters, the coordinating agents may need to pay part of the digester costs. The coordinator may also need to pay the monitoring meters, organize trainings, and regularly communicate with the participating households. Moreover, the coordinator needs to pay for PDD preparation, validation service by a DOE, registration, and verification. In order to be successful, the revenue from CDM must be high enough to cover these costs and leave some reasonable costs to attract the participation of a commercial agent. For this kind of project, the CDM program coordinating service is profitable and the participation of public entity is not absolutely necessary. For some types of small emission reduction activities, the coordinating service is not, however, commercially viable. In such cases fiscal subsidies, or some angel funding from the private sector, are indispensable.
18

Table 2.2 Coordinating entities and approaches of the registered pCDM-like projects Approved pCDM-like project Coordinating entity Type Approach
Kuyasa housing City of Cape Town Public South African public funding and training
Morocco PV Lighting Ministry of Electricity Public Partial funding under the rural electrification program
Biogas Sector Partnership Nepal (two projects)
Alternative Energy Promotion Center, (AEPC), Nepal Ministry of Environment Science and Technology
Public Support subsidy
Micro-hydro Promotion by Alternative Energy Promotion Centre (AEPC), Nepal
Alternative Energy Promotion Center, (AEPC), Nepal Ministry of Environment Science and Technology
Public
Public subsidy under the Rural Energy Development Program (REDP) and Energy Sector Assistance Program (ESAP)
Bagepalli CDM Solar Hot Water Heating Program CER India Pvt. Ltd. Public
Indian Renewable Development Agency provides some soft loans of between two and five percent interest (after subsidy from the Ministry of Nonconventional Energy) for users to install solar hot water heating systems.
CDM Solar Cooker Project Aceh One
Government of Aceh Province, Indonesia, Klimaschutz e.V., Bonn, Germany, German experts on solar cookers, fuel saving devices and CDM
Private
PT Petromat Agrotech Monitoring and project administration; assembly, distribution and maintenance of the equipment A Germany company provides investment and get one hundred percent of the CERs
Moldova Biomass Heating in Rural Communities Project Numbers One and Two, Moldova energy conservation and GHG emission reduction:
Moldova Social Investment Fund, World Bank Community Development Carbon Fund
Public Subsidy from SIF, Carbon Finance Unit Moldova owns the program
BRT Bogotá, Colombia: TransMilenio Phase II to IV Local community Public The local municipality provides the
transit infrastructure One hundred village biomass gasifier project Private company Private With grants from World Bank and
subsidies from the Indian government
Bagepalli CDM Solar Hot Water Heating Program Private company Private
Indian Ministry of Nonconventional Energy subsidizes low-interest rate (two to five percent) soft loans to users
CDM COOK STOVE PROJECT Kupang 1, Indonesia Local government Public With a German company who provides
the devices and get the CERs
Egyptian brick factory project Private company Private No public funding, completely relying on sales revenue from CERs
Installation of 30,000 Solar Home Systems (SHS) in Rural Households
A “not-for-profit” company Private SHS sold on discounted price, with CER
sales revenue going to the SHS seller
Karnataka CDM Photovoltaic Lighting Program, India Private company Private
Sales revenue from CERs allows the PV lighting kit supplier to provide the equipment at low prices
Kolar District Biogas Project, India Private company Private CER sales revenue enables the supplier
to provide the equipment at low prices
Marketing of low-cost irrigation devices in rural areas Irrigation device manufacturers Private
Some bilateral development funding for market development and promotional costs of the activity
Micro-hydro Promotion by Alternative Energy Promotion Centre (AEPC)
Alternative Energy Promotion Centre (AEPC) under the Nepal Ministry of Environment, Science and Technology
Public Coordination and subsidy
Rice husk-based renewable energy generation through gasification for rice mills
Rice Mill Owner’s Green Association (RMOGA)
Public-private joint efforts
West Bengal Renewable Energy Development Agency (WBREDA) offers technical support and coordination
Vedaranniyam Biogas Project Private company Private CER sales revenue enables the supplier
to provide the equipment at low prices Source: Based on information in the relevant PDDs
19

2.3 CDM methodologies applied in existing pCDM-like projects
As indicated in the COP/MOP 1 decisions and the EB Guidance on PoAs, an approved CDM methodology is a precondition for the registration of a PoA, the same is required for the registration of single or stand-alone CDM projects.
The last few years have witnessed significant progress with CDM methodology approval. By the end of May 2007, there were forty-five AMs for large-scale CDM projects (excluding the seven AMs that were cancelled), ten consolidated and twenty-one SSC methodologies; however, not all of these methodologies are suitable for application under pCDM. As a rule, projects involving the emission reduction of nonCO2 gases with high global warming potential (GWP) (e.g., HFCs, PFCs, SF6, N2O, and CH4) are usually of low incremental cost for emission reduction and concentrate on large industrial facilities. Most EE would come from the reduction of CO2 emissions.
Table 2.3 lists the methodologies used by the pCDM-like projects in the pipeline. Most of the projects apply SSC methodologies. More than half of the projects are electricity, thermal, and mechanical energy for end-use, especially in the form of biogas, solar, and biomass. Clearly, energy supply is one of the promising areas for pCDM.
There are few methodologies for demand-side energy pCDM-like projects, especially in terms of EE for buildings and specific technologies. In some cases a fossil fuel-switch methodology is used to attain EE improvements.
Table 2.3 Demand-side and end-use CDM approved methodologies (AMs) and their applications
Type Approved methodologies AMs
Projects in pipeline
PCDM-like
projectsRemarks
AM17: Projects improving steam system efficiency by replacing steam traps and returning condensate
0 0 Approved in June 2005
AM18: Steam optimization systems
14 0
Energy-intensive industrial facility, bundle and single-site project would be good enough
ACM3: Emission reduction through partial substitution of fossil fuels with alternative fuels in cement manufacture
12 0
Energy intensive industry, bundling, and single-site project would be good enough
AM38: Improved electrical EE of an existing submerged electric arc furnace used for the production of SiMn
1 0
Approved in February 2005
Energy efficiency for industries, large scale
AM44: EE improvementprojects boiler rehabilitation or replacement in industrial and district heating sectors
0 0
Approved in February 2007
EE in service sector, large scale
AM20: Water pumping efficiency improvement 0 0
EE for household, large scale
AM46: Replacement of incandescent by compact fluorescent bulbs
0 0 Approved in February 2007
EE in public transport, large scale
AM31: Baseline methodology for BRT project 1 1
BRT system
EE for household, industry, or service sectorSSC
AMS-II.C.: Demand-side EE programs for specific technologies 9 2
EE for industry: four chemical, one textile, one food, one machinery, and two household projects
20

EE for industrial sector, SSC
AMS-II.D.: EE and fuel-switching measures for industrial facilities 75 0
Mainly such energy-intensive sectors as paper, iron and steel, petrolchemical, cement, building materials, etc
EE for household or service sector, SSC
AMS-II.E.: EE and fuel-switching measures for buildings
15 4
Eight Brazilain stores, one Chinese Yantai project, three Moldovian EE and household projects, the Kuyasa project, one Indian hotel project, and one Indian IT-building project
EE for agriculturalactivities, SSC
AMS-II.F.: EE and fuel-switching for agricultural activities 1 0
Northeast Caeté Mills Irrigation Project (NECMIP)
Transport, SSC AMS-III.C.: Emission reductions by low-greenhouse emission vehicles 3 0 Actions by single enterprise
AMS-I.A.: Electricity generation by the user 15 4 Biomass, biogas, solar, and
small hydro (Nepal) AMS-I.B.: Mechanical energy for the user 4 2 One withdrawn and one
rejected AMS-I.C.: Thermal energy for the user 92 10 Four solar, four biogas
power, and two biomass
Renewable energy, SSC
AMS-I.D.: Renewable electricity generation for a grid 590 0 Mainly hydro, wind, biogas,
and biomass Source: based on URC CDM Pipeline Analysis and Database as of 11 June 2007
2.3.1 Approved demand-side EE CDM methodologies
SSC methodologies Under the CDM, the methodologies for SSC project activities are divided into three types, originally with the following thresholds: Type I are renewable energy project activities with a maximum output capacity equivalent to up to fifteen MWs (or an appropriate equivalent); Type II are EE improvement project activities which reduce energy consumption—on the supply and/or demand-side—by up to the equivalent of fifteen GWh per year; and Type III are other project activities that both reduce anthropogenic emissions by sources and directly emit less than fifteen thousand tones of carbon dioxide equivalent annually.16
In response to public complaints that the maximum limits for Types II and III were disproportionably smaller than for Type I, at COP/MOP 2 the limit for type two was increased to “a maximum output of 60 GWh per year (or an appropriate equivalent),” and type III to “less than or equal to 60 kt/CO2e annually” (see Table 2.4).
Table 2.4 The current limits for SSC CDM projectsType Before COP/MOP 2 After COP/MOP 2 Type I—renewable energy 15 MW 15 MW
Type II—EE 15 GWh 60 GWh
Type III—other 15 kt/CO2e 60 kt/CO2e
Due to the fact that proposing a new CDM methodology for full-scale projects tends to take an average of one year, the simplified SSC methodologies offer an interesting avenue for pCDM implementation in the near future. The SSC methodologies can be used to determine the baseline and monitoring protocols of each CPA. As long as it is below the SSC threshold and does not satisfy the EB33 guidance on debundling under pCDM each CPA can apply the chosen SSC methodology, even if over time the total sum of emission reductions under the program exceeds 16 COP/MOP 1, decision 17/CP.7, paragraph 6 (c) (iii)
21

the threshold. There is no limit on how many CPAs can be added to one single CDM program over the twenty-eight year period. The EB has determined that existing SSC methodologies shall be revised to account for leakage. With the revisions available after EB33, SSC methodologies can now be widely used for CPAs in CDM programs, thereby significantly increasing the application and implementation opportunities of pCDM.
Large-scale methodologies As shown in Table 2.3, the four demand-side methodologies AM17 and AM18 are mainly for energy-intensive industrial enterprises, and they are less likely to be applied to pCDM activity.
In contrast, AM20 and AM46 are more likely to be appliedfor pCDM implementation. It is noteworthy that though AM20 was actually approved in June 2005, at the time of writing no project applying this methodology has been developed. This indicates that either there is not much interest in developing this kind of project or that the methodology contains some defects, making it difficult to apply under many circumstances.
AM44 is a methodology with promising application under pCDM. The emission reduction is based on replacing less efficient boilers with efficient ones before the end of their use life. CERs are then claimed for the duration of the replaced boiler’s remaining use life. Unfortunately, this methodology presents some complications. It is effectively inapplicable to the use of efficient boilers in new installations and the planned replacement of less efficient boilers upon end of their use life. The replacement of boilers before the end of their use life also means that enterprises lose some of the benefits they could get from inefficient boilers.
If the boilers are still new and only a small share of their use life has been passed, early replacement represents a loss, reducing its cost-effectiveness. Yet, if the boiler’s use life expires in a few years, then it may be unattractive for pCDM due to the short duration of time that can be claimed for credit. Replacement may also disrupt the enterprises’ normal operations.
2.3.2 New proposed large-scale methodologies with potential for pCDM application
Among the existing new methodologies under consideration, a few have promising application for EE improvement under pCDM. These include methodologies on district heating, efficient electrical appliances, and accelerated replacement of electrical equipment, as well as boilers (see Table 2.5).
Table 2.5 New proposed large-scale methodologies with potential for pCDM application
Sectoral scope Proposed new methodologies (NMs) under consideration
Energy distribution NM186: Introduction of a new primary district heating system (NM96)
Energy demand
NM197: Power saving through accelerated replacement of electrical equipment with variable load under a PoA NM211: Efficiency improvement of fossil fuel-fired steam boiler (systems) by boiler replacement or rehabilitation
Transport NM205: Improving the fuel efficiency of vehicle fleets NM142: Ten percent of palm oil methyl ester added to diesel
Source: Based on information in the UNFCCC website
It should be mentioned that, as the experience of existing pCDM-like projects indicates, most approved methodologies can be applied to both stand-alone and bundled projects, as well as PoAs. There are some methodologies that are usually applied to stand-alone CDM projects, but
22

which can, in certain cases, also be applied to pCDM project design (e.g., small hydro projects).17 For projects such as wind farms and hydropower stations, where most of the units are supposed to be big enough for bundles or stand-alone projects, programs to boost the implementation of those activities are not precluded. In fact, there is already one small hydro pCDM-like project in the pipeline—the Micro-hydro Promotion by Alternative Energy Promotion Centre (AEPC) in Nepal.
2.4 Demand-side EE CDM projects in the pipeline and the role of pCDM
According to the CDM pipeline from 11 June 2007, there are currently 116 demand-side EE projects, most of which are carried out by energy intensive industries (see Table 2.6). These projects are stand-alone or bundled.
There are a few EE CDM projects in the service sector, and the residential sector has even less. This can be explained by the fact that each single source in industrial facilities uses more energy, and thus has greater emission reduction potential, than service entities. In fact, one industrial facility could easily achieve the volume of emission reduction of several bundled service entities. The industrial project can, therefore, be more easily implemented as a single-site CDM project. In the case of households, each consumes a very small amount of energy. Due to the existence of more or less high fixed transaction costs, household emission reductions would have to be pooled by the thousands in order to make the CDM a viable option.
Table 2.6 Demand-side EE CDM projects in the pipeline as of 11 June 2007
Type At validation or registered
Total PCDM like Percentage Remarks
EE households 4 4 0.2% Cooking stove, housing, and biomass heating EE industry 96 0 11.2% Mainly energy intensive industries
EE service 12 1 0.6% Eight EE for supermarkets, one hotel, one small service and industrial energy user, and two public buildings projects
Transport 4 1 BRT Total 116 5 12.1% Source: URC CDM Pipeline Analysis and Database
2.4.1 End-use EE for the industrial sector As Table 2.6 shows, industrial users have implemented a few pCDM-like projects for EE improvements; however, this does not mean that such projects are irrelevant for pCDM. In fact, among a number of low efficiency small to medium-sized enterprises (SMEs) there is a general lack of expertise about CDM project activity implementation. At the same time, EE improvement potential for each enterprise is not big enough for stand-alone or bundled CDM, but must be designed as a pCDM project. External support for coordination and capacity development is needed to make use of the EE improvement potential in these facilities.
There are more areas other than light bulbs, which are typically mentioned as examples in the debate around pCDM, which have potential. The activities under a program can also promote energy-efficient vehicles or small hydro (as the Micro-hydro Promotion by AEPC project). Other promising areas are industrial installations and facilities such as the Egyptian brick factory GHG reduction project. This project proposes to convert about 242 brick kilns from heavy oil to NG. 17 In fact, there is already one small hydro pCDM-like project in the pipeline: the Micro-hydro Promotion by Alternative Energy Promotion Centre (AEPC) in Nepal.
23

Another example is the FaL-G Brick Project in India. As in many other developing countries, the brick industry in India is primarily an informal or unorganized sector composed of more than 100,000 brick kilns operating in clusters in rural and peri-urban areas producing fired clay bricks. The project activity aims to improve the thermal performance of the brick manufacturing units in selected clusters of the country—especially in the states of Chattishgarh, Madhya Pradesh, and Orissa—through the introduction of Vertical Shaft Brick Kiln (VSBK) technology. This technology is both cleaner and more energy efficient than the clamp technology that is commonly used by the brick manufacturers (World Bank 2005).
2.4.2 EE and renewable energy with direct participation by households As indicated in Figure 2.1, all of the fifteen existing CDM projects involving direct household participation are carried out in the form of programs. Due to the participation of numerous households and the high-transaction costs of CDM under the existing regime, external coordination and additional incentives are often indispensable for the implementation of such activities.
2.4.3 EE involving the service sector There have been some projects carried out for EE improvement in the service sector. Examples include improving the EE of a hotel and of the stores of a large supermarket group. EE improvement in the service sector can be implemented in the form of single-site, bundles, or programs, depending on whether the volume of emission reductions from a single service complex is high enough and whether they belong to one or multiple owners. At the time of writing there are twelve EE improvements for the service sector:
1. An Indian EE consumption project involves both demand-side and supply-side EE measures at a new hotel unit. This is a single-site project aiming to implement and encourage EE measures both at the generation and demand-side of energy being consumed by a new hotel unit (i.e., one or more commercial buildings) and thus reduce GHG emissions directly or indirectly attributed to the business. Even though two methodologies are applied under this project in order to claim credits for emission reductions from both supply side and demand side, the annual emission reduction is estimated at only 3025 CERs (UNFCCC PDD of the project).
2. An Indian IT building EE improvement.
3. The Moldova Energy Conservation and GHGs Emissions Reduction Project plans efficiency improvements and fuel-switching measures for a series of public buildings (e.g., kindergardens, schools, vocational schools, hospitals, etc.) implemented via the WB Moldova Energy II Project.
4. The Yantai Coal-Fired Boiler Energy Efficiency Project from China includes conducting energy-optimization diagnosis/training and installing automated control technologies at various buildings and industrial facilities in the city of Yantai, to improve the operating efficiency of small to mid-sized coal-fired boilers.
5. The eight CDM projects under the name of “Pão de Açúcar—Demand-side electricity management” from Brazil are designed to reduce electricity consumption at the stores of a company by implementing different independent electricity efficiency measures.
Space heating and cooling contributes to a substantial share of the total world primary energy consumption. As indicated in the section section of this paper, when deciding whether the EE activity should be carried out in the form of large stand-alone CDM, bundled CDM, or pCDM, some considerations or assumptions need to be borne in mind. The form of the project depends
24
not only on the technology, but also on the size, the amount of the emission reductions, and on the ownership of different facilities or installations, which affects the timing of the actions.
One typical example is improving lighting efficiency by replacing incandescent with fluorescent bulbs. Although the energy consumption and emission reduction potential of each bulb is small, when the action is carried out by a large number of households, it may be better to implement it as a program, because a large number of participants would replace bulbs a period of time. On the other hand, if the project were to take place inside an industrial facility, or a single large office complex belonging to one owner who can decide to replace all the bulbs at a single point in time, stand-alone CDM would be the best choice. If the emission reduction involves multiple medium-sized blocks, like chain stores or multiple hotels, it may be better to carry it out in bundles.
Likewise, for emission reductions in transport involving many vehicles owned by a single company, stand-alone CDM project could be the right option, due to the centralized decision making. In the case that each household has their own passenger car(s), a program would be more advantageous, since the timing of the efficiency measures is hard to predict.
2.4.4 Demand-side EE under CDM—different solutions As explained by Niederberger and Spalding-Fecher (2006), EE investments can be generally divided into three different markets: discretionary retrofit, planned replacement, and new installations (see Table 2.7). The additionality demonstration and baseline establishment for the first market is somewhat easier due to the existence of historic and current energy performance data.
Table 2.7 EE markets Market Definition
Discretionary retrofit Decision to prematurely replace existing technology with high-efficiency equipment for the primary purpose of improving EE
Planned replacement Decision to replace existing technology at the end of its useful lifetime (e.g., failure, replacement schedule) with high-efficiency equipment
New installations Decision to select high-efficiency equipment over other alternatives at the time of new installations
Source: Niederberger and Spalding-Fecher 2006
The current methodologies for end-use EE improvement tend to apply to the discretionary retrofit market. In this type of project emission reductions can only be claimed for the remaining part of the use life of the facilities replaced (see the discussion of AM44 in section 2.3.1).
For planned replacement and new installations, the challenge is the additionality demonstration and baseline establishment. For pCDM project activities, there are also more complicated issues such as free riders, and technology transition and dissemination under the baseline scenarios. Therefore, to facilitate the development of CDM methodologies for EE and eliminate barriers to the implementation of pCDM project activities, agreements on sectoral, national, or regional baselines for relevant EE improvements would be helpful.
2.5 Programmatic CDM implementation using existing methodologies
Programmatic CDM arouses high expectations for the CDM to fulfill its dual targets: 1) to promote sustainable development in developing countries, and 2) contribute to the stabilization of concentrations of GHGs. As discussed in the first section of this paper, it may also contribute
25

to improvements in the quality of the emission reductions: increasing shares of CERs from renewable energy and EE: enabling low-income communities and social groups, and less-developed countries to benefit more from CDM; and stimulating sector or region-wide transitions toward renewable energy and higher EE.
Sixteen months after the COP/MOP 1 decision on the eligibility of programs for registration as single site CDM projects, pCDM implementation progress is still very slow. The guidance on pCDM was first issued in December 2006 after long discussions at Methodology Panel level, and call for public comments on the UNFCCC website. The documents on pCDM guidance and procedures were further discussed at EB30 and EB31, and then finalized at EB32. Given the lack of clarity on guidance and provisions, it is not surprising that only one pCDM-specific methodology (AM47) has been submitted and approved.
Despite the optimism brought about by pCDM, and considering that the number of CDM projects has more than tripled since the end of 2005 and that it takes a shorter time for a project to pass from validation to registration (see Figure 2.2), it is surprising that the number of pCDM-like projects has only increased from ten to the current twenty-one since COP/MOP 1. There remain major barriers to pCDM implementation, including lack of methodologies, and how to address such complicated methodological issues as leakage, baseline, double-counting, and monitoring.
0
20
40
60
80
100
120
140
160
180
Dec
-03
Jan-
04Fe
b-04
Mar
-04
Apr
-04
May
-04
Jun-
04Ju
l-04
Aug-
04Se
p-04
Oct
-04
Nov
-04
Dec
-04
Jan-
05Fe
b-05
Mar
-05
Apr
-05
May
-05
Jun-
05Ju
l-05
Aug-
05Se
p-05
Oct
-05
Nov
-05
Dec
-05
Jan-
06Fe
b-06
Mar
-06
Apr
-06
May
-06
Jun-
06Ju
l-06
Aug-
06Se
p-06
Oct
-06
Nov
-06
Dec
-06
Jan-
07Fe
b-07
Mar
-07
Apr
-07
May
-07
Num
ber o
f Pro
ject
s ea
ch
mon
th
0
100
200
300
400
500
600
700
800
Cum
ulat
ive
aver
age
time
to re
ques
t for
regi
stra
tion
(day
s)
Registration Requested (-withdrawn & rejected) Not Yet Submitted/withdrawn/rejected Average time to submission (cumulative)
Fig. 2.2. Number of CDM projects starting the public comments period each month, the number of them that have requested registration, and the cumulative time lag between these two events
Source: URC CDM Pipeline Analysis and Database as of 11 June 2007
2.5.1 Application of methodologies and technologies under pCDM The procedures for pCDM stipulate that only one methodology is allowed under each program; yet among the pCDM-like projects discussed, there are projects using more than one methodology, especially in the case of SSC projects.
The analysis in items 3.1 and 3.3 indicates that applying more than one methodology under one CDM project is quite common. In addition, some apply two methodologies for only one project and even as many as three methodologies are applied in some cases. There are various combinations of methodologies, including more than one full-scale methodology, more than one SSC methodology, or the combination of SSC and full-scale methodologies under one project. The Pão de Açúcar projects from Brazil are an example of the last case. Each each of these eight
26

projects applies one full-scale methodology, ACM2, and two SSC methodologies: ASM I. D and ASM. II. E.
The “Kuyasa low-cost urban housing energy upgrade project” and the two Moldova Biomass Heating in Rural Communities projects each applied three approved SSC methodologies. The Moldova Energy Conservation Project applied two methodologies: AMS-II.E (EE and fuel-switching measures for buildings) and AMS- III.B (switching fossil fuels).
Individual EE measures tend to generate small emission reductions and often are performed in combinations. For example, building EE improvements often combine improved insulation, more efficient heating (installing heating meters for each household and/or district heating), as well as fuel-switching. The EB Guidance on PoAs stipulates that only one methodology can be applied under each PoA, meaning that emissions reductions from only one type of technology and one methodology can be claimed under a PoA, which will shrink the emission reduction per participating household. As the costs and time associated with persuading and coordinating a household’s participation are quite high and the difference between one or more measures taken by each household is small, such a restriction will increase coordination costs for each unit of CERs generated. As a result, it could decrease cost-effectiveness of implementing PoA for EE and lower its attractiveness among households and smallholders.
2.5.2 Time taken for approval of new pCDM-like methodologies From the experience with the CDM methodologies approval process so far, low approval rates in the future for new proposed pCDM methodologies are predictable. As indicated in the UNEP Risø CDM Pipeline, on average it takes around 200 days between the submission of a new CDM methodology and a final decision on rejection, and approximately 300 days to get a final approval decision.
The proposed new methodology for large-scale replacement of incandescent with compact fluorescent bulbs took 401 days before it was approved. The new methodology for the enhancement of penetration of CFL bulbs was rejected 401 days after its submission.
The methodology for improved air conditioning standards in Ghana was first submitted as NM72 in October 2004, and the final rejection decision was made in February 2006. Then the methodology developer decided to resubmit the methodology as NM159 in January 2006, and was again rejected in February 2007.
New methodology NM46 for the reconstruction of a district heating network was developed by the World Bank Prototype Carbon Fund (PCF) based on a project activity in Uzbekistan. It was first submitted to the EB in April 2004 and it was rejected in September 2004. Then the PCF revised the methodology and submitted a new one, the NM103, in May 2005, which was again rejected eighty days later.
DANIDA, the Danish aid agency, first submitted a new methodology for district heating in June 2004. After rejection in December 2004, it revised the proposed methodology and resubmitted it as NM96, which was again rejected by the EB in July 2005. DANIDA hired another consulting agency to revise the new methodology and resubmitted it for the third time as NM181 in May 2006, which got a final decision of B (meaning the participant or the EB must make some revisions) in December 2006. At the time of writing, it had not been approved.
The Japanese did successfully submit a new methodology for EE improvement projects (boiler rehabilitation or replacement in industrial and district heating sectors) and receive EB approval in nearly eleven months. This methodology (AM44) may not, however, apply under all circumstances, and does not represent a complete elimination of methodological barriers to district heating projects.
27

The delays could be partially attributed to the lack of EB guidance on programs. With the Guidance finally formally issued and the procedures for PoA registration having been made public, the process of proposing new PoA-related methodologies may be faster.
In summary, the experiences so far with the submission and approval of pCDM-like methodologies are not encouraging. Unless PoAs are boosted in the first commitment period, pCDM is unlikely to live up to the expectation of unlocking the huge potential of CDM, dramatically increasing the annual emission reduction and significantly enlarging the share of renewable energy and EE in the CDM project mix, and leading to more geographically balanced distribution of CDM projects and benefits.
Internationally, there have been some recommendations about how to address these issues. One solution suggests efforts from multiple channels to make CDM work better for end-use EE improvement. Another is making greater use of the existing channels, including calling for public inputs, submitting proposed new methodologies, and desk reviews. There are also recommendations for some kind of institutional arrangement under the CDM EB for greater support on EE CDM or policy/program CDM. Niederberger and Spalding-Fecher (2006) suggest a dedicated EE Working Group, or practitioner/expert forum, to derive international best practice with respect to (a) monitoring and verification of CDM projects, drawing on existing protocols and (b) common elements in the design of CDM baseline methodologies for end-use EE projects. Lex de Jonge recommends establishing a policy/program CDM working group under the CDM EB (2005).
28

3. Understanding end-use EE and its potential for pCDM Having discussed pCDM modality, guidelines, methodology and pipeline issues, it is helpful to have a general review of the needs, barriers, and potential of the demand-side of EE project development. There are several advantages for EE improvement in developing countries. First of all, it extends or maximizes the potential of already installed energy generation, particularly interesting for severe generation scarcity and in places where capital is not available for construction of new plants. Secondly, it reduces GHG and other environmental pollutants by improving production processes and reducing fossil fuel consumption. Thirdly, it helps to reduce energy demand growth and is seen as an important measure to improve energy security as developing countries, especially the fast developing ones, struggle to meet growing demand for energy.
Most EE actions to date focus on promoting end-use practices through various public and private sector instruments, including demand-side policies (such as DSM), standards and regulations (such as appliances and equipment standards), financial incentives (such as subsidies, tax breaks, and rebates), and the establishment of an EE market (such as ESCO’s agendas). Due to barriers arising from the nature of energy end uses and their derived market failures, past energy efficiency interventions have not, however, been widely adopted or effectively enforced. Even where there are policies in place, the interventions have had difficulty reaching small end-users.
This section aims to provide basic understanding of the logic behind the carbon reduction potential of energy efficiency projects under pCDM. It begins with a conceptual illustration of the nature of end-use energy and the barriers that have been holding back improvement of EE in the process of economic development. This leads to a characterization of the scope of EE and provides insights into how to handle the dispersed nature of EE, so that it can reach its full potential. EE options in various economic sectors that have potential for every category of the CDM (pCDM, bundled CDM, and stand-alone CDM) are presented. Finally, niche sectors for EE projects for pCDM are discussed.
3.1 End-use energy in human society
Human economic development is characterized by the ability to make use of available energy sources, including animal power, fossil fuels, biofuels, and various renewable energy resources. As an economy moves through different stages of development, energy end-use patterns move from biofuels, human, and animal power, to a mix of traditional and modern commercial fossil fuels (Barnes and Floor 1996; Toman and Jemelkova 2003).18 Following this trajectory, the development of the economy has bundled tightly around increasing uses and applications of fossil fuels. Ever-growing and renewing end-use applications and technologies enabled by fossil fuels have extended to every aspect of human life and virtually all economic activities. Consequently, energy end-uses present a distinct characteristic of dispersed end-use patterns, in terms of location, technologies, sizes, sectors, end-use requirements, and end-users’ decisions. Although the manifestations of dispersed patterns (i.e., location, technologies, sizes, etc.) could differ in economies at diverse stages of development, the characteristics of dispersed end-use are found in every economy—developed, fast developing, and the least developed economies.
To describe the distribution of the dispersed end-use patterns within the context of CDM, it is helpful to understand it with regard to three aspects of the energy end-use units (equipments)- the size, number, and ownership. Figure 3.1 shows a generalized conceptual illustration of 18 The theory, known as the energy ladder model, is first proposed by Barnes and Floor in 1996 and is one of the early attempts to fabricate conceptual connections between energy use and development.
29

distribution of units that may represent certain industrial equipments, office and household appliances, or apartments.19 To illustrate the conglomeration of energy end-use units by their owners and by size, a distribution (or frequency) plot is used, in which the y-axis represents the cumulative number of units (of the same size) owned by each owner (understood as frequency), whereas the x-axis plots each owner of the units. The owners have been presorted by the unit sizes they own (shown as Unit Size-Owner; owners with large size units are plotted to the left).20
Fig. 3.1. Dispersed energy end-use patterns
# of units each owner (frequency)
Figure 3.1 shows that energy end-uses can be categorized into three groups: 1) large centralized end-use units owned by single owners; 2) conglomerated units which consist of small to medium, and sometimes large units, owned by single or multiple owners; and 3) a large amount of small end-use units owned and operated by individual owners. Due to the large quantity, dispersed end-use requirements, and preferences of individual owners, the third category presents the characteristics of long tail energy use7. The accumulated units in the long tail could outweigh the “head” to the left, depending on the structure of the economy as well as on development stage. Moreover, the shape of the curve—for example, the size of conglomeration (presented as the height in the graph) and the length of the tail—could also change as each end-use equipment/facility has its unique pattern.
In the household and service sector, the long tail represents individual households and small business users. The conglomerated uses appear in collective housing as well as commercial and services complexes that are designed, built and owned, or managed by one, or several, entities; the first category is often seen in large development projects where energy end uses are often designed, built, and supplied in a centralized manner. In the industrial sector, the long tail represents energy uses in SMEs, often in light industries, where units are generally small and locations are dispersed. This is often seen in industrial clusters, where similar units or factories built by the same, or different, owners aggregate geographically. In other cases, the same company could build and operate many factories that present similar energy end-use patterns; in
19 Note that the graph is for illustration purpose only. It is not based on real data, nor is it mapped to scale. 20 This type of plot with one axis showing two parameters is used to avoid complicated three-dimensional plots in cases where the two parameters are independent and do not interfere with each other. 7 The long tail is the colloquial name for a long-known feature of statistical distributions (Zipf, Power laws, Pareto distributions and/or general Lévy distributions). The feature is also known as heavy tails, power-law tails, or Pareto tails. In these distributions, a high-frequency or high-amplitude population is followed by a low-frequency or low-amplitude population that gradually "tails off." In many cases, though not always, the infrequent or low-amplitude events—the long tail—can cumulatively outnumber or outweigh the initial portion of the graph, such that in aggregate they comprise the majority (from the Wikipedia website, at http://en.wikipedia.org/wiki/The_Long_Tail).
Long Tail : small units, small owners
Unit size-owner large medium to small small
heavy medium to light industries large development individual household/ small business
multiple units, single or few owners
large unit, single owner
30

this case, the units are not necessarily geographically aggregated. The first type of industrial end uses generally concentrates on heavy industries and large manufacturing units.
Development implications are intrinsic to this grouping of end-use energy patterns. As an economy becomes more modern, energy end uses tend to move left along the x-axis to more clustered and larger capacity patterns (towards the head). In the least developed economies, most energy end uses remain small and dispersed; therefore, most consumption activities come from the tail.
There is another dimension—time—that becomes critical when the development process is taken into account. New technological requirements expand and diversify the distributions. The speed of this expansion and diversification is closely tied to how the country’s economy is developing. As countries develop increasingly quickly, more and more equipment/construction/units are added. Over time, technology becomes installed from different stages of technological development. These different installations operate at diverse efficiency levels and have varying operational life-spans. As a result, equipment and infrastructure with different installation times adds to the complexity of evaluating energy end uses.
Furthermore, there are also differences in technology adaptation and operational conditions between economies at the head and the tail. Entities in tail economies (e.g., small builders and business owners) often adopt efficient technologies more slowly, because they generally have capital constraints prohibiting them from purchasing better equipment at installation. Entities at the head schedule replacement and retrofitting more often to maintain operational quality; in contrast, entities at the tail maintain equipment and infrastructure at a merely functional level, making quality and efficiency improvements difficult. As a result, long tail economic activities consist of equipment and infrastructure of differing age, quality, and condition, and would be expected to continue the trend of inefficient end-use without strong intervention and incentives to change (though some expansion and diversification could occur as the economy evolves).
The next section investigates some generic barriers that have slowed down or even blocked the improvement of end-use EE, despite the fact that many efforts have been made in the public and private sectors to promote it. These barriers are present in of both developed economies and nations in different development stages. They may, however, vary in degree of severity and exist at different levels and sectors of the economies.
3.2 Barriers to end-use EE
The role of market failures and other barriers to improved EE is well-studied. EE is limited by issues such as: imperfect competition, externalities, imperfect information, high transaction costs, and organizational failures.. Governments have tried to utilize policy mechanisms and incentive tools to correct market failures through specific regulations or program. These policies or program inevitably run into generic barriers (not necessarily market barriers) at different levels in the economic sectors that created the market failures in the first place. These barriers interlink with each other and are difficult to solve with policies or programs that aim at removing only one or two of them. Inadequate or inefficient policies themselves, in turn, often create more barriers rather than ease them. Barriers are often perceived to be more prominent in developing countries than in developed ones, although they are widespread in both. The underlying generic barriers that cause market failures and create market barriers for EE include:
3.2.1. Financial barriers Installation of EE equipment, buildings, and appliances requires additional funding, especially at the initial stages. Although the energy savings in the product use cycle would compensate for these additional investments and, generally, comfortably exceed the original extra costs, users
31

often fail to choose energy-efficient options. This is usually due to (a) lack of information on the relative efficiency of products and services, (b) lack of information on the cost effectiveness of energy-efficient choices, (c) constraints in initial funding, and (d) split, or insufficient, incentives to make pertinent decisions. The financial sector can also be reluctant to finance EE projects due to their potentially high credit risks, the relatively small size of the investment, and lack of financing history and expertise on the part of project developers.
Limited technological expertise In developing countries the current industrial base does not have sufficient energy-efficient technological capacity, which manifests itself in two ways: insufficient capacity for designing and manufacturing EE products, and the inability to deploy energy-efficient technologies and practices in the marketplace. Technological asymmetry is also more prevalent in developing countries; SMEs generally have less access to EE technologies than their publicly-owned counterparts and large private or multinational companies.
Information barriers Information barriers are often seen as one of the major factors impeding the efficiency of the energy market, in terms of both financial and energy consumption. In less-developed countries (LDCs), where information dissemination is generally weaker, information gaps are present in all aspects of the market: consumers lack knowledge to purchase efficient end-use equipment; producers have little knowledge about technologies that would enable them to make efficient products and to do so efficiently; energy end-use providers are unacquainted with efficient technologies and thus unable to provide adequate information to customers; and a company’s decision-makers lack effective management tools and procedures to account for the economic benefits of efficiency improvements (Worrell et al. 2001). Many of these problems also occur in more developed countries, but usually to a lesser degree.
Dispersed end-use barriers A large part of financial, technical, and informational barriers for EE improvement comes from its dispersed nature. The widespread geographical locations, multiplicity of small end-users, and differing technological and knowledge levels of end-users make any attempt for control and management difficult and costly. Command-and-control type government policies work the best in large and aggregated energy consumers (again, the head in the long tail model), but rarely reach the tail effectively. Immense effort required to achieve a small efficiency gain often hampers the willingness of owners and financial institutions to start EE projects. Individual differences between end-users and dispersed locations also make it difficult to form any voluntary collective actions.
The barrier of inertia at both the managerial and individual levels One of the most daunting barriers is that EE is not a central concern for most businesses or individuals. This barrier creates a strong inertia that is difficult for any EE effort to overcome and can be the result of a combination of the barriers described above. This inert attitude is often the first hurdle that EE professionals confront in project implementation. For example, most business owners in the developing world (especially SMEs) do not prioritize future savings as much as they do expenditure reduction and assurance of short-term income. In practice, this means that EE professionals have faced difficulties selling the concept of initial investment for delayed savings. They often find that business owners prefer to keep day-to-day liquidity instead of embarking on an investment leading to net savings in the future.
32
Another major cause of the inertia is that EE often interferes—sometimes even conflicts—with companies’ and individuals’ daily routines and tried-and-true common practices. It is often disconnected with short-term and long-term managerial goals, such as increasing production or expanding market share. Policies and incentives often are not sufficient to get individuals to change their daily routines and conventional way of doing business. It takes tremendous effort for companies and individuals to change their mind-sets and practices.
Barriers at the institutional level Governments, especially in developing countries, often have limited capacity in designing and implementing EE policies and program. Designing and implementing effective policies and regulatory environments requires resources and that have generally been undersupplied, even in more developed economies. Even where there is a favorable regulatory environment, local governments—on whom the enforcement burden often falls—have a limited workforce and little expertise to undertake all the tasks stipulated by law. Obligatory tasks include local enforcement, supervision, and inspection; all of which require large numbers of professionals with sufficient knowledge of EE and experience in various engineering fields. This knowledge and experience is drastically lacking among LDCs.
3.3 Characteristics of end-use EE that are essential for success
Having studied the barriers, what contributes to improving the chances of success for EE policies, projects, and programs? Several characteristics of end-use EE are essential to keep in mind. All of these factors are best considered and practiced in order to obtain optimal results for EE improvements. Considering these EE concepts in project or PoA design, and incorporating them into CDM projects and methodologies could maximize the impact and carbon reduction potential of EE CDM projects in developing countries.
3.3.1 Efficiency comes with quality An energy inefficient economy comes from careless and poorly planned economic activities. Insufficient and inefficient design, construction, product use, and economic infrastructure often result in both economic and energy inefficiency. Improvement of EE could also result in other gains, for example, better quality products, conservation of resources, and environmental improvement. Conversely, improvement of quality, resource conservation, and environmental performance can, in most cases, also lead to energy efficiency gains (Porter 1995). Due to its strong connection with quality control and environmental benefits, EE improvement has important implications in developing countries for redirecting the development path toward a new, healthy, and quality economy.
3.3.2 Importance of new installations Large success in EE improvements often comes from deployment of inherently energy-efficient production processes and holistic designs that keep efficiency in mind. This also includes incorporating energy efficient technologies and practices into the production process in the design and construction stages. EE technology is best considered in the design and planning stage rather than during retrofitting (Porter 1995). This is also usually less expensive. For example, in the building sector, construction costs typically increase by only three to five percent due to the introduction of energy efficient solutions, although this figure may vary according to construction type (UNEP 2007).
Incorporating EE into new installations has special significance for developing economies. The prospective growth in demand for energy over the next two to three decades will most likely increase substantially; this is especially true in fast growing economies, such as China, India, and
33

some Latin American countries. The increased demand is expected to come from new installations of public and private construction and infrastructure. Since the new infrastructure will consume several times more energy than is currently used, and because it saves money and effort to get the design and construction right from the beginning, it makes perfect sense to increase the EE of new installations rather than retrofitting existing ones in most developing countries.
3.3.3 Combined technology improvement is cheaper and more efficient EE is not an additive game: the systematic approach for improvement in new design or retrofitting is essential to obtain the optimal results. For example, optimization of the steam system, including pipe layout, high pressure and low pressure steam optimization, insulation, heat exchange, steam traps, and waste heat recycling could improve EE by order of magnitude compared to improving the boiler efficiency alone. In addition, combined retrofits generally cost less and are less cumbersome than retrofitting individual units separately. This is especially important for small units and small owners. For this reason it is hoped that the EB will eventually allow more than one methodology in a PoA.
3.3.4. Incorporating soft measures with technological improvement gives the optimal gain
Changing consumption behaviors and simply being energy conscious are at least as important as technological improvement in terms of energy conservation. EE could be maximized when combining technological changes with soft measures such as: good SOP (standard operation procedure), proper maintenance, optimizing operation conditions, good housekeeping and recordkeeping (for industrial end-users), using energy consumption devices on an as-needed basis, learning how to properly save energy, and changing behaviors for residential and services end-users. Internalizing energy conservation by incorporating energy saving behaviors into daily routines in all economic activities is the ultimate goal of EE. The internalization process takes time and requires an establishment of successful new practices, and the provision of strong incentives, possibly in terms of profitability, accessibility, and responsibility; thus attempting to ensure that the new practices are followed through the long tail end.
3.3.5. Collective actions to realize potential for small end-users As discussed throughout section one, EE technology deployment does better on a gradually collective basis as the result of intentional programs, which can be government policies or private sector promotion programs. This is especially true for reaching the end-users at the long tail. Past experience has suggested some elements for sustained success, including: providing funding to overcome initial investment barriers; incentive program design to attract and retain commitment of end-users (including benefit sharing among end-users, program managers, and technology providers); and proper monitoring to ensure results. Government mandates generally are unable to provide these elements, which makes implementation difficult and ineffective, especially in developing countries and at the tail end. The private sector is not willing to take on extended actions, for reasons described in the barriers section. CDM modalities promise some of the elements for success described above. The revised PoA procedure allows planned collective actions, which leaves methodology and project developers ample freedom to attract and retain commitment for participation (as long as CDM methodological requirements are met). With the perverse incentive described in section 1.1 removed, and the evolution of CDM rules, pCDM could become one of the major mechanisms, in consonance with public policies, to improve EE and economic quality in the developing countries.
34

3.4 Potential for end-use EE programs
In developing countries, there exist many EE improvement opportunities in the current and future economies These opportunities could potentially be fully realized by making use of the CDM mechanism, as CDM is evolving in the direction to better accommodate EE projects. In this section, we propose potential end-use EE options that are suitable, or have the potential for PoAs. EE options for bundled CDM and stand-alone CDM projects are also discussed for comparison purposes. The examples discussed in this section, including end-use EE options for the household, service, industrial, and transportation sectors, are common projects and are technologically available. They are suited for new installations or for retrofits. Options for household, services, industrial, and transportation end-use energy efficiency are discussed respectively. The options presented in this section do not mean to be an exhaustive list of all energy efficiency options that have CDM potential, as many new technologies, innovative ideas, and EE projects specifically fitting local needs could also be well-qualified for CDM. It is up to the CDM project and methodology developers to come up with energy efficiency projects suited for local conditions and future development needs.
In general, EE can be improved through changes in three different categories:
1. Process and design change. A complete or partial change to the elemental processes may result in less energy-intensive products. Examples include changing the recipe of a cement blend so it requires less heat per output unit, or changing the orientation and natural ventilation of a building in order to very significantly reduce its energy intensity.
2. Technological change. This includes equipment upgrade and installation of new hardware
based on more efficient technologies (e.g., better insulation for buildings, more efficient household appliances, replacing old boilers, changing burners, better isolated furnaces, steam/heat recirculation systems, etc.).
3. Fuel-switching, distributed generation, and renewables. Fuel-switching, renewables,
and distributed generation are not typically considered EE measures, nor are they part of demand-side management. They are sometimes even considered as supply-side projects; however, use of these technologies does reduce requirement for fossil fuels and does improve overall efficiency. For instance, switching from coal or residual fuel oil to NG or biomass generally increases the combustion process efficiency. Cogeneration units, with distributed generation, reduce energy waste and improve the utilization of heat production. As well, small applications for renewables reduce the need for fossil fuel combustion. Most decisions for fuel-switching, installation of cogeneration kits in the industrial sector, and small applications for renewable energy in the household and service sectors depend on end-user actions, and are often considered as part of EE upgrade projects. These projects carry de facto characteristics of end-use EE and are suitable for pCDM.
3.4.1 Residential energy efficiency The potential for EE in the residential sector comes largely from changing building practices, while a smaller part comes from efficiency improvements in household appliances (Cheng 2005). According to IEA (2006), implementing EE policies in the alternative policy scenario could reduce energy consumption by eleven percent in 2030 in residential and service sectors combined. The two sectors account for forty percent of savings in final energy consumption and sixty-eight percent of electricity savings by 2030. Of which, residential sector will account for seventy percent of the savings in 2030. Table 3.1 shows categories of technological options that could improve EE in the household sector, including building construction and design, heating and cooling, ventilation, cooking, lighting, and electrical appliances. Achieving long-term EE
35

improvements in this sector is necessarily affected by buildings having multiple owners and decisions being rendered by owners of individual units. The type of ownership is, therefore, the crucial factor for determining which CDM projects to pursue.
New installations For new construction of large development sites and large apartment complexes, where ownership has not been transferred to individual buyers, builders or property managers could apply for stand-alone projects in a single site if enough carbon reduction potential can be achieved. Builders who are constructing a number of large buildings or development projects at different geographical locations, or several builders who are constructing large buildings using similar EE concepts, could apply for a bundled project among different specified sites, as long as the sites and carbon reduction potential are known at the time of application. EE technologies that are suitable to be included as large buildings are constructed are appropriate for these two types of projects. To ensure the continuous production of carbon credits, builders may reach agreements with future unit buyers to maintain the EE features and to ensure ease of monitoring before transferring ownership. Since the EE features listed in Table 3.1 that are suitable for bundled and stand-alone CDM are built into the design and structure of the buildings, unit buyers would find it difficult to change the intended EE features, and would have a strong incentive to maintain their operation as long as a proper maintenance program provided by builders or project managers was put in place. Benefit sharing among developers, property managers, and end-users may also be designed to incentivize energy saving design, construction, and operation.
Table 3.1 Potentials for residential EE (including small renewable applications)
EE Improvement Technology OwnerStand- Alone
Stand- Alone
(of unit or building)
Single dwelling/
small apartment
building
building complex
/large apartment
building
building complex
/large apartment
building
large develop-
ment project
large develop-
ment project
Single dwelling/
small apartment building
building complex
/large apartment building
building complex
/large apartment building
large develop-
ment project
large develop-
ment project
small units/
quantity
small units/
quantity
large units/
quantity
large units/
quantity
large units/
quantity
small units/
quantity
small units/
quantity
large units/
quantity
large units/
quantity
large units/
quantity builder/ owner owner builder builder builder owner owner manager manager manager
Single √ √ √Many √ √ √ √Single √ √ √ √ √ √Many √ √ √ √ √ √ √ √Single √ √ √ √ √ √Many √ √ √ √ √ √ √ √SingleMany √ √Single √ √ √ √ √ √Many √ √ √ √ √ √ √ √Single √ √ √ √● √● √●
Many √ √ √ √ √ √ √● √●
SingleMany √ √SingleMany √ √ √ √Single √ √ √ √ √ √Many √ √ √ √ √ √ √ √Single √ √ √ √ √ √Many √ √ √ √ √ √ √ √
√ - suitable √● - suitable for public areas
New Installations Retrofits
Bundled. CDM Bundled. CDM Prog. CDM
1 Building design & orientation
2Building envelope- including building material, thermal mass, insulation & windows etc.
3Space cooling and heating (heat pump, passive solar heating, air exchange cooling, etc)
4 Efficient electric room air conditioner (cooling and heating)
5 Solar thermal water heater
6 High efficiency lighting, PV lighting, natural lighting
7 Efficient electrical appliances
8 Energy efficient stoves and solar and biomass based stoves
9Building and district HVAC, including heating, ventilation, and cooling, may include water heating
10 Combined household sector EE improvement
Prog. CDM
For dispersed small building units built by small home builders, and technologies that are generally chosen by individual households, such as appliances and lighting, a PoA is suitable for tapping their EE potentials. Due to the large amount of end-use units, numbers of participants would be unknown at the start of the project. Because participants can join at any stage in the project, it is also suitable to accommodate new installations of buildings and appliances in different periods. Benefit sharing among project coordinators and end-users, and even appliance
36

and material suppliers—depending on program design—could be used to incentivize energy saving choices and operation.
Retrofits For existing buildings, more difficulties exist, since building units generally belong to individual owners, and decisions and timing for renovation are commonly individually distinct. Programmatic CDM is particularly suitable for this type of EE improvement. It relies on project coordinators to attract participation and retain commitments of individual end-users. Benefit sharing is also helpful to incentivize EE technology adoption and energy saving actions.
In the case of retrofits, projects suited for bundled and stand-alone CDM are relatively limited compared to new installations. The two centralized CDM types may be suited for large building complexes and community housing possessing the same or a few owners or property managers. Building owners or property managers (versus households who lease individual units) are capable of making substantial changes in building structure, utility designs, and changes in lighting and appliances that are used in public areas or have been included in the leasing contracts.
Technologies and good practices Although methodologies to calculate carbon reduction need to be developed, two essential factors need to be considered in the design of projects and PoAs to maximize carbon reduction potentials.
a. Combined technologies As discussed in section 3.3.3, combining EE technologies when implementing EE projects is more effective and less costly. Some already registered projects combine several methodologies in order to maximize the energy savings potential; however, the EB has for the time being restricted CDM programs to the use of one methodology. The existing SSC methodologies, AMS-II.D-F, may be used individually for EE improvement in programmatic projects, as long as they account for leakage. Relevant large-scale methodologies can also be used, but each program can only use one methodology. This restriction severely diminishes the potential that could be obtained by pCDM in EE improvement. Table 3.1 (and Tables 3.2 and 3.3) list combined technologies of EE improvement. These could be combinations of related technologies listed in the tables or unrelated technologies that can be implemented at once for the sake of saving time and money.
b. Maintenance and operation procedures In section 3.3.4, we suggest that incorporating soft measures in EE projects and programs could maximize the carbon reduction from technological improvement, although current CDM methodologies have not allowed incorporating soft measures. Carbon reduction calculations with soft measures included may still be subject to tough reviews in proving additionality and fulfilling monitoring requirements. Designing appropriate maintenance, operational procedures, and behavior change elements in projects would optimize EE effects. Although not shown in the technology tables in this section, other technological options to accompany management and behavioral changes can be identified.
3.4.2 EE in commercial and services sector Like the residential sector, improvements in building design and construction present a substantial energy savings potential in the commercial and service sector. Most technological improvements in this sector are similar to those in the residential sector, except that commercial
37

improvements may be larger with greater capacity. The distinctions among programmatic, bundled, and stand-alone CDM are, in general, similar to what has been described in the residential sector in section 3.4.1, and will not be repeated in this section. Examples of categories of potential EE technologies are listed in Table 3.2, with more detailed options listed in
Suitable technologies to improve end-use efficiency in households, communities, or small businesses and business complexes include: renewable-based small generation units, efficient fossil fuel-based cogeneration, and energy storage options (e.g. fuel cells) in conjunction with renewable energy generation. Furthermore, district HVAC for buildings, and small community heating and hot water supplies in cold climate also bear characteristics of distributed energy end-use and would benefit greatly from a CDM scheme for technology deployment. Because of their small capacities, high installation costs, and dispersed end-uses, they suffer the same barriers as other small EE options. Table 3.2 includes these technologies as potential targets for EE projects or PoAs in the household and services sectors.
Table 3.2 Potentials for energy efficiency in commercial and services sector (including small renewable applications and distributed generation)
EE Improvement Technology Owner Stand- Alone
Stand- Alone
(of unit or building) small building
large building
large building
complex/ large
develop-ment
complex/ large
develop-ment
small building
large building
large building
complex/ large
develop-ment
complex/ large
develop-ment
small units/
quantity
small units/
quantity
large units/
quantity
large units/
quantity
large units/
quantity
small units/
quantity
small units/
quantity
large units/
quantity
large units/
quantity
large units/
quantity builder/ owner owner builder builder builder owner owner manager manager manager
Single √ √ √Many √ √ √ √Single √ √ √ √ √ √Many √ √ √ √ √ √ √ √Single √ √ √ √ √ √Many √ √ √ √ √ √ √ √Single √ √ √Many √ √ √ √Single √ √ √ √ √ √Many √ √ √ √ √ √ √ √Single √ √ √ √● √● √●
Many √ √ √ √ √ √ √● √●
Single
Many √ √ √ √
Single
Many√ √ √ √
Single
Many √ √
Single √ √ √ √ √ √
Many √ √ √ √ √ √ √ √
Single √ √ √ √ √ √
Many √ √ √ √ √ √ √ √Single √ √ √ √ √ √Many √ √ √ √ √ √ √ √Single √ √ √ √ √ √Many √ √ √ √ √ √ √ √
√ - suitable √● - suitable for public areas
New Installations Retrofits
Bundled. CDM Bundled. CDM Prog. CDM
1 Building design & orientation
2Building Envelope- including building materials, thermal mass, insulation, windows, etc.
3Space cooling and heating (heat pump, passive solar heating, air exchange cooling, etc)
4 Efficient electric room air conditioner (cooling and heating)
5Solar thermal water heater and efficient hot water boilers - including pumping and distribution
6 High Efficiency Lighting, PV lighting, natural lighting
7 Energy efficient stove/heater and solar and biomass based stove
8
Efficient and energy conservation commercial refrigeration and show case- including heat exchange and insulation
9 Efficient electrical appliances and equipment
10Optimization of electricity receiving and distributing equipment to reduce electricity loss
13 Combined services sector EE improvement
11
Fossil fuel and renewables based generator (including fuel selection/ switch/ cogeneration/storage/ fuel cell)
12Building and District HVAC, including heating, ventilation, and cooling, may include water heating
Prog. CDM
3.4.3 Industrial EE According to IEA’s 2006 Energy Outlook, implementing EE policies will reduce industrial energy consumption by ten percent in the developing countries in 2030 (compared to BAU scenario). Industrial sector EE can generally be divided into two categories: (1) heating and cooling processes that do not require electricity and (2) electric driving equipment and electricity
38

delivery. For heating and cooling processes—apart from updating combusting or chilling technologies (e.g., boiler design and fuel-switching) to obtain better thermal efficiency—better insulation, more efficient heat exchange, and better steam and chilling energy uses and recovery could greatly improve the efficiency of energy uses in industrial processes. For efficiency improvement of electrical equipment, adoption of more efficient technologies (e.g., using variable speed motors instead of stroking motors), optimizing use of kinetic energy (e.g., reducing friction and reducing suction heads), and reducing transmission and conversion losses of electricity delivery systems are among the most important measures. Moreover, as in the household and service sectors, use of energy conservation technologies for factory buildings is also important, though often overlooked. Ventilation, efficient lighting, thermal efficiency of office buildings, use of renewables, and cogeneration could greatly reduce energy consumption in factories.
Depending on the size and owners of industrial equipment and units, suitable projects for programmatic, bundled, and stand-alone CDM could be developed. Potential areas for EE improvement in industrial sectors are listed in Table 3.3.
Table 3.3 Potentials for EE in industries (including small renewable applications and distributed generation)
EE Improvement Technology OwnerStand- Alone
Stand- Alone
(of unit or plant) small plants
medium plants
medium plants
large plants
large plants
small plants
medium plants
medium plants
large plants
large plants
small units/
quantity
medium units/
quantity
medium units/
quantity
large units/
quantity
large units/
quantity
small units/
quantity
medium units/
quantity
medium units/
quantity
large units/
quantity
large units/
quantity
Single √ √ √ √ √ √
Many √ √ √ √ √ √ √ √Single √ √ √ √ √ √Many √ √ √ √ √ √ √ √
Single √ √ √ √ √ √
Many √ √ √ √ √ √ √ √
Single√ √ √ √ √ √
Many√ √ √ √ √ √ √ √
Single√ √ √ √ √ √
Many√ √ √ √ √ √ √ √
Single √ √ √ √ √ √
Many √ √ √ √ √ √ √ √Single √ √ √ √ √ √Many √ √ √ √ √ √ √ √
Single√ √ √ √ √ √
Many√ √ √ √ √ √ √ √
Single √ √ √ √ √ √Multi √ √ √ √ √ √ √ √
Single√ √ √ √ √ √
Many √ √ √ √ √ √ √ √√ - suitable √● - suitable for public areas
1
High heat and heating process- including furnace, boiler, kiln, oven, steam & hot water system, heat recovery
New Installations Retrofits
Bundled. CDMBundled. CDM Prog. CDM
2 Combined heating process technologies/systems improvement
3Efficient drying-including fuel selection and renewable based drying
High efficiency lighting, PV, natural lighting
7Optimization of electricity receiving and distributing equipment to reduce electricity loss
4Pumps, fans, compressors - including piping system optimization and heat exchange optimization
6
Electric equipment and process improvement and fuel switching - including electric furnace, heating, drying, electrolytic process, electric driving/motion machineries
10Ventilation system- including efficient fans and air exchange equipment, optimized piping system
Prog. CDM
8
Fossil fuel and renewables based generator (including fuel selection/ switch/cogeneration/storage/ fuel cell)
9Combined electric consumption and distribution/ generation equipment improvement
6
To obtain maximum efficiency gains, the need for combined technologies and inclusion of operation and maintenance procedures with technological changes holds true, as described in 3.4.1. For small factory owners, it would be desirable to combine technologies and to utilize SSC methodologies with combined carbon reduction within the eligibility limit in each CPA. Project developers and factory owners also desire to be able to combine several large-scale methodologies for larger scale units to make use of pCDM’s full potential. Moreover, the project
39

developers should be encouraged to incorporate operation procedures for energy efficiency improvement within their SOPs for operation and housekeeping. Combination of technology improvement and inclusion of soft measures are also stressed in Table 3.3.
3.4.4 EE in the transportation and agricultural sectors EE in the transportation sector is an important measure for fossil energy saving. Nevertheless, due to its distinctively different nature from the previously discussed EE project types, it is not discussed in detail in this paper. EE in the transportation sector can be achieved mostly through centralized actions that are not characteristically end-use, such as fuel-switching, technological changes in car manufacturing, and provisions for public transportation; however, measures promoting fuel-switching actions by car owners, the selection of fuel-efficient vehicles, the replacement of inefficient cars, as well as encouraging the use of public transportation by individuals, or by public or private entities, may work as options for pCDM.
In the agricultural sector, most EE technological options (e.g., water pumps and agricultural produce processors) are similar to those in the industrial sector, although likely on a smaller scale. Another potential area for EE improvement is agricultural vehicles and tractors, which is similar to what has been discussed in the transportation sector. Because the agricultural sector is dispersed and constituted primarily by small actors in developing countries, it is especially suitable for pCDM.
3.5 Niche sectors for EE projects and pCDM The natural niches for EE projects for the three CDM modalities (refer to Table 1.2 for an overview of the distinctions between pCDM and bundled CDM) are briefly summarized below (see Figure 3.2). As of today, EE projects are under-represented in the CDM pipeline. A project developer could take advantage of the newly improved CDM rules and develop projects in their appropriate niche sectors, thus harnessing the full potential of end-use EE in developing economies.
Fig. 3.2. Harnessing the full potential of end-use EE in the economy—natural niches of EE projects for three CDM modalities
# of units each owner (frequency)
3.5.1. Programmatic CDM Programmatic CDM is suitable for small to medium-size units that are geographically dispersed. There are a large number of potential owners to participate in the programs for EE improvement, and the number of committed owners is unknown at the onset of the programs. Committed
Long T : small units, small o
ailwners
Bundled CDM Programmatic CDM
Regular CDM
Unit size-owner large medium to small small
heavy medium to light industrieslarge development individual household/ small business
40

owners would gradually come into the project as EE programs take effect. Coordinating plans or programs are needed to convene and to maintain the commitment of project participants.
3.5.2 Bundled CDM Bundled CDM is suitable for medium to large units, or small units in large aggregation, which belong to limited number of owners. Project sites may include several conglomerate sites. The project sites are temporally concentrated; in other words, EE improvement activities occur more or less during a short period of time in different project sites. The number of committed owners is known at the start of the project, and the addition of new participants is not allowed.
3.5.3 Stand-alone CDM Traditional stand-alone CDM is suitable for large units and large sites that generally belong to a single owner (the majority of CDM projects that have registered to date are in this category).
It is worth noting that Figure 3.2 is a generalization, and resembles the conceptual distribution of EE projects. Specific business sectors, such as the power stations and industrial boilers that are discussed in section four, may show different curves. As shown in Figure 4.2, sites concentrated on the long tail point to two natural niches for pCDM: industrial boilers, and small and micropower stations. The case study presented in section four discusses the suitability of structuring a CDM program for one of these technological options (boilers).
41

4. Case study: fuel-switching for EE improvements of industrial boilers in Peru
4.1 Introduction
The guidance for PoAs is best understood in light of its potential application. This case study starts with the premise that fuel-switching for EE is a potentially promising PoA application in Peru. It then explores how the potential PoA could be structured under three different scenarios, two of which are possible under the current rules, and one that is currently not allowed, but that promises the greatest impact.
4.2 Options for CDM programs in Peru
In principle, one could apply pCDM to stand-alone projects and bundled projects, but the full advantage of pCDM lies in the possibility of registering the program without specifying, ex-ante, ALL its constituent activities (which is not possible under bundling or regular CDM).21 In this case study, we select and further develop a suitable sector for a CDM program. We start by recalling that (as pointed out in section two) p-CDM finds its natural niche in sectors with the following characteristics:
• Small to medium-size units • Geographically dispersed • Temporally dispersed • Large quantity of owners • Unknown committed owners • Combined EE measures (types one, two and/or three)
Fig. 4.1. Examples of possible actions by EE improvement type
21 According to annex 39, EB32 the PoADD for registration should include at least one real case (a real CPA).
42
In Peru there are several sets of activities that share these characteristics. The number and profile of such activities is diverse. Figure 4.1 shows possible EE initiatives classified according to the categories listed at the beginning of section two.
It is evident that there are a wide range of potential sectors that could aggregate projects under a PoA, and that possess GHG emission reduction potential. An assessment of different options was conducted in Peru to identify the most suitable sector for the case study. It was determined that the most promising options are: EE in the public sector, small landfill programs, solar energy in the Peruvian highlands, and industrial boilers.
The EE program in the public sector would be based on the promotion of efficient lighting and the rational use of energy in equipment (i.e., elevators, computers, printers, air conditioning, etc.). The program would be coordinated by the Ministry of Energy and Mines (MINEM). In the past, this ministry led an in-house pilot project that achieved five percent energy savings (Energy and Mines Ministry Annual Report 2001).
The small landfill program would be targeted at cities and landfills with less than one hundred tons of solid waste per day. This program would be led jointly by the National Municipalities Association, the Sanitation Department at the Housing Ministry (which is in charge of planning the development of infrastructure for sanitation) and a private operator to be selected through a bidding process.
The solar energy program in the Peruvian highlands would aim at coordinating micro-efforts to deploy solar systems for domestic hot water, space heating for farm animals, and fish farming. The Center for Renewable Energies at the National Engineering University (CER-UNI) and the National Environmental Fund (FONAM) would lead this initiative. CER-UNI has a long track record, having implemented more than 30,000 solar thermals in Arequipa.
The industrial boilers program would be led by the Production Ministry and the High Level Cabinet Commission for the Promotion of Natural Gas. Given the fact that, on average, the boilers currently in use have been operating for over twenty-one years (some boilers have been working for over seventy years) and that the main fuel source (83.3%) is residual oil, the program promises to boost efficiency along two lines of action: technological upgrade and fuel-switching to NG or biomass.
In order to select the suitable sector, a screening process was conducted taking into consideration some crucial factors such as: social and economic impacts, GHG emissions reductions, national development priorities, and country readiness. Table 4.1 summarizes this appraisal.
Among the programs proposed, only the EE public sector program and the industrial boilers program aim to improve EE levels. Of these two, only the industrial boilers program is based on approved baseline and monitoring methodologies of suitable scope. Hence, the program chosen for this case study is fuel-switching for EE in industrial boilers. In addition to this comparative advantage, a program for industrial boilers would include:
• Official bottom-up information to establish the characteristics and parameters of the sector: national boilers inventory
• Official information to identify and support the sector baseline: national and production GHG tier two emissions inventory
• Official top-down information to identify alternatives and trends: annual national energy balance
Within the possible actions shown in Figure 4.1, fuel-switching to improve EE levels in boilers (combining types one and three) falls into the long tail section (see Figure 4.2) and has the characteristics of a CDM program.
43

Table 4.1 Options for pCDM in Peru
Social and economic impact
Potential GHG reductions Strategic priorities for Peru Institutional and
market readiness
EE public sector program
Because the government is the biggest buyer of goods and services in Peru, this program would demonstrate large-scale EE benefits
Assuming a five percent decrease in electricity consumption (taking the MINEM pilot program as a reference) the program would lead to a modest yearly GHG reduction of 7825 t/CO2e22
Peru is realigning its public budget, giving more emphasis to public investment and trying to decrease state overhead; however, the minor amount of savings and CERs from this program do not help its short term viability
The technology and know-how can be easily supplied by local firms
Small landfill program
The program would boost capital allocation to sanitary infrastructure improving in the short term the environmental performance of small municipalities and districts
Former estimates by the National Environmental Council (CONAM) point to 150,000–200,000 tCO2e per year Further fieldwork is required to quantify potential GHG reductions
Highest priority In line with the National Plan for Solid Waste Management (PNRS)
The regulatory side needs further work to allow a single or a few private operators for such a program Current legal framework limits an operator to landfill concession on a one-by-one basis
Solar energy program in the Peruvian highlands
Program would contribute to fight poverty in areas with poverty percentage above seventy percent
Not estimated Needs further information on number of households and potential fishing farms to be installed on highlands
It is in line with the recently launched export program, Sierra Exportadora, that focuses on developing commercial capabilities among highlanders
The technology and know-how can be easily supplied by local firms
Industrial boilers program
Program would enhance competitiveness of heat intensive sectors such as textiles, fishing industry, among others
Energy consumption would decrease by 798.814 GJ/year, which would roughly mean a yearly GHG reduction of 610,039 t/CO2e23
It is in line with the National Competitiveness Plan devised by the Ministries of Production and Economics and Ministry of Finance The program would count with the institutional support of the Ministry of Production
The technology and know-how can be easily supplied by local firms
Fig. 4.2. Distribution of EE possibilities v. unit size
22 Estimated considering a total electricity consumption of 1,161 TJ and a grid emission factor of 0.485/tCO2e /MWh by the Peruvian public sector (National Energy Balance 2004; IPCC EFDB 2006). 23Estimated considering a national residual fuel oil consumption of 133,588 TJ and an emission factor of 0.011186/tCO2e /US gallon (National Energy Balance 2004; IPCC EFDB).
44

Following are three different scenarios for fuel-switching. They are presented in order to fully assess both the potential and limitations of the guidance on PoAs. Each has different implications for structuring a PoA: 1. Scenario one. A PoA limiting itself to the application of one approved baseline
methodology and one technology (according to the original guidelines published in Annex 15 of EB28)
2. Scenario two. A PoA using a single baseline and monitoring methodology applied to several technologies (according to the revised guidelines published in Annex 38 of EB32)
3. Scenario three. A PoA that would be a comprehensive program, including several methodologies and several technologies (a scenario not allowed under the current guidelines)
Scenarios one and two are exclusively oriented toward EE improvements through fuel-switching, Scenario three seeks to improve boilers in general (going beyond EE improvement and fuel switch-ing). Figure 4.3 shows the conceptual boundaries of the three scenarios.
Fig. 4.3. Conceptual boundaries of PoA scenarios
4.3 Conceptual design of the program
4.3.1 Scenario one: PoA limited to one methodology and one technology A program entailing activities to improve the EE levels of industrial boilers may entail diverse actions, and not all of them will necessarily comply with the current rules and procedures of CDM. The guidance on the registration of CPAs under a PoA as a single CDM project activity, originally issued by the EB at its twenty-eighth meeting, stated that each CDM program can use only one approved baseline methodology and one technology. Taking this into account, the program should restrict itself to activities that can be described by a single baseline and monitoring methodology. The consolidated approved methodology ACM009 suits this requirement. In line with this methodology, the PoA would be limited to activities that switch from residual fuel oil to NG at boilers that are located at, and directly linked to, an industrial process with a main output other than heat.
45

a) Description of a typical CPA The program would consist of a set of CPAs. A CPA would be the mitigation activities that would be applied to a single boiler. Individual boilers could be added to the program at any time over the length of the duration of the PoA. These would be implemented by a multitude of owners/users (mainly at the long tail) in response to the program that would be put in place. The managing entity would make sure that the following conditions apply to each enrolling CPA:
• Prior to the implementation of the CPA, only coal or petroleum fuel (but not NG) has been used in the boiler to be defined as the CPA
• Regulations/programs in the country do not constrain the facility from using the fossil fuels being used prior to fuel-switching
• Regulations do not require the use of NG or any other fuel in the element processes
• The project activity does not increase the capacity of thermal output or lifetime of the element processes during the crediting period (i.e., emission reductions are only accounted up to the end of the lifetime of the relevant element process), nor is there any thermal capacity expansion planned for the project facility during the crediting period
• The proposed project activity does not result in integrated process change (this disables the inclusion of type two EE activities [see Figure 4.1])
A typical CPA would consist of fuel-switching at a single element process. The ACM009 methodology defines an element process as fuel combustion in a single piece of equipment at one point of an industrial facility (the fuel is not combusted for the purpose of electricity generation or used as an oxidant in chemical reactions, or otherwise used as feedstock). For the purpose of this program, an element process would be defined as steam and hot air generation by a boiler. Each element process should generate a single output (such as steam or hot air) by using mainly a single fuel (not plural energy sources). For each element process, EE is defined as the ratio between the useful energy (the enthalpy of the steam/water/gas multiplied with the steam/water/gas quantity) and the supplied energy to the element process (the net calorific values of the fuel multiplied by the fuel quantity).
Each CPA would consist of fuel-switching from residual fuel oil to NG at a small or medium-size boiler, and would entail the following interrelated measures:
• Contract to extend NG pipeline
• Purchase and installation of internal NG tubing within the industrial facility
• Purchase and installation of NG meters and burners
• Natural gas supply contract and fuel switching from coal or oil to NG
b) PoA boundary The program boundary would cover CO2 emissions associated with fuel combustion in each boiler (element process affected) at each CPA along or close to the NG pipeline of Peru. The project boundary is applicable to both baseline emissions and CPA emissions. For the purpose of determining CPA emissions, PoA participants should include carbon dioxide emissions from the combustion of NG in each boiler within their respective CPAs.
46

For the purpose of determining baseline emissions, PoA participants should include carbon dioxide emissions from the combustion of the quantity of residual fuel oil that would be used in each boiler in the absence of their respective CPAs.
The spatial extent of the PoA boundary encompasses the physical, geographical sites of all industrial facilities participating in the PoA. As pointed out before, it is foreseen that most CPAs would be located close to or along the NG pipeline in Lima, Peru.
c) Baseline and additionality analysis The additionality of the PoA must be established at both the PoA level and the CPA level. At the PoA level the managing entity must demonstrate that in the absence of the CDM (a) the proposed voluntary measure would not be implemented, or (b) the mandatory policy or regulation would not be systematically enforced, or (c) that the PoA will lead to a greater level of enforcement of the existing mandatory policy or regulation. In the case of Peruvian boilers, the additionality of the PoA would be established by the fact that there is no requirement to implement fuel-switching activities in the boilers in Peru.
At the level of the individual boilers, the additionality of the CPAs could be demonstrated by the application of the combined tool for baseline and additionality.
Step one: Definition of alternative scenarios to the proposed CPAs We have identified all alternative scenarios that are available to the PoA participants and that provide outputs or services with comparable quality, properties, and application areas as the proposed PoA.
PoA participants would have the following alternatives for the fuel use at boilers based on the consolidated baseline methodology ACM0009:
1. Continuation of the current practice 2. Switching fuel to biomass at small and medium-size boilers 3. Switching fuel to NG without CDM at small and medium-size boilers 4. Switching to NG on small and medium-size boilers at a future point in the crediting period
All four alternatives are in full compliance with current applicable laws and regulations. From the demand standpoint, there are no local regulations or programs restricting the use of coal, petcoke, fuel oil number six, NG, or biomass as industrial thermal fuels in Peru. Neither are any environmental regulations or programs prohibiting boilers from continued use of coal, petcoke, or fuel oil number six as fuels. In summary, no alternative is banned from being implemented according to current laws and regulations in Peru; therefore, no alternative is eliminated in Sub-step 1b.
Step two: Identification of barriers and their impact on alternative scenarios There are no prohibitive barriers to alternative one. In alternative two, the use of biomass would require a greater (than current) heat input to produce the same quantity and quality of heat and steam.24 Given the boundary of the PoA (arid zone) and the lack of sufficient biomass to bring the boilers to the required temperature for the element process, the implementation of this alternative is not realistic. Alternative three lacks of prevailing practice, making this it the “first of its kind.” Former fuel-switching activities have focused on entire medium and large-scale facilities, and not on small and medium-size boilers.
24 A project-specific penalty could be applied, because the combustion of typically coarser biomass and other alternative fuels, as opposed to more finely ground coal, would reduce the heat transfer efficiency at boilers. This would, therefore, require a greater heat input to produce the same quantity and quality of heat and steam.
47

In the case of alternative four, it is foreseeable that during the crediting period of the CPAs, the price of NG could rise sharply for two reasons. First, it is indexed to the international price for oil on the international market (considered in the forty-year concession contract and stability rules between the State of Peru and the NG Camisea Project operators).25 Second, the medium and long-term business plans of gas companies (considered in the concession of the second phase of Camisea) are focused on NG exports. In this framework, the NG operators in Peru have the freedom of exporting the gas instead of selling the gas in the domestic market of Peru, avoiding a high opportunity cost and profiting from high oil and NG prices in the international market.
Under these conditions, the alternative of switching to NG in the medium or long-term (during the crediting period) faces remarkable barriers. In summary, the only alternative that does not face barriers is alternative one; hence alternative one represents the baseline scenario for each typical CPA.
The registration of the PoA would alleviate the barriers that prevent and discourage the implementation of alternative three through the supply of CER revenues, which could be used to kick-start a massive fuel switch at boilers along or close to the pipeline. According to the combined tool for baseline and additionality, we should now move to step three.
Step three: Common practice analysis A few years ago, some industries signed NG supply contracts under the “take-or-pay” principle
in order to guarantee lower fees for NG at the reception point and some other advantages.26 According to OSINERG, only six industries in Peru signed such contracts with gas producers:
1. Alicorp S.A. (food and beverages sector) 2. Sudamericana de Fibras S.A. (fiber manufacturer) 3. Cerámica Lima S.A. (ceramic manufacturer) 4. Vidrios Industriales S.A. (glass manufacturer) 5. Corporación Cerámica S.A. (ceramic manufacturer) 6. Cerámicas San Lorenzo S.A.C. (ceramic manufacturer) 27
Most of these industries are ceramics and glass manufacturers that switched from liquefied petroleum gas (LPG) and fuel oil number six to NG. Even under favorable conditions, the gas prices offered were too high for boiler owners to be able to maintain their operational costs in a profitable range and they did not sign any of these initial contracts for gas supply.
According to the Official National GHG Inventory of Peru, “the common practice in Peruvian boilers is to use residual fuel oil” (National Environmental Council 2005). This demonstrates that the CPAs within the proposed PoA are not common practice; hence, the CPA is additional.
d) The proposed monitoring approach The managing entity would standardize monitoring protocols within the PoA and would report periodically to CONAM, the host country DNA, the updated list of CPAs undertaken within the PoA. This would avoid the double recognition of a CPA as an individual CDM project (CONAM
25 Most natural gas in Peru comes from the Camisea Project. The proposed PoA would use natural gas from this source. 26 Article four of the Reglamento de Promoción del Desarrollo de la Industria del Gas Natural (Promotion for Development of the Natural Gas Industry Regulations) states the benefits under the contracts. The main benefits are: lower fares, longer periods to recover the prepaid volumes of natural gas (“make up” and “carry forward” periods) and other benefits stated in each contract. 27 National Bureau for Energy Investment Supervision 2004b
48

is in the process of implementing a national registry). In addition, periodic site visits for technical and CDM auditing would be performed. These actions would ensure that double counting is systematically avoided.
Since the PoA would use the consolidated methodology ACM0009, the managing entity would monitor the PoA according to the following indicators:
1. NG consumption for each CPA would be measured on a continuous basis. This would be reported on a monthly basis to the program manager who would sign a memorandum of understanding (MoU) with Calidda, the NG distributor at Lima-Callao. This MoU would entail specific cooperation and information exchange to document NG consumption on a monthly and annual basis for a submitted list of CPA participants. This would make sampling NG consumption unnecessary since the program manager would count on complete and accurate firsthand information. CPA participants would declare (and would be audited periodically) if NG would be used beyond their boilers: in this case NG flow meters would be installed at each boiler to gauge net NG consumption for each boiler within the PoA. A draft of the reports on NG consumption would be copied to every CPA participant.
2. The EE of each CPA, the net calorific value (NCVNG,y) and the CO2 emission factor of NG (EFNG, CO2) would be monitored monthly, based on national or international standards. Based on the monthly measurements, annual averages would be calculated and used in the equations presented in the baseline methodology. A process information protocol would be implemented by the CPA participants. This protocol would capture all information needed to calculate the EE at each boiler. This system would provide information on all the CPA participants. The net calorific value of NG would be provided by the NG provider. A standardized and documented CO2 emission factor of NG would be provided by the managing entity.
e) The managing entity A PoA must have a coordinating or managing entity that assumes the responsibility of developing the PoA DD, setting the framework for the implementation of the PoA, and unambiguously defining all CPAs under the PoA. The coordinating entity communicates with the EB, and makes arrangements with the owners of the CPAs related to the distribution of CERs. Furthermore, the program manager is in charge of negotiating the sale of CERs through ERPAs or carbon bidding. It is expected that the managing entity should hold a combination of managerial, CDM technical capabilities, and experience developing CDM projects.
f) Program lifetime and leakage Each CPA would have a renewable crediting period of either ten or seven years. Because CPAs can be added to the program at any time, the crediting period of the CPAs within the program would be staggered. At registration, the managing entity must define the duration of the PoA, which can be any period up to a maximum of twenty-eight years. The decision on the duration of the PoA would depend on consultation during the design phase with potential members and other stakeholders.
According to the National Energy Balance, boilers represent half of the industrial energy consumption in Peru. More importantly, industrial boilers are the major consumer pool of residual fuel oil. If industrial boilers are switched to fuels in the framework of the program, this could cause a drift effect, ultimately influencing other business sectors (e.g., brick makers, small power stations, etc.) to switch to healthier fuels.
49

Another positive consequence of the program is that leakage would be easily noticed. The program manager could exchange information with the planning department at the Ministry of Energy and Mines to detect/quantify the flow of used residual fuel oil from boilers to other businesses. CPAs would stimulate the extension and availability of NG in facilities or locations. Combined with the fact that the profitability of residual fuel oil sellers depends on big volumes, this would induce a positive spillover effect. Additionally, proper monitoring and follow-up would ensure that replaced boilers do not end up being used elsewhere. There are initiatives to take old boilers to rural villages and convert them to biomass instead of destroying them. This would cause “good” leakage in areas where biomass is abundant and, if not used, it would end up decomposing and anaerobically generating methane.
4.3.2 Scenario two: adding furnaces and roasters to the fuel switch program The program we have just outlined in the previous section is exclusively limited to fuel-switching in boilers, due to the original EB28 restriction to a single technology; however, the revised guidance contained in Annex 38 of EB 32 now makes it clear that, although the single methodology limitation is still in place, its application to a single technology has been lifted. In that new context, ACM009 as a single methodology extends its application beyond boilers to include furnaces and roasters, as well. The methodology considers these additional technologies as similar element processes that can be included within the same project activity. Consequently, for this second scenario we structure the PoA using a single approved baseline methodology, ACM 009, applied to several similar technologies.
Enhancing the CPA concept To illustrate such a program, let us revisit the conceptual design of the PoA. In this process we realize that the compliance terms (applicability conditions for ACM009) stay the same, but the CPA profile needs to be upgraded to include other similar element processes. Accordingly, and for the purpose of this program, an element process would be defined by the ACM0009: fuel combustion in a single piece of equipment at one point of an industrial facility (the fuel is not combusted for the purpose of electricity generation or used as oxidant in chemical reactions or otherwise used as feedstock). Under this scenario, a typical CPA would be defined as fuel-switching in an element process including: switching boilers using residual fuel oil for steam or heat generation; or furnaces using coal for heat generation; or roasters using residual fuel oil or diesel for heat generation.
All CPAs are identical since they are each a single equipment in an industrial facility generating a single output (such as steam or hot air) by using mainly a single fuel (not plural energy sources). The same measures are applied to each CPA (see Table 4.1). For each element process, EE is defined as the ratio between the useful energy (the enthalpy of the steam/water/gas multiplied with the steam/water/gas quantity) and the supplied energy to the element process (the net calorific values of the fuel multiplied with the fuel quantity).
Table 4.1 Typical CPA: heat generation Process Measures applied to each CPA
Heat generation through a boiler Heat generation by a furnace Heat generation by a roaster
Contract to extend NG pipeline + Purchase and installation of internal NG tubing within the industrial facility + Purchase and installation of NG meters burners + Natural Gas Supply contract and switching fuel from coal or oil to NG
50

a) PoA boundary The program boundary would cover CO2 emissions associated with fuel combustion in the element process affected by all CPAs. The project boundary is applicable to both baseline emissions and CPA emissions. For the purpose of determining CPA emissions, PoA participants would include carbon dioxide emissions from the combustion of NG in each element process within their respective CPAs.
For the purpose of determining baseline emissions, each CPA would identify the original fuel being displaced and include carbon dioxide emissions from the combustion of the quantity of coal, residual fuel oil, or diesel that would be used in boilers, furnaces, and roasters in the absence of their respective CPAs.
The spatial extent of the PoA boundary would encompass the physical, geographical sites of all industrial facilities participating in the PoA.
b) Baseline and additionality analysis As under the previous scenario, the additionality of the PoA would be established by the fact that there is no requirement to implement fuel switching activities in boilers, furnaces, or roasters in Peru. The additionality of the CPAs at the level of the individual boilers, furnaces, or roasters could be demonstrated by the application of the combined tool for baseline and additionality.
Step one: definition of alternative scenarios to the proposed CPAs We have identified all alternative scenarios that are available to the PoA participants and that provide outputs or services with comparable quality, properties, and application areas as the proposed PoA. PoA participants in this scenario would have the same alternatives for the fuel use at boilers, furnaces, or roasters (also based on the consolidated baseline methodology ACM0009) as those in scenario one.
All four alternatives are in full compliance with current applicable laws and regulations. From the demand standpoint, there are no local regulations or programs restricting the use of coal, petcoke, fuel oil number six, NG, or biomass as industrial thermal fuels for boilers, furnaces, or roasters in Peru. Neither are any environmental regulations or programs prohibiting their owners from continued use of coal, petcoke, or fuel oil number six as fuels. In summary, no alternative is banned from being implemented according to current laws and regulations in Peru; therefore, no alternative is eliminated in Sub-step 1b.
Step two: identification of barriers and their impact on alternative scenarios There are no prohibitive barriers to alternative one. Alternative two faces the same constraints as in scenario one, rendering it largely unrealistic except for those CPAs located in places where biomass is readily available. Specific detail should be provided to show whether or not an alternative use for biomass is already in practice, or whether additional logistical systems need to be implemented to ensure a sustained flow of biomass for the CPAs. Otherwise, alternative two poses no barriers for CPAs located at biomass-rich places.
Alternatives three and four are subject to the same conditions as in scenario one, and for the same reasons the alternative of switching to natural gas in the medium or long-term (during the crediting period of the CPA) faces remarkable barriers.
In summary, as in scenario one, the only alternative that does not face barriers (in general and depending on the ad-hoc analysis to be performed on CPAs located in biomass rich places) is alternative one; hence, it represent the baseline for each CPA.
51

The registration of the PoA would alleviate the barriers that prevent and discourage the implementation of alternative three through the supply of CER revenues that could be used to kick start a massive fuel switch in boilers, furnaces or roasters along or close to the pipeline. According to the combined tool for baseline and additionality, we should now move to step three.
Step three: common practice analysis For a discussion of the industries who have signed natural gas supply contracts in order to guarantee lower fares for natural gas at the reception point and some other advantages, see step three in scenario one.
As was highlighted previously, most of these industries are ceramics and glass manufacturers that switched from LPG and fuel oil number six to natural gas. Even with these promoting conditions the offered gas prices were too high for SMEs owning boilers, furnaces, or roasters to be able to maintain their operational costs in a profitable range and they did not sign any of these initial contracts for gas supply.
According to the Official National GHG Inventory of Peru, “the common practice in Peruvian boilers is to use residual fuel oil, furnaces use coal [and] Peruvian roasters use residual fuel oil or diesel depending on their size” (CONAM 2005). This demonstrates that the CPAs within the proposed PoA are not common practice; hence, making the CPAs additional.
The monitoring approach, the program lifetime, leakage, and the profile for the managing entity are the same as for the PoA of the former section. The impact of this more comprehensive program would, however, obviously be greater than the impact of the previous scenario since it goes beyond boilers and includes other types of heat generation equipment (furnaces and roasters) located close to the present and future natural gas pipeline.
4.3.3 Scenario three: envisioning an all-inclusive package for boilers
If one asks boiler technicians what needs to be done to improve end-use efficiency at boilers, they will tell you that everything depends on the size, age, and owner of the boiler. Not every boiler owner has the creditworthiness to finance the replacement of an old inefficient boiler, is located close to a NG pipeline, or likes the idea of changing heat and steam processes. Motivated by this diversity of measures to improve boilers performance, we explored the different types of EE actions that may be performed under a comprehensive program to improve boilers efficiencies. We start by considering the EE improvement action types suggested in section two and proceed with an analysis of how currently available baseline methodologies could be put together to give shape to a comprehensive boilers program that, at least in some cases, would have to include several methodologies. In this regard, such a comprehensive program would combine three main lines of action:
1. Switching fuel. This entails switching to NG or biomass. Obviously, for NG, the area of influence would be the current and future NG pipeline, where companies could switch to NG through pipeline extension and burners replacement. The baseline and GHG reductions could be properly quantified through the application of the approved consolidated baseline methodology ACM0009. For the case of boilers located at sugar mills, and other areas where a sustainable supply of biomass is available, baseline methodology AM0036 would be the most appropriate to describe activities involving the migration from residual fuel oil to bagasse (this involves some process change and also falls into type two).
2. Process change. If companies decide to outsource one hundred percent of their heat and electricity needs from Energy Service Companies (ESCOs), these service firms could
52

implement natural gas cogeneration packages and the situation could be described by baseline methodology AM0014.
3. Technological upgrade. This involves the upgrade/installation of more efficient burners, isolation systems, steams traps, and steam optimization practices. The area of influence would be national; however, the actual program “site” would be limited to 115 fishing flour28 industrial facilities along the Peruvian coastline and 528 industrial facilities29 across Peru comprising textile, food, and beverage companies. In cases where this technological upgrade is not accompanied by fuel-switching, baseline methodology AM0044 would be the easiest way to describe and quantify the baseline, and account for GHG emissions reductions of the activities.
To include all possible activities leading to EE improvements at boilers, we have defined several types of CPAs (A-H) to reflect specific applicability conditions of available baseline and monitoring methodologies. Of course this cannot be done with the current CDM rules that limit a PoA to one methodology.
Table 4.2 Program memberships and activity table No. CPA Methodology
used CPA type
I No fuel switch (technological upgrade only) This includes thermal EE improvement of boilers, at multiple locations, through rehabilitation or replacement of the boilers
AM0044 A
II Switching fuel from residual fuel oil to NG through burner upgrades or boiler replacement
ACM009 F
III Heat and electricity is outsourced from ESCOs through the deployment of a NG cogeneration package
AM0014 B G
IV Efficiency improvements can be achieved by reducing losses in steam traps and by increasing the return of condensate
AM0017
C
V Steam optimization projects in production processes with homogeneous and relatively constant outputs with continuous monitoring of steam output
AM0018
D E
VI Biomass for heat generation at boilers (mainly at sugarmills) AM0036 H
Table 4.2 shows that the classification according to activity and methodology would render eight types of CPAs:
1. Type A complies only with methodology AM0044 (for companies far away from the NG pipeline)
2. Type B complies with methodologies ACM009 and AM0014 3. Type C complies with methodologies ACM009, AM0014, and AM0017 4. Type D complies with methodologies AM0014, AM0017, and AM0018 5. Type E complies with methodologies AM0017, and AM0018 6. Type F complies only with methodology ACM009 (for companies along or close to the NG
pipeline) 7. Type G complies only with methodology AM0014 8. Type H complies only with methodology AM0036 and is relevant to agricultural
companies (e.g., sugar mills and agro exports)
The following steps could be used to identify the baseline scenario:
28 541 boilers consuming residual fuel oil with average capacity of 5000–6000 kW/boiler. Total energy consumption of 26,617 TJ. 29 399 boilers consuming residual fuel oil with an average capacity of 4,000–9,800 kW/boiler and total energy consumption of 19,631 TJ. 652 boilers consuming diesel with an average capacity of 500–1500 kW/boiler and total energy consumption of 2,152 TJ.
53

Step one: identify alternative scenarios to the proposed CDM project activity that are consistent with current laws and regulations
Alternatives include, but are not limited to, the following scenarios:
1. Continuation of use of the existing boilers (there are no regulations or laws restricting or obligating given types and boiler performance)
2. Replacement/rehabilitation/fuel-switching/technological upgrade of boilers by the program´s participant, as defined in baselines methodologies ACM0009, AM0014, AM0017, AM0018, AM0036, and AM0044 (i.e., implementation of the proposed program without the CDM)
Step two: identify the most likely baseline scenario Alternative one is far more likely than alternative two due to the fact that:
1. Most boilers belong to companies that have difficulty accessing capital due to poor credit worthiness (e.g., fishing flour companies already hold too much debt). Moreover, in the case of a big disbursement, such as the acquisition of new boilers, the return on investment rarely breaks even.
2. According to the Official National Boilers Inventory, the rehabilitation/replacement of boilers to improve efficiency is not a common practice in Peru.
But what does this mean in specific numbers? According to the 2004 National Survey for Boilers commissioned by the Industry Ministry and the 2004 National Energy Balance:
• Continuation of use of 541 boilers consuming residual fuel oil with average capacity of 5,000–6,000 kW/boiler and total energy consumption of 26,617 TJ
• Continuation of use of 399 boilers consuming residual fuel oil with average capacity of 4,000–9,800 kW/boiler and total energy consumption of 19,631 TJ
• Continuation of use of 652 boilers consuming diesel with average capacity of 500–1500 kW/boiler and total energy consumption of 2,152 TJ
Table 4.3 Projected usage of boilers in Peru (2004) Business sector Companies Residual
fuel oil Diesel two
Other fuels
Consumption TJ/year
tCO2/year
399 19,631 1,478,788 652 2,152 157,849
Manufacturing, textile, food and beverage
528
99 Fishing flour 115 541 26,617 2,005,059 TOTAL 643 940 652 99 48,400 3,641 696 Source: Developed with data from the ENC- MITINCI and the National Energy Balance 2004 MINEM
The assessment of additionality for this potential program could be comprised of three steps:
1. Investment and sensitivity analysis. The identification of the baseline scenario (done in the former section) consistently supports the idea that alternative two (i.e., CDM program without income from CERs) is not the most financially attractive alternative. This is because the capital expenditure is substantial (e.g., diverse technological upgrade, training expenses, and equipment purchase) compared to the zero capital expenditure required by alternative one. The program would not be undertaken without CER income. The tool for the demonstration and assessment of additionality suggests three analytical methods: 1)
54

simple cost analysis, 2) investment comparison analysis, and 3) benchmark analysis. Based on the fact that the CDM project activity generates no financial or economic benefits other than CDM-related income, simple cost analysis (option one, sub-step 2b in the additionality tool) is recommended to confirm alternative one as the most plausible baseline scenario. This comparison would be based on the costs to provide the same amount of heat using different fuel sources. Sub-step 2c would be hard to apply because much of the needed information cannot be known ex-ante. Once the program is launched we expect to have a progressive company enrollment at the program. Financial indicators could be calculated as a precondition for anyone joining the program to be considered additional. At this further step, traditional techniques such as discounted cash flow analysis, NPV, and EBITDA parameters would be used.
2. Common practice analysis. Examples of this were given in the previous section. As per official information, boilers improvement and/or replacement and/or fuel-switching is not a common practice in Peru.
3. Impact of CDM registration. Improves the Internal Rate of Return (IRR) of individual activities integrating the program. Specific numbers cannot be provided at this point but it is estimated that at least 600,000 CERs/year could be generated. This could be used to feed a capital fund of at least U.S.$6 million to catalyze further GHG reductions in this business sector.
If we define the program properly so that enrolling activities comply with available baseline methodologies and withstand the additionality test (i.e., the different CPAs could be shown to be additional).
4.4 Monitoring a multimethodology/technology program Ensuring strict compliance with program membership requirements through proper data management and corrective actions is critical to the success of monitoring the many activities integrated into this program scenario.
Even in the early days of a program (e.g., at validation) the question arises of the effectiveness of sampling versus examining all individual activities one-by-one. Though the program may still be only at the paper status and no sampling may be necessary at the time of validation, the verification of CDM programs still entails several challenges, such as providing sound accounting of many activities of a similar nature but with enough diversity to add complexity to this process. In view of these issues we propose a bottom-up monitoring protocol that is based on the specific monitoring requirements of individual methodologies ACM0009, AM0014, AM0017, AM0018, AM0036 and AM0044 that would be applied in the course of achieving CERs within the program.30
The philosophy behind the monitoring protocol for the program is that much of the standard verification steps can be prepared beforehand under the legal responsibility of the managing entity who conducts, not annual, but monthly detailed reporting of all the variables needed to quantify emissions reductions. Figure 4.4 shows the recommended protocol to monitor the program.
The monitoring indicators/variables can be supplied by the managing entity and CPA participants. Besides the compulsory periodicity of reporting according to the baseline methodologies, the managing entity can conduct revisions and technical audits as part of a 30 If novel methodologies arise they can be easily included defining new membership types. The compliance of applicability conditions with current and upcoming methodologies is a requirement to join the program under any of the membership types.
55

Quality Assurance System. This would ensure that each of the members complies with the terms of the program in accordance with its type of membership. This also eases the programming of verification activities by designated operational entities (DOEs) in order to synchronize CER issuance with good emissions trading prices.
AM:0014 1….2….3….
AM:0017
Reputed ProgramManager &
Technical Auditor
AM:0018
AM:0036
AM:0044
ACM0009
1….2….3….
1….2….3….
1….2….3….
1….2….3….
1….2….3….
Individual Reports withMonitoring Parameters
MonthlyProgramReport
DOE orientedProgram Report
DOE
Pre-defined BussinesProceses withinProgram´s participants(e.g. ISO managementsystems, reportingprocedures, etc.)
Fig. 4.4. The monitoring protocol for a comprehensive boilers program
The manager, in close consultation with the program’s members, would analyze the convenience of implementing specific GHG accounting procedures such as the GHG Protocol, the ISO 14064, or ad-hoc monitoring ISO procedures within members accredited with the ISO seal. One of the benefits of this monitoring practice is that it promotes sound reporting, a practice that can be spread to other areas beyond CDM such as environmental reporting compliance. In this way, it is a good contribution to sustainable development governance.
But how would this monitoring protocol be implemented in practice? Imagine a DOE starting a verification task. A first step would be to stop by the managing entity’s office, analyze a sample of monitoring reports submitted by the CPAs to the managing entity, and crosscheck them with fieldwork. This sounds like standard sampling but it is not: it constitutes a quality check on the robustness of the monitoring reporting system administrated by the managing entity. It is quite different from sampling CPA locations and auditing them in detail. This second way of sampling can be done, alongside a quality assurance activity, to ensure that sound monitoring reporting practices are in place, are not ambiguous, and that their outcomes can be reproduced. This procedure—called top-down and bottom-up crossed sampling—is sometimes used by customs agents and at international ports operated by private entities.
In a few words, the DOE samples the quality of the CPA’s reporting while the managing entity closely monitors (and reflects this on monthly reports) day-to-day activities of the PoA, and is held responsible for its environmental integrity.
In this case study we have depicted and briefly analyzed three scenarios targeting EE improvements of three commonly used industrial appliances: boilers, furnaces, and roasters.
56

While the motivation for this case study was to show how current CDM rules help or restrain GHG reductions associated with EE improvements, through the course of this study we have shown that traditional EE approaches (type three) can be easily complemented by type one and two actions in order to structure GHG reduction projects in the framework of CDM.
Regardless of the number and type of data that needs to be gathered regularly by the monitoring system, it is clear that the critical success factor for a sound monitoring is the actual operating capacity of the managing entity who needs to keep an eye on the day-to-day activities of individual CPAs.
One of the key findings of this case study is the fact that under scenarios one and two PoAs are pretty much alike (i.e., same boundary and same baseline methodology) while scenario three goes beyond discrete EE actions and aims to tackle general improvement on a base technology in a given sector (e.g., industrial boilers). Table 4.4 summarizes the three scenarios.
Table 4.4 Summary of case study Scenarios Methodological
issues 1: One methodology and one technology
2. One methodology and various technologies
3. Multiple technologies and multiple methodologies
Program description EE improvements through fuel-switching at boilers from residual fuel oil to natural gas
EE improvements through fuel-switching at boilers, furnaces, and roasters to natural gas
Comprehensive EE improvements for boilers The program aims to improve EE levels at industrial boilers through three lines of action: • fuel-switching • process change • technological upgrade
Typical CPA to happen in multiple sites
Fuel-switching at single element process (small and medium-size boilers for steam and heat generation) Interrelated measure: • contract to extend NG pipeline • installation of NG tubing within
the industrial facility • installation of NG meters and
burners NG supply contract and fuel-switching from coal or oil to NG
Fuel-switching in an element process including boilers, furnaces, and roasters Additional measures for each CPA: • contract to extend NG
pipeline • installation of NG
tubing within the industrial facility
• installation of NG meters and burners
NG supply contract and fuel-switching from coal or oil to NG
CPAs may include: I. technological upgrade II. fuel-switching from residual
fuel oil to NG through burners upgrade or boiler replacement
III. heat and electricity is outsourced from ESCOs through the deployment of a NG cogeneration package
IV. Eeficiency improvements can be achieved by reducing losses in steam traps and by increasing the return of condensate.
V. steam optimization projects in production processes with homogeneous and relatively constant outputs with continuous monitoring of steam output
VI. biomass for heat generation at boilers (mainly at sugarmills)
Managing entity Private or public entity with the technical and managerial capacity to monitor and organize multiple simultaneous projects
Domestic support All program scenarios count on: 1. institutional support from the Ministry of Production once the program design is complete 2. cross-sectoral support through the High Level Cabinet Commission on NG 3. official bottom-up information to characterize the sector (e.g., National Boilers Inventory) 4. official information to identify and support the sector baseline (e.g., National and
Production GHG tier two Emissions Inventory) 5. official top-down information to identify alternatives and trends (e.g., Annual National
Energy Balance) PoA boundary The program boundary covers CO2 emissions associated with
fuel combustion in each element process affected by each CPA The project boundary is applicable to both baseline emissions and CPA emissions
The spatial extent of the PoA boundary encompasses the physical, geographical sites of all companies participating at
57
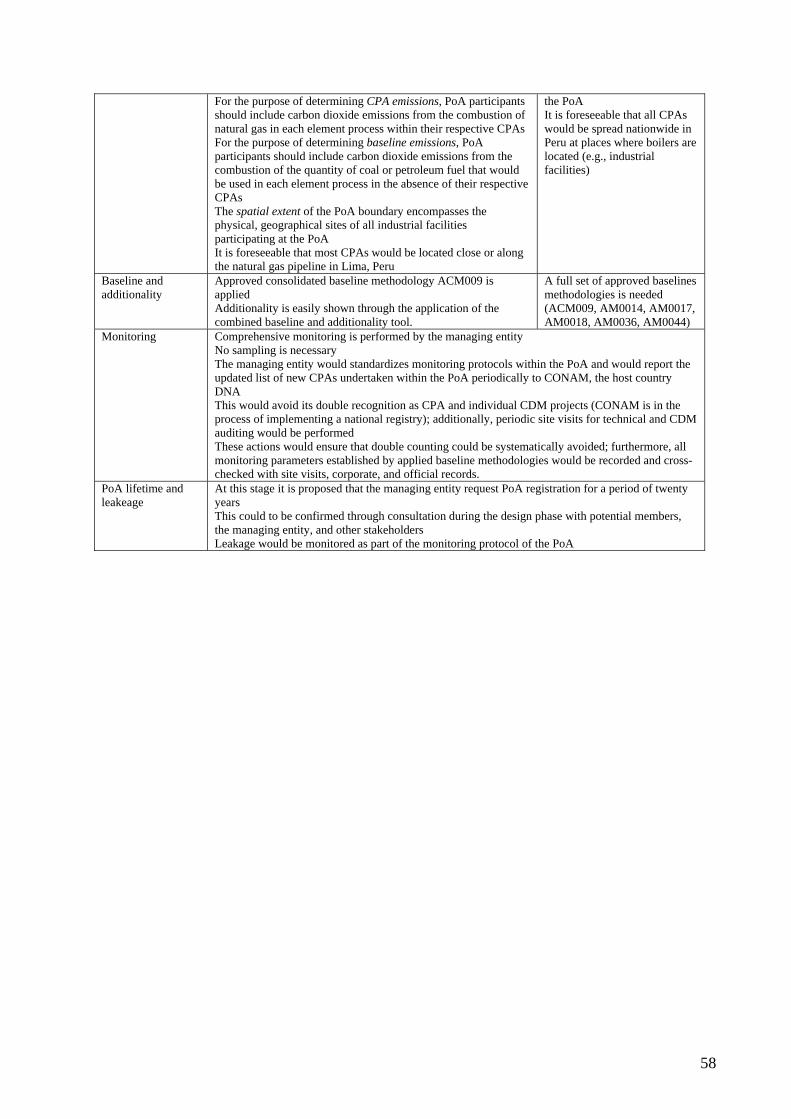
For the purpose of determining CPA emissions, PoA participants should include carbon dioxide emissions from the combustion of natural gas in each element process within their respective CPAs For the purpose of determining baseline emissions, PoA participants should include carbon dioxide emissions from the combustion of the quantity of coal or petroleum fuel that would be used in each element process in the absence of their respective CPAs The spatial extent of the PoA boundary encompasses the physical, geographical sites of all industrial facilities participating at the PoA It is foreseeable that most CPAs would be located close or along the natural gas pipeline in Lima, Peru
the PoA It is foreseeable that all CPAs would be spread nationwide in Peru at places where boilers are located (e.g., industrial facilities)
Baseline and additionality
Approved consolidated baseline methodology ACM009 is applied Additionality is easily shown through the application of the combined baseline and additionality tool.
A full set of approved baselines methodologies is needed (ACM009, AM0014, AM0017, AM0018, AM0036, AM0044)
Monitoring Comprehensive monitoring is performed by the managing entity No sampling is necessary The managing entity would standardizes monitoring protocols within the PoA and would report the updated list of new CPAs undertaken within the PoA periodically to CONAM, the host country DNA This would avoid its double recognition as CPA and individual CDM projects (CONAM is in the process of implementing a national registry); additionally, periodic site visits for technical and CDM auditing would be performed These actions would ensure that double counting could be systematically avoided; furthermore, all monitoring parameters established by applied baseline methodologies would be recorded and cross-checked with site visits, corporate, and official records.
PoA lifetime and leakeage
At this stage it is proposed that the managing entity request PoA registration for a period of twenty years This could to be confirmed through consultation during the design phase with potential members, the managing entity, and other stakeholders Leakage would be monitored as part of the monitoring protocol of the PoA
58

5. Conclusions This working paper has presented and explained the guidance for PoAs, and assessed both the potential and the limitations of pCDM. The analysis leads us to the following conclusions:
1. Programmatic CDM offers a promising framework to maximize sustainable development benefits through the inclusion of long tail business sectors in developing countries. Households and SMEs are the main constituents of the long tail and, as such, their strengthening is fundamental to fight poverty and promote sustainable development. Structuring PoAs around long tail opportunities is one of the available avenues to integrate GHG reductions and sustainable development.
2. Programmatic CDM offers real incentives to promote EE improvements in developing countries. It is difficult to convince a home or business owner to invest in reducing GHG emissions if there is no guarantee of revenue. Programmatic CDM can reduce regulatory risk for investments at the long tail, where predefined PoAs (validated and registered) can offer real incentives to GHG abatement actions in SMEs or households.
3. Sound monitoring and reporting protocols proposed for PoAs promote the improvement and standardization of reporting, thereby contributing to environmental governance in developing countries. One of the backbones of a PoA is a robust monitoring system administered by the managing entity. As the number of participants in PoAs can be high, their participation in the PoA would stimulate much needed standardized reporting to the DNA, which in many countries is the national environmental authority, thereby strengthening environmental governance in developing countries. The standardization of GHG emissions and related variables reporting can have a positive spillover effect on other environmental fields such as water usage, waste management, and community relationships.
4. The current guidelines for PoA registration do not maximize the potential of pCDM. The restriction to one single methodology limits pCDM from taking advantage of large-scale initiatives that involve system-wide efficiency improvements representing real business decisions (which rarely seek to improve one thing at a time, preferring integrated optimization instead—better business not just better process). System-wide efficiency is much more effective in terms of reducing energy consumption and GHGs, but would need several CDM methodologies.
59

REFERENCES Barnes, D.F., and W.M. Floor. 1996. Rural energy in developing countries: A challenge for
economic development. Annual Review of Energy and the Environment. 21: 497–530.
Bosi, M., and J. Ellis. 2005. Exploring options for “sectoral crediting mechanisms.” Organization for Economic Cooperation and Development (OECD)/International Energy Agency (IEA). Paper for the Annex One Experts Group on the UNFCCC, Paris, France.
Capoor, K., and P. Ambrosi. 2007. State and trends of the carbon market 2007. International Emissions Trading Association (IETA) and the World Bank, Washington, D.C.
Cheng, C. 2005. Electricity demand-side management for an energy efficient future in China: Technology options and policy priorities. Ph.D. diss., Massachusetts Institute of Technology, Cambridge, Mass.
Cosbey, A., J.-E. Parry, J. Browne, Y.D. Babu, P. Bhandari, J. Drexhage, and D. Murphy. 2005. Realizing the development dividend: Making the CDM work for developing countries. Winnipeg, Canada: International Institute for Sustainable Development.
Ellis, J. 2006. Issues related to a program of activities under the CDM. Organization for Economic Cooperation and Development (OECD)/International Energy Agency (IEA). COM/ENV/EPOC/IEA/SLT 3 (05 May 2006) 26.
Figueres, C. 2005. Sectoral CDM: Opening the CDM to the yet unrealized goal of sustainable development. International Journal of Sustainable Development Law and Policy. 2(1): 5–27.
Figueres C., and M. Bosi. 2006. Achieving greenhouse gas emission reductions in developing countries through energy efficient lighting projects in the Clean Development Mechanism (CDM). Washington, D.C.: World Bank Carbon Finance Unit Working Paper.
Figueres, C., E. Haites, and E. Hoyt. 2005. Programmatic CDM project activities: Eligibility, methodological requirements, and implementation. Washington, D.C.: World Bank Carbon Finance Unit Working Paper.
Intergovernmental Panel on Climate Change (IPCC). 2006. Emissions factors database (EFDB).
International Energy Agency (IEA). 2006. Light’s labor’s lost. IEA: Paris.
———. 2006. World Energy and Environmental Outlook. IEA: Paris.
———. 2004. World Energy and Environmental Outlook. IEA: Paris.
Ministry of Energy and Mines. 2005. National energy balance 2004. Lima, Peru.
Monteiro, L.F., C. Cohen, K. Helioui, F. Nadaud, and A. Szklo Salem. 2004. How to use the CDM in the residential sector: The case of Brazilian refrigerators.
Müller-Pelzer, F., and A. Michaelowa, A. 2005, Lessons from the submission and approval process of energy-efficiency CDM baseline and monitoring methodologies. Hamburg Institute of International Economics (HWWI) Research Paper Number One. HWWI International Climate Policy Research Program, 40.
National Bureau for Energy Investment Supervision (OSINERG). 2004a. Promotion for development of the natural gas industry regulations. Lima, Peru.
60

———. 2004b. Natural gas industry in Peru. Lima, Peru.
National Environmental Council (CONAM). 2005. National GHG inventory base year 2000. Lima, Peru.
Niederberger, A.A., and R. Spalding-Fecher. 2006. Demand-side energy efficiency promotion under the Clean Development Mechanism: Lessons learned and future prospects. Energy for Sustainable Development 10(4): 51–64.
Ng, W., and L. Schipper. 2005. China motorization trends: Policy options in a world of transport challenges. In Growing in the greenhouse: Protecting the climate by putting development first, edited by K. Baumer. Washington D. C.: World Resources Institute.
Porter, M. E., and C. van der Linde. 1995. Green and competitive: Ending the stalemate. Harvard Business Review 73(120).
Production Ministry. 1999. National boilers inventory. Lima, Peru.
Sales, R., and B. Kerlakian Sabbag. 2006. Legal compliance with environmental requirements impacting assessment and demonstration of additionality in Clean Development Mechanisms: A legal review under the UNFCCC, the Kyoto Protocol and the Brazilian Legal Framework on Climate Change.
Samaniego, J., and C. Figueres. 2002. Evolving to a sector-based Clean Development Mechanism. In Building on the Kyoto Protocol: Options for protecting the climate, edited by K. Baumert. Washington, D.C.: World Resources Institute.
Schmidt, J., E. Silsbe, J. Lee, S. Winkelman, N. Helme, and J. Garibaldi. 2006. Program of activities as CDM projects: Implications of the Montreal decision. Washington, D.C.: Center for Clean Air Policy.
Schmidt, J., K. Lawson, and J. Lee. 2004. Sector-based greenhouse gas emissions reduction approach for developing countries: Some options. Washington, D.C.: Center for Clean Air Policy.
Sterk, W., and B. Wittneben. 2005. Addressing opportunities and challenges of a sectoral approach to the Clean Development Mechanism. JIKO Policy Paper 1/2005. Wuppertal Institut fur Klima, Umwelt und Energie, Wuppertal, Germany.
Toman, M., and B. Jemelkova. 2003. Energy and economic development: An assessment of the state of knowledge. Washington, D.C.: Resource for the Future.
United Nations Environmental Program (UNEP). 2007. Buildings and Climate Change: Status, Challenges and Opportunities. UNEP.
UNFCCC (United National Framework Convention on Climate Change) Secretariat. CDM Executive Board. UNFCCC Secretariat. 2007. Revision to the combined tool to identify the baseline scenario and demonstrate additionality.
———. 2006a. Decision/CMP.2. Further guidance relating to the Clean Development Mechanism. http://unfccc.int/files/meetings/cop_12/application/pdf/cmp_8.pdf.
———. CDM Executive Board. 2006b. Revision to the approved consolidated baseline methodology: ACM0009 consolidated baseline methodology for fuel-switching from coal or petroleum fuel to natural gas.
61

———. CDM Executive Board. Annex 15, EB28. 2006c. Guidance on the registration of project activities under a program of activities as a single CDM project activity.
———. CDM Executive Board. Annex 3, EB22. 2005. Additional clarifications regarding the treatment of national/sectoral policies and circumstances. ———. CDM Executive Board. The additionality tool. See UNFCCC website at
www.unfccc.int/cdm.
———. CDM Methodologies Panel. Annex one of the report of the twenty-fifth meeting (15–19 January 2007). Draft baseline and monitoring methodology AM00XX “Distribution of efficient light bulbs to households.”
World Bank. 2005. A case example of a programmatic small-scale CDM Project: The FaL-G Brick Project in India. Washington, D.C.: The World Bank.
Worrell, E., and R. van Berkel. 2001. Technology transfer of energy efficient technologies in industry: A review of trends and policy issues. Energy Policy 29: 29–43.
62
Related Documents