Munich Personal RePEc Archive Potential and Return Migrants in Bulgaria - Demographic and Socio-economic Aspects Vesselin Mintchev Economic Research Institute at the Bulgarian Academy of Sciences, International Business School, Botevgrad, Bulgaria 15 July 2016 Online at https://mpra.ub.uni-muenchen.de/78597/ MPRA Paper No. 78597, posted 24 April 2017 13:43 UTC

Welcome message from author
This document is posted to help you gain knowledge. Please leave a comment to let me know what you think about it! Share it to your friends and learn new things together.
Transcript
MPRAMunich Personal RePEc Archive
Potential and Return Migrants inBulgaria - Demographic andSocio-economic Aspects
Vesselin Mintchev
Economic Research Institute at the Bulgarian Academy of Sciences,International Business School, Botevgrad, Bulgaria
15 July 2016
Online at https://mpra.ub.uni-muenchen.de/78597/MPRA Paper No. 78597, posted 24 April 2017 13:43 UTC
1
Vesselin Mintchev1
POTENTIAL AND RETURN MIGRANTS IN BULGARIA -
DEMOGRAPHIC AND SOCIO-ECONOMIC ASPECTS
Abstract:
The article suggests results from a study of external migration in Bulgaria as a
sending country where the so called potential migrants and returnees from abroad
are explored. The purpose of the paper is to outline the profile, attitudes and labour
realization (expected – concerning the potential migrants, and factual of the
returnees) in both groups. The comparison between them shows whether the
migration experience of returnees relates to the attitudes and expectations of potential
migrants. On the other hand, the monitoring of external migration attitudes of
Bulgarian population allows the estimation of the country’s migration potential and
description of the employment and income status of return migrants during their stay
abroad. Furthermore, the attitudes of Bulgarians towards the influx of foreign
population into the country are duscussed on the basis of data from three consecutive
sample surveys (2001, 2007, and 2011).
JEL: F22, J11, O15.
Introduction
Migration is a complex, multi-dimensional phenomenon which persistently induces the
interest of various disciplines. In this respect, the focus of this study are the demographic
and socio-economic factors supporting the strong attitudes to international mobility and
external migration in the country. The study does not assume any differentiation between
the terms “mobility” and “migration”. Of course, after the integration of Bulgaria in the EU
out-migration from Bulgaria to the old EU member states is legally considered as “intra-
community mobility”of EU citizens. Given the reasons that cause it – namely, differences
in the standard of living, and because of the consequences for the country associated with
an irreversible change in the structure of the population – here these two terms are seen as
synonymous.
The study summarizes and analyzes empirical data on various categories of emigrants:
potential and actual. Тhe former are categorized as long-term and short-term migrants; the
latter (i.e.the actual migrants) in this case include the category of so-called “temporary
migrants”. These in turn, can be differentiated into “return” and “circular” migrants.
The factors supporting strong attitudes to cross-border mobility of Bulgarian population are
interpreted through the prism of migration and re-migration potential and profiles; job
1 Vesselin Mintchev is from Economic Research Institute at the Bulgarian Academy of Sciences and
from International Business School, Botevgrad, Bulgaria, phone: +359-886-283295,
e-mail: [email protected].

2
realization – expected and actual (by activity, sector of employment and occupied
positions); income, expenses and remittance behavior; “self-organization” of Bulgarians
during their stay abroad.
The information basis is one of the main issues of migration studies. There is a variety of
sources providing information on external migration. One of them is based on sample
surveys – using such a source it is relatively easy to obtain information on the attitudes
towards emigration and on the assessment of the profile of people who would like to
emigrate, as well as their main reasons to enter any migration processes. Surveys in the so-
called “countries of origin” provide such an appropriate information. At the same time, this
type of surveys can be used to monitor the so-called “return migrants”. The assessment of
their number, profile and their experience abroad (in terms of fulfillment and satisfaction)
very often alters the notion of purely hypothetical migration attitudes persisting in the
“countries of origin”. Furthermore, surveys of return migrants provide an opportunity for
alternative assessments of remittances and savings from abroad, complementing the
information from the national balance of payments.
Therefore, one of the objectives of this paper is to provide information, based on sample
surveys conducted since 2007, on potential emigration from the country, on return migrants
and their migration experience and remittance behavior.
1. Sociological survey in Bulgaria (2011)
For the purposes of analysis of potential emigration from the country and for assessing the
number, profile and attitudes of returnees, we use data from a nationally representative
sample survey conducted in the framework of a project entitled “Bulgarian diaspora in
Western Europe: cross-border mobility, national identity and development”. The target
population covers Bulgarian residents in the age range 15-59 at April 2011, where the
available statistical information on the population as of 2009 was used in planning the
sample by regions.
The sample was planned and implemented based on a two-stage cluster design where the
planned volume of 1200 respondents was distributed proportionally to the population of the
28 districts of the country2. The sample was planned to contain a total of 200 clusters with a
fixed number of survey units of 6 respondents in each cluster. During the first stage, in each
district clusters were selected randomly in the respective housing areas by implementing
the technique of “sampling with probability proportional to size”. At the second stage, the
sampling of respondents was implemented by random selection of a starting survey address
in each cluster in the sample. Households in which a respondent was to be selected, were
identified by the method of random selection by visiting every third address (see: Appendix
Table 25, 26, 27).
2 The fieldwork was performed in April 2011 by the Agency for Socioeconomic Analyses /A.S.A./.
The survey team was coordinated by Dr. Docho Mihailov.
3
In order to ensure the best possible degree of match between the demographic structure of
the sample and that of the target population, a subsequent quota control was performed.
Quotas by gender and age (five age subgroups for each of the 28 districts) were determined
in proportion to the size of the population in each age group in the respective district. On
this basis, individual respondents were identified after reconciliation with the quota by
gender and age (in case of more than one person in the household that qualifies into the
relevant age-gender group, the selection method of the “closest birthday” was applied; see:
Appendix, table 26).
The planned sampling error of the representative sample at national level amounted to 1.44
percentage points for estimating a relative share of 50%. This was epected to provides a
high degree of validity of the sample estimates. Moreover, as a result of the applied control
procedures the formed sample reproduces with very high accuracy the structure of the
population by districts, gender and age. The resulting deviations of the sample shares of
subsets differentiated by both gender and age do not exceed 1 percentage point.
Bigger differences are identified only in individual age groups within males and females -
for example, in the highest age group (55-59 years) the proportion of the individuals in the
sample exceeded this proportion in the population by 1.2 percentage points for females and
by 1.6 percentage points for males (see: Appendix, table 27). These differences can be
explained by the fact that the sampling design was implemented on the basis of data from
2009, and within the two years (2009-2011) some changes occurred in the gender and age
structure of the population. These changes, together with the influence of random factors
during the sampling, are the two main causes of deviations – but they can be considered as
minor and cannot question the validity of the results from the conducted empirical survey.
The questionnaire includes 237 variables alolocated to 80 questions. It contains two main
sections – the first one (Section A – Residing Abroad) aims in gathering information from
the so-called “return migrants” (in this case, these are people who resided abroad for more
than 3 months in the previous 5 years). We were interested in information about:
1) the way of departure;
2) job realization (activity, sector of employment and occupied position);
3) education (including - information on students abroad; specialty; how do they support
themselves during their studies, etc.);
4) income, expenses and remittances (distribution of respondents by income groups); this
information is used for evaluating remittances of emigrants (as in this case no
distinction is made between “remittances of emigrants” and “remuneration of the
employees abroad”(see Balkanska and Mintchev, 2012);
5) contacts with other Bulgarians;
6) attitudes of the local people and authorities;
7) political involvement.
In the second section (Section B - Potential Emigration) the attitudes concerning a decision
to emigrate – forming the types of emigration – are recorded using an ordinally scaled

4
question in the survey (with options: “emigration for good”, “long-term /labour/
migration”, “short-term” and “educational”). The focus of the analysis hereafter is put
mainly on:
1) preferred destinations;
2) ways of departure;
3) reasons to leave Bulgaria – in the context of Ravenstein laws (Grigg, 1997), subsequently
transformed into the so-called “push” and “pull” migration factors;
4) expected activity abroad, including sector, job, etc.;
5) attitudes towards potential immigration flows to Bulgaria.
The information from this survey (fundamental for the analysis in this study) matches in
large extent with the results from similar studies, e.g. those conducted in 2007 (Mintchev
and Boshnakov, 2007), 2012 (Mintchev et al., 2012) and 20133.
In this paper, based on the information from the sample surveys indicated above, we will
consecutively look at the following important questions:
the migration potential and preferred destinations;
socio-demographic profile of potential expatriates and potential short-term migrants
(gender, age, education, economic status);
expected activities, sectors of employment and jobs of the potential migrants;
“return” and “current” migrants (i.e. individuals residing abroad at the time of the study)
- estimates about their number, length of stay, remittance behavior;
diaspora organization and political involvement in the host countries;
countries from which they return and reasons for returning;
activities, jobs, and sectors of employment after returning to Bulgaria.
2. Migration potential
Traditionally, migration potential from Bulgaria is evaluated by two key questions
identically implemented by the above-mentioned questionnaire surveys. The first question
distinguishes between the so-called “potential migrants” from “potential non-migrants”. It
facilitates the categorization of “potential migrants” into short-term (intending to leave for a
few months /not more than a year/), long-term (with the intention to leave the country for a
period longer than 1 year), and expatriates (settlers: people who express intentions to
permanently settle abroad).
3The last survey was conducted under the project “Migration and transnationalism between
Switzerland and Bulgaria” within the Bulgarian-Swiss Research Program 2011-2016. The data from
this study is presented in Richter, M. et al. (2017).
5
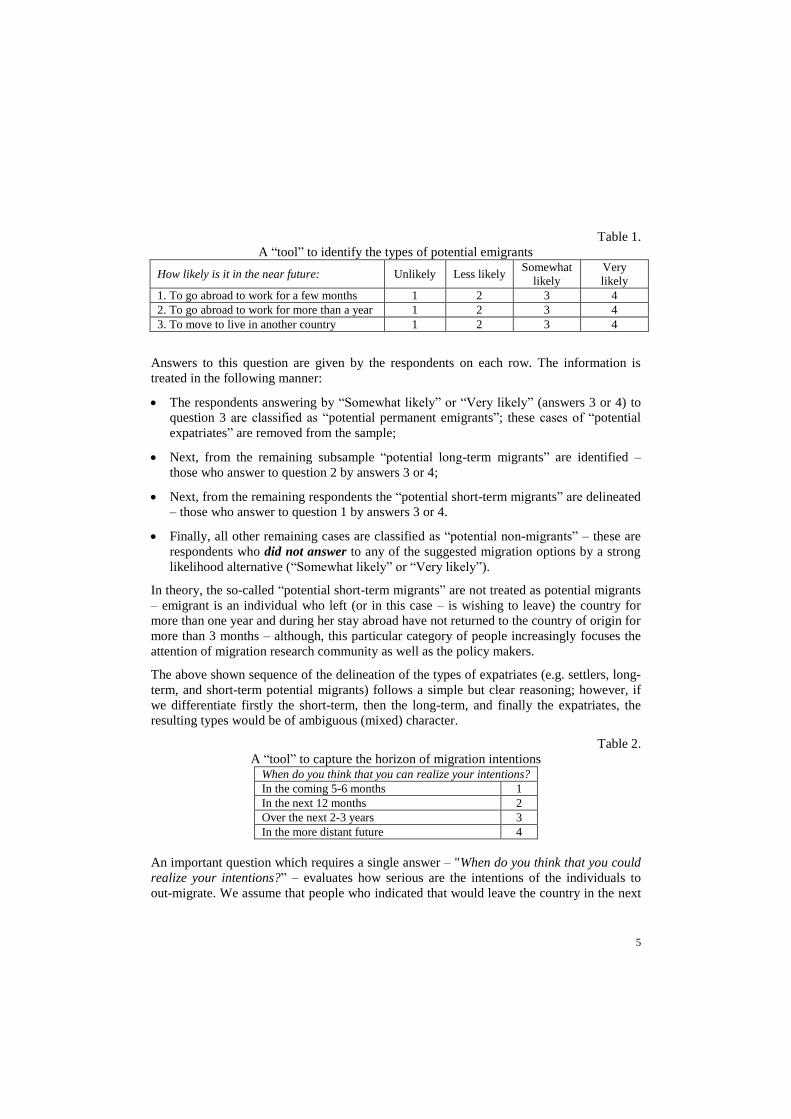
Table 1.
A “tool” to identify the types of potential emigrants
How likely is it in the near future: Unlikely Less likely Somewhat
likely
Very
likely
1. To go abroad to work for a few months 1 2 3 4
2. To go abroad to work for more than a year 1 2 3 4
3. To move to live in another country 1 2 3 4
Answers to this question are given by the respondents on each row. The information is
treated in the following manner:
The respondents answering by “Somewhat likely” or “Very likely” (answers 3 or 4) to
question 3 are classified as “potential permanent emigrants”; these cases of “potential
expatriates” are removed from the sample;
Next, from the remaining subsample “potential long-term migrants” are identified –
those who answer to question 2 by answers 3 or 4;
Next, from the remaining respondents the “potential short-term migrants” are delineated
– those who answer to question 1 by answers 3 or 4.
Finally, all other remaining cases are classified as “potential non-migrants” – these are
respondents who did not answer to any of the suggested migration options by a strong
likelihood alternative (“Somewhat likely” or “Very likely”).
In theory, the so-called “potential short-term migrants” are not treated as potential migrants
– emigrant is an individual who left (or in this case – is wishing to leave) the country for
more than one year and during her stay abroad have not returned to the country of origin for
more than 3 months – although, this particular category of people increasingly focuses the
attention of migration research community as well as the policy makers.
The above shown sequence of the delineation of the types of expatriates (e.g. settlers, long-
term, and short-term potential migrants) follows a simple but clear reasoning; however, if
we differentiate firstly the short-term, then the long-term, and finally the expatriates, the
resulting types would be of ambiguous (mixed) character.
Table 2.
A “tool” to capture the horizon of migration intentions When do you think that you can realize your intentions?
In the coming 5-6 months 1
In the next 12 months 2
Over the next 2-3 years 3
In the more distant future 4
An important question which requires a single answer – "When do you think that you could
realize your intentions?” – evaluates how serious are the intentions of the individuals to
out-migrate. We assume that people who indicated that would leave the country in the next
6
5-6 months (or up to 1 year) are much more prone to act accordingly – however, those
saying “over the next 2-3 years” or “in a more distant future” could be considered as having
quite a hypothetical migration intentions.
The data below sorts out the attitudes expressed during the year before the country's full EU
membership (Mintchev and Boshnakov, 2007) as well as during the period immediately
after the start of the global crisis. A serious discrepancy in the attitudes to emigrate in 2011
compared to 2007 is observed. Only 6.7% of the respondents in 2007 were willing to
emigrate in the current year and 11.8% declared that they would do it after few years or in
the more distant future; in 2011, the former were already almost 10% (9.8% said they
would leave in the coming 5-6 months or within 1 year) and the latter reached 13.8%.
In other words, the potential emigration from Bulgaria just before the integration of the
country in the EU was below 20% (more precisely - 18.6%); only four years after that (in
2011) 22.8% of the working age population was willing to search realization abroad – i.e. it
could be assumed that almost every fourth Bulgarian resident of working age was a
potential emigrant.
Another important notion also came to light – in 2007 the prevailing intentions were
focused on the short-term migration (i.e. rather for mobility /apparently within the EU/ than
for emigration); on the other hand, in 2011 the desires for “emigration for good”
(resettlement) clearly prevailed.
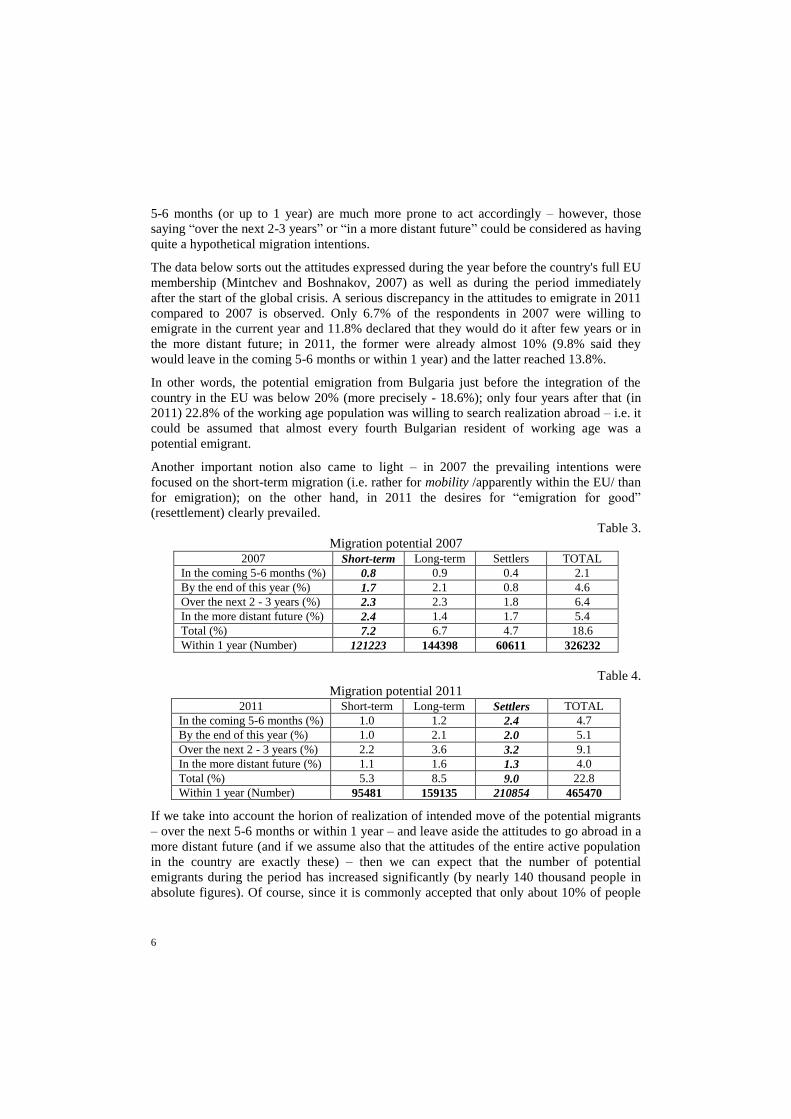
Table 3.
Migration potential 2007
2007 Short-term Long-term Settlers TOTAL
In the coming 5-6 months (%) 0.8 0.9 0.4 2.1
By the end of this year (%) 1.7 2.1 0.8 4.6
Over the next 2 - 3 years (%) 2.3 2.3 1.8 6.4
In the more distant future (%) 2.4 1.4 1.7 5.4
Total (%) 7.2 6.7 4.7 18.6
Within 1 year (Number) 121223 144398 60611 326232
Table 4.
Migration potential 2011 2011 Short-term Long-term Settlers TOTAL
In the coming 5-6 months (%) 1.0 1.2 2.4 4.7
By the end of this year (%) 1.0 2.1 2.0 5.1
Over the next 2 - 3 years (%) 2.2 3.6 3.2 9.1
In the more distant future (%) 1.1 1.6 1.3 4.0
Total (%) 5.3 8.5 9.0 22.8
Within 1 year (Number) 95481 159135 210854 465470
If we take into account the horion of realization of intended move of the potential migrants
– over the next 5-6 months or within 1 year – and leave aside the attitudes to go abroad in a
more distant future (and if we assume also that the attitudes of the entire active population
in the country are exactly these) – then we can expect that the number of potential
emigrants during the period has increased significantly (by nearly 140 thousand people in
absolute figures). Of course, since it is commonly accepted that only about 10% of people

7
intending to out-migrate would really act to do it, then the number of potential emigrants
(settlers) can be estimated at much lower figures (6 thousand in 2007 and 21 thousand in
2011).
Changes occur also in the destinations preferred by Bulgarians - the attractive until recently
South-European destinations Spain and Greece “surrendered the first places” among the
preferences of Bulgarians to countries like the UK and Germany. Among the top 10
destinations invariably are the United States, France, Italy and Cyprus – both in 2011 and in
2007. Moreover, Turkey and Belgium that were frequently indicated in 2007 were replaced
by the Netherlands and Switzerland in 2011.
The persistence of the most preferred destinations during the period is impressive. Among
other things, it speaks of a stabilization of the Bulgarian migration corridors (in terms of the
common attitudes to migrate to specific countries).
Table 5.
Destinations of potential emigration from Bulgaria No 2007 2011
1 Spain UK
2 Greece Germany
3 Germany Spain
4 UK Greece
5 USA USA
6 Turkey France
7 Italy Italy
8 France Cyprus
9 Cyprus The Netherlands
10 Belgium Switzerland
Table 6.
Destinations of out-migration from Bulgaria
by types of potential migrants (in %, 2007)
Short-term Long-term
Expatriates
(Settlers) TOTAL
Spain 10.3 19.8 32.4 17.4
Greece 19.1 14.8 8.8 15.5
Germany 11.8 11.1 14.7 12.1
UK 8.8 9.9 11.8 9.2
USA 4.4 6.2 11.8 6.8
Turkey 11.8 2.5 2.9 6.8
Italy 4.4 7.4 - 5.8
France 2.9 3.7 - 3.4
Cyprus 2.9 3.7 - 2.9
Belgium 2.9 2.5 - 2.4
If only 17.4% of the potential emigrants in total and 32.4% (i.e. almost one in three) of
potential settlers would prefer Spain in 2007, then in 2011 Germany and the UK attract

8
over 40% of them. Furtehrmore, nearly 1/3 of the expatriates would head to the UK and
16.3% to Germany.
Table 7.
Destinations of emigration from Bulgaria by types of potential emigrants (in %, 2011)
Short-term Long-term Expatriates
(Settlers) TOTAL
UK 26.1 10.3 28.6 21.7
Germany 13.0 28.2 16.3 20.8
Spain 8.7 15.4 12.2 11.7
Greece 4.3 15.4 4.1 8.3
USA 8.7 5.1 6.1 5.8
France 4.3 2.6 4.1 5.0
Italy 8.7 5.1 2.0 4.2
Cyprus 4.3 2.6 4.1 3.3
The Netherlands - 2.6 2.0 2.5
Switzerland - - 6.1 2.5
3. Socio-demographic profile of potential migrants
The question how and to what extent the profile of potential expatriates and potential short-
term emigrants has changed in the period 2007-2011 is discussed in the next sections.
3.1. Socio-demographic profile of potential expatriates (settlers)
During the period, the structure of potential expatriates by gender has changed
significantly4. In 2007 it was balanced. Half of potential expatriates were female (49.6%)
and half male (50.4%). This is indicative for a likely relief of migration pressures from the
country immediately prior to EU membership.
Things become different in 2011. Among potential expatriates, although by not so high
percentage, men predominate (58.4%) which gives ground to assume that attitudes to final
(permanent) emigration have become more active.
Serious and somewhat surprising changes have occurred in the age structure of potential
expatriates. If in 2007 people aged up to 20 and up to 30 years dominated, then in 2011
people aged up to 30 and up to 40 years prevailed. Regarding the educational level the
relatively strong desire for resettlement of people with secondary vocational education
stands out in 2011.
The labor market in Bulgaria (from the aspect of “employment-unemployment” factors)
does not affect considerably the desire for a definite emigration. Yet, we observe some
“relaxing” of the intention for resettlement among the employed.
4 A more comprehensive analysis of the so-called “gender dimensions” of the new Bulgarian
emigration is provided, for example, in Rangelova, R. et al. (2006).
9
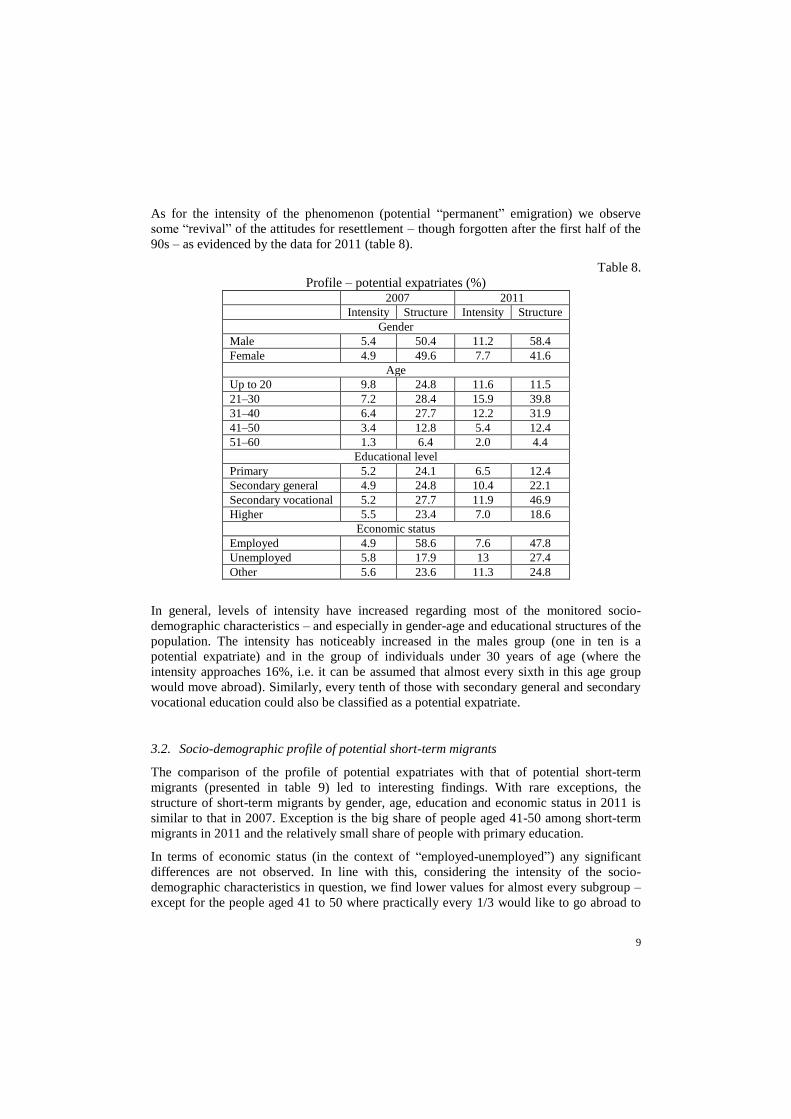
As for the intensity of the phenomenon (potential “permanent” emigration) we observe
some “revival” of the attitudes for resettlement – though forgotten after the first half of the
90s – as evidenced by the data for 2011 (table 8).
Table 8.
Profile – potential expatriates (%) 2007 2011
Intensity Structure Intensity Structure
Gender
Male 5.4 50.4 11.2 58.4
Female 4.9 49.6 7.7 41.6
Age
Up to 20 9.8 24.8 11.6 11.5
21–30 7.2 28.4 15.9 39.8
31–40 6.4 27.7 12.2 31.9
41–50 3.4 12.8 5.4 12.4
51–60 1.3 6.4 2.0 4.4
Educational level
Primary 5.2 24.1 6.5 12.4
Secondary general 4.9 24.8 10.4 22.1
Secondary vocational 5.2 27.7 11.9 46.9
Higher 5.5 23.4 7.0 18.6
Economic status
Employed 4.9 58.6 7.6 47.8
Unemployed 5.8 17.9 13 27.4
Other 5.6 23.6 11.3 24.8
In general, levels of intensity have increased regarding most of the monitored socio-
demographic characteristics – and especially in gender-age and educational structures of the
population. The intensity has noticeably increased in the males group (one in ten is a
potential expatriate) and in the group of individuals under 30 years of age (where the
intensity approaches 16%, i.e. it can be assumed that almost every sixth in this age group
would move abroad). Similarly, every tenth of those with secondary general and secondary
vocational education could also be classified as a potential expatriate.
3.2. Socio-demographic profile of potential short-term migrants
The comparison of the profile of potential expatriates with that of potential short-term
migrants (presented in table 9) led to interesting findings. With rare exceptions, the
structure of short-term migrants by gender, age, education and economic status in 2011 is
similar to that in 2007. Exception is the big share of people aged 41-50 among short-term
migrants in 2011 and the relatively small share of people with primary education.
In terms of economic status (in the context of “employed-unemployed”) any significant
differences are not observed. In line with this, considering the intensity of the socio-
demographic characteristics in question, we find lower values for almost every subgroup –
except for the people aged 41 to 50 where practically every 1/3 would like to go abroad to
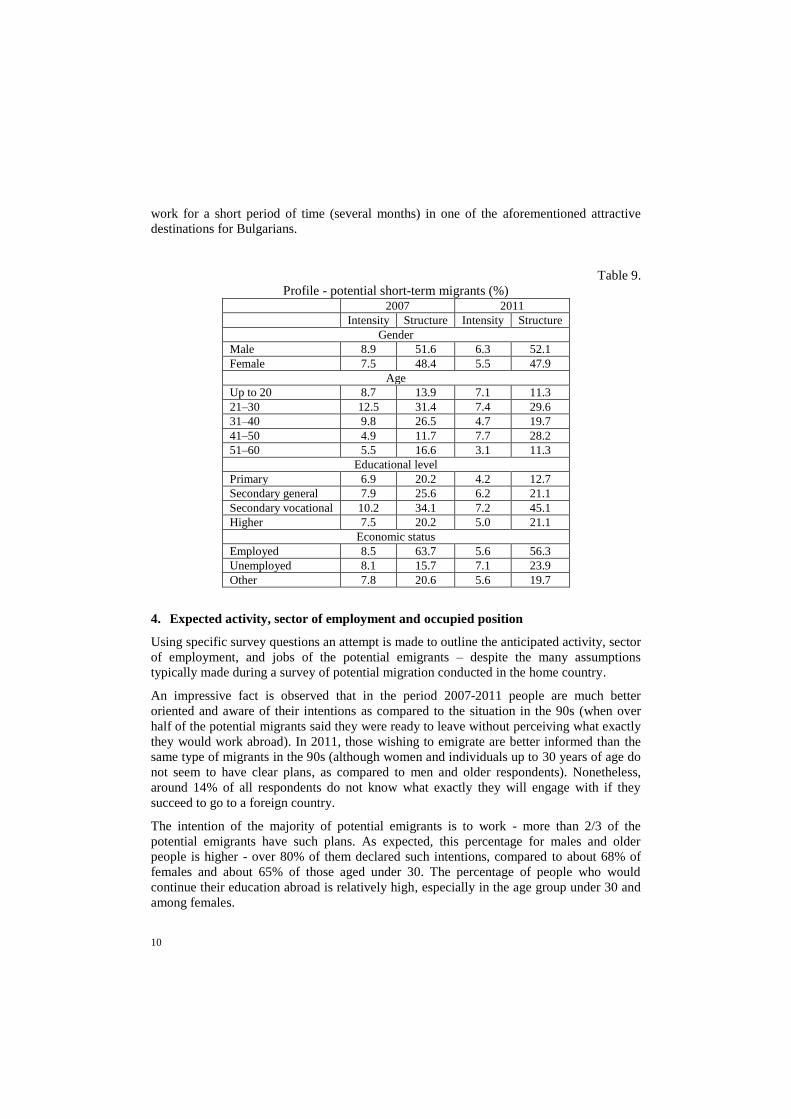
10
work for a short period of time (several months) in one of the aforementioned attractive
destinations for Bulgarians.
Table 9.
Profile - potential short-term migrants (%) 2007 2011
Intensity Structure Intensity Structure
Gender
Male 8.9 51.6 6.3 52.1
Female 7.5 48.4 5.5 47.9
Age
Up to 20 8.7 13.9 7.1 11.3
21–30 12.5 31.4 7.4 29.6
31–40 9.8 26.5 4.7 19.7
41–50 4.9 11.7 7.7 28.2
51–60 5.5 16.6 3.1 11.3
Educational level
Primary 6.9 20.2 4.2 12.7
Secondary general 7.9 25.6 6.2 21.1
Secondary vocational 10.2 34.1 7.2 45.1
Higher 7.5 20.2 5.0 21.1
Economic status
Employed 8.5 63.7 5.6 56.3
Unemployed 8.1 15.7 7.1 23.9
Other 7.8 20.6 5.6 19.7
4. Expected activity, sector of employment and occupied position
Using specific survey questions an attempt is made to outline the anticipated activity, sector
of employment, and jobs of the potential emigrants – despite the many assumptions
typically made during a survey of potential migration conducted in the home country.
An impressive fact is observed that in the period 2007-2011 people are much better
oriented and aware of their intentions as compared to the situation in the 90s (when over
half of the potential migrants said they were ready to leave without perceiving what exactly
they would work abroad). In 2011, those wishing to emigrate are better informed than the
same type of migrants in the 90s (although women and individuals up to 30 years of age do
not seem to have clear plans, as compared to men and older respondents). Nonetheless,
around 14% of all respondents do not know what exactly they will engage with if they
succeed to go to a foreign country.
The intention of the majority of potential emigrants is to work - more than 2/3 of the
potential emigrants have such plans. As expected, this percentage for males and older
people is higher - over 80% of them declared such intentions, compared to about 68% of
females and about 65% of those aged under 30. The percentage of people who would
continue their education abroad is relatively high, especially in the age group under 30 and
among females.

11
Table 10.
Expected activities of potential migrants from Bulgaria (in %, 2011)
What do you intend to do abroad as main
activity?
Gender Age groups Total
Male Female Up to
30 31-45
over
45
Employment / work 80.4 67.7 65.2 84.3 83.3 74.8
Education 5.9 11.8 16.9 0.8 - 8.5
To live with relatives 2.0 4.3 1.7 3.1 6.7 3.0
I don’t know now, but I will decide there 11.8 16.1 16.3 11.8 10.0 13.7
Total 100.0 100.0 100.0 100.0 100.0 100.0
The employment sectors in which the potential migrants from Bulgaria think they would be
able to find jobs, are mainly:
construction (nearly one in five of the total, and almost every third of males);
hotels and restaurants (16% of the total potential emigrants are inclined to work in this
sector and such intentions were declared by over 29% of females);
agriculture - nearly 13% of potential emigrants declared such expectations;
activities in households (housemaids, care for children and/or elderly people) are
popular mostly among women;
financial brokerage, real estate, business services, etc. – only 2.8% of the potential
emigrants (mainly people under 30) would target those sectors
Table 11.
Expected employment sector of potential migrants by gender and age (in %, 2011)
Specify the preferred economic activity Gender Age groups Total
Male Female Up to 30 31-45 over 45
Agriculture, hunting and forestry 15.0 9.4 13.9 8.7 18.8 12.8
Manufacturing industry 6.9 1.9 2.6 5.8 8.3 4.9
Production and distribution of electric and heat energy 1.9 0.9 0.9 1.9 2.1 1.5
Construction 31.9 1.9 18.3 19.4 25.0 19.9
Trade, repair and technical services of motor vehicles 8.1 5.7 11.3 5.8 - 7.1
Hotels and restaurants 7.5 29.2 18.3 19.4 4.2 16.2
Transport, warehousing and communication 11.3 0.9 6.1 7.8 8.3 7.1
Financial brokerage 1.3 2.8 3.5 1.0 - 1.9
Real estate operations, renting and business services 1.9 1.9 3.5 1.0 - 1.9
Public administration and defense; compulsory social security 1.3 - - 1.0 2.1 0.8
Education 1.3 2.8 0.9 1.9 4.2 1.9
Healthcare and social work - 7.5 2.6 3.9 2.1 3.0
Other activities for social and personal services 9.4 12.3 11.3 10.7 8.3 10.5
Activities in households / families (assistant, caregiver, cook) 2.5 22.6 7.0 11.7 16.7 10.5
Total 100.0 100.0 100.0 100.0 100.0 100.0
Regarding the expected occupations almost every third (31%) assesses her chances as more
than modest – people expect jobs of the low-skilled segments (in this respect, women have
higher self-esteem than men) as well as engagement in public services (28.2%). Here the
interest of women is significantly higher than that of men – nearly half of them expect to
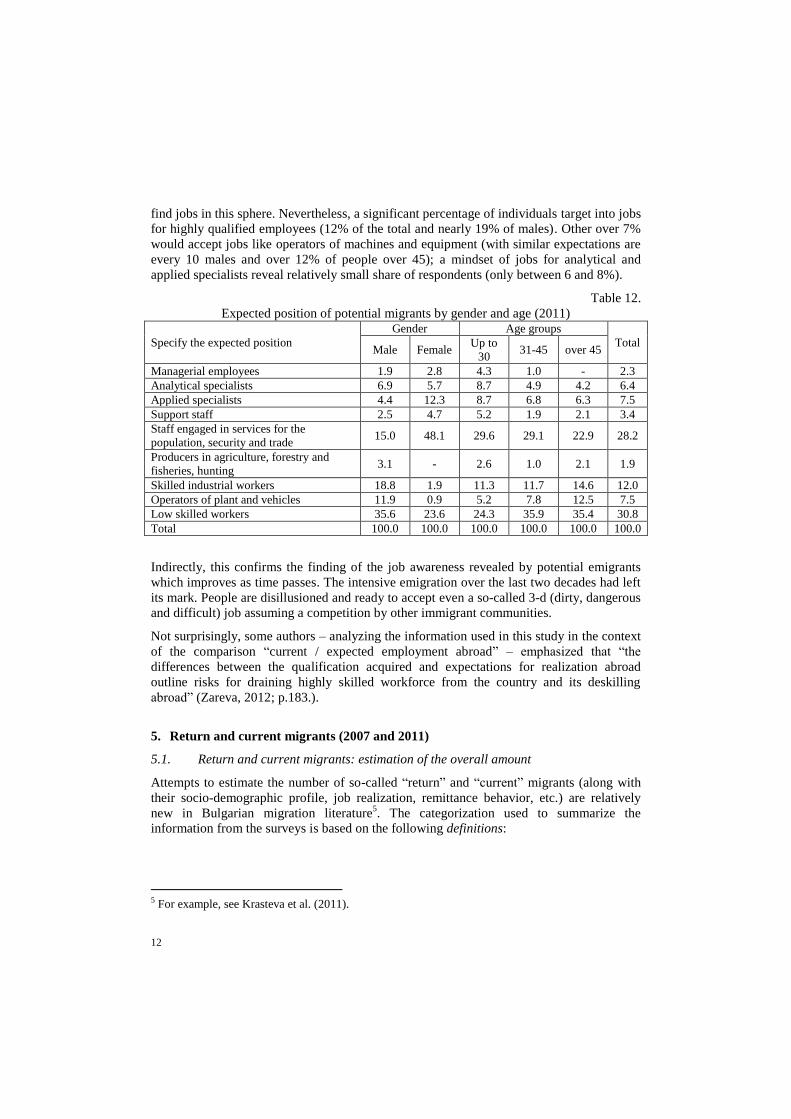
12
find jobs in this sphere. Nevertheless, a significant percentage of individuals target into jobs
for highly qualified employees (12% of the total and nearly 19% of males). Other over 7%
would accept jobs like operators of machines and equipment (with similar expectations are
every 10 males and over 12% of people over 45); a mindset of jobs for analytical and
applied specialists reveal relatively small share of respondents (only between 6 and 8%).
Table 12.
Expected position of potential migrants by gender and age (2011)
Specify the expected position
Gender Age groups
Total Male Female
Up to
30 31-45 over 45
Managerial employees 1.9 2.8 4.3 1.0 - 2.3
Analytical specialists 6.9 5.7 8.7 4.9 4.2 6.4
Applied specialists 4.4 12.3 8.7 6.8 6.3 7.5
Support staff 2.5 4.7 5.2 1.9 2.1 3.4
Staff engaged in services for the
population, security and trade 15.0 48.1 29.6 29.1 22.9 28.2
Producers in agriculture, forestry and
fisheries, hunting 3.1 - 2.6 1.0 2.1 1.9
Skilled industrial workers 18.8 1.9 11.3 11.7 14.6 12.0
Operators of plant and vehicles 11.9 0.9 5.2 7.8 12.5 7.5
Low skilled workers 35.6 23.6 24.3 35.9 35.4 30.8
Total 100.0 100.0 100.0 100.0 100.0 100.0
Indirectly, this confirms the finding of the job awareness revealed by potential emigrants
which improves as time passes. The intensive emigration over the last two decades had left
its mark. People are disillusioned and ready to accept even a so-called 3-d (dirty, dangerous
and difficult) job assuming a competition by other immigrant communities.
Not surprisingly, some authors – analyzing the information used in this study in the context
of the comparison “current / expected employment abroad” – emphasized that “the
differences between the qualification acquired and expectations for realization abroad
outline risks for draining highly skilled workforce from the country and its deskilling
abroad” (Zareva, 2012; p.183.).
5. Return and current migrants (2007 and 2011)
5.1. Return and current migrants: estimation of the overall amount
Attempts to estimate the number of so-called “return” and “current” migrants (along with
their socio-demographic profile, job realization, remittance behavior, etc.) are relatively
new in Bulgarian migration literature5. The categorization used to summarize the
information from the surveys is based on the following definitions:
5 For example, see Krasteva et al. (2011).

13
return migrant is an individual who has resided abroad for a period at least 3
months during the last five years, and at the time of the survey is located in
Bulgaria;
current migrant is an individual who, at the time of the survey, resides abroad.
Of course, these definitions are too conditional but they allow, however, the
implementation of a technique for estimation of the number of people classified in a
particular type. Similarly to the potential migrants, these definitions facilitate the analysis
of the profiles of individuals having migration experience as well as the exploration of the
households having members abroad in the framework of the survey.
The method consists of extrapolation of sample estimates obtained from the surveys
regarding the indicators “number of return migrants” and “number of current migrants” per
one household – assuming we know the approximate number of all households in the
country in a particular year (2007 and 2011). We estimate that the share of households with
return migrants has increased from 10% in 2007 to 13% in 2011 (table 13) while the share
of households with current migrants in 2011 remained at the level of 2007 (about 7%).
Thus, in absolute figures, we calculate that in 2011 the number of returnees exceeded 450
thousand (compared to 384 thousand in 2007) and the number of current migrants is about
256 thousand (compared to 280 thousand in 2007).
Table 13
Returnees and present migrants (estimates 2007 and 2011) As of April of the respective year 2007 2011
Relative share of households with returned migrant (%) 10.1 13.1
Number of households with returned emigrants 294345 391497
Number of return migrants 384494 450814
Relative share of households with present emigrant (%) 7.5 7.1
Number of households with present emigrant 218478 201680
Number of the present emigrants 280435 256252
These figures illustrate one of the effects of the global financial and economic crisis (2008-
2010) on Bulgarian external migration – either way, the number of people returned from
abroad has increased. This is probably one of the reasons for the increase in migration
potential of the country discussed above.
The number of returnees does not seem so impressive if one takes into account the fact that
this is just a 5-years period of identification (preceding to the critical moments of surveys
field work). This explains the lower number of the so-called “current” migrants (those who
at the time of the survey were abroad). Therefore, it could be expected that in the period
2006-2010 about 700 thousand Bulgarian citizens of working age had a kind of
commitment in a foreign country (work; education; staying with relatives or friends, etc.).
Perhaps it needs to be clearly specified that these are estimates derived and based on data
from representative sample surveys conducted in the home country – i.e. we monitor such a
part of Bulgarian migration community that maintains contacts with their relatives and
faces a set of choices – to return, to circulate, or to emigrate for good. Plausibly, a fraction
of them (most probably – the majority) practice the so-called circular migration which is
14
evidenced by the constantly estimated large shares of Bulgarian households with return
and/or current migrants.
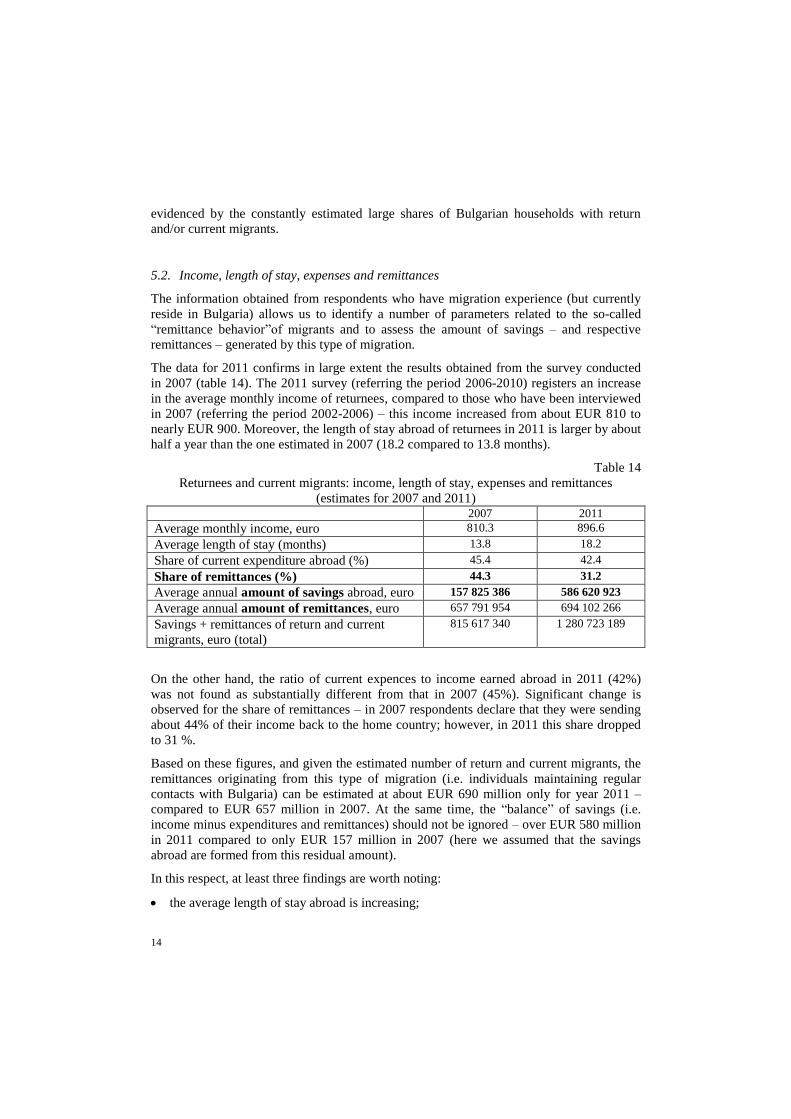
5.2. Income, length of stay, expenses and remittances
The information obtained from respondents who have migration experience (but currently
reside in Bulgaria) allows us to identify a number of parameters related to the so-called
“remittance behavior”of migrants and to assess the amount of savings – and respective
remittances – generated by this type of migration.
The data for 2011 confirms in large extent the results obtained from the survey conducted
in 2007 (table 14). The 2011 survey (referring the period 2006-2010) registers an increase
in the average monthly income of returnees, compared to those who have been interviewed
in 2007 (referring the period 2002-2006) – this income increased from about EUR 810 to
nearly EUR 900. Moreover, the length of stay abroad of returnees in 2011 is larger by about
half a year than the one estimated in 2007 (18.2 compared to 13.8 months).
Table 14
Returnees and current migrants: income, length of stay, expenses and remittances
(estimates for 2007 and 2011) 2007 2011
Average monthly income, euro 810.3 896.6
Average length of stay (months) 13.8 18.2
Share of current expenditure abroad (%) 45.4 42.4
Share of remittances (%) 44.3 31.2
Average annual amount of savings abroad, euro 157 825 386 586 620 923
Average annual amount of remittances, euro 657 791 954 694 102 266
Savings + remittances of return and current
migrants, euro (total)
815 617 340 1 280 723 189
On the other hand, the ratio of current expences to income earned abroad in 2011 (42%)
was not found as substantially different from that in 2007 (45%). Significant change is
observed for the share of remittances – in 2007 respondents declare that they were sending
about 44% of their income back to the home country; however, in 2011 this share dropped
to 31 %.
Based on these figures, and given the estimated number of return and current migrants, the
remittances originating from this type of migration (i.e. individuals maintaining regular
contacts with Bulgaria) can be estimated at about EUR 690 million only for year 2011 –
compared to EUR 657 million in 2007. At the same time, the “balance” of savings (i.e.
income minus expenditures and remittances) should not be ignored – over EUR 580 million
in 2011 compared to only EUR 157 million in 2007 (here we assumed that the savings
abroad are formed from this residual amount).
In this respect, at least three findings are worth noting:
the average length of stay abroad is increasing;
15
the average monthly remuneration of Bulgarian migrants has increased, however, along
with a tendency to save more abroad;
in 2011 the estimated savings of Bulgarian migrants are comparable in amount to the
sum of money transfered from abroad.
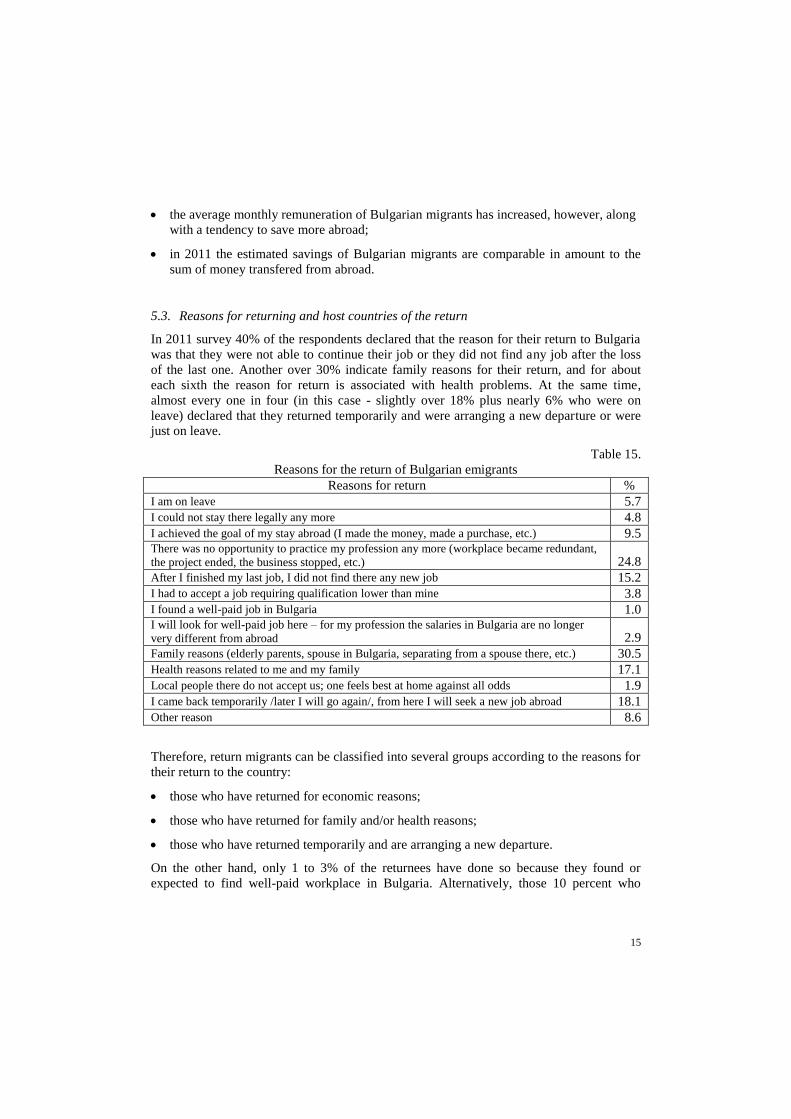
5.3. Reasons for returning and host countries of the return
In 2011 survey 40% of the respondents declared that the reason for their return to Bulgaria
was that they were not able to continue their job or they did not find any job after the loss
of the last one. Another over 30% indicate family reasons for their return, and for about
each sixth the reason for return is associated with health problems. At the same time,
almost every one in four (in this case - slightly over 18% plus nearly 6% who were on
leave) declared that they returned temporarily and were arranging a new departure or were
just on leave.
Table 15.
Reasons for the return of Bulgarian emigrants
Reasons for return %
I am on leave 5.7
I could not stay there legally any more 4.8
I achieved the goal of my stay abroad (I made the money, made a purchase, etc.) 9.5 There was no opportunity to practice my profession any more (workplace became redundant,
the project ended, the business stopped, etc.) 24.8
After I finished my last job, I did not find there any new job 15.2
I had to accept a job requiring qualification lower than mine 3.8
I found a well-paid job in Bulgaria 1.0 I will look for well-paid job here – for my profession the salaries in Bulgaria are no longer
very different from abroad 2.9
Family reasons (elderly parents, spouse in Bulgaria, separating from a spouse there, etc.) 30.5
Health reasons related to me and my family 17.1
Local people there do not accept us; one feels best at home against all odds 1.9
I came back temporarily /later I will go again/, from here I will seek a new job abroad 18.1
Other reason 8.6
Therefore, return migrants can be classified into several groups according to the reasons for
their return to the country:
those who have returned for economic reasons;
those who have returned for family and/or health reasons;
those who have returned temporarily and are arranging a new departure.
On the other hand, only 1 to 3% of the returnees have done so because they found or
expected to find well-paid workplace in Bulgaria. Alternatively, those 10 percent who
16
declared that they have returned because they achieved the goal of their stay aborad seem
quite optimistic.
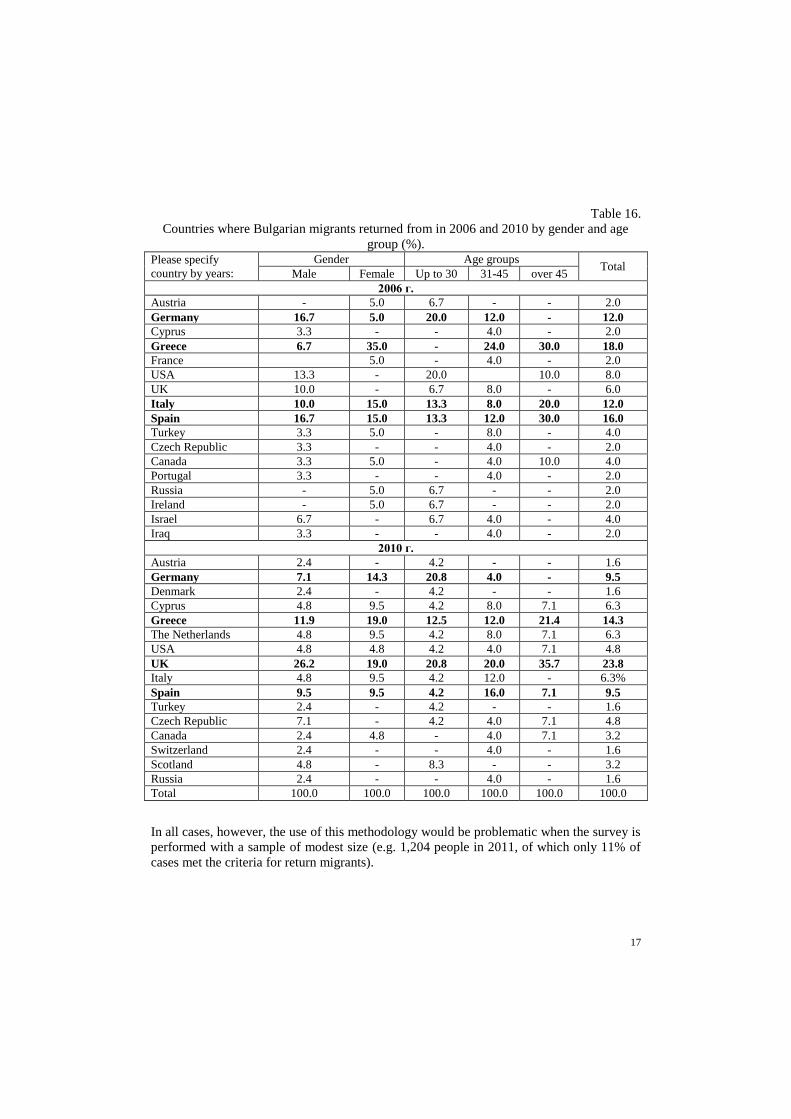
It is interesting to take a look on the information about where in particular the migrants
residing during the survey in Bulgaria have returned from. We will focus on data for two of
the years – 2006 and 2010 (see table 16).
In 2006, the “flow” of returnees was mainly from Greece (18%), Spain (16%), Germany
(12%) and Italy (12%) /i.e. almost half (48%) of the total returnees/. And in 2010 – from
the UK (23.8%), Greece (14.3%), Germany (9.5%) and Spain (9.5%) /i.e. 57% of the total
number of returnees in 2010/.
It is important to note that in both years more often women have returned from Greece. The
gender and age structure of returnees from Spain is balanced – in most cases, the
distributions by gender and age are similar. Relatively younger people return from
countries like the USA, UK and Germany – most likely due to the “educational” migration
from Bulgaria to these countries. The UK became more visible to Bulgarian migrants after
2007 – the survey data indicates that since 2008 most returnees have come back namely
from there.
Another question here is how to distinguish “return” from “circular” migrants; obviously a
significant part of the returnees are people who travel frequently in search of a better job
abroad, and did not take a decision to stay either in Bulgaria or abroad.
There are at least two options:
1) From within the returnees (i.e. people with migration experience) a fraction can be
delineated – those who have been abroad more than once for the period of last 5 years
can be considered as “circular” migrants6. Thus we could distinguish between return
and circular migrants at the survey completion date.
2) Or amongst returnees we can differentiate between those who would leave again (in the
near or distant future) and those remaining in the country. Thus we could distinguish
between “stayers” and “movers”; moreover, the latter could also be seen as potential
“circular” migrants.
6 Such approach is used in: Vadean, Fl. and M. Piracha, 2009, Circular Migration or Permanent
Return: What Determines Different Forms of Migrations?, IZA DP No. 4287, p.1.; The number of
travels is discussed also in Constant, A. and Kl. F. Zimmerman, 2007, Circular Migration: Counts of
Exits and Years Away from the Host Country, IZA DP No. 2999.
17
Table 16.
Countries where Bulgarian migrants returned from in 2006 and 2010 by gender and age
group (%).
Please specify
country by years:
Gender Age groups Total
Male Female Up to 30 31-45 over 45
2006 г.
Austria - 5.0 6.7 - - 2.0
Germany 16.7 5.0 20.0 12.0 - 12.0
Cyprus 3.3 - - 4.0 - 2.0
Greece 6.7 35.0 - 24.0 30.0 18.0
France 5.0 - 4.0 - 2.0
USA 13.3 - 20.0 10.0 8.0
UK 10.0 - 6.7 8.0 - 6.0
Italy 10.0 15.0 13.3 8.0 20.0 12.0
Spain 16.7 15.0 13.3 12.0 30.0 16.0
Turkey 3.3 5.0 - 8.0 - 4.0
Czech Republic 3.3 - - 4.0 - 2.0
Canada 3.3 5.0 - 4.0 10.0 4.0
Portugal 3.3 - - 4.0 - 2.0
Russia - 5.0 6.7 - - 2.0
Ireland - 5.0 6.7 - - 2.0
Israel 6.7 - 6.7 4.0 - 4.0
Iraq 3.3 - - 4.0 - 2.0
2010 г.
Austria 2.4 - 4.2 - - 1.6
Germany 7.1 14.3 20.8 4.0 - 9.5
Denmark 2.4 - 4.2 - - 1.6
Cyprus 4.8 9.5 4.2 8.0 7.1 6.3
Greece 11.9 19.0 12.5 12.0 21.4 14.3
The Netherlands 4.8 9.5 4.2 8.0 7.1 6.3
USA 4.8 4.8 4.2 4.0 7.1 4.8
UK 26.2 19.0 20.8 20.0 35.7 23.8
Italy 4.8 9.5 4.2 12.0 - 6.3%
Spain 9.5 9.5 4.2 16.0 7.1 9.5
Turkey 2.4 - 4.2 - - 1.6
Czech Republic 7.1 - 4.2 4.0 7.1 4.8
Canada 2.4 4.8 - 4.0 7.1 3.2
Switzerland 2.4 - - 4.0 - 1.6
Scotland 4.8 - 8.3 - - 3.2
Russia 2.4 - - 4.0 - 1.6
Total 100.0 100.0 100.0 100.0 100.0 100.0
In all cases, however, the use of this methodology would be problematic when the survey is
performed with a sample of modest size (e.g. 1,204 people in 2011, of which only 11% of
cases met the criteria for return migrants).
18
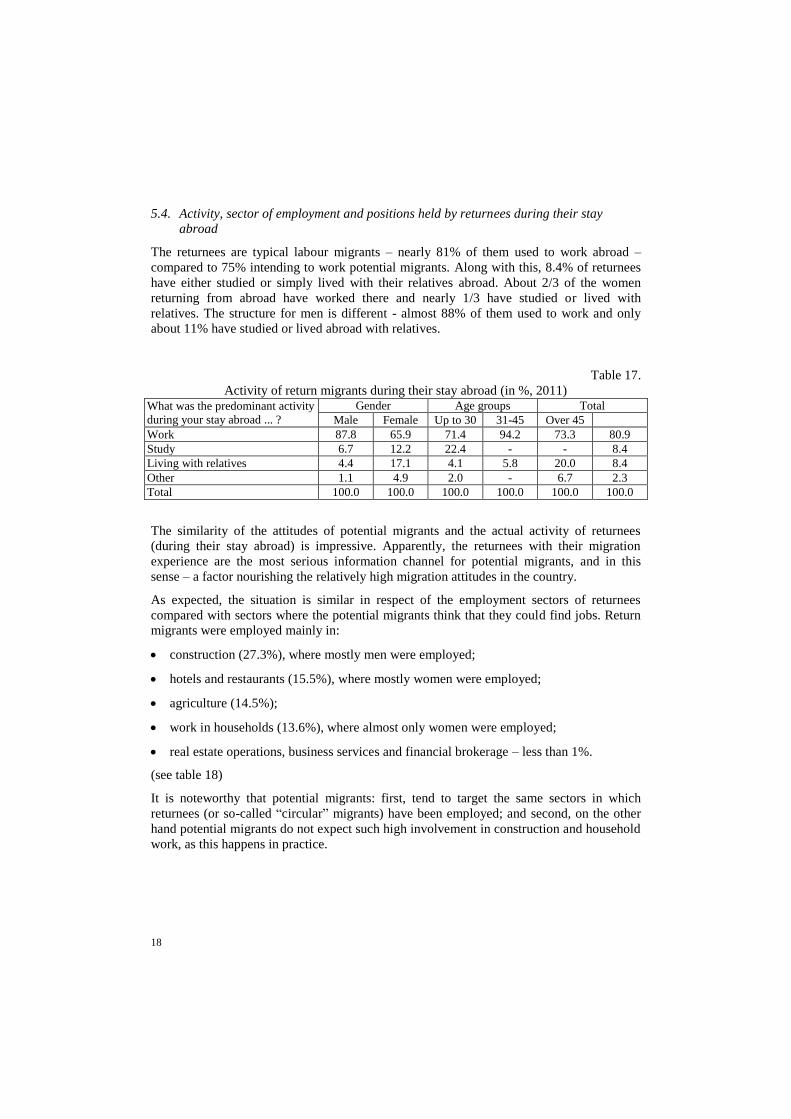
5.4. Activity, sector of employment and positions held by returnees during their stay
abroad
The returnees are typical labour migrants – nearly 81% of them used to work abroad –
compared to 75% intending to work potential migrants. Along with this, 8.4% of returnees
have either studied or simply lived with their relatives abroad. About 2/3 of the women
returning from abroad have worked there and nearly 1/3 have studied or lived with
relatives. The structure for men is different - almost 88% of them used to work and only
about 11% have studied or lived abroad with relatives.
Table 17.
Activity of return migrants during their stay abroad (in %, 2011)
What was the predominant activity
during your stay abroad ... ?
Gender Age groups Total
Male Female Up to 30 31-45 Over 45
Work 87.8 65.9 71.4 94.2 73.3 80.9
Study 6.7 12.2 22.4 - - 8.4
Living with relatives 4.4 17.1 4.1 5.8 20.0 8.4
Other 1.1 4.9 2.0 - 6.7 2.3
Total 100.0 100.0 100.0 100.0 100.0 100.0
The similarity of the attitudes of potential migrants and the actual activity of returnees
(during their stay abroad) is impressive. Apparently, the returnees with their migration
experience are the most serious information channel for potential migrants, and in this
sense – a factor nourishing the relatively high migration attitudes in the country.
As expected, the situation is similar in respect of the employment sectors of returnees
compared with sectors where the potential migrants think that they could find jobs. Return
migrants were employed mainly in:
construction (27.3%), where mostly men were employed;
hotels and restaurants (15.5%), where mostly women were employed;
agriculture (14.5%);
work in households (13.6%), where almost only women were employed;
real estate operations, business services and financial brokerage – less than 1%.
(see table 18)
It is noteworthy that potential migrants: first, tend to target the same sectors in which
returnees (or so-called “circular” migrants) have been employed; and second, on the other
hand potential migrants do not expect such high involvement in construction and household
work, as this happens in practice.

19
Table 18.
Employment sector of return migrants during their stay abroad (in %, 2011)
Economic activity according to the applied
classifiers (employment sector)
Gender Age groups Total
Male Female Up to
30 31-45 over 45
Agriculture, hunting and forestry 16.3 10.0 20.0 9.8 16.7 14.5
Manufacturing industry 12.5 6.7 5.7 13.7 12.5 10.9%
Production and distribution of electric and heat
energy 1.3 - 2.9 - - 0.9
Construction 37.5 - 25.7 25.5 33.3 27.3
Trade, repair and technical services of motor
vehicles 7.5 - 5.7 5.9 4.2 5.5
Hotels and restaurants 10.0 30.0 20.0 19.6 - 15.5
Transport, warehousing and communication 7.5 - 2.9 7.8 4.2 5.5
Real estate operations, renting and business
services 1.3 - 2.9 - - 0.9
Public administration and defense; compulsory
social security 1.3 - - 2.0 - 0.9
Healthcare and social work 3.3 - - 4.2 0.9
Other activities for social and personal services 3.8 3.3 5.7 3.9 - 3.6
Activities in households / families (helper,
caregiver, cook) 1.3 46.7 8.6 11.8 25.0 13.6
Total 100.0 100.0 100.0 100.0 100.0 100.0
Regarding the occupations held by returnees during their stay abroad – the respondents
indicate mainly low-skilled jobs (36.1% of the total, 43.6% of men) or employment in
services to the local population (29.6% of the total and over 76% of women; a relatively
even distribution is observed for the age groups). Among returnees, nearly 20% are highly
qualified workers (i.e. every fifth) and about one fourth of the men; again, in respect of the
staff employed in services to the population, the distribution by age groups is relatively
even. (Table 19)
Table 19.
Occupations held by returnees during their stay abroad (in %, 2011)
Positions according to the applied
classifiers
Gender Age groups Total
Male Female
Up to
30 31-45
over
45
Managerial employees 2.6 - 3.0 2.0 - 1.9
Applied specialists 2.6 - - 3.9 - 1.9
Staff engaged in services for the
population, security and trade 11.5 76.7 30.3 29.4 29.2 29.6
Producers in agriculture, forestry
and fisheries, hunting 2.6 3.3 3.0 2.0 4.2 2.8
Skilled industrial workers 24.4 3.3 15.2 21.6 16.7 18.5
Operators of plant and vehicles 12.8 - 6.1 11.8 8.3 9.3
Low skilled workers 43.6 16.7 42.4 29.4 41.7 36.1
Total 100.0 100.0 100.0 100.0 100.0 100.0
20
Potential migrants express interests in such positions as well – i.e. low- and high-skilled
jobs, employment in services to the population, etc. – however, with lower expectations for
jobs in both low- and high-skilled segment, as compared to the actual practice of returnees.
5.5. Self-organization of return migrants during their stay abroad.
With some of the questions aimed in outlining issues related to the “self-organization” of
our compatriots when resided abroad. We are interested in whom they approached when
they had difficulties; whether they were involved in activities of the Bulgarians abroad;
whether they were interested in what was happening in Bulgaria, and so on. This
information could be compared to the similar information about the Bulgarian community
in Spain (see for example, the article about the Bulgarian community in Spain in this issue).
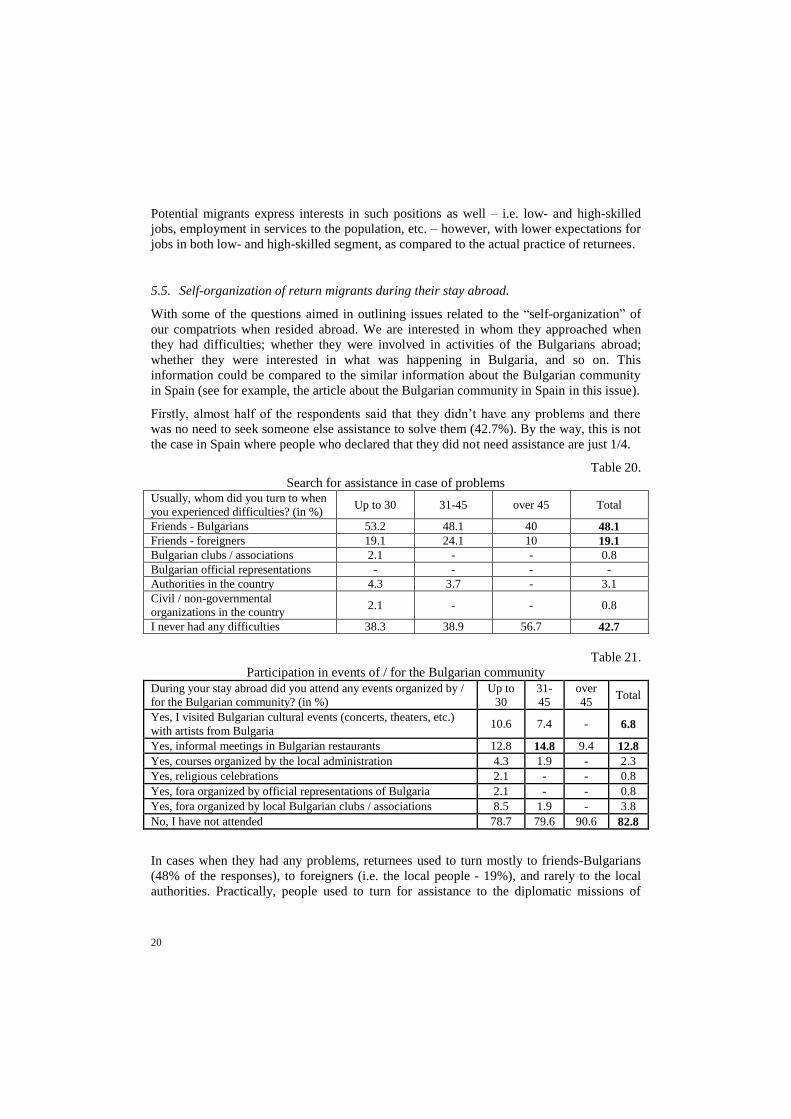
Firstly, almost half of the respondents said that they didn’t have any problems and there
was no need to seek someone else assistance to solve them (42.7%). By the way, this is not
the case in Spain where people who declared that they did not need assistance are just 1/4.
Table 20.
Search for assistance in case of problems Usually, whom did you turn to when
you experienced difficulties? (in %) Up to 30 31-45 over 45 Total
Friends - Bulgarians 53.2 48.1 40 48.1
Friends - foreigners 19.1 24.1 10 19.1
Bulgarian clubs / associations 2.1 - - 0.8
Bulgarian official representations - - - -
Authorities in the country 4.3 3.7 - 3.1
Civil / non-governmental
organizations in the country 2.1 - - 0.8
I never had any difficulties 38.3 38.9 56.7 42.7
Table 21.
Participation in events of / for the Bulgarian community
During your stay abroad did you attend any events organized by /
for the Bulgarian community? (in %)
Up to
30
31-
45
over
45 Total
Yes, I visited Bulgarian cultural events (concerts, theaters, etc.)
with artists from Bulgaria 10.6 7.4 - 6.8
Yes, informal meetings in Bulgarian restaurants 12.8 14.8 9.4 12.8
Yes, courses organized by the local administration 4.3 1.9 - 2.3
Yes, religious celebrations 2.1 - - 0.8
Yes, fora organized by official representations of Bulgaria 2.1 - - 0.8
Yes, fora organized by local Bulgarian clubs / associations 8.5 1.9 - 3.8
No, I have not attended 78.7 79.6 90.6 82.8
In cases when they had any problems, returnees used to turn mostly to friends-Bulgarians
(48% of the responses), to foreigners (i.e. the local people - 19%), and rarely to the local
authorities. Practically, people used to turn for assistance to the diplomatic missions of

21
Bulgaria as an exception – a similar behavior is observed regarding the Bulgarian migrants
in Spain. This data suggests that returnees (and to a greater extent – those who have settled
in Spain), along with their preferences for informal purely Bulgarian channels for solving
problems /where they occur/, used to be open to contacts with the local people.
On the other hand, return migrants participated relatively less in events of the community -
meetings, cultural and other events - compared to our compatriots established in Spain (see
Table 21). In more than 82% of the cases absence of any interest in such events has been
declared. However, about 20% of respondents were interested in informal meetings with
compatriots and in Bulgarian cultural events.
Table 22.
Interest in the events in Bulgaria (information channels)
Were you interested in the events in Bulgaria during your stay
abroad? (in %)
Up to
30 31-45
over
45 Total
Yes, from the Internet editions of the Bulgarian press 61.7 48.1 15.6 45
Yes, from Bulgarian electronic media - television, radio, etc. 34 59.6 56.3 49.6
Yes, from newspapers and magazines distributed by the
official Bulgarian representations 4.3 7.7 12.5 7.6
Yes, from newspapers and magazines distributed by
Bulgarian clubs and associations 4.3 7.7 6.3 6.1
Yes, from Bulgarian newspapers and magazines published
abroad 6.4 13.5 9.4 9.9
No, I was not interested 25.5 11.5 31.3 21.4
Table 23.
Voters in Bulgarian elections and in local elections in the host country by gender and age
(%)
Have you voted in the Bulgarian elections for
parliament or president during your stay abroad?
Gender Age groups
Total Male Female
Up to
30
31-
45
over
45
Yes 5.6 2.3 4.3 5.6 3.1 4.5
No 74.4 76.7 70.2 79.6 75.0 75.2
There were no elections for parliament or
president 20.0 20.9 25.5 14.8 21.9 20.3
Total 100.0 100.0 100.0 100.0 100.0 100.0
Have you voted for local authorities of the place
where you lived abroad / For example, for mayor
of a city in Spain/?
Gender Age groups
Total Male Female
Up to
30
31-
45
over
45
Yes 1.1 2.4 - 1.9 3.1 1.5
No 88.6 85.7 82.6 94.2 84.4 87.7
While I was abroad there were no elections for
local authorities 10.2 11.9 17.4 3.8 12.5 10.8
Total 100.0 100.0 100.0 100.0 100.0 100.0
During their stay abroad, return migrants used to follow closely what was happening in
Bulgaria – mainly from internet editions of the press and the electronic media. However,
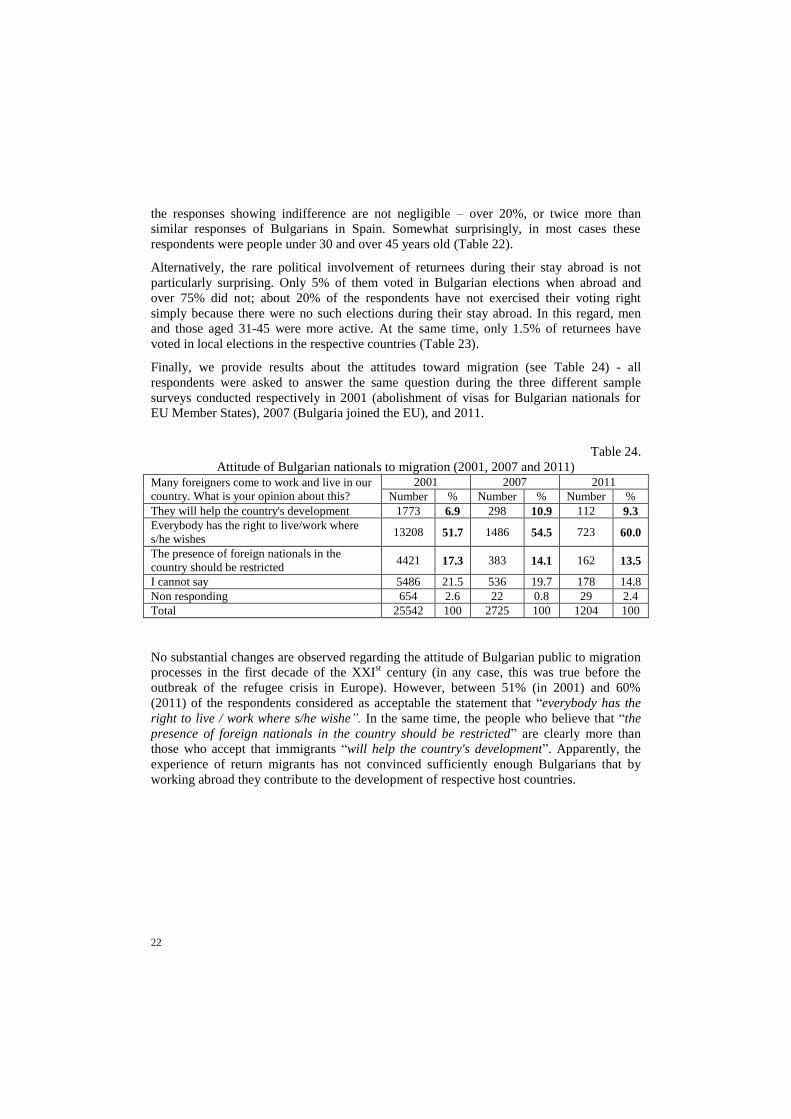
22
the responses showing indifference are not negligible – over 20%, or twice more than
similar responses of Bulgarians in Spain. Somewhat surprisingly, in most cases these
respondents were people under 30 and over 45 years old (Table 22).
Alternatively, the rare political involvement of returnees during their stay abroad is not
particularly surprising. Only 5% of them voted in Bulgarian elections when abroad and
over 75% did not; about 20% of the respondents have not exercised their voting right
simply because there were no such elections during their stay abroad. In this regard, men
and those aged 31-45 were more active. At the same time, only 1.5% of returnees have
voted in local elections in the respective countries (Table 23).
Finally, we provide results about the attitudes toward migration (see Table 24) - all
respondents were asked to answer the same question during the three different sample
surveys conducted respectively in 2001 (abolishment of visas for Bulgarian nationals for
EU Member States), 2007 (Bulgaria joined the EU), and 2011.
Table 24.
Attitude of Bulgarian nationals to migration (2001, 2007 and 2011)
Many foreigners come to work and live in our
country. What is your opinion about this?
2001 2007 2011
Number % Number % Number %
They will help the country's development 1773 6.9 298 10.9 112 9.3
Everybody has the right to live/work where
s/he wishes 13208 51.7 1486 54.5 723 60.0
The presence of foreign nationals in the
country should be restricted 4421 17.3 383 14.1 162 13.5
I cannot say 5486 21.5 536 19.7 178 14.8
Non responding 654 2.6 22 0.8 29 2.4
Total 25542 100 2725 100 1204 100
No substantial changes are observed regarding the attitude of Bulgarian public to migration
processes in the first decade of the XXIst century (in any case, this was true before the
outbreak of the refugee crisis in Europe). However, between 51% (in 2001) and 60%
(2011) of the respondents considered as acceptable the statement that “everybody has the
right to live / work where s/he wishe”. In the same time, the people who believe that “the
presence of foreign nationals in the country should be restricted” are clearly more than
those who accept that immigrants “will help the country's development”. Apparently, the
experience of return migrants has not convinced sufficiently enough Bulgarians that by
working abroad they contribute to the development of respective host countries.
23
References:
Constant, A. and Kl. F. Zimmerman, (2007). Circular Migration: Counts of Exits and Years
Away from the Host Country. IZA DP, N 2999.
Grigg, D. B. (1977). E. G. Ravenstein and the “laws of migration”. – Journal of Historical
Geography, Vol. 3(1), pp. 41-54.
Krasteva, A., Otova, I., and E. Staykova, (2010). Rediscovering ‘Gurbeti’? Transition from
settling down to circulation, from migration to mobility? (ЕММ).
http://annakrasteva.wordpress.com/2011/03/10/temporary-circular-migration/.
Mintchev, V., Kaltchev, I., Goev, V., and Boshnakov, V. (2004). External migration from
Bulgaria at the beginning of the XXI century: Estimates of potential emigrants’
attitudes and profile. – Economic Thought, N 7, pp. 137-161.
Mintchev, V., Boshnakov, V. (2007). Migration Survey. – In: Mihailov, D., Mintchev, V.
(eds.). Family Patterns and Migration: National Representative Survey. Chapter II.
Sofia: UNFPA, Ministry of Labour and Social Policy, and A.S.A.
Mintchev, V., Boshnakov, V., Richter, M., Ruspini, P. (2017). Determinants of Migration
and Types of Migration and Mobility. – In: Richter, M., et al. (eds.). Migration and
Transnationalism between Switzerland and Bulgaria. Springer International
Publishing Switzerland, pp. 25-60.
Rangelova, R., et al, (2006). Gender dimension of Bulgaria’s new migration: policy
implications. – Economic Studies, N 1, pp. 43-66.
Richter, M., Ruspini, P., Mihailov, D., Mintchev, V., and Nollert, M. (eds.), (2017).
Migration and Transnationalism between Switzerland and Bulgaria. Springer
International Publishing Switzerland.
Vadean, Fl., and M. Piracha, (2009). Circular Migration or Permanent Return: What
Determines Different Forms of Migrations? IZA DP, N 4287.
Зарева, И., (2012). Трудова реализация на българските емигранти. – В: Минчев, В.
(ред.). Българската емиграция: теории, политики, емпирични изследвания. Изд.
„Икопис”, С., c. 170-200. [Zareva, I. (2012). Labour realization of Blgarian
migrants. – In: Mintchev, V. (ed.). Bulgarian Emigration: Theories, Policies,
Empirical Studies. Sofia: Ikopis, pp. 170-200.].
Минчев, В. (ред.), (2012). Българската емиграция: теории, политики, емпирични
изследвания. Изд. „Икопис”, С. [Mintchev, V. (ed.), (2012). Bulgarian
Emigration: Theories, Policies, Empirical Studies. Sofia: Ikopis].
Христова-Балканска, И., и В. Минчев, (2012). Парични трансфери и доходи
(Емпирични свидетелства на примера на завърналите се емигранти и на
българите в Испания). – В: Минчев, В. (ред.). Българската емиграция: теории,
политики, емпирични изследвания. Изд. „Икопис”, С., c. 221-246. [Christova -
Balkanska, I., and V. Mintchev, (2012). Remittances and incomes: Empirical
evidences on the examples of return migrants and Bulgarians in Spain. – In:
Mintchev, V. (ed.), Bulgarian Emigration: Theories, Policies, Empirical Studies.
Sofia: Ikopis, pp. 221-246.].

24
Appendix
Table 25.
Distribution of the sample by gender and districts
District
Gender Total
Males Females Number %
Number % Number %
Sofia-city 102 17.3 108 17.6 210 17.4
Sofia - region 15 2.5 21 3.4 36 3.0
Shumen 15 2.5 15 2.4 30 2.5
Yambol 9 1.5 9 1.5 18 1.5
Kardzhali 15 2.5 15 2.4 30 2.5
Pleven 21 3.6 21 3.4 42 3.5
Vidin 8 1.4 10 1.6 18 1.5
Lovech 9 1.5 9 1.5 18 1.5
Pernik 8 1.4 10 1.6 18 1.5
Haskovo 22 3.7 21 3.4 43 3.6
Stara Zagora 27 4.6 27 4.4 54 4.5
Kyustendil 9 1.5 9 1.5 18 1.5
Smolyan 9 1.5 9 1.5 18 1.5
Vratsa 15 2.5 15 2.4 30 2.5
Montana 12 2.0 12 2.0 24 2.0
Gabrovo 12 2.0 12 2.0 24 2.0
Targovishte 11 1.9 13 2.1 24 2.0
Pazardzhik 24 4.1 24 3.9 48 4.0
Varna 35 5.9 37 6.0 72 6.0
Silistra 12 2.0 12 2.0 24 2.0
Veliko Tarnovo 20 3.4 22 3.6 42 3.5
Plovdiv 56 9.5 55 9.0 111 9.2
Burgas 35 5.9 37 6.0 72 6.0
Sliven 14 2.4 16 2.6 30 2.5
Blagoevgrad 26 4.4 28 4.6 54 4.5
Razgrad 13 2.2 11 1.8 24 2.0
Rousse 22 3.7 20 3.3 42 3.5
Dobrich 15 2.5 15 2.4 30 2.5
Total 591 100.0 613 100.0 1204 100.0

25
Table 26.
Distribution of the sample by gender and age
Age groups
Gender
Total Male Female
Number % Number % Number %
15-24 г. 116 19.6 111 18.1 227 18.9
25-34 г. 136 23.0 152 24.8 288 23.8
35-44 г. 131 22.2 153 25.0 284 23.6
45-54 г. 133 22.5 128 20.9 261 21.7
55-60 г. 75 12.7 69 11.2 144 12.0
Total 591 100.0 613 100.0 1204 100.0
Table 27.
Comparison of the distribution of respondents in the sample by gender and age with the
structure of the population according to the Census of 2011 (in %).
Age groups
Gender Total
Male Female Census Sample
Census Sample Census Sample
15-24 г. 19.5 19.6 19.1 18.1 19.3 18.9
25-34 г. 23.3 23.0 22.3 24.8 22.8 23.8
35-44 г. 23.9 22.2 23.3 25.0 23.6 23.6
45-54 г. 22.2 22.5 22.9 20.9 22.6 21.7
55-59 г. 11.1 12.7 12.4 11.2 11.7 12.0
Total 100.0 100.0 100.0 100.0 100.0 100.0
Source: NSI (http://censusresults.nsi.bg/Reports/2/2/R1.aspx)
Related Documents