E 5S rio,cid6 cop , 2 MALHEUR AGRICULTURAL EXPERIMENT STATION Potato, Onion, and Sugar Beet Research Special Report 816 February 1988 Agricultural Experiment Station Oregon State University Corvallis

Welcome message from author
This document is posted to help you gain knowledge. Please leave a comment to let me know what you think about it! Share it to your friends and learn new things together.
Transcript
E 5Srio,cid6cop , 2
MALHEUR AGRICULTURAL
EXPERIMENT STATION
Potato, Onion, andSugar Beet Research
Special Report 816 February 1988
Agricultural Experiment StationOregon State UniversityCorvallis
MALHEUR AGRICULTURAL EXPERIMENT STATION
Potato, Onion, and Sugar Beet Research
Special Report 816, February 1988
5 e
Agricultural Experiment Station
Oregon State University, Corvallis

CONTENTS
POTATOES Page
Potato Dark-End Research, 1986 1
The Effects of Time of Spring Tillage, Planting Date,and Irrigation on Tuber Yields, Quality, and Sugar-Endsin Russet Burbank Potatoes 14
Potato Variety Trials 21
Herbicide Trials in Russet Burbank Potatoes 27
An Evaluation of Postemergence Applications ofMetribuzin on Sugar-Ends in Russet Burbank Potatoes 31
The Effect of Growth-Regulating Agents on PotatoYields and Quality 34
Effects of Straw Mulch and Irrigation Rate on Soiland Runoff 38
ONIONS
Insecticide Trials for Onion Thrip Control inDry Bulb Onions 48
Onion Variety Testing Results 54
Artificial Drying of Onion Bulbs to ImproveStorage Quality 59
Onion Thrip Survey and Resistance 64
Onion Plant Density and Row Spacing to Obtainthe Highest Marketable Yield and Gross Return 68
Fall-Applied Herbicides for Weed Control in Bulb Onions 83
SUGAR BEETS
Sugar Beet Variety Testing Results 88
A Comparison of Formula 132B + Nutrient PelletedSugar Beet Seed to Raw Seed for Emergence andSugar Yields 93
An Evaluation of Postemergence-Applied Herbicidesfor Weed Control in Sugar Beets 97
Observations on the Effect of Straw Mulch on SugarBeet Stress and Productivity 103
Trailwater and Soil Persistence Study UsingSulfonylurea Herbicides 106

CONTRIBUTORS
MALHEUR COUNTY OFFICE, O.S.U. EXTENSION SERVICE PERSONNEL:
Jensen, Lynn
Assistant ProfessorSimko, Ben
Associate Professor
MALHEUR EXPERIMENT STATION:
Bradshaw, PamelaBurnett, Charles R.Eldridge, EricIshida, JoeyKee, Mary JoKolding, Mathias F.Shock, Clinton C.
Stanger, Charles E.Stieber, TimSwisher, Jerry
SecretaryResearch AssistantGraduate StudentBiological TechnicianSecretarySenior InstructorSuperintendent and AssociateProfessorProfessor of Crop ScienceResearch AssistantFarm Foreman
OREGON STATE UNIVERSITY, CORVALLIS, AND OTHER STATIONS;
Appleby, ArnoldBroich, SteveBurrill, LarryHane, DanHolmes, Zoe Ann
Kronstad, WarrenJames, Steven R.Maxwell, JerryMosley, Alvin R.
Stephen, WilliamVerhoeven, MaryVomocil, JamesWernz, James
Willnow, Jeff
UNIVERSITY OF IDAHO:
Pavek, Joe
Professor, Dept. of Crop ScienceResearch AssociateWeed Control SpecialistResearch Assistant (Hermiston)Professor, Dept. of Foods andNutritionProfessor, Dept. of Crop ScienceResearch Assistant (Redmond)Research Assistant (Klamath Falls)Associate Professor, Dept ofCrop ScienceProfessor, Dept. of EntomologyInstructor, Dept. of Crop ScienceProfessor, Dept of Soil ScienceResearch Associate and Managerof the Plant Analysis LaboratoryStudent
Research Geneticist
OTHER PERSONNEL COOPERATING ON SPECIAL PROJECTS;
Burnett, Denise
Burr, Jim
Lewis, Mike
Agriculture Research Technician,Ore-Ida Foods, Inc.,Ontario, OregonPrivate Crop Consultant,Ontario, OregonManager of Agriculture Services,Ore-Ida Foods, Inc.,Ontario, Oregon

McKinney, Mark
Zalewski, James D.
Gardner, Bronson
Futter, Herb
Perry, Bob
Hobson, JoePeterson, RobertTipton, DickOkuda, MinBeck, Richard
Vogt, Glenn
Manager of Raw ProductsOre-Ida Foods, Inc.,Ontario, OregonSenior Manager of AgriculturalResearch, Ore-Ida Foods, Inc.,Ontario, OregonProduct Technical ManagerStandard Oil Engineered MaterialsSolon, OhioDistrict ConservationistOntario, OregonSoil ConservationistOntario, OregonCooperating FarmerCooperating FarmerCooperating FarmerCooperating FarmerBeck Precision PlantersNyssa, OregonJ. R. Simplot Company
GROWERS ASSOCIATIONS SUPPORTING RESEARCH
Idaho-Eastern Oregon Onion CommitteeNyssa Nampa Beet Growers AssociationOregon Processed Vegetable CommissionMint Growers AssociationOregon Potato CommissionOregon Wheat CommissionNevada Seed Council

POTATO DARK-END RESEARCH, 1986
Clinton C. Shock, Lynn Jensen, Tim Stieber,Eric Eldredge, and Jim Zalewski
Malheur Experiment Station, Oregon State UniversityMalheur County Office, O.S.U. Extension Service
Agricultural Research Department, Ore-Ida Foods, Ontario
Introduction
The Treasure Valley has an agricultural resource-based eco-nomy. Economic development of this economy involves stimulatingthe production of high-value crops and of increasing the numberof industries that process agriculural raw materials. Industryconverts farm products into a higher value form, thus providingincome and employment. A good example of the type of crop wewould like to stimulate is the potato.
The potato has high productivity and can provide an adequatereturn per acre. The potato has been successfully industrializedin the Treasure Valley. We have numerous processing plants andthese processing plants produce a wide variety of products. Themajor industrialized product is frozen french fried potatoes. Inthe fall of 1985, the potato harvest presented processors with aproblem of crisis proportions. Potato quality was insufficientto satisfy consumer demand because of an the internal defectcalled sugar-ends or dark-ends.
What are sugar-ends? When a potato plant suffers moistureand temperature stress during the growth of the tuber a sugar-end can develop. A sugar-end potato from our region typicallyhas more sugars in the stem end than in rest of the potato.When the potato strips are fried at 375
o F. for 2 1/2 minutes,
the end with the greater sugars, the part of the potato stripnear the stem end of the potato, develops a dark color which isunacceptable for the fast food industry and other industrial foodservice consumers.
Potatoes as a raw material for industry must meet thequality specifications of sugar-ends. If quality specificationsare not met producers will lose potato acreage and cash income,industries will lose sales, and communities will lose jobs.
Approaches to Solve Sugar-Ends
The sugar-ends problem can be addressed with two basicapproaches. The first approach is to find cultural practiceswhich will minimize stress on the potato plant and thereby avoidthe development of sugar-ends. The second approach is to findpotato germplasm which will be able to tolerate the environmentalstress that would provoke sugar-ends in another more susceptiblevariety.
1
I. VARIETY DEVELOPMENT
No current variety is satisfactory in solving the sugar-endproblem. Varieties that have a high degree of susceptibility tosugar-ends are unacceptable. Varieties with low indices ofsugar-ends have some secondary negative attribute that eliminatesor severely limits their use as a cultivar to replace RussetBurbank. Growers and industry will not accept a potato cultivarthat has a high incidence of shatter bruise, hollow heart,black spot, sprouting in storage, low specific gravities, or lowyields.
Variety evaluation methods in Oregon have been acceleratedto increase the probabilities of success. Nearly 100,000 newprogeny from crosses can be examined each year. Early generationmaterials, including single hills and preliminary trials, are nowevaluated in their first year for tolerance to sugar-ends.Several germplasm selections show tolerance to sugar-ends andprovide hope that a variety that not only tolerates sugar-endsbut has acceptable performance in all other aspects will befound.
Variety development is a long-term solution. In addition tothe potato breeding program, the industry needs immediate solu-tions to the problem to bridge the time when these improvedvarieties become available.
II. CULTURAL PRACTICES
Many potato cultural practice experiments were conducted in1986 at and around the Malheur Experiment Station. Culturalpractice experiments included studies on the effect of delayingthe onset of irrigation, the comparison of furrow irrigation withsprinkler irrigation, and the effect of straw mulch onsprinkler- and furrow-irrigated potatoes. Other experimentsexamined the effects of the timing of stress on the developmentof sugar-ends, such as the particular periods during the yearwhen potatoes were prone to produce sugar-ends. Studies were con-ducted to study the temperature of the crop canopy to determineto what extent sugar-end potatoes can be predicted based on thetemperature of the canopy and calculated levels of moisturestress. Furthermore, irrigation treatments were evaluated to seehow they changed soil temperatures in the potato beds.
Procedures
Each experiment was conducted using normal cultural prac-tices used by growers. Potatoes were planted 10 inches aparton 36-inch beds.
Experimental treatments for all studies were replicated fourtimes. Each plot had its own gated pipe or sprinklers. Plotswere 105 to 120 feet long and two to four rows wide. Only the
2

potatoes out of the middle of each plot were harvested. Neutronprobe tubes were located in every plot. Soil water was monitoredtwice a week. Potatoes were irrigated when the neutron probecounts showed between 2.6 and 2.2 inches per foot of water.
Potato sugar-ends are often evaluated against a USDA colorchart. The person who is taking the center fry strips thenjudges the color at about a half-inch from the stem end of thepotato against the USDA color chart. The evaluation of potatofry color against the color chart is a rather subjective deci-sion. The stem end fry color of the potatoes in these experi-ments was determined using a photovolt reflectance meteravailable in the Ag Research labs of Ore-Ida. The photovoltreflectance meter was calibrated to take light reflectance obser-vations of each potato from every plot in the same way. Thedarker the french fry, the less light is reflected back into themeter. The lighter the french fry, the more light is reflectedback. The first method used to get exactly a half-inch from theend of the potato was to cut a slab lengthwise through the wholepotato. After frying, there is a change in color from the stemend to the bud or the growing point end of each potato, a grada-tion from the darkest end to the lightest end. A center stripcut through the potato may not catch the darkest part of thepotato. The second method was to cut a half-inch piece off thestem end of the potato, fry it, and measure the reflectance. Thetwo methods resulted in reflectance values which were practicallyidentical for any two samples of potatoes.
A. DELAYED START OF IRRIGATION
Delayed onset of irrigation might result in a plant that issmaller in stature and pre-conditioned to stress. This plantwould not be subject to wet soil conditions during early growth,and perhaps it would not be inoculated by disease organisms untila later date. An early stressed plant might senesce later andthereby grow actively later in the growing season. Reduced vinegrowth, reduced tuber set, and reduced yield were expected in themore extreme treatments. A larger proportion of number-onetubers and a lower percentage of number-two tubers were alsoanticipated with a delay in the onset of irrigation. We expectedto see that the tubers with the later onset of irrigation wouldhave higher specific gravities and possibly lighter dark-end frycolors.
In both 1985 and 1986, experiments were conducted wherethe onset of irrigation was delayed. Potatoes were irrigatedstarting eight or nine days after planting, at first emergence,at full emergence, a week after emergence, when the plants were6 to 8 inches tall, when the plants were 12 to 14 inches tall, orwhen the plants were near row closure. The later irrigationonset treatments were really quite extreme since the first irri-gation did not occur until about mid-June, in spite of the factthat potatoes started to set about June 7 both years.
3
With delayed irrigation, plant size was reduced in bothyears. Fewer tubers were set per plant and the total tuberweight by June 26 was lower for delayed irrigation in both years.In 1985, yield decreased if irrigation were delayed by more than22 days (Table 1). But, in 1986, there was no decline in yields,even if irrigation was delayed into June, in spite of a verysevere heat wave at the end of May and the beginning of June(Table 2).
Delayed irrigation was associated with a larger percent ofnumber-one potatoes and fewer number-two potatoes. This samephenomenon was observed in 1986 but the proportion of number-one potatoes was much higher in 1986 than in 1985. Temperaturestress was much greater in 1985 than in 1986.
No significant trend occurred in specific gravities with adelay in the onset of irrigation.
Sugar-ends were far less where furrow irrigation was de-layed. The greatest number of sugar-ends was found in the treat-ments that were irrigated earliest both years.
The increase in sugar-ends with early irrigation could beexplained by disease organisms infecting these plants and thatthey were more poorly able to translocate water. Althoughdifferences in infection may occur in certain fields, this phenom-enon did not occur in the areas that were under this experiment.The vines that were watered earlier did not die down early.Secondly, we could explain the results by the notion that theplants that were watered early had the greater plant top areaand, therefore, were more subject to moisture stress and respira-tion stress when the plant got into trouble. A third explanationfor more sugar-ends in early irrigated plots is that the waterinfiltration rate declines with each successive irrigation and itbecomes more difficult to get the soil wet in the early irrigatedplots. Plant canopy temperatures and stress indices were meas-ured. The data indicated that the plants were not responding somuch to whether or not they had been preconditioned to stress,but that the early irrigated plots actually had drier soil duringJune than the corresponding treatments where the onset of irriga-tion was begun later. In fact, more irrigations and more hoursof irrigation were necessary later in the season to keep the soilmoist in the early irrigated plots.
In June 1986, the soil in the plots which had been wateredthree or four times was not nearly as moist as the soil in theplots that had been watered just recently for the first time.The plant canopies were cooler where the potatoes had recentlybeen watered for the first time compared to the plant canopieswhere the soil had been watered three or four times. The plantcanopies of the early watered potatoes were about six degrees be-low environmental temperatures, compared to eight or ninedegrees below for potatoes recently watered for the first time.The plants in plots that had not yet been watered had canopy
4

temperatures approximately the same as the surrounding air,suggesting only minimal evaporative cooling.
Small differences in plant canopy temperature have an ex-tremely great importance for a potato. A potato has a photosyn-thetic maximum of about 70 to 80 degrees Fahrenheit. Above 85or 90 degrees, photosynthesis drops off very rapidly and respira-tion of the plant increases rapidly. So small differences intemperature at the upper end of the range can have dramaticconsequences for the plant's carbohydrate status.
A probable reason for higher canopy temperatures in theseearly irrigated plants was that the soil moisture was not as highas in the plots that had just recently been irrigated for thefirst time. Early irrigation leads to reduced rates of infiltra-tion, drier soil during June, and added moisture stress on theplants.
B. REDUCED WATER INFILTRATION RATES
Ring infiltrometers were mounted in the rows of the date-of-first-irrigation experiment to see what the effect of thepast history of irrigation would be on the infiltration rate.Ring infiltrometers were mounted in furrows which had receivedfour, three, or no irrigations. Double rings were maintainedwith water for a period of 24 hours. Where the furrows hadalready been irrigated three times, infiltration rates averaged0.05 inches per hour. Infiltration rates were 1.08 inches perhour with the first irrigation. Repeating this procedure for theequivalent of a fifth irrigation, we see that the infiltrationrate decreased yet further to 0.036 inches per hour.
Thio-sul added to the irrigation water at 10 gallons peracre did not improve infiltration. The infiltration ratedeclined to 0.033 inches per hour for the fifth irrigation,similar to the fifth irrigation withour Thio-Sul. It appearsthat one primary reason for sugar-end occurance with earlywatered potatoes on silt loam soils is that the infiltration rateof the soils is decreasing. The soil particle structure may becollapsing and crusting. The declining infiltration rates withsuccessive irrigations are consistent with observations. In1953, Tileston found that with each successive 24-hour furrowirrigation on a field of corn in Ontario, he observed lower andlower water intake rates.
In conclusion, early irrigation, "watering-up" the crop,should be avoided. Begin watering only when the potatoesabsolutely need irrigation. Furthermore, furrow irrigationshould only be made in every other row. The infiltration ratesare so much higher with the first irrigation in a furrow thatwatering every other row provides sufficient moisture. Subse-quent irrigations can stay in the same furrow until tubers areset. Delaying watering a row will make it easier to get the soilto a higher water status in the second half of June and later on
5

in the season when moisture stress to the potato plants must beminimized.
C. FURROW IRRIGATION VERSUS SPRINKLER IRRIGATION
In a set of two experiments, one conducted on the stationand one conducted off-station, sprinkler and furrow irrigationwere compared for their ability to reduce sugar-ends. Simultaneously the effect of straw mulch on both furrow- andsprinkler-irrigated potatoes was investigated at both locations.The potatoes were furrow-irrigated with no straw, furrow-irrigated with 800 pounds of straw per acre, sprinkler-irrigatedwith no straw, and sprinkler-irrigated with 800 pounds of strawper acre. The straw was applied loosely in the furrow after allplanting and herbicide incorporation practices were completed,but before first irrigation. At the station both sprinkler andfurrow irrigations were initiated using the same criteria, whenthe soil reached near 65 percent field capacity. The furrow-irrigated plots without straw needed both more frequent irriga-tion and more hours of irrigation. In spite of more frequentirrigations in the furrows with no straw, the soil moisture levelwas more difficult to maintain.
At the experiment station, the average moisture content ofthe soil was higher under sprinkler irrigation and higher underthe furrow irrigation with straw. The total amount of water de-livered was far greater in the furrow-irrigated plots than in thesprinkler-irrigated plots, but the exact amount was not measured.A large proportion of the furrow-irrigated water went off the endof the field through the tail ditch, whereas none of the waterfrom the sprinkler-irrigated plots left the field. Irrigationsystems and the use of straw were evaluated based on potatoyields, the percent of number-one tubers, the percent of number-two tubers, the specific gravities, and the sugar-end fry colorreflectance.
At the experiment station, on rather level ground, theaddition of straw to either furrow- or sprinkler-irrigated pota-toes did not increase total yields, but the percent of number-onetubers increased with straw under furrow irrigation while thepercentage of number twos decreased. The highest percentage ofnumber-one potatoes was produced under sprinkler irrigation irre-spective of whether straw was present.
Results were similar in the off-station plots with furrowirrigation, sprinkler irrigation, with or without straw, exceptthat sprinklers not only enhanced the percent of number-onetubers, but both the sprinklers and the straw enhanced totalyields over the furrow-irrigated check. The straw may have hadgreater benefits on the off-station plots because they were on agreater slope.
Potatoes from the sprinkler plots reflected a greater amountof light (the sugar-end fry color was lighter) and the colorscorresponded to potatoes that would average somewhere between
6

double-zero and one on the USDA chart. The furrow-irrigatedpotatoes at the station had darker fry colors irrespective ofwhether there was straw present. There were more undesirabledark-end french fries from the furrow-irrigated plots. On theoff-station experiments the use of straw in the furrow-irrigatedplots produced lighter sugar-end fry colors than the potatoesgrown without straw. There was a trend toward higher specificgravity potatoes under the sprinkler system compared with thefurrow irrigation.
Where economically feasible, a sprinkler system providesimmediate advantages, both in the percent of number-one tubersand in lighter sugar-end fry colors. The advantage of sprinklersystems has been demonstrated at only two locations based on oneyear's observation. Management practices with positive resultsshould be repeated for several years. The results are consistentwith observations by the industry that growers who change fromfurrow-irrigated to sprinkler-irrigated potato crops in the Trea-sure Valley obtain a higher-quality product.
Although the trials showed only marginal benefits of straw,the full benefits of straw may not have been realized in thesetrials. Perhaps if the irrigation frequency had been the samewith straw and without straw and of shorter irrigation durationin the strawed plots, potato quality would have been better.With the same frequency of irrigation of strawed and non-strawedfurrows both would have had the same number of cooling cycles.The strawed plots would have had less extreme variations of soilmoisture levels.
D. THE TIMING OF STRESS THAT PRODUCES SUGAR-ENDS
In previous research, workers have shown that sugar-endpotatoes can be produced by moisture stress in the latter part ofJune. From fragmented industry records it has been very diffi-cult to verify which years in the last two decades have producedthe greatest indices of sugar-ends, and to correlate thoseobservations with particular periods of moisture stress or hightemperatures within any given year. Two years that did produce agreat deal of sugar-ends in potatoes were 1971 and 1985. Theweather of 1985 had hot periods and high evapotransiration demandin late June, and July set a new heat record for monthly tempera-ture. Weather records reveal that 1971 and 1985 both had longperiods of elevated temperature. Certainly prolonged heat wouldallow the possibility of inadequate irrigation during any smallperiod of the summer to produce stress on the plants. It is ofgreat practical significance to the grower to know during whichperiods of the year moisture stress is likely to be most damagingto the potato crop.
The treatments were specific moisture stress periods inJune, early July, and early August. Plant water stress periodswere imposed by allowing the soil moisture level to fall below 65percent field capacity, to as low as 50 percent field capacity,during the interval in question. The plots that had a period of
7

stress for two to three weeks received fewer hours and numbers ofirrigations than the checks. The soil in the check plots wasmaintained at or above 65 percent field capacity throughout thewhole growing season. In a fifth treatment the soil was keptwetter than the check during the late June period. The plotsthat were maintained wetter during late June received considera-bly more water than the check plots.
Potatoes stressed in July 1986 produced low yields. TheAugust 1986 stress period was intermediate in reducing yields.The June stress period in 1986 produced a very small proportionof number-one potatoes and a very large proportion of number-twopotatoes. These potatoes were typically bottle necked or hadsome restrictions in them.
July and August moisture stress periods resulted in lowerspecific gravities than the check treatment. Potatoes stressedin June and August had higher incidence of sugar-ends as seen inlower sugar-end reflectance from these tubers. Perhaps the 1986data are not really representative because July weather wasrelatively cool. So, these potatoes may not have received thesame combination of moisture and temperature stress as the pota-toes that were stressed for moisture in June or August. Augustwas considerably hotter than the July stress period and moderate-ly hotter than the June stress period.
Soil temperatures were monitored at 8 inches in thebeds of all treatments. Soil temperatures were
2o F hotter in
stress treatments in June and August compared to the minimallystressed check treatment. There was no difference in soiltemperatures produced by July moisture stress in 1986.
The timed stress results from 1986 have important practicalconsequences. July stress reduced yield. We observed highersugar-ends in our June and August stress. There were lowerspecific gravities with July and August stress. The highestpercent of number twos was observed with June stress. It isquite clear from the results of 1986 that periods of stress,regardless of whether they are in late June, July, or August,will have negative consequences for the potato producer. As apractical matter this helps us keep in focus that all periods ofgrowth from mid-June through late August are exceedingly impor-tant for potato production, and that we cannot allow the potatoesto be stressed for moisture in any of these periods of time if wewant to maximize yield and quality.
E. PLANT CANOPY TEMPERATURES AND THE EXTENT OF STRESS
Potatoes were planted at increasing distance from a solid-set sprinkler system to provide a range of irrigation treatments.Potatoes grown between the sprinkler lines were irrigated whenthe soil neared 65 percent field capacity. These potatoes con-stituted the well-watered check treatment. Potatoes grown insoil along the sprinkler line had wetter soil than the check

treatments all season. Potatoes in plots outside the sprinklerlines were in successively drier soils.
Applied water, soil moisture content, and soil temperaturewere monitored. Potato plant canopy temperatures were measuredusing an infrared thermometer in a Scheduler (equipment trademarkof Standard Oil of Ohio). The Scheduler also calculates a cropcanopy temperature, the air temperature, and the air relativehumidity. Potatoes from all plots were harvested, graded, andsubjected to specific gravity and dark-end fry color determina-tions.
The seasonal average soil moisture was consistent with thevariation in the amount of applied inches of water during theseason. Potato yield was highest and market grade was best whenthe soil was maintained above 65 percent moisture. The potatograde differences were statistically significant with a muchhigher percentage of number-one tubers in the sprinkler plotsthat were held at the higher moisture levels.
The specific gravities were poorer in the plots that re-ceived a lower amount of moisture during the season. The stem-end french fry color was much lighter from tubers grown in thecheck plots than it was from tubers grown in the drier plots.Specific gravity decreased with decreasing average season-longsoil moisture content. When the season-long average soil mois-ture is compared with the fry color, the lightest sugar-end frycolor is associated with potatoes that have an average soilmoisture level about 75 percent field capacity and season-longminimum moisture content of 65 percent field capacity. The factthat potatoes grown in the driest plots had high incidence ofsugar-ends means that growers must make sure that sprinklersystems apply water adequately and uniformly. The soils thataverage a higher moisture rating than the check may have hadslightly darker sugar-end fry color.
We have seen in the date-of-first-irrigation experiment thatthe plant canopy temperature is a close mirror of the soil mois-ture status. Canopy measurements provide a useful tool sincethey are easy and rapid to measure. Soil moisture status ismore difficult. Could plant canopy temperatures be used toevaluate the water stress of the plant, and hence predict sugar-ends? Could we avoid sugar-ends by monitoring the plant canopytemperatures? On these same treatments which are a gradient ofmoisture stress, we periodically evaluated the plants for potatocanopy temperatures. By using the plant temperature, the airtemperature, and the relative humidity of the air it is possibleto calculate the amount of water stress that a plant is sufferingat a particular moment. The water stress is measured in unitscalled the "crop water stress index," CWSI. CWSI values rangefrom 0 to 1. A non-stressed plant has a CWSI close to zero and ahighly stressed plant that is not cooling itself at all withevaporative cooling has a CWSI reading of 1.
9

Stress readings were closely related to the amount of mois-ture in the soil in our 1986 plots. Across the gradient of soilmoisture status, potato canopy temperature differences wereobserved. Higher CWSI values were closely related to sugar-ends.The higher the stress index, the higher the sugar-ends. Theability to rapidly read crop canopy temperatures and estimateplant water stress may give us a tool to evaluate when a potatocrop needs to be watered to provide cooling, to increase itswater status, and maintain high-quality potatoes.
Over the sprinkler gradient of moisture the soil 8 inchesdeep in the beds at the highest soil moisture levels was 6°Fcooler than the same soil in the beds at the lowest soil moisturelevel. Soil temperatures in the potato beds are directly relatedto soil moisture status.
When irrigations are started, the water immediately startsto cool the environment. The data from August 11, 1986, indicatehow both furrow and sprinkler irrigations cool the soil surfaceand the air 8 inches above beds. The cooling effects of irriga-tion are presented in Figure 1.
Soil moisture, soil temperature, and air temperature appar-ently interact in sugar-end susceptible potato varieties likeRusset Burbank to produce sugar-end tubers.
Conclusion
From initial one- and two-year studies, applied culturalpractices have been identified which minimize sugar-end potatoproblems.
1. Delay the onset of furrow irrigation as long as feasible.2. Begin furrow irrigation in every other row, and water the
second row beginning at tuber set.3. Use cultural practices and rotations that enhance water
infiltration rates into the soil, such as plantingpotatoes after grain.
4. Use low rates of straw mulch to increase water infiltrationrates where furrow irrigation is used on sloping ground.
5. Install sprinkler irrigation systems where economicallyfeasible.
6. Make sure sprinkler coverage is uniform to avoid spotswith season-long moisture stress.
7. Maintain adequate soil moisture from tuber set throughthe end of August. A season-long minimum level is 65percent field capacity.
8. Assure that plants have sufficient soil moisture to main-tain cool tops through transpiration.
9. Soil moisture levels and canopy cooling require closergrower attention when air temperatures are elevated.
10

Acknowledgments
Research was supported financially by the Oregon PotatoCommission. Irrigation pipe was provided by B 2 M Irrigation ofWeiser. Sugar-end fry colors and specific gravities were deter-mined at the Agricultural Research Department of Ore-Ida. DeniseBurnett helped conduct the date-of-first-irrigation experiment in1985. Jerry Swisher completed many of the cultural operations.
11
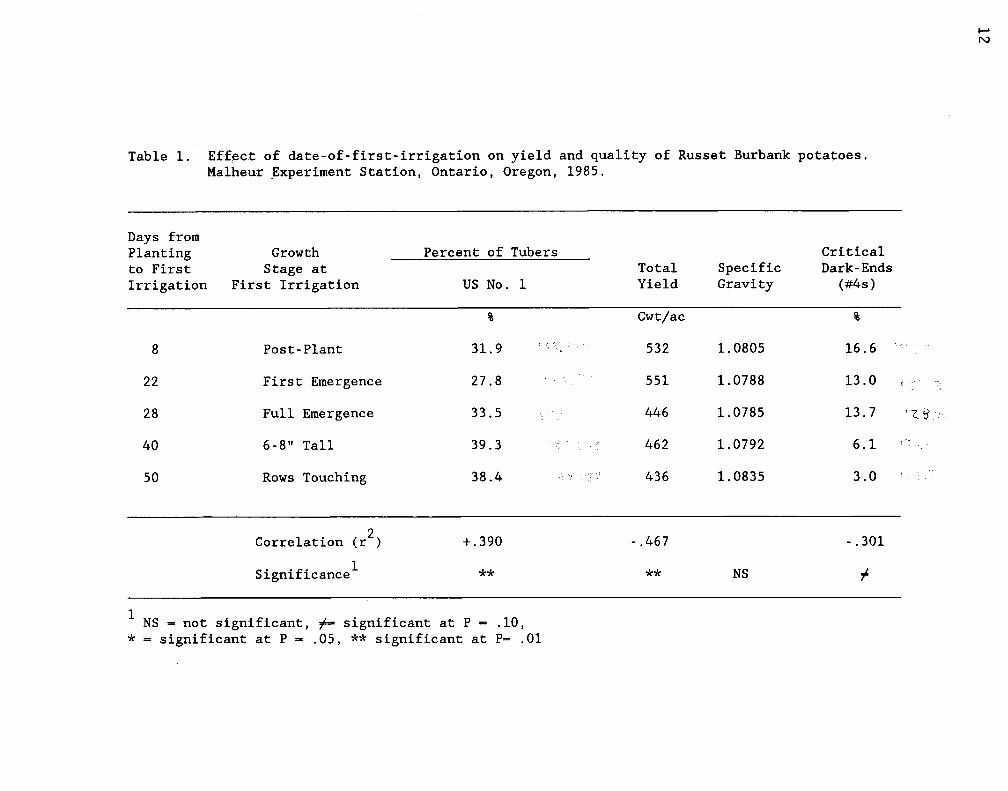
Table 1. Effect of date-of-first-irrigation on yield and quality of Russet Burbank potatoes.Malheur Experiment Station, Ontario, Oregon, 1985.
Days fromPlanting Growthto First Stage atIrrigation First Irrigation
Percent of Tubers CriticalTotal Specific Dark-EndsYield Gravity (#4s)US No. 1
8 Post-Plant
22 First Emergence
28 Full Emergence
40 6-8" Tall
50 Rows Touching
31.9
27.8
33.5
39.3
38.4
Cwt/ac
532 1.0805 16.6
551 1.0788 13.0
446 1.0785 13.7 1Z6
462 1.0792 6.1
436 1.0835 3.0
Correlation (r2
) +.390 -.467 -.301
Significance1** ** NS
1NS = not significant, significant at P - .10,
* - significant at P - .05, ** significant at P- .01
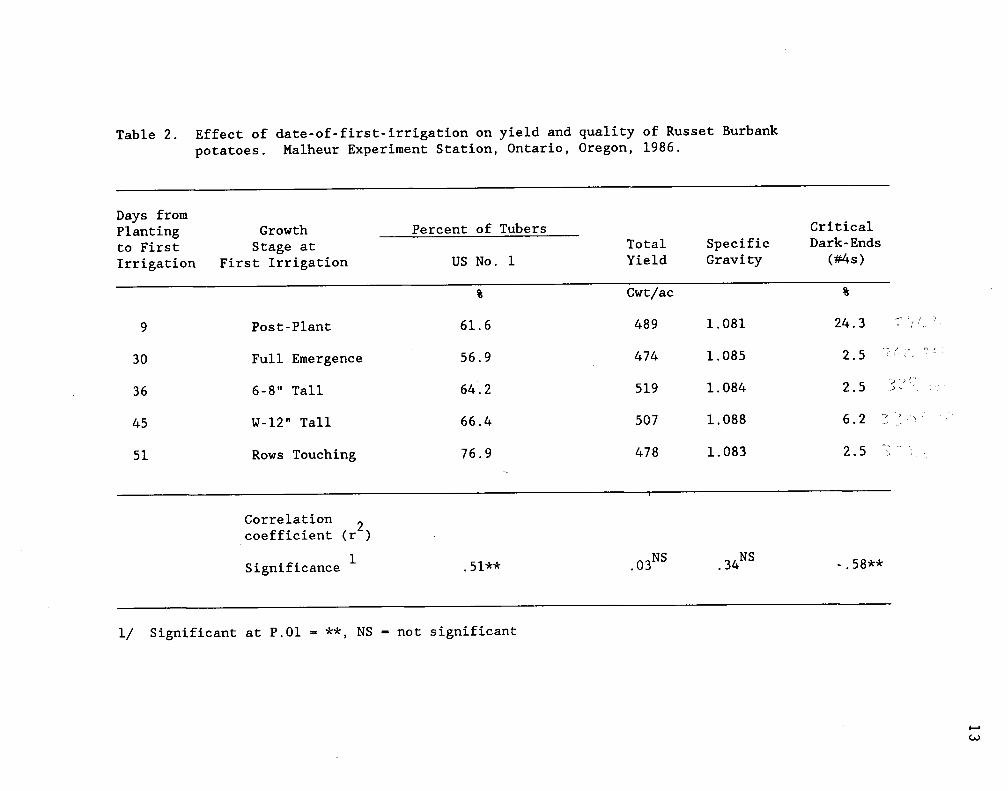
Table 2. Effect of date-of-first-irrigation on yield and quality of Russet Burbankpotatoes. Malheur Experiment Station, Ontario, Oregon, 1986.
Days fromPlanting Growthto First Stage atIrrigation First Irrigation
Percent of Tubers CriticalTotal Specific Dark-EndsYield Gravity (#4s)
Cwt/ac
US No. 1
9 Post-Plant
30 Full Emergence
36 6-8" Tall
45 W-12" Tall
51 Rows Touching
61.6 489 1.081 24.3
56.9 474 1.085 2.5
64.2 519 1.084 2.5
66.4 507 1.088 6.2
76.9 478 1.083 2.5
Correlationcoefficient (r
2)
Significance 1 .51**NS
.34NS
.03 -.58**
1/ Significant at P.01 - **, NS = not significant
THE EFFECTS OF TIME OF SPRING TILLAGE, PLANTING DATE, ANDIRRIGATION ON TUBER YIELDS, QUALITY, AND SUGAR-ENDS
IN RUSSET BURBANK POTATOES
Charles E. Stanger and Joey IshidaMalheur Experiment Station, Ontario, Oregon, 1986
Purpose
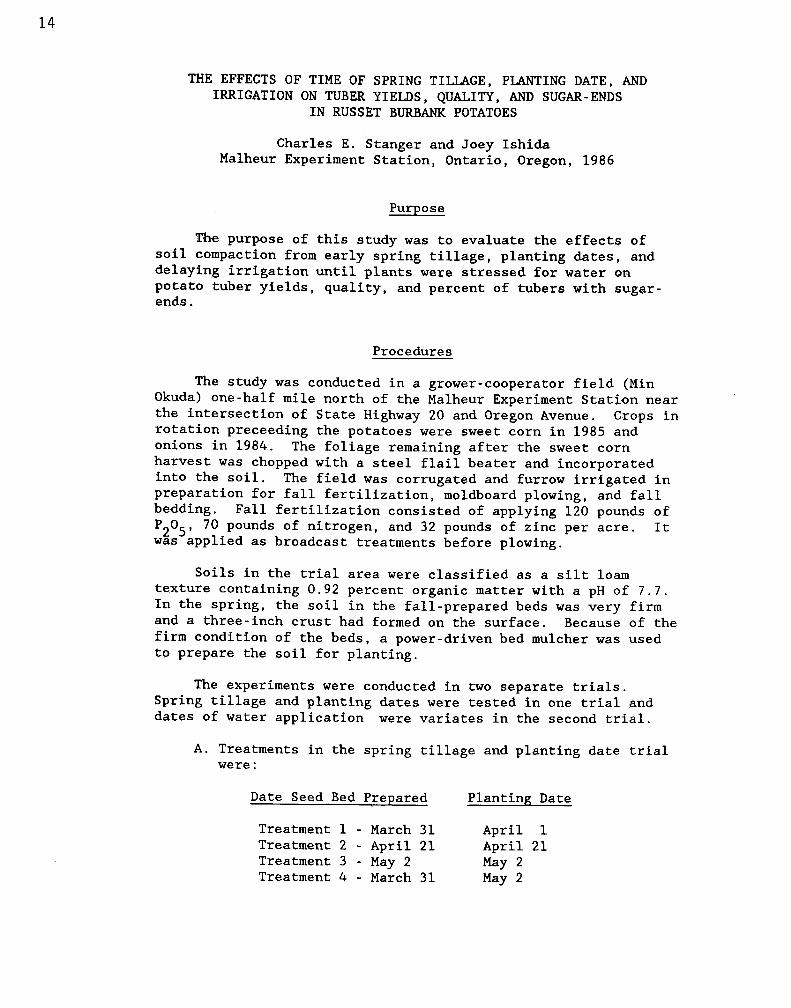
The purpose of this study was to evaluate the effects ofsoil compaction from early spring tillage, planting dates, anddelaying irrigation until plants were stressed for water onpotato tuber yields, quality, and percent of tubers with sugar-ends.
Procedures
The study was conducted in a grower-cooperator field (MinOkuda) one-half mile north of the Malheur Experiment Station nearthe intersection of State Highway 20 and Oregon Avenue. Crops inrotation preceeding the potatoes were sweet corn in 1985 andonions in 1984. The foliage remaining after the sweet cornharvest was chopped with a steel flail beater and incorporatedinto the soil. The field was corrugated and furrow irrigated inpreparation for fall fertilization, moldboard plowing, and fallbedding. Fall fertilization consisted of applying 120 pounds ofP05 , 70 pounds of nitrogen, and 32 pounds of zinc per acre. It2 5'was applied as broadcast treatments before plowing.
Soils in the trial area were classified as a silt loamtexture containing 0.92 percent organic matter with a pH of 7.7.In the spring, the soil in the fall-prepared beds was very firmand a three-inch crust had formed on the surface. Because of thefirm condition of the beds, a power-driven bed mulcher was usedto prepare the soil for planting.
The experiments were conducted in two separate trials.Spring tillage and planting dates were tested in one trial anddates of water application were variates in the second trial.
A. Treatments in the spring tillage and planting date trialwere:
Date Seed Bed Prepared Planting Date
Treatment 1 - March 31 April 1Treatment 2 - April 21 April 21Treatment 3 - May 2 May 2Treatment 4 - March 31 May 2
14

Equipment and procedures used in spring tillage to preparethe fall-bedded land for planting were:
a. rehilling fall-bedded land with hilling shovels toshape beds for herbicide application. Enough soilwas moved from the furrows to form a peak at thecenter of the furrow;
b. applying Prowl (1.5 lbs ai/ac) and Dual (2 lbs ai/ac)as double overlap broadcast treatments over rebeddedland;
c. mulching tops of beds with power-driven bed mulcherequipped with straight teeth, tilling the soil to adepth of 4 inches;
d. tilling beds with triple-k to aerate and mulch soilto an 8-inch depth;
e. planting Russet Burbank variety potatoes using aParma cup type planter (potato tubers were plantedat 9-inch spacings);
f. rehilling potatoes using hilling shovels mounted infront of and behind rolling teeth on a lillistoncultivator. Herbicide and soil from the furrow areawere thrown over the bed to form a high, well-shapedpotato hill. This operation was the final tillageoperation and the potatoes were layed-by.
B. Dates in the study evaluating time of applyingirrigations were:
1. May 13 - (72 percent available soil moisture atdepth of seed piece). Irrigated wheel row with12-hour irrigation. Potatoes in the trial area werefully emerged with 3 to 4 inches of foliage growth.
2. May 31 - (58 percent available soil moisture atdepth of seed piece). Irrigated wheel row with12-hour irrigations. Potato foliage was 12 to 16inches high. Foliage color was good, did not showsigns of water stress.
3. June 19 - (42 percent available soil moisture atdepth of seed piece). Irrigated wheel row with12-hour irrigations. On this date potato foliage wasshowing symptoms from severe moisture stress. Foliageacross rows was touching.
The field was irrigated uniformly after planting to assurepotato emergence from the dry soil. After the irrigations on May13, May 31, and June 19, potatoes were irrigated when availablesoil moisture in the potato hills fell to about 65 percent.
15
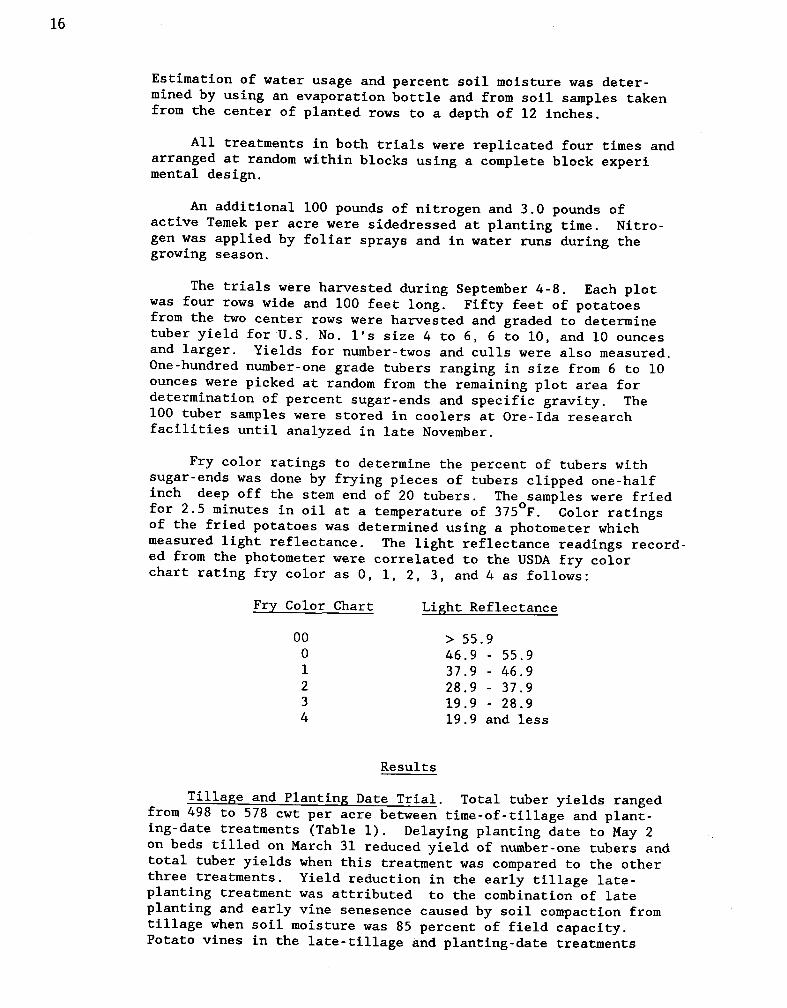
Estimation of water usage and percent soil moisture was deter-mined by using an evaporation bottle and from soil samples takenfrom the center of planted rows to a depth of 12 inches.
All treatments in both trials were replicated four times andarranged at random within blocks using a complete block experimental design.
An additional 100 pounds of nitrogen and 3.0 pounds ofactive Temek per acre were sidedressed at planting time. Nitro-gen was applied by foliar sprays and in water runs during thegrowing season.
The trials were harvested during September 4-8. Each plotwas four rows wide and 100 feet long. Fifty feet of potatoesfrom the two center rows were harvested and graded to determinetuber yield for U.S. No. l's size 4 to 6, 6 to 10, and 10 ouncesand larger. Yields for number-twos and culls were also measured.One-hundred number-one grade tubers ranging in size from 6 to 10ounces were picked at random from the remaining plot area fordetermination of percent sugar-ends and specific gravity. The100 tuber samples were stored in coolers at Ore-Ida researchfacilities until analyzed in late November.
Fry color ratings to determine the percent of tubers withsugar-ends was done by frying pieces of tubers clipped one-halfinch deep off the stem end of 20 tubers. The were friedfor 2.5 minutes in oil at a temperature of 375
o F. Color ratings
of the fried potatoes was determined using a photometer whichmeasured light reflectance. The light reflectance readings record-ed from the photometer were correlated to the USDA fry colorchart rating fry color as 0, 1, 2, 3, and 4 as follows:
Fry Color Chart Light Reflectance
00 > 55.90 46.9 - 55.91 37.9 - 46.92 28.9 - 37.93 19.9 - 28.94 19.9 and less
Results
Tillage and Planting Date Trial. Total tuber yields rangedfrom 498 to 578 cwt per acre between time-of-tillage and plant-ing-date treatments (Table 1). Delaying planting date to May 2on beds tilled on March 31 reduced yield of number-one tubers andtotal tuber yields when this treatment was compared to the otherthree treatments. Yield reduction in the early tillage late-planting treatment was attributed to the combination of lateplanting and early vine senesence caused by soil compaction fromtillage when soil moisture was 85 percent of field capacity.Potato vines in the late-tillage and planting-date treatments
16
remained green until harvested. Delaying harvest of these plotsmay have increased tuber yields above yields from the earlytillage (March 31) and planting-date (April 1) treatment. Soilconditions resulting in fewer clods at harvest were better fromOle late tillage (May 2) and planting-date plots. There werefewer number-two tubers but more culls (< four-ounce tubers) whentillage and planting dates were delayed. Differences in time oftillage and planting did not affect fry color or specific gravityreadings (Table 2). Fry colors were acceptable for all treat-ments with light reflectance reading averaging 47.3 and colorchart ratings falling in the 0 and 1 range. Specific gravitiesvaried insignificantly between treatments and averaged 1.0762.
The single most important factor affecting tuber yields andquality obtained in this trial was time of vine senescence orearly dying. Compacted soil restricting aeration and water move-ment initiates diseases which cause premature senescence of pota-to vines. Delaying tillage for seed-bed preparation until soil isdry enough to work properly without compaction will improveconditions for optimum potato growth. Delaying planting untilthese conditions prevail will increase tuber yield, tuber quali-ty, and improve harvest conditions.
Irrigations. Total tuber yields and tuber size were less inthe May 13 irrigation treatment. Delaying irrigation until May31 increased total tuber yield by 98 cwt per acre and increasedthe yield of number-one tubers by 87 cwt per acre. Delayingirrigation until June 19 increased tuber size and yield of 10-ounce number one tubers, but total tuber yields were equal to theMay 31 irrigation treatment and significantly better than the May13 irrigation. Light reflectance (fry color) and specificgravity readings were comparable for all irrigation treatments(Table 4). Results indicate that delaying application date ofirrigation will increase tuber yields and tuber size withoutaffecting fry color or specific gravity quality. Early applica-tions of water increased early vine growth, vine size, andenhanced earlier vine senescence. These three factors are alldetrimental in potato production.
17
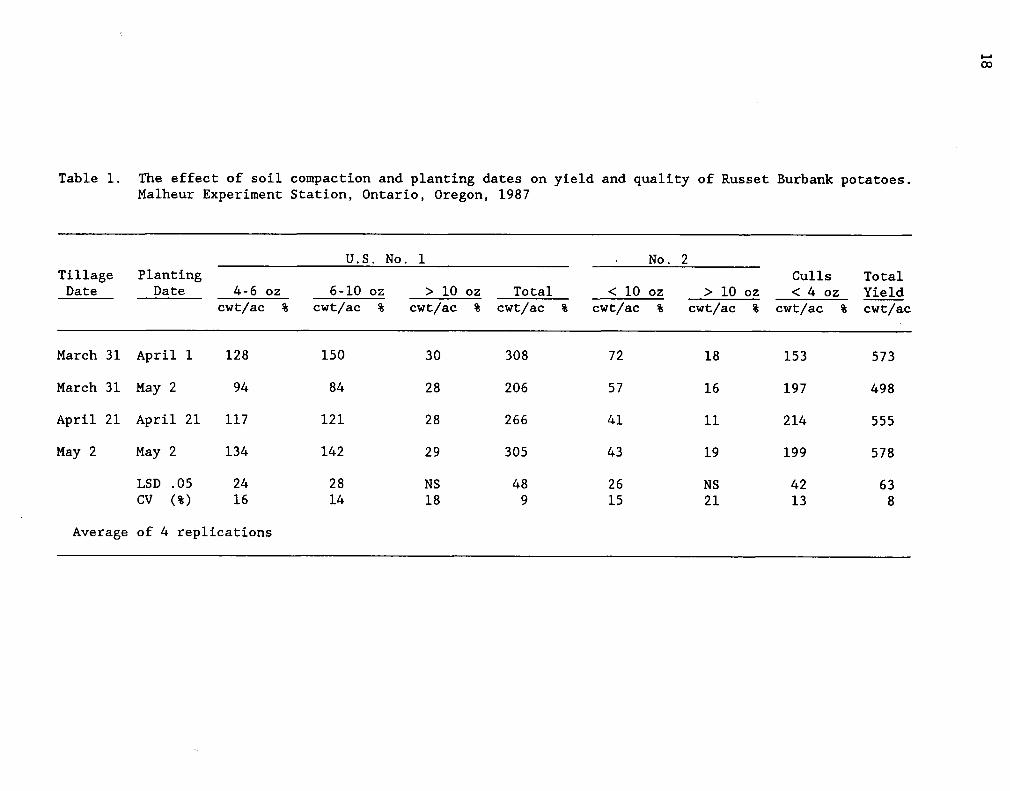
Table 1. The effect of soil compaction and planting dates on yield and quality of Russet Burbank potatoes.Malheur Experiment Station, Ontario, Oregon, 1987
TillageDate
PlantingDate
U.S. No. 1 No. 2Culls< 4 oz
TotalYield4-6 oz 6-10 oz > 10 oz Total < 10 oz > 10 oz
cwt/ac % cwt/ac % cwt/ac % cwt/ac % cwt/ac % cwt/ac % cwt/ac % cwt/ac
March 31 April 1 128 150 30 308 72 18 153 573
March 31 May 2 94 84 28 206 57 16 197 498
April 21 April 21 117 121 28 266 41 11 214 555
May 2 May 2 134 142 29 305 43 19 199 578
LSD .05 24 28 NS 48 26 NS 42 63CV (%) 16 14 18 9 15 21 13 8
Average of 4 replications

Table 2. The effect of soil compaction and planting date on fry quality, specific gravity, and fieldrot. Malheur Experiment Station, Ontario, Oregon, 1986
TillageDate
PlantingDate
LightReflectance
USDA FryColor Rating
SpecificGravity
SoilField Rot Moisture at Planting
Soil Temp.at Planting
% % Field Capacity uF
March 31 April 1 45.9 1 .0782 8 85 50
March 31 May 2 49.4 0 .0750 7 58 59
April 21 April 21 45.9 1 .0750 4 75 58
May 2 May 2 47.8 0 .0768 2 50 61
LSD .05 NS NS 3CV (%) 3 8 11
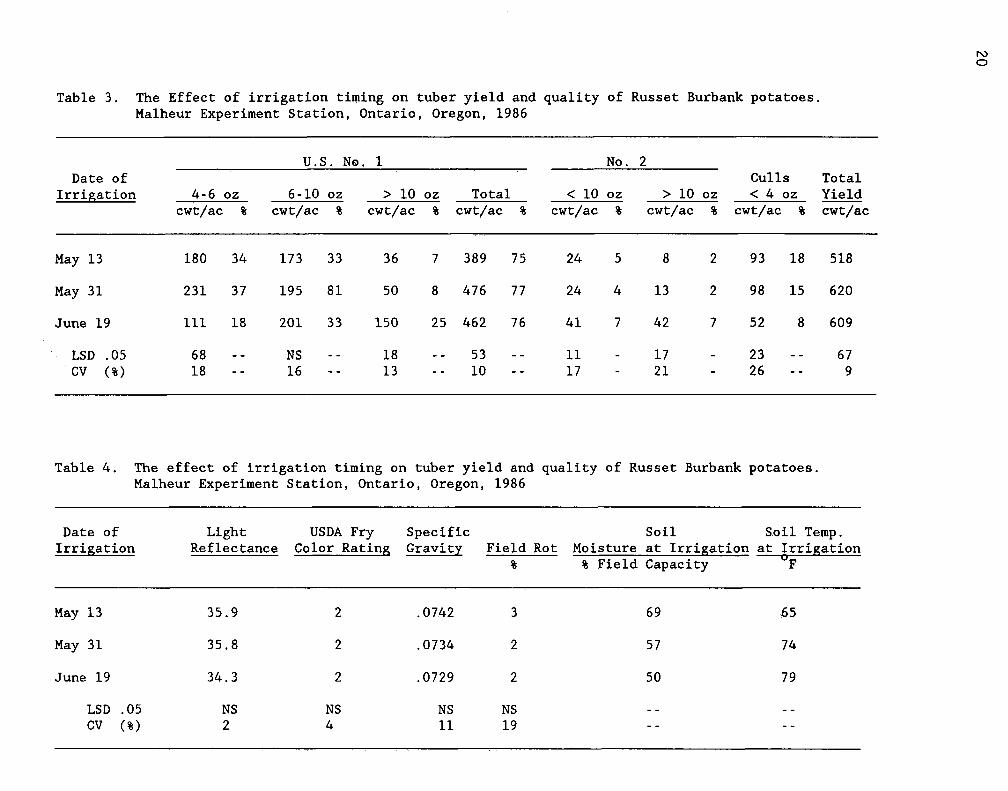
Table 3. The Effect of irrigation timing on tuber yield and quality of Russet Burbank potatoes.Malheur Experiment Station, Ontario, Oregon, 1986
U.S. No. 1 No. 2Date of Culls Total
Irrigation 4-6 oz 6-10 oz > 10 oz Total < 10 oz > 10 oz < 4 oz Yieldcwt/ac % cwt/ac % cwt/ac % cwt/ac % cwt/ac % cwt/ac % cwt/ac % cwt/ac
May 13 180 34 173 33 36 7 389 75 24 5 8 2 93 18 518
May 31 231 37 195 81 50 8 476 77 24 4 13 2 98 15 620
June 19 111 18 201 33 150 25 462 76 41 7 42 7 52 8 609
LSD .05 68 NS 18 53 -- 11 17 23 - 67CV (%) 18 16 13 10 -- 17 21 26 - 9
Table 4. The effect of irrigation timing on tuber yield and quality of Russet Burbank potatoes.Malheur Experiment Station, Ontario, Oregon, 1986
Date of Light USDA Fry Specific Soil Soil Temp.Irrigation Reflectance Color Rating Gravity Field Rot Moisture at Irrigation at Irrigation
% Field Capacity °F
May 13 35.9 2 .0742 3 69 65
May 31 35.8 2 .0734 2 57 74
June 19 34.3 2 .0729 2 50 79
LSD .05 NS NS NS NSCV (%) 2 4 11 19
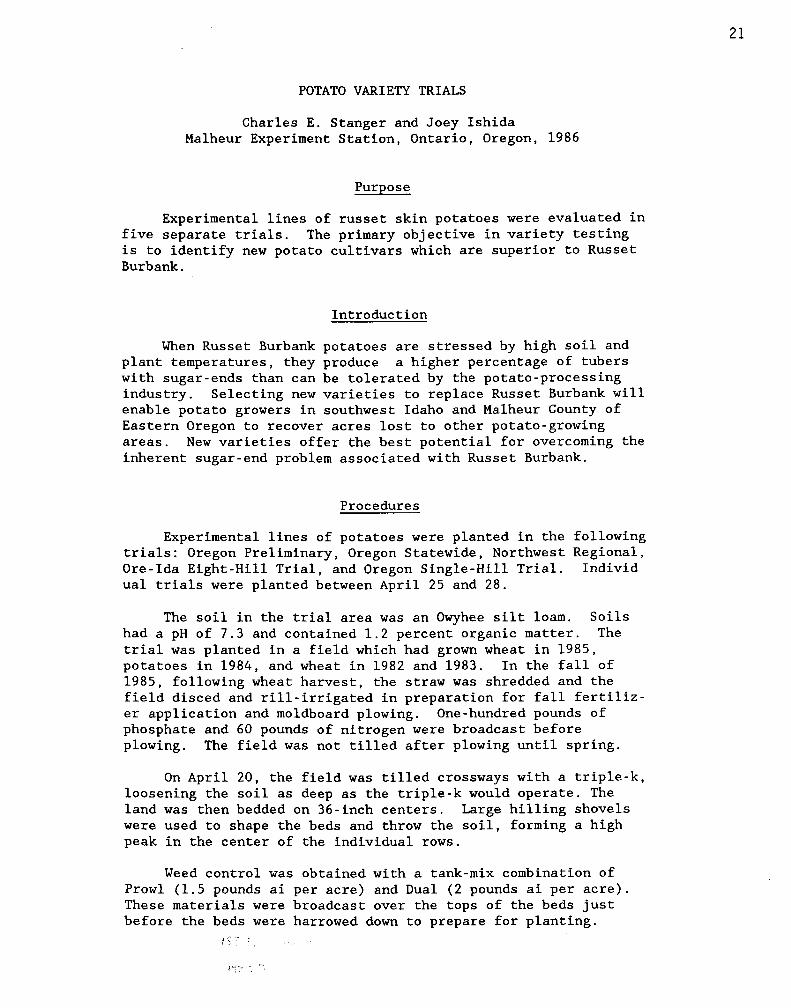
POTATO VARIETY TRIALS
Charles E. Stanger and Joey IshidaMalheur Experiment Station, Ontario, Oregon, 1986
Purpose
Experimental lines of russet skin potatoes were evaluated infive separate trials. The primary objective in variety testingis to identify new potato cultivars which are superior to RussetBurbank.
Introduction
When Russet Burbank potatoes are stressed by high soil andplant temperatures, they produce a higher percentage of tuberswith sugar-ends than can be tolerated by the potato-processingindustry. Selecting new varieties to replace Russet Burbank willenable potato growers in southwest Idaho and Malheur County ofEastern Oregon to recover acres lost to other potato-growingareas. New varieties offer the best potential for overcoming theinherent sugar-end problem associated with Russet Burbank.
Procedures
Experimental lines of potatoes were planted in the followingtrials: Oregon Preliminary, Oregon Statewide, Northwest Regional,Ore-Ida Eight-Hill Trial, and Oregon Single-Hill Trial. Individual trials were planted between April 25 and 28.
The soil in the trial area was an Owyhee silt loam. Soilshad a pH of 7.3 and contained 1.2 percent organic matter. Thetrial was planted in a field which had grown wheat in 1985,potatoes in 1984, and wheat in 1982 and 1983. In the fall of1985, following wheat harvest, the straw was shredded and thefield disced and rill-irrigated in preparation for fall fertiliz-er application and moldboard plowing. One-hundred pounds ofphosphate and 60 pounds of nitrogen were broadcast beforeplowing. The field was not tilled after plowing until spring.
On April 20, the field was tilled crossways with a triple-k,loosening the soil as deep as the triple-k would operate. Theland was then bedded on 36-inch centers. Large hilling shovelswere used to shape the beds and throw the soil, forming a highpeak in the center of the individual rows.
Weed control was obtained with a tank-mix combination ofProwl (1.5 pounds ai per acre) and Dual (2 pounds ai per acre).These materials were broadcast over the tops of the beds justbefore the beds were harrowed down to prepare for planting.
21

The size of plots and number of replications for each entryvaried between trials. Seventy-one entries were planted in theOregon Preliminary Trial. Individual plots were 12 hills longand each entry was replicated twice. The Oregon Statewide Trialhad 19 entries and the Northwest Regional Trial had 14 entries.In these trials each entry was 25 hills long with 4 replications.The Ore-Ida Eight-Hill Trial had 71 entries, 8 hills per entry.Seed piece spacing in all trials was 9 inches apart. Seedpieces of Red Norland potatoes separated each entry planted inthe variety trials.
The Oregon Single-Hill Trial had approximately 7,500 lines.Seed piece spacing in the single hill was 27 inches. Seed of RedNorland potatoes separated groups of related crosses in thesingle-hill trial.
After planting, the potatoes were sidedressed with 125pounds of nitrogen (NH
4)2SO
4) and 2.0 pounds active ingredient
per acre of Temik and layed-by using hilling shovels mounted on alilliston.
The potatoes were first irrigated in wheel rows on May 4 toadd adequate soil moisture for plant emergence. Subsequent irri-gations were not needed until after potatoes emerged. DuringJune, July, and early August when water demands were greatest,water was applied in every row, usually for 12 hours on four dayintervals.
The Oregon Single-Hill Trial was harvested on October 2.The remaining trials were harvested during the week of October 6.Data recorded for each entry included total tuber yield, tuberyield by size category for U.S. number ones (4-6oz, 6-10 oz, > 10oz), number twos, and culls. Ten large tubers from all entrieswere cut and evaluated for hollow heart and internal abnormali-ties, including black spot and internal necrosis. Fry color andspecific gravity values were determined for all entries from 8-pound samples of 6- to 10-ounce tubers. Fry color evaluationswere recorded by a Photometer from pieces of potatoes clippedone-half inch deep from the stem-end. The clippings were deepfried for 2.5 minutes at 375°F. Recorded data are the amount oflight reflected from the center of the cut surface of the clippedpiece of potato.
Results
Trial results are summarized in data tables 1 through 4.The experimental lines listed below will be evaluated again in1987. Lines selected for testing in 1987 were superior to RussetBurbank in fry color and at least equal to Russet Burbank intuber yield, yield of number-one tubers, and freedom from inter-nal defects.
22
Tubers from 154 single-hill plants were selected at harvest.These samples were stored in refrigeration at Ore-Ida Foods and

fried for sugar-end evaluations in November. Tubers from 63 ofthe 154 lines evaluated had fry quality superior to Russet Bur-bank. These are stored at Redmond and are being eye-indexed inpreparation for planting in 5-and 8-hill trials in 1987.
Oregon Statewide Oregon Preliminary
A74212-1 Lemhi A082254-24 A082611-7A081178-11 A81362-3 A082260-4 A082616-12A081178-12 A81727-9 A082260-7 A082616-18A081216-1 A081084-2 A082260-8 00082136-2A081394-7 A081509-1 A082281-1 00082063-300080152-1 A081512-1 A082283-1 ND01062-1C008177-2 A081522-1 A082283-5 ND01567-2ND534-4 A081783-7 A082283-9 ND02061-2
A082023-1 A082606-13
Regional Trial Oregon Single-Hill Entries
A76147-2 00084061-202 A084336-202 A084421-203A79141-3 A084439-212 ND02788-201 A084441-210AC79100-1 A084421-205 00084027-203 A084418-203C008014-1 A084428-203 A084408-204 00084042-202
ND02788-203 00084024-204 A084441-223A084439-210 ND02692-203 A084427-20500084056-201 A084180-201 A084428-20400084055-203 00084055-206 A084427-206ND02704-208 00084055-205 A084441-212A084408-211 A084408-210 00084055-201A084428-201 A084439-211 A084421-20100084026-202 00084055-204 A084427-207A084418-202 ND02692-204 A084439-205A084408-203 00084056-204 A084439-206A084408-205 00084056-202 A084441-208A084439-208 00084026-201 A084427-203A084408-202 00084042-203 A084439-202A084428-202 A084418-205 A084427-20100084030-201 CO084056-203 A084427-20200084061-204 00084074-202 A084427-204ND02692-202 A084431-201 A084418-206
Entries listed above from the single-hill trials will befurther evaluated in 5- or 8-hill plots in 1987 because of theirexcellent fry color and general appearance compared to RussetBurbank. The number of lines will be increased to about 15,000in 1987 to evaluate a large number of progeny when grown underlocal environmental and cultural conditions.
23
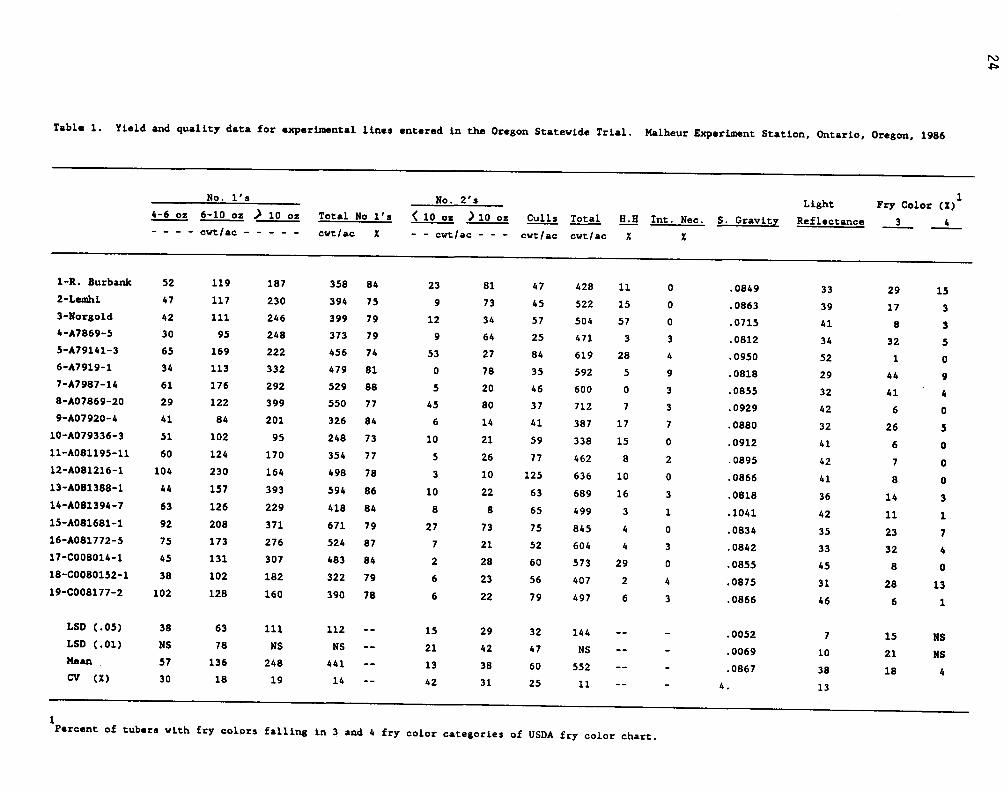
Table 1. Yield and quality data for experimental lines entered in the Oregon Statewide Trial. Malheur Experiment Station, Ontario, Oregon, 1986
No. l's No. 2's Light Fry Color (X)4-6 oz 6-10 oz ) 10 oz Total No l's < 10 oz ) 10 oz Culls Total H.H Int. Nec. S. Gravity Reflectance 3 4- - - - cwt/ac cwt/ac X - - cwt/ac - - - cwt/ac cwt/ac XX
1-R. Burbank 52 119 187 358 84 23 81 47 428 11 0 .0849 33 29 152-Lemhi 47 117 230 394 75 9 73 45 522 15 0 .0863 39 17 33-Norgold 42 111 246 399 79 12 34 57 504 57 0 .0715 41 8 34-A7869-5 30 95 248 373 79 9 64 25 471 3 3 .0812 34 32 55-A79141-3 65 169 222 456 74 53 27 84 619 28 4 .0950 52 1 06-A7919-1 34 113 332 479 81 0 78 35 592 5 9 .0818 29 44 97-A7987-14 61 176 292 529 88 5 20 46 600 0 3 .0855 32 41 48-A07869-20 29 122 399 550 77 45 80 37 712 7 3 .0929 42 6 09-A07920-4 41 84 201 326 84 6 14 41 387 17 7 .0880 32 26 5
10-A079336-3 51 102 95 248 73 10 21 59 338 15 0 .0912 41 6 011-A081195-11 60 124 170 354 77 5 26 77 462 8 2 .0895 42 7 012-A081216-1 104 230 164 498 78 3 10 125 636 10 0 .0866 41 8 013-A081388-1 44 157 393 594 86 10 22 63 689 16 3 .0818 36 14 314-A081394-7 63 126 229 418 84 8 8 65 499 3 1 .1041 42 11 115-A081681-1 92 208 371 671 79 27 73 75 845 4 0 .0834 35 23 716-A081772-5 75 173 276 524 87 7 21 52 604 4 3 .0842 33 32 417-0008014-1 45 131 307 483 84 2 28 60 573 29 0 .0855 45 8 018-00080152-1 38 102 182 322 79 6 23 56 407 2 4 .0875 31 28 1319-0008177-2 102 128 160 390 78 6 22 79 497 6 3 .0866 46 6 1
LSD (.05) 38 63 111 112 15 29 32 144 .0052 7 15 NSLSD (.01) NS 78 NS NS 21 42 47 NS .0069 10 21 NSMean 57 136 248 441 13 38 60 552 .0867 38 18 4CV (%) 30 18 19 14 42 31 25 11 4. 13
1
1Percent of tubers wLth fry colors falling in 3 and 4 fry color categories of USDA fry color chart.

Table 2. Yield and quality data for experimental lines entered in the Regional Potato Trial. Malheur Experiment Station, Ontario, Oregon, 1986
1
No. l's No. 2's Light Fry Color (X)
4-6 oz 6-10 oz 10 oz Total No l's 11121. ) 10 oz Culls Total H.H Int. Nec. S. Gravity Reflectance 3 4
- - - - cwt/ac cwt/ac X - - cwt/ac - - - cwt/ac cwt/ac X X
1-AD7267-3 18 86 196 300 76 7 30 56 393 5 0 1.0858 29 42 7
2-TC582-1 37 134 212 383 79 4 22 72 481 2 0 1.0994 36 10 0
3-AC79100-1 36 104 337 477 82 14 44 44 579 20 0 1.0902 36 14 2
4-AC76147-2 24 118 428 570 77 11 122 39 742 3 3 1.0879 45 7 0
5-A7411-2 31 119 235 385 73 19 79 45 528 2 2 1.0989 44 6 0
6-A74114-4 22 70 285 377 84 5 26 40 448 5 2 1.0902 34 21 7
7-A76260-16 28 133 355 516 83 12 49 38 615 7 3 1.0823 49 0 0
8-A79141-3 58 181 190 429 70 35 59 93 616 12 1 1.0995 59 0 0
9-0008014-1 25 108 347 480 81 18 63 29 590 3 2 1.0878 50 0 0
10-ND534-4 65 158 214 437 85 0 7 67 511 6 0 1.0792 36 12 2
11-Norgold 22 84 278 384 75 16 32 45 514 37 0 1.0738 38 10 5
12-Lemhi 24 89 260 373 76 9 63 47 492 10 5 1.0952 44 11 2
13-R. Burbank 114 178 124 416 70 27 48 102 593 1 0 1.0886 34 24 2
14-A74212-1 39 157 367 563 73 25 129 55 772 0 2 1.08513 30 37 4
LSD (.05) 25 38 91 100 NS 54 22 91 1.0048 4.7 15 NS
LSD (.01) 34 50 124 134 NS 72 29 122 1.0064 6.3 20 NS
Mean 39 123 264 436 14 55 56 562 1.0889 40.4 15 2
CV (X) 45 21 24 16 97 68 27 11 3.8 8.2 69 195
1.Percent of tubers with fry colors falling in 3 and 4 fry color categories of USDA fry color chart.

2 6
Table 3. Yield and quality data for experimental lines entered in the Oregon Preliminary variety trial.Malheur Experiment Static°, Ontario, °regal. 1966
LightReflectance
Fry Color (1)13 4,
36 22 035 23 336 13 029 59 929 54 333 33 037 17 036 13 547 7 035 30 036 10 041 5 042 3 0'28 55 1248 4 636 14 041 5 537 18 351 849 0 041 10 046 5 a
43 2543 0 952 3 544 5 053 3 647 9 041 5 344 9 341 14 646 0 052 0 048 3 046 0 040 8 335 20 649 8 040 13 1048 0 054 0 055 0 043 8 352 0 041 3 046 5 039 10 337 22 054 3 043 7 747 6 048 6 053 0 037 22 033 22 049 5 044 3 335 25 642 8 033 32 052 8 043 10 043 5 539 4 049 6 040 6 052 6 562 0 048 3 037 10 0
8 26 NS10 26 NS43 11 2
9 -- --
No. 1's Mo. 2's
4-6 oz 6-11 oz > 19 oz Total No 1's < 10 oz > 10 oz Culls Total H.H. Int. Nec.5. Gravity"cats-j- cwt/ac % - - cwt/ac - - - cwErgE cWic S
1-R. Burbank 126 117 49 292 65 35 16 108 451 0 52-Lamhi 93 152 114 399 55 75 115 64 565 9 63-Norgold 42 198 59 299 53 E7 72 151 559 54-851 66 69 59 194 36 181 174 97 646 0 05-852 22 137 372 531 80 51 49 31 662 22 16-A7923-16 36 117 419 572 72 33 142 48 795 0 67-A31320-2 31 65" 82 173 63 30 10 55 274 5 o
8-A81362-3 59 138 224 421 69 61 24 151 667 5 09-1.81727-9 74 152 101 327 70 35 33 74 469 0 0
15-1.07869-104 16 53 125 194 53 6 119 45 3611-A680209-131 94 124 140 358 70 46 5 100 509 0 6
12-A081018-4 67 63 31 161 55 33 5 99 29313-1.0816E4-2 73 170 141 384 72 29 38 85 536 5 614-16E1140-1 49 81 164 294 57 94 56 69 513 20 215-A081227-101 169 83 30 282 64 8 5 147 442 0 616-1.981238-101 80 157 195 432 65 28 122 79 661 5 017-681347-101 59 134 173 366 72 37 37 65 505 0 018-0081479-119 19 90 325 414 79 49 14 45 522 0 015-1.581559-1 11 32 42 33 27 50 43 125 311 0 0
1509-2 115 168 11 234 55 10 0 179 423 021-1.081512-1 37 140 235 382 83 21 7 48 458 0 023 4.081522-1 55 156 154 365 73 42 37 55 499 9 024-0981620-3 55 74 277 406 75 31 41 62 540 9 C.2.54.681783-4 49 103 189 332 72 19 45 64 460 Z C26-A581733-7 63 115 150 328 75 37 17 53 435 9 '027-1.081783-19 6 39 88 133 51 35 42 50 26028-1.381783-12 39 77 293 319 63 59 73 54 565 25 6
29-1.981794-1 163 102 85 290 47 177 17 129 613 3
3€-4°.81794- 67 296 159 432 66 124 25 78 659 65 9
31-1.081794-5 43 . 107 154 364 76 9 16 72 461 33 032-1.081794-7 52 85 163 31Z 65 67 26 69 462 a 033-A081794-8 56 103 59 212 49 99 49 81 432 9 C34-11081794-9 7• 162 76 328 54 157 67 52 654 535-A681794-11 86 153 75 311 69 40 15 83 449 0 036-1.081794-17 97 126 74 297 59 60 31 116 512 0 037.4h082023-1 131 169 105 405 63 68 7 163 643 038-A082024-4 80 196 193 469 60 55 33 142 694 0 1039-1.082260-4 53 154 158 365 71 43 36 71 515 5 040-A082260-5 28 103 227 353 75 63 49 42 512 0 541,1.382260-7 104 83 61 248 54 28 76 104 45642-1.082260-8 72 167 59 298 59 69 9 130 506 9
434082263- 46 49 37 132 39 119 16 73 34544-1.562263-107 50 143 154 347 69 52 28 78 505 24 045-A082283-1 49 134 262 445 60 86 153 60 744 0 646-1.582283-5 40 154 230 382 66 39 81 79 581 0 047,4682283-9 47 98 314 459 84 21 25 43 548 5 048-1.082540-2 41 112 207 360 76 26 45 49 471 15 0
49 606-13 65 156 59 280 56 71 33 120 534 0 1550-1.082611-7 69 155 220 444 68 53 97 59 650 5 551-8982616-4 47 M 107 239 57 14 92 74 419 952-1.582616-8 126 135 IC 274 64 20 15 113 425 0 a53-1.082616-12 Ile 125 37 205 62 73 o 192 455 0 954-1.082616-18 49 126 198 283 62 41 13 113 455 055-A082704-1 le 75 227 321 75 25 38 42 425 66 6556-1.982704-6 45 190 235 396 8.1 9 45 52 477 5 957-1.093188-3 84 61 18 163 59 33 25 158 329 15558-420060.005-1 34 157 149 346 83 16 22 33 411 25 959-00082105-2 22 114 148 284 77 23 24 40 371 C63-00082123-1161-4a0882613-4
3493
7997
4973
161263
4958
5840
187
89134
326452 0 5
62-CLOS2136-2 36 43 120 199 51 38 85 67 393 5 964-,M082063-3 44 113 184 341 85 18 6 35 403 0 665-CW82667-1 37 124 182 343 67 55' 9 105 512 16 a66-000E12068-167-00082982-3
3052
9451
20114
325117
4862
13610
.1722
3440
674189
27 33
68-4501062-1 44 48 152 244 51 120 69 47 48069-e501676-2 30 81 129 242 66 33 41 47 361 0 370-8001496-1 93 124 126 343 59 33 12 195 583 03 0371-1051567-2 112 185 53 359 79 10 Z 83 443 0 680-R. Burbank 112 192 112 416 66 94 19 133 632 7 0
Lap (.05) 32 84 78 98 - 65 73 45 121 -- --,' LSD (.51) 49 NS 91 129 -- 79 95 61 172 -- --
Mean 61 115 139 313 -- 52 44 el 49,... -- --
CV (5) 33 27 23 14 -- 52 63 29 9 -- --
1Percent of tubers with fry colors falling in 3 and 4 fry color categories of USDA fry color chart.
.0773
.0814
.5810
.0834
.Fii
.0845
.0797:::/7.0792
.0939
.0751
.0939
.3972
.0830
.0707
:69417..0920
:r71:.0833.0718.0829
::::.0822.0787.0808.0888.0764.0885.0820
.0812
.0852
.0859
.0870
.0812
.0845
.0915
.1001
.0912
.0737
.0878
.0904
.0855
.0951
.0956
.0922
.0848
.0E92
.0:71
.0903
.0796
.0850
.0806
.0849
.0781
.9719
:=7;.0947
.0841
.0120
..0133
.08416.
HERBICIDE TRIALS IN RUSSET BURBANK POTATOES
Charles E. Stanger and Joey IshidaMalheur Experiment Station, Ontario, Oregon, 1986
Purpose
Herbicides were applied as preplant incorporated, pre-emergence non-incorporated, and postemergence treatments toobtain efficacy data for weed control and tolerance in potatoesgrown using furrow irrigation.
Procedures
Russet Burbank potatoes were planted in Owyhee silt loamsoil with a pH of 7.3 and an organic matter content of 1.2percent. The land had previously grown wheat. Before the wheatstubble was plowed it was shredded, disced, irrigated, and fertil-ized. Fertilizer applied in the fall of 1985 consisted of 100pounds of phosphate and 60 pounds of nitrogen. After plowing,the field was left until spring without further tillage.
On April 10, 1986, the soil was tilled with a triple-k onceand the loose soil bedded in rows 36 inches apart. Large 12-inchhilling shovels were used to make high well-hilled beds. Peakedbeds with deep furrows are essential to successful use of herbi-cides applied to bedded land for weed control. The preplantherbicide treatments were applied as double overlap broadcastapplications over the bedded land and the beds were harrowed toincorporate herbicides and prepare land for planting.
The potatoes were planted on May 12. The planted rows wererehilled using hilling shovels mounted in front and behind therolling teeth of a lilliston cultivator. Soil and herbicidesfrom the furrows were thrown over the tops of the planted potatorows and mulched by the tilling action of the rolling teeth ofthe lilliston. The potatoes were layed-by and the pre-emergencenon-incorporated herbicide treatments were broadcast over the topof the hilled rows.
On May 14, the potatoes were furrow irrigated for moistureto sprout and emerge potatoes and to germinate weed seed andactivate the preplant and pre-emergence herbicide treatments.
The preplant and pre-emergence herbicides were applied usinga single-wheel bicycle plot sprayer. The spray pattern wasdouble overlap. The spray boom was nine feet long. Spray noz-zles were teejet fan nozzles size 8002 spaced at 10-inch inter-vals along the boom. Spray pressure was 35 psi and water as thecarrier was applied at a volume of 28 gallons per acre.
The postemergence treatments were applied on June 4. Thepotato foliage was about eight inches tall. The herbicides wereapplied using a CO backback sprayer. The boom was six feet widecovering the width oftwo potato rows. The spray nozzles were
27

teejet fan size 8002. Spray pressure was 35 psi. Water as thecarrier was applied at a volume of 32 gallons per acre. The weedspecies emerged at time of spraying were barnyardgrass, pigweed,and lambsquarters. The broadleaf weeds were less than threeinches tall when herbicides were applied. The largest barnyard-grass had four leaves and one tiller.
Individual plots were two rows wide and 30 feet long. Athree-foot wide non-planted area was a buffer separating adjacentplots. Each treatment was replicated four times and was placedat random using a complete block experimental design.
The treatments were evaluated for weed control and croptolerance on June 20 and September 17. The potato vines werebeat off on September 19 and the tubers harvested on September20. The harvested tubers were graded to obtain tuber yields andyields of number ones, number twos, and culls. Samples of 20tubers were taken from each plot and analyzed for specific gravi-ty and fry color. Fry color is reported as light reflectancefrom readings taken with a Photometer. A clipped section one-half inch deep was taken from the stem-end of the tuber and deepfried for 2.5 minutes at 325°F to determine fry quality andpercent of tubers with sugar-ends.
Results
The better herbicide treatments were Genep/Cobra + Sencor(ppi + pe), Cinch (ppi), and the postemergence treatments ofSencor + Fusilade (Table 1). These herbicides gave nearly com-plete control of barnyardgrass, pigweed, and lambsquarters.Tillage was necessary to adequately incorporate herbicides forsoil activity under furrow irrigation. Sencor applied pre-emergence in sequence with the preplant application of Genep +Cobra enhanced the activity of Genep + Cobra even though Sencorwas a pre-emergence soil surface treatment. Fusilade was neededfor barnyardgrass control in Sencor + Fusilade tank-mix combina-tions.
The potatoes were tolerant to all herbicide treatments(Table 2). Tuber yields and tuber quality for treated plots wereequal to those in the hand-weeded control plots. Weed competi-tion in the non-weeded control plots reduced tuber yields but didnot affect fry color ratings or specific gravity values. Weedscompeting with the crop in the non-weeded control caused signifi-cant yield reductions in 10-ounce number ones and increased cullyield. Cull yield was increased because of the number of smalltubers (< 4 ounces). Total yield of tubers from certain herbi-cide treatments was not great enough to be significantly higherthan tuber yields in the non-weeded control. This effecthowever, was a result of the number of culls in the non-weededcontrol. If the cull yields had been dropped in calculatingtotal yield, yield differences would be significantly higher forall herbicide treatments when compared to yield in non-weededcontrol.
28

Table 1. The percent weed control and tolerance of potatoes to the herbicides applied as preplant,pre-emergence, and postemergence treatments to Russet Burbank potatoes. Malheur ExperimentStation, Ontario, Oregon, 1986
HerbicideRate
lbs ai/ac AppliedCrop
Injury- - - - Percent Weed Control Barnyardgrass Pigweed Lambsquarters
6/20 9/17 6/20 9/17 6/20 9/17 6/20 9/17
Genep/Cobra 3 + 0.3 ppi/pe 0 0 95 88 96 90 94 90Genep/Cobra 3 + 0.6 ppi/pe 0 0 95 90 98 92 95 91Cobra/Fusilade 0.3 + 0.25 pre/post 0 0 98 92 99 96 96 91Dual/Cobra 3 + 0.3 pe 0 0 82 78 92 83 76 65Cinch/Cobra 0.4 + 0.3 pe 0 0 98 96 98 98 92 90Genep/Cobra + Sencor 3 + 0.5 + 0.25 ppi/pe 0 0 98 98 100 100 99 99Cinch 0.8 ppi 0 0 99 98 97 95 96 94Cinch 1.2 ppi 0 0 99 99 98 95 99 98Cinch 0.8 pe 0 0 74 83 68 80 65 78Cinch 1.2 pe 0 0 78 88 78 81 68 83Fusilade + Sencor 0.125 + 0.5 post 0 0 100 100 100 100 100 100Fusilade + Sencor 0.188 + 0.5 post 0 0 100 100 100 100 100 100Sencor 0.5 post 0 0 85 82 100 100 100 100Handweed Check ---- 0 0 100 80 100 92 100 95Weedy Check 0 0 0 0 0 0 0 0
Evaluated June 20 and July 17.
Ratings: 0 = no effect, 100 = all plants killed.

Table 2. Tuber yields and tuber quality from Russet Burbank potatoes treated with herbicides applied as preplant, pre-emergenceand postemergence treatments. Malheur Experiment Station, Ontario, Oregon, 1986
Herbicides lbs ai/ac Applied 4-6 ozcwt/ac cwt/ac cwt/ac cwt/ac cwt/ac cwt/ac cwt/ac
Genep/Cobra 3 + 0.3 ppi/pe 55 137 166 358 70 50 478 35.6 0.0831Genep/Cobra 3 + 0.6 ppi/pe 41 143 169 353 82 50 485 33.4 0.0811Cobra/Fusilade 0.3 + 0.25 pe/post 58 157 174 389 77 53 519 36.3 0.0836Dual/Cobra 3 + 0.3 pe 65 147 179 391 72 60 523 39.4 0.0840Cinch/Cobra 0.4 + 0.3 pe 48 137 172 357 77 60 494 31.3 0.0831Genep/Cobra + Sencor 3 + 0.5 + 0.25 ppi/pe 70 146 186 402 79 55 536 35.1 0.0829
Cinch 0.8 ppi 58 137 178 373 79 53 505 37.6 0.0837
Cinch 1.2 ppi 60 140 186 386 77 60 523 38.7 0.0836Cinch 0.8 pe 53 145 164 362 65 60 487 33.1 0.0836Cinch 1.2 pe 62 157 162 381 68 60 509 32.8 0.0834Fusilade + Sencor 0.125 + 0.5 post 65 149 169 383 73 63 519 36.7 0.0832Fusilade + Sencor 0.188 + 0.5 post 61 153 174 388 76 57 521 37.2 0.0839Sencor 0.5 post 59 143 161 363 71 59 493 35.9 0.0835Handweeded Check ---- 65 155 159 379 72 63 514 32.6 0.0836Weedy Check 47 122 116 285 58 107 450 35.4 0.0831
LSD (.05) NS 28 38 62 NS 31 72 NS NSCV (%) 24 14 18 11 36 21 9 6 7Mean 58 140 177 376 72 55 508 35.4 0.0833
U.S. No. l's Total Light Specific6-10 ) 10 No.2's Culls Total Reflectanceoz oz No.l's Gravity
AN EVALUATION OF POSTEMERGENCE APPLICATIONS OF METRIBUZINON SUGAR-ENDS IN RUSSET BURBANK POTATOES
Charles E. Stanger and Joey IshidaMalheur Experiment Station, Ontario, Oregon, 1986
Purpose
Trials were initiated to determine if Sencor can cause anincrease in the percent of sugar-ends in Russet Burbank potatoes.
Introduction
Preliminary research has indicated that Sencor applied aspostemergence treatments to Russet Burbank potatoes has causedenough growth stress on potato foliage to increase the percent ofsugar-ends. Foliar stress was observed as chlorosis and in somecases has been severe enough to cause necrosis on leaf margins.Most often foliar symptoms occur when Sencor is applied underhigh air temperatures and light intensity one or two days follow-ing cool, cloudy, or rainy weather. Sencor destroys chlorophylland interferes with carbohydrate formation and movement whenpostemergence applications are appled in June when tubers aresensitive to the initiation of sugar-ends.
Procedures
Russet Burbank potatoes were planted on April 22 on landthat was plowed in the fall of 1985 and bedded in the spring of1986. The land had been rotated to Stephens wheat in 1984 andhad grown an experimental crop, Cuphea, in 1985. One-hundredpounds per acre phosphate and 60 pounds per acre of nitrogen wereapplied broadcast in the fall of 1985 and plowed under with amoldboard plow. The field was left plowed during the winter.
In the spring, the seed bed was tilled with a triple-K fieldcultivator and bedded into rows 36 inches apart. A tank-mixcombination of Prowl (pendimethalin) at 1.5 pounds active ingre-dient per acre and Dual (metalochlor) at 2 pounds active ingre-dient per acre was applied for weed control. The herbicides werebroadcast over the bedded land before the beds were harrowed inpreparation for planting. After planting, 150 pounds of nitrogenper acre and 2 pounds active ingredient of Temik were sidedressed.The potatoes were then hilled using a lilliston and layed-by with-out further tillage.
On May 1, the potatoes were irrigated lightly, in alternaterows, to add soil moisture for sprouting and emergence.
The first Sencor treatments were applied on June 13. Thepotato foliage was 8 to 10 inches tall. Sencor was applied at0.38 and 0.5 pounds active ingredient per acre as single anddouble applications. The second application for the double-applied treatments was made on June 22 just before the potato
31
foliage closed the rows. The additional herbicide was appliedon July 12 at 0.5 pounds active ingredient per acre. This treat-ment was applied following two to three days of cool, rainyweather in whip temperatures dropped from a high of 91.5°F fortwo days to 78 °F for one day, and 0.22 inches of rain fell onJuly 10. Air temperature on July 12 was 85°F.
Skies were clear on June 13 and22 and respective tempera-tures on those dates were 92
o and 89°F.
All herbicides were applied using a CO2 backpack sprayer
with a spray boom covering a six foot width. Spray pressure was35 psi, and water as the herbicide carrier was applied at a rateof 28 gallons per acre. Individual plots were six feet wide (tworows) and 30 feet long. A buffer area, one row wide, separatedplots that were adjacent to each other. Each treatment wasreplicated four times and all treatments were arranged at randomusing a randomized block experimental design.
The potatoes were observed for symptoms of Sencor injury tothe potato foliage on June 19 and 29. On both dates, the potatofoliage treated at all rates was showing some yellowing fromchlorosis, and leaf margins of some leaves were burning fromnecrosis. More yellowing and burn were evident at the higherrate and on the plants receiving two applications.
The tubers were harvested to determine yield, quality, spe-cific gravity, and fry color on October 12 and 13. Tuber yieldand tuber quality were determined from tubers harvested from tworows 15 feet long. Twenty tubers of uniform size (8 to 10ounces) were selected from the remaining 15 feet of two rows forspecific gravity and fry color evaluations. The tubers selectedfor
E density and fry color evaluations were stored in coolers at
65 F temperatures until they were processed by OSU staff inDecember at Ore-Ida Foods research laboratories. Fry color wasdetermined using a Photovolt reflection meter measuring the lightreflectance. Rating fry color was accomplished by correlatingreflectance reading with a USDA color chart.
Results
Metribuzin (Sencor) applied at rates and time of applicationevaluated in this trial had no detrimental effect on tuber yieldor tuber quality. The rates and time of application are inaccord with label rates for postemergence applications. In frycolor determinations it was noted that light reflection variedmore between replications for the control than from any treatment.
Higher application rates will be evaluated to find an effectlevel on quality to determine what amount of tolerance growershave in using metribuzin as postemergence treatments to RussetBurbank potatoes.
32
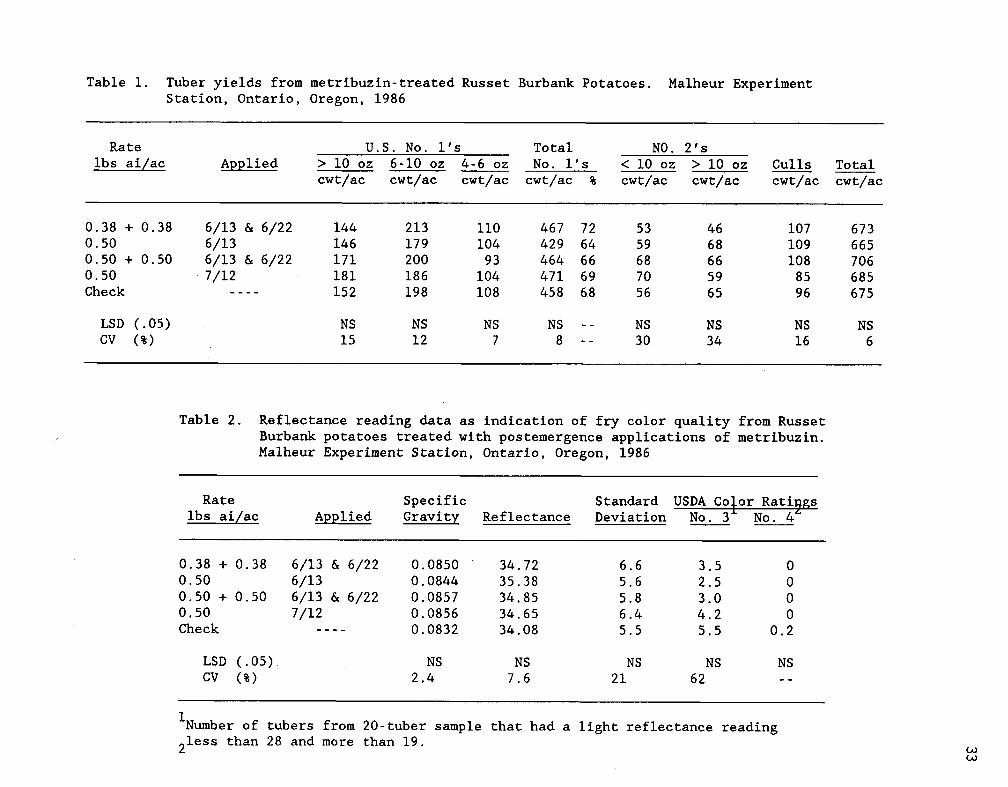
Table 1. Tuber yields from metribuzin-treated Russet Burbank Potatoes. Malheur ExperimentStation, Ontario, Oregon, 1986
Rate U.S. No. l's Total NO. 2's lbs ai/ac Applied
> 10 oz 6-10 oz 4-6 oz No. l's < 10 oz > 10 oz Culls Total cwt/ac cwt/ac cwt/ac cwt/ac % cwt/ac cwt/ac cwt/ac cwt/ac
0.38 + 0.38 6/13 & 6/22 144 213 110 467 72 53 46 107 6730.50 6/13 146 179 104 429 64 59 68 109 6650.50 + 0.50 6/13 & 6/22 171 200 93 464 66 68 66 108 7060.50 7/12 181 186 104 471 69 70 59 85 685Check 152 198 108 458 68 56 65 96 675
LSD (.05)
NS NS NS NS - NS
NS NS NSCV (%)
15 12 7 8 - 30
34 16 6
Table 2. Reflectance reading data as indication of fry color quality from RussetBurbank potatoes treated with postemergence applications of metribuzin.Malheur Experiment Station, Ontario, Oregon, 1986
Ratelbs ai/ac
Specific Standard USDA Color RatigsApplied Gravity Reflectance Deviation No. 3 No. 4
0.38 + 0.38 6/13 & 6/22 0.0850 34.72 6.6 3.5 00.50 6/13 0.0844 35.38 5.6 2.5 00.50 + 0.50 6/13 & 6/22 0.0857 34.85 5.8 3.0 00.50 7/12 0.0856 34.65 6.4 4.2 0Check 0.0832 34.08 5.5 5.5 0.2
LSD (.05)
NS NS
NS NS NSCV (%)
2.4 7.6
21 62
1Number of tubers from 20-tuber sample that had a light reflectance reading
2 1ess than 28 and more than 19.
THE EFFECT OF GROWTH-REGULATING AGENTS ONPOTATO YIELDS AND QUALITY
Charles E. Stanger and Joey IshidaMalheur Experiment Station, Ontario, Oregon, 1986
Purpose
MCPA and PPG-1720 were evaluated as foliar-applied treatments to increase tuber yield, and tuber size, reduce the percentof number two tubers, and improve tuber quality by reducingnumber of tubers with sugar-ends and low-fry quality in RussetBurbank potatoes.
Procedures
Russet Burbank potatoes were planted on April 13 in Owyheesilt loam soil with a pH of 7.3 and an organic matter content of1.2 percent. Potatoes and wheat were grown in 1984 and 1985,respectively. After the wheat harvest in 1985, the straw wasshredded, fertilizer added (100 pounds phosphate per acre and 60pounds of nitrogen per acre), and the field was moldboard plowed.
Spring tillage in preparation for planting included triple-ktillage, bedding on 36-inch centers, and applying Dual (2 poundsper acre) and Prowl (1.5 pounds per acre) for weed control.After the herbicides were applied over the bedded land, the bedswere harrowed nearly flat and a Russet Burbank variety of pota-toes was planted and partially hilled with shovels mounted on thepotato planter. After planting, the potatoes were sidedressedwith 150 pounds of nitrogen ((NH
4)2SO
4) and 2 pounds of Temik.
The potato rows were hilled and the field was layed-by withoutany further tillage or tractor traffic.
The potatoes were irrigated in every other row to apply onlyenough soil moisture to sprout the tuber for shoot emergence.
The first application of PPG-1720 was applied on June 7 whenthe stolons were "hooking." The MCPA treatments and the applica-tion of PPG-1720 at "tuber initiation" were applied on June 13.The 7-10 day repeat treatments of PPG-1720 to the tuber initia-tion treatments were applied on June 20. Application rates ofMCPA were 0.25, 0.50, 0.75, 1.00, and 0.25 + 0.25 pounds activeingredient per acre.
Individual plots were two rows wide and 30 feet long. Abuffer three feet wide separated adjacent plots. Each treatmentwas replicated four times and randomized using a complete blockexperimental design.
The chemicals were broadcast sprayed onto the potato fo-liage using a back pack CO2 plot sprayer. The spray boom was sixfeet long, with five teejet nozzles size 8003. Spray pressure
34

was 35 psi and water was applied as the carrier at a rate of 40gallons per acre.
The potatoes were harvested during the second week of Octo-ber. Tubers from two rows 15 feet long were harvested and gradedto determine tuber yields and tuber size and quality. Number-onetubers from PPG-1721 treatments were sized from 4 to 8 ounces, 8to 10 ounces, 10 to 12 ounces, and larger than 12 ounces.Number-one size grades from MCPA treatments were 4 to 6 ounces, 6to 10 ounces, and more than 10 ounces. Number twos and cullswere also determined from both trials.
Twenty 8- to 10-ounce tubers were picked off the ground fromthe remaining 15 feet of each two row plot for specific gravityand sugar-end analysis. These samples were stored in refriger-ated rooms at 65°F until they were analyzed in December by OSUstaff at Ore-Ida Foods laboratory. A photovolt meter measuringlight reflectance was used in measuring fry color of tubers. Asection one-half inch deep from the stem-end of the tuber wasdeep fried for 2.5 minutes at 325°F. Light reflectance from thecenter of the clipped tuber was measured with the photovoltmeter. Readings less than 28.9 are dark colored and unacceptableby potato processors.
Results
MCPA caused significant reductions in total yield, size, andpercent of number ones. Harvested tubers from MCPA-treated plantswere severely misshapen with rough skins and warts on the surfaceof tubers. MCPA did not reduce the fry quality or specificgravity.
Total tuber yields were generally less in plants treatedwith PPG-1721 compared with the control treatment. Total tuberyields between treatments were variable and with exception of twotreatments (50-ppm tuber initiation and 100-ppm stolon hooking)were not enough to be significant at the 5 percent level (Table1). Percent of 12-ounce tubers increased with rate of PPG-1721with a compensating reduction in yield of smaller-sized tubers.This effect was evident with the stolon hooking treatments for50-, 75-, and 100-ppm rates. No differences in fry color orspecific gravity readings occurred with PPG-1721 treatments.
In summary, MCPA had a severe adverse effect on potato tuberproduction. PPG-1721 treatments compared to control treatmentstended to reduce total tuber yield but increased size or percentof 12-ounce number one tubers and lowered yield of small numberone tubers.
35

C.001
Table 1. Tuber yields from PPG-1721-treated Russet Burbank potatoes. Malheur Experiment Station, Ontario, Oregon, 1986
PPG-1721 Applied U S No. l's Total l's U S No. 2's CullsTotalYield
FryColor
SpecificGravity
(PPm) 4-8 oz 8-10 oz 10-12 oz >12 oz cwt/ac % cwt/ac % cwt/ac % cwt/ac
50 Stolon Hooking 185 123 48 111 467 65 147 21 95 13 709 31.0 0.084475 Stolon Hooking 175 116 40 153 484 65 175 23 82 11 741 32.9 0.0855
100 Stolon Hooking 163 100 54 123 440 62 181 25 86 12 707 30.4 0.0842150 Stolon Hooking 174 101 64 109 448 61 199 27 89 12 736 31.9 0.0866
50 Tuber initiation& 7 days 186 103 56 89 434 62 172 25 90 13 696 32.1 0.0854
75 Tuber initiation& 7 days 184 106 57 108 455 64 161 22 91 12 707 34.3 0.0851
100 Tuber initiation& 7 days 196 138 47 130 511 69 140 19 90 12 741 32.8 0.0865
150 Tuber initiation& 7 days 200 108 44 112 464 63 174 24 98 13 736 32.6 0.0850
Check 229 109 66 102 506 65 176 23 89 11 771 33.3 0.0856
LSD 0.10 20 29 -- NS NSLSD 0.05 30 16 31 61 NS NSCV (%) 11 15 20 19 9 14 -- 15 7 8.5 3.1Mean 187 112 53 114 446 169 -- 89 726 32.3 0.0854
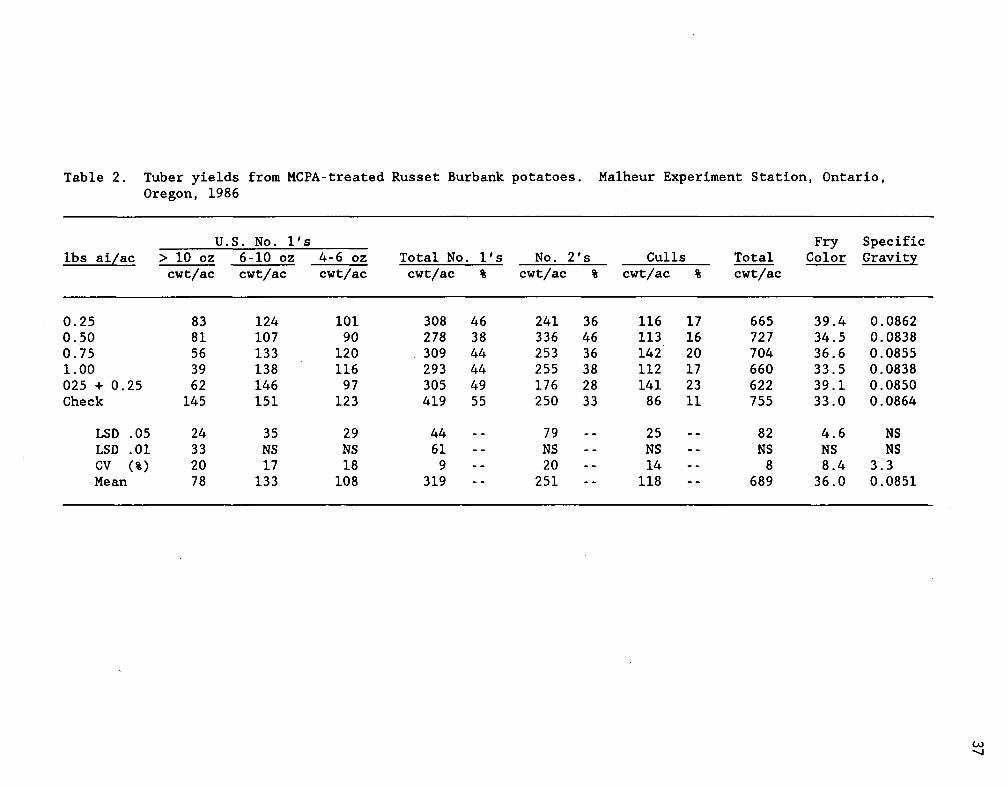
Table 2. Tuber yields from MCPA-treated Russet Burbank potatoes. Malheur Experiment Station, Ontario,Oregon, 1986
lbs ai/acU.S. No. l's
Total No. l's No. 2's Culls TotalFry
ColorSpecificGravity> 10 oz 6-10 oz 4-6 oz
cwt/ac cwt/ac cwt/ac cwt/ac % cwt/ac cwt/ac % cwt/ac
0.25 83 124 101 308 46 241 36 116 17 665 39.4 0.08620.50 81 107 90 278 38 336 46 113 16 727 34.5 0.08380.75 56 133 120 309 44 253 36 142 20 704 36.6 0.08551.00 39 138 116 293 44 255 38 112 17 660 33.5 0.0838025 + 0.25 62 146 97 305 49 176 28 141 23 622 39.1 0.0850Check 145 151 123 419 55 250 33 86 11 755 33.0 0.0864
LSD .05 24 35 29 44 79 25 82 4.6 NSLSD .01 33 NS NS 61 NS NS NS NS NSCV (%) 20 17 18 9 20 14 8 8.4 3.3Mean 78 133 108 319 251 118 689 36.0 0.0851
EFFECTS OF STRAW MULCH AND IRRIGATION RATE ONSOIL LOSS AND RUNOFF
Clinton Shock, Herb Futter, Robert Perry,Jerry Swisher, and Joe Hobson
Malheur Experiment Station and Soil Conservation Service,Ontario, Oregon
Summary
A Nyssa silt loam soil was bedded for potatoes. Furrowirrigation for 11 hours at four gallons per minute on a 2.5percent slope resulted in 17.7 tons of soil lost per acre. Soilloss was reduced to 2.8 tons per acre by the use of 790 lbs/acreof wheat straw mulch. At two gallons per minute, straw reducedsoil losses from 3.4 to 0.02 tons per acre. Erosion controlbenefits from mulch continued to a lesser extent during thesecond irrigation. Wheat straw mulch increased water intake anddecreased runoff. Water intake was not related to the irrigationinflow rate.
Introduction
Furrow irrigation on moderate slopes can lead to high ratesof soil loss and low efficiency of water use. Where water intakeis limited, crop yield and quality can be adversely affected.Application of small quantities of straw mulch is a possiblepractical means to decrease erosion and increase water infiltra-tion. Robert Berg (1984) showed that small quantities of strawcould increase water infiltration and decrease soil loss infurrow-irrigated crops near Kimberly. Berg's studies were doneon straw applied uniformly by hand into the furrows. Miller andAarstad (1983) showed that at Prosser, Washington, most of themeasured soil loss occurring under furrow irrigation could becontrolled by relatively small quantities of hand-applied straw(between 360 and 1,080 lbs of straw per acre). Although thecosts of wheat straw mulch are low, the labor costs to apply themulch can be considerable. The use of a tractor-drawn multiple-row straw spreader used in this experiment makes the mulch a morefeasible alternative.
Materials and Methods
An experiment was designed to measure the effects of strawmulch and irrigation rate on runoff, water intake, and soilerosion. The soil used was a Nyssa silt loam with average slopeof 2.5 percent at the Malheur Experiment Station. The soil is atypical bench soil planted to a wide variety of row crops.
38
More than 40 beds for potatoes were prepared with three feetbetween the furrows. Operations in preparing the land wererepeated so there would be no difference in tractor trafficbetween wheel rows and non-wheel rows. Forty furrows 250 feetlong were used for the experiment. Each replicate of each treat-ment was installed in five parallel furrows.
The land was bedded as if a potato crop were going to beplanted. No crop was planted. The first irrigation was made onAugust 6 and 7 and the second irrigation was made on August 20and 21. The first irrigation dates were chosen for the conven-ience of making erosion and water measurements.
The treatments were 1) strawed furrows, two gallons perminute irrigation, 2) non-strawed furrows, two gallons per minuteirrigation, 3) strawed furrows, four gallons per minute irriga-tion and 4) non-strawed furrows, four gallons per minute irriga-tion. Furrows were strawed using Hobson's Baled Mulch Applica-tor. This machine spread 790 lbs/acre(5.4 lbs/100 ft. of furrow)of baled wheat straw simultaneously down the length of fivefurrows. The straw distribution was not completely uniform.Most of the straw fell into the furrow. Loose soil in the beddedground tended to hold the straw in place before the first irriga-tion.
Furrow irrigation was controlled by adjusting the outlets ofgated pipe. Powlus flumes were used to measure water inflow andoutflow throughout the duration of the experiment. Soil erosionwas calculated by collecting runoff water and allowing collectedsediment to settle in Imhoff cones.
Results and Discussion
Differences among the treatments were clearly evident fromthe beginning of the first irrigation. At approximately fourgallons per minute the water reached the end of the non-strawed250-foot furrow in 40 minutes; the strawed furrow took 89minutes. At approximately two gallons per minute, the watertook 108 minutes in the non-strawed furrows and 175 minutes inthe strawed furrows.
Sediment differences in the outflowing water were obviousfrom subjective evaluation. During the first irrigation, watercoming from the strawed furrows appeared as clear as the waterentering the furrow at the top of the field regardless of irri-gation rate. During the second irrigation, only the strawedfurrow at two gallons per minute had clear water at the lower endof the field.
39

1. Water Inflow
Water inflows were maintained close to the two- and four-gallon per minute rates desired (Table 1). Analysis of theoutflow volumes, water intake, and irrigation rate effects onerosion were based on actual rates of inflow into the furrows atthe top of the field.
2. Water Outflow
Water outflow volume was closely related to the rate ofinflow (Tables 1 and 2). Outflow volumes showed highly signifi-cant decreases with straw mulch.
3. Water Intake
Averaged over water inflow rates and irrigations, strawmulch increased water intake by 250 gallons per furrow per irri-gation during the first 7 hours and 10 minutes, and by 460 gal-lons over the entire 11 hours. Increased water intake from strawwas greatest during the first irrigation (Table 1). On average,the use of straw increased the amount of total water intake by 20percent (Tables 1 and 2).
Water intake over time is extremely important for cropgrowth and water management. The strawed treatment at fourgallons per minute was not as effective at promoting water intakeduring the second irrigations as during the first irrigation(Table 1, Figures 1 and 2).
Water intake was not influenced by irrigation rate (Table2), suggesting that water intake was severely limited by waterinfiltration rates in this soil.
4. Sediment Yield
Soil loss at a rate of 18 tons per acre per irrigationoccurred with water application rates of four gallons per minuteper furrow. At four gallons per minute, 790 lbs/acre of strawmulch reduced soil loss to less than 3 tons per acre on thefirst irrigation, but soil loss rose to 8 1/2 tons per acre onthe second irrigation. The soil loss on the second irrigationwas exaggerated on the mulched treatment because the mulch hadstimulated high water intake during the first irrigation. Thesoil retained a large reserve of moisture from the first irriga-tion that slowed intake, increased outflow, and increased soilloss from strawed furrows during the second irrigation.
At two gallons per minute, soil loss from strawed furrowsaveraged less than 0.2 tons per acre per irrigation over 11hours. The non-strawed furrows lost more than 3.3 tons of soilper acre per irrigation. The soil loss over time was leastduring the initial part of both irrigations (Figures 3 and 4).
40

Literature Cited
Berg, R. D. 1984. Straw residue to control furrow erosion onsloping, irrigated cropland. Journal of Soil and WaterConservation 39(1): 58-60.
Miller, D. E. and J. S. Aarstad. 1983. Residue Management toreduce furrow erosion. Journal of Soil and WaterConservation 38(4): 366-370.
41
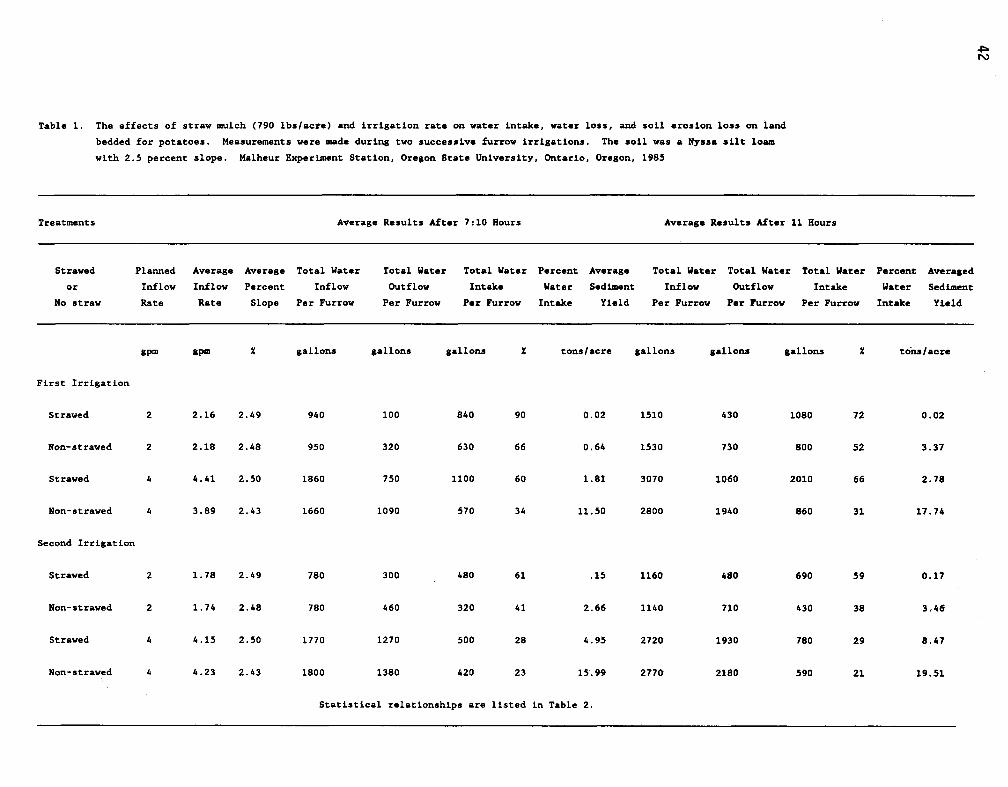
Table 1. The effects of straw mulch (790 lbs/acre) and irrigation rate on water intake, water loss, and soil erosion loss on land
bedded for potatoes. Measurements were made during two successive furrow irrigations. The soil was a Nyssa silt loam
with 2.5 percent slope. Malheur Experiment Station, Oregon State University, Ontario, Oregon, 1985
Treatments Average Results After 7:10 Hours Average Results After 11 Hours
Strawed Planned Average Average Total Water Total Water Total Water Percent Average Total Water Total Water Total Water Percent Averaged
Or Inflow Inflow Percent Inflow Outflow Intake Water Sediment Inflow Outflow Intake Water Sediment
No straw Rate Rate Slope Per Furrow Per Furrow Per Furrow Intake Yield Per Furrow Per Furrow Per Furrow Intake Yield
gpm gpm X gallons gallons gallons X tons/acre gallons gallons gallons X tons/acre
First Irrigation
Strayed 2 2.16 2.49 940 100 840 90 0.02 1510 430 1080 72 0.02
Non-strawed 2 2.18 2.48 950 320 630 66 0.64 1530 730 800 52 3.37
Strayed 4 4.41 2.50 1860 750 1100 60 1.81 3070 1060 2010 66 2.78
Non-strayed 4 3.89 2.43 1660 1090 570 34 11.50 2800 1940 860 31 17.74
Second Irrigation
Strayed 2 1.78 2.49 780 300 480 61 .15 1160 480 690 59 0.17
Non-strayed 2 1.74 2.48 780 460 320 41 2.66 1140 710 430 38 3.46
Strawed 4 4.15 2.50 1770 1270 500 28 4.95 2720 1930 780 29 8.47
Non-straved 4 4.23 2.43 1800 1380 420 23 15.99 2770 2180 590 21 19.51
Statistical relationships are listed in Table 2.

Table 2. Observed variations in water loss, water intake, and soil loss had highly significant relationships to the average water
inflow rate, whether or not the furrow was strayed, or whether the observation was during the first or second irrigation.
To interpret the equations the average inflow rate per furrow in gallons per minute is represented as "Inflow" and the
percent slope is represented as "Slope." Both "Inflow" and "Slope" are continuous variables. The variable "Irrigation"
takes on the values 0 or 1 depending on whether it is the first or second irrigation. The variable "Strewed" takes on a
value of 1 when strewed and a value of 0 otherwise. Malheur Experiment Station, Ontario, Oregon, 1985
*** 2 ** **1. Total Outflow Volume = 204 + 53.7 (Inflow) + 204 (Irrigation) - 299 (Strewed ns
to 7:10 hours
(gallons/furrow)
*** **2. Total Water Intake = 665 ns - 355 (Irrigation) + 251 (Strewed ns
to 7:10 hours
(gallons/furrow)
*** 2 *** **3. Percent Water Intake = 74 - 1.92 (Inflow) - 25.4 (Irrigation) + 20.3 (Strawed) ns
to 7:10 hours
( x )
*** *** **4. Percent Water Loss = 20 + 12.5 (Inflow) + 20.1 (Irrigation) - 13.8 (Strayed) ns
at 7:10 hours
( Z )
2R = .96
2R = .69
2R = .81
2R = .97
5. Ln (Sediment Yield
to 7:10 hours)
( Ln(tons/acre) )
*** **= -10.2 + 1.37 (Inflow) + 1.63 (Irrigation)
** * 23.06 (Strewed) + 2.74 (Slope) R .90
* statistically significant p. _ .95
** highly significant p. _ .99
*** vary highly significant p. _ .999
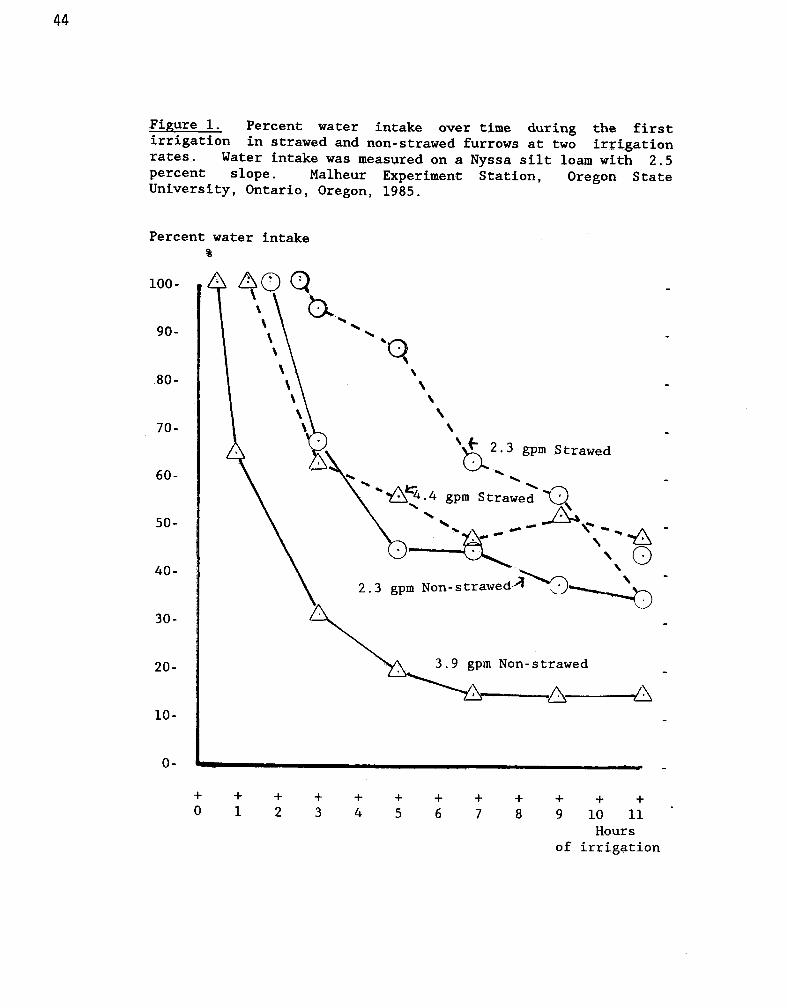
f 2.3 gpm Strawed
ft. 17N -4.4 gpm Strawed
44
Figure 1. Percent water intake over time during the firstirrigation in strawed and non-strawed furrows at two irrigationrates. Water intake was measured on a Nyssa silt loam with 2.5percent slope. Malheur Experiment Station, Oregon StateUniversity, Ontario, Oregon, 1985.
Percent water intake
100-
40-
50-
60-
80-
70-
90-
30-
3.9 gpm Non-strawed
A10-
0
+ + + + + + + + + + + +0 1 2 3 4 5 6 7 8 9 10 11
Hoursof irrigation
20-
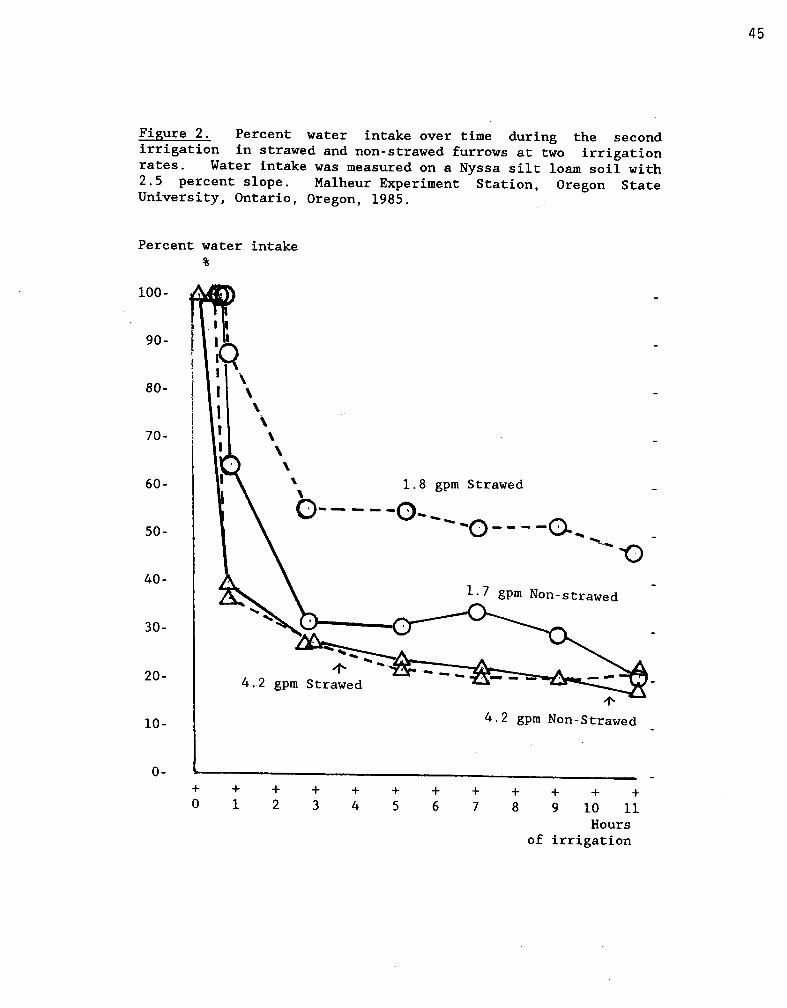
—o----Q
1.8 gpm Strawed
100-
90-
80-
70-
60-
50-
40-
30-
20-
45
Figure 2. Percent water intake over time during the secondirrigation in strawed and non-strawed furrows at two irrigationrates. Water intake was measured on a Nyssa silt loam soil with2.5 percent slope. Malheur Experiment Station, Oregon StateUniversity, Ontario, Oregon, 1985.
Percent water intake
4%4.2 gpm Non-Strawed10-
0-+ + + + + + + + + + + +0 1 2 3 4 5 6 7 8 9 10 11
Hoursof irrigation
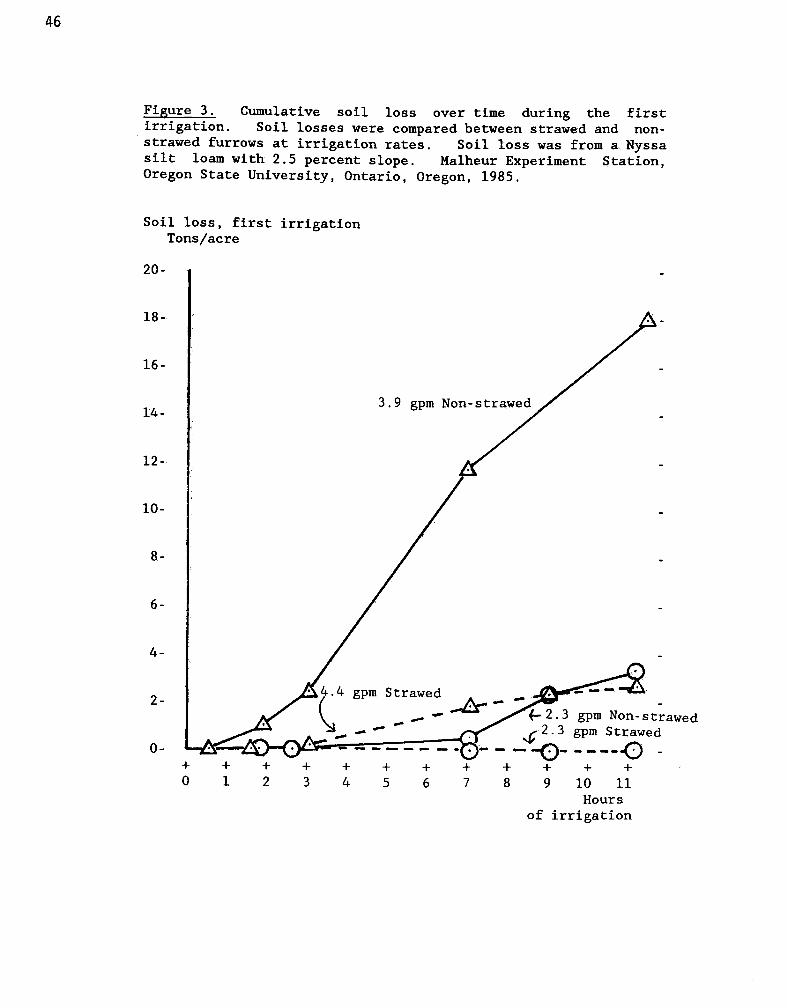
4-2.3 gpm Non-strawed2.3 gpm Strawed
+ + + + + +0 1 2 3 4 5 6 7
+ + + +8 9 10 11
46
Figure 3. Cumulative soil loss over time during the firstirrigation. Soil losses were compared between strawed and non-strawed furrows at irrigation rates. Soil loss was from a Nyssasilt loam with 2.5 percent slope. Malheur Experiment Station,Oregon State University, Ontario, Oregon, 1985.
Soil loss, first irrigationTons/acre
20-
Hoursof irrigation
18-
16-
14-
12-
10-
8-
6-
4-
2-
0-
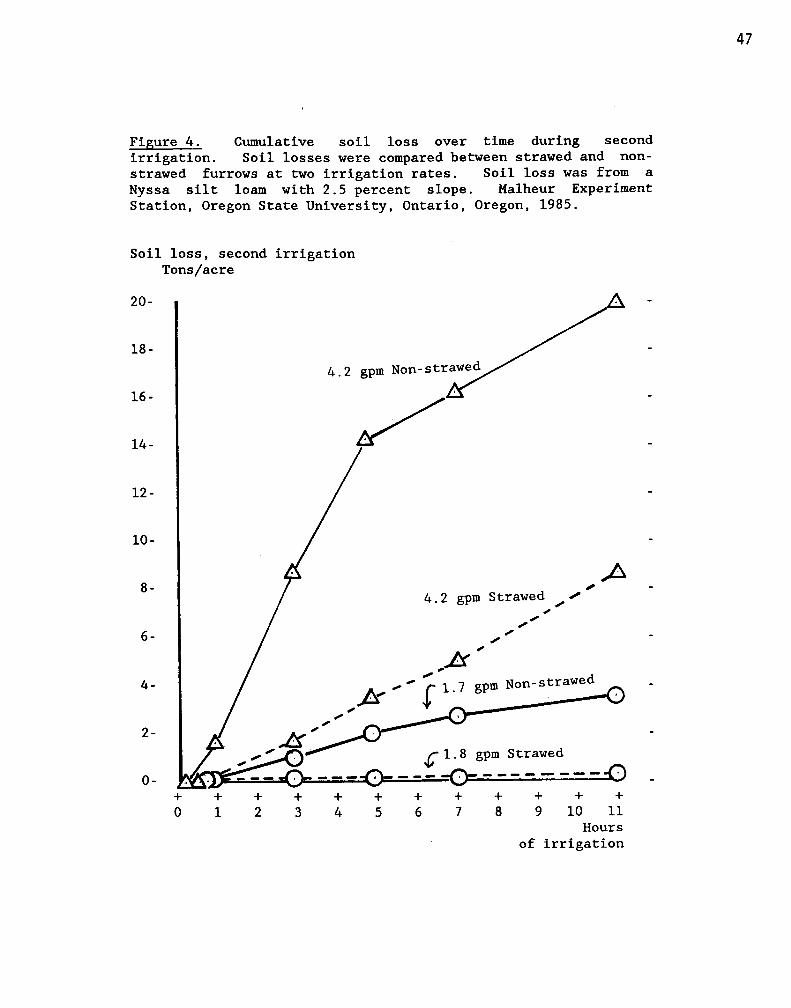
A
4 1.8 gpm Strawed
-0- ---------0+7
+8
+9
+ +10 11
Hours
20-
18-
16-
14-
12-
10-
8-
6-
4-
2-
0-
47
Figure 4. Cumulative soil loss over time during secondirrigation. Soil losses were compared between strawed and non-strawed furrows at two irrigation rates. Soil loss was from aNyssa silt loam with 2.5 percent slope. Malheur ExperimentStation, Oregon State University, Ontario, Oregon, 1985.
Soil loss, second irrigationTons/acre
of irrigation
INSECTICIDE TRIALS FOR ONION THRIP CONTROLIN DRY BULB ONIONS
Lynn Jensen, Malheur County Office, O.S.U. Extension ServiceMalheur Experiment Station, Ontario, Oregon, 1986
Purpose
The object of this study was to evaluate alternativeinsecticides for onion thrip control.
Introduction
A combination of parathion and toxaphene has been the stan-dard insecticide for onion thrip control in the Treasure Valleyfor a number of years. With the decision of the EPA to rescindToxaphene registration, it became necessary to find other insec-ticides that would be effective. Some organo-phosphate materialswere identified as being effective, but were ineffective in partsof the Treasure Valley in 1985 and throughout most of the valleyin 1986. Some growers sprayed five or six times without gettinggood thrip control. Also, increased onion acreage near alfalfaseed fields necessitated finding insecticides effective on onionthrip, yet relatively safe when used near fields where leafcutterbees are working.
Procedures
Insecticide evaluations were conducted at the MalheurExperiment Station at Ontario and on the Dwayne Bennett farm nearAdrian, Oregon. The plots were treated according to standardcultural practices for the area with regards to planting,fertilization, onion maggot control, irrigation, and cultivation.
Plots at the Experiment Station were four single rows wideby 30 feet long. The insecticides were applied with a CO2-typeplot sprayer equipped with a five-foot boom and LF3 nozzles toapply 25 G.P.A. at 30 psi (Table 1). L1-700, a penetratingsurfactant, was applied at a rate of 2 pints per 100 gallons ofwater plus the water was buffered appropriately.
The insecticides were applied at both sites when the thripcounts averaged 25 thrip per plant. All spraying was done in themorning, although 1985 spraying trials did not show any difference in control between morning and evening applications. Therewere both adults and nymphs at both sites at the time the mate-rials were applied.
Thrip counts were made on July 14 and 22 at the ExperimentStation and on July 22 at the Adrian site. The treatments weremade on July 11 at the Experiment Station with the second appli-cation of the double treatments on July 18. The Adrian site wasalso sprayed on July 18.
48
Results
All thrip control was lower than expected for 1986 exceptthe double treatments seven days apart (Table 2). These were theonly treatments that gave satisfactory thrip control. This wouldindicate that probably the best method of control will be tospray two times about seven days apart. It is possible that weare missing those thrip that are pupating in the soil on a one-application schedule, where a second application seven days afterthe first will control many of these emerging adults. Twoapplications seven days apart might lessen the need forinsecticide applications later in the season. The adults thatemerge from the soil are ready to begin a new cycle, so control-ling them will delay the cycle buildup. The organo-phosphateinsecticides generally performed about as well as the sytheticpyrethroids (Table 6) at the 3-day counts, but did not give anyresidual control, whereas the synthetic pyrethroid materialscontinued to give as good or better control at the end of 10 daysas they did at 3 days.
One of the problems which was evident from past years andwhich continued to manifest itself is the variability of controlwith the organo-phosphate insecticides. Neither Penncap M,methyl parathion, nor Guthion did well at either site, butLorsban and ethyl parathion showed good control at Adrian andpoor control at the Malheur Experiment Station (Table 5). Thismay explain why a grower in one area can have good control withone particular insecticide while his neighbor a few miles away isnot getting any results. Growers experiencing problems may insome cases increase their thrip control by switching to an ethylparathion formulation. The synthetic-pyrethroid insecticidesappear to be much more consistent in their control throughout thedifferent areas of the valley (Table 4).
Conclusions
1. The ethyl parathion formulation may be more effectivethan other parathion formulations in some areas of theTreasure Valley.
2. The synthetic pyrethroid insecticides give much longerresidual control of onion thrip.
3. Two spray applications seven days apart appear to givethe best control.
4. Two applications of Baythroid gave significantly bettercontrol than two applications of Penncap M + methylparathion.
49

Table 1. Summary of insecticide treatments on onion thrip (Thrip tabaci Lindeman) control - three-day counts. Malheur Experiment Station,Ontario, Oregon, 1986
RatTreatment lbs ai/ac
Average NumberThrips/Plant
ThripControl
ThripPopulations
thg10 1,2
Ammo 2.5 E.C. 0.06 7.1 75.1 .81 aBaythroid 2 E.C. + 0.05 7.4 74.2 .82 a-bVydate L (2) 0.5Pounce 3.2 E.C. 0.15 7.5 73.8 .86 a-cSpur + 0.15 8.2 71.1 .87 a-dVydate L (2) 0.5Ammo 2.5 E.C. 0.08 8.6 69.9 .93 a-eBaythroid 2 E.C. 0.05 9.8 65.5 .94 a-ePounce 3.2 E.C. 0.2 9.7 66.1 .96 a-ePenncap M + 0.5 9.7 66.0 .97 a-eethyl parathion 4 E.C. 0.5
Penncap M + 0.5 10.2 64.4 .99 a-emethyl parathion 5 E.C. 0.5Lorsban 4E 1.0 11.1 61.0 1.03 a-eBaythroid 2 E.C. 0.025 11.7 59.1 1.06 b-ePenncap M + 0.5 12.3 57.1 1.07 c-eGuthion 2S + 0.75Sulfur-flowable 1.0
Lorsban 4E + 1.0 12.3 57.1 1.07 c-emethyl parathion 5 E.G. 0.5Penncap M + 0.5 13.2 53.8 1.08 c-eGuthion 2S 0.75Penncap M + 0.5 13.9 51.4 1.11 d-eethyl parathion 4 E.C.crop oil
0.5
Vydate L (2) 0.5 16.00 44.0 1.15 eControl 28.6 0.0 1.44 f
LSD .24
Ratings with same letter are not significantly different at the 5 percentlevel using Fishers's LSD Test.The thrip population index was calculated by taking the Log ic) of the meannumber of thrip per plant. Hartley's test for homogenity of populationvariances was used to determine whether to transform the data to Logic).The extreme variations in population means made this type of analysisnecessary to show true treatment differences.
50
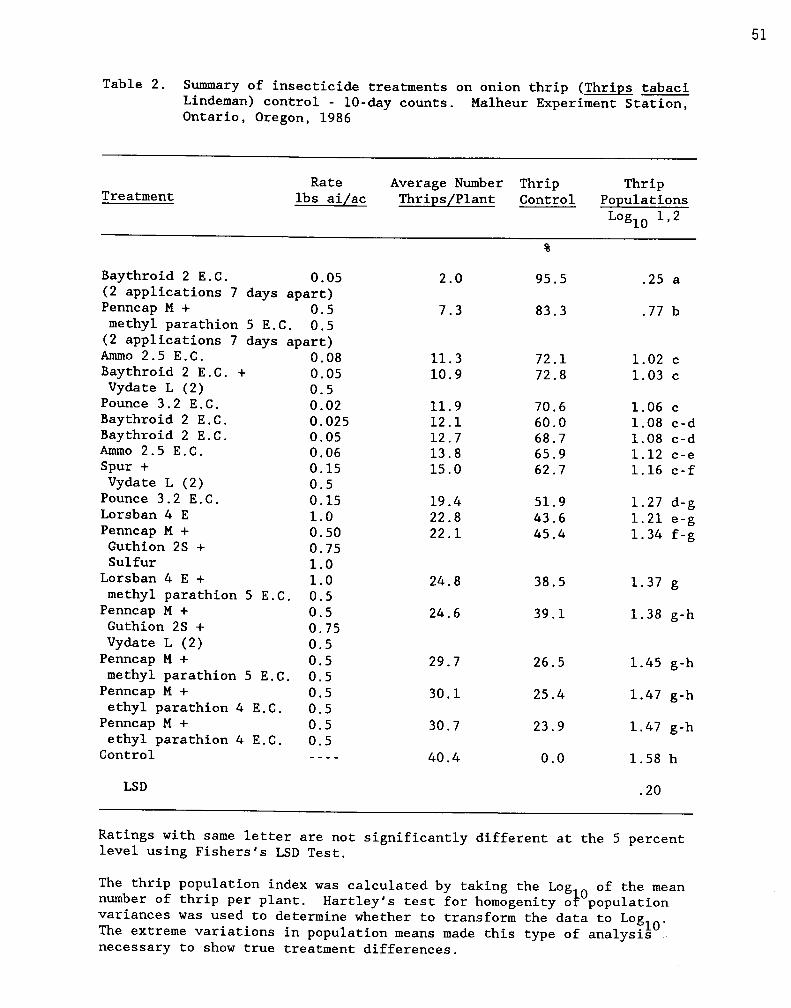
Table 2. Summary of insecticide treatments on onion thrip (Thrips tabaciLindeman) control - 10-day counts. Malheur Experiment Station,Ontario, Oregon, 1986
RateTreatment lbs ai/ac
Average NumberThrips/Plant
ThripControl
ThripPopulations
Logic, 1,2
Baythroid 2 E.C. 0.05 2.0 95.5 .25 a(2 applications 7 days apart)Penncap M + 0.5methyl parathion 5 E.C. 0.5
7.3 83.3 .77 b
(2 applications 7 days apart)Ammo 2.5 E.C. 0.08 11.3 72.1 1.02 cBaythroid 2 E.C. + 0.05 10.9 72.8 1.03 cVydate L (2) 0.5Pounce 3.2 E.C. 0.02 11.9 70.6 1.06 cBaythroid 2 E.C. 0.025 12.1 60.0 1.08 c-dBaythroid 2 E.C. 0.05 12.7 68.7 1.08 c-dAmmo 2.5 E.C. 0.06 13.8 65.9 1.12 c-eSpur + 0.15 15.0 62.7 1.16 c-fVydate L (2) 0.5Pounce 3.2 E.C. 0.15 19.4 51.9 1.27 d-gLorsban 4 E 1.0 22.8 43.6 1.21 e-gPenncap M + 0.50 22.1 45.4 1.34 f-gGuthion 2S + 0.75Sulfur 1.0
Lorsban 4 E + 1.0methyl parathion 5 E.C. 0.5
24.8 38.5 1.37 g
Penncap M + 0.5 24.6 39.1 1.38 g-hGuthion 2S + 0.75Vydate L (2) 0.5Penncap M + 0.5methyl parathion 5 E.C. 0.5
29.7 26.5 1.45 g-h
Penncap M + 0.5ethyl parathion 4 E.C. 0.5
30.1 25.4 1.47 g-h
Penncap M + 0.5ethyl parathion 4 E.C. 0.5
30.7 23.9 1.47 g-h
Control 40.4 0.0 1.58 h
LSD .20
Ratings with same letter are not significantly different at the 5 percentlevel using Fishers's LSD Test.
The thrip population index was calculated by taking the Log 0 of the meannumber of thrip per plant. Hartley's test for homogenity of populationvariances was used to determine whether to transform the data to Log10.The extreme variations in population means made this type of analysisnecessary to show true treatment differences.
51

Table 3. Summary of insecticide treatments on onion thrip (Thrips tabaci Lindeman) control, three-day counts. Dwayne Bennett Farm, Adrian,Oregon, 1986
TreatmentRate
lbs ai/acAverage NumberThrips/Plant
ThripControl
ThripPopulations
Logic, 1,2
Lorsban 4E + 1.0 1.6 89.9 1.47amethyl parathion 5 E.C. 0.5Lorsban 4E 1.0 1.8 89.0 1.53 a-bPenncap M + 0.5 2.8 82.7 1.54 a-bethyl parathion 4 E.C. 0.5
Spur + 0.15 2.4 85.0 1.55 a-bVydate L (2) 0.5Pounce 3.2 E.C. 0.15 2.1 87.0 1.56 a-bPounce 3.2 E.C. 0.20 2.0 87.3 1.58 a-bAmmo 2.5 E.C. 0.08 2.1 86.8 1.61 a-bBaythroid 2 E.C. 0.05 3.4 78.8 1.80 a-cAmmo 2.5 E.C. 0.06 4.2 74.2 1.89 b-cBaythroid 2 E.G.C + 0.05 4.6 71.3 1.91 b-cVydate L (2) 0.5Baythroid 2 E.C. 0.025 4.9 69.5 1.92 b-cVydate L (2) 0.5 5.0 69.2 1.93 b-cPenncap M + 0.5 7.6 53.2 2.06 c-dmythyl parathion 5 E.C. 0.5Penncap M + 0.5 8.0 50.6 2.20 c-eGuthion 0.75Penncap M + 0.5 12.9 21.9 2.40 d-eethyl parathion 4 E.C.crop oil
0.5
Control 16.2 0.0 2.48 e
LSD .41
Ratings with same letter are not significantly different at the 5 percentlevel using Fishers's LSD Test.
The thrip population index was calculated by taking the Log ic) of the meannumber of thrip per plant. Hartley's test for homogenity of populationvariances was used to determine whether to transform the data to Log
10 .The extreme variations in population means made this type of analysisnecessary to show true treatment differences.
52
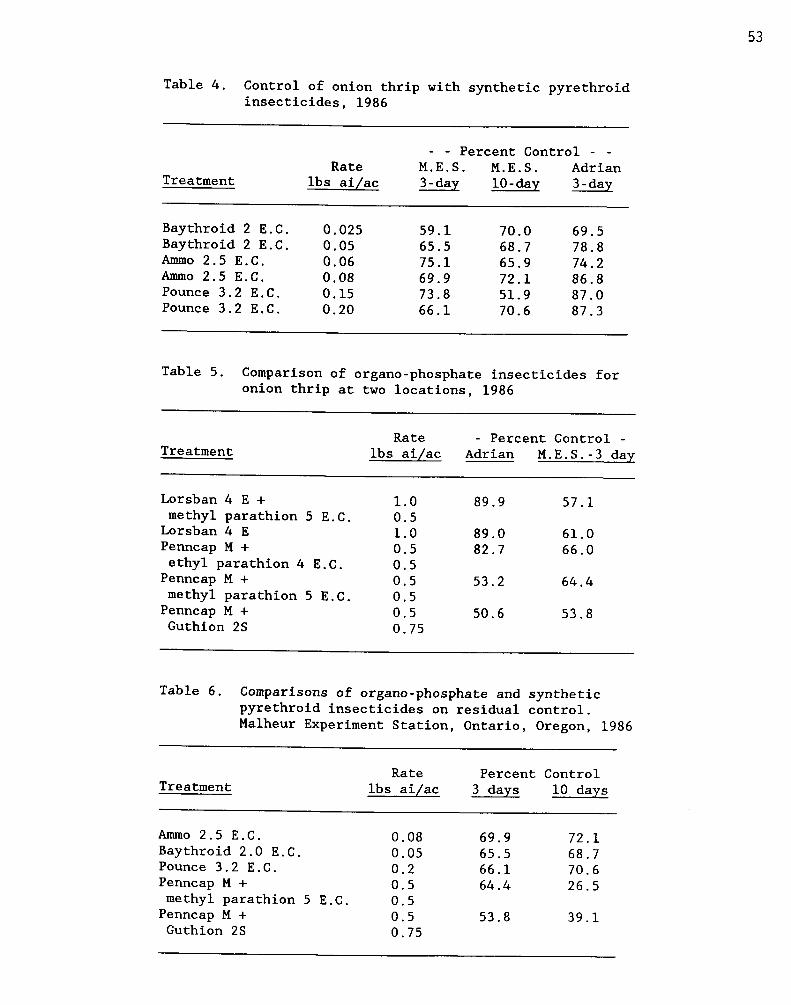
53
Table 4. Control of onion thrip with synthetic pyrethroidinsecticides, 1986
TreatmentRate
lbs ai/ac
- - Percent Control - -M.E.S. M.E.S. Adrian3-day 10-day 3-day
Baythroid 2 E.C. 0.025 59.1 70.0 69.5Baythroid 2 E.C. 0.05 65.5 68.7 78.8Ammo 2.5 E.C. 0.06 75.1 65.9 74.2Ammo 2.5 E.C. 0.08 69.9 72.1 86.8Pounce 3.2 E.C. 0.15 73.8 51.9 87.0Pounce 3.2 E.C. 0.20 66.1 70.6 87.3
Table 5. Comparison of organo-phosphate insecticides foronion thrip at two locations, 1986
TreatmentRate
lbs ai/ac- Percent Control -
Adrian M.E.S.-3 day
Lorsban 4 E + 1.0 89.9 57.1methyl parathion 5 E.C. 0.5Lorsban 4 E 1.0 89.0 61.0Penncap M + 0.5 82.7 66.0ethyl parathion 4 E.C. 0.5
Penncap M + 0.5 53.2 64.4methyl parathion 5 E.C. 0.5Penncap M + 0.5 50.6 53.8Guthion 2S 0.75
Table 6. Comparisons of organo-phosphate and syntheticpyrethroid insecticides on residual control.Malheur Experiment Station, Ontario, Oregon, 1986
TreatmentRate
lbs ai/acPercent Control
3 days 10 days
Ammo 2.5 E.C. 0.08 69.9 72.1Baythroid 2.0 E.C. 0.05 65.5 68.7Pounce 3.2 E.C. 0.2 66.1 70.6Penncap M + 0.5 64.4 26.5methyl parathion 5 E.C. 0.5Penncap M + 0.5 53.8 39.1Guthion 2S 0.75
ONION VARIETY TESTING RESULTS
Charles E. Stanger and Joey IshidaMalheur Experiment Station, Ontario, Oregon, 1986
Purpose
Commercial and experimental lines of yellow, white, and redonions were compared for maturity, ibulb yields, bulb size, andneckrot developing during storage.
Procedures
The onions were planted on April 11 in Owyhee silt loam soilcontaining 1.1 percent organic matter with a pH of 7.3. Cornand wheat were grown at the test site in 1984 and 1985, respect-ively. The grain straw was shredded and the soil chiseled,disced, irrigated, and moldboard-plowed in the fall. Fertilizer(100 pounds P per acre and 60 pounds N per acre) was broadcastbefore plowing. The plowed land was left open during the winter.
In the spring, the seedbed was prepared by tilling the soilwith a triple-k and spike-tooth harrow. For chemical weed con-trol, Ramrod (4 lbs ai/ac) and Hoelon (1.5 lbs ai/ac) were broad-cast and incorporated at a shallow depth by a spike-tooth harrowbefore planting. The trial area was marked out at 22-inch rowspacing and planted using cone-seeders mounted on John DeereModel 71 Flexi-planters.
Individual plots were two rows wide and 25 feet long. Eachvariety was replicated five times using a complete randomizedblock experimental design. The seed was planted at a rate ofabout 12 viable seeds per linear foot of row. The plants werehand-thinned to a final stand of four onions per foot when theonions had three to four leaves. The onions were watered byfurrow irrigation. Water was applied between each row of onions.Early irrigations were applied in alternate rows. After midsea-son, all furrows were irrigated. In mid-May, 30 pounds of nitro-gen per acre was water run in the form of ammonium nitrate. Anadditional 150 pounds per acre of nitrogen in the form of ammo-nium sulfate was sidedressed the first week of July.
Maturity was assessed on August 12, 18, 28, and September 8and 15. The ratings were expressed as percentages of plants withtops fallen over within each plot (Table 1).
1Seed was received for testing from 11 seed companies: American
Takii, Arco, Asgro, Crookham, Ferry Morse, Harris-Moran, Mono-Hy,Nickerson Zwann, Petoseed, Quali-sel, and Vanderhave.
54

The bulbs were lifted on September 15 and hand-topped onSeptember 23, 24, and 25. Onions from individual plots were putin burlap bags and stored in field crib boxes. The onions wereput in storage on October 6. The storage shed was equipped withfans forcing air underneath each of the boxes which were stackedacross the onion shed in rows six deep andfour high. Temperatures in storage from 32 to 35 and relative humidity wasapproximately 62°F. F. The fans were run 12 hours or less duringeach 24 hours during the time onions were in storage.
The onions remained in storage until January 12 when theywere graded. The onions were graded according to diameter ofbulbs. Size classes were 2 1/4 to 3 inches, 3 to 4 inches, andgreater than four inches. Split bulbs were classed as number twos.The bulbs infected with Botrytis were weighed to determine per-cent storage rot and then graded to calculate onion yields. Thestorage rot data were reported as average neckrot and potentialneckrot. The average neckrot data are reported as an averageamount of rot for all five replications. "Potential" rot was thesingle replication with the greatest amount of neckrot.
Results
Spring growth was normal and summer temperatures wereunusually warm at the end of May and early in June. Approximate-ly 1.6 inches of rain fell in September before the onions werelifted. Clear skies and warm temperatures followed with condi-tions good for onion harvest and field drying. Generally, theonions stored well with only moderate amounts of neckrot occur-ring in most lines, but extensive rot did occur in the late-maturing, high-yielding Avalanche variety of white bulbs.
Data are reported for the varieties for each company and areranked according to total bulb yield (Table 1). Data are reportedfor thirty-nine yellow, seven white, and six red lines. Bulbyields were generally higher in 1986 than 1985. Bulb yields foryellow lines ranged from 393 to 879 cwt/ac. Lines with greaterthan 67 percent colossal-sized bulbs included 4265, 615-4,Durango, Valdez, N-128, N-127, 77-N76, Celebrity, and Dai Maru.White varieties ranged from 745 to 563 hundred weight per acreand red varieties ranged in yield from 589 to 475 hundred weightper acre. Early maturing varieties included American Takii lines327-1, 327-2, 60-12, 60-1, 60-2, and 60-3. Other early lineswere Yula, Golden Cascade, 836-2, Benny Red, NIZ 23-1028, Omega,PSX 1183, PSR 385, and Experimental 21633. The later-maturinglines were 4265, 615-4, Valdez, Avalanche, Glacier, XPH 83N128,XPH 83N127, Celebrity, and White Sweet Spanish. Tops of theselines remained green and at least 30 percent of the tops werestanding when the onions were lifted. The maturity ratings forother lines evaluated were intermediate.
Multiple-year averages for onion yields, rot, and maturityare reported in Tables 2 and 3.
55

56 Table 1. Results of the 1986 onion variety trial. Malheur Experiment Station, Ontario, Oregon, 1986
2omma Variety Total
Average
Neckrot
3Potential
Neckrot +4 Inch 3-4 inch 2 1/4-3 inch 2's Maturity Ratings4
Bolting
cwt/ac Z X cvt/ac Z cwt/ac Z cvt/ac 2 cvt/ac 8/12 8118 8/28 9/89/15
American Takil 327-1 497 0 18 4' 432 86 48 10 3 52 64 88 97 97 0
327-2 494 0 15 3i4"432 88 46 9 0 59 92 92 95 95 0
60-12 490 0 16 3 412 84 62 13 1 57 86 87 95 95 0
60-1 460 0 0 3 1 977 81 100 20 0 77 88 77 98 98 0
60-2 434 0.3 1.5 5 1 362 81 79 18 1 84 91 98 99 99 0
60-3 393 0.4 1.8 4 1 231 59 158 40 0 90 95 98 99 99 0
Arco 4265 841 1.5 2.7 628 75''-'202 24 10 1 23 0 2 13 33 60 2
615-4 817 2.7 5.7 610 75 6 ''195 24 11 1 18 0 0 11 25 54 2
Durango 810 6.6 22.2 536 65 07273 33 13 2 24 0 3 35 15 70 2
Valdez 1Avalanche
779
745
2.2
28.7
4.0
61.4
537
379
697,231
51'1'-''155
30
47
11
12
1
2
13
40
0
0
2
3
22
27
45
50
65
67
12
Winner 1Glacier
727
702
1.9
4.1
2.3
7.9
415
378
55 1 '3298
54'...310
41
44
26
14
4
2
4
8
5
2
18
6
58
31
75
51
82
68
11
Golden Cascade 690 0.9 2.0 368 52', '313 45 21 3 6 16 39 63 74 84 0.2
Magnu 1Blanco Duro
678
635
1.5
5.7
2.3
10.2
378
190
54310
30 .'424
44
67
14
20
2
3
8
4
16
2
26
4
61
34
80
*0
80
74
0
1
836-2 629 0.6 0.9 146 23 462 74 21 3 2 31 51 81 87 89 0.2
Vallent 602 1.7 3.2 167 23 385 61 44 6 18 2 7 41 66 79 02
Tango 526 1.5 2.6 62 12 403 76 61 12 3 13 28 62 76 82 02
Carmen 475 1.2 2.6 66 12':"" 364 74 66 14 16 3 6 32 52 81 0
Asgrov Vega 742 1.0 2.2 411 55124315 43 16 2 32 2 4 29 54 70 1
Armada 742 2.8 7.2 483 63756272 35 16 2 37 2 5 30 58 74 1
Fula 654 2.4 3.3 282 43351 53 32 30 37 70 86 90 88 0
Maya (XP739 641 0.7 1.2 260 40 378 57 24 3 13 18 28 69 81 82 02
Ruby (XP3224) 535 0.8 1.8 95 18,''393 72 54 10 37 21 32 61 83 84 0
Crookham XPH-83N128 879 5.6 15.4 703 80 , 163 18 13 2 28 0 2 14 30 51 0.4
XPH-83N127 821 4.4 6.4 594 72',,'216 27 9 33 0 0 7 24 48 0
XPH-77N76 793 2.9 6.3 523 66' '.262 33 8 77 4 13 58 69 75 0.2
Celebrity 782 2.6 5.2 527 67 '232 30 23 3 55 1 5 25 54 64 2
Dai Marti 776 3.5 4.3 537 69":,231 30 9 1 14 1 5 30 56 70 0.4
Ringmaker 769 1.1 2.5 456 59 . 299 39 13 2 64 7 20 47 67 74 0.6
XPH-85N40 720 0.9 2.1 414 58"' . 291 40 15 2 31 3 11 51 72 79 0.2
Big Mac 695 0.7 1.4 383 54!,R"304 44 18 2 52 3 10 37 64 76 0.2
1White Keepe 581 3.8 10.0 152 26 -,q394 68 33 6 43 2 9 48 65 73 0.2
White Delight ' 563 3.1 4.8 163 27'f7-363 65 37 32 2 7 30 57 75 0.2
Ferry Morse 70 W 6 711 1.2 2.1 384 54:"315 44 12 2 10 10 14 46 73 76 1.2
Bulleye 654 0.9 1,7 254 39 "" 381 58 19 3 6 4 8 32 56 77 2
Sweetheart 603 0.8 1.7 250 40 356 57 17 2 5 0 4 26 5078 1
Redman 589 1.6 4.6 151 26-"6 412 70 26 4 10 4 8 32 6278 0.2
2Harris Moran Benny Red 589 0.7 0.8 117 205u '428 73 44 7 24 17 25 68 85 93
MOX 1008 578 1.0 2.4 159 28 381 66 37 6 57 5 15 38 63 70
Mono-Hy White Sweet Spanish1
709 5.4 8.7 319 45 374 53 14 2 14 0 5 28 55 66 1.2i
WSS Storage 588 3.6 4.8 132 22 424 72 33 6 29 2 7 32 58 74 1
Nickerson 2vann NIZ 23-1028 625 1.0 1.9 178 28 399 64 48 8 58 21 38 67 82 85 0Omega 546 0.5 1.2 106 19 386 71 53 10 17 18 43 70 84 87 0.2
Petoseed PSX 1183 676 0.9 2.6 244 37 407 61 16 7 21 65 66 83 85 0.6PSX 1383 644 0.5 1.1 199 32 ' 405 63 22 5 16 4 10 42 66 77 1)P55 385 369 0.7 2.8 10 4 200 55 148 41 3 76 92 97 99 99 0
Quail-Sel Day Brothers 773 2.7 4.1 490 63-:'268 35 15 2 43 3 9 36 61 70 3EXP. 21633 558 0.7 1.9 109 20 393 70 56 10 13 30 49 70 84 85 0.4
Vanderhave VDH-85089 536 0.4 0.6 64 12 440 82 33 6 12 31 66 87 93 0
LSD .05 50 58 39 19 20LSD .01 66 76 52 25 26Mean 644 274 339 -- 34 23CV (0) 6.3 17 24 32
White Bulbs2Red Bulbs
3Highest percent neckrot observed in single replication of five replications evaluated.
Average number of bulbs bolting from counts taken in five rep lications (80 bulbs nor renlinatinnl
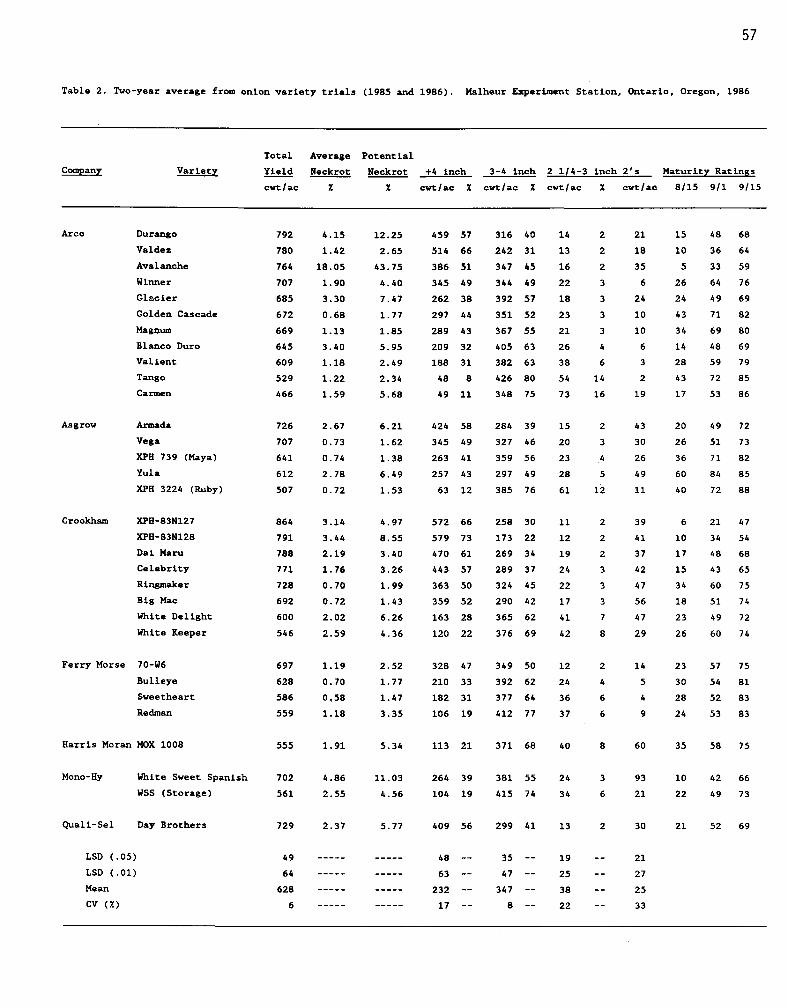
57
Table 2. Two-year average from onion variety trials (1985 and 1986). Malheur Experiment Station, Ontario, Oregon, 1986
Company Variety
Total
Yield
Average
Neckrot
Potential
Neckrot +4 inch 3-4 inch 2 1/4-3 inch 2's Maturity Ratings
cwt/ac X X cwt/ac X cwt/ac X cwt/ac X cwt/ac 8/15 9/1 9/15
Arco Durango 792 4.15 12.25 459 57 316 40 14 2 21 15 48 68
Valdez 780 1.42 2.65 514 66 242 31 13 2 18 10 36 64
Avalanche 764 18.05 43.75 386 51 347 45 16 2 35 5 33 59
Winner 707 1.90 4.40 345 49 344 49 22 3 6 26 64 76
Glacier 685 3.30 7.47 262 38 392 57 18 3 24 24 49 69
Golden Cascade 672 0.68 1.77 297 44 351 52 23 3 10 43 71 82
Magnum 669 1.13 1.85 289 43 367 55 21 3 10 34 69 80
Blanco Duro 645 3.40 5.95 209 32 405 63 26 4 6 14 48 69
Valiant 609 1.18 2.49 188 31 382 63 38 6 3 28 59 79
Tango 529 1.22 2.34 48 8 426 80 54 14 2 43 72 85
Carmen 466 1.59 5.68 49 11 348 75 73 16 19 17 53 86
Asgrow Armada 726 2.67 6.21 424 58 284 39 15 2 43 20 49 72
Vega 707 0.73 1.62 345 49 327 46 20 3 30 26 51 73
XPH 739 (Maya) 641 0.74 1.38 263 41 359 56 23 4 26 36 71 82
Yula 612 2.78 6.49 257 43 297 49 28 5 49 60 84 85
XPH 3224 (Ruby) 507 0.72 1.53 63 12 385 76 61 12 11 40 72 88
Crookham XPH-83N127 864 3.14 4.97 572 66 258 30 11 2 39 6 21 47
XPH-83N128 791 3.44 8.55 579 73 173 22 12 2 41 10 34 54
Dai Maru 788 2.19 3.40 470 61 269 34 19 2 37 17 48 68
Celebrity 771 1.76 3.26 443 57 289 37 24 3 42 15 43 65
Ringmaker 728 0.70 1.99 363 50 324 45 22 3 47 34 60 75
Big Mac 692 0.72 1.43 359 52 290 42 17 3 56 18 51 74
White Delight 600 2.02 6.26 163 28 365 62 41 7 47 23 49 72
White Keeper 546 2.59 4.36 120 22 376 69 42 8 29 26 60 74
Ferry Morse 70-W6 697 1.19 2.52 328 47 349 50 12 2 14 23 57 75
Bulleye 628 0.70 1.77 210 33 392 62 24 4 5 30 54 81
Sweetheart 586 0,58 1.47 182 31 377 64 36 6 4 28 52 83
Redman 559 1.18 3.35 106 19 412 77 37 6 9 24 53 83
Harris Moran MOX 1008 555 1.91 5.34 113 21 371 68 40 8 60 35 58 75
Mono-Hy White Sweet Spanish 702 4.86 11.03 264 39 381 55 24 3 93 10 42 66
WSS (Storage) 561 2.55 4.56 104 19 415 74 34 6 21 22 49 73
Quali-Sel Day Brothers 729 2.37 5.77 409 56 299 41 13 2 30 21 52 69
LSD (.05) 49 48 35 -- 19 21
LSD (.01) 64 63 47 -- 25 27
Mean 628 232 347 -- 38 25
CV (X) 6 17 8 22 33

Table 3. Three-year average from onion variety trials (1984, 1985 and 1986). Malheur Experiment Station, Ontario, Oregon,
Company Variety
Total
Yield
Average
Neckrot
Potential
Neckrot +4 inch 3-4 inch 2 114-3 inch 2's Maturity Ratings,
cwt/ac X Z cwt/ac X cwt/ac X cwt/ac X cwt/ac 8/15 9/1 9/15
Arco Durango 759 3.40 10.07 447 59 296 39 13 2 15 15 54 71
Valdez 753 2.45 5.57 501 67 230 31 12 2 14 9 43- 66
Avalanche 727 15.57 39.77 366 50 334 46 16 2 26 5 39 60:Winner
Glacier
691
648
1.40
2.63
3.37
6.24
343
246
50
38
325
377
47
58
20
17
3
3
4
18
36
34
69,
59
78
73Golden Cascade 646 1.25 3.14 285 44 340 53 20 3 8 53 76 86Magnum 620 2.25 5.37 267 43 334 54 23 4 8 41 74 85Blanco Duro 618 2.83 5.63 215 35 372 60 26 4 6 20 56 71
Valiant 574 0.85 1.96 176 31 361 63 36 6 2 37 66 83Tango 467 0.98 2.16 74 16 351 75 41 9. 1 35 74 87
Carmen 436 1.46 4.68 46 11 324 74 68 15 15 21 63 8%
Asgrow Armada 709 1.98 4.50 389 55 303 43 15 2 34 26 59 75
Vega 682 0.78 1.51 330 48 323 47 18 3 21 38 62 78
XPH 739 (Maya)
Yula
597
566
0.66
2.45
1.32
5.39
246
229
41
40
332
290
56
51
21
27
4
5
21
40
38
68
75
87
84,
89
Crookham
XPH 3224 (Ruby)
XPH-83N128
471
766
0.64
2,73
1.55
7.00
48
559
10
73
361
177
77
23
62
11
13
1
9
31
48
10
79,
39
90
60Dai Maru 759 2.26 5.53 447 59 276 36 16 2 28 23 56 71
Celebrity 741 1.94 4.84 444 60 267 36 19 2 30 14 48 6%Ringmaker 708 0.63 2.16 344 49 332 47 19 3 33 47 69 79
Big Mac 688 0.88 1.72 363 53 293 43 15 2 42 20 57 75
White Delight 571 2.08 6.67 152 27 357 63 41 7 36 29 58 75
White Keeper 522 1.72 2.90 114 22 363 70 39 7 22 31 65 76
Ferry Morse 70-W6 655 1.39 3.44 349 53 286 44 13 2 10 19 6Q 79Redman 522 1.32 3.73 100 19 382 73 37 7 8 31 64 85
Mono-Hy White Sweet Spanish 656 4.47 11.29 277 42 335 51 21 3 76 13 48 69
Quali-Sel
WSS (Storage)
Day Brothers
534
720
1.87
3.75
3.54
9.61
107
431
20
60
389
272
73
38
33
11
6
2
17
23
21
17
54
53
75,
71
LSD (.05) 50 52 38 18 17LSD (.01) 66 68 50 24 22Mean 601 232 327 33 20
CV (%) 6 15 8 22 33
58

ARTIFICIAL DRYING OF ONION BULBSTO IMPROVE STORAGE QUALITY
Charles E. Stanger and Joey IshidaMalheur Experiment Station, Ontario, Oregon, 1986
Purpose
Trials were initiated to compare different drying tempera-tures and times to identify optimum conditions for drying onionbulbs on a commercial scale.
Summary
Bulb yields for all varieties increased significantly whenthe harvest date was delayed until October 6. Increases in yieldwere greatest for late-maturing varieties (Avalanche, Valdez, andDai Maru). These varieties were also more susceptible toBotrytis neckrot in storage. Artificially drying the onion bulbsat harvest reduced percent neckrot and increased storage quality.Drying at 125°F for 20 minutes reduced neckrot from 19.8 to 2.1percent for onions harvested September 1 and from 9 to 2.3 percent for onions harvested October 6. Onion tissue on bulbs driedat 150° F for 80 minutes was cooked and resulted in severe lossesin storage.
Introduction
This study is a continuation of trials conducted in 1984 and1985 to evaluate the interactions between onion varieties, matu-rity, and harvest dates with yield and storage quality. Eachyear, onions from several varieties with different maturity dateswere compared for bulb yield and storage quality when harvestedon different dates and dried by electric heat before being put instorage. Each previous year, significant increases in bulbyields were measured for each variety when harvest date wasdelayed through September. Yield increases were caused by in-creases in bulb size (higher percentages of jumbo and colossal-sized bulbs). Yield increases were greatest with late-maturinglines (Avalanche, Valdez, and Dai Maru), but these lines are moresusceptible to rot infection during a long storage period. Arti-ficial drying in 1984 and 1985 resulted in a significant reduc-tion in neckrot during storage and has increased yield of market-able onions. Drying temperatures and drying periods were con-stant during trials conducted in 1984 and 1985 because of thetype of drying equipment available.
Materials and Methods Five varieties of onions (Avalanche, Valdez, Dai Maru, White
Delight, and Golden Cascade) were planted as strip plots fourrows wide and 600 feet long. Planting rates were in excess ofdesired plant populations and onions were hand-thinned to aspacing of approximately four plants per linear foot of row on
59
June 9 and 10. Further thinning to remove doubles and weeds wasdone on June 17.
The onions were sidedressed on May 26 and July 5 with 100pounds per acre of nitrogen applied each date. The nitrogensource was ammonium nitrate (May 26) and ammonium sulfate (July5).
The early harvested onions were lifted on September 1 andtopped and bagged on September 6. Artificial drying wasbegun onSeptember 15. Drying temperatures were 125 and 150°F. Dryingtimes were 10, 20, 40, and 80 minutes. Control treatments wereincluded for all temperature and time variables and all treat-ments included five replications. The early harvested and arti-ficially dried onions were put in storage without forced airventilation on September 16. The onions were stored in woodboxes used as celery crates. Each celery crate contained about50 pounds of onions.
The late-harvested onions were lifted and bagged on October6 and artificial drying began on October 9. The drying tempera-tures were 100°, 125°, and 150°F and the drying times were thesame as used in the early harvest. These onions were also placedin storage without forced air as they were removed from thedryer.
The onions were removed from storage and grading began onJanuary 12. The onions were graded and weighed by size dependingon bulb diameter: size categories were less than 2 1/4 inches, 21/4 to 3 inches, 3 to 4 inches, and greater than 4 inches. Bulbsinfected with Botrytis neckrot were weighed to determine rotweights and then sized and reweighed according to size of diam-eter to determine field yields.
Total yield by harvest date, jumbos, colossals, and percentrot were calculated. Percent storage rot was calculated andreported as a percent of total yield.
Results
Bulb yields increased for each variety as harvest date wasdelayed from September 1 to October 6 (Table 1). Average in-crease in yields was 18 percent. Avalanche and Dai Maru in-creased 31 and 20 percent respectively. These varieties arelate-maturing lines. Golden Cascade was the earliest-maturingline but continued to grow after the tops were down and yielded a13 percent increase from the growth made in September. Thepercent in colossal-sized bulbs increased from 44 to 76. Valdezhad the highest percent (88) of colossal-sized bulbs. The in-crease in bulb size from growth during September was significantfor each variety tested.
Drying onion bulbs with artificial heat before winter stor-age reduced the Botrytis neckrot significantly for all varieties.The average percent neckrot for five varieties in non-dried bulbs
60

harvested on September 1 and October 6 ranged from a high of 31to a low of 4 (Tables 2 and 3). The variety most susceptible toneckrot was Avalanche. The least amount of rot occurred withGolden Cascade.o Drying onions harvested on September 1 for 10minutes at 125°F reduced the average percent neckrot for allvarieties from 19.8 percent to 1.3 percent. When Avalanche wasdried at 125°F for 10 minutes, neckrot was reduced in the earlyharvest from 28.7 percent to 3.6 percent. A reduction in percentneckrot occurred with both increases in drying temperatures anddrying time. Among the best drying treatments were 100°F for 40minutes, 125° F for 20 to 40 minutes, and 150°F for 10 to 20minutes. Damage to onion bulbs occurred when temperature washeld at 150°F for 80 minutes. Dai Maru was more sensitive to thehigher temperature and exposure time than were the other fourvarieties. White Delight appeared to be more tolerant to dryingat high temperatures.
Clipped necks dried for short periods of time lost signif-icant amounts of moisture (Tables 4 and 5).
Conclusions
Three years of data show that bulb yields increased signif-icantly from bulb enlargement when growth was allowed throughSeptember. The greatest yield increases are noted with the late-maturing varieties, Avalanche, Dai Maru, and Valdez, but yieldincreases were also significant with the early maturing GoldenCascade variety. Bulbs continue to grow and increase in sizeeven though the tops have fallen over and as long as the topsremain green.
Data obtained from three years of study show that onionbulbs dried with artificial heat store with less neckrot at theend of storage than non-heat dried bulbs. Although it has notbeen measured, it was observed that onions artificially driedhave skins that are drier with better color compared to skins ofnon-dried bulbs. It is presumed that the drier bulbs would bebetter preserved for shipment and more appealing to customers atthe marketplace.
Further drying studies evaluating drying temperatures anddrying times are needed to identify optimum conditions for dryingcommercial onions. In addition, costs of drying onion bulbsshould be studied and compared to returns expected from dryingonion bulbs. Further trials evaluating bulb yields by harvestdate are not needed since results are conclusive and supportconsistent increases in bulb yields as harvest dates are extendedthrough September.
Acknowledgements
Funds and new drying equipment provided by the Idaho-OregonOnion Committee made the onion drying research possible.
61
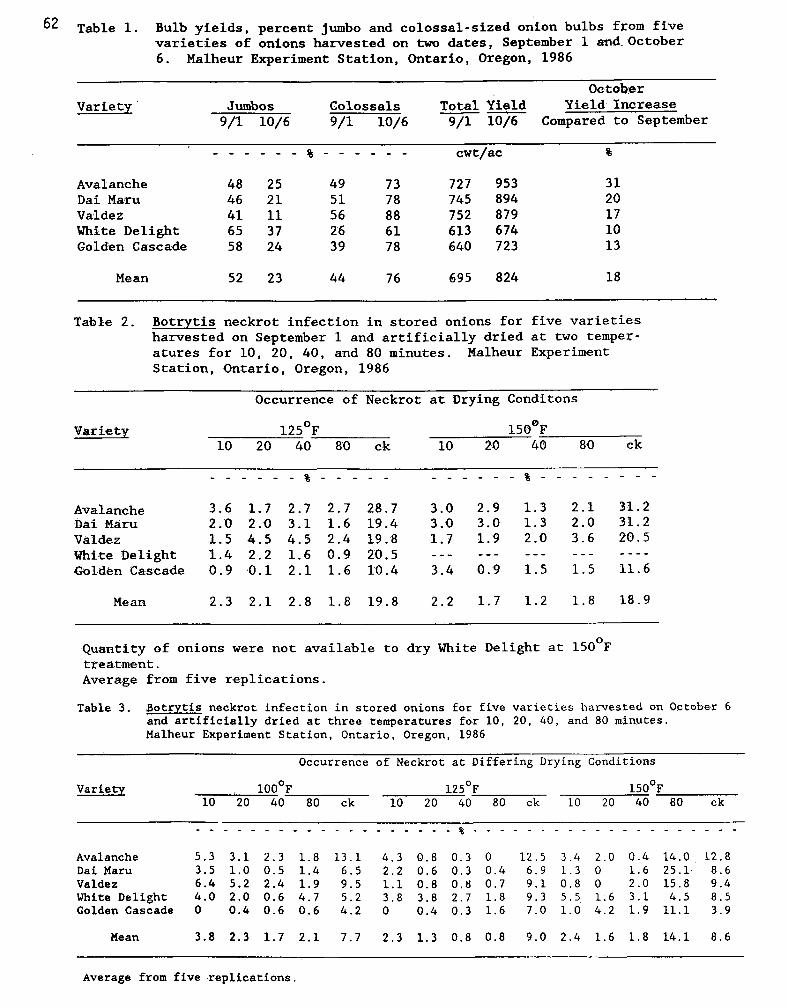
Variety
Occurrence of Neckrot at Drying Conditons
125°F 150°F 10 20 40 80 ck 10 20 40 80 ck
Avalanche 3.6 1.7 2.7 2.7 28.7 3.0 2.9 1.3 2.1 31.2Dai Maru 2.0 2.0 3.1 1.6 19.4 3.0 3.0 1.3 2.0 31.2Valdez 1.5 4.5 4.5 2.4 19.8 1.7 1.9 2.0 3.6 20.5White Delight 1.4 2.2 1.6 0.9 20.5Golden Cascade 0.9 0.1 2.1 1.6 10.4 3.4 0.9 1.5 1.5 11.6
Mean 2.3 2.1 2.8 1.8 19.8 2.2 1.7 1.2 1.8 18.9
62 Table 1. Bulb yields, percent jumbo and colossal-sized onion bulbs from fivevarieties of onions harvested on two dates, September 1 and October6. Malheur Experiment Station, Ontario, Oregon, 1986
OctoberVariety
Jumbos Colossals Total Yield Yield Increase 9/1 10/6 9/1 10/6 9/1 10/6 Compared to September
cwt/ac
Avalanche 48 25 49 73 727 953 31Dai Maru 46 21 51 78 745 894 20Valdez 41 11 56 88 752 879 17White Delight 65 37 26 61 613 674 10Golden Cascade 58 24 39 78 640 723 13
Mean 52 23 44 76 695 824 18
Table 2. Botrytis neckrot infection in stored onions for five varietiesharvested on September 1 and artificially dried at two temper-atures for 10, 20, 40, and 80 minutes. Malheur ExperimentStation, Ontario, Oregon, 1986
Quantity of onions were not available to dry White Delight at 150°Ftreatment.Average from five replications.
Table 3. Botrytis neckrot infection in stored onions for five varieties harvested on October 6and artificially dried at three temperatures for 10, 20, 40, and 80 minutes.Malheur Experiment Station, Ontario, Oregon, 1986
Occurrence of Neckrot at Differing Drying Conditions
Variety 100°F 125°F 150°F 10 20 40 80 ck 10 20 40 80 ck 10 20 40 80 ck
Avalanche 5.3 3.1 2.3 1.8 13.1 4.3 0.8 0.3 0 12.5 3.4 2.0 0.4 14.0 12.8Dai Maru 3.5 1.0 0.5 1.4 6.5 2.2 0.6 0.3 0.4 6.9 1.3 0 1.6 25.1 8.6Valdez 6.4 5.2 2.4 1.9 9.5 1.1 0.8 0.8 0.7 9.1 0.8 0 2.0 15.8 9.4White Delight 4.0 2.0 0.6 4.7 5.2 3.8 3.8 2.7 1.8 9.3 5.5 1.6 3.1 4.5 8.5Golden Cascade 0 0.4 0.6 0.6 4.2 0 0.4 0.3 1.6 7.0 1.0 4.2 1.9 11.1 3.9
Mean 3.8 2.3 1.7 2.1 7.7 2.3 1.3 0.8 0.8 9.0 2.4 1.6 1.8 14.1 8.6
Average from five replications.
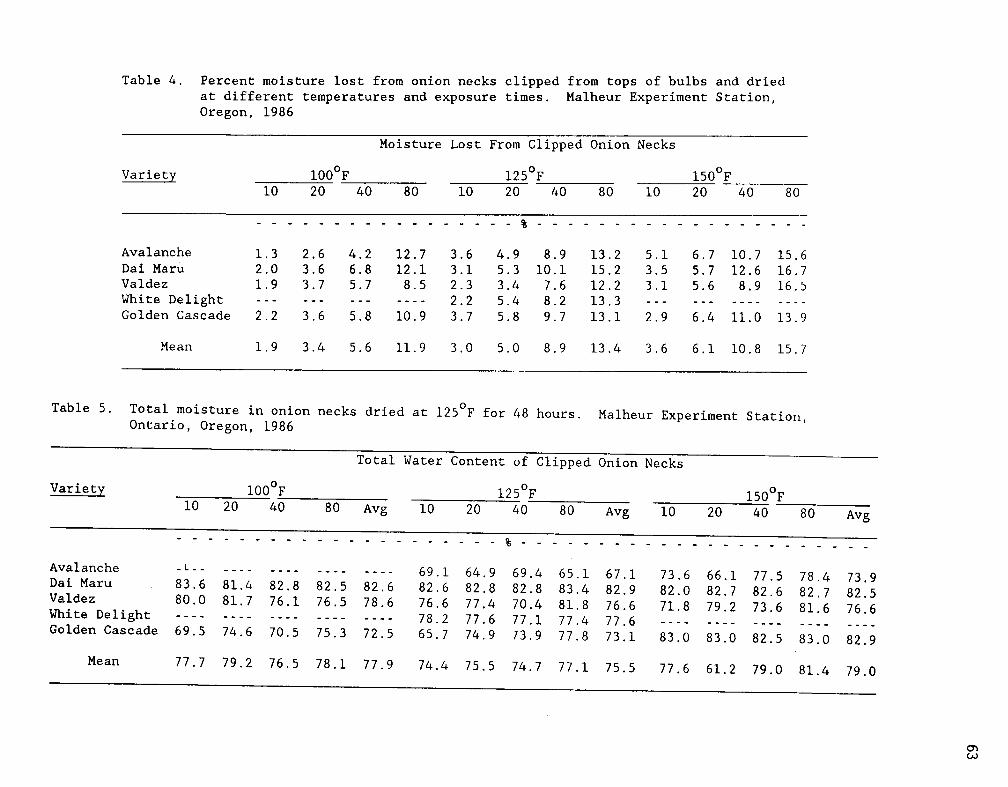
Table 4. Percent moisture lost from onion necks clipped from tops of bulbs and driedat different temperatures and exposure times. Malheur Experiment Station,Oregon, 1986
Variety
Moisture Lost From Clipped Onion Necks
100°F 125°F 150°F 10 20 40 80 10 20 40 80 10 20 40 80
Avalanche 1.3 2.6 4.2 12.7 3.6 4.9 8.9 13.2 5.1 6.7 10.7 15.6Dai Maru 2.0 3.6 6.8 12.1 3.1 5.3 10.1 15.2 3.5 5.7 12.6 16.7Valdez 1.9 3.7 5.7 8.5 2.3 3.4 7.6 12.2 3.1 5.6 8.9 16.5White Delight 2.2 5.4 8.2 13.3Golden Cascade 2.2 3.6 5.8 10.9 3.7 5.8 9.7 13.1 2.9 6.4 11.0 13.9
Mean 1.9 3.4 5.6 11.9 3.0 5.0 8.9 13.4 3.6 6.1 10.8 15.7
Table 5. Total moisture in onion necks dried at 125°F for 48 hours. Malheur Experiment Station,Ontario, Oregon, 1986
Variety
Total Water Content of Clipped Onion Necks
100°F 125 °F 150°F 10 20 40 80 Avg 10 20 40 80 Avg 10 20 40 80 Avg
Avalanche 69.1 64.9 69.4 65.1 67.1 73.6 66.1 77.5 78.4 73.9Dai Maru 83.6 81.4 82.8 82.5 82.6 82.6 82.8 82.8 83.4 82.9 82.0 82.7 82.6 82.7 82.5Valdez 80.0 81.7 76.1 76.5 78.6 76.6 77.4 70.4 81.8 76.6 71.8 79.2 73.6 81.6 76.6White Delight ---- 78.2 77.6 77.1 77.4 77.6Golden Cascade 69.5 74.6 70.5 75.3 72.5 65.7 74.9 73.9 77.8 73.1 83.0 83.0 82.5 83.0 82.9
Mean 77.7 79.2 76.5 78.1 77.9 74.4 75.5 74.7 77.1 75.5 77.6 61.2 79.0 81.4 79.0
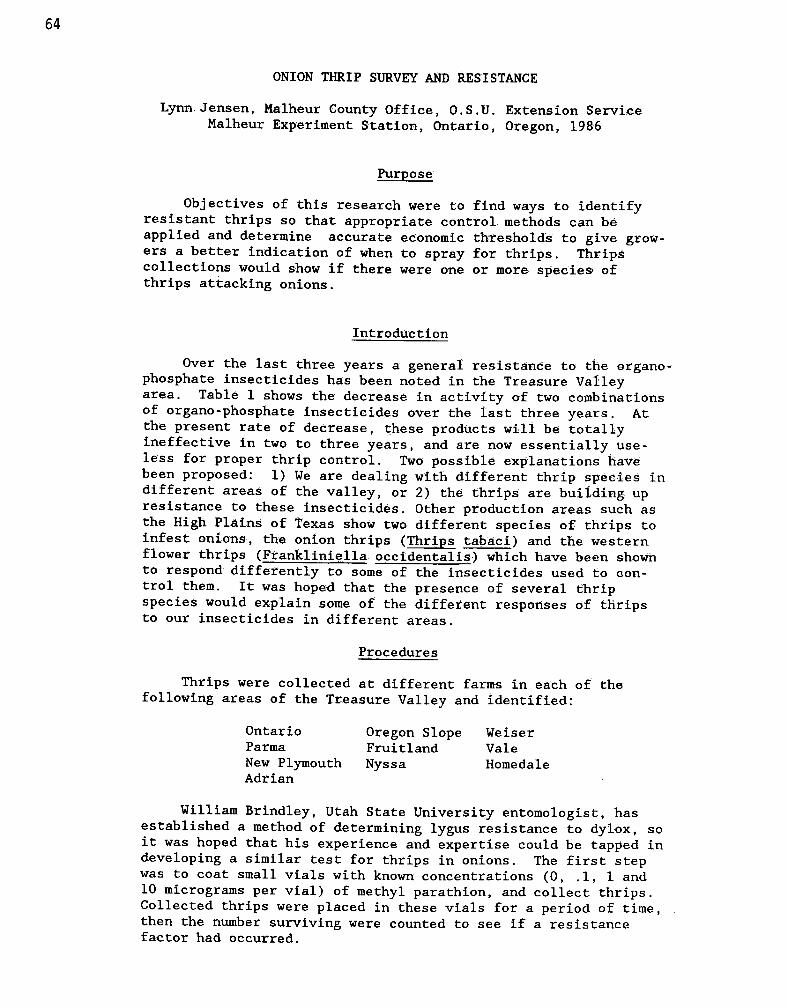
ONION THRIP SURVEY AND RESISTANCE
Lynn. Jensen, Malheur County Office, O.S.U. Extension ServiceMalheur Experiment Station, Ontario, Oregon, 1986
Purpose
Objectives of this research were to find ways to identifyresistant thrips so that appropriate control methods can beapplied and determine accurate economic thresholds to give grow-ers a better indication of when to spray for thrips. Thripscollections would show if there were one or more species ofthrips attacking onions.
Introduction
Over the last three years a general resistance to the organo-phosphate insecticides has been noted in the Treasure Valleyarea. Table 1 shows the decrease in activity of two combinationsof organo-phosphate insecticides over the last three years. Atthe present rate of decrease, these products will be totallyineffective in two to three years, and are now essentially use-less for proper thrip control. Two possible explanations havebeen proposed: 1) We are dealing with different thrip species indifferent areas of the valley, or 2) the thrips are building upresistance to these insecticides. Other production areas such asthe High Plains of Texas show two different species of thrips toinfest onions, the onion thrips (Thrips tabaci) and the westernflower thrips (Frankliniella occidentalis) which have been shownto respond differently to some of the insecticides used to con-trol them. It was hoped that the presence of several thripspecies would explain some of the different responses of thripsto our insecticides in different areas.
Procedures
Thrips were collected at different farms in each of thefollowing areas of the Treasure Valley and identified:
Ontario Oregon Slope WeiserParma Fruitland ValeNew Plymouth Nyssa HomedaleAdrian
William Brindley, Utah State University entomologist, hasestablished a method of determining lygus resistance to dylox, soit was hoped that his experience and expertise could be tapped indeveloping a similar test for thrips in onions. The first stepwas to coat small vials with known concentrations (0, .1, 1 and10 micrograms per vial) of methyl parathion, and collect thrips.Collected thrips were placed in these vials for a period of time,then the number surviving were counted to see if a resistancefactor had occurred.
64
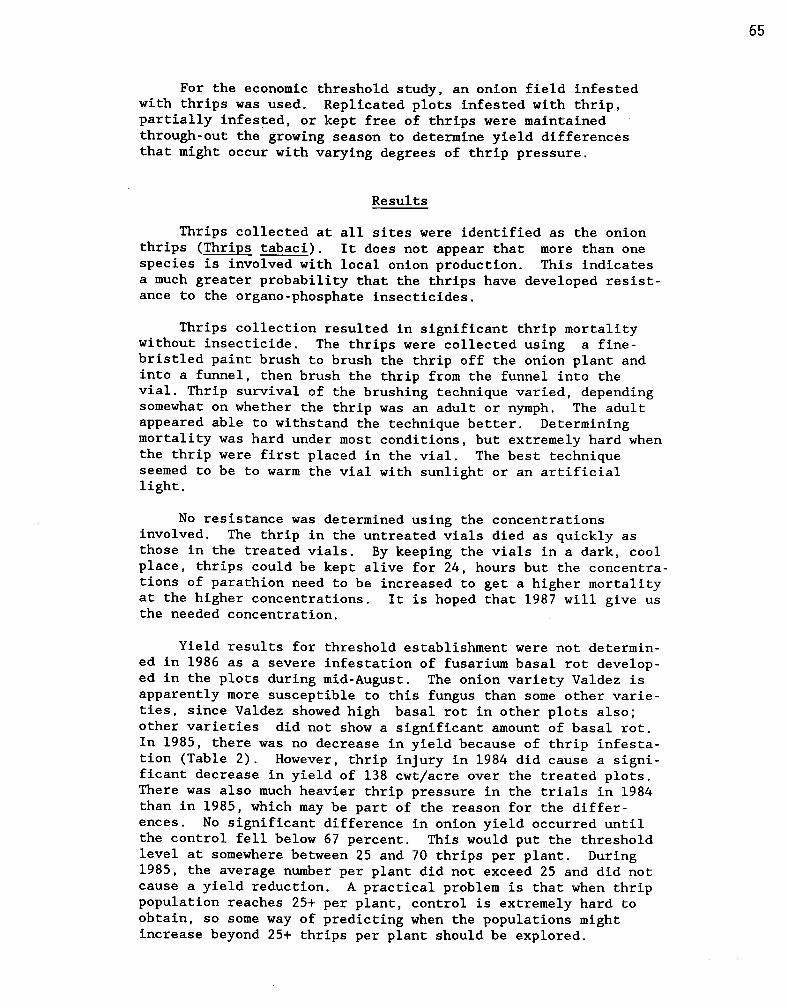
For the economic threshold study, an onion field infestedwith thrips was used. Replicated plots infested with thrip,partially infested, or kept free of thrips were maintainedthrough-out the growing season to determine yield differencesthat might occur with varying degrees of thrip pressure.
Results
Thrips collected at all sites were identified as the onionthrips (Thrips tabaci). It does not appear that more than onespecies is involved with local onion production. This indicatesa much greater probability that the thrips have developed resist-ance to the organo-phosphate insecticides.
Thrips collection resulted in significant thrip mortalitywithout insecticide. The thrips were collected using a fine-bristled paint brush to brush the thrip off the onion plant andinto a funnel, then brush the thrip from the funnel into thevial. Thrip survival of the brushing technique varied, dependingsomewhat on whether the thrip was an adult or nymph. The adultappeared able to withstand the technique better. Determiningmortality was hard under most conditions, but extremely hard whenthe thrip were first placed in the vial. The best techniqueseemed to be to warm the vial with sunlight or an artificiallight.
No resistance was determined using the concentrationsinvolved. The thrip in the untreated vials died as quickly asthose in the treated vials. By keeping the vials in a dark, coolplace, thrips could be kept alive for 24, hours but the concentra-tions of parathion need to be increased to get a higher mortalityat the higher concentrations. It is hoped that 1987 will give usthe needed concentration.
Yield results for threshold establishment were not determin-ed in 1986 as a severe infestation of fusarium basal rot develop-ed in the plots during mid-August. The onion variety Valdez isapparently more susceptible to this fungus than some other varie-ties, since Valdez showed high basal rot in other plots also;other varieties did not show a significant amount of basal rot.In 1985, there was no decrease in yield because of thrip infesta-tion (Table 2). However, thrip injury in 1984 did cause a signi-ficant decrease in yield of 138 cwt/acre over the treated plots.There was also much heavier thrip pressure in the trials in 1984than in 1985, which may be part of the reason for the differ-ences. No significant difference in onion yield occurred untilthe control fell below 67 percent. This would put the thresholdlevel at somewhere between 25 and 70 thrips per plant. During1985, the average number per plant did not exceed 25 and did notcause a yield reduction. A practical problem is that when thrippopulation reaches 25+ per plant, control is extremely hard toobtain, so some way of predicting when the populations mightincrease beyond 25+ thrips per plant should be explored.
65
Conclusions
1 The organo-phophate insecticides' effectiveness in con-trolling onion thrips has continually lessened over thelast three years.
2 All thrips infesting onions in the Treasure Valley areaduring 1986 appeared to be onion thrips (Thrips tabaci).
3 There was a significant yield reduction of 138 cwt/acrein 1984 from thrips but no reduction in 1985.
4 Preliminary results indicate that the economic thresholdfor onion thrip populations may lie between 25 and 60thrips per plant.
66
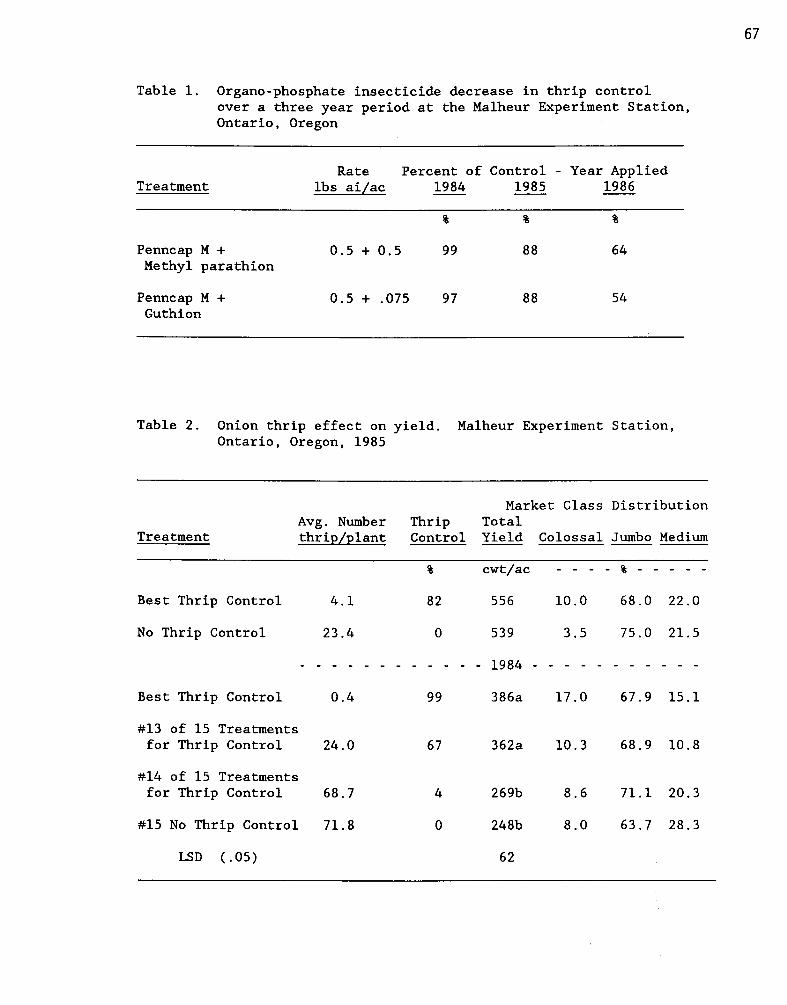
Table 1. Organo-phosphate insecticide decrease in thrip controlover a three year period at the Malheur Experiment Station,Ontario, Oregon
Rate Percent of Control - Year AppliedTreatment
lbs ai/ac 1984 1985 1986
Penncap M + 0.5 + 0.5 99 88 64Methyl parathion
Penncap M + 0.5 + .075 97 88 54Guthion
Table 2. Onion thrip effect on yield. Malheur Experiment Station,Ontario, Oregon, 1985
Market Class DistributionAvg. Number Thrip Total
Treatment thrip/plant Control Yield Colossal Jumbo Medium
cwt/ac - - - - %
Best Thrip Control 4.1 82 556 10.0 68.0 22.0
No Thrip Control 23.4 0 539 3.5 75.0 21.5
1984
Best Thrip Control 0.4 99 386a 17.0 67.9 15.1
#13 of 15 Treatmentsfor Thrip Control 24.0 67 362a 10.3 68.9 10.8
#14 of 15 Treatmentsfor Thrip Control 68.7 4 269b 8.6 71.1 20.3
#15 No Thrip Control 71.8 0 248b 8.0 63.7 28.3
LSD (.05) 62
67

ONION PLANT DENSITY AND ROW SPACING TO OBTAINTHE HIGHEST MARKETABLE YIELD AND GROSS RETURN
Clinton C. Shock and Tim StieberMalheur Experiment Station, Ontario, Oregon, 1986
PURPOSE
The objective of this research is to determine the plantpopulations and row spacings that result in the best marketableyields and gross crop value per acre. This study was designed todiscover the best target populations that growers should shootfor when they plant their onion seed.
Summary
Four Yellow Sweet Spanish onion varieties were grown atincreasing plant densities from 2 to 16 plants per foot of bed.Onions were harvested and graded to determine the highest yields,highest yields of jumbo onions, and best gross dollar returns.Populations that produced the highest yields of jumbo onions were8 onions per foot of bed for the Golden Cascade variety, 10onions per foot for Vega, and 12 onions per foot for Valdez andDai Maru. Plant populations that resulted in the best grossreturn per acre were higher than the populations with the mostjumbo onion yields. Best gross returns were at 10 to 12 onionsper foot of bed for Golden Cascade and Vega and 14 to 16 onionsper foot of bed for Valdez and Dai Maru.
Introduction
Onion producers understand that spotty stands lead to a highproportion of colossal onions (onions with diameters greater thanfour inches), many split double onions, and reduced yields, Con-versely, when onion stands are excessive, the average size ofonions is relatively small and economic returns are reduced.
The economic value of Yellow Sweet Spanish onion productionin the Treasure Valley is in the "jumbo" market class (onionsgreater than three inches in diameter). Smaller sizes of onionsare produced competitively at locations nearer major onion mar-kets in the east, south, and west.
A number of studies have been conducted in other productionareas of the United States on the effects of onion plant densityand spacing between rows on marketable yields of onions. Pre-vious work has not been designed to maximize the yields of jumboonions but to maximize yields of onions 2 1/4 inches and larger.Those studies were conducted in environments not directly appli-cable to the Treasure Valley.
68
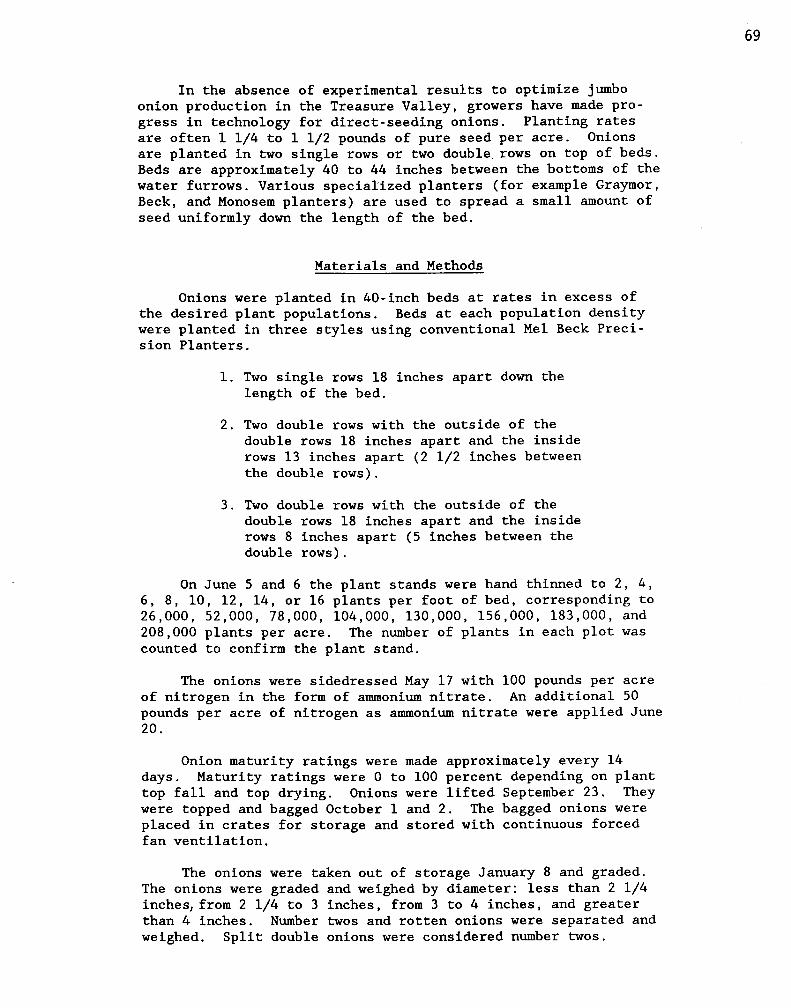
In the absence of experimental results to optimize jumboonion production in the Treasure Valley, growers have made pro-gress in technology for direct-seeding onions. Planting ratesare often 1 1/4 to 1 1/2 pounds of pure seed per acre. Onionsare planted in two single rows or two double, rows on top of beds.Beds are approximately 40 to 44 inches between the bottoms of thewater furrows. Various specialized planters (for example Graymor,Beck, and Monosem planters) are used to spread a small amount ofseed uniformly down the length of the bed.
Materials and Methods
Onions were planted in 40-inch beds at rates in excess ofthe desired plant populations. Beds at each population densitywere planted in three styles using conventional Mel Beck Preci-sion Planters.
1. Two single rows 18 inches apart down thelength of the bed.
2. Two double rows with the outside of thedouble rows 18 inches apart and the insiderows 13 inches apart (2 1/2 inches betweenthe double rows).
3. Two double rows with the outside of thedouble rows 18 inches apart and the insiderows 8 inches apart (5 inches between thedouble rows).
On June 5 and 6 the plant stands were hand thinned to 2, 4,6, 8, 10, 12, 14, or 16 plants per foot of bed, corresponding to26,000, 52,000, 78,000, 104,000, 130,000, 156,000, 183,000, and208,000 plants per acre. The number of plants in each plot wascounted to confirm the plant stand.
The onions were sidedressed May 17 with 100 pounds per acreof nitrogen in the form of ammonium nitrate. An additional 50pounds per acre of nitrogen as ammonium nitrate were applied June20.
Onion maturity ratings were made approximately every 14days. Maturity ratings were 0 to 100 percent depending on planttop fall and top drying. Onions were lifted September 23. Theywere topped and bagged October 1 and 2. The bagged onions wereplaced in crates for storage and stored with continuous forcedfan ventilation.
The onions were taken out of storage January 8 and graded.The onions were graded and weighed by diameter: less than 2 1/4inches, from 2 1/4 to 3 inches, from 3 to 4 inches, and greaterthan 4 inches. Number twos and rotten onions were separated andweighed. Split double onions were considered number twos.
69

Total yield, total jumbos (> 3-inch diameter), percent jum-bos, percent rot, and percent loss were calculated for eachvariety, row spacing, and plant density treatment. Percent lossincluded all sources of loss from harvest through grading. Loss-es included loss of moisture, dirt, and rot before and duringstorage.
Gross economic returns were calculated by crediting mediumpackout with $4 per hundredweight and jumbo packout with $8 perhundredweight. No credit was calculated for small onions, doubleonions, or rotten onions.
Effects of Varieties
By early August the tops of Golden Cascade started to fallover as in 1985. Vega, Dai Maru, and Valdez followed (Table 1).By harvest all varieties were mature if not completely dry.
The varieties differed greatly in total yield, in totaljumbo yield, in their tendency to produce doubles, and otherfactors (Table 2). Golden Cascade was the least productive ofthe four varieties, averaging 641 cwt/acre. Dai Maru was themost productive variety, averaging 755 cwt/acre. Dai Maru hadthe greatest production of doubles. Variety lateness to maturityappeared to be related to yield (Table 1).
Effects of Plant Density
The number of onions per foot of bed directly effected on-ion maturity, yield, market class size distribution, and quali-ty. As the density increased from 2 to 16 plants per foot ofbed, the onion necks were considerably thinner, and the tops fellover sooner and dried earlier.
Average total yields increased from 377 to 826 cwt/acre asplants per foot increased from 2 to 16 bulbs per foot (Table 3).Onions at 2 bulbs per foot of bed produced 2 percent small andmedium onions and 98 percent jumbo onions. However, 12.7 percentof the total yield at 2 bulbs per foot were doubles. In con-trast, at 16 bulbs per foot, onions averaged 69 percent jumbosand only 0.4 percent doubles. Doubles clearly decreased withincreased plant density (Table 4, Figure 3).
Interaction of Density with Variety
Varieties and plant density showed strong interaction ef-fects on total yield, market class distribution, doubles, androt. Valdez and Dai Maru showed the greatest yield and jumboyield enhancements with increased plant density (Table 5, Figures1 and 2).
70

All varieties had increased proportions of small and mediumonions and decreased proportions of colossal onions with in-creased plant density. The surprising result from the 1986 cropis that these four varieties had the same plant populations formaximal yields of jumbo onions as in 1985 (Table 6). The highestyields of jumbo Golden Cascade onions, 652 cwt/acre, occurred at8 plants per foot of bed. Vega had its highest yields, 787cwt/acre, at 12 plants per foot of bed, but had maximum yields ofjumbo onions, 621 cwt/acre, at 10 plants per foot of bed. Incontrast, Dai Maru and Valdez produced the greatest yield ofjumbo onions (804 and 752 cwt/acre respectively) at 12 plants perfoot of bed.
Gross Return Per Acre
Gross dollar return per acre is influenced by plant popula-tion and the relative price of jumbo and medium onions. Econom-ic penalties for low plant populations were severe in 1986.Gross return was best for our arbitrary prices at plant popula-tions slightly above those that produced the greatest yields ofjumbo onions (Table 7 and Figure 5).
Effects of Row Spacings
In review, the onions were either planted in two single rows18 inches apart on the 40-inch beds, or the onions were plantedin two double rows. Double rows were 2.5 or 5 inches apart. Theeffects of row spacings were far less than effects of plantdensity.
Planting in double rows appeared to enhance total yields atthe highest plant densities (Table 8). The total yield of jumboswas effected little by row spacings independent of density.Planting two single rows per bed resulted in larger proportionsof double onions than planting two double rows in 1985, but hadno effect on double onion production in 1986.
Conclusions
1. Highest yields of jumbo onions were obtained at lowerpopulations for earlier varieties. Top yields of jumboonions were Golden Cascade at 8 onions, Vega at 10onions, and Valdez and Dai Maru at 12 onions per footof 40-inch bed.
2. If jumbo onions are twice as valuable as medium onions,best gross returns were obtained with 10 to 12 onionsper foot of bed for Golden Cascade and Vega and 14 to16 onions per foot of bed for Valdez and Dai Maru.
3. Double onions were very common at low onion populationsand reduced at higher populations.
71

4. Two double rows on a 40-inch bed is just as good orbetter than two single rows on the same bed.
Discussions
Grower choices of variety, planting density, and rowspacings impact onion yield, market class, quality, and economicreturns. The large economic responses to changes in plant popu-lation observed justify intensive care to seed bed preparation,planting, and seedling emergence. Any advances toward precisionplanting will not only save seed but result in greater profits togrowers.
Acknowledgments
This research was supported by resources provided by theIdaho-Eastern Onion Growers and Oregon State University. EricEldredge assisted with the planting and Charles Burnett and JoeyIshida assisted with the onion grading. Seed of the four onionvarieties was provided by Asgrow, Crookham, and Arco SeedCompanies.
72
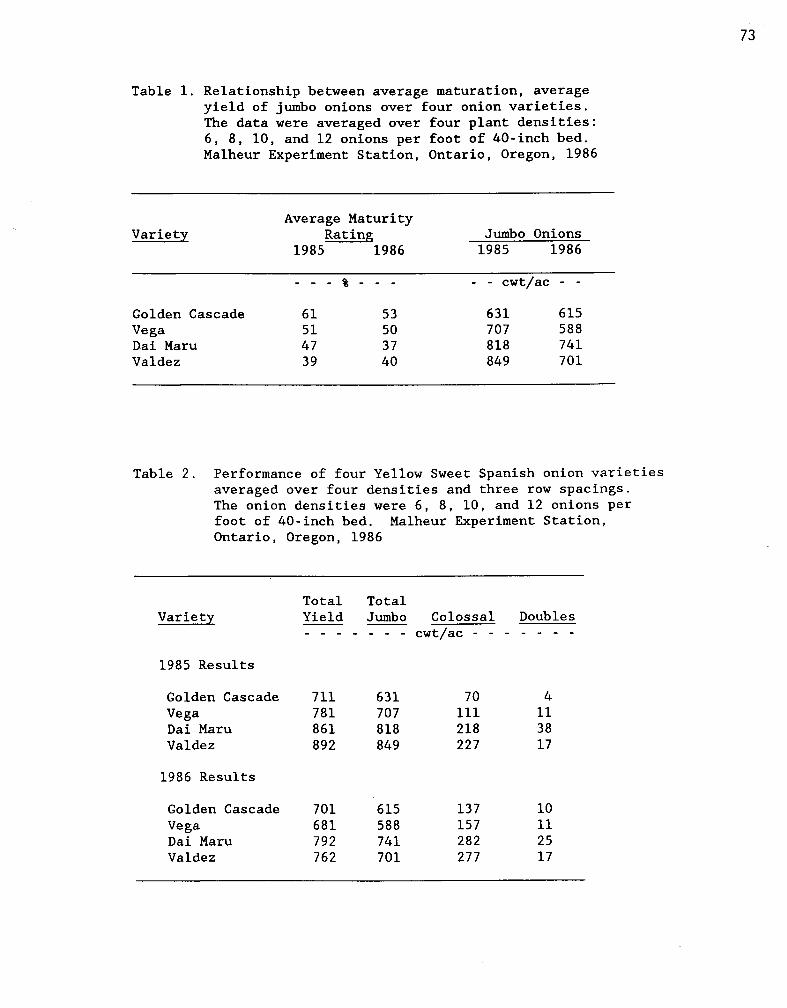
Table 1. Relationship between average maturation, averageyield of jumbo onions over four onion varieties.The data were averaged over four plant densities:6, 8, 10, and 12 onions per foot of 40-inch bed.Malheur Experiment Station, Ontario, Oregon, 1986
Average MaturityVariety Rating Jumbo Onions
1985 1986 1985 1986
- - cwt/ac - -
Golden Cascade 61 53 631 615Vega 51 50 707 588Dai Maru 47 37 818 741Valdez 39 40 849 701
Table 2. Performance of four Yellow Sweet Spanish onion varietiesaveraged over four densities and three row spacings.The onion densities were 6, 8, 10, and 12 onions perfoot of 40-inch bed. Malheur Experiment Station,Ontario, Oregon, 1986
Total TotalVariety Yield Jumbo Colossal Doubles
cwt/ac
1985 Results
Golden Cascade 711 631 70 4Vega 781 707 111 11Dai Maru 861 818 218 38Valdez 892 849 227 17
1986 Results
Golden Cascade 701 615 137 10Vega 681 588 157 11Dai Maru 792 741 282 25Valdez 762 701 277 17
73

Table 3. Average total yield response of Yellow Sweet Spanishonions to increasing plant populations. MalheurExperiment Station, Ontario, Oregon, 1986
Population Variety
Onions per Golden Dai
foot of 40-inch Plants per Cascade Vega Maru Valdez Averagebed acre cwt/ac
2 26,00Q 394 362 403 362 377
4 52,000 429 537 598 565 534
6 78,000 587 572 705 649 615
8 104,00Q 710 645 801 755 725
10 130,000 735 719 761 781 752
12 156,000 775 787 900 863 833
14 182,000 742 627 930 870 807
16 208,000 763 624 939 910 826Average 641 609 755 719 684
Table 4. The effects of plant .density on the yield, size distribution, and loss averaged over fourYellow Sweet Spanish onion varieties. Malheur Experiment Station, Ontario, Oregon, 1986
Plant Densities Onion Yields by Market Class Jumbo distribution
Plants per foot Plants per Small Medium Jumbo Total Crop Doubles Jumbo Colossalof 40-inch bed acre <2.25" loss 3-4" >4"
cwt/ac cwt/ac - - - cwt/ac - -
2 26,000
4 52,000
6 78,000
8 104,000
10 130,000
12 156,000
14 182,000
16 208,000Average
7 369 377 15 48 57 312
8 525 534 13 38 142 383
3 24 589 616 14 13 310 279
4 42 679 725 11 • 14 411 268
5 77 670 752 V 10 10
493 177
7 130 696 833 13 8
569 127
12 169 626 807 9 5
543 83
18 237 571 826 10 3
504 67
6 87 591 684 12 17
379 212

75
Table 5. The effects of plant density on the yields, size distribution, and loss of four Yellow
Sweet Spanish onion varieties. Malheur Experiment Station, Ontario, Oregon, 1986
Varieties
Plant Densities Onion Yields by Market Class
Jumbo distributio
Plants per foot Plants per Small Medium Jumbo Total Crop Doubles Jumbo Colossa
of 40-inch bed acre <2.25" 2.25-3" >3" loss 3-4" > 4"
cwt/ac X cwt/ac - - - - cwt/ac - -
Golden Cascade 2 26,000 1 23 370 394 16 29 115 255
4 52,000 0 16 413 429 11 10 193 220
6 78,000 6 26 555 587 11 5 356 199
8 104,000 5 52 652 709 9 3 487 165
10 130,000 4 88 642 734 11 2 527 115
12 156,000 5 158 611 774 9 0 542 69
14 182,000 16 178 547 741 13 2 504 43
16 208,000 18 269 476 763 13 1 454 22
Average 2 101 533 641 12 6 397 136
Vega 2 26,000 1 4 357 362 14 51 37 320
4 52,000 1 6 530 537 9 30 157 373
6 78,000 2 27 543 572 12 12 323 220
8 104,000 3 53 589 645 9 14 363 226
10 130,000 5 93 621 719 9 12 505 116
12 156,000 13 177 597 787 17 6 530 67
14 182,000 14 211 401 627 8 2 379 22
16 208,000 32 307 285 624 9 0 271 14
Average 9 110 490 609 11 16 320 170
Dai Maru 2 26,000 0 3 400 403 13 73 35 365
4 52,000 0 5 593 598 13 80 113 480
6 78,000 3 28 675 705 6 33 295 380
8 104,000 2 32 767 801 7 26 422 345
10 130,000 4 41 716 761 3 22 490 226
12 156,000 5 91 804 900 5 19 627 177
14 182,000 12 149 770 930 5 8 653 117
16 208,000 12 196 731 939 4 4 646 85
Average 5 68 682 755 7 33 410 272
Valdez 2 26,000 0 3 359 362 19 35 65 294
4 52,000 1 4 560 565 24 31 96 464
6 78,000 1 18 630 649 21 15 265 365
8 104,000 4 31 720 755 17 13 393 327
10 130,000 5 74 702 781 13 8 462 240
12 156,000 6 105 752 863 17 8 577 175
14 182,000 7 155 708 870 10 6 575 133
16 208,000 17 187 706 910 12 7 555 151
Average 5 72 642 719 17 12 373 269

76
Table 6. Summary of the plant density for each variety that resultedin the highest yield of jumbo Yellow Sweet Spanish onions.Malheur Experiment Station, Ontario, Oregon, 1986
1985Plants per
foot of 40-inchTotalJumbo
1986Plants per
foot of 40-inchTotalJumbo
Variety bed >3" bed >3"Number cwt/ac Number cwt/ac
Golden Cascade 8 676 8 652Vega 10 725 10 621Dai Maru 12 876 12 8Q4Valdez 12 903 12 752

77
for four Yellow Sweet Spanish onion varietiesat increasing plant populations. Malheur ExperimentStation, Ontario, Oregon 1986.
Gross ReturnVariety Plants per foot Medium Jumbo Total
of 40-inch bed - - - - $/ac
Golden Cascade 2 166 2074 22404 119 2876 29956 188 3917 41058 378 4719 5097
10 625 4592 521712 1161 4433 559414 1241 3849 509016 1854 3356 5210
Vega 2 29 2116 21454 49 3661 37106 189 3756 39458 381 4185 4566
10 670 4492 516212 1106 3768 487414 1563 2948 451116 2258 2083 4341
Dai Maru 2 24 2274 22984 37 3578 36156 204 4835 50398 237 5511 5748
10 321 5360 568112 693 5972 666514 1130 5816 694616 1511 5598 7109
Valdez 2 19 2105 21244 28 3223 32516 116 3792 39088 196 4671 4867
10 515 4831 534612 713 4909 562214 1110 5074 618416 1300 4994 6294
1 Gross returns are based on graded packout yields with rotand double onions removed. Medium onions were given thevalue of $4 per cwt and jumbos were valued at $8 per cwt.

Table 8. Interaction effects of row spacings and plantdensities on the yield performance of Yellow SweetSpanish onions. Malheur Experiment Station,Ontario, Oregon, 1986
Plant density inPlants per foot of 40-inch bed
Row Spacing 2 4 6 8 10 12 14 16 Total Yield, cwt/ac
2 single rows 384 515 616 718 722 800 -
2 double rows 375 563 629 752 772 828 802 8042.5" apart
2 double rows 367 545 583 686 718 85S 835 --
5" apart
Table 9. Interaction effects of row spacings an4 Plantdensities on the yield of doub le YellOw SweeSpanish onions. Malheur gxPeriMent Station,Ontario, Oregpn, 1986
Plant density inPlants per foot of 40-inch bed
Row Spacing 2 4 6 8 10 12 14 lb Doubles, cwt/ac
2 single rows 47 43 12 20 6 12 ---
2 double rows 41 21 14 14 12 9 4 12.5" apart
2 double rows 52 40 10 11 5 2 65" apart
78
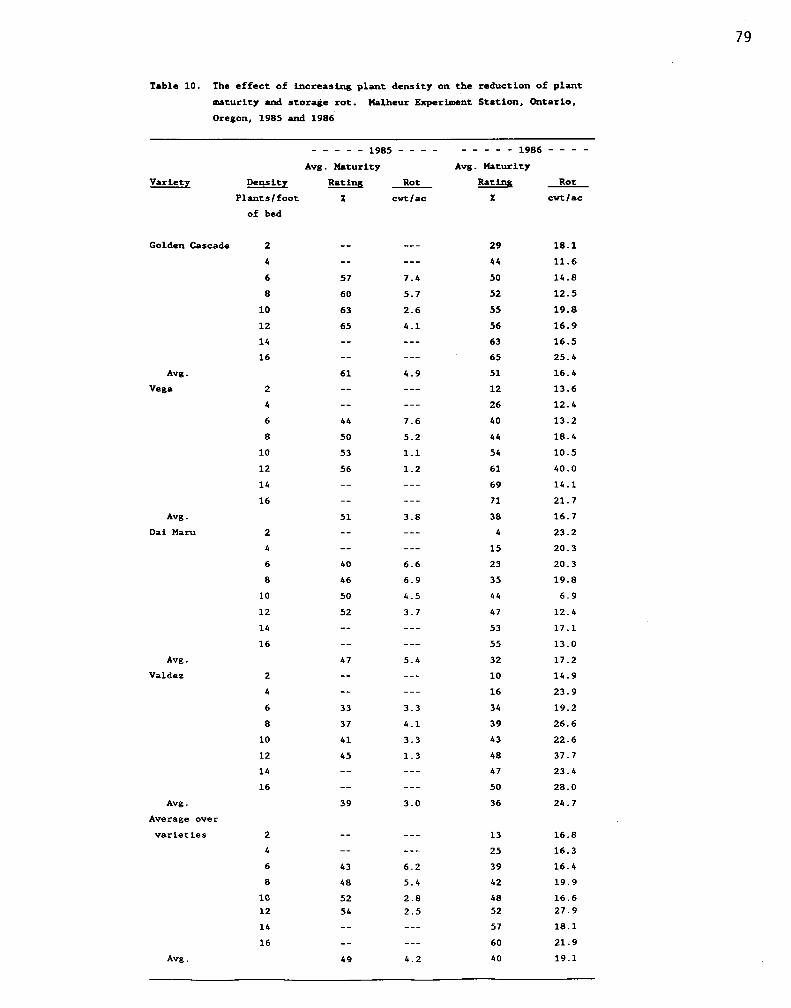
Table 10. The effect of increasing plant density on the reduction of plant
maturity and storage rot. Malheur Experiment Station, Ontario,
Oregon, 1985 and 1986
1985 1986 - - - -
Avg. Maturity Avg. Maturity
Variety Density Rating Rot Rating Rot
Plants/foot X cwt/ac X cvt/ac
of bed
Golden Cascade 2 29 18.1
4 -- --- 44 11.6
6 57 7.4 50 14.8
8 60 5.7 52 12.5
10 63 2.6 55 19.8
12 65 4.1 56 16.9
14 --- 63 16.5
16 65 25.4
Avg. 61 4.9 51 16.4
Vega 2 12 13.6
4 -- --- 26 12.4
6 44 7.6 40 13.2
8 50 5.2 44 18.4
10 53 1.1 54 10.5
12 56 1.2 61 40.0
14 --- 69 14.1
16 71 21.7
Avg. 51 3.8 38 16.7
Dai Maru 2 4 23.2
4 15 20.3
6 40 6.6 23 20.3
8 46 6.9 35 19.8
10 50 4.5 44 6.9
12 52 3.7 47 12.4
14 -- 53 17.1
16 55 13.0
Avg. 47 5.4 32 17.2
Valdez 2 10 14.9
4 16 23.9
6 33 3.3 34 19.2
8 37 4.1 39 26.6
10 41 3.3 43 22.6
12 45 1.3 48 37.7
14 47 23.4
16 -- 50 28.0
Avg. 39 3.0 36 24.7
Average over
varieties 2 13 16.8
4 --- 25 16.3
6 43 6.2 39 16.4
8 48 5.4 42 19.9
10 52 2.8 48 16.612 54 2.5 52 27.9
14 -- 57 18.1
16 60 21.9
Avg. 49 4.2 40 19.1
79
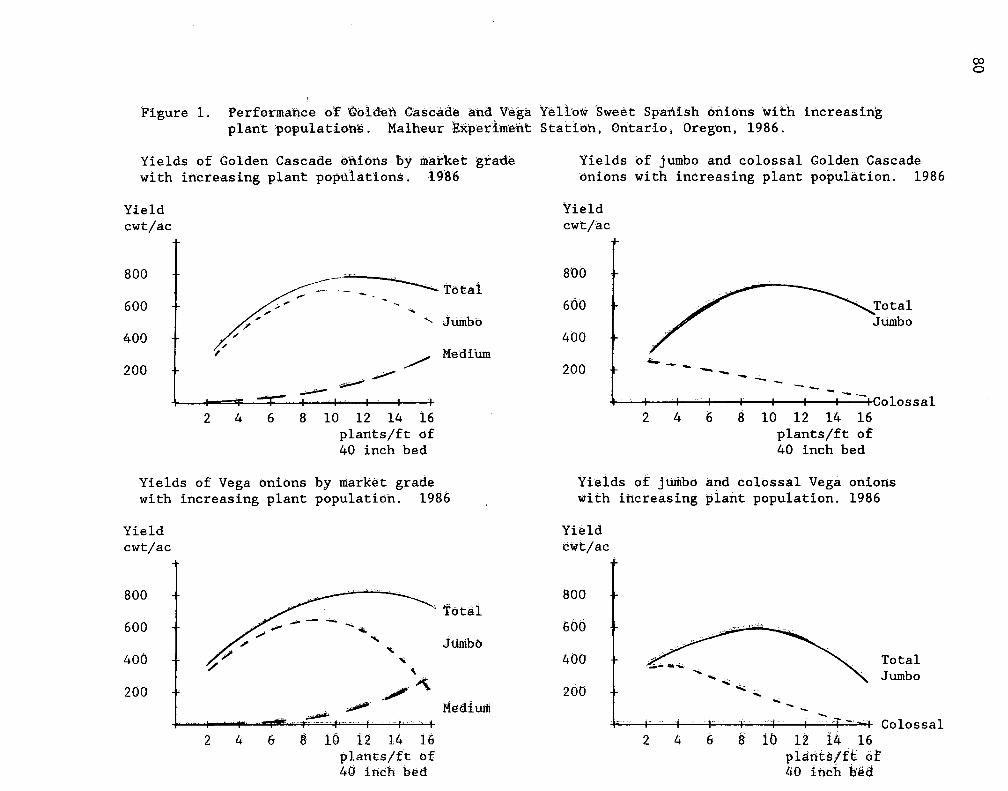
Yieldcwt/ac
800 +Total
600 +Jumbo
400 +Medium
200 +
800
TotalJumbo
—1 Colossal10 12 14 16
plants/ft of40 inch bed
600
400
200
Figure 1. Performance of tOlden Cascade and Vega Yellow Sweet Spanish onions with increasingplant populations. Malheur Experiment Station, Ontario, Oregon, 1986.
Yields of Golden Cascade onions by market grade Yields of jumbo and colossal Golden Cascadewith increasing plant populations. 1986 onions with increasing plant population. 1986
I 4 + +
2 4 6 8 10 12 14 16plants/ft of40 inch bed
i fColossal6 8 10 12 14 16
plants/ft of40 inch bed
Yieldcwt/ac
800
600
400
200
Yields of Vega onions by market gradewith increasing plant population. 1986
Yields of jumbo and colossal Vega onionsWith increasing plant population. 1986
Yield Yieldcwt/ac cwt/ac
MediUdi
Imo - r ---"4"16*- t - I
2 4 6 8 10 12 14 16plants/ft of40 inch bed
800
600
400
200

Yieldcwt/ac
Total800
Jumbo600
400
Medium 200
—
— Colossal+iiiiili
TotalJumbo
Yieldcwt/ac
7-,11111
800 -
600 +
400 +
200 +
Yieldcwt/ac
Total800
Jumbo600
400
Medium 200
Yieldcwt/ac
800
600
400
200
-r-- I I I II
TotalJumbo
ColossalI I I I I 1 I I
Figure 2. Performance of Valdez and Dai Maru Yellow Sweet Spanish onions with increasingplant populations. Malheur Experiment Station, Ontario, Oregon, 1986.
Yields of Valdez onions by market grade
Yields of jumbo and colossal Valdez onionswith increasing plant populations. 1986
with increasing plant population. 1986
2 4 6 8 10 12 14 16plants/ft of40 inch bed
Yields of Dai Maru onions by market gradewith increasing plant population. 1986
2 4 6 8 10 12 14 16plants/ft of40 inch bed
Yields of jumbo and colossal Dai Maru onionswith increasing plant population. 1986
2 4 6 8 10 12 14 16
2 4 6 8 10 12 14 16plants/ft of
plants/ft of40 inch bed
40 inch bed
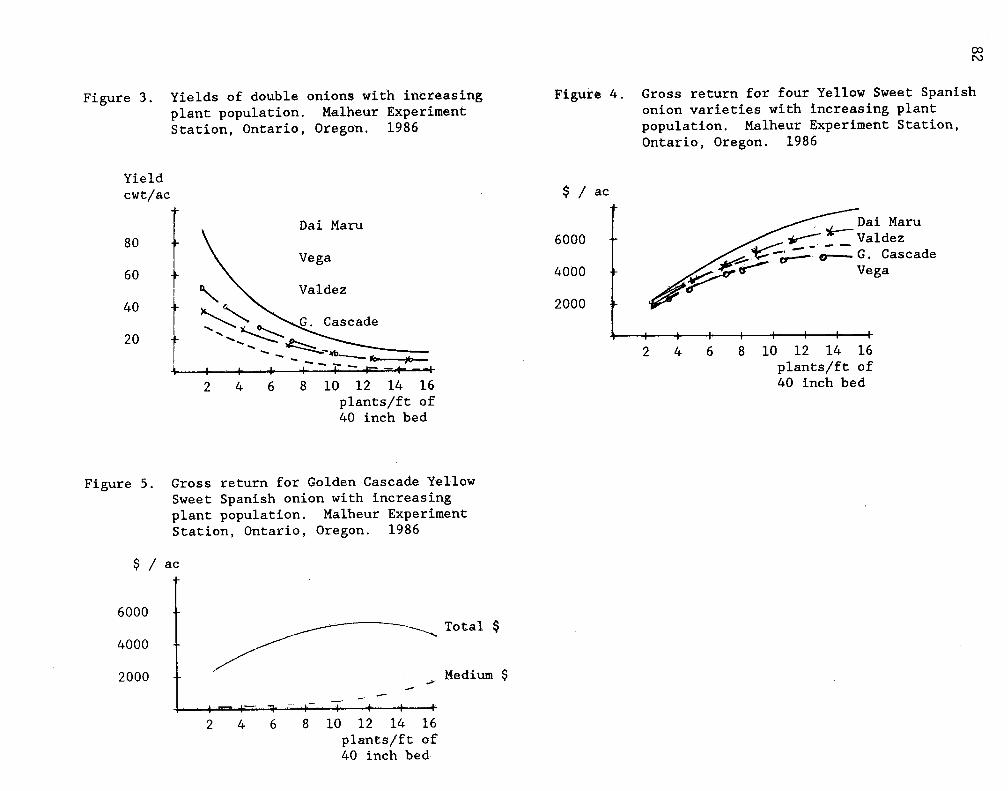
2 4 6 8 10 12 14 16plants/ft of40 inch bed
Dai Maru*--- Valdez
0--- G. CascadeVega
CO
Figure 3. Yields of double onions with increasingplant population. Malheur ExperimentStation, Ontario, Oregon. 1986
Figure 4. Gross return for four Yellow Sweet Spanishonion varieties with increasing plantpopulation. Malheur Experiment Station,Ontario, Oregon. 1986
Yieldcwt/ac $ ac
Dai Maru80
Vega60
Valdez40
G. Cascade20
11470")b•n•nn•
6 8 10 12 14 16plants/ft of40 inch bed
6000
4000
2000
Figure 5. Gross return for Golden Cascade YellowSweet Spanish onion with increasingplant population. Malheur ExperimentStation, Ontario, Oregon. 1986
$ / ac
6000 -
4000 -
2000 -
2 4 6 8 10 12 14 16plants/ft of40 inch bed

FALL-APPLIED HERBICIDES FOR WEED CONTROL IN BULB ONIONS
Charles E. Stanger and Joey IshidaMalheur Experiment Station, Ontario, Oregon, 1986
Purpose
This study was initiated with the objective of eliminatingthe need for applying soil-active herbicides in the spring byapplying herbicides and/or fumigants in the fall as land isbedded.
Introduction
Fields being planted to onions are customarily bedded in thefall before planting onions in the spring. Soil moisture andtilth for planting onions are generally better when land isbedded in the fall, and growers are reluctant to incorporateherbicides by tilling soil in spring because moisture needed forseed germination is lost. Presently herbicides with soil activi-ty are applied after the onions are planted and mixed to someextent with the soil above the depth of the planted onion seed.Unless rain occurs the herbicides remain inactive in dry soil,and weed control is unsatisfactory.
Procedures
Vapam (fumigant), Nortron, Pyramin, Dual, Hoelon, andDacthal (herbicides) were applied as band treatments on October31, 1985, as the land was hilled to form beds. The chemicalswere sprayed in bands 11 inches wide on flat soil in the centerbetween furrows spaced 22 inches apart. The soil adjacent to thesprayed bands was thrown over the top of the sprayed area as thehills were made, leaving the chemicals in a layer at the base ofindividual beds. Each plot was 30 feet long, four rows wide andtreatments were replicated three times using a randomized com-plete block experimental design.
The Vapam and herbicides were applied with a single bicyclewheel type plot sprayer. The boom contained four teejet fan-typenozzles, size 8003E, spaced at 22 inches so that one nozzle wascentered over each row. Vapam was applied so the broadcast rate(25 and 50 gallons per acre) was concentrated in the banded area.The amount of herbicides used per acre was adjusted to the widthof the area within the band (11/22 of amount used in broadcastapplication). For the application of the herbicide treatments,water at the rate of 28 gallons per acre was used as the carrier.Vapam was applied at the volume rate of 25 and 50 gallons peracre. Water was added to the 25-gallon rate to bring its volumeto 50 gallons per acre. The skies were overcast and the airtemperature was 47°F when treatments were applied. The soils
83
were dry on the surface with good soil moisture below. The landwas bedded immediately after the chemical treatments wereapplied.
The soil in the trial area was a silt loam with 1.2 percentorganic matter and a pH of 7.3. Spring wheat was grown on theland in 1985. The wheat straw was shredded, the field wasdisced, irrigated, and fertilizer (100 pounds of phospate and 60pounds of nitrogen) was applied broadcast before being moldboard-plowed and worked down in preparation for applying the chemicaltreatments and hilling in rows to form beds.
On April 6, the beds were worked down using a heavy steelspike-tooth harrow. The metal beam on the front of the harrowleveled the beds and the teeth incorporated the herbicide as thesoil was mulched in preparation for planting.
Golden Cascade variety onions were planted with a Beckshoe-type drill on April 7. Soil moisture was adequate for seedgermination and seedling emergence.
The treatments were evaluated for weed control and croptolerance on May 14. After evaluations, the plots were sprayedwith a tank-mix combination of Ronstar (1.0 pound ai/ac) andRoast (0.25 pounds al/ac) for weed control. Mor Act oil concerttrate was added to the tank-mix at a rate of 1.0 quart per acre.
The onions were hand-thinned to an approximate plant countof five onions per linear foot of row. Prowl (two pounds ai/ac)was applied after the first cultivation following thinning, andcultivated again before irrigating to incorporate the herbicide.
The onions were lifted on September 3 and topped on Septem-ber 14. They remained in the field for drying until September28, when they were put in storage. On January 7, they were re-moved from storage and graded to determine the effect of thechemical treatments on bulb size and bulb yield.
Results
Onion tolerance was satisfactory for all herbicides with theexception of Dual. Dual at two and three pounds active ingre-dient per acre caused stand losses that reduced the yield ofharvested bulbs. Dual effectively controlled all species ofweeds at rates above and including 1.5 pounds active ingredient.
Hoelon persisted to give control of green foxtail and barnyardgrass. Nortron at 1.5 pounds active ingredient per acrecontrolled 98 to 100 percent of pigweed and lambquarters but wasless effective on grasses than Hoelon. Four pounds of Pyramincontrolled 92 and 97 percent of the lambsquarters and pigweed.Pyramin had very little activity on green foxtail and barnyardgrass. The tank-mix combination of Nortron and Pyramin was nobetter than Nortron alone. Nortron gave better weed control than
84
Pyramin. Dacthal did not persist overwinter to give adequateweed control.
A tank-mix combination treatment of Nortron and Hoelon wouldappear to be an excellent combination for fall application tocontrol broadleaf weeds and grasses in onions.
Vapam did have herbicide activity. At the rate of 50 gal-lons per acre it gave about 94 percent control of lambsquartersand pigweed and 82 to 85 percent control of green foxtail andbarnyardgrass. It was less active at the 25-gallon- per-acrerate. At harvest time Vapam did not reduce the amount of pink-rot on the onion roots and did not increase bulb yields whencompared to yields obtained from the non-treated control.
85

Rate 1Injury Lambsquarters Pigweed Foxtail grassCrop2
Weed Control2
Green Barnyard-Herbicides
Table 1. Weed control and crop injury ratings from herbicides applied in thefall to land bedded for onions. Malheur Experiment Station,Ontario, Oregon, 1986
86
Ter acre
Vapam 25 gal 0
78 82 76 73Vapam 50 gal 0
93 95 85 82
Nortron 1.5 0 98 100 91 87Nortron 2.0 5 99 100 94 90
Pyramin wp 3.0 0 90 96 20 15Pyramin wp 4.0 0 92 97 25 18
Hoelon 1.0 0 0 0 100 100Hoelon 1.5 0 0 0 100 100
Nortron + Pyramin 1 + 2 5 96 100 88 85Nortron + Pyramin 1 + 3 5 98 100 88 83Nortron + Pyramin 1.5 + 2 5 98 100 94 88Nortron + Pyramin 1.5 + 3 7 98 100 92 89
Dacthal 9,0- 0 72 78 '65 68
Dual 1.0 5 100 100 95 92Dual 1.5 10 100 100 98 96Dual 2.0 18 100 100 100 98Dual 3.0 55 100 100 100 100
Check 0 0 0 0
1Rates: herbicides Nortron, Pyramin, Hoelon, Dacthal, and Dual expressed as
pounds active ingredient per acre.2Ratings: 0 = no effect, 100 – all plants killed. Average of three replications.

Table 2. Total bulb yields and yields for bulbs of different size categories from spring
planted onions treated with herbicides applied in October to bedded land.
Malheur Experiment Station, Ontario, Oregon, 1986
87
1 2Rate Yield of Onion Bulbs
Herbicides per acre Total ) 4 inch 3-4 inches 2 1/4-3 inches < 2 1/4 inch
cwt/ac cwt/ac X cwt/ac X cwt/ac X cwt/ac X
Vapam 25 gal 646 93 14 459 71 57 9 6 1
Vapam 50 gal 616 91 15 469 76 52 8 5 1
Nortron 1.5 642 104 16 485 76 49 8 3 0.5
Nortron 2.0 706 166 24 499 70 39 6 2 0.3
Pyramin 3.0 621 139 22 440 71 40 6 3 0.5
Pyramin 4.0 680 100 15 524 77 53 8 2 0.3
Hoelon 1.0 636 95 15 485 76 54 8 2 0.3
Hoelon 1.5 631 60 10 491 77 75 12 5 1
Nortron + Pyramin 1 + 2 605 126 21 440 73 33 5 6 1
Nortron + Pyramin 1 + 3 639 86 13 494 77 58 9 2 0.3
Nortron + Pyramin 1.5 + 2 639 97 15 482 75 58 9 2 0.3
Nortron + Pyramin 1.5 + 3 675 134 20 484 72 53 8 3 0.4
Dacthal 9.0 689 148 21 502 73 35 5 4 1
Dual 1.0 576 52 9 458 79 62 11 4 1Dual 1.5 585 111 19 419 71 51 9 4 1Dual 2.0 554 130 23 379 68 42 8 3 1Dual 3.0 474 106 22 318 67 46 10 4 1
Check 670 116 17 510 76 41 6 2 0.3
LSD (.05) 97 NS -- 93 NS NS
LSD (.01) 131 NS -- 125 NS NS
Mean 621 107 -- 461 50 4
CV (X) 9 21 12 29 33
1Herbicides Nortron, Pyramin, Hoelon, Dacthal, and Dual rates are expressed as pounds active
ingredient per acre.2Yields are average of three replications.
SUGAR BEET VARIETY TESTING RESULTS
Charles E. StangerMalheur Experiment Station, Ontario, Oregon, 1986
Purpose
Commercial varieties and experimental lines of sugar beetswere evaluated to identify lines for superior yield and quality.
Introduction
The data from Ontario are combined with data from easternIdaho and are used by a joint seed advisory committee, includingpeople from the seed industry, Amalgamated Sugar Company, andsugar beet grower representatives, for the purpose of improvingthe sugar beet industry by emphasizing improvements in varieties.The committee evaluates the data and recommends varieties ofhighest quality for planting in different areas of production forMalheur County of eastern Oregon and the sugar-beat-growing areasof Idaho.
Procedures
Forty-three cultivars and experimental lines were evaluated.Twenty entries were included in the commercial trial and 28 lineswere evaluated as experimental entries. Seed for evaluation wasreceived from American Crystal, Betaseed, Holly, Mono-hy and,TASCO companies.
The sugar beets were planted in an Owyhee silt loam soilwhere Stephens wheat was grown for two years. Soil pH was 7.3and soil organic matter 1.2 percent. The field was plowed in thefall of 1985. One-hundred pounds P
205 and 60 pounds N was
applied as a broadcast treatment before plowing. An additional140 pounds N was sidedressed after thinning. Two pounds activeingredient per acre of Nortron and 1.5 pounds active ingredientper acre Hoelon were broadcast and incorporated with a spike-tooth harrow before planting.
The commercial varietes and experimental lines were plantedin separate trials. Commercial checks were planted with experi-mental lines to use as standards for comparison purposes. Eachentry was replicated eight times and arranged in a completerandomized block experimental design. Each plot was four rowswide and 22 feet long with four-foot alleyways between blocks.Enough seed was prepackaged to plant approximately 12 viableseeds per foot of row for each 22 feet of row. The seed was
88
planted on April 10 with a cone-seeder mounted on a John DeereModel 71 Flexi-planter equipped with disc openers. After plant-ing, the sugar beets were furrowed and surface-irrigated toassure enough moisture for uniform seed germination and seedlingemergence.
The sugar beets were thinned during the third week of May.Spacing between plants was approximately eight inches. In mid-July, just before the last cultivation, one pound active ingred-ient of Bayleton was applied broadcast with a ground sprayer.Another Bayleton application at 0.5 pounds active ingredient peracre and 40 pounds of sulfur dust per acre were aerial-applied onSeptember 1. Comite for spotted mite control and Orthene forarmyworm control were also aerial-applied on September 5.Each material was applied at the rate of one pound active ingred-ient per acre.
The sugar beets were harvested on October 14, 15, 16, and17. The top foliage was removed by a rubber flail beater and thecrowns clipped with dragging scalping knives. The roots from thetwo center rows of each four-row plot were dug with a single-rowlifter type harvester and roots in each 22 feet of row weighed tocalculate root yields. A sample of seven beets was taken fromthe two harvested rows of each plot and analyzed to measurepercent sucrose and obtain a conductivity reading as a measure ofroot purity. The root weights were tared by 5 percent and thepercent sucrose content factored to 93 percent when final yieldsand percent sucrose were recorded.
Results
The entries have been grouped according to companiesfurnishing seed. Each entry has been ranked within eachcompany's group based on yield of recoverable sugar per acre.These data were analyzed statistically.
Yield of recoverable sugar from commercial entries rangedfrom a high of 13,927 pounds of sugar per acre to a low of11,659, with an entry mean of 12,646 (Table 1). Three entriesproduced sugar yields significantly greater than the mean.Yields of recoverable sugar for entries among the experimentallines ranged from 14,455 to 11,549, with a mean of 12,938 poundsof sugar per acre (Table 2). Twelve of the 28 lines tested hadsugar yields above the test average. Seven of these entries hadsugar yields significantly higher than the mean at the 5-percentlevel.
89
Comparing the 1986 to 1985 recoverable sugar yields, yieldswere higher in 1986. In the 1986 tests, comparing averages forexperimental lines, both root yields and percent sucrose werehigher by about three tons per acre and 1.0 percent sucrose. Thecommercial varieties were also higher in 1986 by slightly morethan 1.0 tons per acre and 0.70 percent sucrose. In 1985, av-erage yield of recoverable sugar was 11,701 pounds per acre amongthe commercial entries and 11,964 pounds per acre among theentries tested in the experimental variety trial.
90
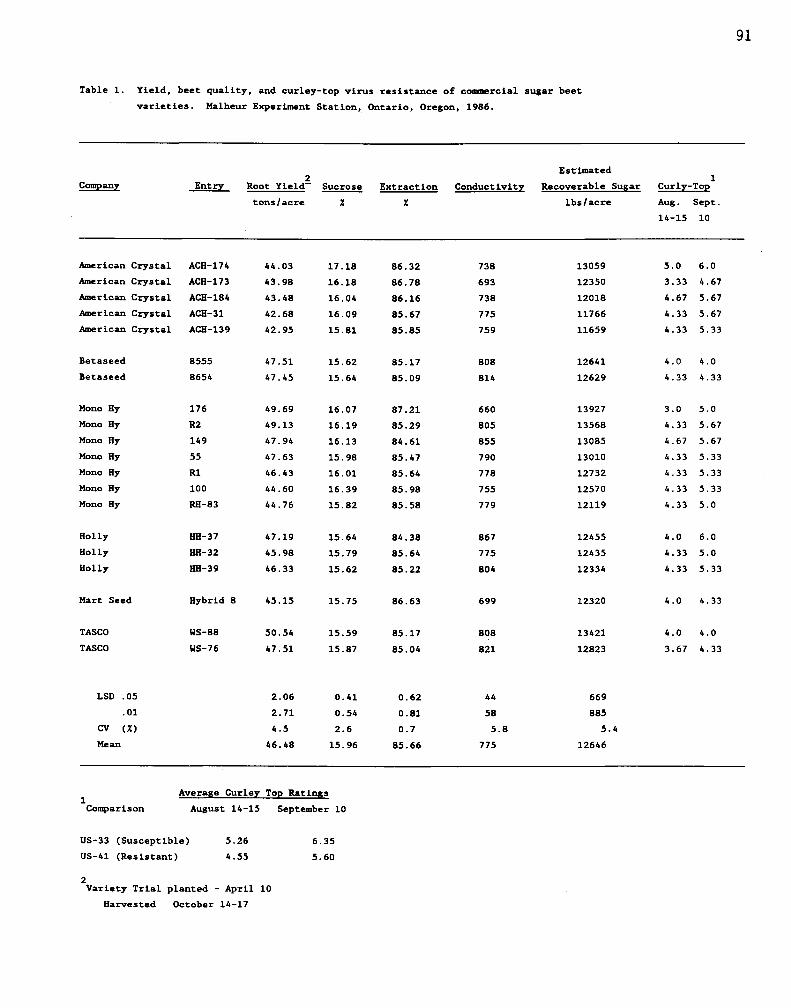
91
Table 1. Yield, beet quality, and curley-top virus resistance of commercial sugar beet
varieties. Malheur Experiment Station, Ontario, Oregon, 1986.
Company Entry2
Root Yield- Sucrose Extraction Conductivity Recoverable
Estimated
Sugar1
Curly-Top
tons/acre X X lbs/acre Aug.
14-15
Sept.
10
American Crystal ACH-174 44.03 17.18 86.32 738 13059 5.0 6.0
American Crystal ACH-173 43.98 16.18 86.78 693 12350 3.33 4.67
American Crystal ACH-184 43.48 16.04 86.16 738 12018 4.67 5.67
American Crystal ACH-31 42.68 16.09 85.67 775 11766 4.33 5.67
American Crystal ACH-139 42.95 15.81 85.85 759 11659 4.33 5.33
Betaseed 8555 47.51 15.62 85.17 808 12641 4.0 4.0
Betaseed 8654 47.45 15.64 85.09 814 12629 4.33 4.33
Mono Hy 176 49.69 16.07 87.21 660 13927 3.0 5.0
Mono Hy R2 49.13 16.19 85.29 805 13568 4.33 5.67
Mono Hy 149 47.94 16.13 84.61 855 13085 4.67 5.67
Mono Hy 55 47.63 15.98 85.47 790 13010 4.33 5.33
Mono Hy R1 46.43 16.01 85.64 778 12732 4.33 5.33
Mono Hy 100 44.60 16.39 85.98 755 12570 4.33 5.33
Mono Hy RH-83 44.76 15.82 85.58 779 12119 4.33 5.0
Holly HH-37 47.19 15.64 84.38 867 12455 4.0 6.0
Holly HH-32 45.98 15.79 85.64 775 12435 4.33 5.0
Holly HE-39 46.33 15.62 85.22 804 12334 4.33 5.33
Mart Seed Hybrid 8 45.15 15.75 86.63 699 12320 4.0 4.33
TASCO WS-88 50.54 15.59 85.17 808 13421 4.0 4.0
TASCO WS-76 47.51 15.87 85.04 821 12823 3.67 4.33
LSD .05 2.06 0.41 0.62 44 669
.01 2.71 0.54 0.81 58 885
CV (X) 4.5 2.6 0.7 5.8 5.4
Mean 46.48 15.96 85.66 775 12646
1 Average Curley Top Ratings
Comparison August 14-15 September 10
US-33 (Susceptible)
5.26 6.35
US-41 (Resistant)
4.55 5.60
2Variety Trial planted - April 10
Harvested October 14-17
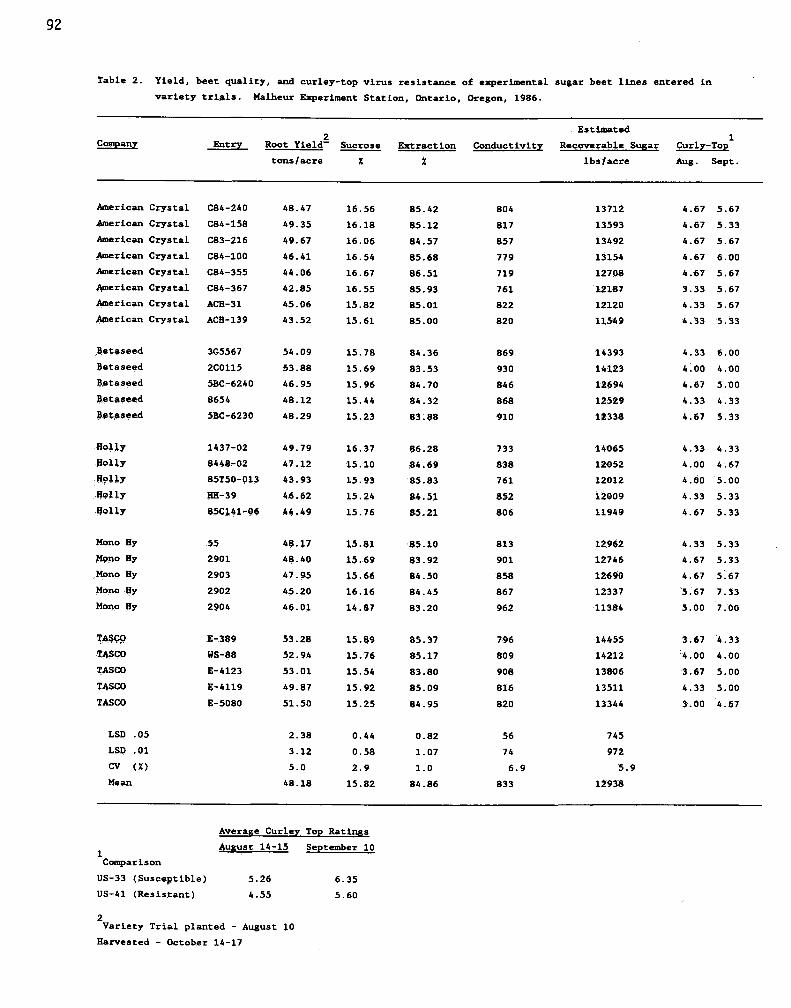
Table 2. Yield, beet quality, and curley-top virus resistance of experimental sugar beet lines entered in
variety trials. Malheur Experiment Station, Ontario, Oregon, 1986.
CompanyEstimated
2 1Entry Root Yield- Sucrose Extraction Conductivity Recoverable Sugar Curly-Top
tons/acre X X lbsfacre Aug. Sept.
American Crystal C84-240 48.47 16.56 85.42 804 13712 4.67 5.67
American Crystal C84-158 49.35 16.18 85.12 817 13593 4.67 5.33
American Crystal C83-216 49.67 16.06 84.57 857 13492 4.67 5.67
American Crystal C84-100 46.41 16.54 85.68 779 13154 4.67 6.00American Crystal C84-355 44.06 16.67 86.51 719 12708 4.67 5.67American Crystal C84-367 42.85 16.55 85.93 761 12187 3.33 5.67
American Crystal ACH-31 45.06 15.82 85.01 822 12120 4.33 5.67
American Crystal ACH-139 43.52 15.61 85.00 820 11549 4.33 5.33
Betaseed 3G5567 54.09 15.78 84.36 869 14393 4.33 6.00
Betaseed 2C0115 53.88 15.69 83.53 930 14123 4.00 4.00
Betaseed 58C,6240 46.95 15.96 84.70 846 12694 4.67 5.00
Betaseed 8654 48.12 15.44 84.32 868 12529 4.33 4.13
AOX#5eed 58C-6230 48.29 15.23 83.88 910 12338 4:67 5.33
4011Y 1437-02 49.79 16.37 86.28 733 14065 4.33 4.33
golly 8448-02 47.12 15.10 84.69 838 12052 4.00 4.67
R9117 85T50-013 43.93 15.93 85.83 761 12012 4.00 5.00
4911Y OH-39 46.62 15.24 84.51 852 12009 4.33 5.33
$011Y 85C141-96 44.49 15.76 85.21 806 11949 4.67 5.33
Mono By 55 48.17 15.81 85.10 813 12962 4.33 5.33
Mono By 2901 48.40 15.69 83.92 901 12746 4.67 5:33Mono Hy 2903 47.95 15.66 84..50 858 12690 4.67 5.67
Mono By 2902 45.20 16.16 84.45 867 12337 5.67 7.33
Mono Hy 2904 46.01 14.87 83.20 962 11384 5.00 7:00
TAW? E-389 53.28 15.89 85.37 796 14455 3.67 4.33
;4SCO WS-88 52.94 15.76 85.17 809 14212 4.00 4.00
TASCO E-4123 53.01 15.54 83.80 908 13806 1.67 5.00
TASCO E-4119 49.87 15.92 85.09 816 13511 4.33 5.00
TASCO E-5080 51.50 15.25 84.95 820 13344 3.00 4.67
LSD .05 2.38 0.44 0.82 56 745LSD .01 3.12 0.58 1.07 74 972CV (X) 5.0 2.9 1.0 6.9 5.9Mean 48.18 15.82 84.86 833 12938
1Comparison
US-33 (Susceptible)
US-41 (Resistant)
Average Curley Top Ratings
August 14-15 September 10
5.26 6.35
4.55 5.60
2Variety Trial planted - August 10
Harvested - October 14-17
92
A COMPARISON OF FORMULA 132B + NUTRIENT PELLETED SUGAR BEETSEED TO RAW SEED FOR EMERGENCE AND SUGAR YIELDS
Charles E. StangerMalheur Experiment Station, Ontario, Oregon, 1986
Purpose
This study was undertaken to determine if nutrients andother additives contained in the coating material of pelletizedsugar beet seed can reduce seedling disease, enhance seedlingemergence and growth, and increase sugar yields.
Procedures
The trial contained three treatments, including pelletedseed identified as formula 132B + nutrient, raw seed furnished byGermain's, and raw commercial seed obtained from a local sugarbeet seed distributor. The seed lot number for the pelleted seedand the raw seed furnished by Germain's was G 618. The lotnumber of the locally obtained commercial seed was G 629. Allseed was TASCO variety WS-88.
The sugar beets were planted in an Owyhee silt loam soilwith a pH of 7.3 and an organic matter content of 1.2 percent.The field had previously been planted to winter wheat for twoconsecutive years. Land preparation consisted of moldboard plow-ing in the fall and field tillage in the spring to prepare theseed bed. One-hundred pounds of P 205 and 60 pounds of N wereapplied as a broadcast treatment before plowing. An additional140 pounds N were sidedressed after thinning. Two pounds activeingredients per acre of Nortron and 1.5 pounds active ingredientsper acre Hoelon were broadcast and incorporated with a spike-tooth harrow before planting.
The three treatments with treated seed were planted in thecommercial sugar beet variety trial. Each entry was replicatedeight times and arranged in a complete randomized block experi-mental design. Each plot was four rows wide and 22 feet longwith four-foot alleyways between blocks. An equal number of seedwas prepackaged to plant approximately 12 viable seeds per footof row for each 22 feet of row.
The seed was planted on April 10 with a cone-seeder mountedon a John Deere Model 71 Flexi-planter equipped with disc open-ers. After planting, the sugar beets were furrowed and surface-irrigated to assure enough soil moisture for seed germination.
Stand counts to determine time of emergence, rate of emer-gence, seedling vigor, and seedling survival began at firstemergence on April 22. Subsequent stand counts were taken on
93
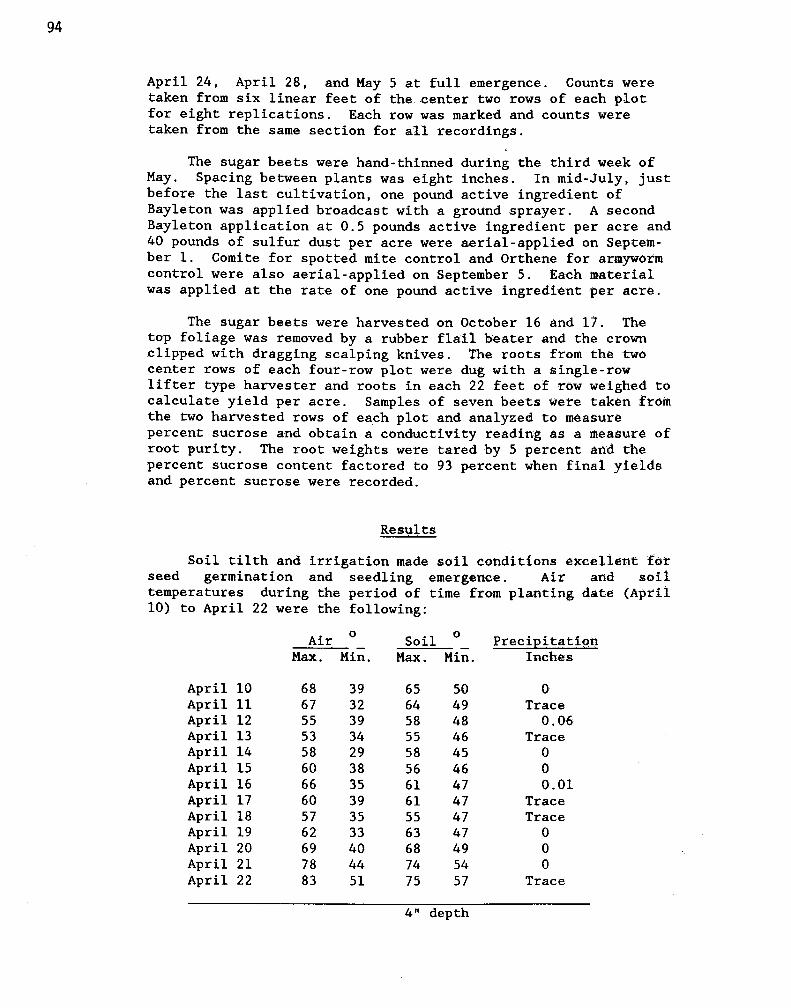
April 24, April 28, and May 5 at full emergence. Counts weretaken from six linear feet of the center two rows of each plotfor eight replications. Each row was marked and counts weretaken from the same section for all recordings.
The sugar beets were hand-thinned during the third week ofMay. Spacing between plants was eight inches. In mid-July, justbefore the last cultivation, one pound active ingredient ofBayleton was applied broadcast with a ground sprayer. A secondBayleton application at 0.5 pounds active ingredient per acre and40 pounds of sulfur dust per acre were aerial-applied on Septem-ber 1. Comite for spotted mite control and Orthene for armywormcontrol were also aerial-applied on September 5. Each materialwas applied at the rate of one pound active ingredient per acre.
The sugar beets were harvested on October 16 and 17. Thetop foliage was removed by a rubber flail beater and the crownclipped with dragging scalping knives. The roots from the twocenter rows of each four-row plot were dug with a single-rowlifter type harvester and roots in each 22 feet of row weighed tocalculate yield per acre. Samples of seven beets were taken fromthe two harvested rows of each plot and analyzed to measurepercent sucrose and obtain a conductivity reading as a measure ofroot purity. The root weights were tared by 5 percent and thepercent sucrose content factored to 93 percent when final yieldsand percent sucrose were recorded.
Results
Soil tilth and irrigation made soil conditions excellent forseed germination and seedling emergence. Air and soiltemperatures during the period of time from planting date (April10) to April 22 were the following:
Air ° Soil PrecipitationMax. Min. Max. Min. Inches
April 10 68 39 65 50 0April 11 67 32 64 49 TraceApril 12 55 39 58 48 0.06April 13 53 34 55 46 TraceApril 14 58 29 58 45 0April 15 60 38 56 46 0April 16 66 35 61 47 0.01April 17 60 39 61 47 TraceApril 18 57 35 55 47 TraceApril 19 62 33 63 47 0April 20 69 40 68 49 0April 21 78 44 74 54 0April 22 83 51 75 57 Trace
94
4" depth
and number of emergedplot), are recorded inpercent sucrose, percentrecoverable sugar per
Data, including percent emergencebeets per 12 linear feet (avg. of eachTable 1. Table 2 contains root yield,extraction, conductivity, and yield ofacre.
95
No differences existed between treatments for time and rateof emergence. Cool temperatures for several days after plantingmay have contributed to even germination and early preemergenceseedling growth, and the rapid increase in air and soil tempera-tures may have resulted in uniform emergence. Stand loss didoccur in raw seed plots from fungus disease. This was not notedin the pelleted seed plots where emerged plant numbers remainedconstant.
Differences between treatments for root yield, percent su-crose, and percent extraction were not significant; however,yields were enough better for these factors in the pelleted seedtreatments to result in a significant increase in calculatedyield of recoverable sugar when tested at the 5 percent level ofconfidence.
Recoverable sugar = root yield x % sucrose x % extraction.
The data are reported as one year's results at one location.The coefficient of variation is good. The data justify furthertesting under our cultural and environmental conditions to sub-stantiate the true effect of the treatment identified as 132B +nutrient in pelleted seed.
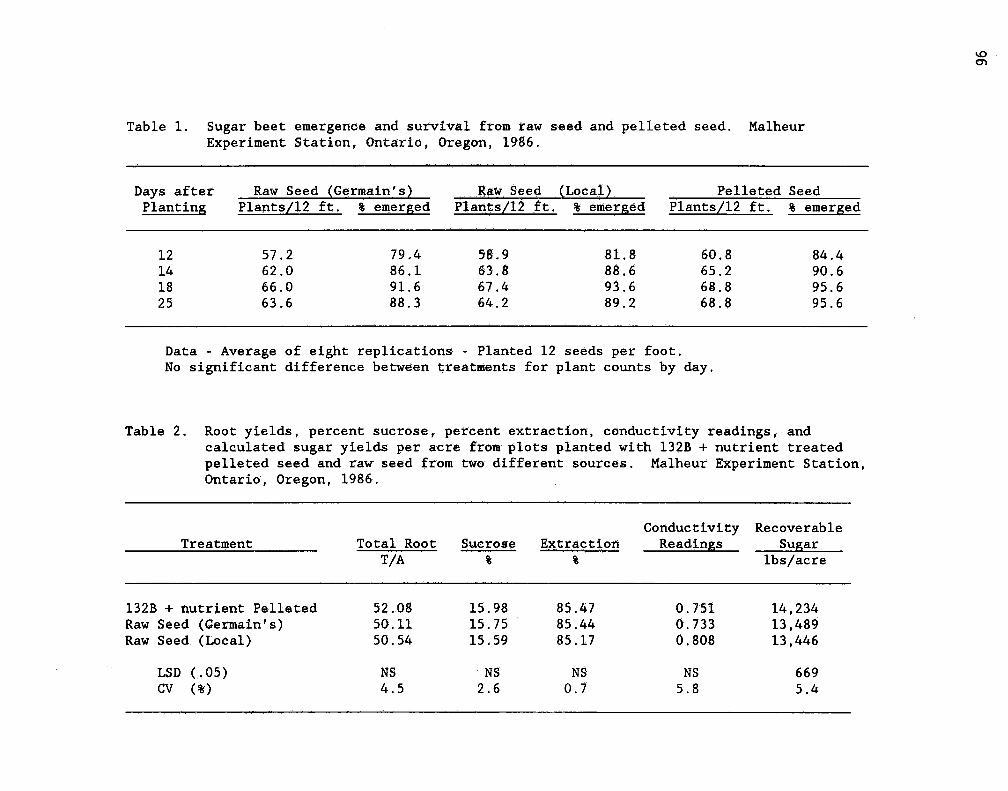
Table 1. Sugar beet emergence and survival from raw seed and pelleted seed. MalheurExperiment Station, Ontario, Oregon, 1986.
Days after Raw Seed (Cermain's) Raw Seed (Local) Pelleted Seed Planting Plants/12 ft. % emerged Plants/12 ft. % emerged Plants/12 ft. % emerged
12 57.2 79.4 58.9 81.8 60.8 84.414 62.0 86.1 63.8 88.6 65.2 90.618 66.0 91.6 67.4 93.6 68.8 95.625 63.6 88.3 64.2 89.2 68.8 95.6
Data - Average of eight replications - Planted 12 seeds per foot.No significant difference between treatments for plant counts by day.
Table 2. Root yields, percent sucrose, percent extraction, conductivity readings, andcalculated sugar yields per acre from plots planted with 132B + nutrient treatedpelleted seed and raw seed from two different sources. Malheur Experiment Station,Ontario, Oregon, 1986.
Conductivity RecoverableTreatment
Total Root Sucrose Extraction Readings Sugar T/A lbs/acre
132B + nutrient Pelleted 52.08 15.98 85.47 0.751 14,234Raw Seed (Cermain's) 50.11 15.75 85.44 0.733 13,489Raw Seed (Local) 50.54 15.59 85.17 0.808 13,446
LSD (.05) NS NS NS NS 669CV (%) 4.5 2.6 0.7 5.8 5.4

AN EVALUATION OF POSTEMERGENCE-APPLIED HERBICIDESFOR WEED CONTROL IN SUGAR BEETS
Charles E. Stanger and Joey IshidaMalheur Experiment Station, Ontario, Oregon, 1986
Introduction
Growers of sugar beets are relying more heavily on foliar-active herbicides to control weeds in their crop. In some casessoil-active herbicides have been eliminated completely from theirweed control programs. This change has been brought about pri-marily because of the availability of new gramicides which arevery effective on grasses infesting sugar beets and are compatiblewhen tank-mixed with Betamix. Betamix is active on many speciesof annual broadleaf weeds and most effective when applied asrepeat applications with low volumes of water as the carrier.
PURPOSE
These studies were initiated to evaluate the compatibilityof Fusilade 2000 and Poast when tank-mixed with Betamix and totest Chevron's RE-45601 for activity on annual grasses whenapplied as soil and foliar treatments.
Procedures
Sugar beet variety WS-88 was planted on April 16, in siltloam soil which was plowed and bedded in the fall of 1985. Thefield had been planted to Stephens variety of winter wheat fortwo years before planting sugar beets. All straw residue hadbeen returned to the soil. Soil pH is 7.3 and the organic matteris 1.2 percent. The sugar beets were planted in single-row bedsspaced 22 inches apart. Individual plots were four rows wide and30 feet long. Each treatment was replicated four times andrandomized within blocks using a randomized-block experimentaldesign.
The sugar beets were watered by furrow irrigation. Thefirst irrigation was applied after planting to assure adequatesoil moisture for crop seed and weed seed germination and seed-ling growth. Weed species included pigweed (Amaranthus retroflexus), lambsquarters (Chenopodium album), kochia (Kochiasativa), barnyardgrass (Echinochloa crus-galli), green foxtail(Setaria virdius), and wild oats (Avena fatua). The preplantincorporated and the postplant pre-emergence nonincorporatedtreatments were applied on April 15 and April 16, respectively.The preplant treatments were incorporated with a roto-tillerequipped with L-shaped teeth and set to till at a depth of threeinches. The pre-emergence treatments were left on the soil sur-face. They preceded the first irrigation. The earliest postemer-gence treatments began when the sugar beets had two true leaves.Subsequent applications varied between trials.
97
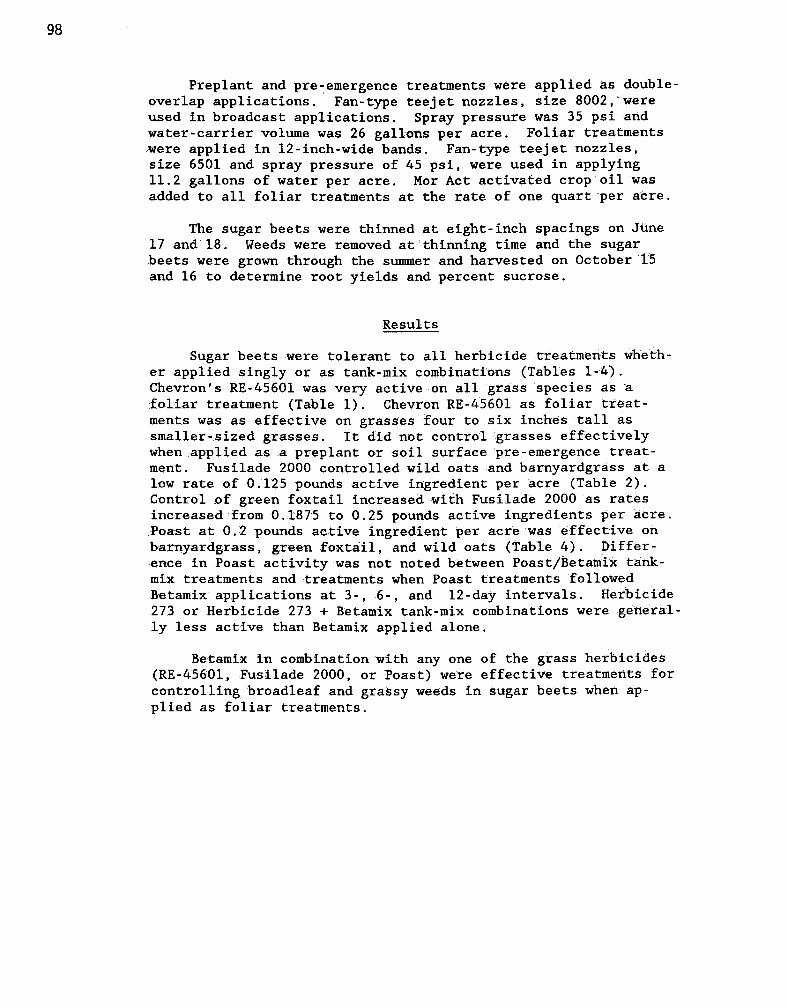
Preplant and pre-emergence treatments were applied as double-overlap applications. Fan-type teejet nozzles, size 8002, wereused in broadcast applications. Spray pressure was 35 psi andwater-carrier volume was 26 gallons per acre. Foliar treatmentswere applied in 12-inch-wide bands. Fan-type teejet nozzles,size 6501 and spray pressure of 45 psi, were used in applying11.2 gallons of water per acre. Mor Act activated crop oil wasadded to all foliar treatments at the rate of one quart per acre.
The sugar beets were thinned at eight-inch spacings on June17 and 18. Weeds were removed at thinning time and the sugarbeets were grown through the summer and harvested on October 15and 16 to determine root yields and percent sucrose.
Results
Sugar beets were tolerant to all herbicide treatments wheth-er applied singly or as tank-mix combinations (Tables 1-4).Chevron's RE-45601 was very active on all grass species as afoliar treatment (Table 1). Chevron RE-45601 as foliar treat-ments was as effective on grasses four to six inches tall assmaller-sized grasses. It did not control grasses effectivelywhen applied as ,a preplant or soil surface pre-emergence treat-ment. Fusilade 2000 controlled wild oats and barnyardgrass at alow rate of 0.125 pounds active ingredient per acre (Table 2).Control of green foxtail increased with Fusilade 2000 as ratesincreased from 0.1875 to 0.25 pounds active ingredients per acre.Poast at 0.2 pounds active ingredient per acre was effective onbarnyardgrass, green foxtail, and wild oats (Table 4). Differ-ence in Poast activity was not noted between Poast/Betamix tank-mix treatments and treatments when Poast treatments followedBetamix applications at 3-, 6-, and 12-day intervals. Herbicide273 or Herbicide 273 + Betamix tank-mix combinations were general-ly less active than Betamix applied alone.
Betamix in combination 'with any one of the grass herbicides(RE-45601, Fusilade 2000, or Poast) were effective treatments forcontrolling broadleaf and grassy weeds in sugar beets when ap-plied as foliar treatments.
98
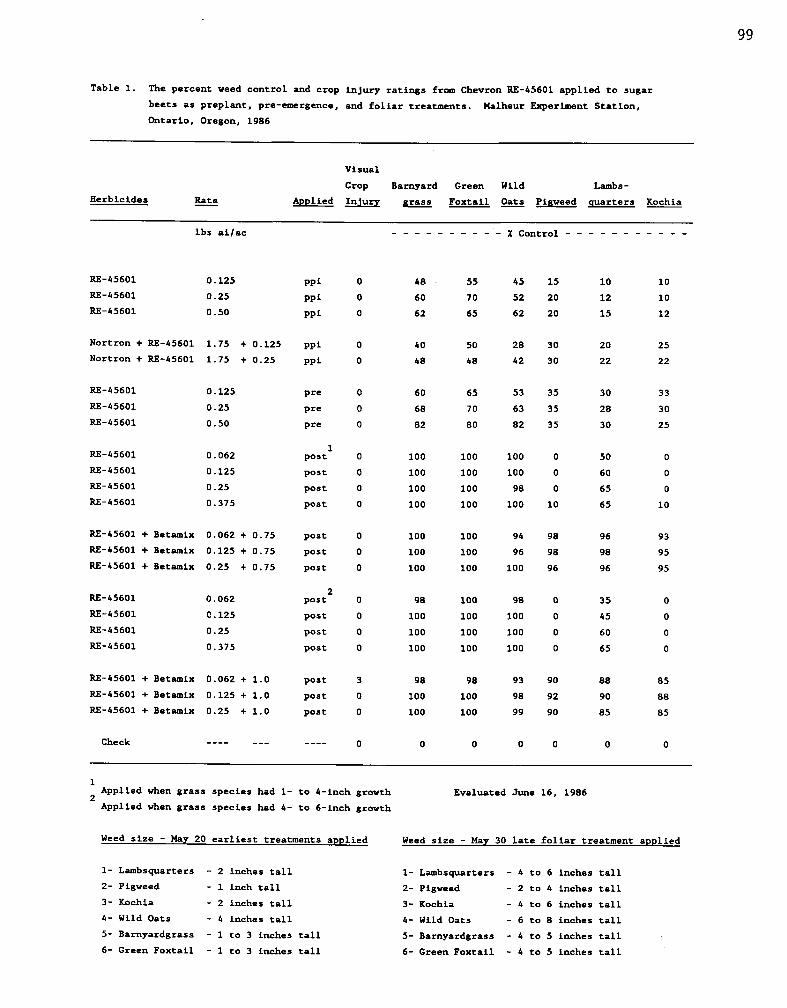
Table 1. The percent weed control and crop injury ratings from Chevron RE-45601 applied to sugar
beets as preplant, pre-emergence, and foliar treatments. Malheur Experiment Station,
Ontario, Oregon, 1986
99
Visual
Crop Barnyard Green Wild Lambs-Herbicides Rate Applied Injury grass Foxtail Oats Pigweed quarters Kochia
lbs ai/ac X Control
RE-45601 0.125 ppi 0 48 55 45 15 10 10RE-45601 0.25 ppi 0 60 70 52 20 12 10RE-45601 0.50 ppi 0 62 65 62 20 15 12
Nortron + RE-45601 1.75 + 0.125 ppi 0 40 50 28 30 20 25Nortron + RE-45601 1.75 + 0.25 ppi 0 48 48 42 30 22 22
RE-45601 0.125 pre 0 60 65 53 35 30 33RE-45601 0.25 pre 0 68 70 63 35 28 30RE-45601 0.50 pre 0 82 80 82 35 30 25
RE-45601 0.062 post 0 100 100 100 0 50 0RE-45601 0.125 post 0 100 100 100 0 60 0RE-45601 0.25 post 0 100 100 98 0 65 0RE-45601 0.375 post 0 100 100 100 10 65 10
RE-45601 + Betamix 0.062 + 0.75 post 0 100 100 94 98 96 93RE-45601 + Betamix 0.125 + 0.75 post 0 100 100 96 98 98 95RE-45601 + Betamix 0.25 + 0.75 post 0 100 100 100 96 96 95
RE-45601 0.062 post 0 98 100 98 0 35 0RE-45601 0.125 post 0 100 100 100 0 45 0RE-45601 0.25 post 0 100 100 100 0 60 0RE-45601 0.375 post 0 100 100 100 0 65 0
RE-45601 + Betamix 0.062 + 1.0 post 3 98 98 93 90 88 85RE-45601 + Betamix 0.125 + 1.0 post 0 100 100 98 92 90 88RE-45601 + Betamix 0.25 + 1.0 post 0 100 100 99 90 85 85
Check 0 0 0 0 0 0 0
12 Applied when grass species had 1- to 4-inch growth Evaluated June 16, 1986
Applied when grass species had 4- to 6-inch growth
Weed size - May 20 earliest treatments applied Weed size - May 30 late foliar treatment applied
1- Lambsquarters - 2 inches tall 1- Lambsquarters - 4 to 6 inches tall2- Pigweed - 1 inch tall 2- Pigweed - 2 to 4 inches tall3- Kochia - 2 inches tall 3- Kochia - 4 to 6 inches tall4- Wild Oats - 4 inches tall 4- Wild Oats - 6 to 8 inches tall5- Barnyardgrass - 1 to 3 inches tall 5- Barnyardgrass - 4 to 5 inches tall
6- Green Foxtail - 1 to 3 inches tall 6- Green Foxtail - 4 to 5 inches tall
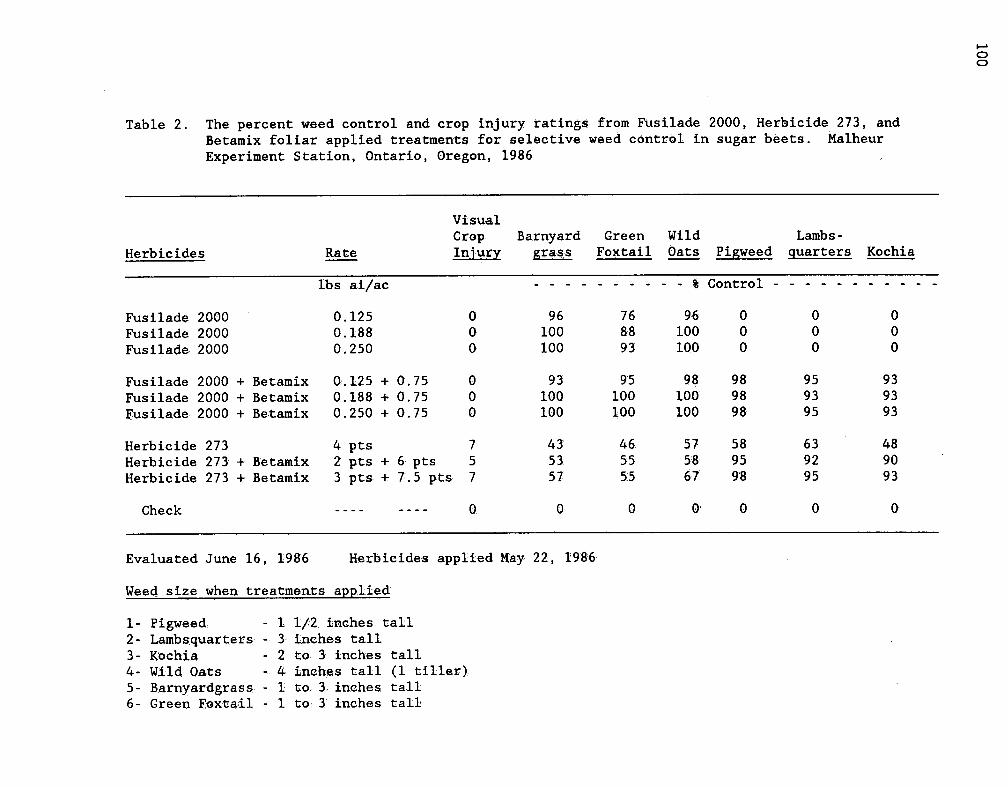
Table 2. The percent weed control and crop injury ratings from Fusilade 2000, Herbicide 273, andBetamix foliar applied treatments for selective weed control in sugar beets. MalheurExperiment Station, Ontario, Oregon, 1986
VisualCrop Barnyard Green Wild Lambs-
Herbicides Rate Injury grass Foxtail Oats Pigweed quarters Kochia
lbs ai/ac % Control
Fusilade 2000 0.125 0 96 76 96 0 0 0Fusilade 2000 0.188 0 100 88 100 0 0 0Fusilade 2000 0.250 0 100 93 100 0 0 0
Fusilade 2000 + Betamix 0.125 + 0.75 0 93 95 98 98 95 93Fusilade 2000 + Betamix 0.188 + 0.75 0 100 100 100 98 93 93Fusilade 2000 + Betamix 0.250 + 0.75 0 100 100 100 98 95 93
Herbicide 273 4 pts 7 43 46 57 58 63 48Herbicide 273 + Betamix 2 pts + 6 pts 5 53 55 58 95 92 90Herbicide 273 + Betamix 3 pts + 7.5 pts 7 57 55 67 98 95 93
Check 0 0 0 0 0 0 0
Evaluated June 16, 1986 Herbicides applied May 22, 1986
Weed size when treatments applied
1- Pigweed - 1 1/2 inches tall2- Lambsquarters - I inches tall3- Kochia - 2 to. 3 inches tall4- Wild Oats - 4 inches tall (1 tiller)5- Barnyardgrass - 1 to 3 inches tall6- Green Foxtail - 1 to 3 inches tall
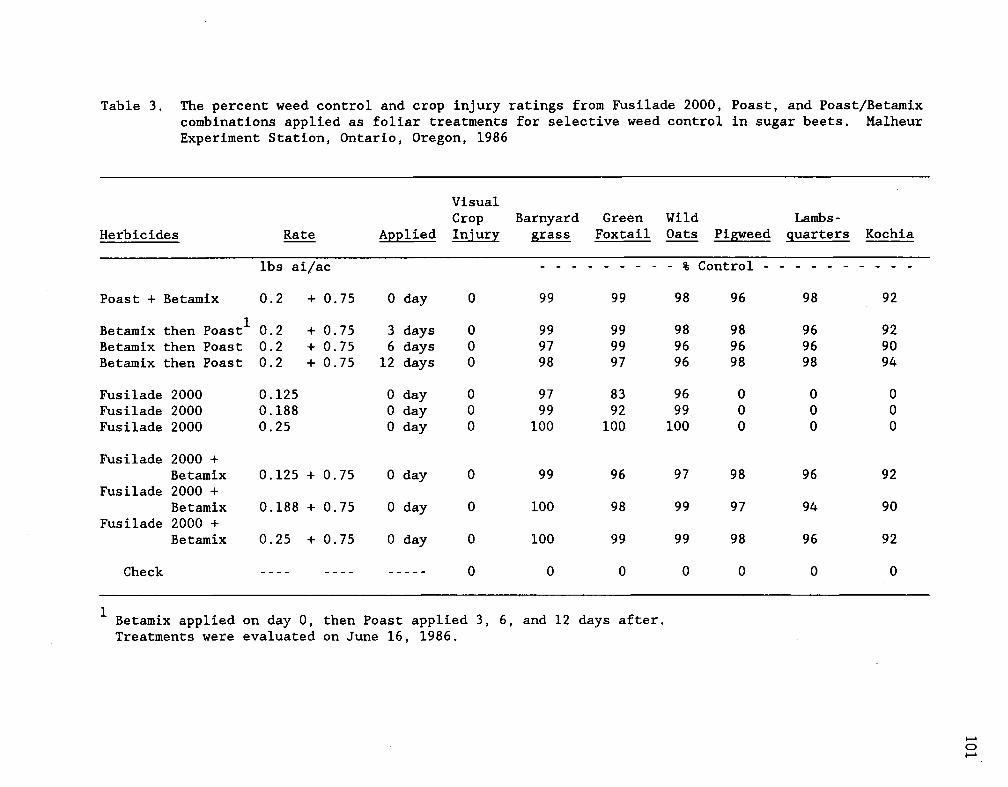
Table 3. The percent weed control and crop injury ratings from Fusilade 2000, Poast, and Poast/Betamixcombinations applied as foliar treatments for selective weed control in sugar beets. MalheurExperiment Station, Ontario, Oregon, 1986
VisualCrop Barnyard Green Wild Lambs-
Herbicides Rate Applied Injury grass Foxtail Oats Pigweed quarters Kochia
lbs ai/ac % Control
Poast + Betamix 0.2 + 0.75 0 day 0 99 99 98 96 98 92
Betamix then Poastl 0.2 + 0.75 3 days 0 99 99 98 98 96 92Betamix then Poast 0.2 + 0.75 6 days 0 97 99 96 96 96 90Betamix then Poast 0.2 + 0.75 12 days 0 98 97 96 98 98 94
Fusilade 2000 0.125 0 day 0 97 83 96 0 0 0Fusilade 2000 0.188 0 day 0 99 92 99 0 0 0Fusilade 2000 0.25 0 day 0 100 100 100 0 0 0
Fusilade 2000 +Betamix 0.125 + 0.75 0 day 0 99 96 97 98 96 92
Fusilade 2000 +Betamix 0.188 + 0.75 0 day 0 100 98 99 97 94 90
Fusilade 2000 +Betamix 0.25 + 0.75 0 day 0 100 99 99 98 96 92
Check 0 0 0 0 0 0 0
1Betamix applied on day 0, then Poast applied 3, 6, and 12 days after.Treatments were evaluated on June 16, 1986.

Table 4. The percent weed control and crop injury ratings from Poast and Betamix applied asfoliar treatments for selective Weed Control in sugar beets. 'Malheur Experiment
1986Station, Ontario, Oregon,
Herbicides Rate
lbs ai/ac
Betamix + Poast 0.75 + 0.2
Betamix then Poast 0.75 + 0.2Betamix then Poast 0.75 + 0.2Betamix then Poast 0.75 + 0.2
Poast 0.2
Betamix 0.75
day 0 0 99 99
day 3 0 99 99day 6 0 97 99day 12 0 98 97
day 0 0 98 99
day 0 0 28 30
, % Control
98 98 93 91
98 99 95 9296 98 93 9096 98 95 92
87 0 0
12 98 94 92
Visualcrop Barnyard Green Wild Lambs-
Applied– thiurY grass 'oxtail Oats Pigweed quarters Kochia
Check 0 0
1 Evaluated on June 8, 1986.Betamix and Poast alone and Betamix + Poast tank Ix applied on day 0.
OBSERVATIONS ON THE EFFECT OF STRAW MULCHON SUGAR BEET STRESS AND PRODUCTIVITY
Clinton C. Shock, Charles E. Stanger, and Herb FutterMalheur Experiment Station, Ontario, Oregon, 1986
Purpose
Straw mulch was evaluated on a furrow-irrigated sugar beetfield to determine potential benefits in increased yield, bettersoil moisture status, and reduced soil erosion.
Summary
Straw mulch applied at 650 pounds per acre in alternatefurrows on a hill at 2 to 5 percent slope appeared to benefitsugar beet yields and sugar production. Soil moisture was enhanc-ed by the mulch. On August 4, sugar beet leaf canopies averaged7.0 F above air temperatures where the field was not strawed.Sugar beet canopies averaged 4.1°F less than air temperatureswhere straw was applied. Beet yields were 37.5 tons per acre onstrawed furrows compared with 30.1 tons per acre on non-strawedfurrows. Estimated sugar recovered was 10,030 pounds per acrefrom the strawed furrows compared with 7,540 pounds per acre innon-strawed furrows.
Experimental Site Description and Methods
Sugar beet variety Beta Seed 8654 was planted March 28,1986, on a sloping bench soil near Ontario, Oregon. The soil wasa Nyssa silt loam with 2 to 5 percent slope. Every other furrowin most of the field was mulched with wheat straw at the rate of650 pounds per acre. Strips in the field were left without strawmulch. Throughout the season, the field was watered by furrowirrigation in every other row. The mulched parts of the fieldwere watered only in the strawed furrows.
On August 4, observations were made on crop status and soilmoisture. Soil moisture was determined by digging replicatedsamples representative of the first foot of soil.
Stress on the crop was measured by use of a Standard Oil"Scheduler." The Scheduler measures the crop canopy temperature,air temperature, relative humidity, and solar radiation. TheScheduler calculates plant stress using the actual canopy temper-ature and compares it with maximum and minimum canopy tempera-tures at maximal and minimal moisture stress at the currentambient relative humidity and air temperature. Observations
103
were replicated four times at each of four locations north tosouth through the field for both strawed and non-strawed treat-ments.
The sugar beets were harvested October 29 and evaluated forsucrose and conductivity October 30 and 31 at the AmalgamatedSugar Company research laboratory at Nyssa, Oregon. Harvestswere replicated in four rows each of three locations north tosouth throughout the field for both strawed and non-strawedtreatments.
Results and Discussion
The first irrigation resulted in soil losses of 3 tons peracre from the straw mulched furrows and 17 tons per acre from thenon-strawed furrows.
As the season progressed, the beets in the non-strawed rowswilted in the afternoon. Soil moisture was less in the non-strawed rows (Table 1). The sugar beet leaves in the mulchedrows were able to maintain evaporative cooling, but the leaveson plants in non-strawed rows were unable to maintain cool plantcanopies (Table 1). Stress indices for crop without straw weremuch higher than the crop with straw.
Beet yields and estimated recoverable sugar were enhanced 25and 33 percent, respectively (Table 2). Recoverable sugar wasfound to be negatively correlated with August 4 observations ofleaf temperature, leaf temperature from air temperature, and theplant stress index. The sucrose content and conductivity variedmore with location north and south and by harvested row than bymulching treatment.
Conclusions
The application of straw mulch to gently sloping (2 to 5percent) furrows appeared to decrease soil loss, decrease plantstress, and increase sugar beet and sucrose yields. The promis-ing results would justify testing the effects of straw mulch in acomplete-block randomized design so that conclusions could bereached with greater confidence.
Acknowledgments
The sugar beet crop was planted and cared for by Dick Tiptonof Ontario, Oregon. Sugar beet samples were analyzed by DonOldemeyer of Amalgamated Sugar Company of Nyssa, Oregon. TheScheduler equipment used to measure sugar beet canopy temperatureand plant stress was provided by Bronson Gardner of Standard Oil.Soil losses were calculated by Herb Futter of the Soil Conserva-tion Service.
104

Table 1. Observations on the effect of straw mulch on the leaf canopy temperature and estimatedrelative stress of sugar beets, 1:30 to 2:30 p.m., August 4, 1986. Other parameterswere measured at the same time. Dick Tipton's sugar beets, Ontario, Oregon.
Beet SoilAir Canopy Temperature Relative Plant Solar Wind Moisture in
Treatment Temperature Temperature Difference Humidity Stress Index Radiation Speed The Top FootuF uF °F % PSI Watts MPH Inches/ft
No Straw 90.2 97.2 + 7.0 22.9 1.27 1085 2.7 2.05
Straw 91.4 87.3 - 4.1 26.7 .44 1084 1.8 3.00
Table 2. Effects of straw mulch on sugar beet productivity.Dick Tipton's sugar beets, harvested October 29, 1986,Ontario, Oregon.
EstimatedBeet Sucrose Conductivity Sugar
Treatment Yield Content Recoveredtons/ac pohms lbs/ac
No Straw 30.1 15.1 974 7,540
Straw 37.5 16.1 938 10,030
TAILWATER AND SOIL PERSISTENCE STUDY USINGSULFONYLURFA HERBICIDES
Charles E. 'Stanger'Malheur Experiment Station, Ontario, Oregon, 1986
Purpose
The experiments were conducted: 1) to determine ifsulfonylurea herbicides will move with tailwater when these herb-icides are applied to seedling wheat and irrigated by surfaceirrigation, 2) to determine if sulfonylurea herbicides can per-sist to injure sensitive crops if planted within seven weeksafter the sulfonylurea herbicides were applied to seedling wheat.
Procedures
Tailwater Study
DPX-L5300 (Express), DPX-R9674 (Matrix), and 2,4-D-tanvel Dmixture were applied as strip treatments on April 17 to fall-planted Stephens wheat. Each treated strip was 14 feet wide and400 feet long. Application rates for Express were 0.125 and 0.25ounces active ingredient per acre, Matrix rates were 0.375 and0.5 ounces active ingredient per acre, and 2,4-D-Banvel D rateswere 0.75 and 0.12 pounds acid equivalents per acre. Each treat-ment was replicated two times. The herbicide applications wereapplied using a single-wheel plot sprayer. Spray pressure was 35.psi applying water as the herbicide carrier at a volume of 28gallons per acre. Spray nozzles were teejet fan, size 8002, andthe herbicides were applied as double-overlap broadcast treat-ments. The wheat had three to four tillers when the herbicideswere applied. Weed species present when the herbicides wereapplied included prickly lettuce, tumbling mustard, blue mustard,kochia, shepherds purse, and tansy mustard. All plants of eachweed species were small and susceptible to the herbicide treat-ments, resulting in good weed control.
Soil samples were taken from the 0- to 4-inch depth fromeach plot. The samples were taken using a 0.75-inch soil tube.The soil was probed at 24 locations and composited to consist ofa sample. The 'samples were frozen for later analysis.
Golden Cascade sweet Spanish onions and Mono-Hy R1 varietyof sugar beets were planted on April 28 below the wheat pre-viously treated with sulfonylurea herbicides. Both crops wereplanted on '22-inch row spacing and the crops were planted alter-nating the rows across the width of the herbicide-treated area.The winter wheat vas irrigated on April 29 and the tailwater fromthe area planted to wheat was used to irrigate the sugar beetsand onions. Water samples of the tailwater coming off theherbicide-treated wheat were collected. The water samples were
106
taken from each replication of the herbicide-treated strips andfrozen for chemical analysis.
Irrigation continued through the summer on the wheat withthe tailwater used to irrigate the sugar beets and onions. Standcounts were taken of the sugar beets and onions at emergence todetermine if the tailwater contained sulfonylurea herbicides tocause injury to the crops. All onions and sugar beets were hand-thinned and weeded. On May 19 before thinning, plants wereharvested from six linear feet of row at six locations per repli-cation to obtain dry weights as a measure of plant growth andvigor. The bulbs of onions and roots of sugar beets were harvest-ed on October 19 to obtain yield and quality data.
Soil Residue Study:
Stephens wheat was treated with Express and Matrix on May 13using rates of Express at 0.25 and 0.5 and Matrix at 0.375 and0.75 ounces active ingredients per acre. The wheat was fullytillered and the stems were starting to elongate. Individualplots were 14 feet wide and 40 feet long. The herbicides wereapplied with a bicycle wheel plot sprayer and a boom with 10-inchnozzle spacings to apply the herbicides as double-overlap broadcast treatments. Water as the herbicide carrier was used at avolume of 57 fluid ounces per plot. Spray pressure was 35 psiand nozzles were fan teejet size 8002. Skies were partly cloudywhen treatments were applied and air and soil temperatures were68
o and 62
oF, respectively. Soil temperature was recorded at a
depth of four inches. Soils were dry on the surface but moistbelow. At both experimental sites, soil texture was a silt loamwith a pH of 7.3 and an organic matter content of 1.2 percent.The wheat in the trial area was irrigated on May 15, May 29, andJune 10 by rill-type irrigations.
On June 15, the wheat was clipped and the straw residueremoved from the trial plots. The soil was rototilled to a depthof four inches on June 18 and the seed bed prepared for plantingsugar beets and onions on June 26. After planting, the cropswere corrugated and watered by furrow irrigation to supply soilmoisture for seed germination and seedling growth. Plant countswere taken at plant emergence to determine emergence rates andrate of seedling growth between herbicide treatments. Plantsamples were taken and dry weights measured to study differencesbetween treatments in rate of plant growth. Samples were takenfrom five locations in each replication and included both rootsand foliage.
Results
Observations and measurements of plot emergence, plantgrowth, and harvested yields indicate that irrigating sugar beetsand onions with tailwater from a wheat field treated with Expressor Matrix had no detrimental effect on these crops (Tables 1 and2). The crops grew normally and harvested yields were comparableto yields from control plots.
107

Express and Matrix applied to wheat at X and 2X rates didnot persist in the soil to affect emergence rate or plant growthof onions and sugar beets when the wheat straw residue was re-moved and the soil tilled to depth of four inches and the cropplanted seven weeks after the herbicides were applied.
108
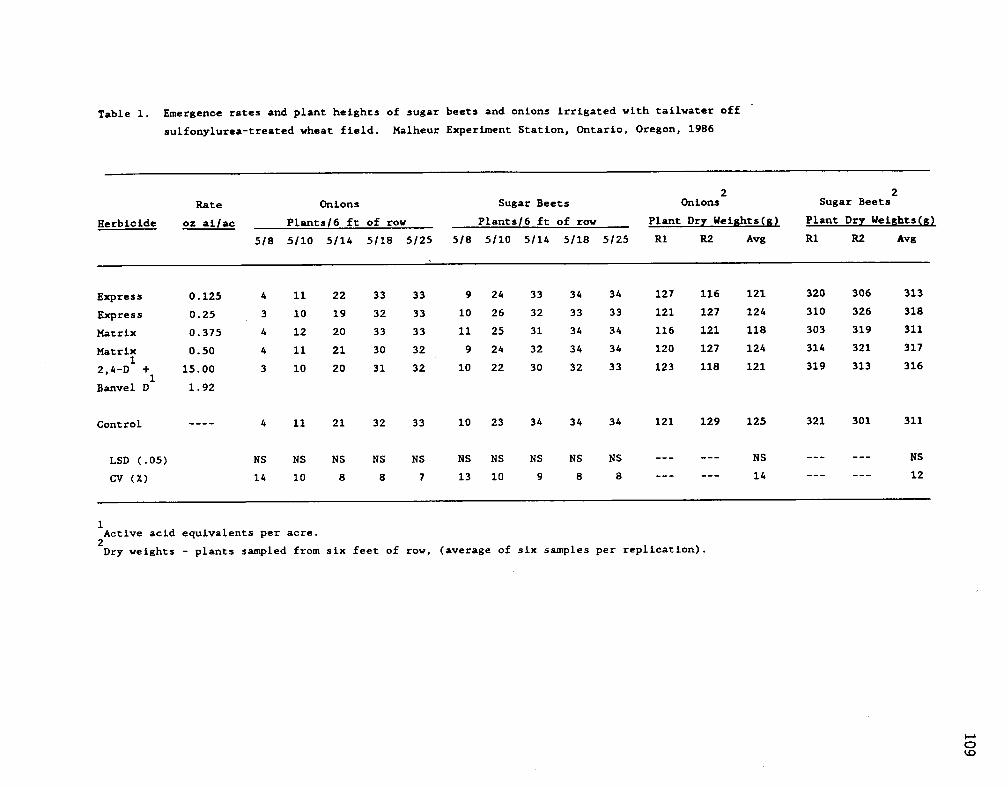
Table 1. Emergence rates and plant heights of sugar beets and onions irrigated with tailwater off
sulfonylurea-treated wheat field. Malheur Experiment Station, Ontario, Oregon, 1986
Herbicide
Rate
oz ai/ac
Onions
Plants/6 ft of row
Sugar Beets
Plants/6 ft of row
2Onions
Plant Dry Weights(g)
2Sugar Beets
Plant Dry Weights(g)
5/8 5/10 5/14 5/18 5/25 5/8 5/10 5/14 5/18 5/25 R1 R2 Avg R1 R2 Avg
Express 0.125 4 11 22 33 33 9 24 33 34 34 127 116 121 320 306 313
Express 0.25 3 10 19 32 33 10 26 32 33 33 121 127 124 310 326 318
Matrix 0.375 4 12 20 33 33 11 25 31 34 34 116 121 118 303 319 311
Matrix 0.50 4 11 21 30 32 9 24 32 34 34 120 127 124 314 321 3171
2,4-D + 15.00 3 10 20 31 32 10 22 30 32 33 123 118 121 319 313 3161
Banvel D 1.92
Control 4 11 21 32 33 10 23 34 34 34 121 129 125 321 301 311
LSD (.05) NS NS NS NS NS NS NS NS NS NS NS NS
CV (7.) 14 10 8 8 7 13 10 9 8 8 14 12
1Active acid equivalents per acre.
2Dry weights - plants sampled from six feet of row, (average of six samples per replication).

Table 2. Harvested yields of sugar beets and onions irrigated with tailwater offsulfonylurea-treated wheat fields. Malheur Experiment Station, Ontario,Oregon, 1986
Sugar Beet Yields Rate - Yield of OOnion BUlbs
1 - Recoverable
Herbicides oz ai/ac 2 1/4-3" 374O! > 4" Total Roots Sucrose Purity Sugar cwt/ac T/A lbs/ac
Express 0.125 89 298 201 588 32.6 16.2 84.3 8,904Express 0.25 96 310 198 604 31.9 16.1 84.7 8,700Matrix 0.375 81 301 210 592 32.1 16.0 84.5 8,680Matrix 0.50 90 295 207 592 30.9 16.2 84.2 8,4302,4-D + 15.00 92 313 192 597 31.3 16.1 84.6 8,526Banvel D 1.92
Control 87 305 194 586 31.7 16.1 84.4 8,615
LSD (.05) NS NS NS NS NS NS NS NSCV (%) 16 11 9 7 8 4 5 6
1Diameter of onion bulbs.
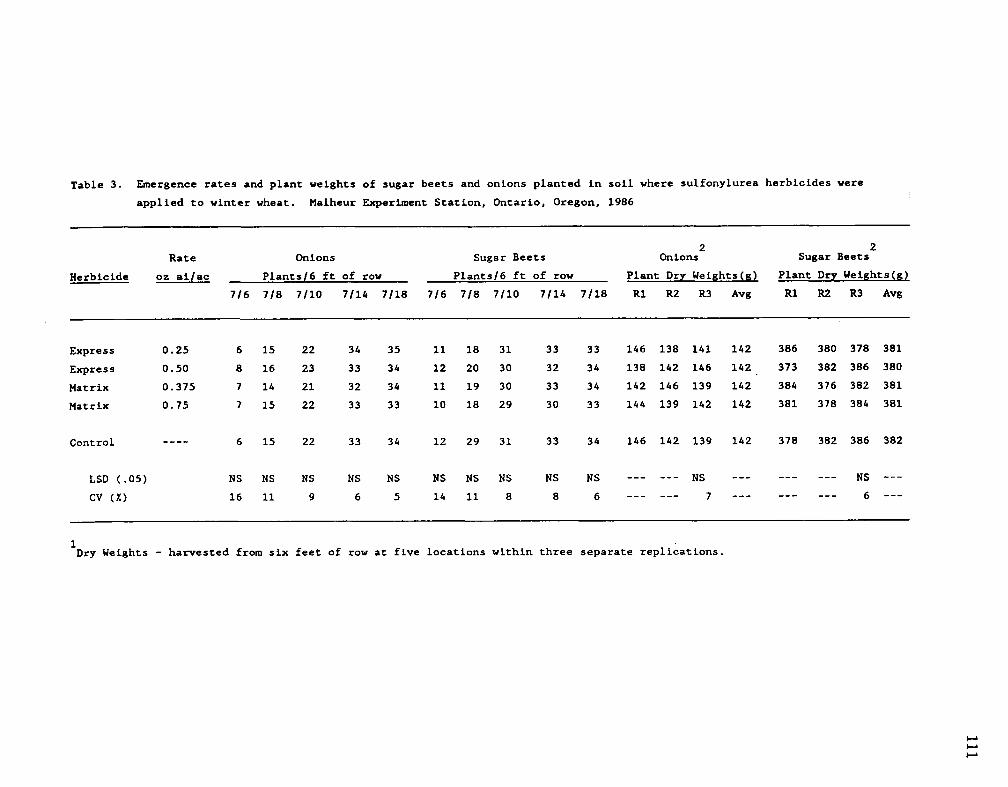
Table 3. Emergence rates and plant weights of sugar beets and onions planted in soil where sulfonylurea herbicides were
applied to winter wheat. Malheur Experiment Station, Ontario, Oregon, 1986
Herbicide
Rate
oz ai/ac
Onions
Plants/6 ft of row
Sugar Beets
Plants/6 ft of row
2Onions
Plant Dry Weights(g)
2Sugar Beets
Plant Dry Weights(g)
7/6 7/8 7/10 7/14 7/18 7/6 7/8 7/10 7/14 7/18 R1 R2 R3 Avg R1 R2 R3 Avg
Express 0.25 6 15 22 34 35 11 18 31 33 33 146 138 141 142 386 380 378 381
Express 0.50 8 16 23 33 34 12 20 30 32 34 138 142 146 142 . 373 382 386 380
Matrix 0.375 7 14 21 32 34 11 19 30 33 34 142 146 139 142 384 376 382 381
Matrix 0.75 7 15 22 33 33 10 18 29 30 33 144 139 142 142 381 378 384 381
Control 6 15 22 33 34 12 29 31 33 34 146 142 139 142 378 382 386 382
LSD (.05) NS NS NS NS NS NS NS NS NS NS NS ---
CV (X) 16 11 9 6 5 14 11 8 8 6 --- 7
1Dry Weights - harvested from six feet of row at five locations within three separate replications.
Related Documents