Visualization and post-processing tools for Siesta Andrei Postnikov Univ ersi t´ e Paul Verla ine, Met z Lyon, June 22, 2006

Welcome message from author
This document is posted to help you gain knowledge. Please leave a comment to let me know what you think about it! Share it to your friends and learn new things together.
Transcript

7/22/2019 Postnikov Visual
http://slidepdf.com/reader/full/postnikov-visual 1/43
Visualization and post-processing tools for Siesta
Andrei Postnikov
Universite Paul Verlaine, Metz
Lyon, June 22, 2006

7/22/2019 Postnikov Visual
http://slidepdf.com/reader/full/postnikov-visual 2/43
What to visualize..?
The structure (unit cell, positions of atoms)
Charge (spin) density ρ(r), or “local density of states”:properties on the grid
Kohn-Sham wavefunctions: properties expanded over the basisfunctions
Fermi surfaces (or other isoenergy surfaces in k-space)
Molecular dynamics or relaxation: how the atoms moves (a movie)
Phonon vibration modes (after a Vibra/vibrator run)
A.Postnikov (Universite Metz) Vizualization and post-processing tools June 2007 2 / 11

7/22/2019 Postnikov Visual
http://slidepdf.com/reader/full/postnikov-visual 3/43
What to visualize..?
Atomic structure
The error-free choice of structure (unit cell,positions of atoms) is the full responsibilityis on the user; only minimal checks are doneby Siesta (e.g., “atoms too close”).
Since the input format is quite flexible (a big advantage!), it is difficult toorganize a simple viewer of input structure data, without using the fdf routines. However, the .XV file (created after the completion of electronicstructure loop) contains all necessary information, as it was really
understood by Siesta
, in a fixed format: unit cell vectors and atomcoordinates (all in Bohr). This file can be easily transformed to, e.g. .xyzformat which is read by many vizualization programs (xmakemol, ...).
In the following examples, we’ll use XCrySDen.
A.Postnikov (Universite Metz) Vizualization and post-processing tools June 2007 2 / 11

7/22/2019 Postnikov Visual
http://slidepdf.com/reader/full/postnikov-visual 4/43
What to visualize..?
Charge/spin density; local density of states
These are scalar fields available, after a Siestarun, on a 3-dim. mesh (the number of divi-sions along three lattice vectors is governed bythe MeshCutoff parameter). A typical graphi-cal representation of such scalar fields is by con-tour plots in 2-dim. cutting planes, and/or iso-surfaces of a givel level. Both representations are possible with XCrySDen.
Kohn-Sham wavefunctions
These are also scalar functions of spatial coordinates, but obtained inSiesta as expression over basis functions. Their visual representation (as2-dim. contours in a chosen plane, or 3-dim. isosurfaces) is handled by thedenchar code. denchar allows export of data in the Gaussian cubeformat, which can be read in by XCrySDen.
A.Postnikov (Universite Metz) Vizualization and post-processing tools June 2007 2 / 11

7/22/2019 Postnikov Visual
http://slidepdf.com/reader/full/postnikov-visual 5/43
What to visualize..?
Fermi surfaces
can be calculated using the energy dispersion data E (k), available fromany band structure code. The difficulty of purely technical character is,how to construct energy isosurfaces and conveniently manipulate them (tochoose viewpoint, select different sheets of the Fermi surface, etc.) This
job is done within XCrySDen, provided the E (k) data are passed in a rightformat.
A.Postnikov (Universite Metz) Vizualization and post-processing tools June 2007 2 / 11

7/22/2019 Postnikov Visual
http://slidepdf.com/reader/full/postnikov-visual 6/43
7/22/2019 Postnikov Visual
http://slidepdf.com/reader/full/postnikov-visual 7/43
7/22/2019 Postnikov Visual
http://slidepdf.com/reader/full/postnikov-visual 8/43
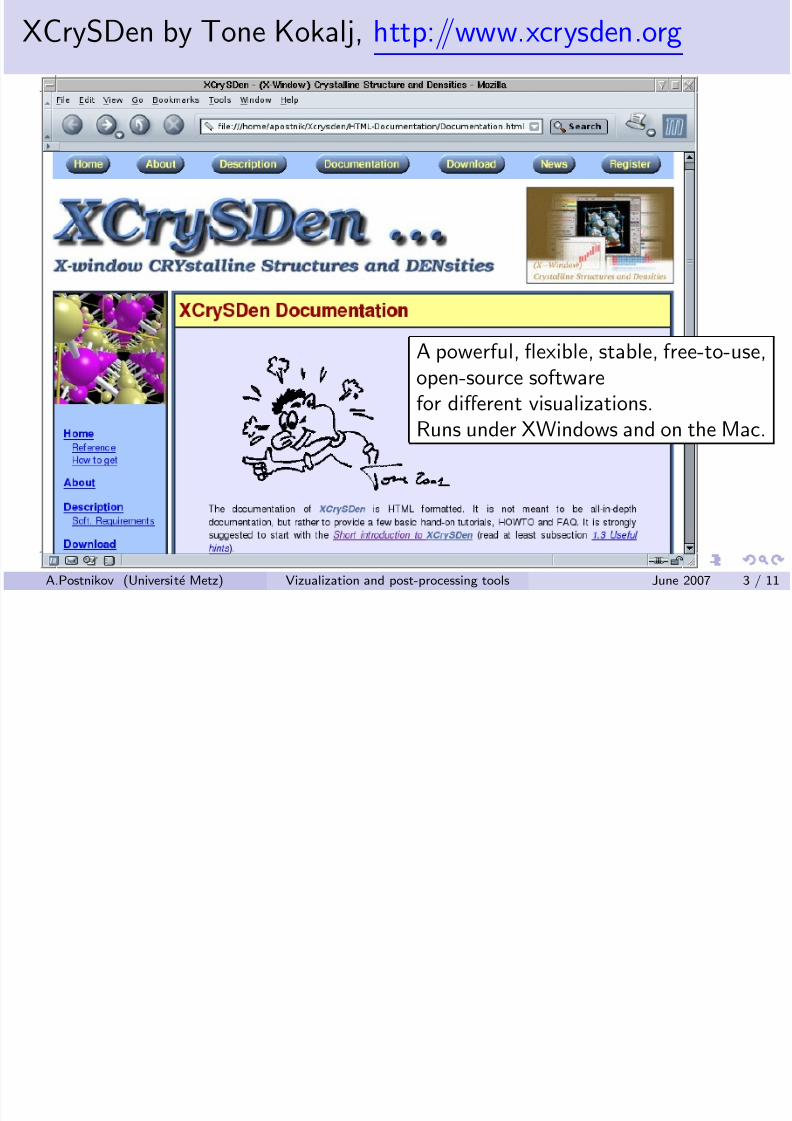
Enables different presentations
of atoms and bonds (colors, shadows, ...),measuring distances and angles ...
A.Postnikov (Universite Metz) Vizualization and post-processing tools June 2007 4 / 11

7/22/2019 Postnikov Visual
http://slidepdf.com/reader/full/postnikov-visual 9/43
Allows to set arrows on atoms(or, on fictituous atoms)and make animations ...
A.Postnikov (Universite Metz) Vizualization and post-processing tools June 2007 4 / 11

7/22/2019 Postnikov Visual
http://slidepdf.com/reader/full/postnikov-visual 10/43
Allows to make contour plots,to draw isosurfaces,to choose path through the Brillouin zone,to use different modiof presenting the Fermi surfaces
A.Postnikov (Universite Metz) Vizualization and post-processing tools June 2007 4 / 11

7/22/2019 Postnikov Visual
http://slidepdf.com/reader/full/postnikov-visual 11/43

7/22/2019 Postnikov Visual
http://slidepdf.com/reader/full/postnikov-visual 12/43

7/22/2019 Postnikov Visual
http://slidepdf.com/reader/full/postnikov-visual 13/43
Format of XCrySDen input files (.xsf, .axsf, .bxsf)
... including forces(or, velocities),
for isolated molecules
A.Postnikov (Universite Metz) Vizualization and post-processing tools June 2007 5 / 11

7/22/2019 Postnikov Visual
http://slidepdf.com/reader/full/postnikov-visual 14/43
Format of XCrySDen input files (.xsf, .axsf, .bxsf)
... as well as for periodic structures
A.Postnikov (Universite Metz) Vizualization and post-processing tools June 2007 5 / 11
Si 2 f ili i

7/22/2019 Postnikov Visual
http://slidepdf.com/reader/full/postnikov-visual 15/43
Sies2xsf utilities
Where to find them:
· · · siesta-2.0/Util/Contrib/APostnikov/
http://www.home.uni-osnabrueck.de/apostnik/Downloads ,or mailto [email protected] or [email protected]
What are they:
xv2xsf : .XV →
.XSF (view structure + cell)rho2xsf : .XV, .RHO or .LDOS → .XSF(atoms within a selected box + data grids)
md2axsf : .XV, .ANI or .MD → .AXSF(animations of structure with fixed or variable cell)
eig2bxsf : .XV, .KP and .EIG → .BXSF (Fermi surfaces)
vib2xsf : .XV and .vectors → .XSF and .AXSFfor each selected phonon mode; static (with arrows to indicatedilacement patterns) and dynamic (animated phonon).
A.Postnikov (Universite Metz) Vizualization and post-processing tools June 2007 6 / 11
Vi li i f Ch / i d i i f LDOS
7/22/2019 Postnikov Visual
http://slidepdf.com/reader/full/postnikov-visual 16/43
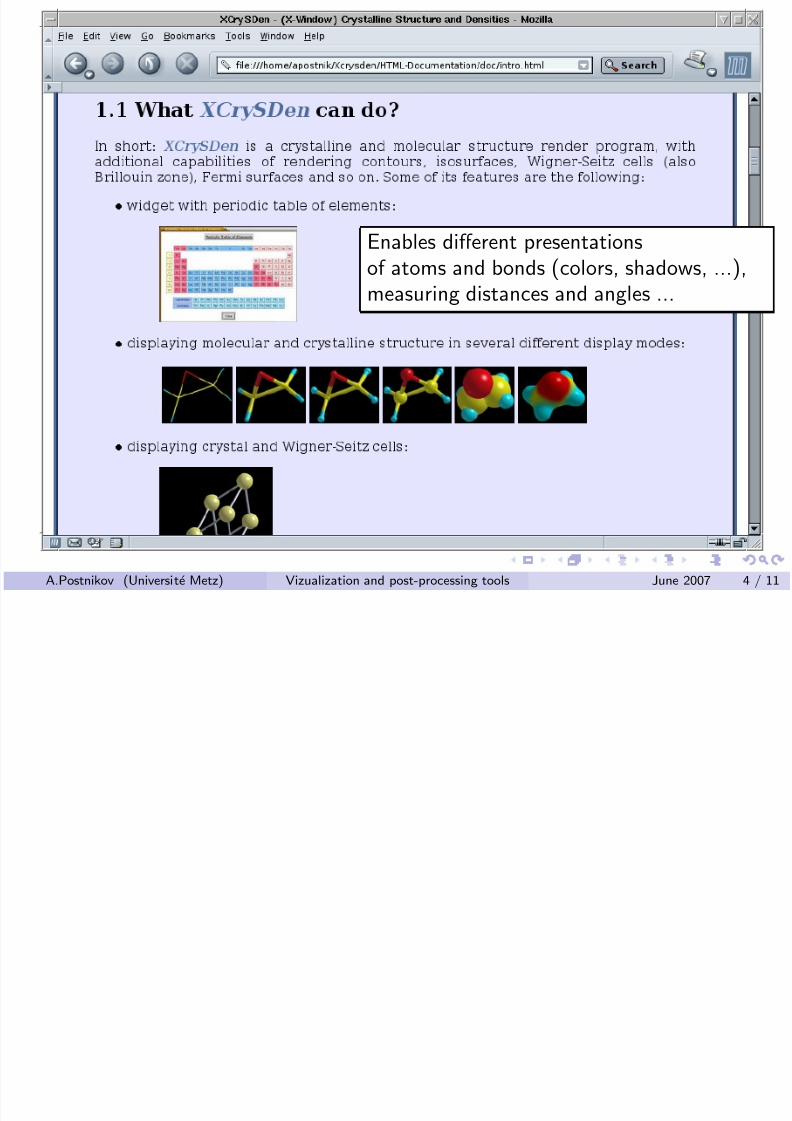
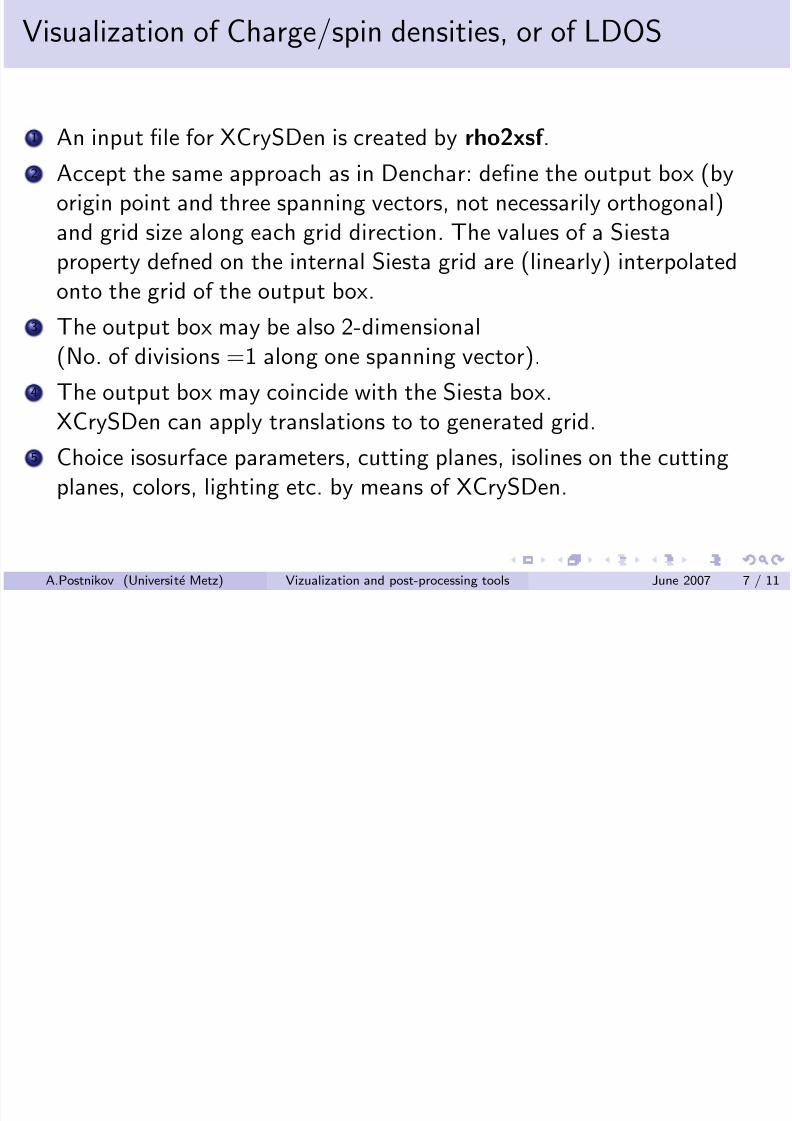
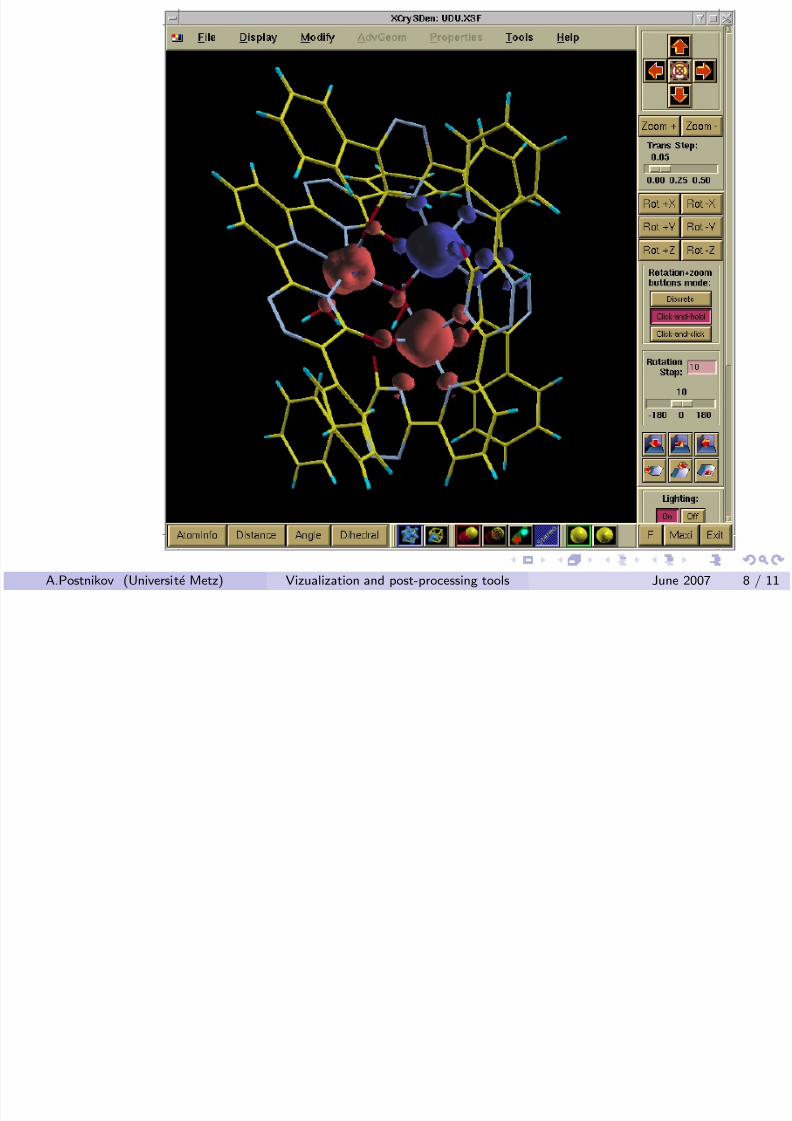
Visualization of Charge/spin densities, or of LDOS
1 An input file for XCrySDen is created by rho2xsf .2 Accept the same approach as in Denchar: define the output box (by
origin point and three spanning vectors, not necessarily orthogonal)and grid size along each grid direction. The values of a Siestaproperty defned on the internal Siesta grid are (linearly) interpolated
onto the grid of the output box.
3 The output box may be also 2-dimensional(No. of divisions =1 along one spanning vector).
4 The output box may coincide with the Siesta box.
XCrySDen can apply translations to to generated grid.5 Choice isosurface parameters, cutting planes, isolines on the cutting
planes, colors, lighting etc. by means of XCrySDen.
A.Postnikov (Universite Metz) Vizualization and post-processing tools June 2007 7 / 11

7/22/2019 Postnikov Visual
http://slidepdf.com/reader/full/postnikov-visual 17/43
A.Postnikov (Universite Metz) Vizualization and post-processing tools June 2007 8 / 11

7/22/2019 Postnikov Visual
http://slidepdf.com/reader/full/postnikov-visual 18/43
A.Postnikov (Universite Metz) Vizualization and post-processing tools June 2007 8 / 11

7/22/2019 Postnikov Visual
http://slidepdf.com/reader/full/postnikov-visual 19/43
A.Postnikov (Universite Metz) Vizualization and post-processing tools June 2007 8 / 11
7/22/2019 Postnikov Visual
http://slidepdf.com/reader/full/postnikov-visual 20/43
A.Postnikov (Universite Metz) Vizualization and post-processing tools June 2007 8 / 11
Visualization of Wave Functions

7/22/2019 Postnikov Visual
http://slidepdf.com/reader/full/postnikov-visual 21/43
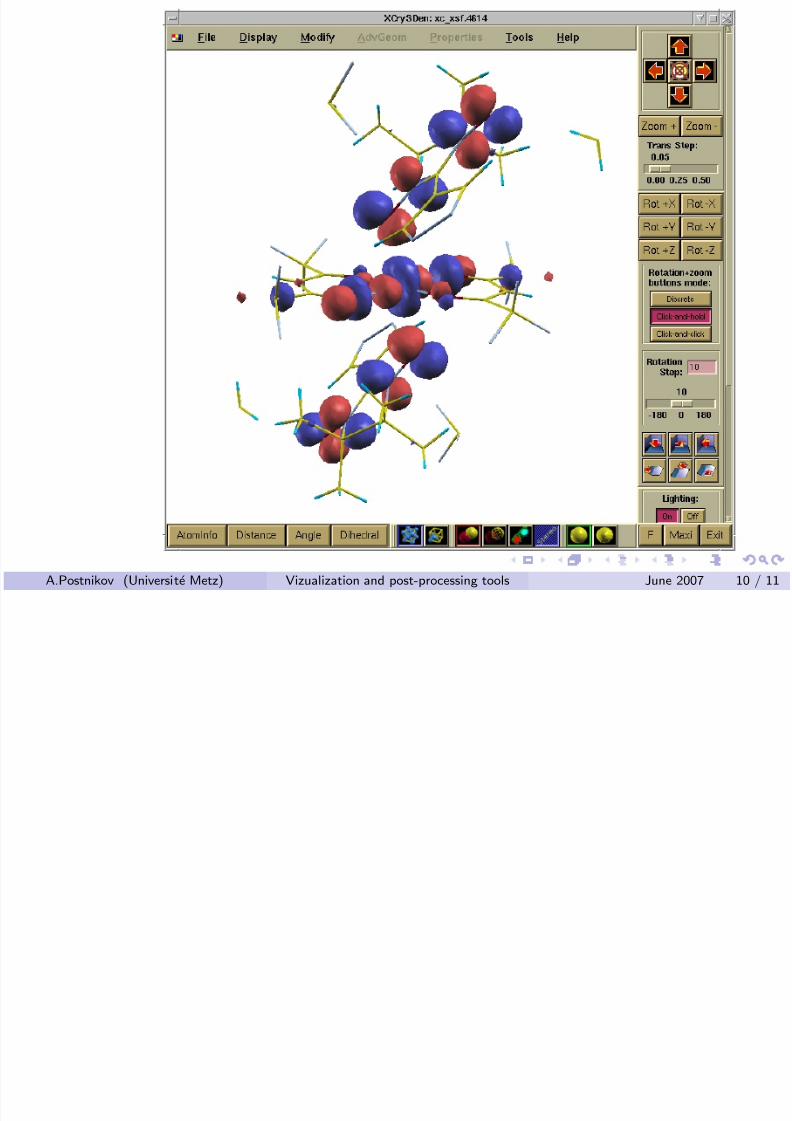
Visualization of Wave Functions
1
Use Denchar, define output box there, save result as Gaussian98Cube file.
2 Read this Gausian98 Cube file into XCrySDen. Save in the XCrySDenformat .xsf ( → A).
3 A bug (or a feature?) in Denchar: it correctly translates the WF
images (grid) over the output box, but not atoms.
4 How to fix: run rho2xsf , define the same output box as in Denchar.Save the atom part in the XCrySDen format .xsf ( → B).
5 Insert (by hand) the “correct” atom part from (B)
into the place of “incomplete” atom part from (A).6 If needed, merge many grid blocks (which reside in different .xsf files,
each exported from its own Gausian Cube) into a single .xsf file.
A.Postnikov (Universite Metz) Vizualization and post-processing tools June 2007 9 / 11

7/22/2019 Postnikov Visual
http://slidepdf.com/reader/full/postnikov-visual 22/43
A.Postnikov (Universite Metz) Vizualization and post-processing tools June 2007 10 / 11

7/22/2019 Postnikov Visual
http://slidepdf.com/reader/full/postnikov-visual 23/43
A.Postnikov (Universite Metz) Vizualization and post-processing tools June 2007 10 / 11

7/22/2019 Postnikov Visual
http://slidepdf.com/reader/full/postnikov-visual 24/43
A.Postnikov (Universite Metz) Vizualization and post-processing tools June 2007 10 / 11
7/22/2019 Postnikov Visual
http://slidepdf.com/reader/full/postnikov-visual 25/43
A.Postnikov (Universite Metz) Vizualization and post-processing tools June 2007 10 / 11

7/22/2019 Postnikov Visual
http://slidepdf.com/reader/full/postnikov-visual 26/43
A.Postnikov (Universite Metz) Vizualization and post-processing tools June 2007 10 / 11
Visualization of Fermi surfaces

7/22/2019 Postnikov Visual
http://slidepdf.com/reader/full/postnikov-visual 27/43
Visualization of Fermi surfaces
1 Calculate eigenvalues on a sufficiently fine,undicplaced k-mesh, i.e.
%block kgrid Monkhorst Pack
16 0 0 0.
0 16 0 0.
0 0 16 0.%endblock kgrid Monkhorst Pack
2 get files .XV, .KP, .EIG,run eig2bxsf → creates .BXSF(or .BXSF 1 and .BXSF 2
for spin-polarized case).
A.Postnikov (Universite Metz) Vizualization and post-processing tools June 2007 11 / 11
Visualization of Fermi surfaces

7/22/2019 Postnikov Visual
http://slidepdf.com/reader/full/postnikov-visual 28/43
Visualization of Fermi surfaces
1 Calculate eigenvalues on a sufficiently fine,undicplaced k-mesh, i.e.
%block kgrid Monkhorst Pack
16 0 0 0.
0 16 0 0.
0 0 16 0.%endblock kgrid Monkhorst Pack
2 get files .XV, .KP, .EIG,run eig2bxsf → creates .BXSF(or .BXSF 1 and .BXSF 2
for spin-polarized case).
A.Postnikov (Universite Metz) Vizualization and post-processing tools June 2007 11 / 11
Visualization of Fermi surfaces

7/22/2019 Postnikov Visual
http://slidepdf.com/reader/full/postnikov-visual 29/43
1 Calculate eigenvalues on a sufficiently fine,undicplaced k-mesh, i.e.
%block kgrid Monkhorst Pack
16 0 0 0.
0 16 0 0.
0 0 16 0.%endblock kgrid Monkhorst Pack
2 get files .XV, .KP, .EIG,run eig2bxsf → creates .BXSF(or .BXSF 1 and .BXSF 2
for spin-polarized case).
A.Postnikov (Universite Metz) Vizualization and post-processing tools June 2007 11 / 11
Visualization of Fermi surfaces

7/22/2019 Postnikov Visual
http://slidepdf.com/reader/full/postnikov-visual 30/43
1 Calculate eigenvalues on a sufficiently fine,undicplaced k-mesh, i.e.
%block kgrid Monkhorst Pack
16 0 0 0.
0 16 0 0.
0 0 16 0.%endblock kgrid Monkhorst Pack
2 get files .XV, .KP, .EIG,run eig2bxsf → creates .BXSF(or .BXSF 1 and .BXSF 2
for spin-polarized case).
A.Postnikov (Universite Metz) Vizualization and post-processing tools June 2007 11 / 11

7/22/2019 Postnikov Visual
http://slidepdf.com/reader/full/postnikov-visual 31/43
Fermi surfaces of some elemental metals

7/22/2019 Postnikov Visual
http://slidepdf.com/reader/full/postnikov-visual 32/43
NaAl
A.Postnikov (Universite Metz) Vizualization and post-processing tools June 2007 12 / 11
Fermi surfaces of some elemental metals

7/22/2019 Postnikov Visual
http://slidepdf.com/reader/full/postnikov-visual 33/43
NaAl Y
A.Postnikov (Universite Metz) Vizualization and post-processing tools June 2007 12 / 11
Fermi surface of MgB2

7/22/2019 Postnikov Visual
http://slidepdf.com/reader/full/postnikov-visual 34/43
over the reciprocal cell
over the Brillouin zone
A.Postnikov (Universite Metz) Vizualization and post-processing tools June 2007 13 / 11
Molecular Dynamics or Relaxation

7/22/2019 Postnikov Visual
http://slidepdf.com/reader/full/postnikov-visual 35/43
1 Calculate MD history:WriteMDhistory T
writes (updates existing) unformatted .MD file,either with or without variable cell;WriteMDXmol T
writes (updates existing) formatted .ANI file
(coordinates only, no variable cell information).2 Having .XV, and either .MD, or .ANI
run md2axsf, answering questions about the (optional) choice of output boxand the MD steps to visualize (first #; last #; keep only each #’s)→ creates .AXSF.
Hopefully, variable or fixed cell will be recognized automatically.If cell information from .MD is not available, the .XV will be used(assuming fixed cell).
A.Postnikov (Universite Metz) Vizualization and post-processing tools June 2007 14 / 11

7/22/2019 Postnikov Visual
http://slidepdf.com/reader/full/postnikov-visual 36/43
In order to see many unit cells,go to Modify → Number of Units drawn
A.Postnikov (Universite Metz) Vizualization and post-processing tools June 2007 15 / 11
7/22/2019 Postnikov Visual
http://slidepdf.com/reader/full/postnikov-visual 37/43
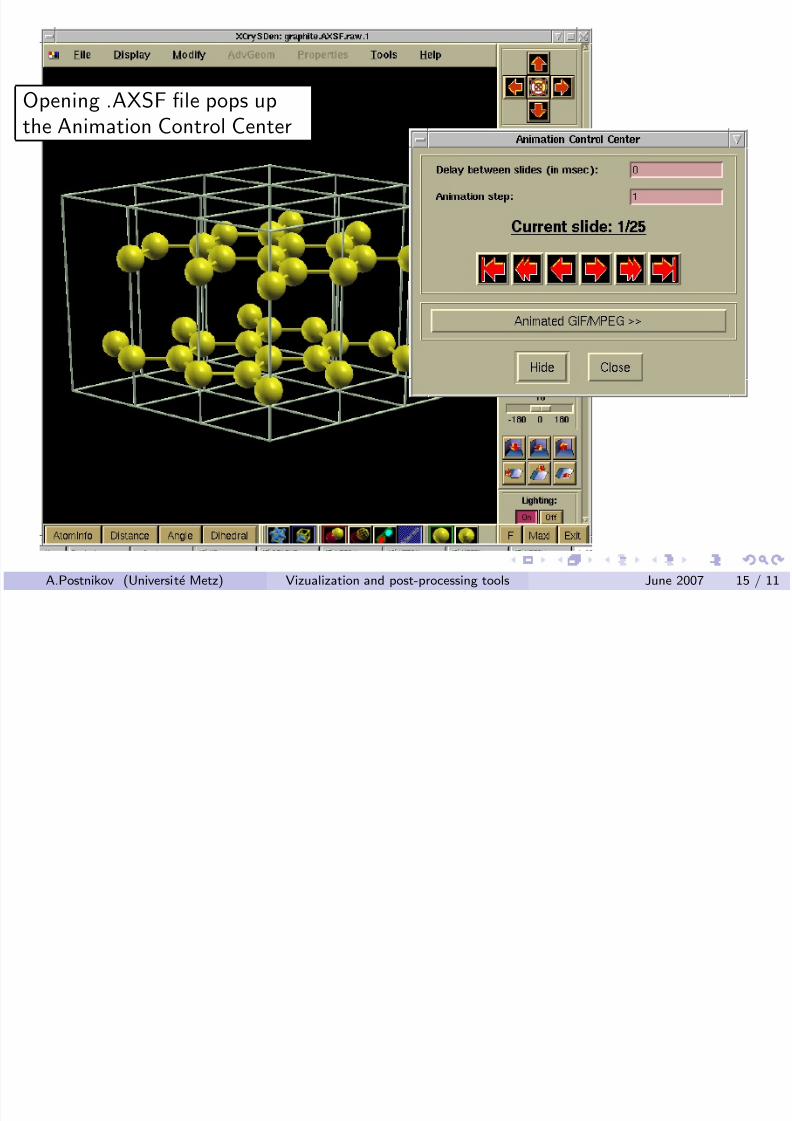
Opening .AXSF file pops upthe Animation Control Center
A.Postnikov (Universite Metz) Vizualization and post-processing tools June 2007 15 / 11
7/22/2019 Postnikov Visual
http://slidepdf.com/reader/full/postnikov-visual 38/43
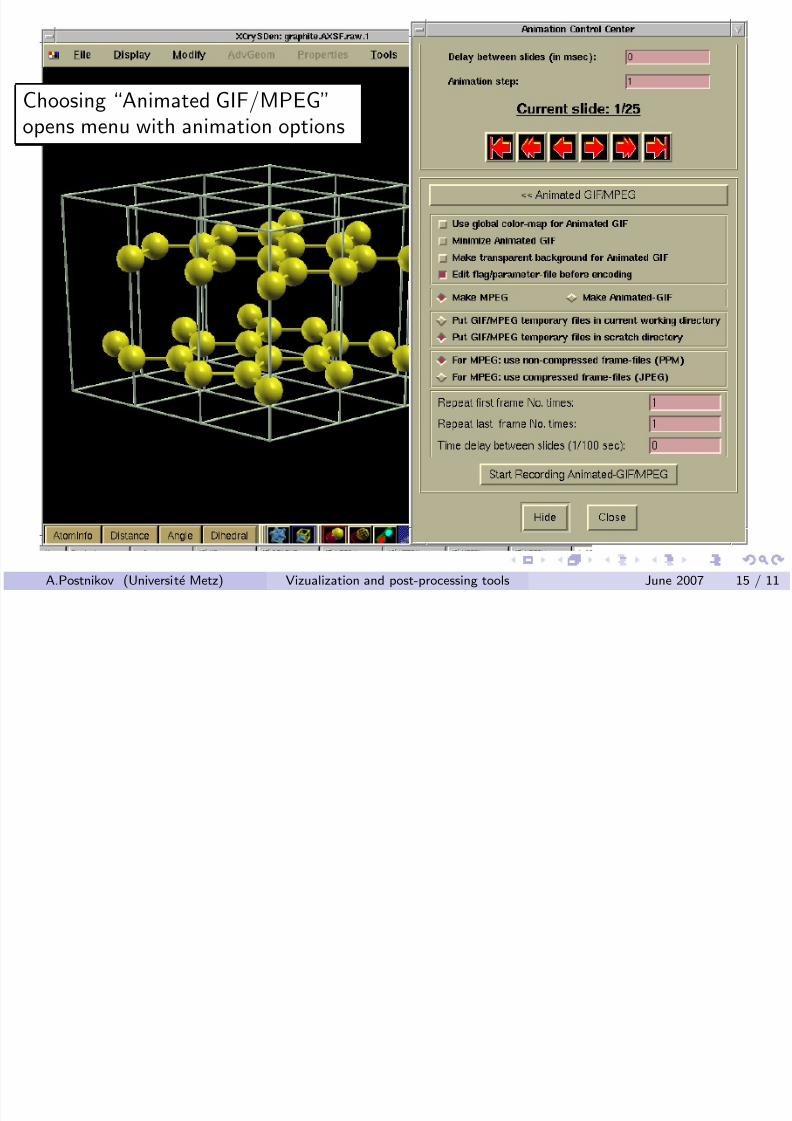
Choosing “Animated GIF/MPEG”opens menu with animation options
A.Postnikov (Universite Metz) Vizualization and post-processing tools June 2007 15 / 11

7/22/2019 Postnikov Visual
http://slidepdf.com/reader/full/postnikov-visual 39/43
... and saved!
A.Postnikov (Universite Metz) Vizualization and post-processing tools June 2007 15 / 11
Frozen phonons (zone-center only)

7/22/2019 Postnikov Visual
http://slidepdf.com/reader/full/postnikov-visual 40/43
1 get .vectors (calculated by vibrator) and .XV (from Siesta)
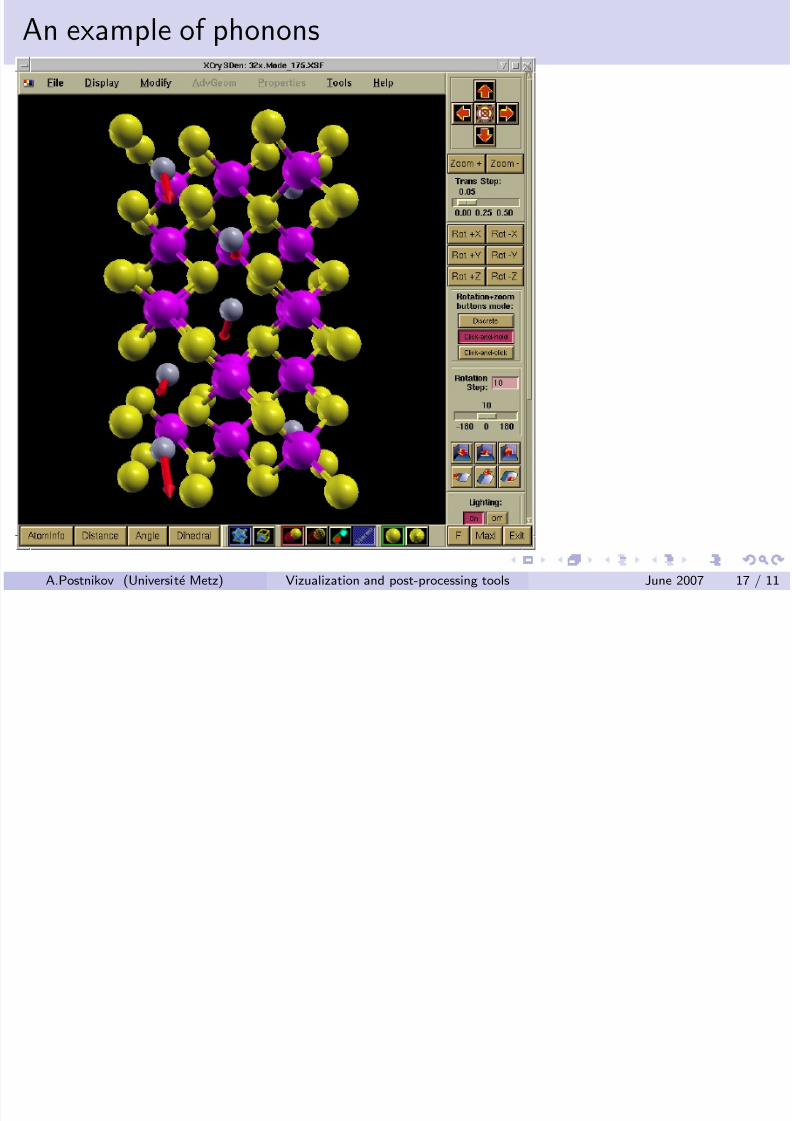
2 run vib2xsf, select # modes (first ... last) to vizualize. For eachselected mode, a separate .XSF file and an .AXSF file are created..XSF contains a static structures (as in .XV), with arrors added toeach atom to indicate displacement pattern..AXSF contains the animation of a phonon, for a (user-chosen)amplitude and number of steps.
A.Postnikov (Universite Metz) Vizualization and post-processing tools June 2007 16 / 11
An example of phonons
7/22/2019 Postnikov Visual
http://slidepdf.com/reader/full/postnikov-visual 41/43
A.Postnikov (Universite Metz) Vizualization and post-processing tools June 2007 17 / 11
An example of phonons

7/22/2019 Postnikov Visual
http://slidepdf.com/reader/full/postnikov-visual 42/43
A.Postnikov (Universite Metz) Vizualization and post-processing tools June 2007 17 / 11

7/22/2019 Postnikov Visual
http://slidepdf.com/reader/full/postnikov-visual 43/43
A.Postnikov (Universite Metz) Vizualization and post-processing tools June 2007 18 / 11
Related Documents