The Journal of Neuroscience, December 1994, 14(12): 7488-7501 Postnatal Development of the Tyrosine Hydroxylase-Containing Cell Population within the Rat Locus Coeruleus: Topological Organization and Phenotypic Plasticity Laurent Bezin, Dominique Marcel, Laure I. Debure, Nathalie Ginovart, Colette Rousset, Jean-Frangois Pujol, and Dinah Weissmann Laboratoire de Neuropharmacologie Molkxxlaire, CNRS-UCBL UMR 105, CERMET, 69003 Lyon, France The cellular phenotypic characteristics of tyrosine hydrox- ylase (TH) expression have been studied within the rat locus coeruleus (LC) during postnatal development at six different stages: postnatal day 4 (PND4), PNDlO, PND14, PND21, PNDBO, and PND42. Coronal brain sections were selected at intervals of 80 brn along the caudorostral extent of the LC and processed for TH immunohistochemistry. At each an- atomical level we (1) reconstructed the mean space of the LC delineated by the TH positive cell bodies, (2) enumerated the mean number of these cell bodies, and (3) determined the mean volume circumscribed by these cell bodies and their density. The topological study revealed a steady re- modeling of the structure until the third week, with a pro- gressive reducing of a ventral cellular group in the anterior LC, which was no longer observable at PND21, concomitant to the stretch of the structure toward its caudal limit. We have noted invariant and variant cellular phenotypic char- acteristics of TH expression. At any stage, the LC could be separated into a posterior and an anterior subregion and its total volume remained quite stable during the studied period. At PND14 and PND21, we observed a transient 33% increase in the total number of TH positive perikarya as compared to PND42. Conjoint analysis of the topological reconstruction and the density of TH positive cells suggested there were three distinct and precisely localized subsets of “quiescent” neurons. TH gene expression in these cells would have low- ered between PND14 and PNDPl inside two subsets and between PND21 and PND30 inside the last one. So topolog- ically defined populations of cells could be involved in spe- cific functions. If they have not definitively lost their TH ex- pression capacity, they could contribute to increasing TH levels in LC occurring in response to physiological pertur- bations or pharmacological treatments. [Key words: tyrosine hydroxylase, locus coeruleus, post- natal development, transient expression, immunohisto- chemistry, topology] Received Dec. 14, 1993; revised May 2, 1994; accepted June 2, 1994. This work was supported by grants from CNRS-UMR 105, Universitt? Claude Bernard Lvon I. DRET (5092 10). and MRT (9 1127). Corresp&de&e should be addressed to L&&t ‘Bezin, CNRS-UCBL UMR 105, CERMEP, 59, Bd Pinel, 69003 Lyon, France. Copyright 0 1994 Society for Neuroscience 0270-6474/94/147486-16.$05.00/O The tyrosine hydroxylase [TH: tyrosine 3-monooxygenase, L-ty- rosine, tetrahydropteridine: oxygen oxidoreductase (3-hydrox- ylating), EC 1.14.16.21,the rate-limiting enzyme in the cate- cholamine (CA) biosynthesis pathway (Nagatsu et al., 1964; Levitt et al., 1965), is detected at early stages of prenatal de- velopment within presumptive catecholaminergic neurons (Specht et al., 198 1). In the CNS, among the perikarya of the neurons that are clustered in several groups at the adult stage, the cell bodies of the locuscoeruleus (LC) neurons undergodeep histological reorganization until they attain their definitive po- sition within the brainstem in the late postnatal period (Sievers et al., 1981). Most of the LC neurons use noradrenaline (NA) as neuro- transmitter at the adult stage (Swanson, 1976;Luque et al., 1992) and the NA released by caeruleal neurons might be involved in the critical periodsof brain plasticity and regulatedifferent brain developmental steps (Seiger and Olson, 1973; Maeda et al., 1974; Kasamatsu and Pettigrew, 1976; Wendlandt et al., 1977; Kasamatsuand Pettigrew, 1979; Ebosoleet al., 198 1; Sievers et al., 1981; Lidov and Molliver, 1982; Pamavelas and Blue, 1982; Kasamatsu et al., 1989). Although the functional impor- tance of the LC appears early in development, there is experi- mental evidence suggesting that the steady state of the cate- cholamine content of the LC perikarya is reached late during the postnatal development (Maeda et Dresse, 1969; Sievers et al., 198 1). It is for this period of postnatal ontogeny that a physiological induction of TH expression hasalready been sug- gested (Zyzek et al., 1990). It has also been hypothesized that plasticity of phenotypic characters of TH expression could occur in the LC at adulthood. Indeed pharmacological treatments (De- bure et al., 1992; Blanchard et al., 1993) or physiological per- turbations (Richard et al., 1988; Schmitt et al., 1993) enhance TH expression in the adult rat LC. In one of these models, Debure et al. (1992) reported a significant increase in the number of TH mRNA-/and TH protein-positive cells. The phenotypic characterization of TH protein expression in the LC can be defined in terms of TH-expressing cells and ex- pressed TH protein. This study was devoted to the analysisof the postnatal evolution of TH expressing cells. The cellular pa- rameters necessary for the phenotypic characterization of TH expression were quantitatively determined. They corresponded to the mean number of TH-expressing cells, the mean limit of the spaceoccupied by these cells, the mean volume circum- scribed by these cells and the mean density of TH-expressing

Welcome message from author
This document is posted to help you gain knowledge. Please leave a comment to let me know what you think about it! Share it to your friends and learn new things together.
Transcript
The Journal of Neuroscience, December 1994, 14(12): 7488-7501
Postnatal Development of the Tyrosine Hydroxylase-Containing Cell Population within the Rat Locus Coeruleus: Topological Organization and Phenotypic Plasticity
Laurent Bezin, Dominique Marcel, Laure I. Debure, Nathalie Ginovart, Colette Rousset, Jean-Frangois Pujol, and Dinah Weissmann
Laboratoire de Neuropharmacologie Molkxxlaire, CNRS-UCBL UMR 105, CERMET, 69003 Lyon, France
The cellular phenotypic characteristics of tyrosine hydrox- ylase (TH) expression have been studied within the rat locus coeruleus (LC) during postnatal development at six different stages: postnatal day 4 (PND4), PNDlO, PND14, PND21, PNDBO, and PND42. Coronal brain sections were selected at intervals of 80 brn along the caudorostral extent of the LC and processed for TH immunohistochemistry. At each an- atomical level we (1) reconstructed the mean space of the LC delineated by the TH positive cell bodies, (2) enumerated the mean number of these cell bodies, and (3) determined the mean volume circumscribed by these cell bodies and their density. The topological study revealed a steady re- modeling of the structure until the third week, with a pro- gressive reducing of a ventral cellular group in the anterior LC, which was no longer observable at PND21, concomitant to the stretch of the structure toward its caudal limit. We have noted invariant and variant cellular phenotypic char- acteristics of TH expression. At any stage, the LC could be separated into a posterior and an anterior subregion and its total volume remained quite stable during the studied period. At PND14 and PND21, we observed a transient 33% increase in the total number of TH positive perikarya as compared to PND42. Conjoint analysis of the topological reconstruction and the density of TH positive cells suggested there were three distinct and precisely localized subsets of “quiescent” neurons. TH gene expression in these cells would have low- ered between PND14 and PNDPl inside two subsets and between PND21 and PND30 inside the last one. So topolog- ically defined populations of cells could be involved in spe- cific functions. If they have not definitively lost their TH ex- pression capacity, they could contribute to increasing TH levels in LC occurring in response to physiological pertur- bations or pharmacological treatments.
[Key words: tyrosine hydroxylase, locus coeruleus, post- natal development, transient expression, immunohisto- chemistry, topology]
Received Dec. 14, 1993; revised May 2, 1994; accepted June 2, 1994.
This work was supported by grants from CNRS-UMR 105, Universitt? Claude Bernard Lvon I. DRET (5092 10). and MRT (9 1127).
Corresp&de&e should be addressed to L&&t ‘Bezin, CNRS-UCBL UMR 105, CERMEP, 59, Bd Pinel, 69003 Lyon, France.
Copyright 0 1994 Society for Neuroscience 0270-6474/94/147486-16.$05.00/O
The tyrosine hydroxylase [TH: tyrosine 3-monooxygenase, L-ty- rosine, tetrahydropteridine: oxygen oxidoreductase (3-hydrox- ylating), EC 1.14.16.21, the rate-limiting enzyme in the cate- cholamine (CA) biosynthesis pathway (Nagatsu et al., 1964; Levitt et al., 1965), is detected at early stages of prenatal de- velopment within presumptive catecholaminergic neurons (Specht et al., 198 1). In the CNS, among the perikarya of the neurons that are clustered in several groups at the adult stage, the cell bodies of the locus coeruleus (LC) neurons undergo deep histological reorganization until they attain their definitive po- sition within the brainstem in the late postnatal period (Sievers et al., 1981).
Most of the LC neurons use noradrenaline (NA) as neuro- transmitter at the adult stage (Swanson, 1976; Luque et al., 1992) and the NA released by caeruleal neurons might be involved in the critical periods of brain plasticity and regulate different brain developmental steps (Seiger and Olson, 1973; Maeda et al., 1974; Kasamatsu and Pettigrew, 1976; Wendlandt et al., 1977; Kasamatsu and Pettigrew, 1979; Ebosole et al., 198 1; Sievers et al., 198 1; Lidov and Molliver, 1982; Pamavelas and Blue, 1982; Kasamatsu et al., 1989). Although the functional impor- tance of the LC appears early in development, there is experi- mental evidence suggesting that the steady state of the cate- cholamine content of the LC perikarya is reached late during the postnatal development (Maeda et Dresse, 1969; Sievers et al., 198 1). It is for this period of postnatal ontogeny that a physiological induction of TH expression has already been sug- gested (Zyzek et al., 1990). It has also been hypothesized that plasticity of phenotypic characters of TH expression could occur in the LC at adulthood. Indeed pharmacological treatments (De- bure et al., 1992; Blanchard et al., 1993) or physiological per- turbations (Richard et al., 1988; Schmitt et al., 1993) enhance TH expression in the adult rat LC. In one of these models, Debure et al. (1992) reported a significant increase in the number of TH mRNA-/and TH protein-positive cells.
The phenotypic characterization of TH protein expression in the LC can be defined in terms of TH-expressing cells and ex- pressed TH protein. This study was devoted to the analysis of the postnatal evolution of TH expressing cells. The cellular pa- rameters necessary for the phenotypic characterization of TH expression were quantitatively determined. They corresponded to the mean number of TH-expressing cells, the mean limit of the space occupied by these cells, the mean volume circum- scribed by these cells and the mean density of TH-expressing
The Journal of Neuroscience, December 1994, 14(12) 7487
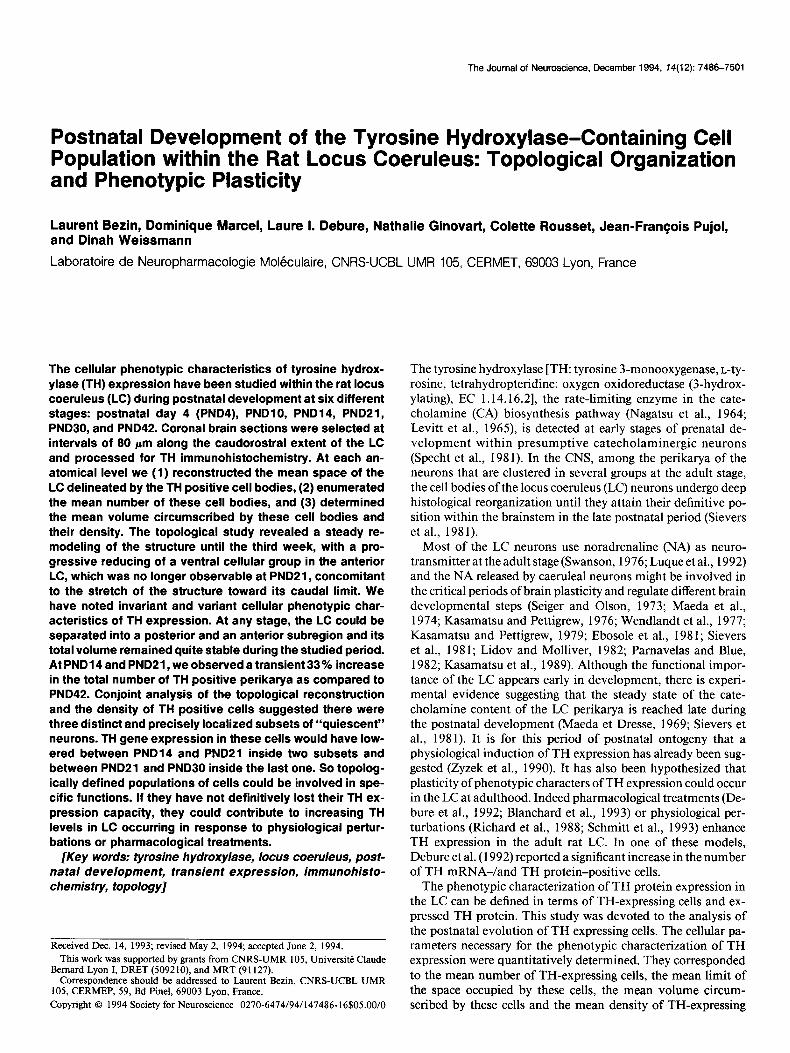
Table 1. Control of age groups by recording the body weight of the rats and experimental conditions (tissue preparation and freezing time of the brains) before TH immunocytochemical processing
Postnatal age
PND4 PNDlO (n = 5) (n = 5)
PND14 (n = 5)
PND2 1 (n = 6)
PND30 (n = 6)
PND42 (n = 6)
Body weight”
Tissue fixation
Freezing time
11.77 27.67 30.48 42.19 92.13 224.00 kO.61 kO.65 kO.4 kO.59 kO.79 k1.66 Fixed by Fixed by Postfixed Postfixed Postfixed Postfixed
immersion immersion 30 set 50 set 50 set 1 min 1 min 1 min
a Mean and SEM obtained for n animals.
perikarya. Each of these parameters was examined along the caudorostral extent of the structure at six different postnatal stages: postnatal day 4 (PND4), PNDl 0, PND14, PND2 1, PND30, and PND42.
Materials and Methods Animal and tissue preparation. All experiments were carried out in accordance with the French (87-848, Minis&e de 1’Agriculture et de la Foret) and the European Community (86-60, EEC) guidelines for care of laboratory animals and were approved by the regional ethical animal use committee.
OFA male rats (Iffa-Credo, Lyon, France) were considered at different postnatal stages: PND4, PNDlO, PND14, PND14, PND21, PND30, and PND42. The day of birth was taken as PNDO. Distorsions between animals belonging to the same postnatal stage were avoided by recording the body weight of the pups (Table 1). For rats aged from PND4 to PND 141 litters arrived at the animalery with a foster mother 3 d before experiments; those from PND21 to PND42 were kept 1 week under a 12: 12 hr dark/light cycle at 21°C with food and water ad libitum.
The detection of TH-containing cell bodies by immunohistochemical methods was carried out on postfixed tissue from PND14 to PND42 whereas it was performed on-tissue fixed by immersion at PND4 and PNDlO because of the fragility of the tissue. After decapitation, the brains were quickly removed from the skull. For PND4 and PNDlO rat brains, the brainstem was separated from the rest of the brain and immersed in a cold (4°C) mixture of 4% paraformaldehyde (Merck) and 0.2% picric acid (Sigma) in 0.1 M Sorensen buffer for 72 hr. They were then immersed overnight to a cold (4°C) sucrose solution (10% for PND4 and 20% for PND 10) in 0.1 M Sorensen buffer and snap-frozen by immersion in cooled (-30°C; Table 1) liquid isopentane (Merck). PND 14-PND42 brains were frozen by immersion in isopentane (- 30°C Table 1). During freezing, the ventral side of the brains was carefully set on a plane surface to prevent distorsions of the longitudinal axis of the brain. All brains were stored at -80°C until further use.
Before cutting, the brains were stuck on an object stage. During this process, particular care was taken to set the longitudinal axis of the brain perpendicular to the object stage. So, when the object stage was fixed to the object holder of the cryostat-microtome, the angle value between the knife and the longitudinal axis of the brain was conserved for all brains belonging to each studied age.
Two frontal cryostat-cut sections (20 pm thick for PND4 and PNDlO, 10 pm thick for PNDl4-PND42) at 80 pm intervals along the caudo- rostra1 extent of the LC were collected on 1% gelatin (SigmaMoated glass slides. One was processed by TH immunohistochemistry and the adjacent one was stained with cresyl violet for histological reference.
Before the immunohistochemical procedure, sections of brains fixed by immersion were directly rinsed (3 x 30 min) with 0.1 M saline phosphate buffer, pH 7.4 (PBS). Sections of fresh-frozen brains were postfixed overnight at 4°C by immersion with a solution of 4% para- formaldehyde in 0.1 M Sorensen buffer. They were then rinsed 3 x 30 min with PBS.
Immunohistochemistry. The sections were then processed using per- oxidase-antiperoxidase method (Stemberger et al., 1970). We used as primary antibody a polyclonal anti-TH antibody raised in the rabbit against purified rat pheochromocytome tyrosine hydroxylase protein. All incubations were carried out at room temperature (-20°C) except the incubation in TH antiserum (4°C). Sections were sequentially in- cubated in (1) a PBS solution containing 1% normal swine serum (NSS;
Dako) for 1 hr, (2) a solution of rabbit TH-antiserum (Jacques Boy) finally 1: 10,000 (v/v) diluted in PBS-l% NSS for 48 hr, (3) a solution of anti-rabbit swine immunoglobulins (Dako) 1:500 (v/v) diluted in PBS/l% NSS, (4) a solution of peroxidase-antiperoxidase complex (Dako) 1:500 (v/v) diluted in PBS/l% NSS. Between each of these four steps, sections were rinsed 3 x 30 min. All rinses were made in 0.1 M PBS solutions containing 0.1% NSS. Control sections were processed in par- allel, leaving out the primary antibody. The peroxidase was revealed with 0.05% 3,3’-diaminobenzidine (Fluka) in 0.1 M Tris-HCl buffer, pH 7.6 containing 0.01% H,O, (Sigma) and 4% nickel ammonium sulfate (Carbo-Erba). The sections were then rinsed, first 3 x 30 min in PBS, and finally, briefly in distilled water before being processed for light microscopy. They were dehydrated in graded ethanols, defatted in meth- ylcyclohexane, and coverslipped.
Observations and drawings of sections including LC. Coronal sections including LC were observed under a light microscope (Reichert) to define, in a first step, the caudal and the rostra1 limits of the structure. Special care was taken to observe the topology of the LC stained by TH immunohistochemistry so as to establish an accurate anatomical register of all the sections (at intervals of 80 urn) from the different rats.
For each animal,.the elements of interest localized in all these sections were drawn using a camera lucida adapted to the microscope. The drawinas renresented all the TH-positive cell bodies within the LC and anatomical landmarks such as the border of the fourth ventricle (4v), the vertical symmetric axis of the brain (vsa), and surrounding structures of the LC such as mesencephalic trigeminal nucleus (me5), superior cerebellar peduncle (scp), and the ventral limit of the cerebellar cortex (cer), obtained from adjacent Nissl-stained sections. Both TH-positive cell counting and the topological reconstruction of the mean space of the LC at each anatomical level were made possible by these drawings.
TH-positive cell body parameter determination and calculation. The evolution of three parameters characterizing the noradrenergic cell pop- ulation of the LC was examined during postnatal development: the number of TH-positive cell bodies, the volume delimited by these peri- karya, and the density of TH-positive cells.
For all sections, the mean perikarya diameter obtained by selecting typical TH-positive cells and the surface (S, mm2) of the LC strictly delimited by the TH-positive cells detected by immunohistochemistry were both determined using an image analysis system, including a cam- era (Pulnix), coupled to the light microscope to transmit the image to a high-resolution monitor, and an adapted software (ANAGRA, P. Platzer, CNRS). The number of counted cells was systematically normalized using the equation of Abercrombie: N = (n.t)l(t + d), where n is the number of these cells, t the thickness of the section, and d the mean diameter of perikarya of the counted cells (Abercrombie, 1946). Con- sidering the diameter of the TH-immunoreactive perikarya, it was ver- ified at each stage that the population of cells was normally distributed (using a Pearson x2 test of normality) at each anatomical level. A mean diameter could therefore be calculated, and the caudorostral distribution of the diameter led us to determine for each subdivision of the LC a mean diameter applied in the Abercrombie formula. The volume (V, mm3) of the LC was calculated (V = S. t) and the cell density (D; cell/ mm,) was estimated (D = Nl V). The percentage of the volume occupied by the total TH-positive cell bodies v [v = N.(4/3) ?r.(d/2)), mm31 versus V (mm)) was also calculated for the whole LC.
The results are expressed as the caudorostral distribution of the mean + SEM of the number of TH-positive cells, the volume in which these cells are contained and the cell density estimated in 80 pm intervals from values obtained for lo- or 20-pm-thick sections. The mean -t SEM ofthe total number ofTH-positive cells, the mean + SEM ofthe volume
7488 Bezin et al. * Developmental Cell Plasticity of TH Expression in LC
270"
Y
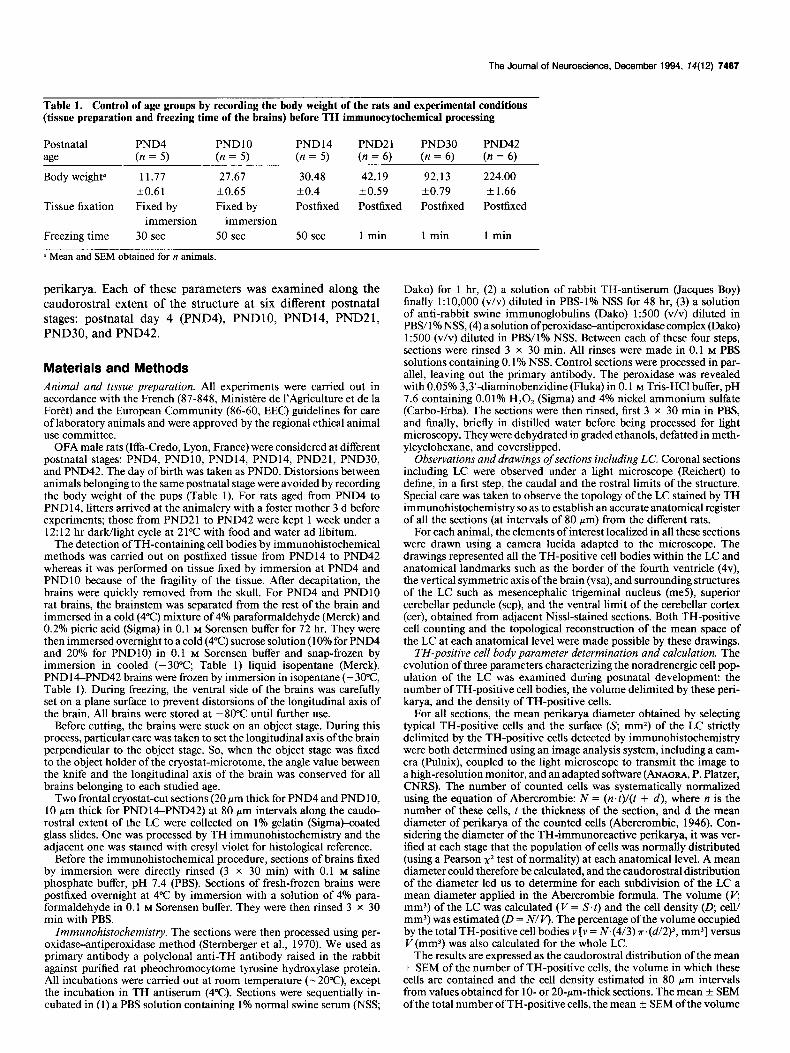
Figure 1. Superimposition of drawings referring to the same anatom- ical plane and the use of an abacus for the reconstruction of the mean limit of the LC delineated by the TH-expressing cell bodies. A, Drawings of a precise anatomical plane of all brains belonging to the same post-
containing all these cells and the mean 2 SEM of the cell density in the whole structure and each one of its subregions were also calculated by adding values estimated at each interval of the LC (or part of it).
The statistical analysis of these results was performed using a one- way analysis of variance (ANOVA I), where n is the number of animals, to compare the effect of the postnatal development on the three param- eters considered. The comparison between any two developmental stages was made in each of the subregions of the LC using the 95% Bonferroni simultaneous confidence intervals. An ANOVA I was also used to sta- tistically test, in each age group, the effect of the caudorostral level on each parameter value (n is the number of all sections analyzed in each grow).
Reconstruction of the mean Iimit of the TH-positive space of the LC. The reconstruction of the mean limit of the LC delineated by the TH- positive perikarya, the mean border of the fourth ventricle and the mean vertical symetric axis of the brain, was made to follow the evolution of the topological space of the LC during postnatal development, along its caudorostral extent.
A method was developed in our laboratory for reconstructing the mean spatial extent ofstructures in the plane ofthe section. This method consists in superimposing one upon the other all the drawings from sections belonging to a same age group and referring to one precise anatomical register. This study was carried out at 160 pm intervals. This superimposition was made in such a manner as to keep the best overlap for each anatomical landmark. The best superimposition be- tween each of all piled-up drawings was marked using a reference system formed by three equidistant points (I, II, and III on Fig. 1). The location of the structure in this reference system was determined using an abacus constituted by a trigonometrical circle including the same adjusted ref-
t
natal stage are superimposed one upon the other, taking into account the best overlap of all anatomical landmarks: the LC, the border of the fourth ventricle (4v), the vertical symetric axis of the section (vsa), mesencephalic trigeminal nucleus (me5), superior cerebellar peduncle (scp), and the ventral limit of the cerebellar cortex (cer). B, A reference system, composed of three equidistant points (I, II, and III), was ap- posed to the piled-up drawings. The center C of the triangle I, II, III was placed within the common area delimited by all piled-up LC. The draw- ings were then perpendicularly transfixed together at the levels of the three points: I, II, and III. C, An abacus consisting of a trigonometrical circle on which the angle values between adjacent represented radius are constant. On this circle appears the same reference system as the one defined in B, the center of this circle being the same as the center C of the triangle I. II, III. D, Quantitative analysis was made on each of the drawings, using the abacus. The marks I, II, and III on the drawings were, respectively, superimposed to the points I, II, and III on the abacus. On each radius, the polar coordinates of the intersection point between the radius and the structure (defined by its vector and the angle value LY of the radius) was recorded. E, After transformation of polar coordinates into Cartesian coordinates, the mean limit - SEM of the somatic area of the LC referring to a precise anatomical level was re- constructed into an orthonormalized system.
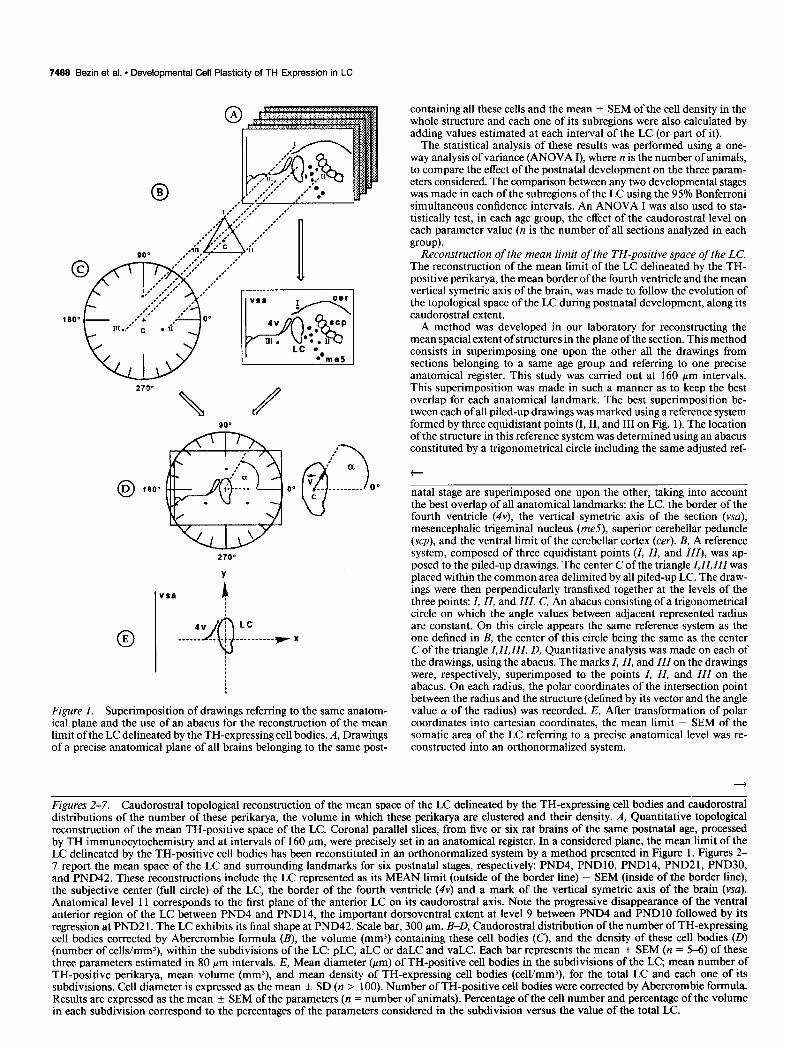
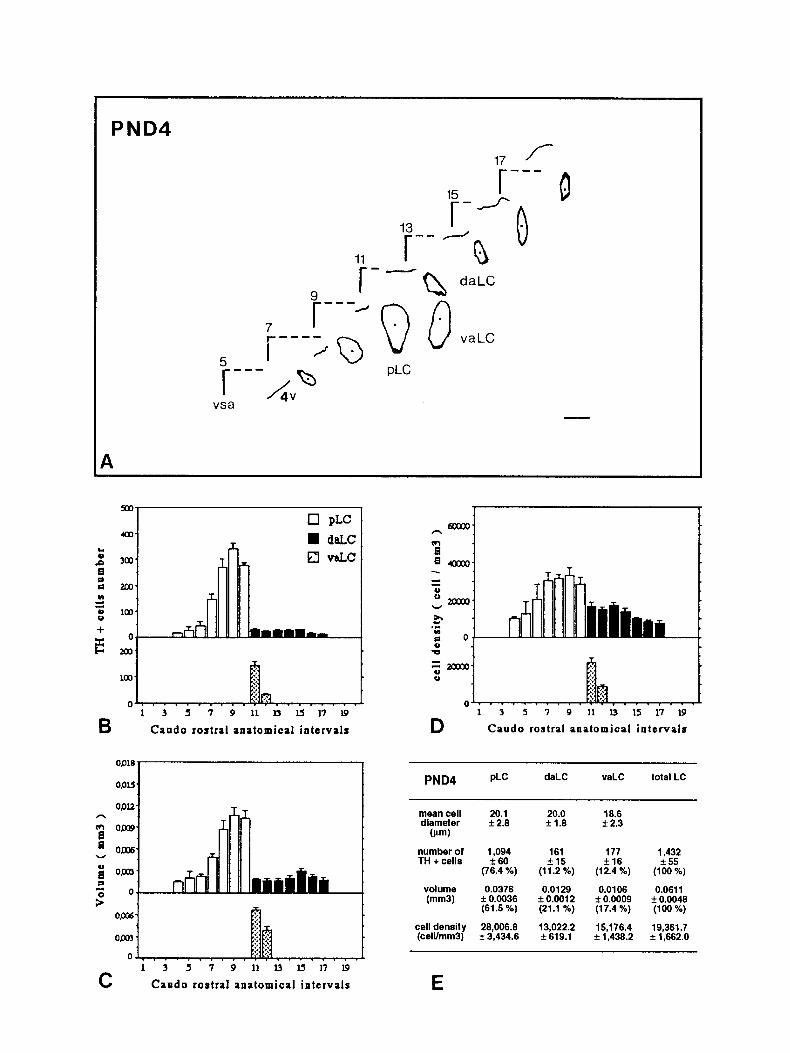
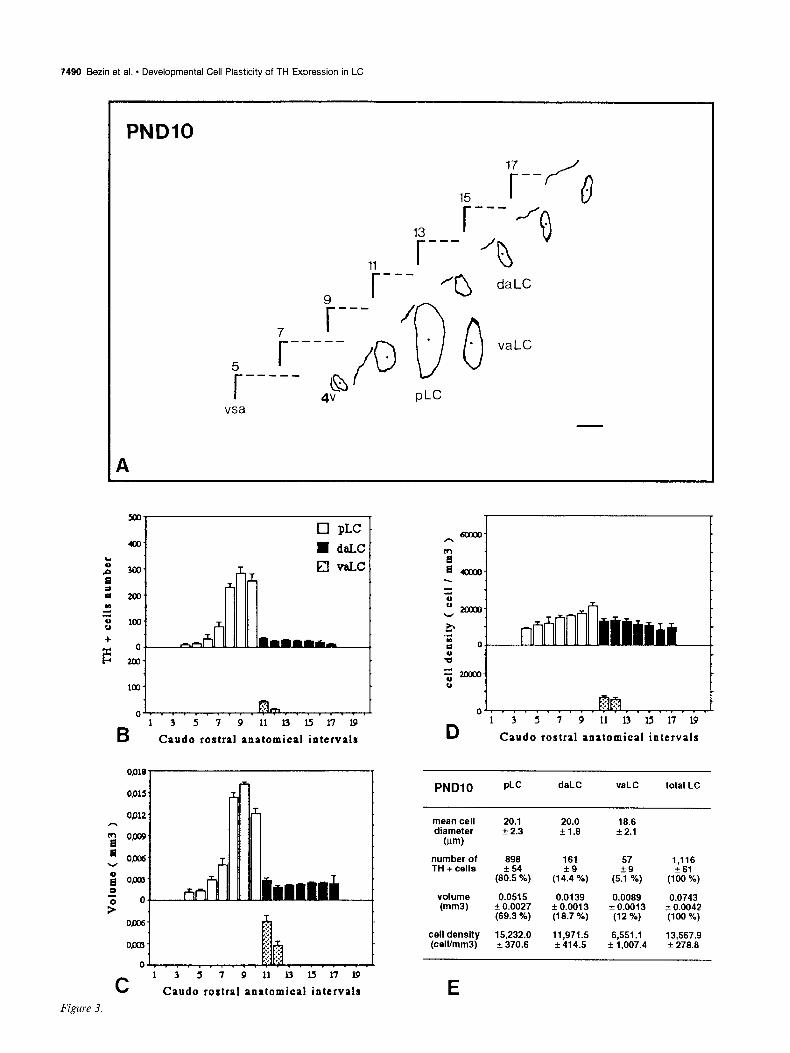
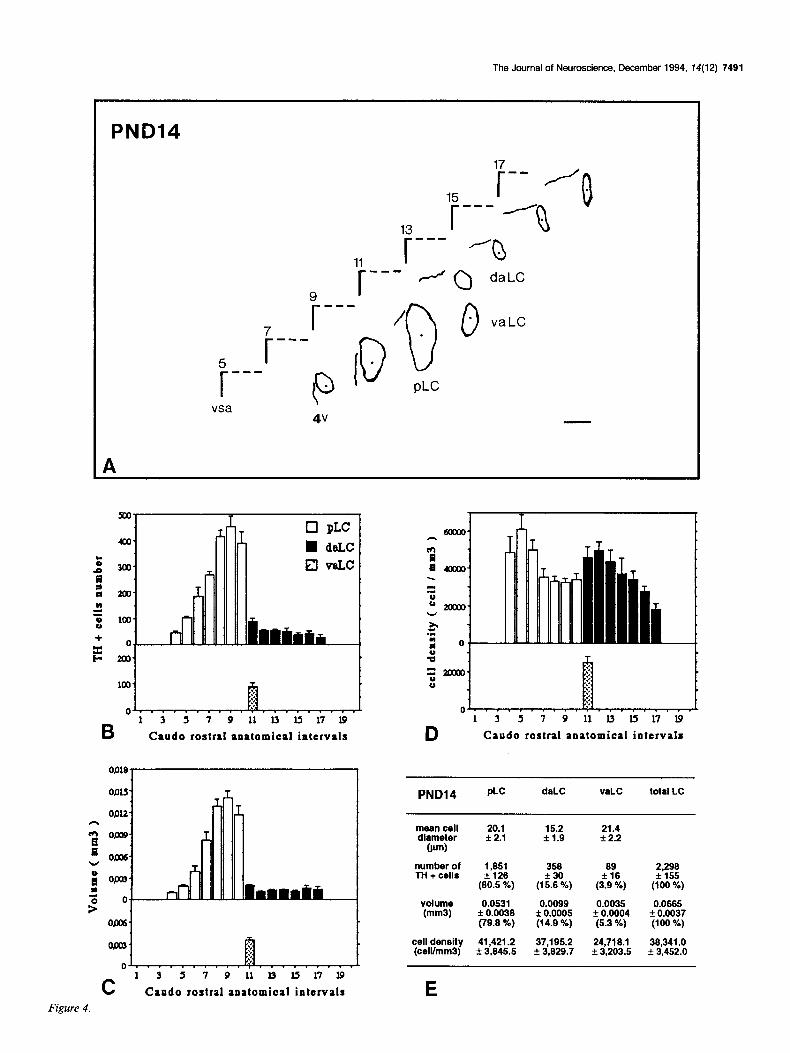
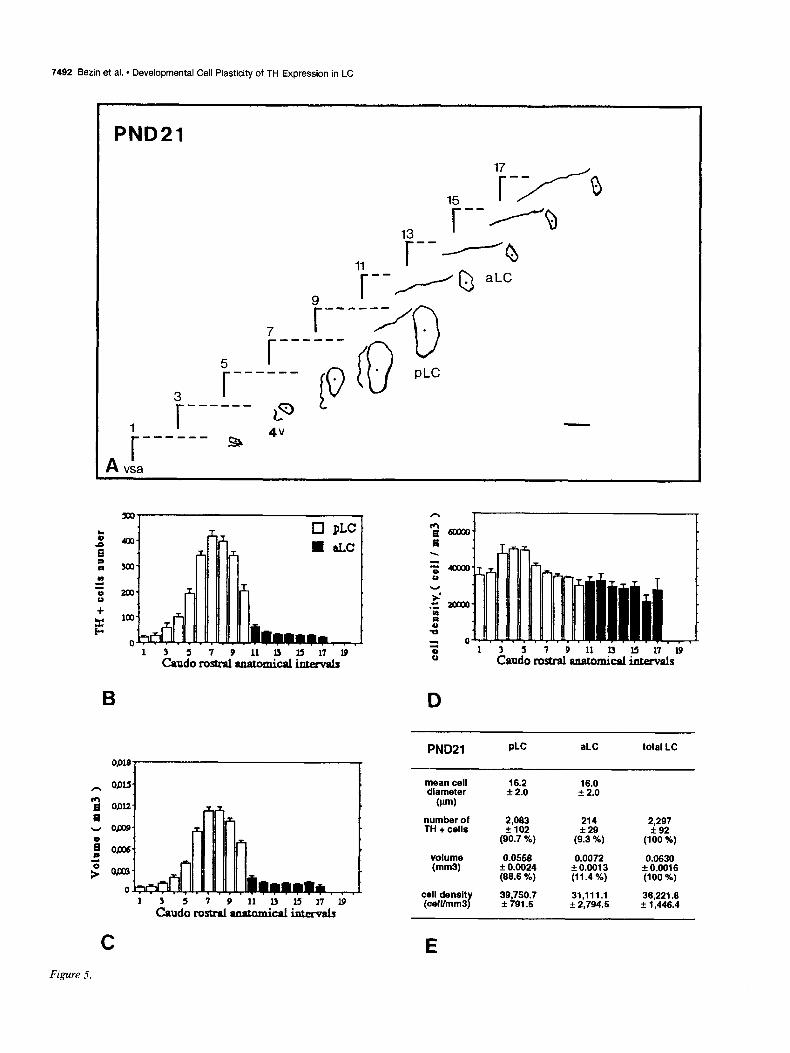
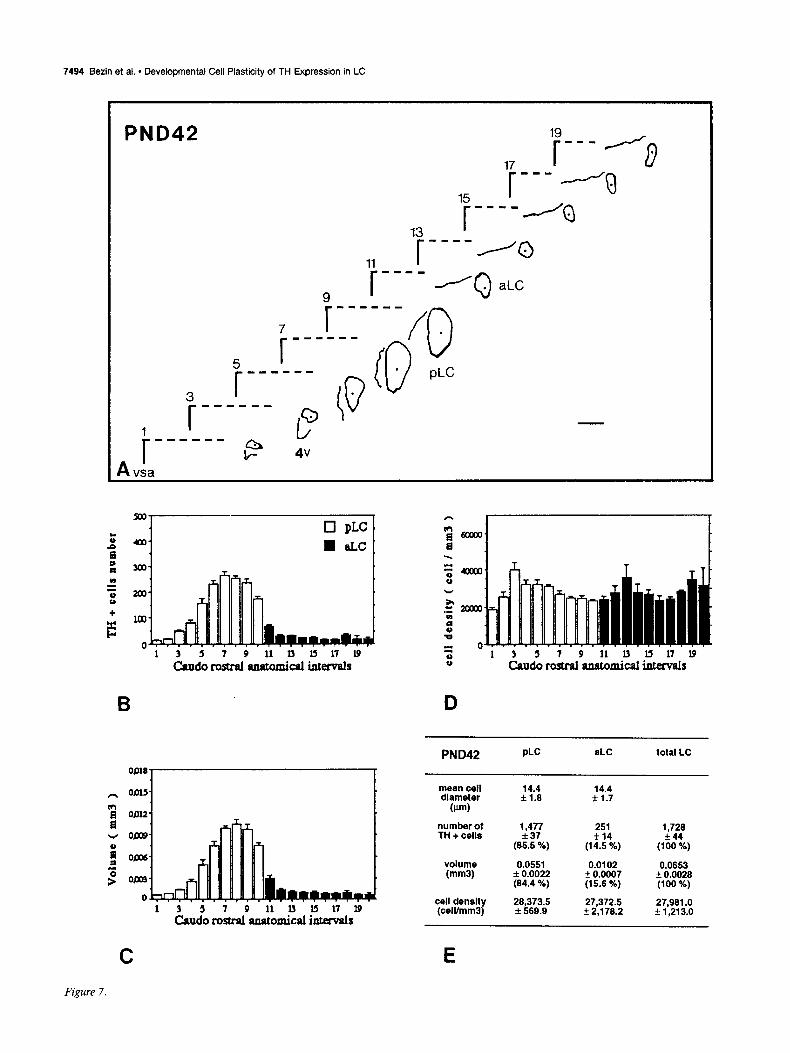
Figures 2-7. Caudorostral topological reconstruction of the mean space of the LC delineated by the TH-expressing cell bodies and caudorostral distributions of the number of these perikarya, the volume in which these perikarya are clustered and their density. A, Quantitative topological reconstruction of the mean TH-positive space of the LC. Coronal parallel slices, from five or six rat brains of the same postnatal age, processed by TH immunocytochemistry and at intervals of 160 pm, were precisely set in an anatomical register. In a considered plane, the mean limit of the LC delineated by the TH-positive cell bodies has been reconstituted in an orthonormalized system by a method presented in Figure 1. Figures 2- 7 report the mean space of the LC and surrounding landmarks for six postnatal stages, respectively: PND4, PNDlO, PND14, PND2 1, PND30, and PND42. These reconstructions include the LC represented as its MEAN limit (outside of the border line) - SEM (inside of the border line), the subjective center (full circle) of the LC, the border of the fourth ventricle (4~) and a mark of the vertical symetric axis of the brain (vsa). Anatomical level 11 corresponds to the first plane of the anterior LC on its caudorostral axis. Note the progressive disappearance of the ventral anterior region of the LC between PND4 and PND14, the important dorsoventral extent at level 9 between PND4 and PNDlO followed by its regression at PND2 1. The LC exhibits its final shape at PND42. Scale bar, 300 pm. B-D, Caudorostral distribution of the number of TH-expressing cell bodies corrected by Abercrombie formula (B), the volume (mm3) containing these cell bodies (C), and the density of these cell bodies (D) (number of cells/mml), within the subdivisions of the LC: pLC, aLC or daLC and vaLC. Each bar represents the mean + SEM (n = 5-6) of these three parameters estimated in 80 pm intervals. E, Mean diameter &m) of TH-positive cell bodies in the subdivisions of the LC; mean number of TH-positive perikarya, mean volume (mm’), and mean density of TH-expressing cell bodies (cell/mm’), for the total LC and each one of its subdivisions. Cell diameter is expressed as the mean & SD (n > 100). Number of TH-positive cell bodies were corrected by Abercrombie formula. Results are expressed as the mean + SEM of the parameters (n = number of animals). Percentage of the cell number and percentage of the volume in each subdivision correspond to the percentages of the parameters considered in the subdivision versus the value of the total LC.
PND4
5 r-
vsa
PLC
vaLC
A
0 PLC
o ,...,,..... c ....,,. ( 1 3 5 7 9 11 b I5 17 19
Caudo rostra1 anatomical intervals
. . . , . , . , ji@. . . . . . ,
3 5 7 9 11 l3 I5 17 I9
Caudo rostra1 anatomical intervals
s=j*. , . . , . . , ,h*. . . , . , .i 1 3 5 7 9 11 I3 ls 17 19
D Caudo rostra1 anatomical intervals
PND4 flc daLC vaLC total LC
mean cell 20.1 20.0 16.6 diameter f 2.0 * 1.0 f 2.3
(w)
number of 1,094 161 177 1,432 TH + cells 260 * 15 fl6 * 55
(76.4 %) (11.2%) (12.4 %) (100 %)
volume 0.0376 0.0129 0.0106 0.0611 (mm31 k 0.0036 * 0.0012 f 0.0009 f 0.0048
(61.5 %) (21.1 %) (17.4 %) (100 96)
cell density 26,006.6 13,022.2 l&176.4 (celVmm3)
19,361.7 + 33434.6 f 619.1 + 1,430.2 f 1,662.O
E
7490 Bezin et al. - Developmental Cell Plasticity of TH Expression in LC
PNDIO
7
r
--
---_
17 / --
15 r 0 ---
L.
13 r r --- 1.
0
0
11
r
--- /
9 a
r --- / --- I0 30
. . Q
4v PLC
daLC
vaLC
A
0 PLC
Caudo rostra1 anatomical intervals
Opco
0
C Figure 3.
1 3 s 7 9 11 l3 ls 17 19
Caudo rostra1 anatomical intervals
Caudo rostra1 anatomical intervals
PNDlO PLC daLC vaLC total LC
mean cell diameter
W-N
number of TH + cells
volume (mm3)
cell density (celVmm3)
20.1 20.0 f 2.3 f1.8
898 161 f54
(80.5 %) (1 ‘z%,
0.0515 0.0139 + 0.0027 + 0.0013 (69.3 %) (19.7 %)
15,232.0 11,971s 2 370.6 f 414.5
18.6 * 2.1
57
(55 ca,
1,116 f 61
(100 %)
0.0089 0.0743 * 0.0013 3~ 0.0042
(12 %) (100 %)
6,551 .I f 1,007.4
13,567.g f 278.8
E
The Journal of Neuroscience, December 1994, 14(12) 7491
PND14
17 -- /
0 .
15 r --- / . 13 r D m-m
‘0 . 11
7 --- 5 r r w-w
vsa
A
cl PI-C
B 13” 9 11 13 l5 17 19
Caudo rostra1 anatomical intervals
0’. . . . . * . . . . . . . . . . . . 8 1 3 5 7 9 11 I3 l5 17 l.9
D Caudo rostra1 anatomical intervals
PND14 plc daLC WLC totsl LC
mean cell diameter
(rm)
number of TH + cells
volume (mm3)
cell density 41,421.2 (ceWmm3) L 3,645.S
E
20.1 f 2.1
1,651 356 69 2,296 +I26 +30 f. 16 + 155
(90.5 %) (15.6 %) (3.9 %) VW %)
0.0531 k 0.0036 (79.9 %)
0.0099 * 0.0005 (14.9 %)
37,195.2 + 3,629.7
0.0035 0.0665 * 0.0004 * 0.0037 (5.3 %) (100 %)
24,719.l 36,341 .o It 3,203.S f 3,452.0
15.2 k-1.9
21.4 f 2.2
L Caudo rostra1 anatomical intervals Figure 4.
7492 Eezin et al. l Developmental Cell Plasticity of TH Expression in LC
PND21
Cl.. . . . . . - .---, .,.
1 3 5 7 9 11 0 Is 17 l9 Caudo rostcal amuodcal htervalr
B
I 3 5 7 9 11 I3 15 17 w Caudo mitral watamical intervals
ii .
54ccco u
v .
.r” Moo0
2
4 = 0 :: 1 3 5 I 9 11 I3 Is 17 w
Caudo rostraI atmtomical intervals
D
PND21 PLC aLC total LC
mean cell diameter
16.2 16.0 f 2.0 + 2.0
number of 2,063 214 TH + cells f102
2,297 *29 +92
(90.7 %) (9.3 %) (100 %)
volume 0.0556 0.0072 0.0630 (mm3 k 0.0024 ?r 0.6013 f 0.0616
(66.6 %) (11.4 %) (100 %)
cell density (celVmm3)
39,750.7 31,111.l 36,221.e f 791.5 f 2,794s + 1,446.4
C Figure 5.
E
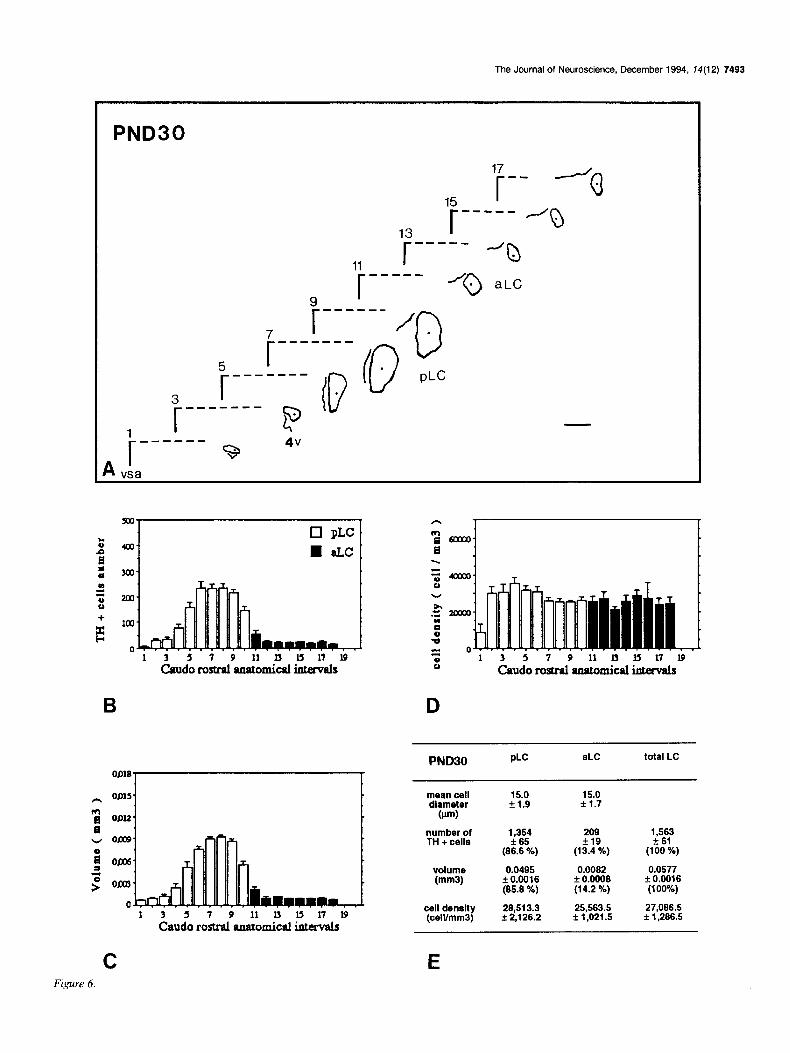
The Journal of Neuroscience, December 1994, 74(12) 7493
PND30
B
h
‘;;f=JaJ a
. zucco ”
”
E 2oca E
4 0
1 3 s 7 9 11 l3 l!3 17 19 = ::
1 3 5 7 9 11 I3 25 17 19 Caudo rostml aaatomical intervals Caudo rostrai anstomical intervals
1 3 5 7 9 11 I3 15 17 19 Caudo rostral anatomical intervh
C Figure 6.
D
PND30 PLC aLC total LC
mean cell 15.0 15.0 diameter 51.9 * 1.7
(wun)
number of 1,354 209 1,563 TH + cells k65 +I9 zk 61
(66.6 %) (13.4 %) (100 %)
volume 0.0495 0.0062 0.0577 (mm31 k 0.0016 f 0.0008 + 0.0016
(65.6 %) (14.2 %) (100%)
cell density 26,513.3 25,563.5 27,066.5 (ceWmm3) f 2,126.2 f 1,021.5 f 1,286.5
E
7494 Bezin et al. l Developmental Cell Plasticity of TH Expression in LC
PND42
15 r -- 13
SXT •J PI-C
h
3-J . =4oooo :: Y
.G 20x0 1 2 = 0 2 1 3 5 7 9 11 l3 ls 17 19
Caudo rostral anatomical irimvals
n au2 .lal
2m
100
0 9 11 l3 ls 17 19 1 3 s
-l
7
Caudo rostraI aMtomicalintervals
D B
PND42 PLC aLC total LC
T mean cell diameter
(Pm)
number of TH + cells
14.4 f1.6
14.4 + 1.7
I 9 1 3 5 7 11 1) l5 17 I9
Caudo rostral anatomical intemalr
1,477 +37
(85.5 %)
251 f 14
(14.5 %)
0.0551 0.0102 f 0.0022 + 0.0007 (64.4 %) (15.6 K)
cell density (celVmm3)
26,373.S + 569.9
27J72.5 f 2,176.2
1,726 f44
(100 %)
0.0653 * 0.0028 (100 %)
27,961 .O f 1,213.o
volume (mm31
i
E C
Figure 7.
The Journal of Neuroscience, December 1994, 14(12) 7495
erence system. Angles between consecutive represented radius were con- stant on the abacus (15” apart). Details of the superimposition of the drawings and the use of the abacus are schematically represented in Figure 1. To measure the polar coordinates of the structure each drawing was then apposed to the abacus. After transformations of the polar coordinates into Cartesian coordinates. the mean limit - SEM of the structure was then reconstructed in an erthonormalized system by link- ing the mean value obtained on consecutive radius.
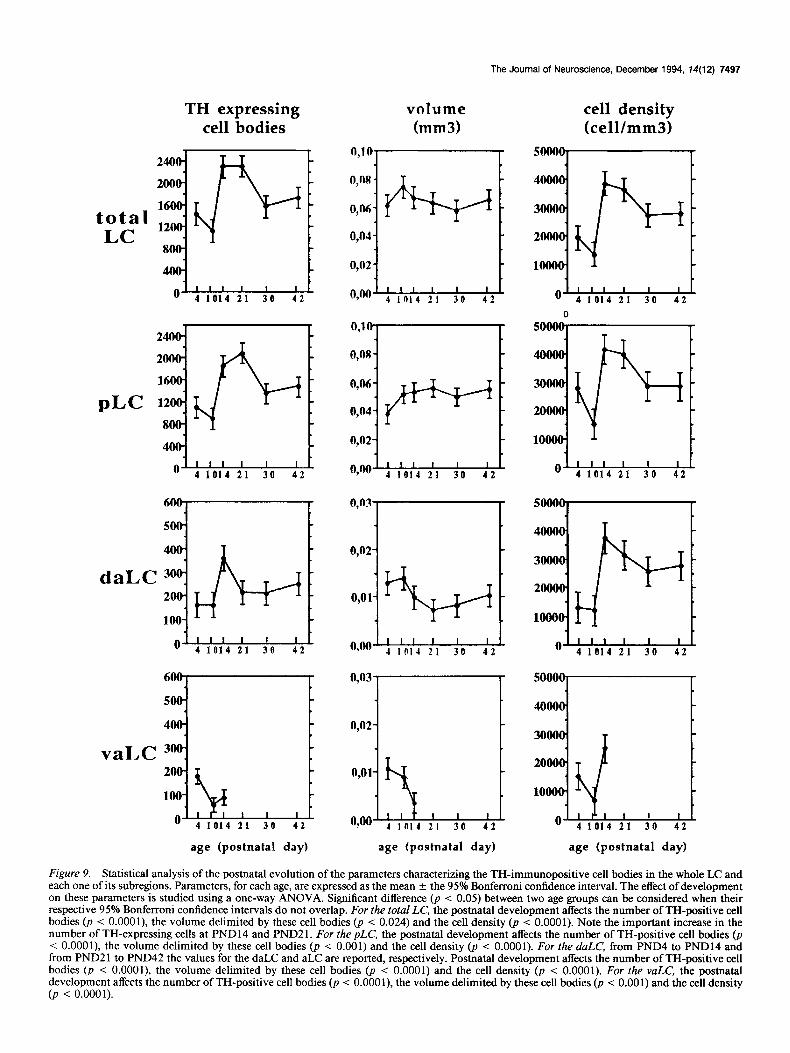
The TH-expressing cells enumerated in the total LC at PND 14 and PND21 were 33% more than that at PND42 (Fig. 9). The transient enhancement of this parameter at these two stages occurred within the pLC and the daLC at PND14, whereas it only appeared within the pLC at PND21 (Fig. 9).
Compared to PND42, the increases in the TH-expressing cell number were localized in the pLC on levels 8-10 (Figs. 4B, 7B) and 6-9 (Figs. 5B, 7B) at PND14 and PND2 1, respectively. In the daLC the enhancement at PND14 was observed on levels 11-16 (Figs. 4B, 7B).
At PND21 344 f 40 Nissl-stained neurons have been enu- merated in the daLC, exactly in the space delimited by the TH- immunoreactive neurons.
Results Postnatal evolution of the phenotypic characters of TH-expressing cells along the caudorostral extent of the LC The cellular phenotypic parameters characterizing the TH ex- pression in the LC were examined along the caudorostral extent of the structure at six postnatal stages: PND4 (Fig. 2) PNDlO (Fig. 3) PND14 (Fig. 4), PND21 (Fig. 5) PND30 (Fig. 6), and PND42 (Fig. 7). For each 160 pm, the mean limit of the space of the LC delineated by the TH-expressing perikarya was quan- titatively reconstructed. The number of TH-positive cell bodies detected by immunohistochemistry, the volume delimited by these perikarya and the cell density were evaluated in 80 pm intervals within different subdivisions of the LC: posterior LC (pLC), dorsal anterior LC (daLC) or anterior LC (aLC) and ventral anterior LC (vaLC) when it was observable.
Postnatal evolution of the volume delimited by the TH-expressing cell bodies At each developmental stage, the volume delimited by the TH- expressing cells was significantly distributed (p < 0.000 1, ANO- VA I, 65 < number of sections < 113) along the caudorostral axis of the structure (Figs. 2C-7C). The pLC represented 61- 88% (Figs. 2E-7E) of the total LC volume, which also validated the division of the LC into a large posterior and a small anterior subregion.
Postnatal evolution of the topological space delimited by the TH-expressing cell bodies within the LC Using the method of the superimposition of drawings referring to a precise anatomical level in an age group, the evolution during postnatal development of the topological organization of the TH-expressing cell bodies within the LC was established at intervals of 160 Wm.
Although the postnatal development of the volume was al- most constant in the total LC, the evolution of this parameter differed in the subregions of the structure (Fig. 9). The progres- sive enhancement of the pLC was concomitant to the regression of the vaLC (Fig. 9) and no variation of the sum of the vaLC and pLC volumes was observed during the postnatal develop- ment (p < 0.073, ANOVA I; Fig. 10).
In each considered developmental stage, these reconstructions exhibited a high Constance of the space of the LC (Figs. 2A-7A). Indeed, the SEMs of both this space and surrounding anatomical landmarks were very low (< 10%) in the different anatomical levels within each age group.
It is interesting to note that, at PND14, the volume within the pLC reached values on levels 8-10, which were never ob- served at the adult stage at the same anatomical intervals (Figs. 4B, 7B).
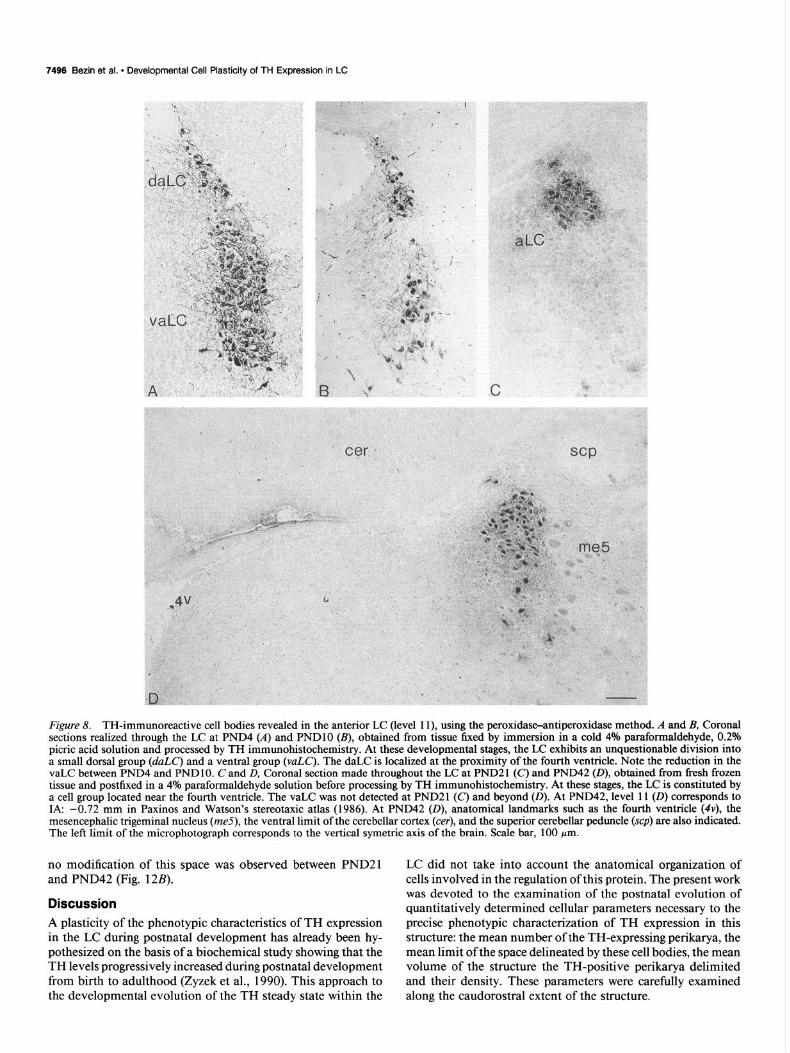
From PND4 to PND14, the observations of the space oc- cupied by the TH immunopositive cells revealed a clear division into dorsal and ventral parts in the middle of the caudorostral extent of the LC (level 11, Figs. 2A-4A, 8AJ). The analysis of the caudorostral distribution of the TH positive cells and the spaces delineated by these cells allowed to clearly divide this structure into a posterior, an anterior dorsal, and an anterior ventral subregion. From PND21 through PND42, such an an- atomical division in the anterior LC was no longer observable (level 11, Figs. 5A-7A, 8CD). In this study, and for all age groups, anatomical level 11 represents the first rostra1 plane of the LC on its caudorostral axis. At PND42, it corresponds to IA: -0.72 mm in Paxinos and Watson’s stereotaxic atlas (1986).
Postnatal evolution of the density of the TH-expressing cell bodies The caudorostral distribution of the cell density was affected by the postnatal development. The cell density was distributed from PND4 to PND21 (Figs. 20-50; p < 0.0001, ANOVA I, 65 < number of sections < 97). Beyond PND21, it was less distributed [PND30 (Fig. 60) p < 0.096, ANOVA I, number of sections = 104; PND42 (Fig. 70) p < 0.001, ANOVA I, number of sections = 1131.
In the total LC and in the pLC, the cell density was greater at PND14 and PND21 than at the other stages (Fig. 9). In the daLC and the vaLC, the peak of the cell density was observed at PND14 (Fig. 9).
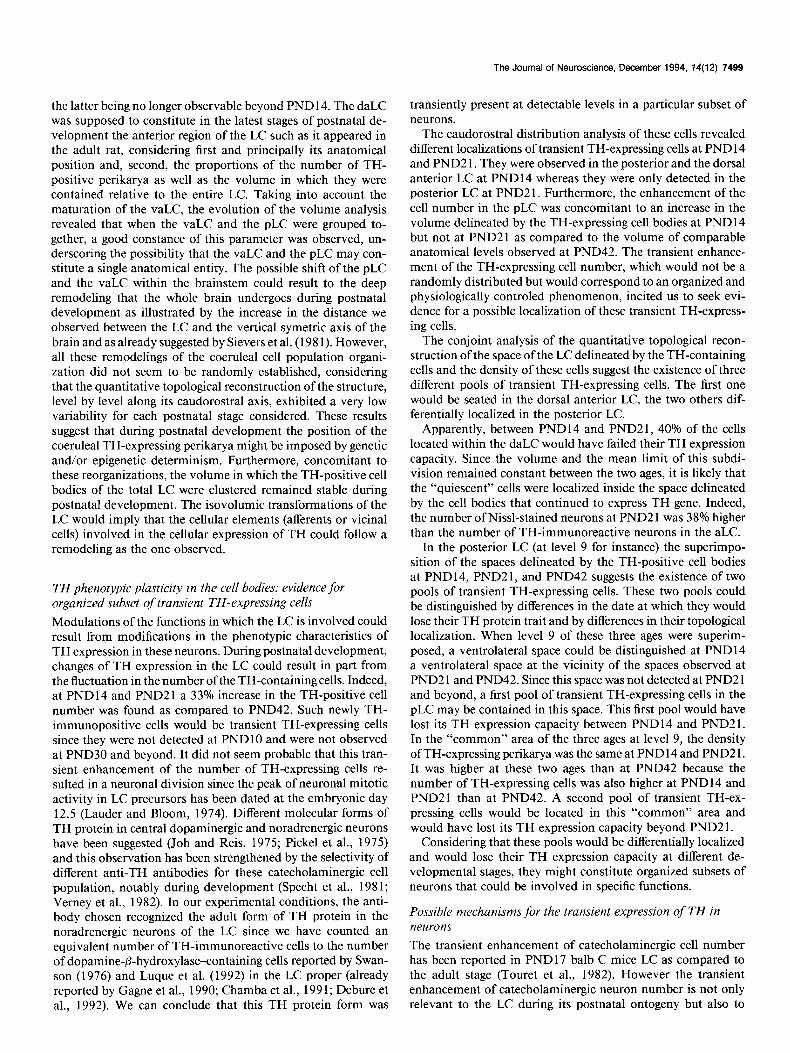
During postnatal development, an increase in the distance At each developmental stage, the volume strictly occupied by between the center of the LC and the vertical symetric axis of the TH-expressing perikarya in the volume delimited by these the brain was noticed, the LC being then progressively shifted perikarya was very weak and never more than 14% (Fig. 11). into a more lateral position (Figs. 2A-7A).
Postnatal evolution of the number of TH-expressing cells At each developmental stage, the number of TH-expressing cells was significantly distributed (p < 0.0001, ANOVA I, 65 < number of sections < 113) along the caudorostral axis of the structure (Figs. 2B-7B). The pLC represented 76-91% (Figs. 2E-7E) of the TH-expressing cells enumerated in the total LC, validating the division of the LC into a large posterior and a small anterior subregion.
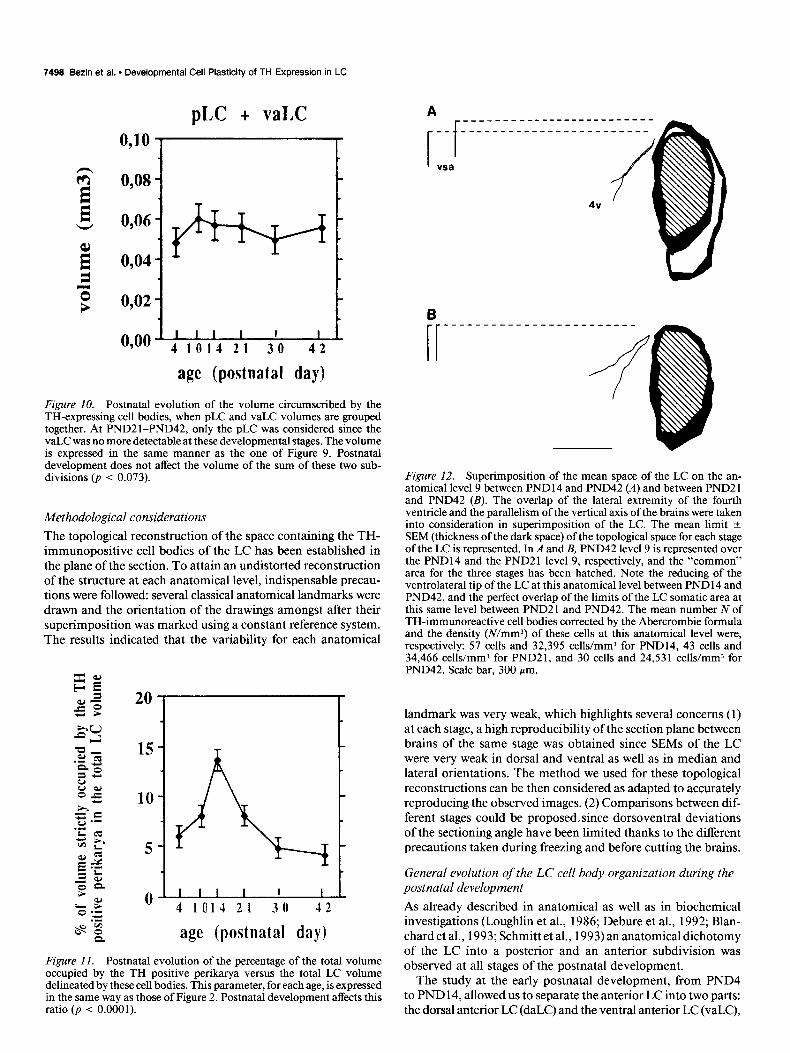
Comparison of the LC space at level 9 at PND14, PND21, and PND42 The superimposition of the spaces of the LC delimited by the TH-expressing cell bodies was carried out taking into consid- eration the superimposition of the lateral extremity of the fourth ventricle and keeping the parallelism of the vertical symetric axis between the different stages considered. These superim- positions revealed a ventrolateral enlargement of the space on level 9 at PND14 as compared to PND42 (Fig. 12A), whereas
7496 Bezin et al. l Developmental Cell Plasticity of TH Expression in LC
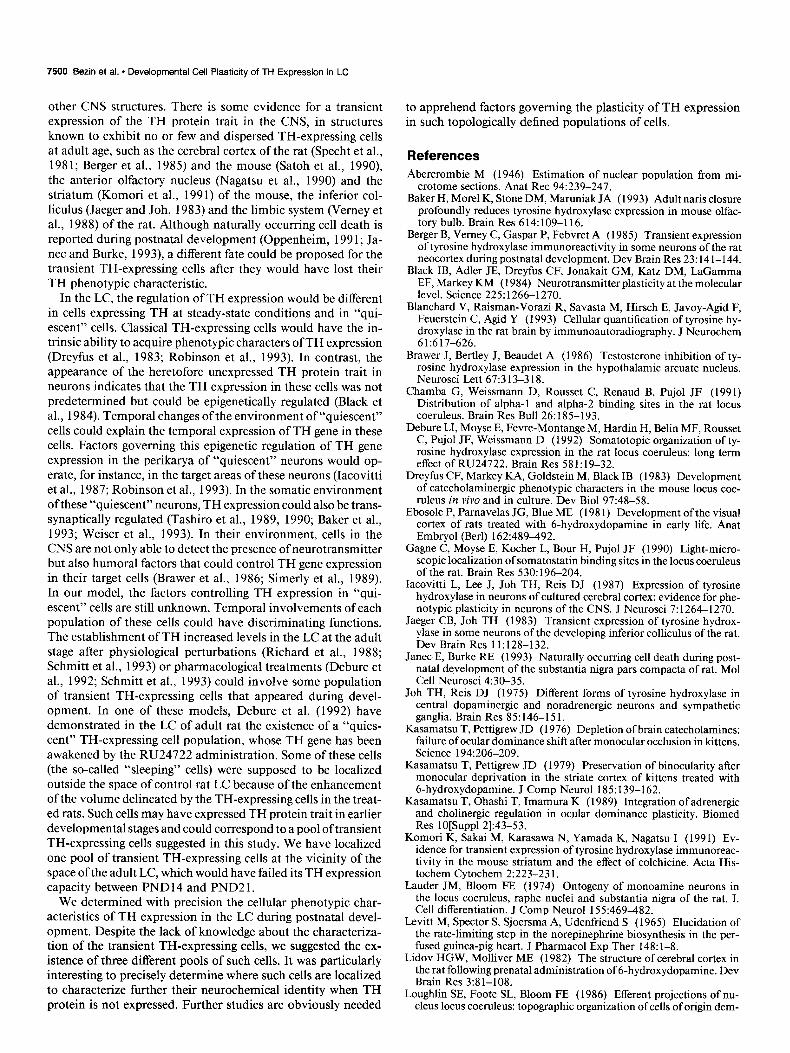
Figure 8. TH-immunoreactive cell bodies revealed in the anterior LC (level 1 l), using the peroxidase-antiperoxidase method. A and B, Coronal sections realized through the LC at PND4 (A) and PNDlO (B), obtained from tissue fixed by immersion in a cold 4% paraformaldehyde, 0.2% picric acid solution and processed by TH immunohistochemistry. At these developmental stages, the LC exhibits an unquestionable division into a small dorsal group (duLC’) and a ventral group (vuLC). The daLC is localized at the proximity of the fourth ventricle. Note the reduction in the vaLC between PND4 and PND 10. C and D, Coronal section made throughout the LC at PND2 1 (c) and PND42 (D), obtained from fresh frozen tissue and postfixed in a 4% paraformaldehyde solution before processing by TH immunohistochemistry. At these stages, the LC is constituted by a cell group located near the fourth ventricle. The vaLC was not detected at PND21 (C) and beyond (0). At PND42, level 11 (0) corresponds to IA: -0.72 mm in Paxinos and Watson’s stereotaxic atlas (1986). At PND42 (D), anatomical landmarks such as the fourth ventricle (4v), the mesencephalic trigeminal nucleus (me5), the ventral limit of the cerebellar cortex (cer), and the superior cerebellar peduncle (scp) are also indicated. The left limit of the microphotograph corresponds to the vertical symetric axis of the brain. Scale bar, 100 pm.
no modification of this space was observed between PND21 and PND42 (Fig. 12B).
Discussion A plasticity of the phenotypic characteristics of TH expression in the LC during postnatal development has already been hy- pothesized on the basis of a biochemical study showing that the TH levels progressively increased during postnatal development from birth to adulthood (Zyzek et al., 1990). This approach to the developmental evolution of the TH steady state within the
LC did not take into account the anatomical organization of cells involved in the regulation of this protein. The present work was devoted to the examination of the postnatal evolution of quantitatively determined cellular parameters necessary to the precise phenotypic characterization of TH expression in this structure: the mean number of the TH-expressing perikarya, the mean limit of the space delineated by these cell bodies, the mean volume of the structure the TH-positive perikarya delimited and their density. These parameters were carefully examined along the caudorostral extent of the structure.
The Journal of Neuroscience, December 1994, M(12) 7497
volume hm3)
cell density (cell/mm31
TH expressing cell bodies
. 240
200
total :; LC
8 $P+
o-"' ' ' I 4 1014 21 30 42
o.ns
O,M
0.04
a,02
O,M I ‘i”/ 4 1014 21 36 42 0- 4 1014 21 30 42
24m
20
1600-
pLC no@ 833
4 ’ AlI1 1 1 I
4 1014 21 30 42
O,O%
O,M
o,n4
0,02
O,cw) III I I I I 4 1014 21 30 42
01 4 1014 21 30 42
a,n3
$02
0,Ol
0.00
daLC
n,nz n,nz-
n,ni O,Ol-
‘Too I I I
'Too 4 In14 21 30 42 4 In14 21 30 42
4
3
2
! 100
0
vaLC
IllLl I 41014 21 42 4 1014 21 30 42
age (postnatal day) age (postnatal day) age (postnatal day)
Figure 9. Statistical analysis of the postnatal evolution of the parameters characterizing the TH-immunopositive cell bodies in the whole LC and each one of its subregions. Parameters, for each age, are expressed as the mean f the 95% Bonferroni confidence interval. The effect of development on these parameters is studied using a one-way ANOVA. Significant difference (p < 0.05) between two age groups can be considered when their respective 95% Bonferroni confidence intervals do not overlap. For the total LC, the postnatal development affects the number of TH-positive cell bodies (a i O.OOOl), the volume delimited by these cell bodies (p < 0.024) and the cell density (p < 0.0001). Note the important increase in the number of TH-expressing cells at PND 14 and PND2 1. For the pLC, the postnatal development affects the number of TH-positive cell bodies @ < O.OOOl), the volume delimited by these cell bodies (p < 0.001) and the cell density (p < 0.0001). For the duLC, from PND4 to PND14 and from PND2 1 to PND42 the values for the daLC and aLC are reported, respectively. Postnatal development affects the number of TH-positive cell bodies (p < O.OOOl), the volume delimited by these cell bodies (p < 0.0001) and the cell density (p < 0.0001). For the VULC’, the postnatal development affects the number of TH-positive cell bodies (p < O.OOOl), the volume delimited by these cell bodies (p < 0.001) and the cell density (p < 0.0001).
7499 Bezin et al. - Developmental Cell Plasticity of TH Expression in LC
OJO
G E
0,08
g 0,06
; 0,04 g
7 0,02
0,oo
pI,C t vaLC
I I I I I 4 1014 21 3’0 42
age (postnafal day)
Figure 10. Postnatal evolution of the volume circumscribed by the TH-expressing cell bodies, when pLC and vaLC volumes are grouped together. At PND21-PND42, only the pLC was considered since the vaLC was no more detectable at these developmental stages. The volume is expressed in the same manner as the one of Figure 9. Postnatal development does not affect the volume of the sum of these two sub- divisions (p < 0.073).
Methodological considerations The topological reconstruction of the space containing the TH- immunopositive cell bodies of the LC has been established in the plane of the section. To attain an undistorted reconstruction of the structure at each anatomical level, indispensable precau- tions were followed: several classical anatomical landmarks were drawn and the orientation of the drawings amongst after their superimposition was marked using a constant reference system. The results indicated that the variability for each anatomical
20
15-
lo-
5
0
:ffJ+
I 4 ICI14 21 30 42
age (postnatal day)
Figure II. Postnatal evolution of the percentage of the total volume occupied by the TH positive perikarya versus the total LC volume delineated by these cell bodies. This parameter, for each age, is expressed in the same way as those of Figure 2. Postnatal development affects this ratio (p < 0.0001).
vsa
B
Figure 12. Superimposition of the mean space of the LC on the an- atomical level 9 between PND 14 and PND42 (A) and between PND2 1 and PND42 (B). The overlap of the lateral extremity of the fourth ventricle and the parallelism of the vertical axis of the brains were taken into consideration in superimposition of the LC. The mean limit + SEM (thickness of the dark space) of the topological space for each stage of the LC is represented. In A and B, PND42 level 9 is represented over the PND 14 and the PND2 1 level 9, respectively, and the “common” area for the three stages has been hatched. Note the reducing of the ventrolateral tip of the LC at this anatomical level between PND 14 and PND42, and the perfect overlap of the limits of the LC somatic area at this same level between PND2 1 and PND42. The mean number N of TH-immunoreactive cell bodies corrected by the Abercrombie formula and the density (N/mm?) of these cells at this anatomical level were, respectively: 57 cells and 32,395 cells/mm) for PND14, 43 cells and 34,466 cells/mm3 for PND21, and 30 cells and 24,53 1 cells/mm3 for PND42. Scale bar, 300 pm.
landmark was very weak, which highlights several concerns (1) at each stage, a high reproducibility of the section plane between brains of the same stage was obtained since SEMs of the LC were very weak in dorsal and ventral as well as in median and lateral orientations. The method we used for these topological reconstructions can be then considered as adapted to accurately reproducing the observed images. (2) Comparisons between dif- ferent stages could be proposed. since dorsoventral deviations of the sectioning angle have been limited thanks to the different precautions taken during freezing and before cutting the brains.
General evolution of the LC cell body organization during the postnatal development As already described in anatomical as well as in biochemical investigations (Loughlin et al., 1986; Debure et al., 1992; Blan- chard et al., 1993; Schmitt et al., 1993) an anatomical dichotomy of the LC into a posterior and an anterior subdivision was observed at all stages of the postnatal development.
The study at the early postnatal development, from PND4 to PND14, allowed us to separate the anterior LC into two parts: the dorsal anterior LC (daLC) and the ventral anterior LC (vaLC),
The Journal of Neuroscience, December 1994, 74(12) 7499
the latter being no longer observable beyond PND14. The daLC was supposed to constitute in the latest stages of postnatal de- velopment the anterior region of the LC such as it appeared in the adult rat, considering first and principally its anatomical position and, second, the proportions of the number of TH- positive perikarya as well as the volume in which they were contained relative to the entire LC. Taking into account the maturation of the vaLC, the evolution of the volume analysis revealed that when the vaLC and the pLC were grouped to- gether, a good Constance of this parameter was observed, un- derscoring the possibility that the vaLC and the pLC may con- stitute a single anatomical entity. The possible shift of the pLC and the vaLC within the brainstem could result to the deep remodeling that the whole brain undergoes during postnatal development as illustrated by the increase in the distance we observed between the LC and the vertical symetric axis of the brain and as already suggested by Sievers et al. (198 1). However, all these remodelings of the coeruleal cell population organi- zation did not seem to be randomly established, considering that the quantitative topological reconstruction of the structure, level by level along its caudorostral axis, exhibited a very low variability for each postnatal stage considered. These results suggest that during postnatal development the position of the coeruleal TH-expressing perikarya might be imposed by genetic and/or epigenetic determinism. Furthermore, concomitant to these reorganizations, the volume in which the TH-positive cell bodies of the total LC were clustered remained stable during postnatal development. The isovolumic transformations of the LC would imply that the cellular elements (afferents or vicinal cells) involved in the cellular expression of TH could follow a remodeling as the one observed.
TH phenotypic plasticity in the cell bodies: evidence for organized subset of transient TH-expressing cells
Modulations of the functions in which the LC is involved could result from modifications in the phenotypic characteristics of TH expression in these neurons. During postnatal development, changes of TH expression in the LC could result in part from the fluctuation in the number of the TH-containing cells. Indeed, at PND14 and PND2 1 a 33% increase in the TH-positive cell number was found as compared to PND42. Such newly TH- immunopositive cells would be transient TH-expressing cells since they were not detected at PNDlO and were not observed at PND30 and beyond. It did not seem probable that this tran- sient enhancement of the number of TH-expressing cells re- sulted in a neuronal division since the peak of neuronal mitotic activity in LC precursors has been dated at the embryonic day 12.5 (Lauder and Bloom, 1974). Different molecular forms of TH protein in central dopaminergic and noradrenergic neurons have been suggested (Joh and Reis, 1975; Pickel et al., 1975) and this observation has been strengthened by the selectivity of different anti-TH antibodies for these catecholaminergic cell population, notably during development (Specht et al., 1981; Vemey et al., 1982). In our experimental conditions, the anti- body chosen recognized the adult form of TH protein in the noradrenergic neurons of the LC since we have counted an equivalent number of TH-immunoreactive cells to the number of dopamine+-hydroxylase-containing cells reported by Swan- son (1976) and Luque et al. (1992) in the LC proper (already reported by Gagne et al., 1990; Chamba et al., 199 1; Debure et al., 1992). We can conclude that this TH protein form was
transiently present at detectable levels in a particular subset of neurons.
The caudorostral distribution analysis of these cells revealed different localizations of transient TH-expressing cells at PND 14 and PND2 1. They were observed in the posterior and the dorsal anterior LC at PND14 whereas they were only detected in the posterior LC at PND2 1. Furthermore, the enhancement of the cell number in the pLC was concomitant to an increase in the volume delineated by the TH-expressing cell bodies at PND 14 but not at PND21 as compared to the volume of comparable anatomical levels observed at PND42. The transient enhance- ment of the TH-expressing cell number, which would not be a randomly distributed but would correspond to an organized and physiologically controled phenomenon, incited us to seek evi- dence for a possible localization of these transient TH-express- ing cells.
The conjoint analysis of the quantitative topological recon- struction of the space of the LC delineated by the TH-containing cells and the density of these cells suggest the existence of three different pools of transient TH-expressing cells. The first one would be seated in the dorsal anterior LC, the two others dif- ferentially localized in the posterior LC.
Apparently, between PND14 and PND2 1, 40% of the cells located within the daLC would have failed their TH expression capacity. Since the volume and the mean limit of this subdi- vision remained constant between the two ages, it is likely that the “quiescent” cells were localized inside the space delineated by the cell bodies that continued to express TH gene. Indeed, the number of Nissl-stained neurons at PND2 1 was 38% higher than the number of TH-immunoreactive neurons in the aLC.
In the posterior LC (at level 9 for instance) the superimpo- sition of the spaces delineated by the TH-positive cell bodies at PND 14, PND2 1, and PND42 suggests the existence of two pools of transient TH-expressing cells. These two pools could be distinguished by differences in the date at which they would lose their TH protein trait and by differences in their topological localization. When level 9 of these three ages were superim- posed, a ventrolateral space could be distinguished at PND14 a ventrolateral space at the vicinity of the spaces observed at PND2 1 and PND42. Since this space was not detected at PND2 1 and beyond, a first pool of transient TH-expressing cells in the pLC may be contained in this space. This first pool would have lost its TH expression capacity between PND14 and PND21. In the “common” area of the three ages at level 9, the density of TH-expressing perikarya was the same at PND 14 and PND2 1. It was higher at these two ages than at PND42 because the number of TH-expressing cells was also higher at PND14 and PND21 than at PND42. A second pool of transient TH-ex- pressing cells would be located in this “common” area and would have lost its TH expression capacity beyond PND2 1.
Considering that these pools would be differentially localized and would lose their TH expression capacity at different de- velopmental stages, they might constitute organized subsets of neurons that could be involved in specific functions.
Possible mechanisms for the transient expression of TH in neurons
The transient enhancement of catecholaminergic cell number has been reported in PND 17 balb C mice LC as compared to the adult stage (Touret et al., 1982). However the transient enhancement of catecholaminergic neuron number is not only relevant to the LC during its postnatal ontogeny but also to
7500 Bezin et al. * Developmental Cell Plasticity of TH Expression in LC
other CNS structures. There is some evidence for a transient expression of the TH protein trait in the CNS, in structures known to exhibit no or few and dispersed TH-expressing cells at adult age, such as the cerebral cortex of the rat (Specht et al., 198 1; Berger et al., 1985) and the mouse (Satoh et al., 1990), the anterior olfactory nucleus (Nagatsu et al., 1990) and the striatum (Komori et al., 1991) of the mouse, the inferior col- liculus (Jaeger and Joh, 1983) and the limbic system (Verney et al., 1988) of the rat. Although naturally occurring cell death is reported during postnatal development (Oppenheim, 199 1; Ja- net and Burke, 1993), a different fate could be proposed for the transient TH-expressing cells after they would have lost their TH phenotypic characteristic.
In the LC, the regulation of TH expression would be different in cells expressing TH at steady-state conditions and in “qui- escent” cells. Classical TH-expressing cells would have the in- trinsic ability to acquire phenotypic characters of TH expression (Dreyfus et al., 1983; Robinson et al., 1993). In contrast, the appearance of the heretofore unexpressed TH protein trait in neurons indicates that the TH expression in these cells was not predetermined but could be epigenetically regulated (Black et al., 1984). Temporal changes of the environment of “quiescent” cells could explain the temporal expression of TH gene in these cells. Factors governing this epigenetic regulation of TH gene expression in the perikatya of “quiescent” neurons would op- erate, for instance, in the target areas of these neurons (Iacovitti et al., 1987; Robinson et al., 1993). In the somatic environment of these “quiescent” neurons, TH expression could also be trans- synaptically regulated (Tashiro et al., 1989, 1990; Baker et al., 1993; Weiser et al., 1993). In their environment, cells in the CNS are not only able to detect the presence of neurotransmitter but also humoral factors that could control TH gene expression in their target cells (Brawer et al., 1986; Simerly et al., 1989). In our model, the factors controlling TH expression in “qui- escent” cells are still unknown. Temporal involvements of each population of these cells could have discriminating functions. The establishment of TH increased levels in the LC at the adult stage after physiological perturbations (Richard et al., 1988; Schmitt et al., 1993) or pharmacological treatments (Debure et al., 1992; Schmitt et al., 1993) could involve some population of transient TH-expressing cells that appeared during devel- opment. In one of these models, Debure et al. (1992) have demonstrated in the LC of adult rat the existence of a “quies- cent” TH-expressing cell population, whose TH gene has been awakened by the RU24722 administration. Some of these cells (the so-called “sleeping” cells) were supposed to be localized outside the space of control rat LC because of the enhancement of the volume delineated by the TH-expressing cells in the treat- ed rats. Such cells may have expressed TH protein trait in earlier developmental stages and could correspond to a pool oftransient TH-expressing cells suggested in this study. We have localized one pool of transient TH-expressing cells at the vicinity of the space of the adult LC, which would have failed its TH expression capacity between PND 14 and PND2 1.
We determined with precision the cellular phenotypic char- acteristics of TH expression in the LC during postnatal devel- opment. Despite the lack of knowledge about the characteriza- tion of the transient TH-expressing cells, we suggested the ex- istence of three different pools of such cells. It was particularly interesting to precisely determine where such cells are localized to characterize further their neurochemical identity when TH protein is not expressed. Further studies are obviously needed
to apprehend factors governing the plasticity of TH expression in such topologically defined populations of cells.
References Abercrombie M (1946) Estimation of nuclear population from mi-
crotome sections. Anat Ret 94~239-247. Baker H, Morel K, Stone DM, Manmiak JA (1993) Adult naris closure
profoundly reduces tyrosine hydroxylase expression in mouse olfac- tory bulb. Brain Res 614:109-l 16.
Berger B, Vemey C, Gaspar P, Febvret A (1985) Transient expression of tyrosine hydroxylase immunoreactivity in some neurons of the rat neocortex during postnatal development. Dev Brain Res 23: 14 1-144.
Black IB, Adler JE, Dreyfus CF, Jonakait GM, Katz DM, LaGamma EF. Markev KM (1984) Neurotransmitter nlasticitv at the molecular level. Science 22s 1266-1270.
,
Blanchard V, Raisman-Vorazi R, Savasta M, Hirsch E, Javoy-Agid F, Feuerstein C, Agid Y (1993) Cellular quantification of tyrosine hy- droxylase in the rat brain by immunoautoradiography. J Neurochem 61:617-626.
Brawer J, Bertley J, Beaudet A (1986) Testosterone inhibition of ty- rosine hydroxylase expression in the hypothalamic arcuate nucleus. Neurosci L&t 67:3 13-3 18.
Chamba G, Weissmann D, Rousset C, Renaud B, Pujol JF (1991) Distribution of amha- and alnha-2 bindine sites in the rat locus coeruleus. Brain Res Bull 26: 185-l 93. -
Debure LI, Moyse E, Fevre-Montange M, Hardin H, Belin MF, Rousset C. Puiol JF. Weissmann D (1992) Somatotonic oreanization of ty- r&i& hydr’oxylase expression in the rat locus coeruleus: long term effect of RU24722. Brain Res 58 1: 19-32.
Dreyfus CF, Markey KA, Goldstein M, Black IB (1983) Development of catecholaminergic phenotypic characters in the mouse locus coe- ruleus in vivo and in culture. Dev Biol 97:48-58.
Ebosole P, Pamavelas JG, Blue ME (198 1) Development of the visual cortex of rats treated with 6-hvdroxvdonamine in earlv life. Anat Embryo1 (Berl) 162:489-492. I - -
Gagne C, Moyse E, Kocher L, Bour H, Pujol JF (1990) Light-micro- scopic localization of somatostatin bindine sites in the locus coeruleus of the rat. Brain Res 530: 196-204. -
Iacovitti L, Lee J, Joh TH, Reis DJ (1987) Expression of tyrosine hydroxylase in neurons of cultured cerebral cortex: evidence for phe- notypic plasticity in neurons of the CNS. J Neurosci 7: 1264-l 270.
Jaeger CB, Joh TH (1983) Transient expression of tyrosine hydrox- ylase in some neurons of the developing inferior colliculus of the rat. Dev Brain Res 11:128-132.
Janet E, Burke RE (1993) Naturally occurring cell death during post- natal development of the substantia nigra pars compacta of rat. Mol Cell Neurosci 4:30-35.
Joh TH, Reis DJ (1975) Different forms of tyrosine hydroxylase in central dopaminergic and noradrenergic neurons and sympathetic ganglia. Brain Res 85: 146-151.
Kasamatsu T, Pettigrew JD (1976) Depletion ofbrain catecholamines: failure of ocular dominance shift after monocular occlusion in kittens. Science 194:206-209.
Kasamatsu T, Pettigrew JD (1979) Preservation of binocularity after monocular deprivation in the striate cortex of kittens treated with 6-hydroxydopamine. J Comp Nemo1 185: 139-l 62.
Kasamatsu T, Ohashi T, Imamura K (1989) Integration of adrenergic and choline& regulation in ocular dominance plasticity. Biomed Res lO[Suppl 2]:43-53.
Komori K, Sakai M, Karasawa N, Yamada K, Nagatsu I (199 1) Ev- idence for transient expression of tyrosine hydroxylase immunoreac- tivity in the mouse striatum and the effect of colchicine. Acta His- tochem Cytochem 2:223-23 1.
Lauder JM, Bloom FE (1974) Ontogeny of monoamine neurons in the locus coeruleus, raphe nuclei and substantia nigra of the rat. I. Cell differentiation. J Comn Neurol 155:469482.
Levitt M, Spector S, Sjoersma A, Udenfriend S (1965) Elucidation of the rate-limiting step in the norepinephrine biosynthesis in the per- fused guinea-pig heart. J Pharmacol Exp Ther 148: l-8.
Lidov HGW, Molliver ME (1982) The structure of cerebral cortex in the rat following prenatal administration of 6-hydroxydopamine. Dev Brain Res 3:81-108.
Laughlin SE, Foote SL, Bloom FE (1986) Efferent projections of nu- cleus locus coeruleus: topographic organization of cells of origin dem-
The Journal of Neuroscience, December 1994, 14(12) 7501
onstrated by three-dimensional reconstruction. Neuroscience 18:29 l- 306.
Luque JM, de Blas MR, Segovia S, Guillamon A (1992) Sexual di- morphism of the dopamine-@-hydroxylase-immunoreactive neurons in the rat locus ceruleus. Dev Brain Res 67:211-215.
Maeda T, Dresse A (1969) Recherches sur le developpement du locus coeruleus. I. Etude des catecholamines au microscope de fluorescence. Acta Neural Belg 69:5-10.
Maeda T, Tohyama M, Shimizu N (1974) Modification of postnatal development of neocortex in rat brain with experimental deprivation of locus coeruleus. Brain Res 70:5 15-520.
Nagatsu I, Komori K, Takeuchi T, Sakai M, Yamada K, Karasawa N (1990) Transient tyrosine hydroxylase-immunoreactive neurons in the region of the anterior olfactory nucleus of pre- and postnatal mice do not contain dopamine. Brain Res 5 11:55-62.
Nagatsu I, Levitt M, Udenfriend S (1964) Tyrosine hydroxylase. The initial step in norepinephrine synthesis. J Bib1 Chem 239:29 10-2917.
Ouuenheim RW (1991) Cell death durina the development of the nervous system. ‘Ann; Rev Neurosci 14:453-50 1. -
Pamavelas JG, Blue ME (1982) The role of the noradrenergic system on the formation of synapses in the visual cortex of the rat. Dev Brain Res 3:140-144.
Pickel VM, Joh TH, Field PM, Becker CG, Reis DJ (1975) Cellular localization oftyrosine hydroxylase by immunohistochemistry. J His- tochem Cytochem 23: l-l 2.
Richard F, Faucon-Biguet N, Labatut R, Rollet D, Mallet J, Buda M (1988) Modulation of tyrosine hydroxylase gene expression in rat brain and adrenal by exposure to cold. J Neurosci Res 260:32-37.
Robinson LJ, Black IB, Dreyfus CF (1993) Hippocampal regulation of the survival and morphological development of locus coeruleus neurons in dissociated cell culture. J Camp Neurol 333:567-577.
Satoh J, Suzuki K (1990) Tyrosine hydroxyiase-immunoreactive neu- rons in the mouse cerebral cortex during the postnatal period. Dev Brain Res 53:1-5.
Schmitt P, Reny-Palasse V, Bourde 0, Garcia C, Pujol JF (1993a) Further characterization of the long-term effect of RU24722 on ty- rosine hydroxylase in the rat locus coeruleus. J Neurochem 6 1: 1423- 1429.
Schmitt P, Pequignot J, Garcia C, Pujol JF, Pequignot JM (1993b) Regional specificity of the long-term regulation of tyrosine hydrox- ylase in some catecholaminergic rat brainstem areas. I. Influence of long-term hypoxia. Brain Res 611:53-60.
Schmitt P, Pequignot J, Hanchin F, Pujol JF, Pequignot JM (1993~) Regional specificity of long-term regulation of tyrosine hydroxylase in some catecholaminergic rat brain areas. II. Effect of a chronic dihydralazine treatment. Brain Res 6 11:6 l-66.
Seiger A, Olson L (1973) Late prenatal ontogeny ofcentral monoamine neurons in the rat: fluorescence histochemical observations. Z Anat Entwicklungsgesch 140:28 l-3 18.
Sievers J, Lolova I, Jenner S, Klemm HP, Sievers H (198 1) Morpho- logical and biochemical studies on the ontogenesis of the nucleus locus coeruleus. Bib1 Anat 19:52-130.
Simerly RB (1989) Hormonal control of the development and regu- lation of tyrosine hydroxylase expression within a sexually dimorphic population of dopaminergic cells in the hypothalamus. Mol Brain Res 6~297-3 10.
Specht LA, Pickel VM, Joh TH, Reis DJ (1981) Light-microscopic immunocytochemical localization of tyrosine hydroxylase in prenatal rat brain. I. Early ontogeny. J Comp Neurol 199:233-253.
Stemberger LA, Hardy X Jr, Cuculis PH, Mayer HG (1970) The unlabeled antibody-enzyme method of immunochemistry. Prepara- tion and properties of soluble antigen-antibody complex (horseradish peroxidase-antihorseradish peroxidase) and its use in identification of spirochetes. J Histochem-18:3 15-339.
Swanson LW (1976) The locus coeruleus: a cvtoarchitectonic. Golai and immunohistochemical study in the albino-rat. Brain Res 1’10:3& 56.
Tashiro T, Sugimoto T, Hattori T, Uemura Y, Nagatsu I, Kikuchi H, Mizuno N (1989) Tyrosine hydroxylase-like immunoreactive neu- rons in the striatum of the rat..Neurosci Lett 97:6-10.
Tashiro Y. Kaneko T. Naaatsu I. Kikuchi H. Mizuno N (1990) In- crease of tyrosine hydroiylase-like immunoreactive neurons in the nucleus accumbens and the olfactory bulb in the rat with the lesion in the ventral tegmental area of the midbrain. Brain Res 531:159- 166.
Touret M, Valatx JL, Jouvet M (1982) The locus coeruleus: a quan- titative and genetic study in mice. Brain Res 250:353-357.
Vemey C, Berger B, Adrien J, Vigny A, Gay M (1982) Development of the dopaminergic innervation of the rat cerebral cortex. A light microscopic immunocytochemical study using anti-tyrosine hydrox- ylase antibodies. Dev Brain Res 5:41-52.
Vemey C, Gaspar P, Febvret A, Berger B (1988) Transient tyrosine hydroxylase-like immunoreactive neurons contain somatostatin and substance P in the developing amygdala and bed nucleus of the stria terminalis of the rat. Dev Brain Res 42:45-58.
Weiser M, Baker H, Wessel TC, Joh TH (1993) Axotomy-induced differential gene induction in neurons of the locus ceruleus and sub- stantia nigra. Mol Brain Res 17:3 19-327.
Weissmann D, Labatut R, Rousset C, Pujol JF (1989) Direct transfer into nitrocellulose and quantitative radioautographic anatomical de- termination of brain tyrosine hydroxylase protein concentration. J Neurochem 531793-799.
Wendlandt S, Crow TJ, Stirling RV (1977) The involvement of the noradrenergic system arising from the locus coeruleus in the postnatal development of the cortex in rat brain. Brain Res 125: l-9.
Zyzek E, Richard F, Bouilloux JP, Pujol JF (1990) Ontogeny of ty- rosine hydroxylase concentration in locus coeruleus of newborn rats: long-term effects of RU24722. J Neurochem 55:849-853.
Related Documents