Cranfield University at Silsoe September 2001 INSTITUTE OF AGRITECHNOLOGY By Laure Caussiol Supervisor: Professor Daryl JOYCE THIS THESIS IS SUBMITTED IN PARTIAL FULFILMENT OF THE REQUIREMENTS FOR THE DEGREE OF MASTER OF SCIENCES Master of Science by Research in Postharvest Technology Postharvest quality of conventionally and organically grown banana fruit Submitted on September 2001 Academic year 2000/2001

Welcome message from author
This document is posted to help you gain knowledge. Please leave a comment to let me know what you think about it! Share it to your friends and learn new things together.
Transcript
Cranfield University at Silsoe September 2001
Laure Caussiol MSc by Research i
INSTITUTE OF AGRITECHNOLOGY
By
Laure Caussiol
Supervisor: Professor Daryl JOYCE
THIS THESIS IS SUBMITTED IN PARTIAL FULFILMENT OF THE REQUIREMENTS FOR THE DEGREE OF MASTER OF SCIENCES
Master of Science by Research in Postharvest Technology
Postharvest quality
of conventionally and organically
grown banana fruit
Submitted on September 2001Academic year 2000/2001
Cranfield University at Silsoe September 2001
Laure Caussiol MSc by Research ii
Abstract
Quality is increasingly important for retailers, who tend to look for more definitive
assessment criteria. Taste has become a major issue over past years for consumers,
who are seeking higher quality produce. For banana fruit, at least one major retailer is
asking TSS measurement in addition to the usual assessment based on skin colour. At
the same time organic produce sales are increasingly important for ripeners and
retailers to consumers.
This study investigated variability in banana pulp with regard to sampling position
from proximal, middle and distal portions. Also two different devices, the traditional
pocket refractometer and the digital refractometer were evaluated. TSS was measured
on juice obtained directly from the pulp, as practised by one supermarket
representative, versus the more conventional method of homogenizing pulp samples
in distilled water. Finally, a comparison of postharvest qualities of conventionally and
organically grown banana fruit from nearby plantations in the Dominican Republic
was made. This comparison involved several harvest times over the seasonal period
from February to June 2001.
Green mature Cavendish bananas var. Grand Nain were imported from the Dominican
Republic by SH Pratt’s & Co. (Luton, UK). Both the conventionally and the
organically grown bananas from the same area were held at about 15°C during
shipping and handling. The fruit were then ripened in a postharvest laboratory in the
UK with a shot of 100 µL/L ethylene applied for 48 hours at 20 ±1°C. They were
then assessed over 12 days of shelf life at this same temperature and at 60 ±10 %
relative humidity. Fruit weight (g), colour (L* and H°), acidity (ml of 0.1 N NaOH),
firmness (N) and TSS (%Brix) were assessed every second day during shelf life. In
addition, starch breakdown was visualised by dipping slices of banana in iodine
solution. Sensory analysis on the ripened fruit was also made with 30 panellists for
four out of six of the harvest times.
Cranfield University at Silsoe September 2001
Laure Caussiol MSc by Research iii
The results suggest that for measuring sugar as a quality parameter, sampling should
be done from the middle of the fruit. Also the conventional diluted extract sampling
method is to be preferred. The pocket refractometer (0-30% range) was well suited for
making TSS measurements. There were virtually no significant differences (P≤0.05)
in objectively postharvest qualities between conventionally and organically grown
fruit. Moreover sensory analysis confirmed this conclusion.
Cranfield University at Silsoe September 2001
Laure Caussiol MSc by Research iv
Dedication
To my friend Sophie

Cranfield University at Silsoe September 2001
Laure Caussiol MSc by Research v
Acknowledgements
I would like to thank
- My supervisor Professor Daryl Joyce for his guidance and advice;
- Severine Ruel, Brice Lamarque and all the employees from SH Pratt’s &Co,
(Luton UK) for their co-operation in this project;
- Dr. Anwar Haque and Dr. Helen White for their advice in thesis committees;
- Allen Hilton for his grateful help in the laboratory;
- Dr John Orchard through his professional collaboration for this thesis;
- All the panellists who kindly agreed to take part in sensory analysis;
- Paul Dauny and Leon Terry for their help and support all year long;
- Xavier Morat, Benoit Lallement, Cecile Gamby, Laetitia Bouchut, Caroline
Paolucci and Stephane Gueritte for their precious help;
- My family and the Silsoe family for their moral support during this intensive year.
Cranfield University at Silsoe September 2001
Laure Caussiol MSc by Research vi
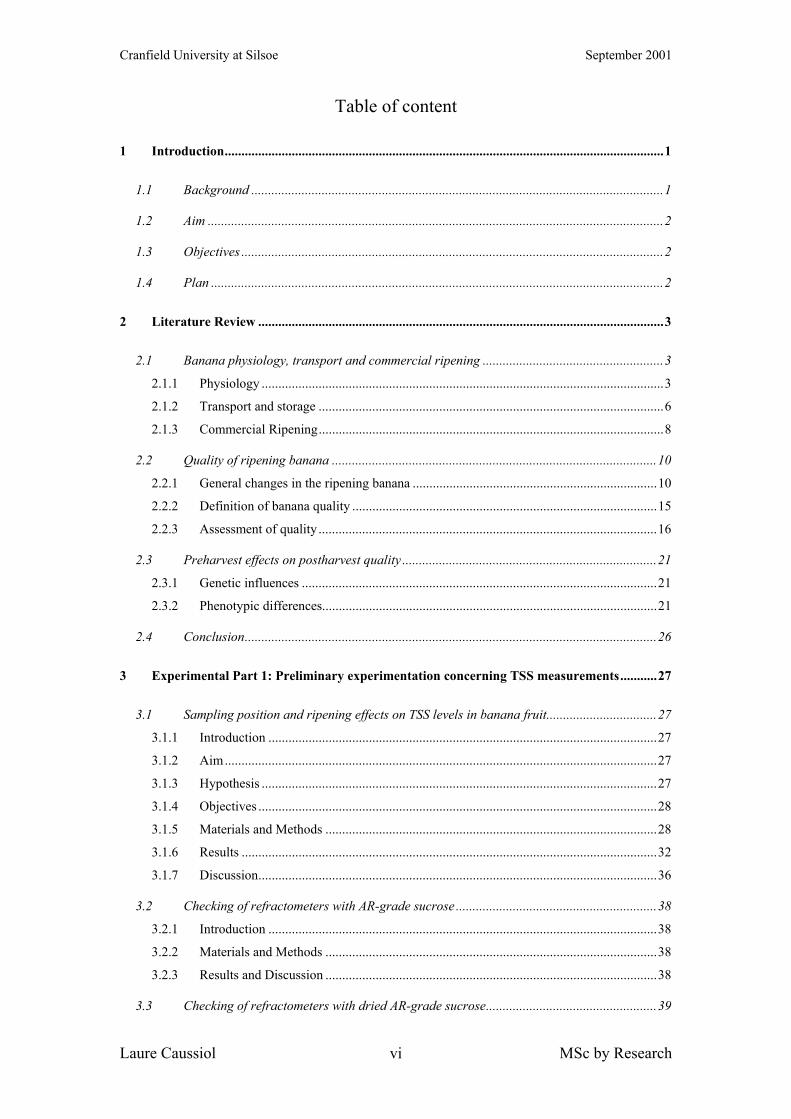
Table of content
1 Introduction...................................................................................................................................1
1.1 Background ...........................................................................................................................1
1.2 Aim ........................................................................................................................................2
1.3 Objectives ..............................................................................................................................2
1.4 Plan .......................................................................................................................................2
2 Literature Review .........................................................................................................................3
2.1 Banana physiology, transport and commercial ripening ......................................................3 2.1.1 Physiology ........................................................................................................................3 2.1.2 Transport and storage .......................................................................................................6 2.1.3 Commercial Ripening.......................................................................................................8
2.2 Quality of ripening banana .................................................................................................10 2.2.1 General changes in the ripening banana .........................................................................10 2.2.2 Definition of banana quality ...........................................................................................15 2.2.3 Assessment of quality .....................................................................................................16
2.3 Preharvest effects on postharvest quality ............................................................................21 2.3.1 Genetic influences ..........................................................................................................21 2.3.2 Phenotypic differences....................................................................................................21
2.4 Conclusion...........................................................................................................................26
3 Experimental Part 1: Preliminary experimentation concerning TSS measurements...........27
3.1 Sampling position and ripening effects on TSS levels in banana fruit.................................27 3.1.1 Introduction ....................................................................................................................27 3.1.2 Aim.................................................................................................................................27 3.1.3 Hypothesis ......................................................................................................................27 3.1.4 Objectives .......................................................................................................................28 3.1.5 Materials and Methods ...................................................................................................28 3.1.6 Results ............................................................................................................................32 3.1.7 Discussion.......................................................................................................................36
3.2 Checking of refractometers with AR-grade sucrose ............................................................38 3.2.1 Introduction ....................................................................................................................38 3.2.2 Materials and Methods ...................................................................................................38 3.2.3 Results and Discussion ...................................................................................................38
3.3 Checking of refractometers with dried AR-grade sucrose...................................................39
Cranfield University at Silsoe September 2001
Laure Caussiol MSc by Research vii
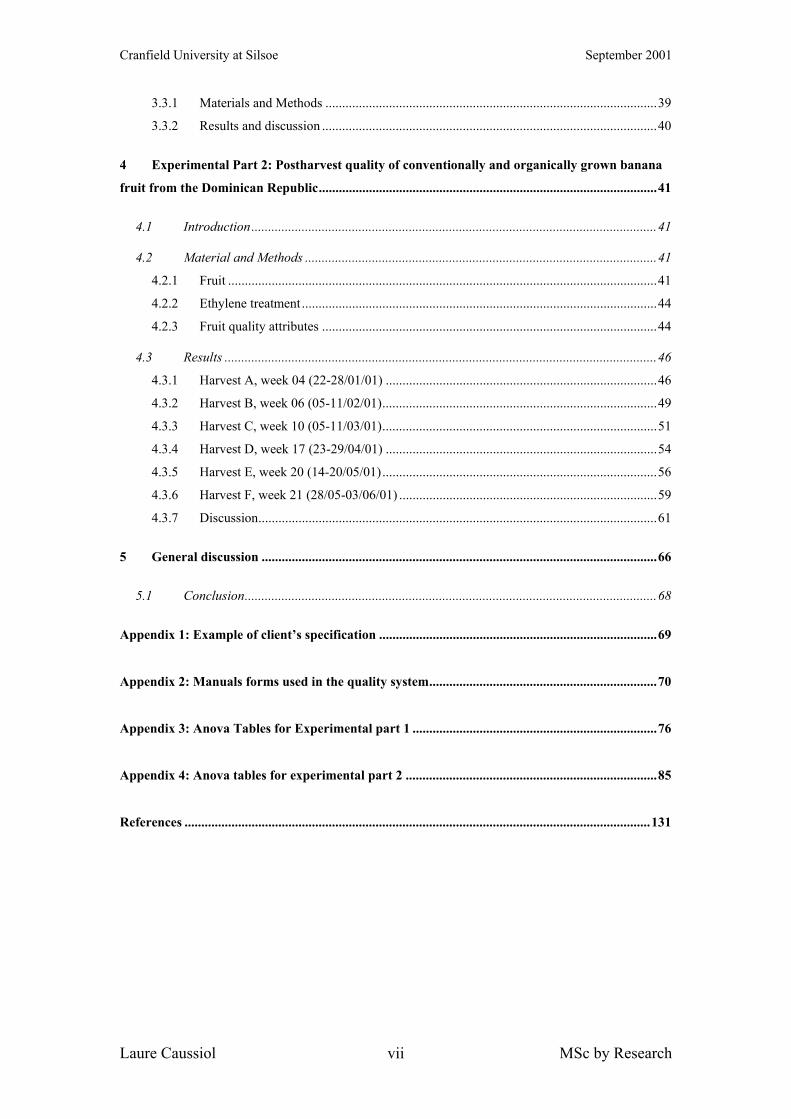
3.3.1 Materials and Methods ...................................................................................................39 3.3.2 Results and discussion ....................................................................................................40
4 Experimental Part 2: Postharvest quality of conventionally and organically grown banana
fruit from the Dominican Republic.....................................................................................................41
4.1 Introduction.........................................................................................................................41
4.2 Material and Methods .........................................................................................................41 4.2.1 Fruit ................................................................................................................................41 4.2.2 Ethylene treatment ..........................................................................................................44 4.2.3 Fruit quality attributes ....................................................................................................44
4.3 Results .................................................................................................................................46 4.3.1 Harvest A, week 04 (22-28/01/01) .................................................................................46 4.3.2 Harvest B, week 06 (05-11/02/01)..................................................................................49 4.3.3 Harvest C, week 10 (05-11/03/01)..................................................................................51 4.3.4 Harvest D, week 17 (23-29/04/01) .................................................................................54 4.3.5 Harvest E, week 20 (14-20/05/01)..................................................................................56 4.3.6 Harvest F, week 21 (28/05-03/06/01) .............................................................................59 4.3.7 Discussion.......................................................................................................................61
5 General discussion ......................................................................................................................66
5.1 Conclusion...........................................................................................................................68
Appendix 1: Example of client’s specification ...................................................................................69
Appendix 2: Manuals forms used in the quality system....................................................................70
Appendix 3: Anova Tables for Experimental part 1 .........................................................................76
Appendix 4: Anova tables for experimental part 2 ...........................................................................85
References ...........................................................................................................................................131
Cranfield University at Silsoe September 2001
Laure Caussiol MSc by Research viii
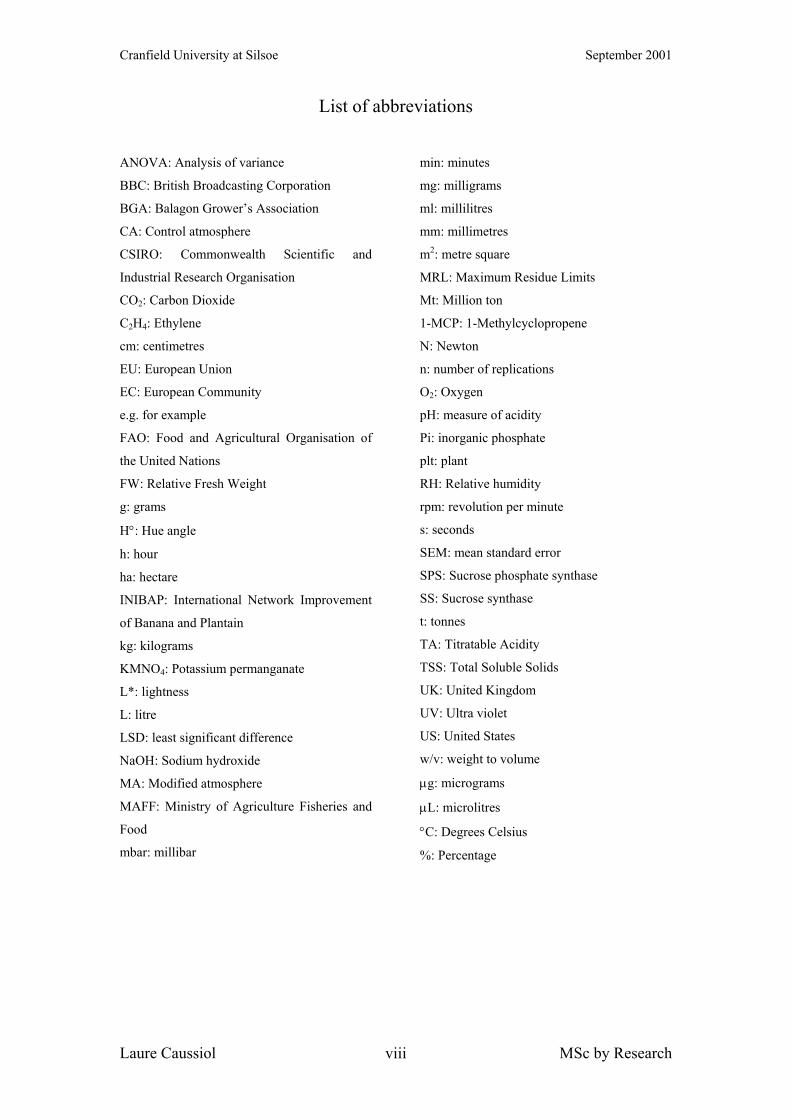
List of abbreviations ANOVA: Analysis of variance
BBC: British Broadcasting Corporation
BGA: Balagon Grower’s Association
CA: Control atmosphere
CSIRO: Commonwealth Scientific and
Industrial Research Organisation
CO2: Carbon Dioxide
C2H4: Ethylene
cm: centimetres
EU: European Union
EC: European Community
e.g. for example
FAO: Food and Agricultural Organisation of
the United Nations
FW: Relative Fresh Weight
g: grams
H°: Hue angle
h: hour
ha: hectare
INIBAP: International Network Improvement
of Banana and Plantain
kg: kilograms
KMNO4: Potassium permanganate
L*: lightness
L: litre
LSD: least significant difference
NaOH: Sodium hydroxide
MA: Modified atmosphere
MAFF: Ministry of Agriculture Fisheries and
Food
mbar: millibar
min: minutes
mg: milligrams
ml: millilitres
mm: millimetres
m2: metre square
MRL: Maximum Residue Limits
Mt: Million ton
1-MCP: 1-Methylcyclopropene
N: Newton
n: number of replications
O2: Oxygen
pH: measure of acidity
Pi: inorganic phosphate
plt: plant
RH: Relative humidity
rpm: revolution per minute
s: seconds
SEM: mean standard error
SPS: Sucrose phosphate synthase
SS: Sucrose synthase
t: tonnes
TA: Titratable Acidity
TSS: Total Soluble Solids
UK: United Kingdom
UV: Ultra violet
US: United States
w/v: weight to volume
µg: micrograms
µL: microlitres
°C: Degrees Celsius
%: Percentage
Cranfield University at Silsoe September 2001
Laure Caussiol MSc by Research ix
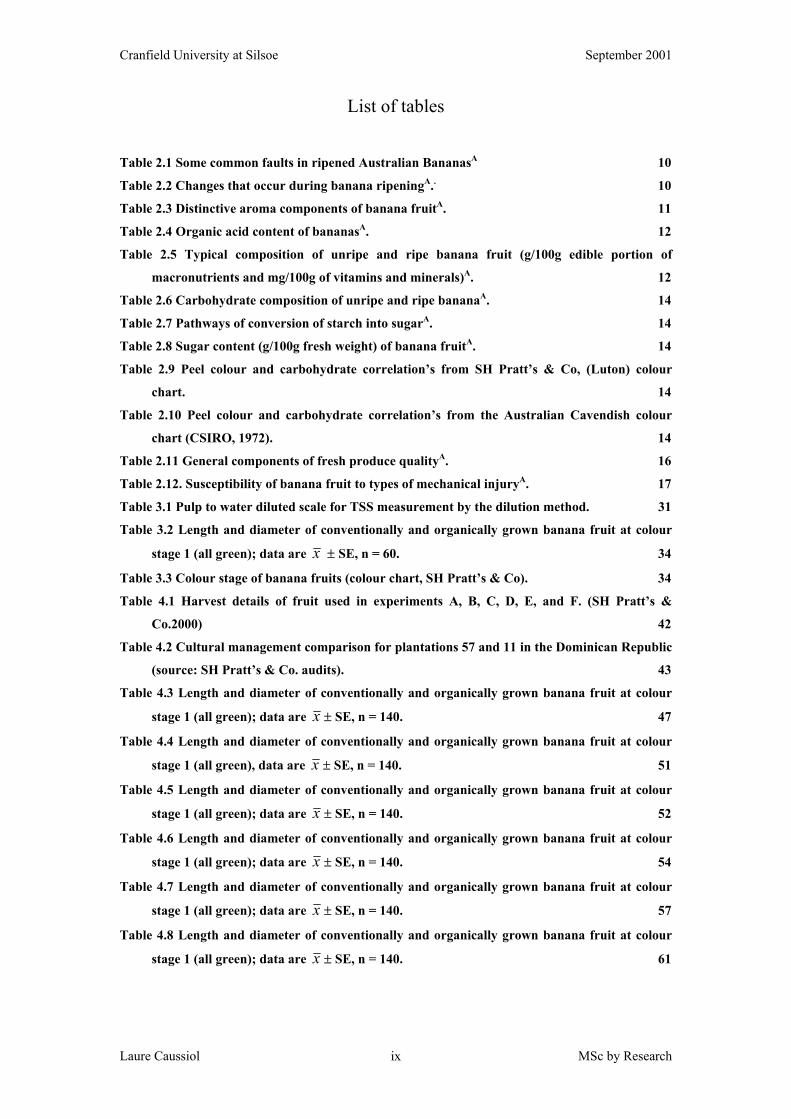
List of tables Table 2.1 Some common faults in ripened Australian BananasA 10 Table 2.2 Changes that occur during banana ripeningA.. 10 Table 2.3 Distinctive aroma components of banana fruitA. 11 Table 2.4 Organic acid content of bananasA. 12 Table 2.5 Typical composition of unripe and ripe banana fruit (g/100g edible portion of
macronutrients and mg/100g of vitamins and minerals)A. 12 Table 2.6 Carbohydrate composition of unripe and ripe bananaA. 14 Table 2.7 Pathways of conversion of starch into sugarA. 14 Table 2.8 Sugar content (g/100g fresh weight) of banana fruitA. 14 Table 2.9 Peel colour and carbohydrate correlation’s from SH Pratt’s & Co, (Luton) colour
chart. 14 Table 2.10 Peel colour and carbohydrate correlation’s from the Australian Cavendish colour
chart (CSIRO, 1972). 14 Table 2.11 General components of fresh produce qualityA. 16 Table 2.12. Susceptibility of banana fruit to types of mechanical injuryA. 17 Table 3.1 Pulp to water diluted scale for TSS measurement by the dilution method. 31 Table 3.2 Length and diameter of conventionally and organically grown banana fruit at colour
stage 1 (all green); data are x ± SE, n = 60. 34 Table 3.3 Colour stage of banana fruits (colour chart, SH Pratt’s & Co). 34 Table 4.1 Harvest details of fruit used in experiments A, B, C, D, E, and F. (SH Pratt’s &
Co.2000) 42 Table 4.2 Cultural management comparison for plantations 57 and 11 in the Dominican Republic
(source: SH Pratt’s & Co. audits). 43 Table 4.3 Length and diameter of conventionally and organically grown banana fruit at colour
stage 1 (all green); data are x ± SE, n = 140. 47 Table 4.4 Length and diameter of conventionally and organically grown banana fruit at colour
stage 1 (all green), data are x ± SE, n = 140. 51 Table 4.5 Length and diameter of conventionally and organically grown banana fruit at colour
stage 1 (all green); data are x ± SE, n = 140. 52 Table 4.6 Length and diameter of conventionally and organically grown banana fruit at colour
stage 1 (all green); data are x ± SE, n = 140. 54 Table 4.7 Length and diameter of conventionally and organically grown banana fruit at colour
stage 1 (all green); data are x ± SE, n = 140. 57 Table 4.8 Length and diameter of conventionally and organically grown banana fruit at colour
stage 1 (all green); data are x ± SE, n = 140. 61
Cranfield University at Silsoe September 2001
Laure Caussiol MSc by Research x
List of figures Figure 2.1: Regulation of ethylene biosynthesis This reaction is normally suppressed and is the
rate-limiting step in the pathway; ➨, induction of synthesis of the enzyme; ⇐, inhibition of
the reaction. Met, Ado, Ade and MACC stand for methionine, adenosine, and 1-
malonyaminocyclopropane-1-carboxylic acid, respectively, from Yang, (1985). 5 Figure 2.2 Fruit respiration and ethylene production of banana fruit at 20°C, ■ CO2, and x C2H4
production, from Biale et al., (1953). 6 Figure 2.3 Colour chart, SH Pratt’s & co, (Luton, UK). 9 Figure 2.4 Pallet label used by the port. 18 Figure 2.5. Banana fruit labels from the Dominican Republic (SH Pratt’s & Co, Luton). Numbers
57 and 11 show plantation origin and 4011 and 94011 conventionally and organically grown
fruit respectively. 19 Figure 2.6 Label of organically grown banana fruit sold in supermarket (source: SH Pratt’s &
Co.) 26 Figure 3.1 Green banana fruit arranged in an open apple tray. 29 Figure 3.2 Digital calliper (Mitutoyo, Japan) and flexible ruler (Geest, UK). 31 Figure 3.3 Pocket 0-30 % (Bellingham and Stanley, UK) and digital 0-30% refractometers (Atago
PR-1, Japan), for the undiluted method. 31 Figure 3.4 Apparatus for homogenisation of banana pulp tissue slices. 31 Figure 3.5 Pocket 0-30 % (Bellingham and Stanley, UK) and digital 0-30% refractometers (Atago
PR-1, Japan), for the diluted method. 32 Figure 3.6 Changes in A. lightness (L*), B. hue angle (H°), and C. FW (%) measured every
second day during shelf life. Keys for graphs: conventionally ■ and organically ○ grown
banana fruits; data are x , n = 5, vertical bars show ± SEM, n = 10 (for ANOVA see
Appendix 3). 34 Figure 3.7. Changes in A. and B. TA (ml of NaOH), and C. and D. starch staining (%), measured
every second day during shelf life. Keys for graphs: conventionally ■ and organically ○
grown banana fruits, proximal ▲, middle + and distal △ positionl; data are x , n = 5,
vertical bars show ± SEM, n = 10 (for ANOVA see Appendix.3). In panel A, TA for
conventionally grown fruit was not measured on day 0 because of broken apparatus. 35 Figure 3.8 Changes in A. B. C. and D. TSS (%) measured every second day during shelf life. Keys
for graphs: conventionally ■ and organically ○ grown banana fruits; proximal ▲, middle +
and distal △ position, undiluted x, and diluted x method, pocket ♦, and digital ◊
refractometer; data are x , n = 5, vertical bars show ± SEM, n = 10 (for ANOVA see
Appendix 3). 36 Figure 3.9 TSS (%) concentrations measured on pure AR-grade sucrose solutions with pocket 0-
50%, pocket 0-30%, and digital refractometers. Keys for graphs: pocket 0-50% □, pocket
Cranfield University at Silsoe September 2001
Laure Caussiol MSc by Research xi
0-30% ♦, and digital ◊ refractometer; data are x , n = 2, vertical bars show ± SEM, n = 6.
39 Figure 3.10. TSS (%) concentration measured on pure AR-grade dried sucrose solutions with
pocket 0-50%, pocket 0-30%, and digital refractometers. Keys for graphs: pocket 0-50% □,
pocket 0-30% ♦, and digital ◊ refractometer; data are x , n = 3, vertical bars show ± SEM,
n = 12. 40
Figure 4.1 Monthly averages of temperatures (°C) ♦ and precipitation (l/m2) ▌ for the Santiago
station in the Dominican Republic in 1999. (source: from Meteo France internet site). 43 Figure 4.2 Pulp firmness assessment on banana fruit. 44 Figure 4.3 Questionnaire for triangle test from Larmond (1977). 46 Figure 4.4. Changes in A. L*, B. H°, C. FW (%), D. firmness (N), E. TA (ml of NaOH), F. starch
staining (%), and G. and H. TSS (%) measured every second day during shelf life. Keys for
graphs: conventionally ■ and organically ○ grown banana fruit, x undiluted and x diluted
method, data are x , n = 20; vertical bars show ± SEM, n = 40 (for ANOVA see Appendix
4.1). 48 Figure 4.5 Changes in A. L*, B. H°, C. FW (%), D. firmness (N), E. TA (ml of NaOH), F. starch
staining (%), and G. and H. TSS (%) measured every second day during shelf life. Keys for
graphs: conventionally ■ and organically ○ grown banana fruit, x undiluted and x diluted
method; data are x , n = 20, vertical bars show ± SEM, n = 40 (for ANOVA see Appendix
4.2). 50 Figure 4.6 Changes in A. L*, B. H°, C. FW (%), D. firmness (N), E. TA (ml of NaOH), F. starch
staining (%), and G. and H. TSS (%) measured every second day during shelf life. Keys for
graphs: conventionally ■ and organically ○ grown banana fruit, x undiluted and x diluted
method; data are x , n = 20, vertical bars show ± SEM, n = 40 (for ANOVA see Appendix
4.3.1). 53 Figure 4.7 Changes in A. L*, B. H°, C. FW (%), D. firmness (N), E. TA (ml of NaOH), F. starch
staining (%), and G. and H. TSS (%) measured every second day during shelf life. Keys for
graphs: conventionally ■ and organically ○ grown banana fruit, x undiluted and x diluted
method; data are x , n = 20, vertical bars show ± SEM, n = 40 (for ANOVA see Appendix
4.4.1). 55 Figure 4.8 Changes in A. L*, B. H°, C. FW (%), D. firmness (N), E. TA (ml of NaOH), F. starch
staining (%), and G. and H. TSS (%) measured every second day during shelf life. Key for
graphs: conventionally ■ and organically ○ grown banana fruit, x undiluted and x diluted
method; data are x , n = 20, vertical bars show ± SEM, n = 40 (for ANOVA see Appendix
4.5.1). 58 Figure 4.9 Changes in A. L*, B. H°, C. FW (%), D. firmness (N), E. TA (ml of NaOH), F. starch
staining (%), and G. and H. TSS (%) measured every second day during shelf life. Keys for
Cranfield University at Silsoe September 2001
Laure Caussiol MSc by Research xii
graphs: conventionally ■ and organically ○ grown banana fruit, x undiluted and x diluted
method; data are x , n = 20, vertical bars show ± SEM, n = 40 (for ANOVA see Appendix
4.6.1). 60 Figure 4.10 Changes in A. length and B. diameter measured on day 0 at colour stage 1 (all green)
for the 6 harvests A (22-28/Jan), B (05-11/ Feb), C (05-11/Mar), D (23-29/Apr), E (14-
20/May), and F (28/Jun-03/Jul). Keys for graphs: conventionally ■ and organically ○
grown banana fruit; data are x , n = 20, vertical bars show ± SE, n = 40. 63 Figure 4.11 Changes in A. L*, B. H°, C. FW (%), D. firmness (N), E. TA (ml of NaOH), F. starch
staining (%), and G. and H. TSS (%) measured on day 4 at colour stage 6 (all yellow) for
the 6 harvests A (22-28/Jan), B (05-11/ Feb), C (05-11/Mar), D (23-29/Apr), E (14-20/May),
and F (28/Jun-03/Jul). Keys for graphs: conventionally ■ and organically ○ grown banana
fruit, x undiluted and x diluted method; data are x , n = 20, vertical bars show ± SEM, n =
40. 64
Cranfield University at Silsoe September 2001
Laure Caussiol MSc by Research 1
1 Introduction
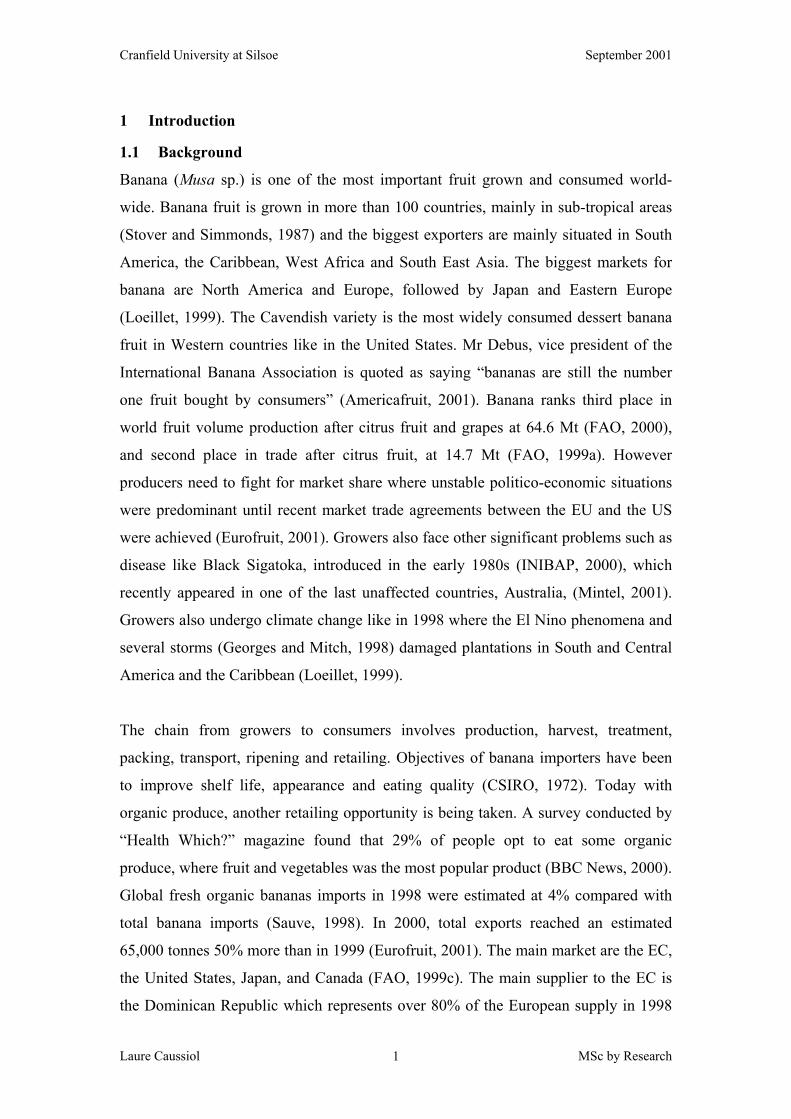
1.1 Background
Banana (Musa sp.) is one of the most important fruit grown and consumed world-
wide. Banana fruit is grown in more than 100 countries, mainly in sub-tropical areas
(Stover and Simmonds, 1987) and the biggest exporters are mainly situated in South
America, the Caribbean, West Africa and South East Asia. The biggest markets for
banana are North America and Europe, followed by Japan and Eastern Europe
(Loeillet, 1999). The Cavendish variety is the most widely consumed dessert banana
fruit in Western countries like in the United States. Mr Debus, vice president of the
International Banana Association is quoted as saying “bananas are still the number
one fruit bought by consumers” (Americafruit, 2001). Banana ranks third place in
world fruit volume production after citrus fruit and grapes at 64.6 Mt (FAO, 2000),
and second place in trade after citrus fruit, at 14.7 Mt (FAO, 1999a). However
producers need to fight for market share where unstable politico-economic situations
were predominant until recent market trade agreements between the EU and the US
were achieved (Eurofruit, 2001). Growers also face other significant problems such as
disease like Black Sigatoka, introduced in the early 1980s (INIBAP, 2000), which
recently appeared in one of the last unaffected countries, Australia, (Mintel, 2001).
Growers also undergo climate change like in 1998 where the El Nino phenomena and
several storms (Georges and Mitch, 1998) damaged plantations in South and Central
America and the Caribbean (Loeillet, 1999).
The chain from growers to consumers involves production, harvest, treatment,
packing, transport, ripening and retailing. Objectives of banana importers have been
to improve shelf life, appearance and eating quality (CSIRO, 1972). Today with
organic produce, another retailing opportunity is being taken. A survey conducted by
“Health Which?” magazine found that 29% of people opt to eat some organic
produce, where fruit and vegetables was the most popular product (BBC News, 2000).
Global fresh organic bananas imports in 1998 were estimated at 4% compared with
total banana imports (Sauve, 1998). In 2000, total exports reached an estimated
65,000 tonnes 50% more than in 1999 (Eurofruit, 2001). The main market are the EC,
the United States, Japan, and Canada (FAO, 1999c). The main supplier to the EC is
the Dominican Republic which represents over 80% of the European supply in 1998
Cranfield University at Silsoe September 2001
Laure Caussiol MSc by Research 2
(FAO, 1999c). After Germany, the UK is the second largest market which has
expanded rapidly due to the strong involvement of the leading supermarket chains
(FAO, 1999c).
Quality is an increasingly challenging issue for retailers, especially now with organic
produce, who tend to focus on consumers’ wishes. The present research investigates
variabilities in Total Soluble Solids (TSS) in bananas imported into the UK.
Considerable work has been done for banana on preharvest quality improvement and
on postharvest physiological and biochemical studies of, for instance, starch into
sugar conversions (Lizana, 1976; Marriott et al., 1981; Garcia and Lajolo, 1988;
Cordenunsi and Lajolo, 1989; Agravante et al., 1990; Hill and Rees, 1994; Kanellis et
al., 1989; Prahba and Bhagyalakshmi, 1998). However there has been surprisingly
little work on simple banana quality evaluation tests. Some sectors of the retail
industry seek a simple and precise quality criterion other than skin colour.
1.2 Aim
The aim of this work was to relate variation in TSS to pulp sample tissue type and to
fruit origin.
1.3 Objectives
The specific objectives of this work were to investigate in collaboration with SH
Pratt’s & Co (Luton, UK) variability in banana fruit TSS as a function of:
1. Pulp tissue sample position within the fruit,
2. Fruit position within the hand,
3. Ripening over time, and,
4. Organic versus conventional production practices.
1.4 Plan
This thesis is presented in three parts. The first part, the Literature Review, considers
banana quality and ripening from physiological and technical perspectives. Then, the
experiments are described under the two sections:
1. Within fruit and within hand variation in TSS over time, and,
2. Preharvest production system effects on TSS.
Finally, overall conclusions and recommendations are made in the general Discussion.
Cranfield University at Silsoe September 2001
Laure Caussiol MSc by Research 3
2 Literature Review
2.1 Banana physiology, transport and commercial ripening
Before reaching the supermarket shelves, green-mature banana fruit are transported
and ripened in the country of consumption (Kashmire and Ahrens, 1992). Retailers
require good shelf life and ideally perfect quality. To appreciate the technologies used
in postharvest processes, an overview of banana fruit physiology may be helpful.
2.1.1 Physiology
2.1.1.1 The Climacteric
Banana fruit ripening is characterised by many changes. Fruit respiration rate and
ethylene production are the main physiological factors that change and define the
climacteric group of fruit, which includes banana (Holl, 1977). This grouping also
includes apple, avocado and mango (Kader, 1992). Three main events occur after
harvest of banana fruit (John and Marchal, 1995): 1. the preclimacteric phase, where
the fruit remains unripe; 2. the ripening phase, where respiration rate is high; and, 3.
the senescent phase, when quality starts to deteriorate.
The preclimacteric period after harvesting is vitally important for importers and
ripeners because banana is transported before it is ripened. During this period, mature-
green fruit have a low basal respiration rate and ethylene production is almost
undetectable (Marriott and Lancaster, 1983). This period is also called the “green
life”. The longest practical preclimacteric period is desired. Green life can be
extended by decreasing temperature to 14°C, and storage under low O2 (≤ 8%) and
high CO2 (≥ 2%) and also by treatment with giberellins (Marriott and Lancaster,
1983).
After their green life, bananas enter the climacteric period, which can be typified by
three major sets of processes (Seymour et al., 1993): 1. a sharp rise in respiration,
indicated by an increase in carbon dioxide (CO2) production; 2. a decrease in the
internal tissue (i.e. pulp) oxygen (O2) level; and, 3. a rapid and transient peak in
endogenous ethylene production. This climacteric behaviour helps to determine
Cranfield University at Silsoe September 2001
Laure Caussiol MSc by Research 4
appropriate handling and storage protocols (Mitchell, 1992). The respiratory
climacteric can occur on the plant or after harvest. In the case of commercial banana,
it is induced by exposure to exogenous ethylene before the natural production
commences.
2.1.1.2 Role of ethylene
Ethylene gas (C2H4) is a natural plant hormone produced by many horticultural
commodities (Reid, 1992). For banana and other climacteric fruit, its role is to co-
ordinate ripening (Burg and Burg, 1965). Ethylene is also used commercially for
degreening mature citrus fruits (Kader and Kashmire, 1984). In climacteric fruits,
ethylene is produced in relatively large amounts. For ripening banana, internal
concentrations range between 0.05 and 2.1 µL/L (Wills et al., 1998). Endogenous
ethylene production from 0.1 to 4.0 µL/kg/h is often induced by exogenous ethylene
(John and Marchal, 1995).
Ethylene is physiologically active at very low concentrations, such as 0.1 µL/L
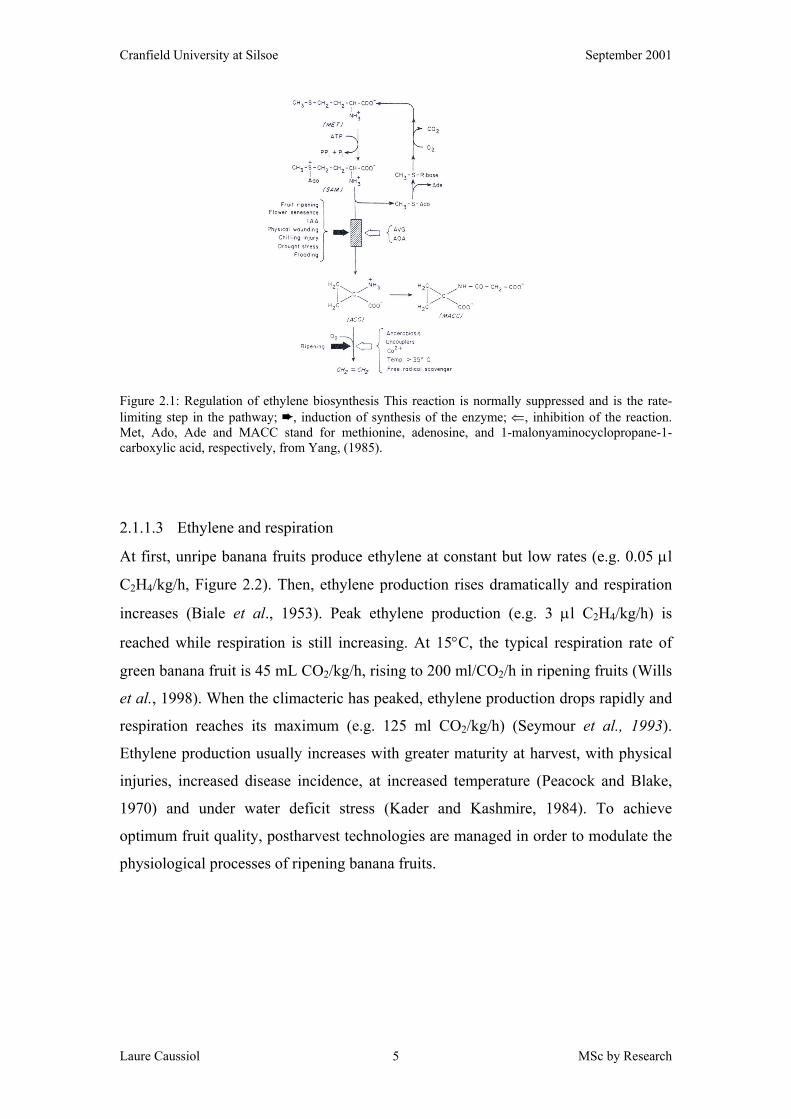
(Peacock, 1972). Ethylene is synthesised in the pulp (Dominguez and Vendrell, 1994)
from methionine through the key intermediates S-Adenosyl Methionine (SAM) and 1-
aminocyclopropane-1-carboxylic acid (ACC), a cyclic amino acid (Figure 2.1; Yang,
1985). The enzyme involved in the conversion of SAM to ACC is ACC synthase.
Conversion of ACC to ethylene is by ACC oxidase, otherwise known as EFE or the
Ethylene Forming Enzyme (McGlasson, 1985). In climacteric fruits, increasing
ethylene production and increasing respiration are strongly related.
Cranfield University at Silsoe September 2001
Laure Caussiol MSc by Research 5
Figure 2.1: Regulation of ethylene biosynthesis This reaction is normally suppressed and is the rate-limiting step in the pathway; ➨, induction of synthesis of the enzyme; ⇐, inhibition of the reaction. Met, Ado, Ade and MACC stand for methionine, adenosine, and 1-malonyaminocyclopropane-1-carboxylic acid, respectively, from Yang, (1985).
2.1.1.3 Ethylene and respiration
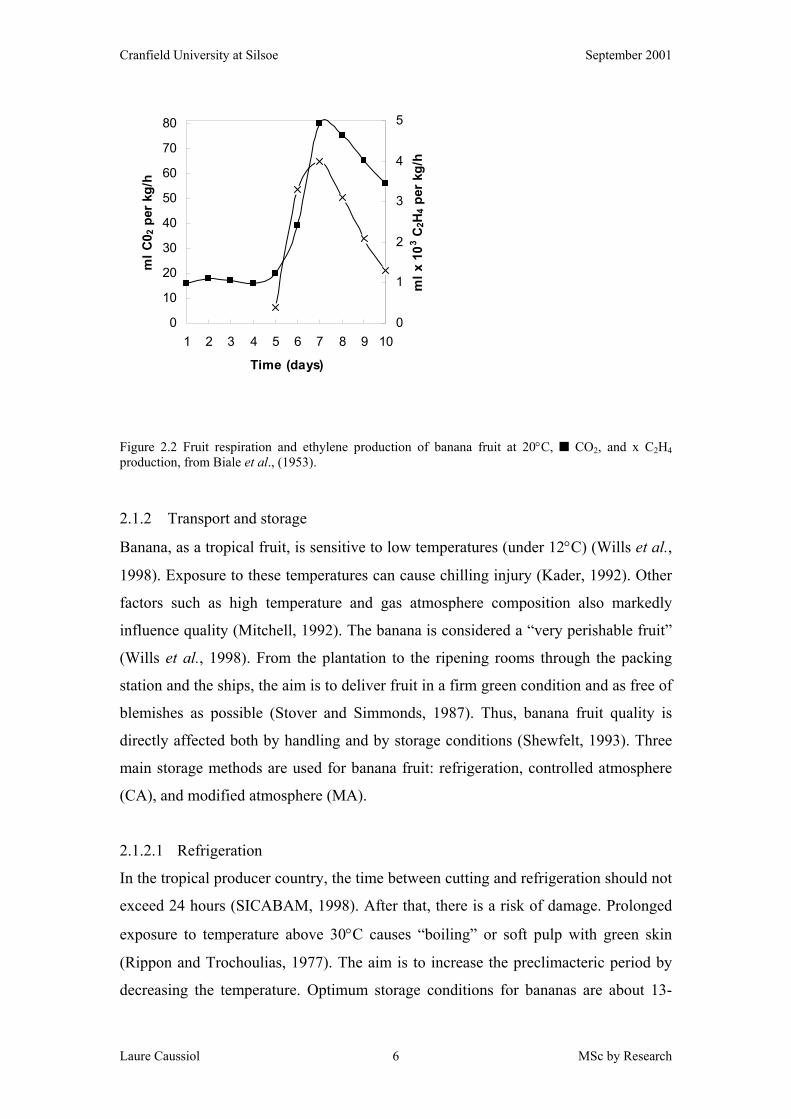
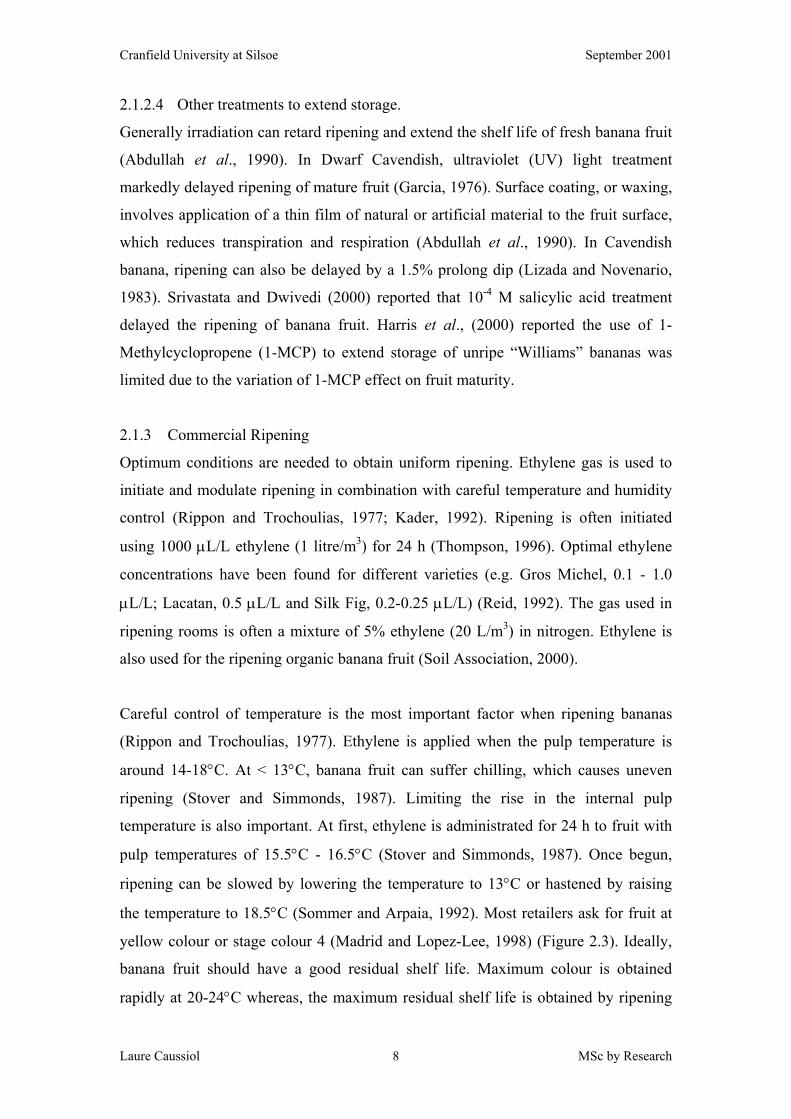
At first, unripe banana fruits produce ethylene at constant but low rates (e.g. 0.05 µl
C2H4/kg/h, Figure 2.2). Then, ethylene production rises dramatically and respiration
increases (Biale et al., 1953). Peak ethylene production (e.g. 3 µl C2H4/kg/h) is
reached while respiration is still increasing. At 15°C, the typical respiration rate of
green banana fruit is 45 mL CO2/kg/h, rising to 200 ml/CO2/h in ripening fruits (Wills
et al., 1998). When the climacteric has peaked, ethylene production drops rapidly and
respiration reaches its maximum (e.g. 125 ml CO2/kg/h) (Seymour et al., 1993).
Ethylene production usually increases with greater maturity at harvest, with physical
injuries, increased disease incidence, at increased temperature (Peacock and Blake,
1970) and under water deficit stress (Kader and Kashmire, 1984). To achieve
optimum fruit quality, postharvest technologies are managed in order to modulate the
physiological processes of ripening banana fruits.
Cranfield University at Silsoe September 2001
Laure Caussiol MSc by Research 6
0
10
20
30
40
50
60
70
80
1 2 3 4 5 6 7 8 9 10
Time (days)
ml C
0 2 p
er k
g/h
0
1
2
3
4
5
ml x
103 C
2H4 p
er k
g/h
Figure 2.2 Fruit respiration and ethylene production of banana fruit at 20°C, ■ CO2, and x C2H4 production, from Biale et al., (1953).
2.1.2 Transport and storage
Banana, as a tropical fruit, is sensitive to low temperatures (under 12°C) (Wills et al.,
1998). Exposure to these temperatures can cause chilling injury (Kader, 1992). Other
factors such as high temperature and gas atmosphere composition also markedly
influence quality (Mitchell, 1992). The banana is considered a “very perishable fruit”
(Wills et al., 1998). From the plantation to the ripening rooms through the packing
station and the ships, the aim is to deliver fruit in a firm green condition and as free of
blemishes as possible (Stover and Simmonds, 1987). Thus, banana fruit quality is
directly affected both by handling and by storage conditions (Shewfelt, 1993). Three
main storage methods are used for banana fruit: refrigeration, controlled atmosphere
(CA), and modified atmosphere (MA).
2.1.2.1 Refrigeration
In the tropical producer country, the time between cutting and refrigeration should not
exceed 24 hours (SICABAM, 1998). After that, there is a risk of damage. Prolonged
exposure to temperature above 30°C causes “boiling” or soft pulp with green skin
(Rippon and Trochoulias, 1977). The aim is to increase the preclimacteric period by
decreasing the temperature. Optimum storage conditions for bananas are about 13-

Cranfield University at Silsoe September 2001
Laure Caussiol MSc by Research 7
14°C with a relative humidity of 85-90% (Sommer and Arpaia, 1992). During
transport by sea, banana boxes are kept for up to 28 days in normal banana carton
(Stover and Simmonds, 1987). Today, however, improved controlled atmosphere or
modified atmosphere systems can also be used.
2.1.2.2 Controlled atmosphere (CA)
CA storage is a technique for maintaining the quality of produce in atmospheres that
differs from air with respect to the proportion of O2, and / or CO2 (Abdullah et al.,
1990). Respiration and ethylene production rates of bananas fall in a CA store of 2-
5% O2 and 2-5% CO2 (Reid, 1992; Kader, 1999). Low O2 also slows down
accumulation of sugars and development of the yellow colour (Kanellis et al., 1989).
Postharvest life potential of mature-green bananas at 14°C is 2-4 weeks in air and 4-6
weeks in CA. Madrid and Lopez-lee (1998) reported no difference in colour (L* value
and Hue value), firmness and Brix at colour stage 4 between banana fruit stored at
16°C and 95% RH in air or in 3% O2.
2.1.2.3 Modified atmosphere (MA)
MA storage is similar to CA storage except that atmospheric composition is obtained
through the combined effect of respiration and the use of sealed semi-permeable
enclosures (e.g. polyethylene bags) (Abdullah et al., 1990). Increase in CO2
concentration within the container suppresses the activity of many enzymes that
normally increase during ripening CO2 (Abdullah et al., 1990). However, in MA
storage, ethylene accumulation in polyethylene bags can cause green ripe banana fruit
when the storage period is too long. Removal of ethylene from storage atmosphere
can increase the green life of banana fruit (Saltveit, 1999). Thus, potassium
permanganate (KMNO4) scrubber can be used in bags as an ethylene absorbent.
KMNO4 converts ethylene into CO2 and H2O. Reported shelf lives of banana fruit
held at 20°C were 7 days in air, 14 days in sealed polyethylene bags and 21 days with
sealed bags and KMNO4 (Wills et al., 1998). A Banavac MA system, where bags are
evacuated before sealing, has been developed (Badran and Lima, 1969). With this
technique, green fruit can be kept up until 40 days (Stover and Simmonds, 1987).
Cranfield University at Silsoe September 2001
Laure Caussiol MSc by Research 8
2.1.2.4 Other treatments to extend storage.
Generally irradiation can retard ripening and extend the shelf life of fresh banana fruit
(Abdullah et al., 1990). In Dwarf Cavendish, ultraviolet (UV) light treatment
markedly delayed ripening of mature fruit (Garcia, 1976). Surface coating, or waxing,
involves application of a thin film of natural or artificial material to the fruit surface,
which reduces transpiration and respiration (Abdullah et al., 1990). In Cavendish
banana, ripening can also be delayed by a 1.5% prolong dip (Lizada and Novenario,
1983). Srivastata and Dwivedi (2000) reported that 10-4 M salicylic acid treatment
delayed the ripening of banana fruit. Harris et al., (2000) reported the use of 1-
Methylcyclopropene (1-MCP) to extend storage of unripe “Williams” bananas was
limited due to the variation of 1-MCP effect on fruit maturity.
2.1.3 Commercial Ripening
Optimum conditions are needed to obtain uniform ripening. Ethylene gas is used to
initiate and modulate ripening in combination with careful temperature and humidity
control (Rippon and Trochoulias, 1977; Kader, 1992). Ripening is often initiated
using 1000 µL/L ethylene (1 litre/m3) for 24 h (Thompson, 1996). Optimal ethylene
concentrations have been found for different varieties (e.g. Gros Michel, 0.1 - 1.0
µL/L; Lacatan, 0.5 µL/L and Silk Fig, 0.2-0.25 µL/L) (Reid, 1992). The gas used in
ripening rooms is often a mixture of 5% ethylene (20 L/m3) in nitrogen. Ethylene is
also used for the ripening organic banana fruit (Soil Association, 2000).
Careful control of temperature is the most important factor when ripening bananas
(Rippon and Trochoulias, 1977). Ethylene is applied when the pulp temperature is
around 14-18°C. At < 13°C, banana fruit can suffer chilling, which causes uneven
ripening (Stover and Simmonds, 1987). Limiting the rise in the internal pulp
temperature is also important. At first, ethylene is administrated for 24 h to fruit with
pulp temperatures of 15.5°C - 16.5°C (Stover and Simmonds, 1987). Once begun,
ripening can be slowed by lowering the temperature to 13°C or hastened by raising
the temperature to 18.5°C (Sommer and Arpaia, 1992). Most retailers ask for fruit at
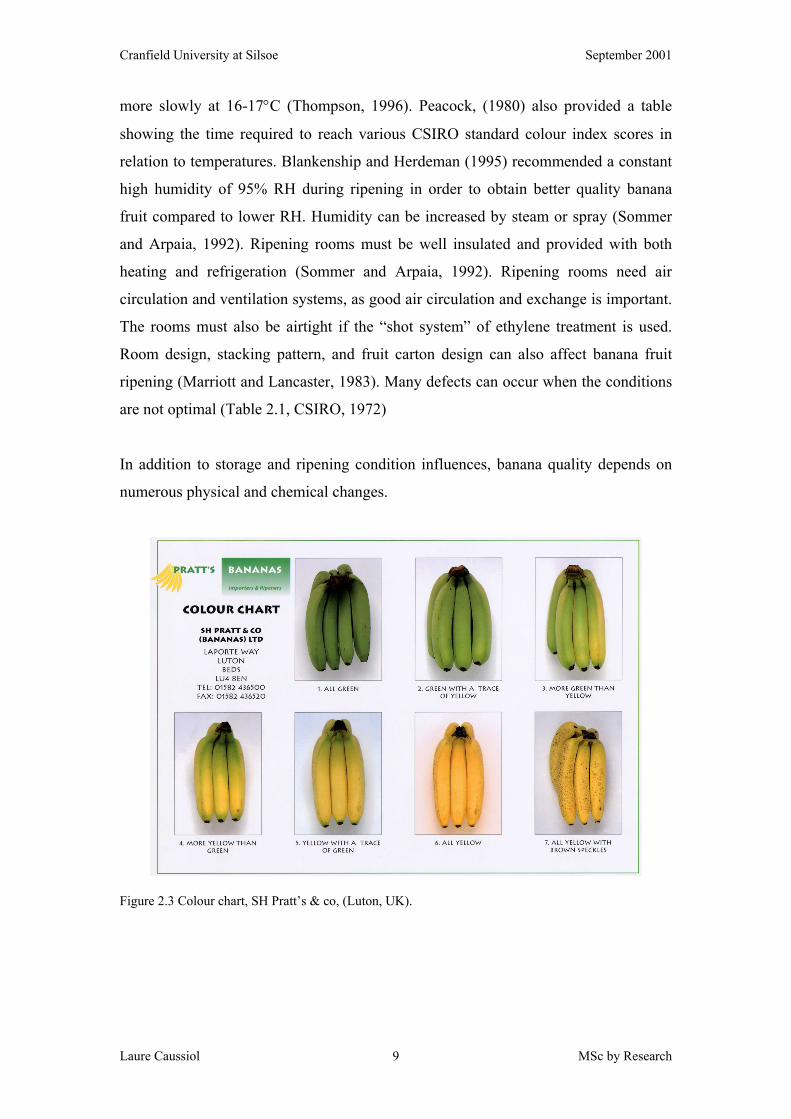
yellow colour or stage colour 4 (Madrid and Lopez-Lee, 1998) (Figure 2.3). Ideally,
banana fruit should have a good residual shelf life. Maximum colour is obtained
rapidly at 20-24°C whereas, the maximum residual shelf life is obtained by ripening
Cranfield University at Silsoe September 2001
Laure Caussiol MSc by Research 9
more slowly at 16-17°C (Thompson, 1996). Peacock, (1980) also provided a table
showing the time required to reach various CSIRO standard colour index scores in
relation to temperatures. Blankenship and Herdeman (1995) recommended a constant
high humidity of 95% RH during ripening in order to obtain better quality banana
fruit compared to lower RH. Humidity can be increased by steam or spray (Sommer
and Arpaia, 1992). Ripening rooms must be well insulated and provided with both
heating and refrigeration (Sommer and Arpaia, 1992). Ripening rooms need air
circulation and ventilation systems, as good air circulation and exchange is important.
The rooms must also be airtight if the “shot system” of ethylene treatment is used.
Room design, stacking pattern, and fruit carton design can also affect banana fruit
ripening (Marriott and Lancaster, 1983). Many defects can occur when the conditions
are not optimal (Table 2.1, CSIRO, 1972)
In addition to storage and ripening condition influences, banana quality depends on
numerous physical and chemical changes.
Figure 2.3 Colour chart, SH Pratt’s & co, (Luton, UK).
Cranfield University at Silsoe September 2001
Laure Caussiol MSc by Research 10
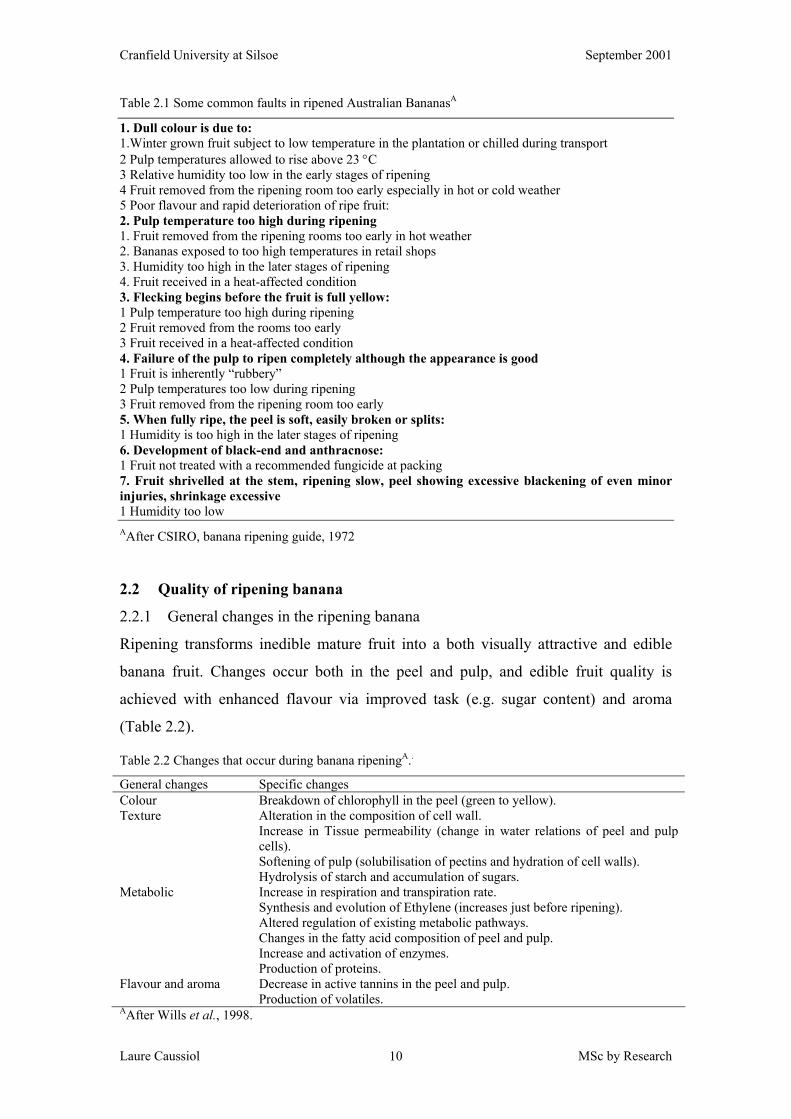
Table 2.1 Some common faults in ripened Australian BananasA
1. Dull colour is due to: 1.Winter grown fruit subject to low temperature in the plantation or chilled during transport 2 Pulp temperatures allowed to rise above 23 °C 3 Relative humidity too low in the early stages of ripening 4 Fruit removed from the ripening room too early especially in hot or cold weather 5 Poor flavour and rapid deterioration of ripe fruit: 2. Pulp temperature too high during ripening 1. Fruit removed from the ripening rooms too early in hot weather 2. Bananas exposed to too high temperatures in retail shops 3. Humidity too high in the later stages of ripening 4. Fruit received in a heat-affected condition 3. Flecking begins before the fruit is full yellow: 1 Pulp temperature too high during ripening 2 Fruit removed from the rooms too early 3 Fruit received in a heat-affected condition 4. Failure of the pulp to ripen completely although the appearance is good 1 Fruit is inherently “rubbery” 2 Pulp temperatures too low during ripening 3 Fruit removed from the ripening room too early 5. When fully ripe, the peel is soft, easily broken or splits: 1 Humidity is too high in the later stages of ripening 6. Development of black-end and anthracnose: 1 Fruit not treated with a recommended fungicide at packing 7. Fruit shrivelled at the stem, ripening slow, peel showing excessive blackening of even minor injuries, shrinkage excessive 1 Humidity too low AAfter CSIRO, banana ripening guide, 1972
2.2 Quality of ripening banana
2.2.1 General changes in the ripening banana
Ripening transforms inedible mature fruit into a both visually attractive and edible
banana fruit. Changes occur both in the peel and pulp, and edible fruit quality is
achieved with enhanced flavour via improved task (e.g. sugar content) and aroma
(Table 2.2).
Table 2.2 Changes that occur during banana ripeningA..
General changes Specific changes Colour Breakdown of chlorophyll in the peel (green to yellow). Texture Alteration in the composition of cell wall.
Increase in Tissue permeability (change in water relations of peel and pulp cells). Softening of pulp (solubilisation of pectins and hydration of cell walls). Hydrolysis of starch and accumulation of sugars.
Metabolic Increase in respiration and transpiration rate. Synthesis and evolution of Ethylene (increases just before ripening). Altered regulation of existing metabolic pathways. Changes in the fatty acid composition of peel and pulp. Increase and activation of enzymes. Production of proteins.
Flavour and aroma Decrease in active tannins in the peel and pulp. Production of volatiles.
AAfter Wills et al., 1998.
Cranfield University at Silsoe September 2001
Laure Caussiol MSc by Research 11
2.2.1.1 Pigment changes (colour, visual appearance)
The colour of banana fruit changes from green to yellow. This is due to chlorophyll
degradation, which subsequently reveals the yellow carotenoid pigments (Marriott
and Lancaster, 1983; Stover and Simmonds, 1987; Seymour, 1993). The stage of
colouration is an excellent indicator of the probable composition of banana fruit. The
colour chart is now used widely for quality evaluation within industry (Figure 2.3).
2.2.1.2 Cell wall changes (firmness and texture)
Banana fruit softening is due to alteration in cell wall structure by degrading enzymes
(e.g. polyglacteronase) and also to degradation of starch (Seymour, 1993). Softening
occurs rapidly. It is principally the result of the interconversion of pectic substances
which represent 0.5 - 0.7% of the ripe pulp (Marriott and Lancaster, 1983, Stover and
Simmonds, 1987). Hultin and Levine (1963) and De Swardt and Maxie (1967)
showed Pectin Methyl Estserase (PME) activity was involved in the pulp during
ripening.
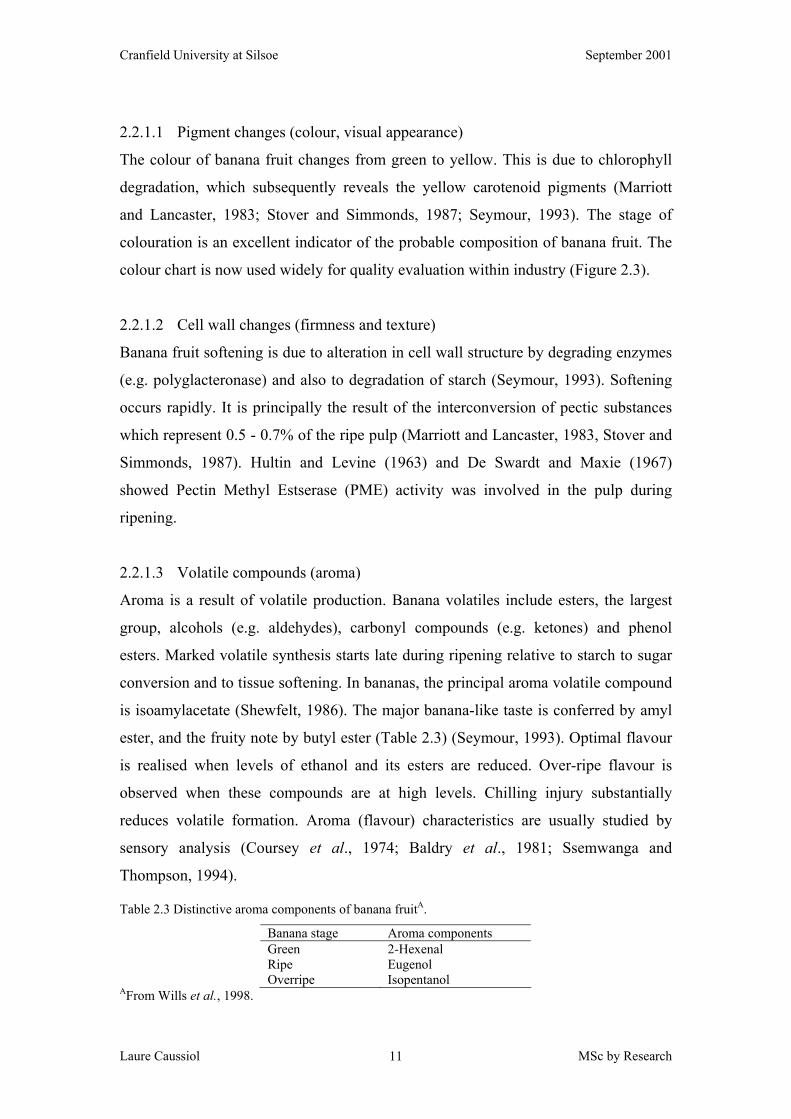
2.2.1.3 Volatile compounds (aroma)
Aroma is a result of volatile production. Banana volatiles include esters, the largest
group, alcohols (e.g. aldehydes), carbonyl compounds (e.g. ketones) and phenol
esters. Marked volatile synthesis starts late during ripening relative to starch to sugar
conversion and to tissue softening. In bananas, the principal aroma volatile compound
is isoamylacetate (Shewfelt, 1986). The major banana-like taste is conferred by amyl
ester, and the fruity note by butyl ester (Table 2.3) (Seymour, 1993). Optimal flavour
is realised when levels of ethanol and its esters are reduced. Over-ripe flavour is
observed when these compounds are at high levels. Chilling injury substantially
reduces volatile formation. Aroma (flavour) characteristics are usually studied by
sensory analysis (Coursey et al., 1974; Baldry et al., 1981; Ssemwanga and
Thompson, 1994).
Table 2.3 Distinctive aroma components of banana fruitA.
Banana stage Aroma components Green 2-Hexenal Ripe Eugenol Overripe Isopentanol
AFrom Wills et al., 1998.
Cranfield University at Silsoe September 2001
Laure Caussiol MSc by Research 12
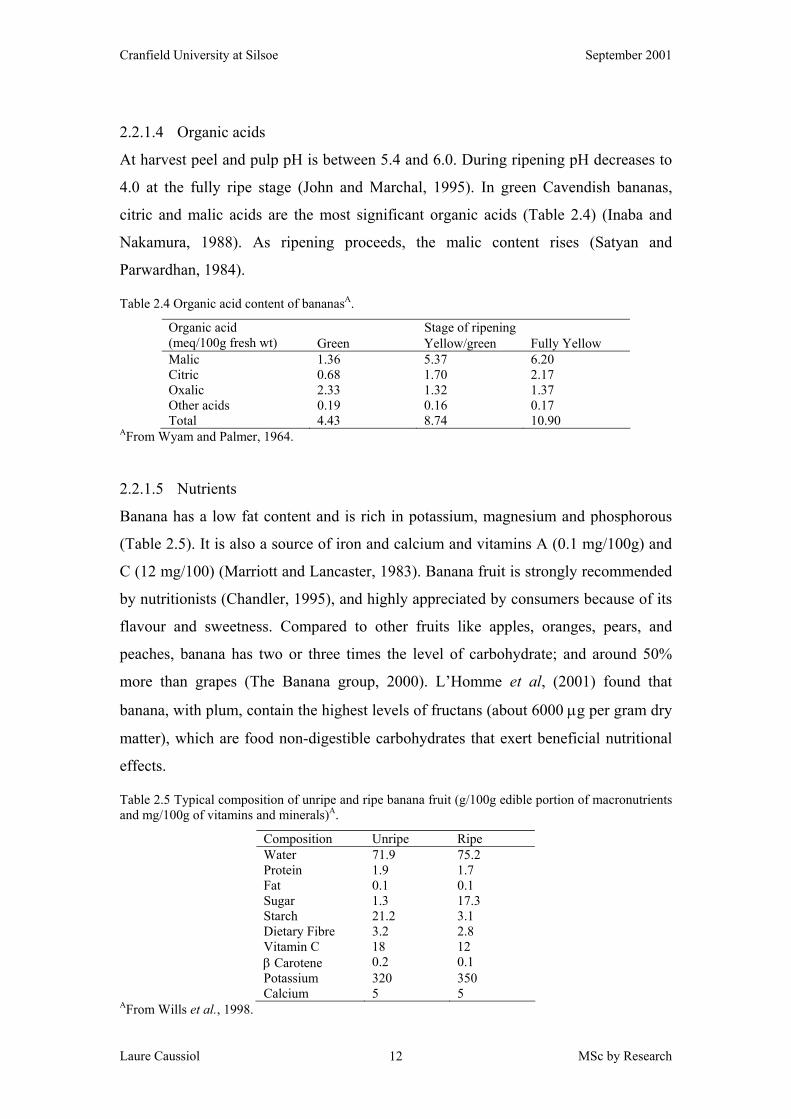
2.2.1.4 Organic acids
At harvest peel and pulp pH is between 5.4 and 6.0. During ripening pH decreases to
4.0 at the fully ripe stage (John and Marchal, 1995). In green Cavendish bananas,
citric and malic acids are the most significant organic acids (Table 2.4) (Inaba and
Nakamura, 1988). As ripening proceeds, the malic content rises (Satyan and
Parwardhan, 1984).
Table 2.4 Organic acid content of bananasA.
Stage of ripening Organic acid (meq/100g fresh wt) Green Yellow/green Fully Yellow Malic 1.36 5.37 6.20 Citric 0.68 1.70 2.17 Oxalic 2.33 1.32 1.37 Other acids 0.19 0.16 0.17 Total 4.43 8.74 10.90
AFrom Wyam and Palmer, 1964.
2.2.1.5 Nutrients
Banana has a low fat content and is rich in potassium, magnesium and phosphorous
(Table 2.5). It is also a source of iron and calcium and vitamins A (0.1 mg/100g) and
C (12 mg/100) (Marriott and Lancaster, 1983). Banana fruit is strongly recommended
by nutritionists (Chandler, 1995), and highly appreciated by consumers because of its
flavour and sweetness. Compared to other fruits like apples, oranges, pears, and
peaches, banana has two or three times the level of carbohydrate; and around 50%
more than grapes (The Banana group, 2000). L’Homme et al, (2001) found that
banana, with plum, contain the highest levels of fructans (about 6000 µg per gram dry
matter), which are food non-digestible carbohydrates that exert beneficial nutritional
effects.
Table 2.5 Typical composition of unripe and ripe banana fruit (g/100g edible portion of macronutrients and mg/100g of vitamins and minerals)A.
Composition Unripe Ripe Water 71.9 75.2 Protein 1.9 1.7 Fat 0.1 0.1 Sugar 1.3 17.3 Starch 21.2 3.1 Dietary Fibre 3.2 2.8 Vitamin C 18 12 β Carotene 0.2 0.1 Potassium 320 350 Calcium 5 5
AFrom Wills et al., 1998.
Cranfield University at Silsoe September 2001
Laure Caussiol MSc by Research 13
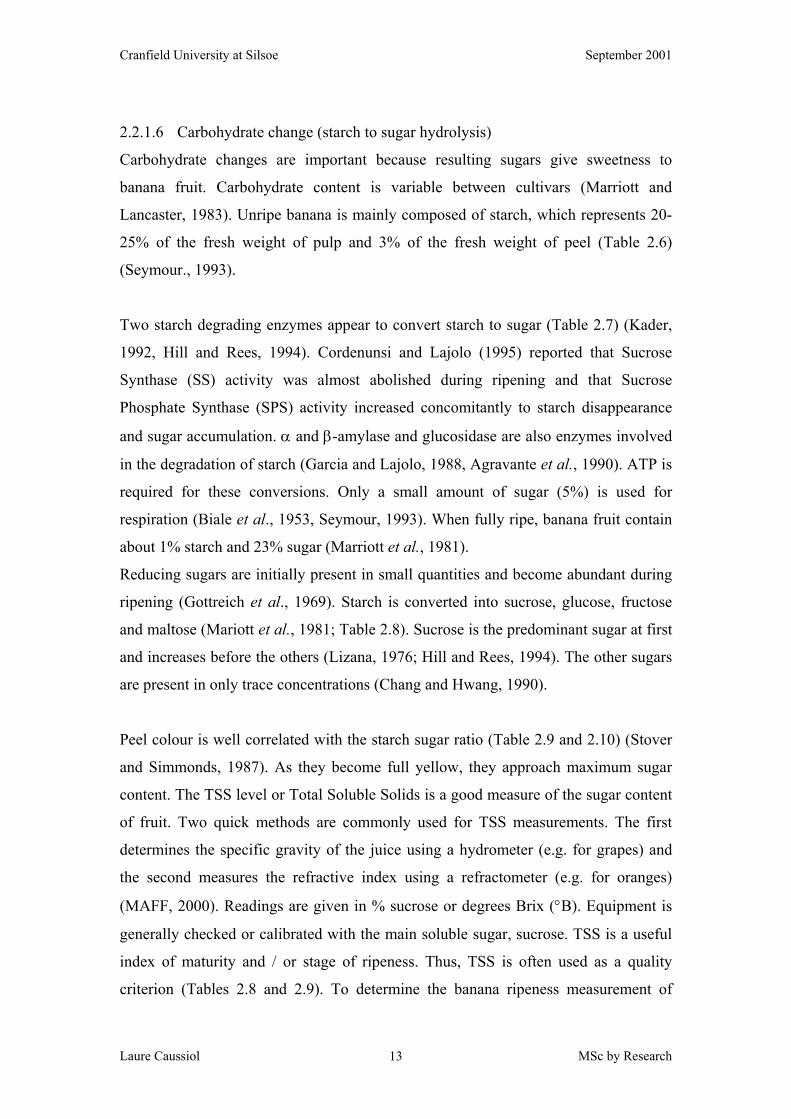
2.2.1.6 Carbohydrate change (starch to sugar hydrolysis)
Carbohydrate changes are important because resulting sugars give sweetness to
banana fruit. Carbohydrate content is variable between cultivars (Marriott and
Lancaster, 1983). Unripe banana is mainly composed of starch, which represents 20-
25% of the fresh weight of pulp and 3% of the fresh weight of peel (Table 2.6)
(Seymour., 1993).
Two starch degrading enzymes appear to convert starch to sugar (Table 2.7) (Kader,
1992, Hill and Rees, 1994). Cordenunsi and Lajolo (1995) reported that Sucrose
Synthase (SS) activity was almost abolished during ripening and that Sucrose
Phosphate Synthase (SPS) activity increased concomitantly to starch disappearance
and sugar accumulation. α and β-amylase and glucosidase are also enzymes involved
in the degradation of starch (Garcia and Lajolo, 1988, Agravante et al., 1990). ATP is
required for these conversions. Only a small amount of sugar (5%) is used for
respiration (Biale et al., 1953, Seymour, 1993). When fully ripe, banana fruit contain
about 1% starch and 23% sugar (Marriott et al., 1981).
Reducing sugars are initially present in small quantities and become abundant during
ripening (Gottreich et al., 1969). Starch is converted into sucrose, glucose, fructose
and maltose (Mariott et al., 1981; Table 2.8). Sucrose is the predominant sugar at first
and increases before the others (Lizana, 1976; Hill and Rees, 1994). The other sugars
are present in only trace concentrations (Chang and Hwang, 1990).
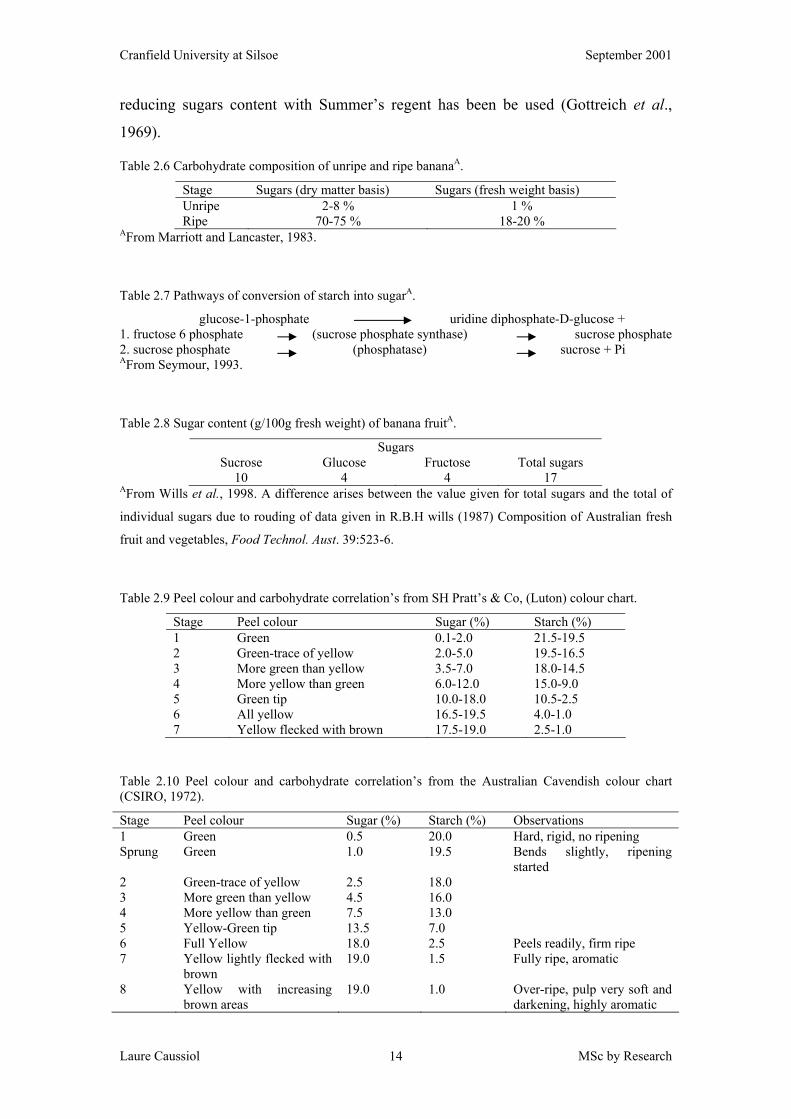
Peel colour is well correlated with the starch sugar ratio (Table 2.9 and 2.10) (Stover
and Simmonds, 1987). As they become full yellow, they approach maximum sugar
content. The TSS level or Total Soluble Solids is a good measure of the sugar content
of fruit. Two quick methods are commonly used for TSS measurements. The first
determines the specific gravity of the juice using a hydrometer (e.g. for grapes) and
the second measures the refractive index using a refractometer (e.g. for oranges)
(MAFF, 2000). Readings are given in % sucrose or degrees Brix (°B). Equipment is
generally checked or calibrated with the main soluble sugar, sucrose. TSS is a useful
index of maturity and / or stage of ripeness. Thus, TSS is often used as a quality
criterion (Tables 2.8 and 2.9). To determine the banana ripeness measurement of
Cranfield University at Silsoe September 2001
Laure Caussiol MSc by Research 14
reducing sugars content with Summer’s regent has been be used (Gottreich et al.,
1969).
Table 2.6 Carbohydrate composition of unripe and ripe bananaA.
Stage Sugars (dry matter basis) Sugars (fresh weight basis) Unripe 2-8 % 1 % Ripe 70-75 % 18-20 %
AFrom Marriott and Lancaster, 1983.
Table 2.7 Pathways of conversion of starch into sugarA.
glucose-1-phosphate uridine diphosphate-D-glucose + 1. fructose 6 phosphate (sucrose phosphate synthase) sucrose phosphate 2. sucrose phosphate (phosphatase) sucrose + Pi AFrom Seymour, 1993.
Table 2.8 Sugar content (g/100g fresh weight) of banana fruitA.
Sugars Sucrose Glucose Fructose Total sugars
10 4 4 17 AFrom Wills et al., 1998. A difference arises between the value given for total sugars and the total of
individual sugars due to rouding of data given in R.B.H wills (1987) Composition of Australian fresh
fruit and vegetables, Food Technol. Aust. 39:523-6.
Table 2.9 Peel colour and carbohydrate correlation’s from SH Pratt’s & Co, (Luton) colour chart.
Stage Peel colour Sugar (%) Starch (%) 1 Green 0.1-2.0 21.5-19.5 2 Green-trace of yellow 2.0-5.0 19.5-16.5 3 More green than yellow 3.5-7.0 18.0-14.5 4 More yellow than green 6.0-12.0 15.0-9.0 5 Green tip 10.0-18.0 10.5-2.5 6 All yellow 16.5-19.5 4.0-1.0 7 Yellow flecked with brown 17.5-19.0 2.5-1.0
Table 2.10 Peel colour and carbohydrate correlation’s from the Australian Cavendish colour chart (CSIRO, 1972).
Stage Peel colour Sugar (%) Starch (%) Observations 1 Green 0.5 20.0 Hard, rigid, no ripening Sprung Green 1.0 19.5 Bends slightly, ripening
started 2 Green-trace of yellow 2.5 18.0 3 More green than yellow 4.5 16.0 4 More yellow than green 7.5 13.0 5 Yellow-Green tip 13.5 7.0 6 Full Yellow 18.0 2.5 Peels readily, firm ripe 7 Yellow lightly flecked with
brown 19.0 1.5 Fully ripe, aromatic
8 Yellow with increasing brown areas
19.0 1.0 Over-ripe, pulp very soft and darkening, highly aromatic
Cranfield University at Silsoe September 2001
Laure Caussiol MSc by Research 15
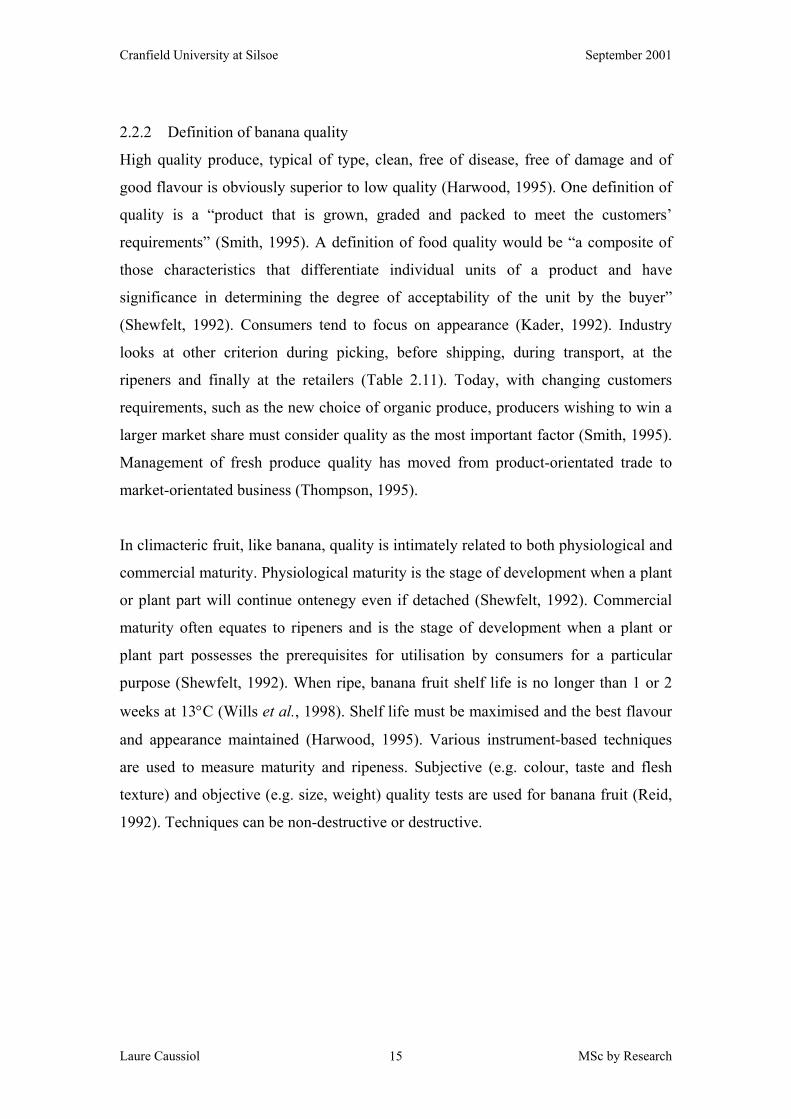
2.2.2 Definition of banana quality
High quality produce, typical of type, clean, free of disease, free of damage and of
good flavour is obviously superior to low quality (Harwood, 1995). One definition of
quality is a “product that is grown, graded and packed to meet the customers’
requirements” (Smith, 1995). A definition of food quality would be “a composite of
those characteristics that differentiate individual units of a product and have
significance in determining the degree of acceptability of the unit by the buyer”
(Shewfelt, 1992). Consumers tend to focus on appearance (Kader, 1992). Industry
looks at other criterion during picking, before shipping, during transport, at the
ripeners and finally at the retailers (Table 2.11). Today, with changing customers
requirements, such as the new choice of organic produce, producers wishing to win a
larger market share must consider quality as the most important factor (Smith, 1995).
Management of fresh produce quality has moved from product-orientated trade to
market-orientated business (Thompson, 1995).
In climacteric fruit, like banana, quality is intimately related to both physiological and
commercial maturity. Physiological maturity is the stage of development when a plant
or plant part will continue ontenegy even if detached (Shewfelt, 1992). Commercial
maturity often equates to ripeners and is the stage of development when a plant or
plant part possesses the prerequisites for utilisation by consumers for a particular
purpose (Shewfelt, 1992). When ripe, banana fruit shelf life is no longer than 1 or 2
weeks at 13°C (Wills et al., 1998). Shelf life must be maximised and the best flavour
and appearance maintained (Harwood, 1995). Various instrument-based techniques
are used to measure maturity and ripeness. Subjective (e.g. colour, taste and flesh
texture) and objective (e.g. size, weight) quality tests are used for banana fruit (Reid,
1992). Techniques can be non-destructive or destructive.
Cranfield University at Silsoe September 2001
Laure Caussiol MSc by Research 16
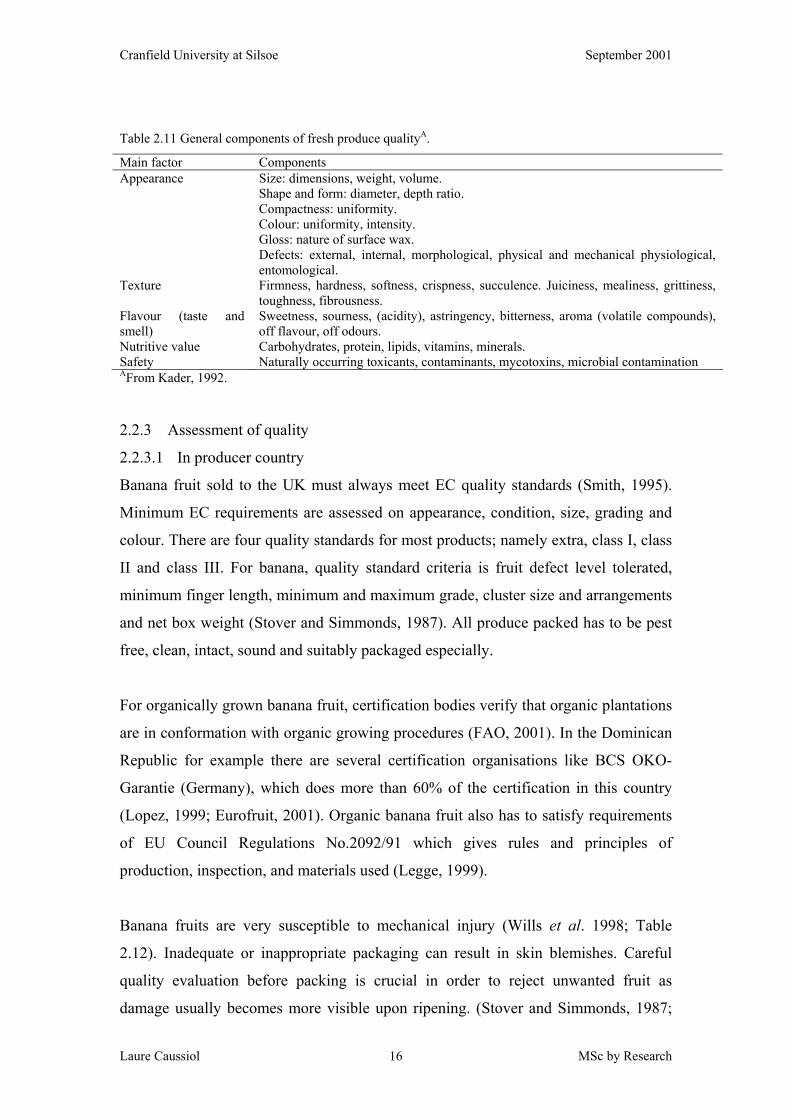
Table 2.11 General components of fresh produce qualityA.
Main factor Components Appearance Size: dimensions, weight, volume.
Shape and form: diameter, depth ratio. Compactness: uniformity. Colour: uniformity, intensity. Gloss: nature of surface wax. Defects: external, internal, morphological, physical and mechanical physiological, entomological.
Texture Firmness, hardness, softness, crispness, succulence. Juiciness, mealiness, grittiness, toughness, fibrousness.
Flavour (taste and smell)
Sweetness, sourness, (acidity), astringency, bitterness, aroma (volatile compounds), off flavour, off odours.
Nutritive value Carbohydrates, protein, lipids, vitamins, minerals. Safety Naturally occurring toxicants, contaminants, mycotoxins, microbial contamination AFrom Kader, 1992.
2.2.3 Assessment of quality
2.2.3.1 In producer country
Banana fruit sold to the UK must always meet EC quality standards (Smith, 1995).
Minimum EC requirements are assessed on appearance, condition, size, grading and
colour. There are four quality standards for most products; namely extra, class I, class
II and class III. For banana, quality standard criteria is fruit defect level tolerated,
minimum finger length, minimum and maximum grade, cluster size and arrangements
and net box weight (Stover and Simmonds, 1987). All produce packed has to be pest
free, clean, intact, sound and suitably packaged especially.
For organically grown banana fruit, certification bodies verify that organic plantations
are in conformation with organic growing procedures (FAO, 2001). In the Dominican
Republic for example there are several certification organisations like BCS OKO-
Garantie (Germany), which does more than 60% of the certification in this country
(Lopez, 1999; Eurofruit, 2001). Organic banana fruit also has to satisfy requirements
of EU Council Regulations No.2092/91 which gives rules and principles of
production, inspection, and materials used (Legge, 1999).
Banana fruits are very susceptible to mechanical injury (Wills et al. 1998; Table
2.12). Inadequate or inappropriate packaging can result in skin blemishes. Careful
quality evaluation before packing is crucial in order to reject unwanted fruit as
damage usually becomes more visible upon ripening. (Stover and Simmonds, 1987;
Cranfield University at Silsoe September 2001
Laure Caussiol MSc by Research 17
Harwood, 1995). Data recorded are location of stem in the field, age control ribbon
colour, stem weight, number of hands, and grade of the middle finger of the 2nd hand
and defects (Stover and Simmonds, 1987). The main defects are scarring, bruising,
insect damage, fruit spots, maturity stain, softy mould, fungicide, undesirable
residues, animal scratches, overgrade, undergrade, deformed hand, and sunburn. After
packing, it is often impossible or not financially viable to rectify grading and handling
condition problems (Smith, 1995). Non-destructive quality assessment methods are
usually used during packing in the producer country (Shewfelt, 1992).
Table 2.12. Susceptibility of banana fruit to types of mechanical injuryA.
Stage Compression Impact Vibration Green intermediate intermediate susceptible Ripe susceptible susceptible susceptible
AFrom Wills et al., 1998.
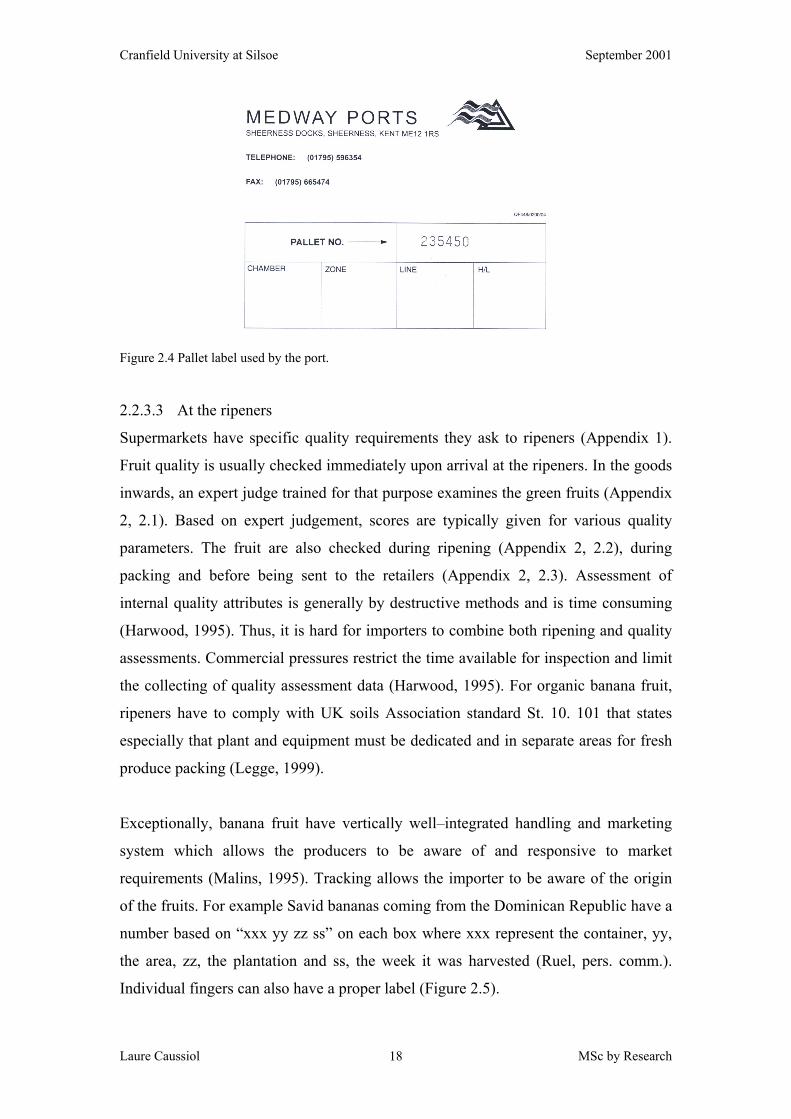
2.2.3.2 At the wharf
Out-turn quality of product is the quality of product reaching the destination market.
Produce is usually inspected at the point of off-loading such as the air- or sea-port
(Figure 2.4). In the UK, grade, finger length and defects of banana fruit are checked at
the discharge port (Stover and Simmonds, 1987). Maturity is the most common out-
turn quality problem of banana fruit. Inconsistent maturity between lots and lack of
uniform maturity within lots can create market uncertainty in the product, depress
price and lead to loss of product (Malins, 1995). Over-mature bananas, which have
commenced ripening during shipment and are identified as “ship-ripe” at off-loading,
are often rejected at the port of entry. From the Dominican Republic, banana fruit are
stored in a connair, a container connected to a cold storage system, before shipping
(SICABAM, 1998). Banana fruits often develop the problem of “ship-ripe” because
of electricity failures, which stops the refrigeration and CA systems (Lamarque, pers.
comm.). Thus, pulp temperatures at off-loading are a useful indicator of potential
quality problems (Malins, 1995).
Cranfield University at Silsoe September 2001
Laure Caussiol MSc by Research 18
Figure 2.4 Pallet label used by the port.
2.2.3.3 At the ripeners
Supermarkets have specific quality requirements they ask to ripeners (Appendix 1).
Fruit quality is usually checked immediately upon arrival at the ripeners. In the goods
inwards, an expert judge trained for that purpose examines the green fruits (Appendix
2, 2.1). Based on expert judgement, scores are typically given for various quality
parameters. The fruit are also checked during ripening (Appendix 2, 2.2), during
packing and before being sent to the retailers (Appendix 2, 2.3). Assessment of
internal quality attributes is generally by destructive methods and is time consuming
(Harwood, 1995). Thus, it is hard for importers to combine both ripening and quality
assessments. Commercial pressures restrict the time available for inspection and limit
the collecting of quality assessment data (Harwood, 1995). For organic banana fruit,
ripeners have to comply with UK soils Association standard St. 10. 101 that states
especially that plant and equipment must be dedicated and in separate areas for fresh
produce packing (Legge, 1999).
Exceptionally, banana fruit have vertically well–integrated handling and marketing
system which allows the producers to be aware of and responsive to market
requirements (Malins, 1995). Tracking allows the importer to be aware of the origin
of the fruits. For example Savid bananas coming from the Dominican Republic have a
number based on “xxx yy zz ss” on each box where xxx represent the container, yy,
the area, zz, the plantation and ss, the week it was harvested (Ruel, pers. comm.).
Individual fingers can also have a proper label (Figure 2.5).
Cranfield University at Silsoe September 2001
Laure Caussiol MSc by Research 19
Figure 2.5. Banana fruit labels from the Dominican Republic (SH Pratt’s & Co, Luton). Numbers 57 and 11 show plantation origin and 4011 and 94011 conventionally and organically grown fruit respectively.
Appearance (visual evaluation)
Morphological examination considers size, shape and colour. Size (small, medium,
large or extra large) can be evaluated by diameter and length (Banana grading chart,
1986). Banana fruit are often found to be ungraded (Malins, 1995). Colour is one of
the most important quality criteria used for banana fruits (Medlicott et al., 1992),
especially during ripening. Ripeners have to regulate and check the ripening colour
stage twice per day and more frequently nearer the end of the program (Ruel, pers.
comm.)
Condition and absence of defects
Mechanical damage before or after harvest becomes visible on the ripened banana
fruit. Mechanical damage is the single highest defect category accounting for
downgrading of quality in ripened banana fruit (Winban, 1993). Bananas also suffer
from postharvest disease such as crown rot, which is caused by a fungal rot complex
(Kader, 1999). This rot causes unsightly blackening and softening of the tissues
around the cut surface of the crown. Other diseases including anthracnose, stem-end
rot and cigar-end rot are also problems for banana ripeners. Latex naturally exudes
from the freshly cut surface or stem of banana fruit. Without careful handling, latex
can become smeared over the fruit during postharvest handling. Oxidation of latex
occurs during shipment, resulting in ugly grey / brown staining on the fruit which
adversely affects marketability.
Pesticide residue
Pesticide residue levels, especially for organic bananas, are frequently monitored to
check if Maximum Residual Levels (MRLs) are being exceeded (Smith, 1995). At SH
Cranfield University at Silsoe September 2001
Laure Caussiol MSc by Research 20
Pratt’s and Co (UK), fruit from conventional management plantations MRLs are
checked randomly twice a year whereas fruit from all organic plantations are checked
(Ruel, pers. comm.).
In the UK the Food Safety Act (1990) states that any party that sells food must show
due diligence towards ensuring that it is safe to eat. In the EC, Council Directive
76/895/EEC, sets the maximum residue levels for selected fruits and vegetables and
the last revised compilation for banana fruit (128 substances) were compiled under the
Commission Directive 2000/24/EC. World-wide, MRLs are set in the Codex
Maximum Residue Limits for Pesticides (Codex Alimentarius, Vol 2B). The FAO
statistical database (2000) gives 25 MRL pesticides used for bananas in which 5 are
used for postharvest treatments.
Texture
For many fruits, texture, firmness or softness is measured by a destructive puncture
test or a deformation test (Reid, 1992). For bananas, firmness is not normally
measured. However, subjective hand measurements (e.g. sprung bananas) have been
devised (Joyce, pers. comm.).
Flavour
Flavour is an issue that has been, until recently, of low importance compared with
yield and price (Harwood, 1995). Flavour is now recognised as a vitally important
quality attribute. For example, the pursuit of good flavour has led to the genetically
modified tomato, Flavr Savr, which also has a longer shelf life when ripe (Harwood,
1995). Flavour can be partly measured by sweetness, which is an important taste
element for consumption quality. Sweetness is a function of sugar and acid balance.
Sugars are major components of soluble solids. Total Soluble Solids content is
measured using a refractometer (MAFF, 1987). The insoluble sugar complex, starch,
can be visualised by iodine staining (Chu, 1988). For apples, staining of starch
provides a semi-quantitative measure for comparison of maturities using a chart
(Reid, 1992). Physicochemical quality tests are only meaningful if they relate to
consumer acceptance (Shewfelt, 1992). Sensory evaluations are often used to measure
sourness, saltiness, astringency, bitterness and aroma (Kader, 1992). The two major
types of sensory tests are preference or acceptance, or semi-analytical tests, which
Cranfield University at Silsoe September 2001
Laure Caussiol MSc by Research 21
evaluates levels of specific attributes based on the sensitivities of panellists. Samples
for sensory assessment have to be prepared and presented at the same time and at the
same temperature to tasters with no distraction.
2.3 Preharvest effects on postharvest quality
Quality assessed after harvest is largely the result of conditions and treatments that
fruit experience during growth and development and at harvest (Munasque et al.,
1990).
2.3.1 Genetic influences
Banana breeding has been existing for more than seventy years (Ortiz et al., 1995).
Smith (1995) suggested that future developments in the banana fruit sector would
depend upon cultivar selection, plant breeding and genetic engineering. The
“Musalogue” (INIBAP, 2000) covers most of the diversity in the genus Musa, from
wild species to cultivated varieties. Varieties differ in many characteristics, including
visual appearance (e.g. size), yield and quality. Size, for example small, medium or
large, is a matter of consumer preference (Hofman and Smith, 1993). Variety also has
an effect on yield, firmness, fibrousness, succulence and juiciness (Kader, 1992). For
certain tree crops, rootstock selection may cause differences in fruit TSS and acidity
via influences on nutrient and water uptake and translocation or differences in
photosynthate partitioning (Beverly et al., 1992). Increasing the energy supply and
decreasing the water content of fruit increases TSS in tomatoes (Shewfelt, 1992).
Thus, TSS exemplifies a trade off between yield and quality, since yield generally
decreases with increasing TSS (Stevens and Rudich, 1978). The genotypic
characteristics of any one cultivar vary in response to environmental effects.
2.3.2 Phenotypic differences
Environmental conditions have many effects on the rate of plant growth and
development (Shewfelt, 1992). Management factors, like irrigation, fertilisation or
pesticide applications also influence quality and shelf life (Kader, 1992).
Cranfield University at Silsoe September 2001
Laure Caussiol MSc by Research 22
2.3.2.1 General management
Canopy management
Canopy management focuses on the amounts of light and CO2 that fruits receive. For
banana fruit, full shade gives a dull yellow peel colour whereas partial shade leads to
a bright yellow peel colour (Munasque et al., 1990). Low light intensity retards
development of carotenoids (Pantastico et al., 1990). An important determinant of
banana fruit quality is row spacing and the associated plant population (Stover and
Simmonds, 1987). Plant density consists of selecting the most vigorous suckers
located in the best places and eliminating undesirable ones (Stover and Simmonds,
1987). This method can increase the number of leaves and fruits exposed to sunlight
(Beverly et al., 1992). Removal of leaves can also help prevent fruit scaring. Bunch
thinning reduces inter-fruit competition and improves fruit size (Munasque et al.,
1990; Beverly et al., 1992). However, an increase in size may decrease firmness and
increase physiological disorders (Hofman and Smith, 1993). An average banana plant
population is around 2, 500 per ha (Stover and Simmonds, 1987). Plant health and
leaf/fruit ratio also influences flavour (Hofman and Smith, 1993). Climatic factors
like temperature and relative humidity considerably affect banana fruit. In particular
the seasons of summer (from March to September) and winter (from October to
February) in tropical areas influence banana fruit characteristics. Winter bananas tend
to ripen slower because of low temperature and higher soluble tannin content in the
bananas (Chang et al., 1990). High temperatures hasten growth and reproductive
maturity and increase respiration, which can decrease the energy stored by plant tissue
(Shewfelt, 1992). While climatic variables cannot be changed, light availability and
water management can be adapted to suit.
Water management
Field water management is mainly achieved by irrigation. Irrigation requirements like
watering and associated drainage are important to fruit growth. Water supply
regulates transpiration by the leaves and input through the roots. Depending on the
climate and the type of fruit grown, the influences of water supply to fruit can differ.
Drought stress can limit crop yield but may either decrease or increase product
quality. For tomatoes, water stress increases TSS, acidity and flavour (Mizrahi and
Hobson, 1988; Shewfelt, 1992). However, if drought stress increases concentration of
most constituents it always reduces yield (Stevens, 1985). For bananas, absence of
Cranfield University at Silsoe September 2001
Laure Caussiol MSc by Research 23
irrigation induces physiological disorders after harvest; like the green ripe disorder
(Munasque et al., 1990). A dry atmosphere induces stomata closure on leaves, which
can limit supply of water and nutrients to fruit (Beverly et al., 1992). In this case,
humidity should be increased. However, excess water also has detrimental quality
consequences for plant. The photosynthetic rate decreases with overly high water
availability and low transpiration rates. High moisture content in fruit also tends to
dilute the soluble solids leading to low flavour intensity (Beverly et al., 1992).
Furthermore, a high relative humidity during fruit development shortens the storage
life and increases the incidence of finger drop and crown rotting (Munasque et al.,
1990).
Nutrient management
The soil type determines the nature of management. Roots will grow differently in
clay or sand. In dry or saline soil, excess solar energy will result in a decrease of
water supply. Under these conditions, nutrient supply can be insufficient and
fertilisers are required. Nitrogen, which moves from older leaf tissue to new leaf and
fruit, usually increases yield but decreases tissue carbohydrates (Shewfelt, 1992;
Beverly et al., 1992). High potassium and calcium will give high dry matter and
glucose content in the peel and the pulp (Gelido, 1986). Calcium, which may be
sprayed via irrigation (Shewfelt, 1992) can reduce physiological disorders and
diseases and also delay softening in fruit during ripening (Hofman and Smith, 1993).
High levels of potassium results in high organic matter content in Robusta banana
(Munasque et al., 1990). Low levels of nitrogen, phosphorus and magnesium give
high dry matter in the pulp (Munasque et al., 1990). High level of phosphorus in ripe
fruits gives low level of TSS (Munasque et al., 1990). High potassium is often
associated with reduced acidity but increased soluble solids in fruit (Hofman and
Smith, 1993). High levels of magnesium in the peel induces finger drop in bananas
(Munasque et al., 1990).
Pest management
Fruit protection is needed in order to obtain healthy fruits. Deleafing consists of
removing old leaves that touch the fruit, debudding stops insect transmission of the
Moko pathogen and bagging prevents peel blemishes and creates a green house effect
around the fruit to improve growth conditions in the same time (Stover and
Cranfield University at Silsoe September 2001
Laure Caussiol MSc by Research 24
Simmonds, 1987). Fruit bagging prevents pest and disease attack during banana fruit
growth. Bagging is typically applied to an 8-12 hands bunch. The whole bunch is
surrounded with a polyethylene bag typically perforated and impregnated with
pesticide. In the case of intense illumination, bags are blue to prevent scalding.
Insects like banana weevil makes holes in the base of the banana plant and banana
eelworm or nematode eats the roots. Other pests such as thrips, aphids and scale
insects may also damage the fruit (Gowen, 1995). Fungi such as the pathogen that
causes Panama disease make the leaves break or for the Leaf spot disease inhibit
respiration and the yield falls greatly (Jeger et al., 1995). The bunchy top, disease
carried by an aphid prevents the leaves from growing (Jeger et al., 1995). Cigar-end
rot rottens banana fruit at the tip. The mosaic disease makes small yellow patches on
the leaves (Winban, 1993). Yellow and black sigatoka diseases decrease yield.
Application of pesticide and fungicide is made (Shamsudin and Suphrangkasen,
1990). Yellow and black sigatoka is controlled by doing good field sanitary practices
(removal of infected material, good drainage) (Orchard and Krauss, 1999). Weeds and
nematodes are controlled with manual herbicides and synthetic nemacides
respectively (Orchard and Krauss, 1999).
2.3.2.2 Organic management
Nutrient management
Synthetic fertilisers are replaced by composted manures from animal and / or
household sources (80/t/ha/yr), mined, mineral fertilisers and green manures (Orchard
and Krauss, 1999). In the Philippines organic fertiliser is employed at the rate of 5 kg
per plant with 1 kg applied prior to land preparation (BGA, 1998).
Pest management
Organic pest management is based on pest prevention rather than control through an
understanding of pest biology and ecology through production of a healthy crop in a
balanced and sustainable ecosystem (Holderness et al., 1999). Synthetic products are
prohibited while other products are allowed only where absolutely necessary and are
restricted by certification (Holderness et al., 1999). Organic pest management systems
include quarantine and pest exclusion, preventative cultural techniques and crop
sanitation. The use of resistant varieties, promotion of crop vigour and fertile soils of
Cranfield University at Silsoe September 2001
Laure Caussiol MSc by Research 25
high biological activity and, where appropriate, use of introduced or augmented
biological control agents are also practices (Holderness et al., 1999). In the
Philippines, spraying of plant extracts such as madrede cacao (Gliricidia sepium),
neem (Azardirachta indica), manungal (Tinospora rumphil), tobacco (Nicotiana
tabacum), chilli (Capercicum anum) and lemon grass, is directed to the affected part
of the plant (BGA, 1998). For yellow and black sigatoka disease, conventional
sanitary practice is replaced by other practices such as early harvesting, and copper
formulations and elemental sulphur (US), and mineral oils in (EU, expires on
31/02/2002) applications. For the same disease, fungicides are replaced by biological
control (bacteria) and disease resistance varieties (FHIA, IITA) (Orchard and Krauss,
1999).
2.3.2.3 Harvest
Harvest management needs to be well prepared. Attention to maturity stage at harvest
is crucial as it profoundly affects ripe fruit quality (Shewfelt, 1992). In order to sell
fruit during favourable periods where demand and prices are high, crop trimming,
which consists of cutting down mature plants and removing unwanted plants, is done
(Stover and Simmonds, 1987). Estimation of the duration of development from
anthesis to harvest is commonly used to determine when to harvest banana fruits
(Shewfelt, 1992). Bunch age grade control using colour ribbons or coloured bags
shows when to harvest bunches and thus to avoid bananas from being too ripe for
transport marketing (Thompson and Burden, 1995). Tagging enables growers to relate
age of fruit with physicochemical properties during fruit development (Sommer and
Arpaia, 1992; Wijeratnam et al. 1992). In the end, good yields result from thoughtful
production management efforts. Average production around is 2,000 boxes for a
small-scale farm and 3,000 boxes for bigger ones, each box containing 18 kg. Yields
are typically 37 to 55 tonnes per hectare (Stover and Simmonds, 1987).
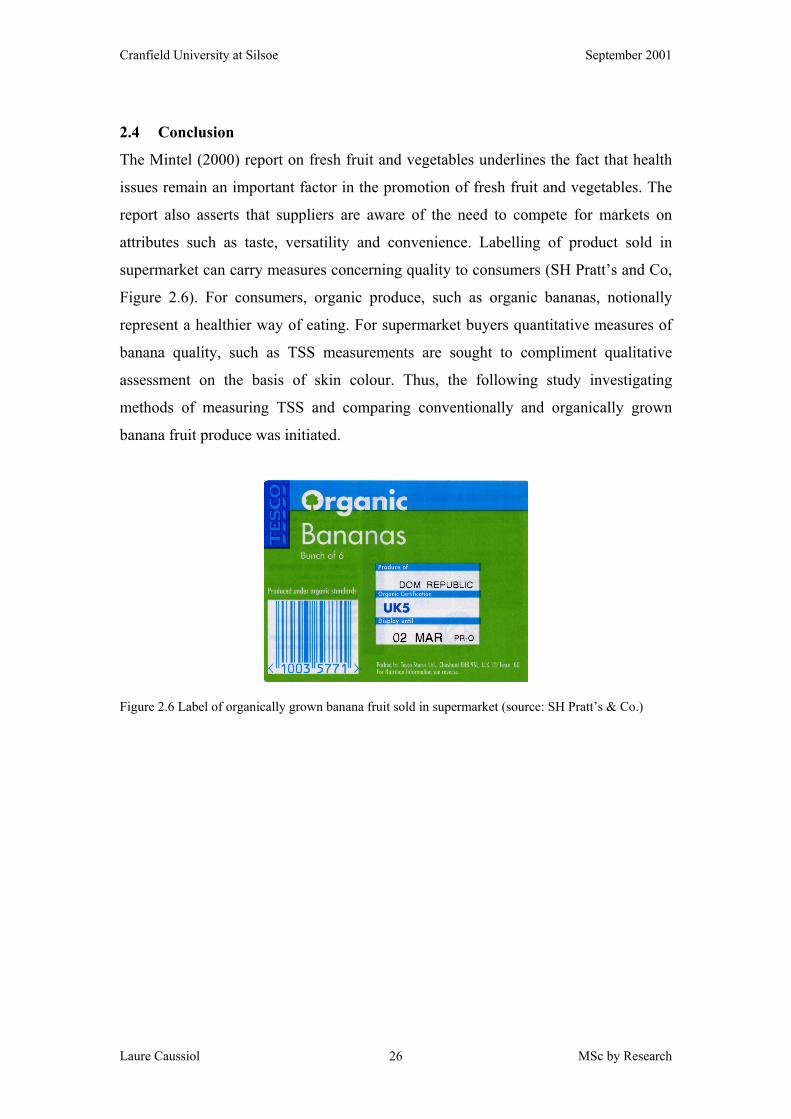
Cranfield University at Silsoe September 2001
Laure Caussiol MSc by Research 26
2.4 Conclusion
The Mintel (2000) report on fresh fruit and vegetables underlines the fact that health
issues remain an important factor in the promotion of fresh fruit and vegetables. The
report also asserts that suppliers are aware of the need to compete for markets on
attributes such as taste, versatility and convenience. Labelling of product sold in
supermarket can carry measures concerning quality to consumers (SH Pratt’s and Co,
Figure 2.6). For consumers, organic produce, such as organic bananas, notionally
represent a healthier way of eating. For supermarket buyers quantitative measures of
banana quality, such as TSS measurements are sought to compliment qualitative
assessment on the basis of skin colour. Thus, the following study investigating
methods of measuring TSS and comparing conventionally and organically grown
banana fruit produce was initiated.
Figure 2.6 Label of organically grown banana fruit sold in supermarket (source: SH Pratt’s & Co.)
Cranfield University at Silsoe September 2001
Laure Caussiol MSc by Research 27
3 Experimental Part 1: Preliminary experimentation concerning TSS
measurements
3.1 Sampling position and ripening effects on TSS levels in banana fruit
3.1.1 Introduction
Sweetness is one of the key flavour qualities and can be measured by the amount of
Total Soluble Solids (TSS) in those fruit whose major carbohydrate pool is sugars
(Kader 1992). Banana fruit peel colour is well correlated with the starch-sugar ratio
(Stover and Simmonds 1987) and serves as one of the major criteria used by
consumers, growers, and researchers to determine whether a fruit is ripe or unripe
(Medlicott et al., 1992). Starch and sugar levels in banana fruit during ripening has
been the subject of many studies (Marriot et al., 1981; Almazan, 1991; Hill and Rees,
1994; Cordenunsi and Lajolo, 1995). Moreover, many investigations looking at
enzymes of starch breakdown and sugar synthesis under various conditions have been
conducted (Lizana, 1976; Beaudry, et al., 1987; Garcia and Lajolo, 1988; Kanellis et
al., 1989; Agravante et al., 1990; Hubbard et al., 1990; Chang and Hwang, 1990;
Nascimento et al., 1997; Madrid and Lopez-Lee, 1998). However, change in banana
fruit sweetness as a practical aspect of quality management has not been widely
examined.
3.1.2 Aim
The aim of this experiment was to investigate variability in TSS as a function of tissue
sampling position from within the fruit. The experiment evaluated starch degradation
in the fruit, the increase in TSS and changes in Titratable Acidity (TA) content over
time and in relation to peel colour.
3.1.3 Hypothesis
The hypothesis tested was that starch would be converted into sugar at different rates
along the banana fruit. Previous researchers have made two relevant observations.
Loesecke (1949) and Mao and Kinsella (1981) reported that ripening starts at the ends
of banana fruit. Garcia and Lajolo (1988) observed that starch hydrolysis starts at the
central core of the fruit and advances towards the periphery of the pulp as ripening
Cranfield University at Silsoe September 2001
Laure Caussiol MSc by Research 28
proceeds. TSS changes were studied during ripening over time using two different
sample extraction methods and two different refractometers for the same samples
from the same banana fruits.
3.1.4 Objectives
The specific objectives were:
1. To relate hydrolysis of starch into sugar (TSS) to ripening and colour changes.
2. To determine where starch was converted into sugar both across (by starch-iodine
staining) and along (by TSS) the banana fruit.
3. To see how TA changed with ripening and colouration of the banana fruit.
4. To evaluate two methods for testing TA and two methods and two devices for
testing TSS.
3.1.5 Materials and Methods
3.1.5.1 Fruit
Conventionally and organically grown green (colour stage 1, according to SH Pratt’s
& Co’s colour chart) Cavendish banana fruit (var Grand Nain) from Costa Rica and
Dominican Republic, respectively, were supplied by SH Pratt’s & Co. Ltd. (Luton,
UK). One box containing 150 banana fruit was collected for each type. At the
postharvest laboratory, fruit were initially stored at 15°C for 2 days while the
experiment was prepared. Individual fingers were cut from the hands and left for 2 h
on paper to let the latex dry. They were then labelled and arranged randomly in apple
fruit trays (Figure 3.1). It should be stressed at this point, that while this experiment
utilised both conventionally and organically grown bananas, it is not intended as a
comparison of these two different production systems.
3.1.5.2 Ethylene treatment
Day 0 was designated the day when ripening was commenced. On day 0 and on day 2
fruit placed at 20°C into an 340 L capacity airtight box received an ethylene shot dose
of 100 µL/L. Ethylene levels were quantified using a Carlo Erba (UK) 8000 gas
chromatograph with a 2.0 m long x 6.35 mm internal diameter stainless steel column
packed with 60-80 mesh Porapack. The oven temperature was set to 150°C. The
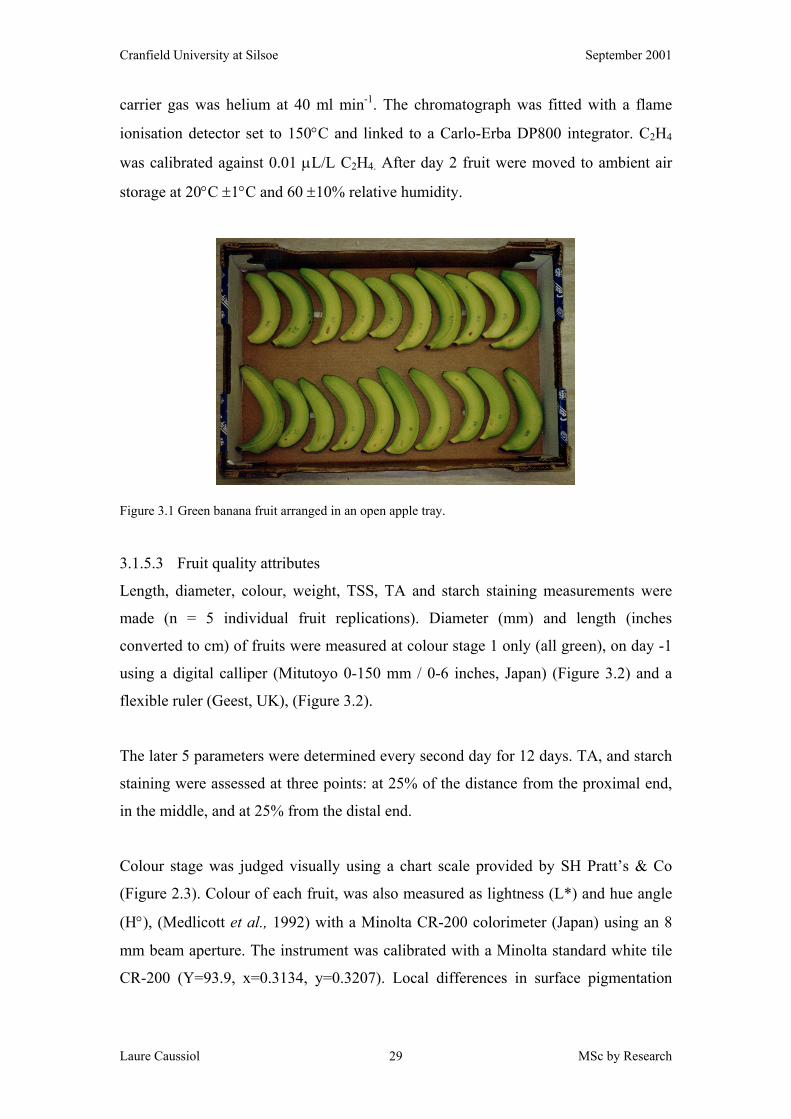
Cranfield University at Silsoe September 2001
Laure Caussiol MSc by Research 29
carrier gas was helium at 40 ml min-1. The chromatograph was fitted with a flame
ionisation detector set to 150°C and linked to a Carlo-Erba DP800 integrator. C2H4
was calibrated against 0.01 µL/L C2H4. After day 2 fruit were moved to ambient air
storage at 20°C ±1°C and 60 ±10% relative humidity.
Figure 3.1 Green banana fruit arranged in an open apple tray.
3.1.5.3 Fruit quality attributes
Length, diameter, colour, weight, TSS, TA and starch staining measurements were
made (n = 5 individual fruit replications). Diameter (mm) and length (inches
converted to cm) of fruits were measured at colour stage 1 only (all green), on day -1
using a digital calliper (Mitutoyo 0-150 mm / 0-6 inches, Japan) (Figure 3.2) and a
flexible ruler (Geest, UK), (Figure 3.2).
The later 5 parameters were determined every second day for 12 days. TA, and starch
staining were assessed at three points: at 25% of the distance from the proximal end,
in the middle, and at 25% from the distal end.
Colour stage was judged visually using a chart scale provided by SH Pratt’s & Co
(Figure 2.3). Colour of each fruit, was also measured as lightness (L*) and hue angle
(H°), (Medlicott et al., 1992) with a Minolta CR-200 colorimeter (Japan) using an 8
mm beam aperture. The instrument was calibrated with a Minolta standard white tile
CR-200 (Y=93.9, x=0.3134, y=0.3207). Local differences in surface pigmentation
Cranfield University at Silsoe September 2001
Laure Caussiol MSc by Research 30
were compensated for by determining the mean of three readings around the surface
of the fruit (Medlicott et al., 1992).
Weight was first measured on day-1 at colour stage 1 (all green) and then repeatedly
on each assessment day. Weight loss was calculated as follows: Relative fresh weight
(FW%) = W1 x 100 / Wo; where Wo was the original weight measured on day 0 and
W1 the weight measured on the assessment day.
TA was measured against a solution of 0.1 N sodium hydroxide (1g / 250ml), with the
addition of three drops of phenolphthalein until a pinkish colour change remained.
Starch staining was measured by dipping a cross-section of banana for 2 sec. in an
iodine preparation of 4.0% potassium iodide (KI), and 1.0 % iodine (I2) (Chu, 1988).
The pattern of the whole slice and starch stained area was traced onto a transparent
plastic sheet (OHT slide), photocopied, and the resultant paper images cut and
weighed. Starch staining was expressed as follows: Starch %= Wst / Wsl x 100; where
Wst was the weight of starch staining area cut out and Wsl the total weight of paper cut
out for each slice. On day 2, starch staining was visually estimated due to the little
amount of unstained areas.
TSS was measured with a pocket refractometer (Bellingham and Stanley, UK) and a
digital refractometer (Atago PR-1, Japan), both scaled from 0-30 % (MAFF, 1987).
Undiluted TSS was measured by administrating an amount of banana pulp squashed
with a wooden stick directly to the refractometers (Figure 3.3). This crude method is
practised by a technical representative of one of the supermarkets, and was therefore
of direct interest to the banana ripener, SH Pratt’s & Co. Diluted (5-fold) TSS was
measured by homogenising banana pulp (at least 2g) in distilled water (Table 3.1)
with an Ultra-Turrax T25 (Janke and Kunkel, Germany) for 15 s at 8,000 rpm
followed by 15 s at 15,000 rpm (Figure 3.4). Tubes were left for 10 min to settle and
TSS of the solution measured (Figure 3.5).
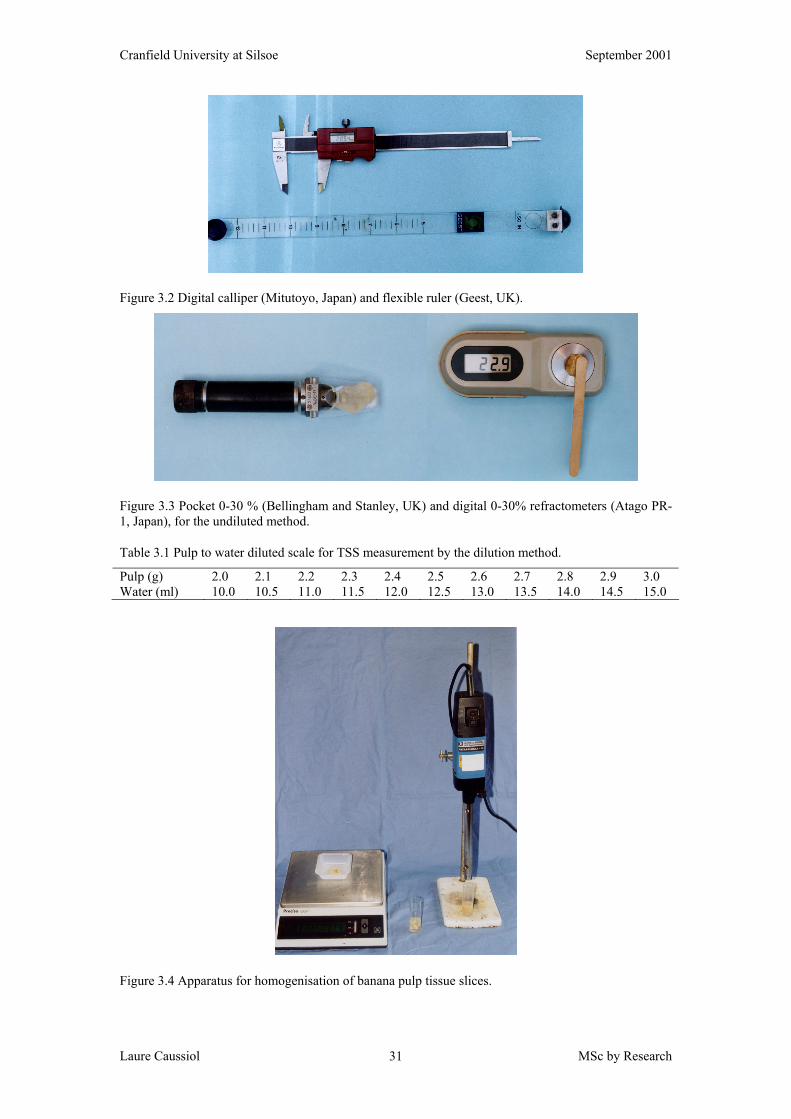
Cranfield University at Silsoe September 2001
Laure Caussiol MSc by Research 31
Figure 3.2 Digital calliper (Mitutoyo, Japan) and flexible ruler (Geest, UK).
Figure 3.3 Pocket 0-30 % (Bellingham and Stanley, UK) and digital 0-30% refractometers (Atago PR-1, Japan), for the undiluted method.
Table 3.1 Pulp to water diluted scale for TSS measurement by the dilution method.
Pulp (g) 2.0 2.1 2.2 2.3 2.4 2.5 2.6 2.7 2.8 2.9 3.0 Water (ml) 10.0 10.5 11.0 11.5 12.0 12.5 13.0 13.5 14.0 14.5 15.0
Figure 3.4 Apparatus for homogenisation of banana pulp tissue slices.
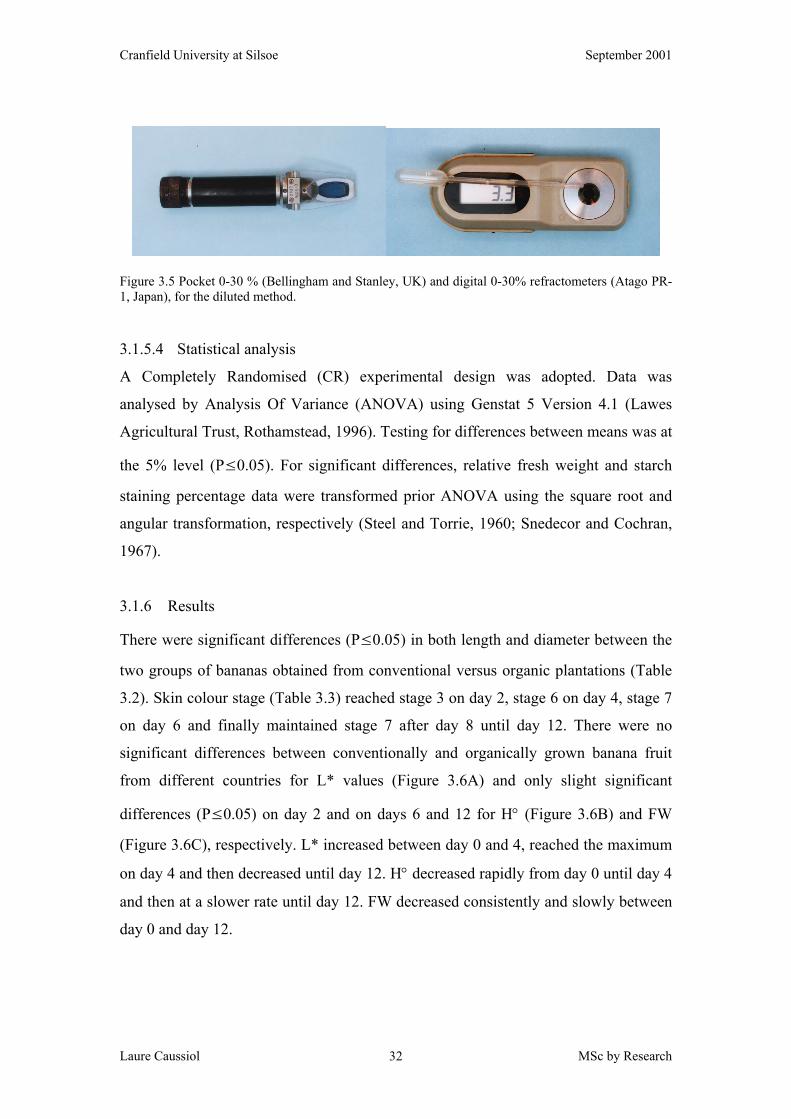
Cranfield University at Silsoe September 2001
Laure Caussiol MSc by Research 32
Figure 3.5 Pocket 0-30 % (Bellingham and Stanley, UK) and digital 0-30% refractometers (Atago PR-1, Japan), for the diluted method.
3.1.5.4 Statistical analysis
A Completely Randomised (CR) experimental design was adopted. Data was
analysed by Analysis Of Variance (ANOVA) using Genstat 5 Version 4.1 (Lawes
Agricultural Trust, Rothamstead, 1996). Testing for differences between means was at
the 5% level (P≤0.05). For significant differences, relative fresh weight and starch
staining percentage data were transformed prior ANOVA using the square root and
angular transformation, respectively (Steel and Torrie, 1960; Snedecor and Cochran,
1967).
3.1.6 Results
There were significant differences (P≤0.05) in both length and diameter between the
two groups of bananas obtained from conventional versus organic plantations (Table
3.2). Skin colour stage (Table 3.3) reached stage 3 on day 2, stage 6 on day 4, stage 7
on day 6 and finally maintained stage 7 after day 8 until day 12. There were no
significant differences between conventionally and organically grown banana fruit
from different countries for L* values (Figure 3.6A) and only slight significant
differences (P≤0.05) on day 2 and on days 6 and 12 for H° (Figure 3.6B) and FW
(Figure 3.6C), respectively. L* increased between day 0 and 4, reached the maximum
on day 4 and then decreased until day 12. H° decreased rapidly from day 0 until day 4
and then at a slower rate until day 12. FW decreased consistently and slowly between
day 0 and day 12.
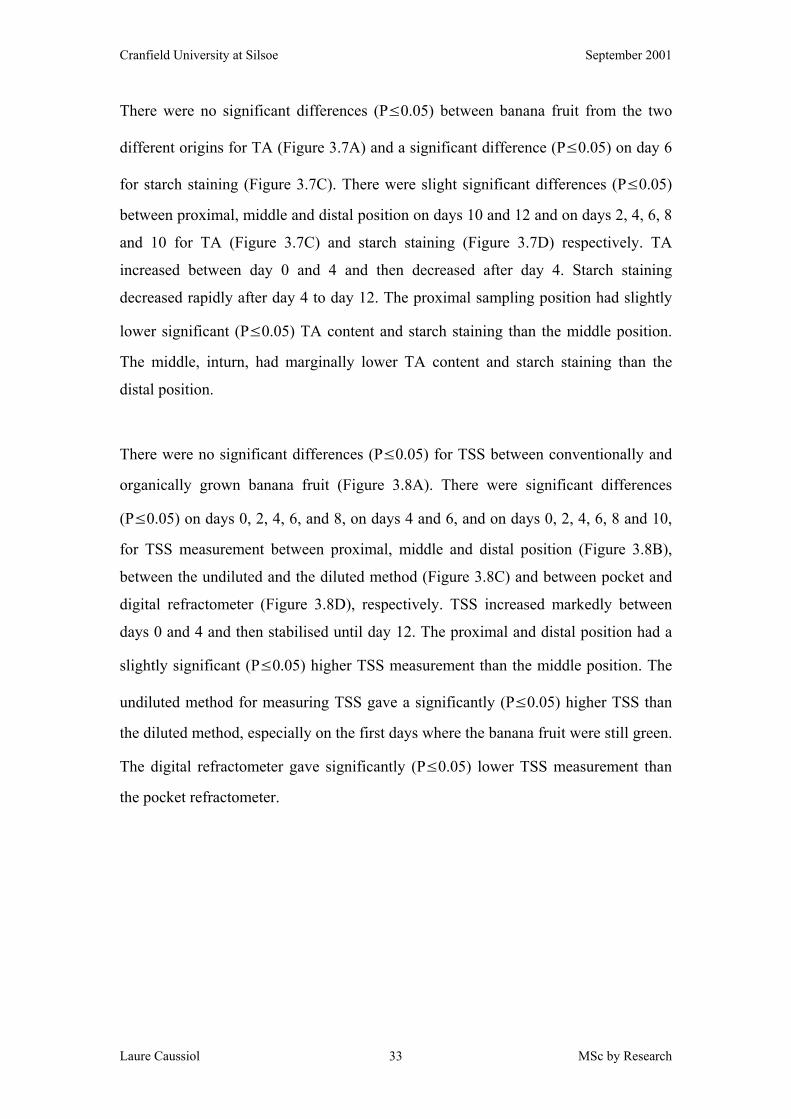
Cranfield University at Silsoe September 2001
Laure Caussiol MSc by Research 33
There were no significant differences (P≤0.05) between banana fruit from the two
different origins for TA (Figure 3.7A) and a significant difference (P≤0.05) on day 6
for starch staining (Figure 3.7C). There were slight significant differences (P≤0.05)
between proximal, middle and distal position on days 10 and 12 and on days 2, 4, 6, 8
and 10 for TA (Figure 3.7C) and starch staining (Figure 3.7D) respectively. TA
increased between day 0 and 4 and then decreased after day 4. Starch staining
decreased rapidly after day 4 to day 12. The proximal sampling position had slightly
lower significant (P≤0.05) TA content and starch staining than the middle position.
The middle, inturn, had marginally lower TA content and starch staining than the
distal position.
There were no significant differences (P≤0.05) for TSS between conventionally and
organically grown banana fruit (Figure 3.8A). There were significant differences
(P≤0.05) on days 0, 2, 4, 6, and 8, on days 4 and 6, and on days 0, 2, 4, 6, 8 and 10,
for TSS measurement between proximal, middle and distal position (Figure 3.8B),
between the undiluted and the diluted method (Figure 3.8C) and between pocket and
digital refractometer (Figure 3.8D), respectively. TSS increased markedly between
days 0 and 4 and then stabilised until day 12. The proximal and distal position had a
slightly significant (P≤0.05) higher TSS measurement than the middle position. The
undiluted method for measuring TSS gave a significantly (P≤0.05) higher TSS than
the diluted method, especially on the first days where the banana fruit were still green.
The digital refractometer gave significantly (P≤0.05) lower TSS measurement than
the pocket refractometer.
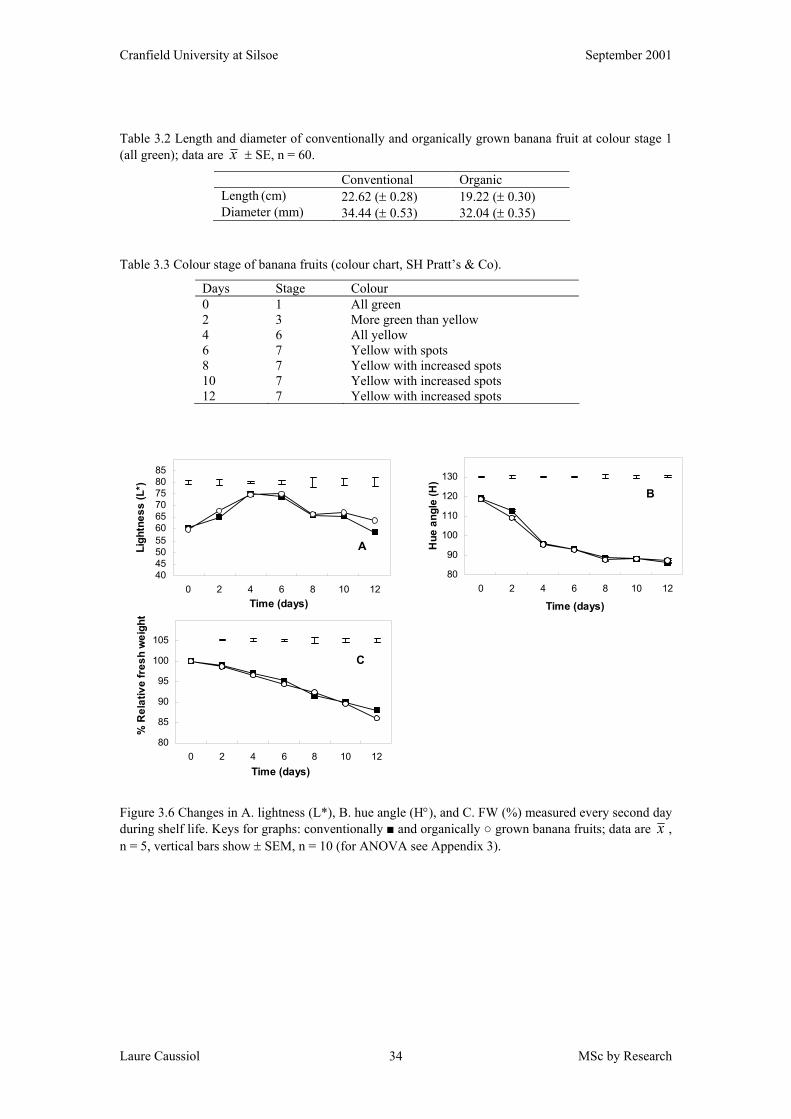
Cranfield University at Silsoe September 2001
Laure Caussiol MSc by Research 34
Table 3.2 Length and diameter of conventionally and organically grown banana fruit at colour stage 1 (all green); data are x ± SE, n = 60.
Conventional Organic Length (cm) 22.62 (± 0.28) 19.22 (± 0.30) Diameter (mm) 34.44 (± 0.53) 32.04 (± 0.35)
Table 3.3 Colour stage of banana fruits (colour chart, SH Pratt’s & Co).
Days Stage Colour 0 1 All green 2 3 More green than yellow 4 6 All yellow 6 7 Yellow with spots 8 7 Yellow with increased spots 10 7 Yellow with increased spots 12 7 Yellow with increased spots
80
85
90
95
100
105
0 2 4 6 8 10 12Time (days)
% R
elat
ive
fres
h w
eigh
t
C
80
90
100
110
120
130
0 2 4 6 8 10 12
Time (days)
Hue
ang
le (H
)
B
40455055606570758085
0 2 4 6 8 10 12Time (days)
Ligh
tnes
s (L
*)
A
Figure 3.6 Changes in A. lightness (L*), B. hue angle (H°), and C. FW (%) measured every second day during shelf life. Keys for graphs: conventionally ■ and organically ○ grown banana fruits; data are x , n = 5, vertical bars show ± SEM, n = 10 (for ANOVA see Appendix 3).
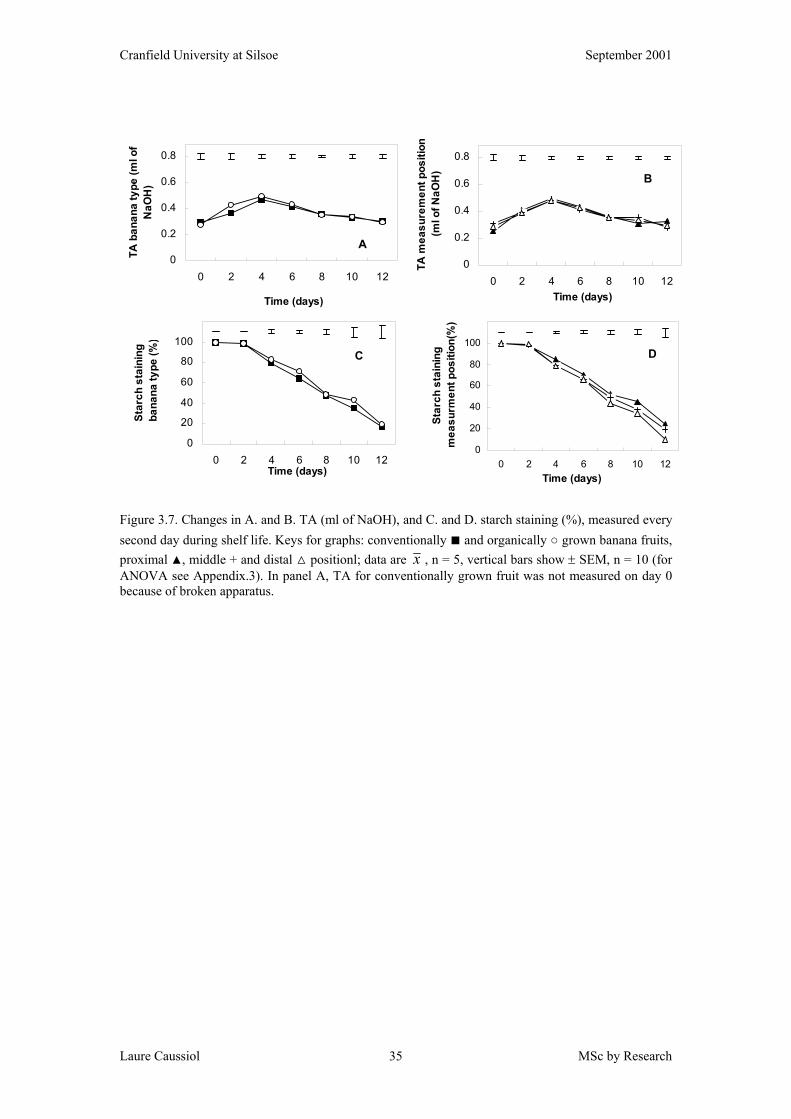
Cranfield University at Silsoe September 2001
Laure Caussiol MSc by Research 35
0
0.2
0.4
0.6
0.8
0 2 4 6 8 10 12
Time (days)
TA b
anan
a ty
pe (m
l of
NaO
H)
A0
0.2
0.4
0.6
0.8
0 2 4 6 8 10 12Time (days)
TA m
easu
rem
ent p
ositi
on(m
l of N
aOH
) B
0
20
40
60
80
100
0 2 4 6 8 10 12Time (days)
Star
ch s
tain
ing
ban
ana
type
(%)
C
0
20
40
60
80
100
0 2 4 6 8 10 12Time (days)
Star
ch s
tain
ing
mea
surm
ent p
ositi
on(%
)
D
Figure 3.7. Changes in A. and B. TA (ml of NaOH), and C. and D. starch staining (%), measured every second day during shelf life. Keys for graphs: conventionally ■ and organically ○ grown banana fruits, proximal ▲, middle + and distal △ positionl; data are x , n = 5, vertical bars show ± SEM, n = 10 (for ANOVA see Appendix.3). In panel A, TA for conventionally grown fruit was not measured on day 0 because of broken apparatus.
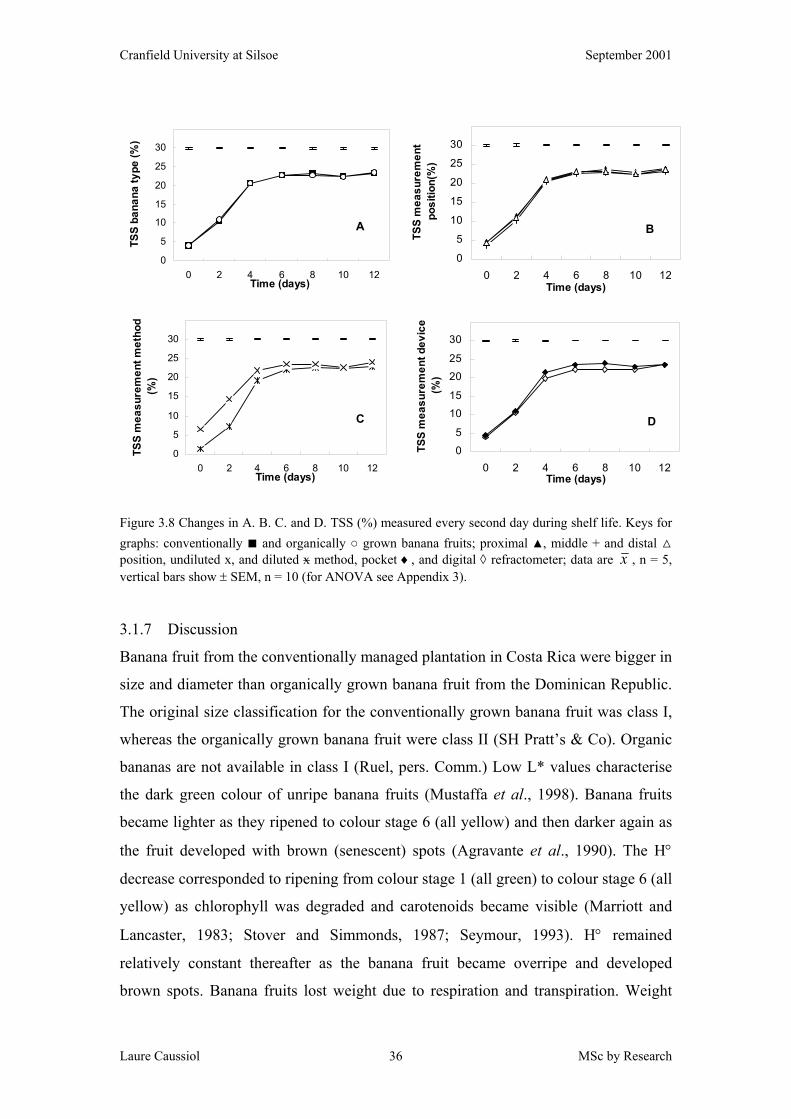
Cranfield University at Silsoe September 2001
Laure Caussiol MSc by Research 36
0
5
10
15
20
25
30
0 2 4 6 8 10 12Time (days)
TSS
bana
na ty
pe (%
)
A
0
5
10
15
20
25
30
0 2 4 6 8 10 12Time (days)
TSS
mea
sure
men
t po
sitio
n(%
)
B
0
5
10
15
20
25
30
0 2 4 6 8 10 12Time (days)
TSS
mea
sure
men
t met
hod
(%)
C
0
5
1015
2025
30
0 2 4 6 8 10 12Time (days)
TSS
mea
sure
men
t dev
ice
(%)
D
Figure 3.8 Changes in A. B. C. and D. TSS (%) measured every second day during shelf life. Keys for graphs: conventionally ■ and organically ○ grown banana fruits; proximal ▲, middle + and distal △ position, undiluted x, and diluted x method, pocket ♦, and digital ◊ refractometer; data are x , n = 5, vertical bars show ± SEM, n = 10 (for ANOVA see Appendix 3).
3.1.7 Discussion
Banana fruit from the conventionally managed plantation in Costa Rica were bigger in
size and diameter than organically grown banana fruit from the Dominican Republic.
The original size classification for the conventionally grown banana fruit was class I,
whereas the organically grown banana fruit were class II (SH Pratt’s & Co). Organic
bananas are not available in class I (Ruel, pers. Comm.) Low L* values characterise
the dark green colour of unripe banana fruits (Mustaffa et al., 1998). Banana fruits
became lighter as they ripened to colour stage 6 (all yellow) and then darker again as
the fruit developed with brown (senescent) spots (Agravante et al., 1990). The H°
decrease corresponded to ripening from colour stage 1 (all green) to colour stage 6 (all
yellow) as chlorophyll was degraded and carotenoids became visible (Marriott and
Lancaster, 1983; Stover and Simmonds, 1987; Seymour, 1993). H° remained
relatively constant thereafter as the banana fruit became overripe and developed
brown spots. Banana fruits lost weight due to respiration and transpiration. Weight
Cranfield University at Silsoe September 2001
Laure Caussiol MSc by Research 37
loss affects appearance, and textural and nutritional qualities (Stover and Simmonds,
1987). TA increased as the banana fruit ripened and then decreased, as the fruit
became overripe. Loesoecke (1950) reported a sharp increase in acidity in course of
banana fruit ripening.
At the colour stage 1 (all green) starch was not yet converted to sugar. Hydrolysis of
starch to sugar appeared to have started slightly on day 2 at colour stage 2 (green with
yellow tip) and in the centre part of the banana fruit. Hydrolysis had occurred
markedly on day 4 at colour stage 4 (all yellow), as ripening took place. This result
was in accordance with Garcia and Lajolo (1988), who found that during the early
preclimacteric phase starch was well distributed in the tissue. During the climacteric,
commencement of starch degradation to sugar started in the central part of the fruit.
Finally as ripening advanced, starch staining such that during the postclimacteric the
process was completed and little starch was detected. However, the observation that
starch staining slightly differed between position in the present experiment was
contrary to results found by Garcia and Lajolo (1988). They stated that the same
pattern of starch hydrolysis was seen in the middle section of the fruit and at 2 cm
from both ends.
Increasing TSS reflects hydrolysis of starch into sugars as banana fruit ripen. This
conversion was reported to be the most important change in ripening bananas (Stover
and Simmonds, 1987). Afterwards, total sugar content does not change significantly
during the later stage of ripening (Marriott et al., 1981). There was no marked
difference in TSS between conventionally grown and organically grown banana fruits.
Even otherwise, no difference between conventionally and organically grown banana
fruit was to be inferred. The ends of the fruit had slightly higher TSS content than the
centre. This result suggested that conversion of starch into sugar was proportionally
greater near the ends.
The digital refractometer usually under-scored the pocket refractometer TSS values,
especially at the beginning when the banana fruits started to ripen. The undiluted
method seemed inappropriate because TSS measurements are not accurate.
Cranfield University at Silsoe September 2001
Laure Caussiol MSc by Research 38
3.1.7.1 Conclusions
Standardisation on sampling from the centre was suggested. For experiment 2, to
which was added firmness and sensory analysis the undiluted and diluted methods
were subjected to further comparisons and only the pocket refractometer 0-30% was
used. Accordingly, instruments were subjected to comparative evaluation.
3.2 Checking of refractometers with AR-grade sucrose
3.2.1 Introduction
Before further assessing TSS for bananas a more direct comparison of the
refractometers was deemed necessary (see above). Ideally, for pure solutions of
sucrose at different concentrations, results given by the different devices (i.e. the
pocket refractometer scaled at both 0-30%, and 0-50%, and the digital refractometer
scaled at 0-30%) should be the same.
3.2.2 Materials and Methods
Stock solutions of pure sucrose (AnalAR, BDH Laboratory Suppliers) diluted in water
were prepared by dissolving 3.2 g in 10 ml or 16.0 g in 50 ml. Five ml was added to
the 32% (w/v) solution to give a 16% (w/v) solution. Concentrations of 32, 16, 8, 4, 2,
and 1% were prepared. TSS % was then measured with the pocket refractometer
scaled 0-50%, the same pocket refractometer scaled 0-30% and the digital
refractometer scaled 0-30%. Refractometers were calibrated at 0.00 with distilled
water.
3.2.3 Results and Discussion
Overall, the measured data underestimated % TSS (Figure 3.9). This difference could
have been due to problems in the solution preparation. The pocket refractometer
scaled 0-50% markedly under-estimated TSS at concentration 16 %. The pocket
refractometer scaled 0-50% was not precise enough compared to the pocket
refractometer 0-30%. The pocket refractometer scaled 0-30% gave good TSS
measurements, as did the digital one. The digital refractometer gave slightly lower %
TSS values than the pocket 0-30 % refractometer.
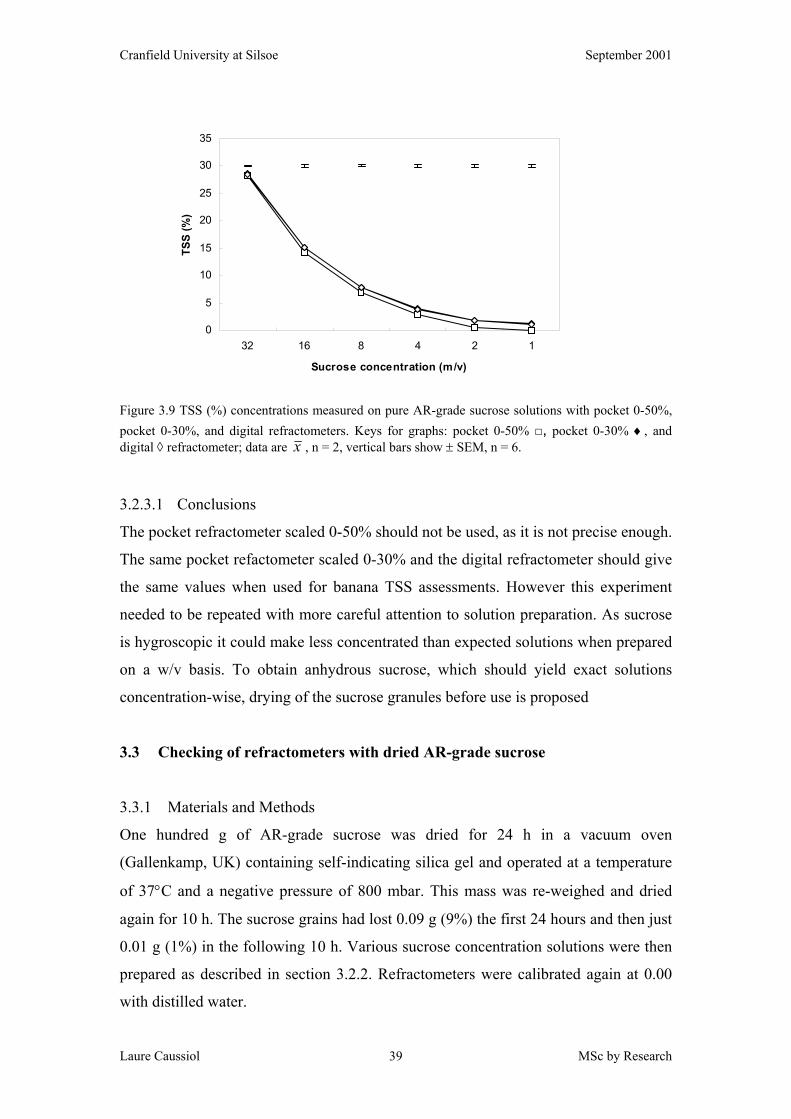
Cranfield University at Silsoe September 2001
Laure Caussiol MSc by Research 39
Figure 3.9 TSS (%) concentrations measured on pure AR-grade sucrose solutions with pocket 0-50%, pocket 0-30%, and digital refractometers. Keys for graphs: pocket 0-50% □, pocket 0-30% ♦, and digital ◊ refractometer; data are x , n = 2, vertical bars show ± SEM, n = 6.
3.2.3.1 Conclusions
The pocket refractometer scaled 0-50% should not be used, as it is not precise enough.
The same pocket refactometer scaled 0-30% and the digital refractometer should give
the same values when used for banana TSS assessments. However this experiment
needed to be repeated with more careful attention to solution preparation. As sucrose
is hygroscopic it could make less concentrated than expected solutions when prepared
on a w/v basis. To obtain anhydrous sucrose, which should yield exact solutions
concentration-wise, drying of the sucrose granules before use is proposed
3.3 Checking of refractometers with dried AR-grade sucrose
3.3.1 Materials and Methods
One hundred g of AR-grade sucrose was dried for 24 h in a vacuum oven
(Gallenkamp, UK) containing self-indicating silica gel and operated at a temperature
of 37°C and a negative pressure of 800 mbar. This mass was re-weighed and dried
again for 10 h. The sucrose grains had lost 0.09 g (9%) the first 24 hours and then just
0.01 g (1%) in the following 10 h. Various sucrose concentration solutions were then
prepared as described in section 3.2.2. Refractometers were calibrated again at 0.00
with distilled water.
0
5
10
15
20
25
30
35
32 16 8 4 2 1
Sucrose concentration (m/v)
TSS
(%)
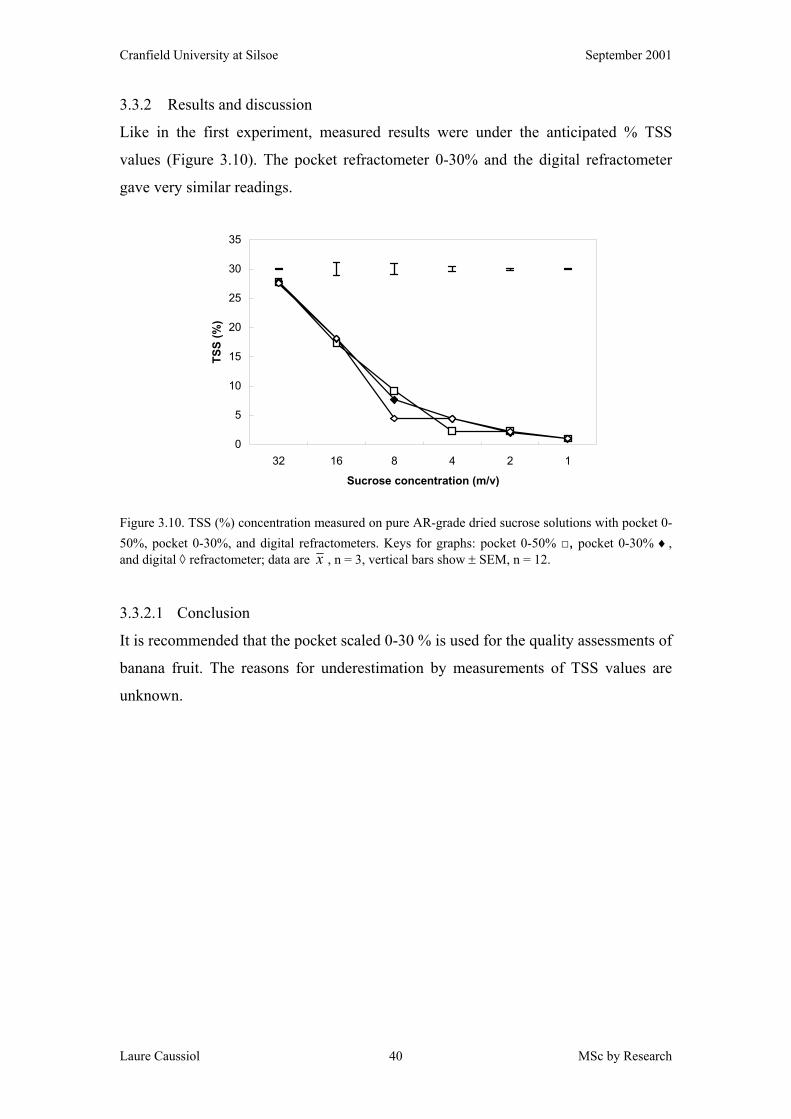
Cranfield University at Silsoe September 2001
Laure Caussiol MSc by Research 40
3.3.2 Results and discussion
Like in the first experiment, measured results were under the anticipated % TSS
values (Figure 3.10). The pocket refractometer 0-30% and the digital refractometer
gave very similar readings.
Figure 3.10. TSS (%) concentration measured on pure AR-grade dried sucrose solutions with pocket 0-50%, pocket 0-30%, and digital refractometers. Keys for graphs: pocket 0-50% □, pocket 0-30% ♦, and digital ◊ refractometer; data are x , n = 3, vertical bars show ± SEM, n = 12.
3.3.2.1 Conclusion
It is recommended that the pocket scaled 0-30 % is used for the quality assessments of
banana fruit. The reasons for underestimation by measurements of TSS values are
unknown.
0
5
10
15
20
25
30
35
32 16 8 4 2 1
Sucrose concentration (m/v)
TSS
(%)
Cranfield University at Silsoe September 2001
Laure Caussiol MSc by Research 41
4 Experimental Part 2: Postharvest quality of conventionally and organically
grown banana fruit from the Dominican Republic
4.1 Introduction
For the banana shipper, ripener and retailer, quality control is primarily a function of
transport and storage conditions (Kashmire and Ahrens, 1992). For the grower, before
the postharvest phase, quality control is based on field operations and conditions
(Sommer and Arpaia, 1992). Optimal cultural management is needed in order to
realise optimum quality as sought by, ultimately, the consumer. These criteria include
fruit size, freedom from pest, disease, and physiological defects, and good visual
appeal (Smith, 1995). These variables can influence the ripening process of the
bananas in the country of consumption (Shewfelt, 1999). To obtain best quality fruits,
the production management must consider the inputs (e.g. water and fertilisers) the
natural conditions (e.g. climate, soils) and plant and fruit care (e.g. protection and
harvest practices) (Bevererly et al., 1992). Supermarkets perceive a strong need for
quantitative measures of banana quality, such as TSS measurements to compliment
qualitative assessment on the basis of skin colour (SH Pratt’s and Co.). Moreover,
some consumers notionally perceive a taste difference between conventionally and
organically grown bananas (SH Pratt’s and Co.). Thus, investigating methods of
measuring TSS and comparing conventionally and organically grown banana fruit
was strongly needed.
TSS levels and changes in banana fruit from nearby organically and conventionally
managed farms in the same country are examined for serial harvests over part of the
year as climate changed from winter to summer conditions.
4.2 Material and Methods
4.2.1 Fruit
Conventionally (plantation 57) and organically (plantation 11) grown green mature
(colour stage 1; SH Pratt’s & Co. colour chart) Cavendish banana fruit var. Grand
Nain from nearby plantations in the Dominican Republic were supplied at different
times of the season (Table 4.1, SH Pratt’s & Co.).
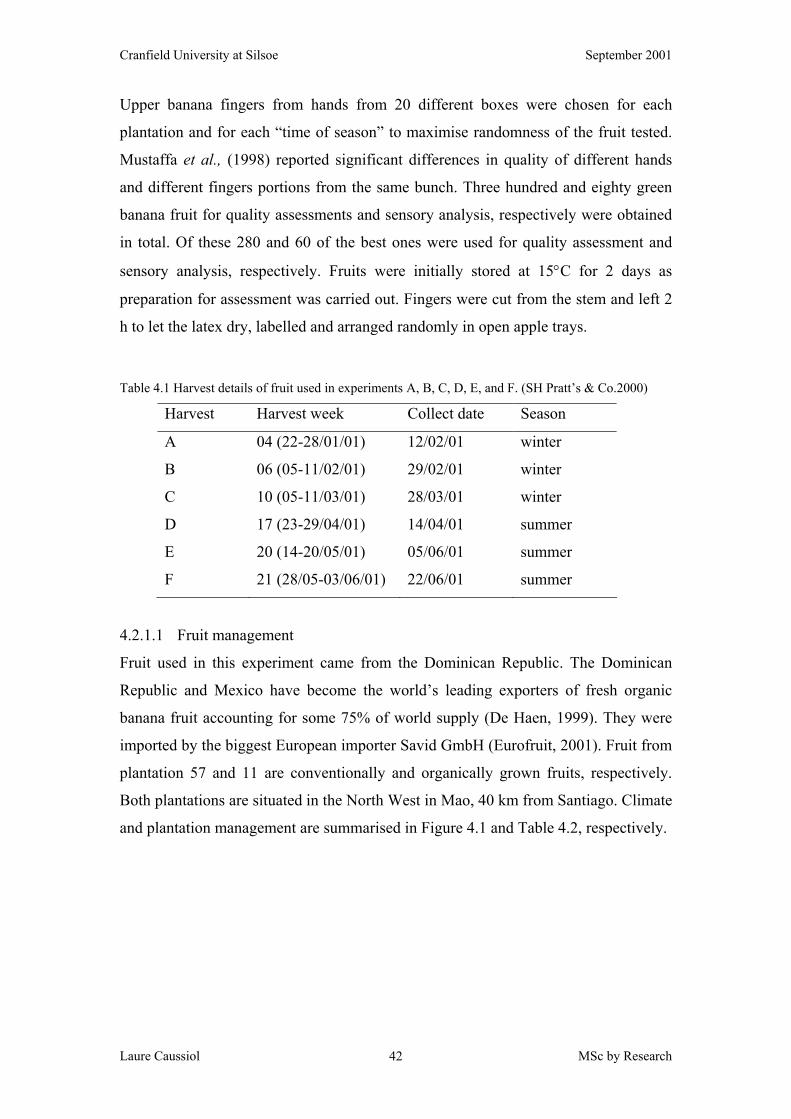
Cranfield University at Silsoe September 2001
Laure Caussiol MSc by Research 42
Upper banana fingers from hands from 20 different boxes were chosen for each
plantation and for each “time of season” to maximise randomness of the fruit tested.
Mustaffa et al., (1998) reported significant differences in quality of different hands
and different fingers portions from the same bunch. Three hundred and eighty green
banana fruit for quality assessments and sensory analysis, respectively were obtained
in total. Of these 280 and 60 of the best ones were used for quality assessment and
sensory analysis, respectively. Fruits were initially stored at 15°C for 2 days as
preparation for assessment was carried out. Fingers were cut from the stem and left 2
h to let the latex dry, labelled and arranged randomly in open apple trays.
Table 4.1 Harvest details of fruit used in experiments A, B, C, D, E, and F. (SH Pratt’s & Co.2000)
Harvest Harvest week Collect date Season
A 04 (22-28/01/01) 12/02/01 winter
B 06 (05-11/02/01) 29/02/01 winter
C 10 (05-11/03/01) 28/03/01 winter
D 17 (23-29/04/01) 14/04/01 summer
E 20 (14-20/05/01) 05/06/01 summer
F 21 (28/05-03/06/01) 22/06/01 summer
4.2.1.1 Fruit management
Fruit used in this experiment came from the Dominican Republic. The Dominican
Republic and Mexico have become the world’s leading exporters of fresh organic
banana fruit accounting for some 75% of world supply (De Haen, 1999). They were
imported by the biggest European importer Savid GmbH (Eurofruit, 2001). Fruit from
plantation 57 and 11 are conventionally and organically grown fruits, respectively.
Both plantations are situated in the North West in Mao, 40 km from Santiago. Climate
and plantation management are summarised in Figure 4.1 and Table 4.2, respectively.
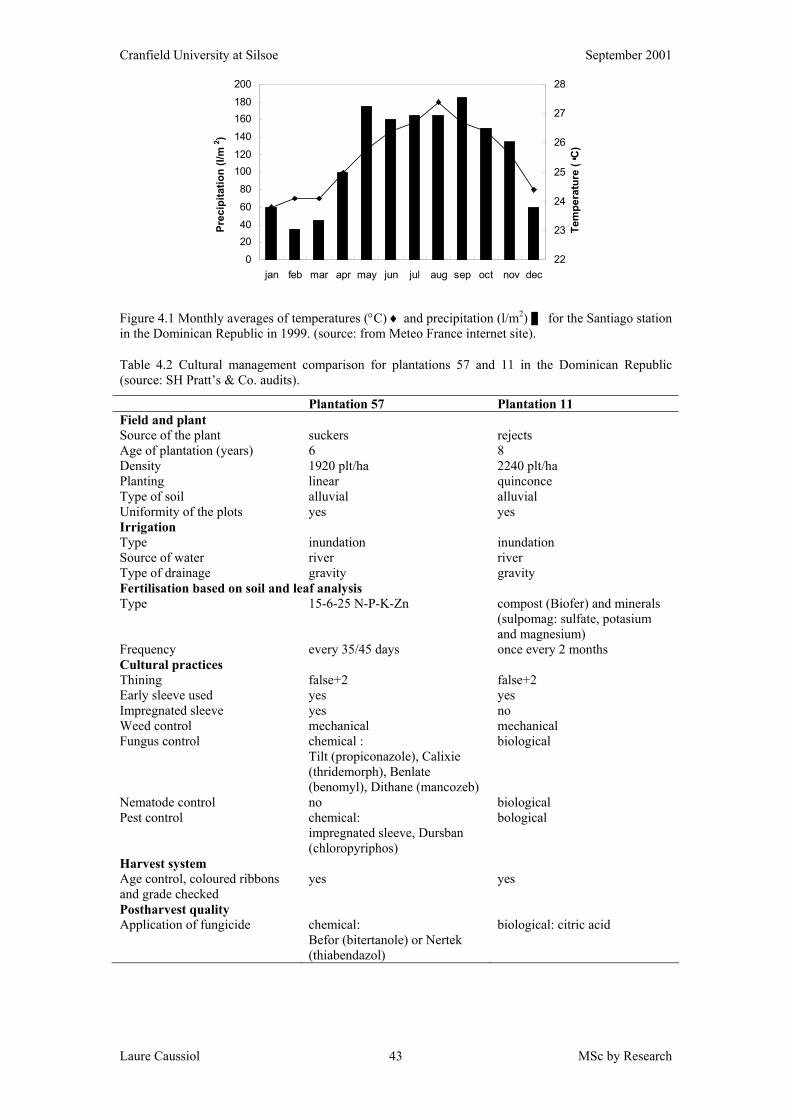
Cranfield University at Silsoe September 2001
Laure Caussiol MSc by Research 43
Figure 4.1 Monthly averages of temperatures (°C) ♦ and precipitation (l/m2) ▌ for the Santiago station in the Dominican Republic in 1999. (source: from Meteo France internet site).
Table 4.2 Cultural management comparison for plantations 57 and 11 in the Dominican Republic (source: SH Pratt’s & Co. audits).
Plantation 57 Plantation 11 Field and plant Source of the plant suckers rejects Age of plantation (years) 6 8 Density 1920 plt/ha 2240 plt/ha Planting linear quinconce Type of soil alluvial alluvial Uniformity of the plots yes yes Irrigation Type inundation inundation Source of water river river Type of drainage gravity gravity Fertilisation based on soil and leaf analysis Type 15-6-25 N-P-K-Zn compost (Biofer) and minerals
(sulpomag: sulfate, potasium and magnesium)
Frequency every 35/45 days once every 2 months Cultural practices Thining false+2 false+2 Early sleeve used yes yes Impregnated sleeve yes no Weed control mechanical mechanical Fungus control chemical :
Tilt (propiconazole), Calixie (thridemorph), Benlate (benomyl), Dithane (mancozeb)
biological
Nematode control no biological Pest control chemical:
impregnated sleeve, Dursban (chloropyriphos)
bological
Harvest system Age control, coloured ribbons and grade checked
yes yes
Postharvest quality Application of fungicide chemical:
Befor (bitertanole) or Nertek (thiabendazol)
biological: citric acid
0
2040
60
80
100120
140
160180
200
jan feb mar apr may jun jul aug sep oct nov dec22
23
24
25
26
27
28
Prec
ipita
tion
(l/m
2 )
Tem
pera
ture
(C
)
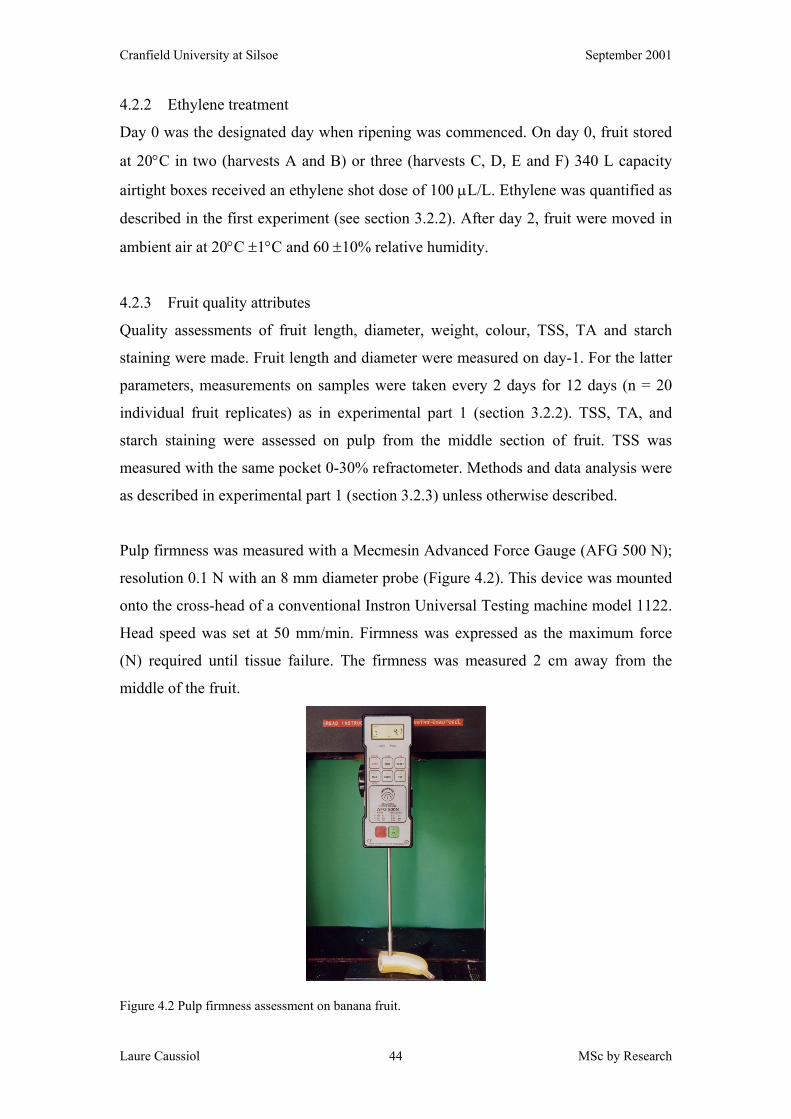
Cranfield University at Silsoe September 2001
Laure Caussiol MSc by Research 44
4.2.2 Ethylene treatment
Day 0 was the designated day when ripening was commenced. On day 0, fruit stored
at 20°C in two (harvests A and B) or three (harvests C, D, E and F) 340 L capacity
airtight boxes received an ethylene shot dose of 100 µL/L. Ethylene was quantified as
described in the first experiment (see section 3.2.2). After day 2, fruit were moved in
ambient air at 20°C ±1°C and 60 ±10% relative humidity.
4.2.3 Fruit quality attributes
Quality assessments of fruit length, diameter, weight, colour, TSS, TA and starch
staining were made. Fruit length and diameter were measured on day-1. For the latter
parameters, measurements on samples were taken every 2 days for 12 days (n = 20
individual fruit replicates) as in experimental part 1 (section 3.2.2). TSS, TA, and
starch staining were assessed on pulp from the middle section of fruit. TSS was
measured with the same pocket 0-30% refractometer. Methods and data analysis were
as described in experimental part 1 (section 3.2.3) unless otherwise described.
Pulp firmness was measured with a Mecmesin Advanced Force Gauge (AFG 500 N);
resolution 0.1 N with an 8 mm diameter probe (Figure 4.2). This device was mounted
onto the cross-head of a conventional Instron Universal Testing machine model 1122.
Head speed was set at 50 mm/min. Firmness was expressed as the maximum force
(N) required until tissue failure. The firmness was measured 2 cm away from the
middle of the fruit.
Figure 4.2 Pulp firmness assessment on banana fruit.
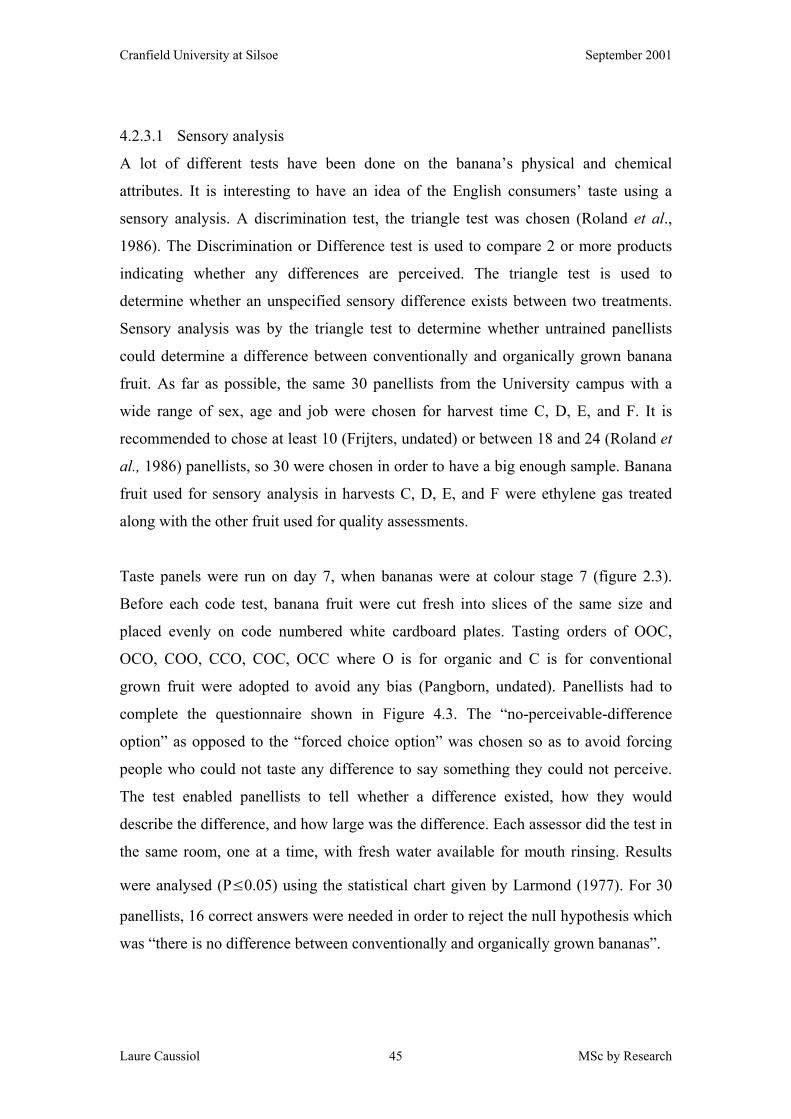
Cranfield University at Silsoe September 2001
Laure Caussiol MSc by Research 45
4.2.3.1 Sensory analysis
A lot of different tests have been done on the banana’s physical and chemical
attributes. It is interesting to have an idea of the English consumers’ taste using a
sensory analysis. A discrimination test, the triangle test was chosen (Roland et al.,
1986). The Discrimination or Difference test is used to compare 2 or more products
indicating whether any differences are perceived. The triangle test is used to
determine whether an unspecified sensory difference exists between two treatments.
Sensory analysis was by the triangle test to determine whether untrained panellists
could determine a difference between conventionally and organically grown banana
fruit. As far as possible, the same 30 panellists from the University campus with a
wide range of sex, age and job were chosen for harvest time C, D, E, and F. It is
recommended to chose at least 10 (Frijters, undated) or between 18 and 24 (Roland et
al., 1986) panellists, so 30 were chosen in order to have a big enough sample. Banana
fruit used for sensory analysis in harvests C, D, E, and F were ethylene gas treated
along with the other fruit used for quality assessments.
Taste panels were run on day 7, when bananas were at colour stage 7 (figure 2.3).
Before each code test, banana fruit were cut fresh into slices of the same size and
placed evenly on code numbered white cardboard plates. Tasting orders of OOC,
OCO, COO, CCO, COC, OCC where O is for organic and C is for conventional
grown fruit were adopted to avoid any bias (Pangborn, undated). Panellists had to
complete the questionnaire shown in Figure 4.3. The “no-perceivable-difference
option” as opposed to the “forced choice option” was chosen so as to avoid forcing
people who could not taste any difference to say something they could not perceive.
The test enabled panellists to tell whether a difference existed, how they would
describe the difference, and how large was the difference. Each assessor did the test in
the same room, one at a time, with fresh water available for mouth rinsing. Results
were analysed (P≤0.05) using the statistical chart given by Larmond (1977). For 30
panellists, 16 correct answers were needed in order to reject the null hypothesis which
was “there is no difference between conventionally and organically grown bananas”.
Cranfield University at Silsoe September 2001
Laure Caussiol MSc by Research 46
Figure 4.3 Questionnaire for triangle test from Larmond (1977).
4.3 Results
4.3.1 Harvest A, week 04 (22-28/01/01)
There were strong significant differences (P≤0.05) for both length and diameter
between conventionally and organically grown banana fruit samples (Table 4.3).
There were significant differences (P≤0.05) between conventionally and organically
grown banana fruit on days 0, 2, 4, 6, 8, 10 and 12, days 0, 6, 8, 10 and 12, days 2 and
12, and days 10 and 12, for L* (Figure 4.4A), H° (Figure 4.4B), FW (Figure 4.4C)
and firmness (Figure 4.4D), respectively. L* increased between day 0 and day 6,
where the maximum L* was reached, and fell after day 6. L* was slightly higher for
conventionally grown fruit than for organically grown fruit. H° decreased markedly
from day 0 until day 6 and then continued to decrease at a slower rate until day 12. H°
was marginally lower for conventionally grown bananas on days 0 and 2, and slightly
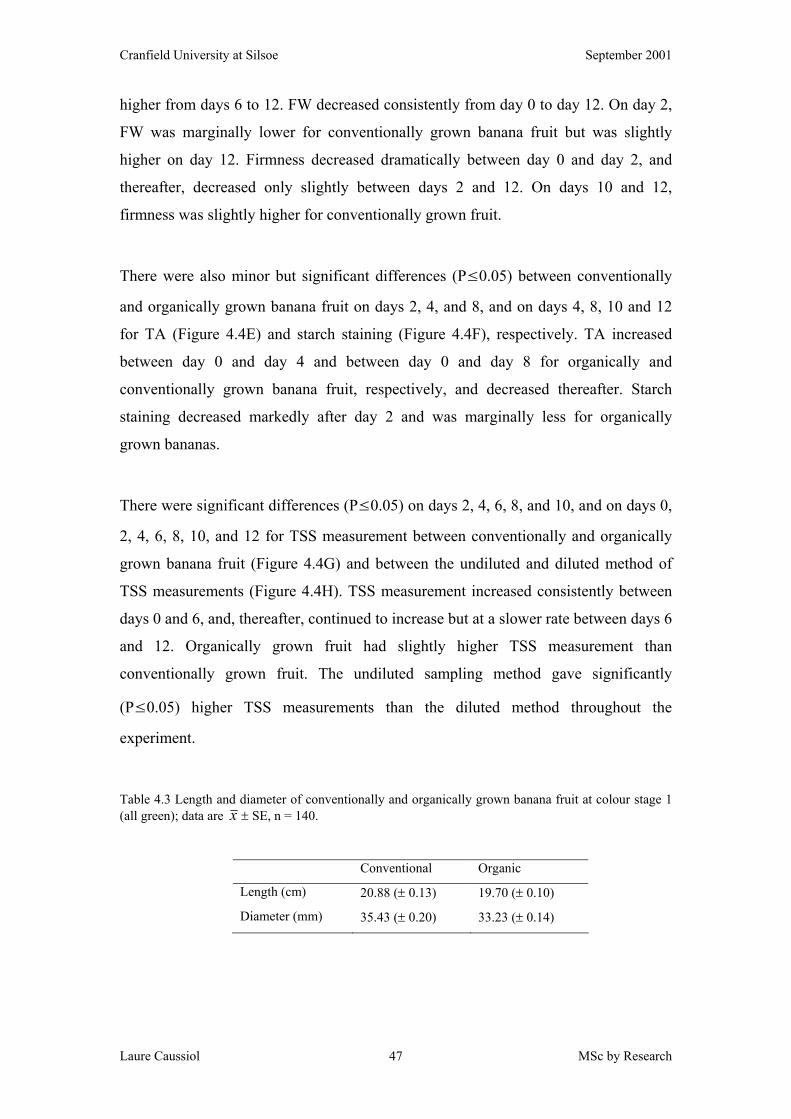
Cranfield University at Silsoe September 2001
Laure Caussiol MSc by Research 47
higher from days 6 to 12. FW decreased consistently from day 0 to day 12. On day 2,
FW was marginally lower for conventionally grown banana fruit but was slightly
higher on day 12. Firmness decreased dramatically between day 0 and day 2, and
thereafter, decreased only slightly between days 2 and 12. On days 10 and 12,
firmness was slightly higher for conventionally grown fruit.
There were also minor but significant differences (P≤0.05) between conventionally
and organically grown banana fruit on days 2, 4, and 8, and on days 4, 8, 10 and 12
for TA (Figure 4.4E) and starch staining (Figure 4.4F), respectively. TA increased
between day 0 and day 4 and between day 0 and day 8 for organically and
conventionally grown banana fruit, respectively, and decreased thereafter. Starch
staining decreased markedly after day 2 and was marginally less for organically
grown bananas.
There were significant differences (P≤0.05) on days 2, 4, 6, 8, and 10, and on days 0,
2, 4, 6, 8, 10, and 12 for TSS measurement between conventionally and organically
grown banana fruit (Figure 4.4G) and between the undiluted and diluted method of
TSS measurements (Figure 4.4H). TSS measurement increased consistently between
days 0 and 6, and, thereafter, continued to increase but at a slower rate between days 6
and 12. Organically grown fruit had slightly higher TSS measurement than
conventionally grown fruit. The undiluted sampling method gave significantly
(P≤0.05) higher TSS measurements than the diluted method throughout the
experiment.
Table 4.3 Length and diameter of conventionally and organically grown banana fruit at colour stage 1 (all green); data are x ± SE, n = 140.
Conventional Organic
Length (cm) 20.88 (± 0.13) 19.70 (± 0.10)
Diameter (mm) 35.43 (± 0.20) 33.23 (± 0.14)
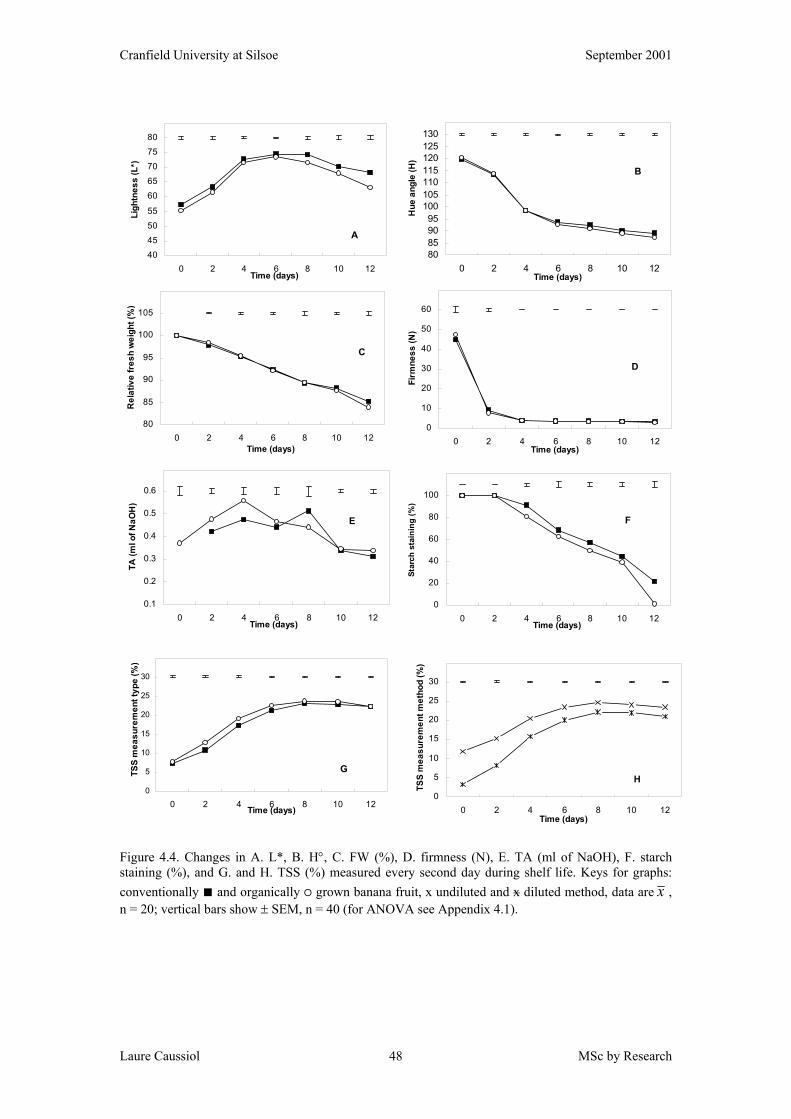
Cranfield University at Silsoe September 2001
Laure Caussiol MSc by Research 48
80
85
90
95
100
105
0 2 4 6 8 10 12Time (days)
Rel
ativ
e fr
esh
wei
ght (
%)
C
40
45
50
55
60
65
70
75
80
0 2 4 6 8 10 12Time (days)
Ligh
tnes
s (L
*)
A
80859095
100105110115120125130
0 2 4 6 8 10 12Time (days)
Hue
ang
le (H
)
B
0
10
20
30
40
50
60
0 2 4 6 8 10 12Time (days)
Firm
ness
(N)
D
0.1
0.2
0.3
0.4
0.5
0.6
0 2 4 6 8 10 12Time (days)
TA (m
l of N
aOH
)
E
0
20
40
60
80
100
0 2 4 6 8 10 12Time (days)
Star
ch s
tain
ing
(%)
F
0
5
10
15
20
25
30
0 2 4 6 8 10 12Time (days)
TSS
mea
sure
men
t typ
e (%
)
G
0
5
10
15
20
25
30
0 2 4 6 8 10 12Time (days)
TSS
mea
sure
men
t met
hod
(%)
H
Figure 4.4. Changes in A. L*, B. H°, C. FW (%), D. firmness (N), E. TA (ml of NaOH), F. starch staining (%), and G. and H. TSS (%) measured every second day during shelf life. Keys for graphs: conventionally ■ and organically ○ grown banana fruit, x undiluted and x diluted method, data are x , n = 20; vertical bars show ± SEM, n = 40 (for ANOVA see Appendix 4.1).
Cranfield University at Silsoe September 2001
Laure Caussiol MSc by Research 49
4.3.2 Harvest B, week 06 (05-11/02/01)
There were no significant differences for length and diameter between conventionally
and organically grown banana fruit (Table 4.4).
There were significant differences (P≤0.05) between conventionally and organically
grown banana fruit on days 6 and 12, and days 2, 4, 6, 8 and 10 for L* (Figure 4.5A),
and FW (Figure 4.5C) respectively. There were no significant differences (P≤0.05)
for H° (Figure 4.5B) and firmness (Figure 4.5D). L* increased between day 0 and day
4, where the maximum L* was reached. On day 6, conventionally grown bananas had
slightly lower L* than organically grown bananas. H° decreased markedly from day 0
until day 6, then continued to decrease but at a slower rate until day 12. FW decreased
consistently from day 0 to day 12. Conventionally grown bananas had slightly lower
FW than organically grown bananas. Firmness decreased dramatically between day 0
and 2, and decreased slightly between day 2 and 12.
There were significant differences (P≤0.05) between conventionally and organically
grown banana fruit on days 0, 2, and 6, and on day 12 for TA (Figure 4.5E) and starch
staining (Figure 4.5F), respectively. TA increased between days 0 and 4, decreased
between days 4 and 6, increased again between days 6 and 8, and then decreased
thereafter. Starch staining decreased markedly after day 2 and was marginally less for
conventionally grown bananas.
There were significant differences (P≤0.05) on day 12 throughout the experiment for
TSS measurement between conventionally and organically grown banana fruit (Figure
4.5G) and for between the undiluted and the diluted method (Figure 4.5H),
respectively. TSS measurement increased consistently between days 0 and 4, then
continued to increase but more slowly between days 4 and 10, and then decreased
slightly after day 10. The undiluted sampling method gave significant (P≤0.05)
higher TSS measurement than the diluted method.
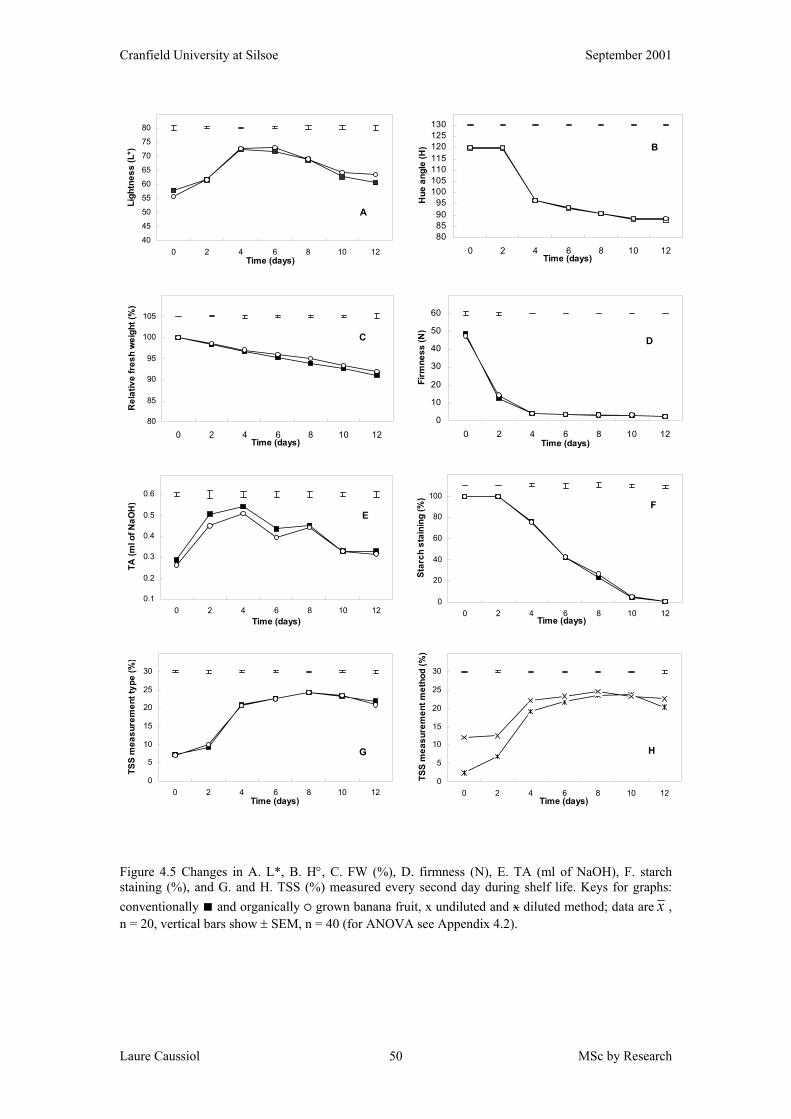
Cranfield University at Silsoe September 2001
Laure Caussiol MSc by Research 50
80
85
90
95
100
105
0 2 4 6 8 10 12Time (days)
Rel
ativ
e fr
esh
wei
ght (
%)
C
40
45
50
55
60
65
70
75
80
0 2 4 6 8 10 12Time (days)
Ligh
tnes
s (L
*)
A
80859095
100105110115120125130
0 2 4 6 8 10 12Time (days)
Hue
ang
le (H
) B
0
10
20
30
40
50
60
0 2 4 6 8 10 12Time (days)
Firm
ness
(N)
D
0.1
0.2
0.3
0.4
0.5
0.6
0 2 4 6 8 10 12Time (days)
TA (m
l of N
aOH
)
E
0
20
40
60
80
100
0 2 4 6 8 10 12Time (days)
Star
ch s
tain
ing
(%)
F
0
5
10
15
20
25
30
0 2 4 6 8 10 12Time (days)
TSS
mea
sure
men
t typ
e (%
)
G
0
5
10
15
20
25
30
0 2 4 6 8 10 12Time (days)
TSS
mea
sure
men
t met
hod
(%)
H
Figure 4.5 Changes in A. L*, B. H°, C. FW (%), D. firmness (N), E. TA (ml of NaOH), F. starch staining (%), and G. and H. TSS (%) measured every second day during shelf life. Keys for graphs: conventionally ■ and organically ○ grown banana fruit, x undiluted and x diluted method; data are x , n = 20, vertical bars show ± SEM, n = 40 (for ANOVA see Appendix 4.2).
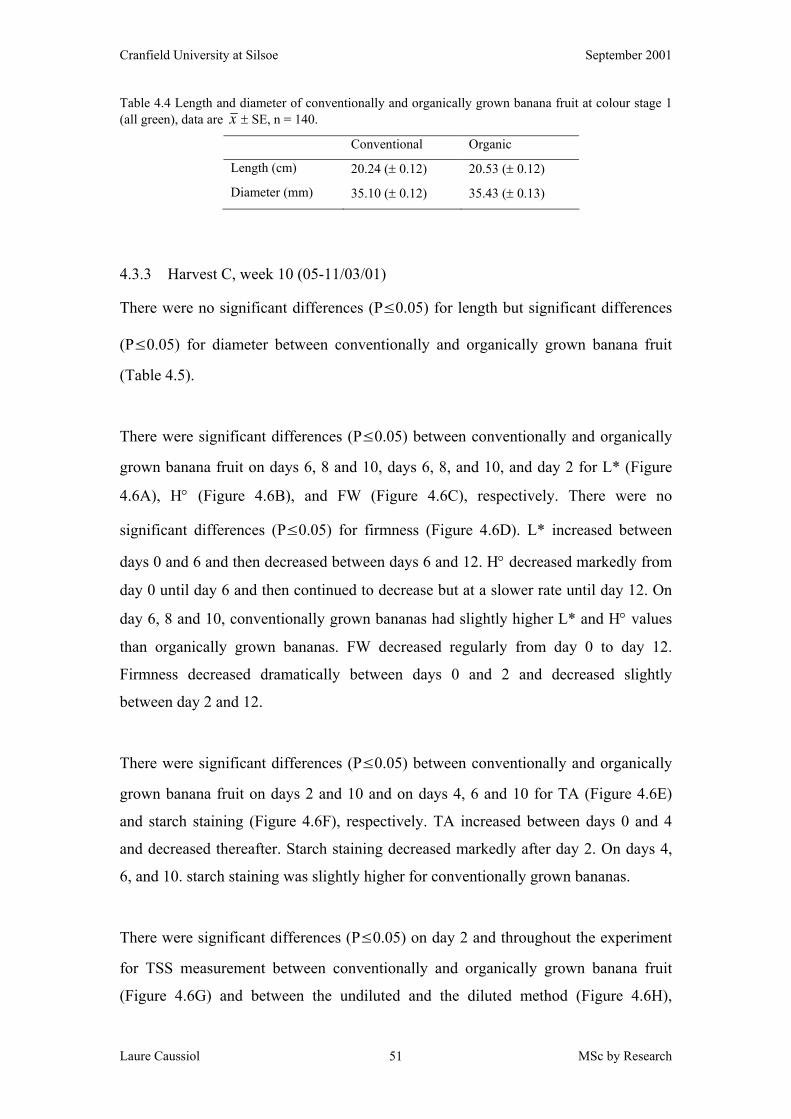
Cranfield University at Silsoe September 2001
Laure Caussiol MSc by Research 51
Table 4.4 Length and diameter of conventionally and organically grown banana fruit at colour stage 1 (all green), data are x ± SE, n = 140.
Conventional Organic
Length (cm) 20.24 (± 0.12) 20.53 (± 0.12)
Diameter (mm) 35.10 (± 0.12) 35.43 (± 0.13)
4.3.3 Harvest C, week 10 (05-11/03/01)
There were no significant differences (P≤0.05) for length but significant differences
(P≤0.05) for diameter between conventionally and organically grown banana fruit
(Table 4.5).
There were significant differences (P≤0.05) between conventionally and organically
grown banana fruit on days 6, 8 and 10, days 6, 8, and 10, and day 2 for L* (Figure
4.6A), H° (Figure 4.6B), and FW (Figure 4.6C), respectively. There were no
significant differences (P≤0.05) for firmness (Figure 4.6D). L* increased between
days 0 and 6 and then decreased between days 6 and 12. H° decreased markedly from
day 0 until day 6 and then continued to decrease but at a slower rate until day 12. On
day 6, 8 and 10, conventionally grown bananas had slightly higher L* and H° values
than organically grown bananas. FW decreased regularly from day 0 to day 12.
Firmness decreased dramatically between days 0 and 2 and decreased slightly
between day 2 and 12.
There were significant differences (P≤0.05) between conventionally and organically
grown banana fruit on days 2 and 10 and on days 4, 6 and 10 for TA (Figure 4.6E)
and starch staining (Figure 4.6F), respectively. TA increased between days 0 and 4
and decreased thereafter. Starch staining decreased markedly after day 2. On days 4,
6, and 10. starch staining was slightly higher for conventionally grown bananas.
There were significant differences (P≤0.05) on day 2 and throughout the experiment
for TSS measurement between conventionally and organically grown banana fruit
(Figure 4.6G) and between the undiluted and the diluted method (Figure 4.6H),
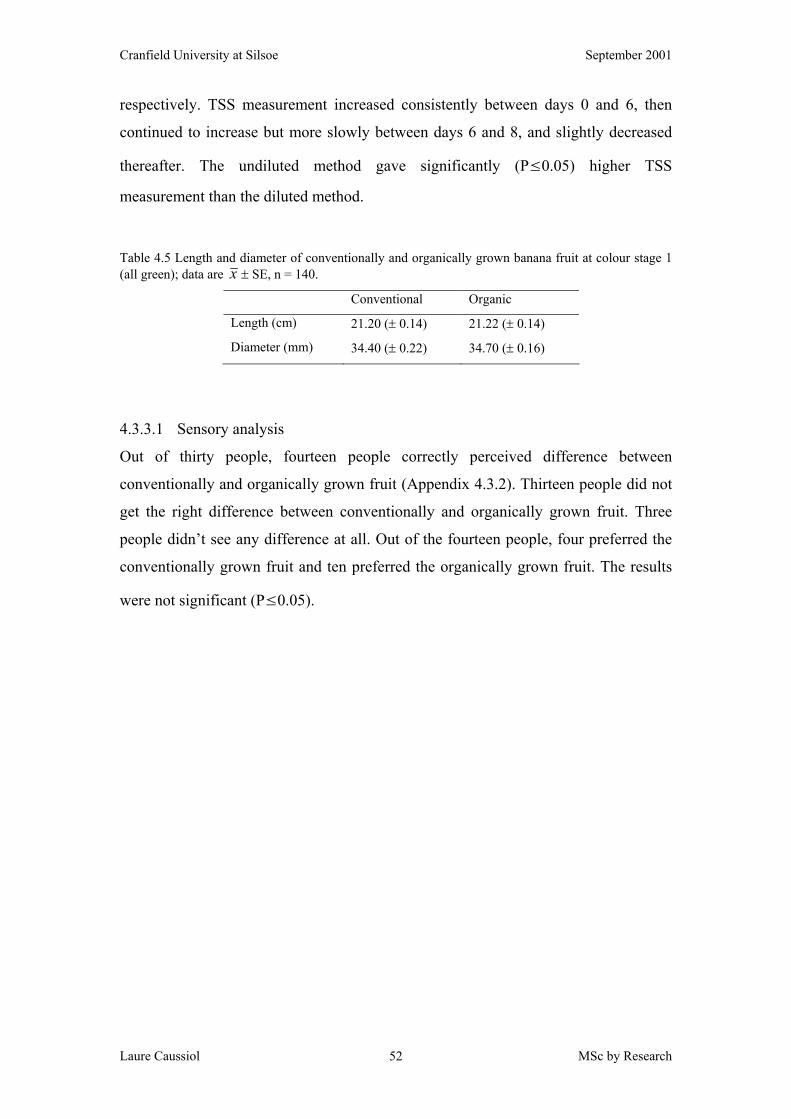
Cranfield University at Silsoe September 2001
Laure Caussiol MSc by Research 52
respectively. TSS measurement increased consistently between days 0 and 6, then
continued to increase but more slowly between days 6 and 8, and slightly decreased
thereafter. The undiluted method gave significantly (P≤0.05) higher TSS
measurement than the diluted method.
Table 4.5 Length and diameter of conventionally and organically grown banana fruit at colour stage 1 (all green); data are x ± SE, n = 140.
Conventional Organic
Length (cm) 21.20 (± 0.14) 21.22 (± 0.14)
Diameter (mm) 34.40 (± 0.22) 34.70 (± 0.16)
4.3.3.1 Sensory analysis
Out of thirty people, fourteen people correctly perceived difference between
conventionally and organically grown fruit (Appendix 4.3.2). Thirteen people did not
get the right difference between conventionally and organically grown fruit. Three
people didn’t see any difference at all. Out of the fourteen people, four preferred the
conventionally grown fruit and ten preferred the organically grown fruit. The results
were not significant (P≤0.05).
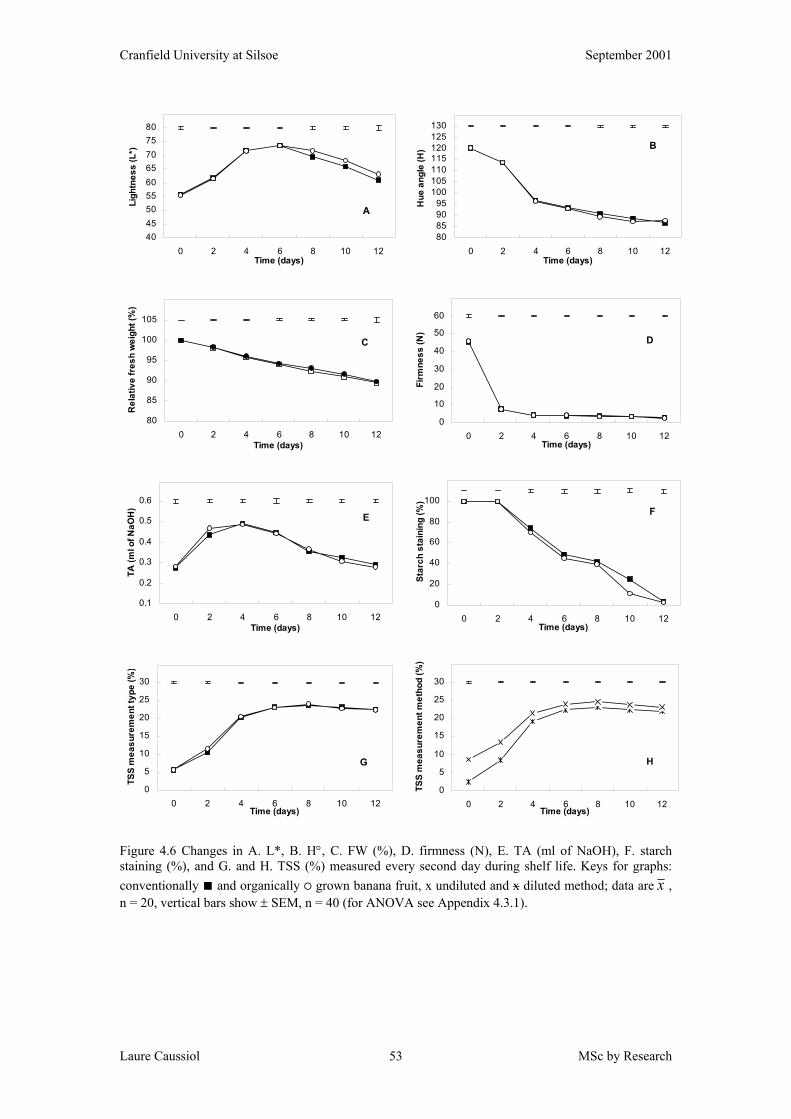
Cranfield University at Silsoe September 2001
Laure Caussiol MSc by Research 53
80
85
90
95
100
105
0 2 4 6 8 10 12Time (days)
Rel
ativ
e fr
esh
wei
ght (
%)
C
404550556065707580
0 2 4 6 8 10 12Time (days)
Ligh
tnes
s (L
*)
A
80859095
100105110115120125130
0 2 4 6 8 10 12Time (days)
Hue
ang
le (H
) B
0
10
20
30
40
50
60
0 2 4 6 8 10 12Time (days)
Firm
ness
(N)
D
0.1
0.2
0.3
0.4
0.5
0.6
0 2 4 6 8 10 12Time (days)
TA (m
l of N
aOH
)
E
0
20
40
60
80
100
0 2 4 6 8 10 12Time (days)
Star
ch s
tain
ing
(%)
F
0
5
10
15
20
25
30
0 2 4 6 8 10 12Time (days)
TSS
mea
sure
men
t typ
e (%
)
G
0
5
10
15
20
25
30
0 2 4 6 8 10 12Time (days)
TSS
mea
sure
men
t met
hod
(%)
H
Figure 4.6 Changes in A. L*, B. H°, C. FW (%), D. firmness (N), E. TA (ml of NaOH), F. starch staining (%), and G. and H. TSS (%) measured every second day during shelf life. Keys for graphs: conventionally ■ and organically ○ grown banana fruit, x undiluted and x diluted method; data are x , n = 20, vertical bars show ± SEM, n = 40 (for ANOVA see Appendix 4.3.1).
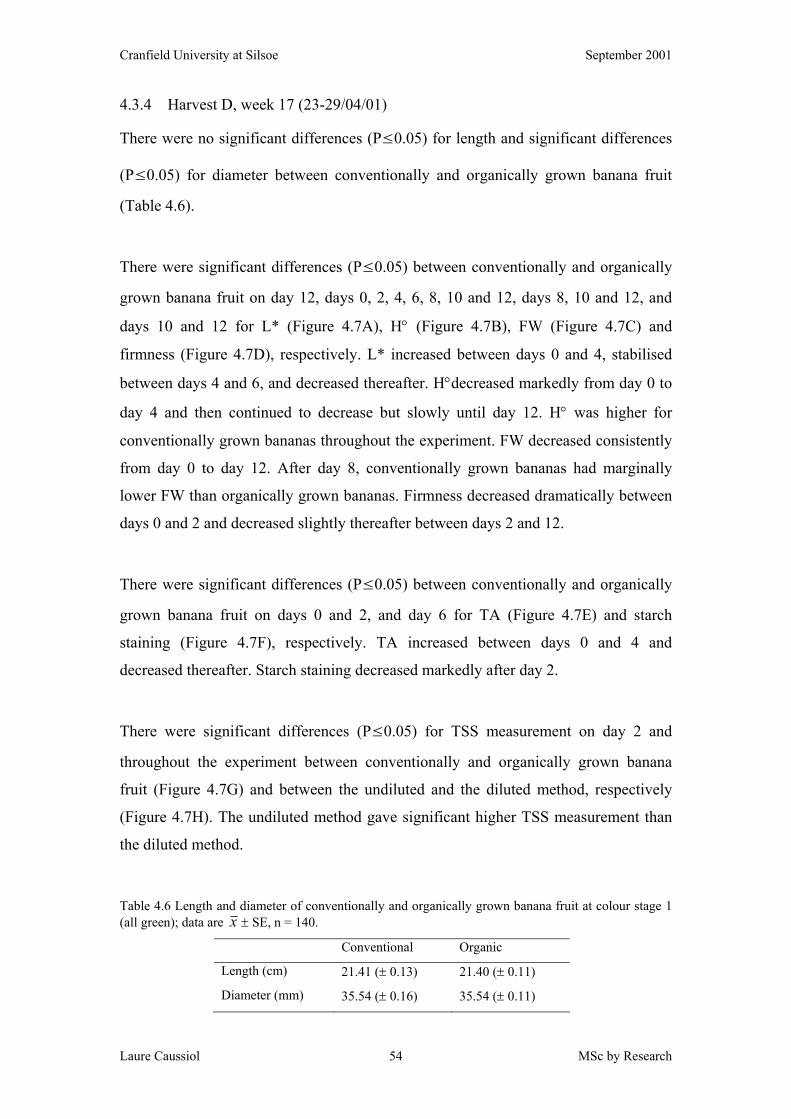
Cranfield University at Silsoe September 2001
Laure Caussiol MSc by Research 54
4.3.4 Harvest D, week 17 (23-29/04/01)
There were no significant differences (P≤0.05) for length and significant differences
(P≤0.05) for diameter between conventionally and organically grown banana fruit
(Table 4.6).
There were significant differences (P≤0.05) between conventionally and organically
grown banana fruit on day 12, days 0, 2, 4, 6, 8, 10 and 12, days 8, 10 and 12, and
days 10 and 12 for L* (Figure 4.7A), H° (Figure 4.7B), FW (Figure 4.7C) and
firmness (Figure 4.7D), respectively. L* increased between days 0 and 4, stabilised
between days 4 and 6, and decreased thereafter. H°decreased markedly from day 0 to
day 4 and then continued to decrease but slowly until day 12. H° was higher for
conventionally grown bananas throughout the experiment. FW decreased consistently
from day 0 to day 12. After day 8, conventionally grown bananas had marginally
lower FW than organically grown bananas. Firmness decreased dramatically between
days 0 and 2 and decreased slightly thereafter between days 2 and 12.
There were significant differences (P≤0.05) between conventionally and organically
grown banana fruit on days 0 and 2, and day 6 for TA (Figure 4.7E) and starch
staining (Figure 4.7F), respectively. TA increased between days 0 and 4 and
decreased thereafter. Starch staining decreased markedly after day 2.
There were significant differences (P≤0.05) for TSS measurement on day 2 and
throughout the experiment between conventionally and organically grown banana
fruit (Figure 4.7G) and between the undiluted and the diluted method, respectively
(Figure 4.7H). The undiluted method gave significant higher TSS measurement than
the diluted method.
Table 4.6 Length and diameter of conventionally and organically grown banana fruit at colour stage 1 (all green); data are x ± SE, n = 140.
Conventional Organic
Length (cm) 21.41 (± 0.13) 21.40 (± 0.11)
Diameter (mm) 35.54 (± 0.16) 35.54 (± 0.11)
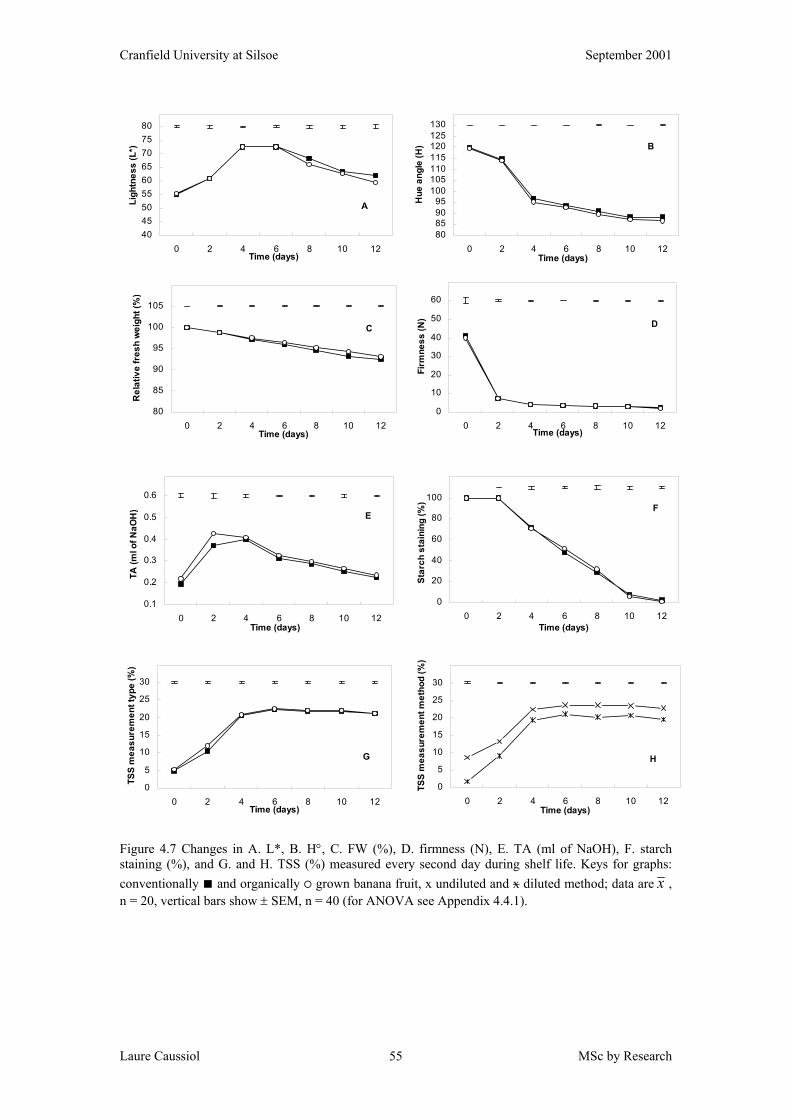
Cranfield University at Silsoe September 2001
Laure Caussiol MSc by Research 55
80
85
90
95
100
105
0 2 4 6 8 10 12Time (days)
Rel
ativ
e fr
esh
wei
ght (
%)
C
404550556065707580
0 2 4 6 8 10 12Time (days)
Ligh
tnes
s (L
*)
A
80859095
100105110115120125130
0 2 4 6 8 10 12Time (days)
Hue
ang
le (H
) B
0
10
20
30
40
50
60
0 2 4 6 8 10 12Time (days)
Firm
ness
(N) D
0.1
0.2
0.3
0.4
0.5
0.6
0 2 4 6 8 10 12Time (days)
TA (m
l of N
aOH
) E
0
20
40
60
80
100
0 2 4 6 8 10 12Time (days)
Star
ch s
tain
ing
(%) F
0
5
10
15
20
25
30
0 2 4 6 8 10 12Time (days)
TSS
mea
sure
men
t typ
e (%
)
G
0
5
10
15
20
25
30
0 2 4 6 8 10 12Time (days)
TSS
mea
sure
men
t met
hod
(%)
H
Figure 4.7 Changes in A. L*, B. H°, C. FW (%), D. firmness (N), E. TA (ml of NaOH), F. starch staining (%), and G. and H. TSS (%) measured every second day during shelf life. Keys for graphs: conventionally ■ and organically ○ grown banana fruit, x undiluted and x diluted method; data are x , n = 20, vertical bars show ± SEM, n = 40 (for ANOVA see Appendix 4.4.1).
Cranfield University at Silsoe September 2001
Laure Caussiol MSc by Research 56
4.3.4.1 Sensory analysis
Out of thirty people, eighteen people correctly perceived difference between
conventionally and organically grown fruit (Appendix 4.4.2). Thirteen did not get the
right difference between conventionally and organically grown fruit. Out of the
eighteen people, ten preferred the conventionally grown fruit and eight preferred the
organically grown fruit. The result was significant (P≤0.05).
4.3.5 Harvest E, week 20 (14-20/05/01)
There were no significant differences (P≤0.05) for length and significant differences
(P≤0.05) for diameter between conventionally and organically grown banana fruit
(Table 4.7).
There were significant differences (P≤0.05) between conventionally and organically
grown banana fruit on days 2, 4, 8, and 12, days 2, 4, 6, 8, and 12, day 4, 6, 8, 10 and
12, and day 8, 10 and 12 for L* (Figure 4.8A), H° (Figure 4.8B), FW (Figure 4.8C)
and firmness (Figure 4.8D), respectively. L* increased between days 0 and 4, lowered
between days 4 and 10 and increased again after day 10. On days 2 and 4, then on
days 8 and 12, conventionally grown bananas had slightly lower and slightly higher,
respectively, L* values than organically grown bananas. H° decreased a lot between
days 0 and 4 then continued to decrease but at a slower rate until day 12. FW
decreased consistently from day 0 to day 12.
Firmness decreased dramatically between day 0 and 2 and decreased slightly between
day 2 and 12. Conventionally grown bananas had slightly higher H° and slightly
lower FW than organically grown bananas.
There were significant differences (P≤0.05) between conventionally and organically
grown banana fruit on day 0, and no significant differences (P≤0.05) for TA (Figure
4.8E) and starch staining (Figure 4.8F), respectively. TA increased slightly between
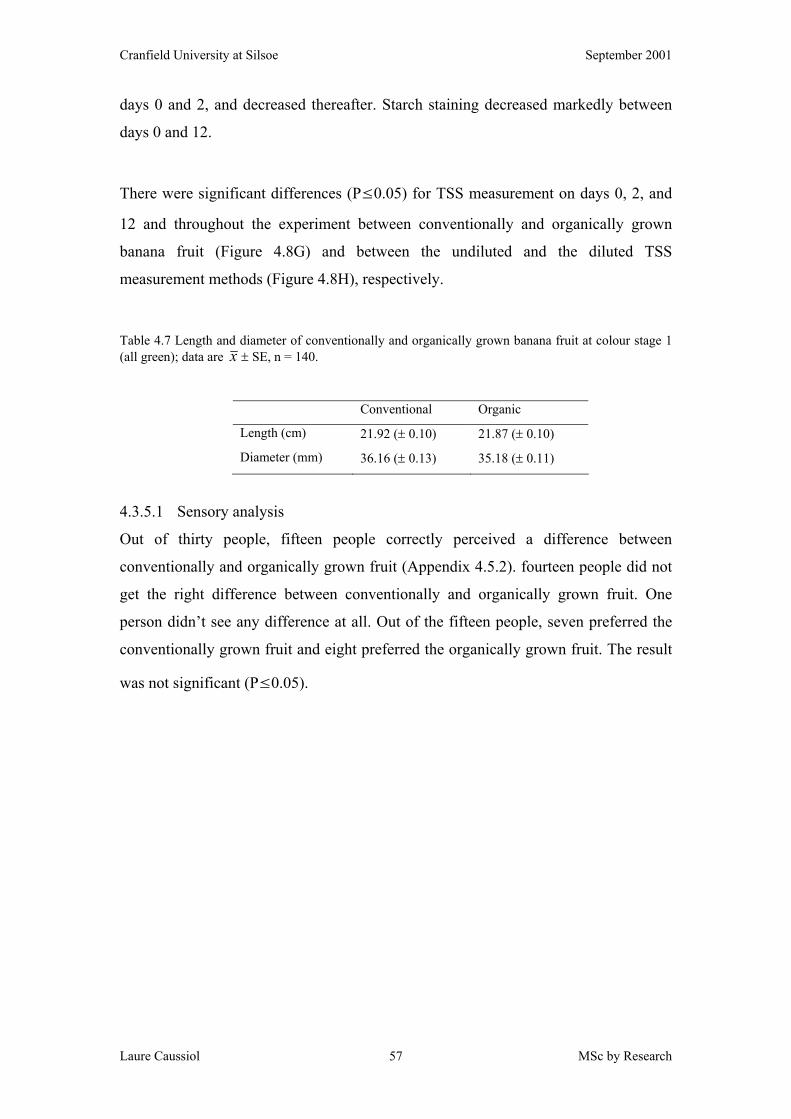
Cranfield University at Silsoe September 2001
Laure Caussiol MSc by Research 57
days 0 and 2, and decreased thereafter. Starch staining decreased markedly between
days 0 and 12.
There were significant differences (P≤0.05) for TSS measurement on days 0, 2, and
12 and throughout the experiment between conventionally and organically grown
banana fruit (Figure 4.8G) and between the undiluted and the diluted TSS
measurement methods (Figure 4.8H), respectively.
Table 4.7 Length and diameter of conventionally and organically grown banana fruit at colour stage 1 (all green); data are x ± SE, n = 140.
Conventional Organic
Length (cm) 21.92 (± 0.10) 21.87 (± 0.10)
Diameter (mm) 36.16 (± 0.13) 35.18 (± 0.11)
4.3.5.1 Sensory analysis
Out of thirty people, fifteen people correctly perceived a difference between
conventionally and organically grown fruit (Appendix 4.5.2). fourteen people did not
get the right difference between conventionally and organically grown fruit. One
person didn’t see any difference at all. Out of the fifteen people, seven preferred the
conventionally grown fruit and eight preferred the organically grown fruit. The result
was not significant (P≤0.05).
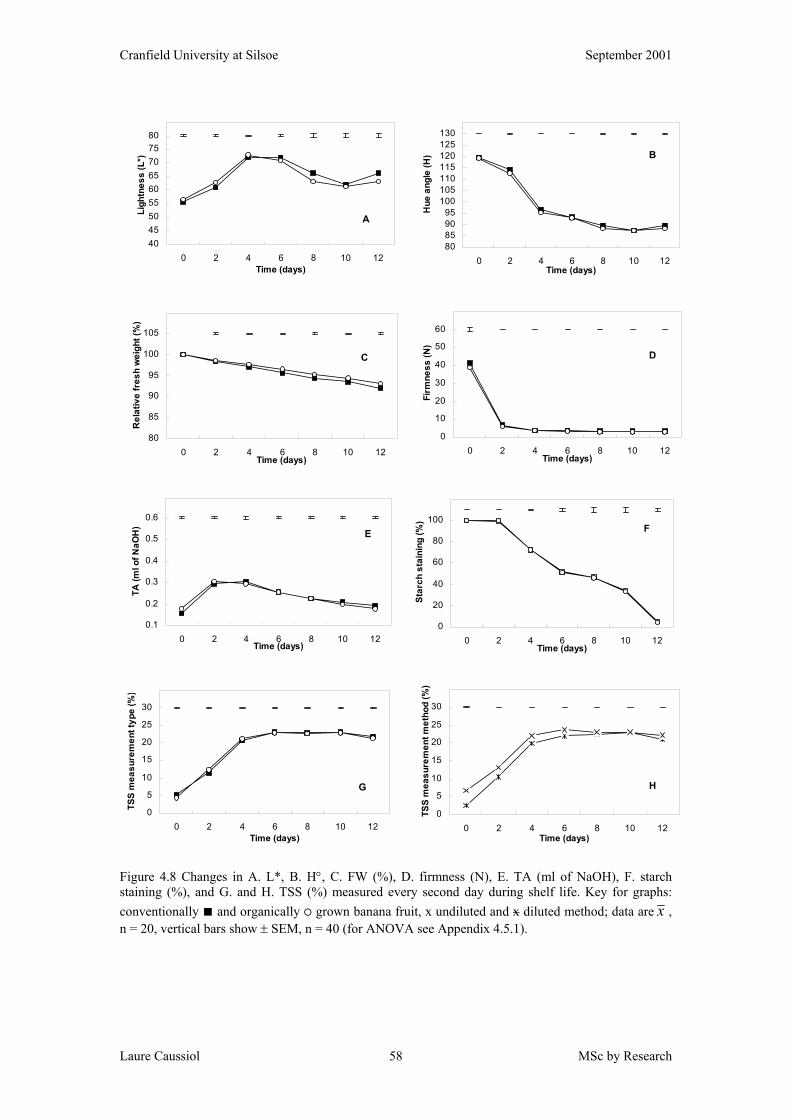
Cranfield University at Silsoe September 2001
Laure Caussiol MSc by Research 58
80
85
90
95
100
105
0 2 4 6 8 10 12Time (days)
Rel
ativ
e fr
esh
wei
ght (
%)
C
404550556065707580
0 2 4 6 8 10 12Time (days)
Ligh
tnes
s (L
*)
A
80859095
100105110115120125130
0 2 4 6 8 10 12Time (days)
Hue
ang
le (H
) B
0
10
20
30
40
50
60
0 2 4 6 8 10 12Time (days)
Firm
ness
(N)
D
0.1
0.2
0.3
0.4
0.5
0.6
0 2 4 6 8 10 12Time (days)
TA (m
l of N
aOH
)
E
0
20
40
60
80
100
0 2 4 6 8 10 12Time (days)
Star
ch s
tain
ing
(%)
F
0
5
10
15
20
25
30
0 2 4 6 8 10 12Time (days)
TSS
mea
sure
men
t typ
e (%
)
G
0
5
10
15
20
25
30
0 2 4 6 8 10 12Time (days)
TSS
mea
sure
men
t met
hod
(%)
H
Figure 4.8 Changes in A. L*, B. H°, C. FW (%), D. firmness (N), E. TA (ml of NaOH), F. starch staining (%), and G. and H. TSS (%) measured every second day during shelf life. Key for graphs: conventionally ■ and organically ○ grown banana fruit, x undiluted and x diluted method; data are x , n = 20, vertical bars show ± SEM, n = 40 (for ANOVA see Appendix 4.5.1).
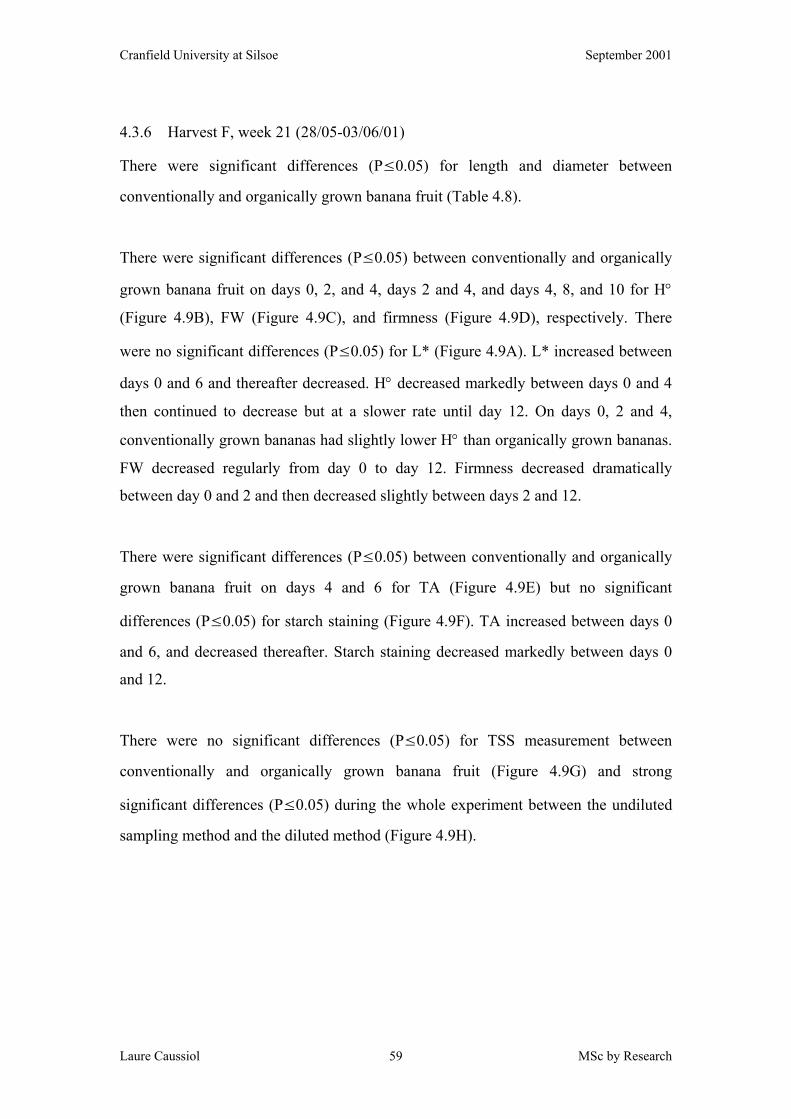
Cranfield University at Silsoe September 2001
Laure Caussiol MSc by Research 59
4.3.6 Harvest F, week 21 (28/05-03/06/01)
There were significant differences (P≤0.05) for length and diameter between
conventionally and organically grown banana fruit (Table 4.8).
There were significant differences (P≤0.05) between conventionally and organically
grown banana fruit on days 0, 2, and 4, days 2 and 4, and days 4, 8, and 10 for H°
(Figure 4.9B), FW (Figure 4.9C), and firmness (Figure 4.9D), respectively. There
were no significant differences (P≤0.05) for L* (Figure 4.9A). L* increased between
days 0 and 6 and thereafter decreased. H° decreased markedly between days 0 and 4
then continued to decrease but at a slower rate until day 12. On days 0, 2 and 4,
conventionally grown bananas had slightly lower H° than organically grown bananas.
FW decreased regularly from day 0 to day 12. Firmness decreased dramatically
between day 0 and 2 and then decreased slightly between days 2 and 12.
There were significant differences (P≤0.05) between conventionally and organically
grown banana fruit on days 4 and 6 for TA (Figure 4.9E) but no significant
differences (P≤0.05) for starch staining (Figure 4.9F). TA increased between days 0
and 6, and decreased thereafter. Starch staining decreased markedly between days 0
and 12.
There were no significant differences (P≤0.05) for TSS measurement between
conventionally and organically grown banana fruit (Figure 4.9G) and strong
significant differences (P≤0.05) during the whole experiment between the undiluted
sampling method and the diluted method (Figure 4.9H).
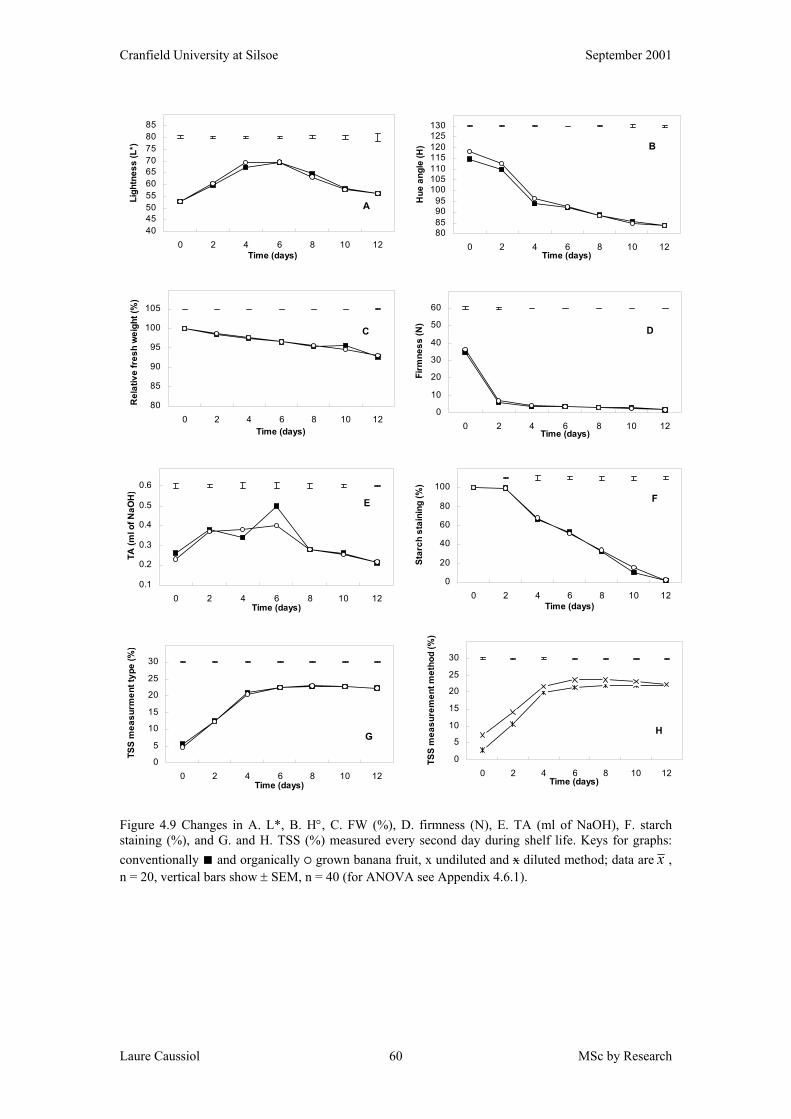
Cranfield University at Silsoe September 2001
Laure Caussiol MSc by Research 60
80
85
90
95
100
105
0 2 4 6 8 10 12Time (days)
Rel
ativ
e fr
esh
wei
ght (
%)
C
40455055606570758085
0 2 4 6 8 10 12Time (days)
Ligh
tnes
s (L
*)
A
80859095
100105110115120125130
0 2 4 6 8 10 12Time (days)
Hue
ang
le (H
) B
0
10
20
30
40
50
60
0 2 4 6 8 10 12Time (days)
Firm
ness
(N)
D
0.1
0.2
0.3
0.4
0.5
0.6
0 2 4 6 8 10 12Time (days)
TA (m
l of N
aOH
)
E
0
20
40
60
80
100
0 2 4 6 8 10 12Time (days)
Star
ch s
tain
ing
(%)
F
0
5
10
15
20
25
30
0 2 4 6 8 10 12Time (days)
TSS
mea
surm
ent t
ype
(%)
G
0
5
10
15
20
25
30
0 2 4 6 8 10 12Time (days)
TSS
mea
sure
men
t met
hod
(%)
H
Figure 4.9 Changes in A. L*, B. H°, C. FW (%), D. firmness (N), E. TA (ml of NaOH), F. starch staining (%), and G. and H. TSS (%) measured every second day during shelf life. Keys for graphs: conventionally ■ and organically ○ grown banana fruit, x undiluted and x diluted method; data are x , n = 20, vertical bars show ± SEM, n = 40 (for ANOVA see Appendix 4.6.1).
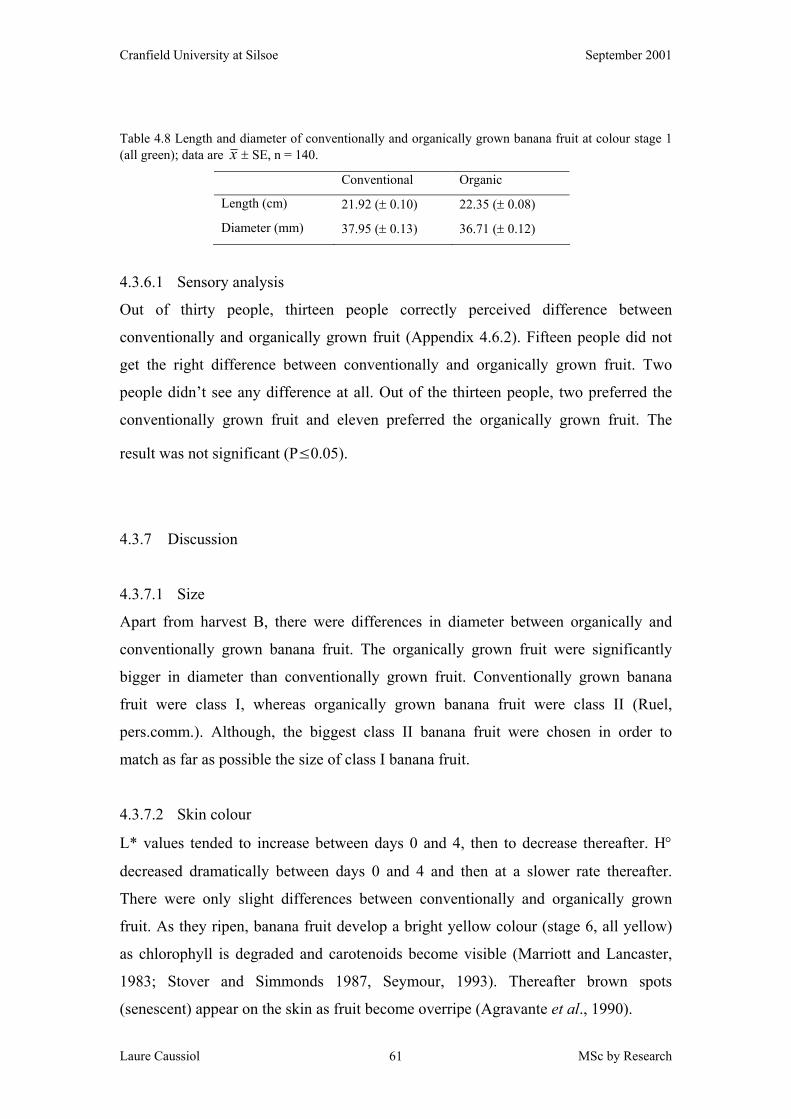
Cranfield University at Silsoe September 2001
Laure Caussiol MSc by Research 61
Table 4.8 Length and diameter of conventionally and organically grown banana fruit at colour stage 1 (all green); data are x ± SE, n = 140.
Conventional Organic
Length (cm) 21.92 (± 0.10) 22.35 (± 0.08)
Diameter (mm) 37.95 (± 0.13) 36.71 (± 0.12)
4.3.6.1 Sensory analysis
Out of thirty people, thirteen people correctly perceived difference between
conventionally and organically grown fruit (Appendix 4.6.2). Fifteen people did not
get the right difference between conventionally and organically grown fruit. Two
people didn’t see any difference at all. Out of the thirteen people, two preferred the
conventionally grown fruit and eleven preferred the organically grown fruit. The
result was not significant (P≤0.05).
4.3.7 Discussion
4.3.7.1 Size
Apart from harvest B, there were differences in diameter between organically and
conventionally grown banana fruit. The organically grown fruit were significantly
bigger in diameter than conventionally grown fruit. Conventionally grown banana
fruit were class I, whereas organically grown banana fruit were class II (Ruel,
pers.comm.). Although, the biggest class II banana fruit were chosen in order to
match as far as possible the size of class I banana fruit.
4.3.7.2 Skin colour
L* values tended to increase between days 0 and 4, then to decrease thereafter. H°
decreased dramatically between days 0 and 4 and then at a slower rate thereafter.
There were only slight differences between conventionally and organically grown
fruit. As they ripen, banana fruit develop a bright yellow colour (stage 6, all yellow)
as chlorophyll is degraded and carotenoids become visible (Marriott and Lancaster,
1983; Stover and Simmonds 1987, Seymour, 1993). Thereafter brown spots
(senescent) appear on the skin as fruit become overripe (Agravante et al., 1990).
Cranfield University at Silsoe September 2001
Laure Caussiol MSc by Research 62
4.3.7.3 Relative fresh weight
FW decreased consistently throughout the experiment from 100% on day 0 to about
90% on day 12. There were only marginal differences between conventionally and
organically grown fruit. Banana fruit loose moisture from the peel and the pulp due to
respiration and transpiration and (Stover and Simmonds, 1987).
4.3.7.4 Pulp firmness
Firmness decreased dramatically between days 0 and 2 and then continued to decrease
at a slower rate thereafter. There were very slight differences between conventionally
and organically grown fruit. This rapid softening corresponds to an interconversion of
pectic substances (Marriott and Lancaster, 1993).
4.3.7.5 Titratable acidity
TA showed an inconsistent pattern of increase and decrease. There was very little
difference between conventionally and organically grown fruit. TA increased as the
banana fruit ripened and then decreased, as the fruit became overripe. Sanchez et al.
(undated) also found this pattern during ripening of Montecristo banana where acidity
increased during the first six days after ripening and decreased thereafter.
4.3.7.6 Starch staining
Starch staining tended to decrease consistently from 100% on day 0 to almost nil on
day 12. There were only slight differences between conventionally and organically
grown fruit. During the preclimacteric, starch content is evident (Cordenunsi and
Lajolo, 1995). The rate of degradation is slow initially and then increases as the
banana ripen and then during the postclimacteric, no starch is detected any more
(Garcia and Lajolo, 1988).
4.3.7.7 TSS
TSS measurements always increased consistently between days 0 and 6. After this
time tended to stabilise and even to decrease towards days 10 and 12. Increase of TSS
is an important characteristic of hydrolysis of starch into soluble sugars such as
sucrose, glucose and fructose (Lizana, 1976; Marriott et al., 1981; Kanellis et al.,
1989; Agravante et al., 1990; Chang and Hwang, 1990; Cordenunsi and Lajolo,
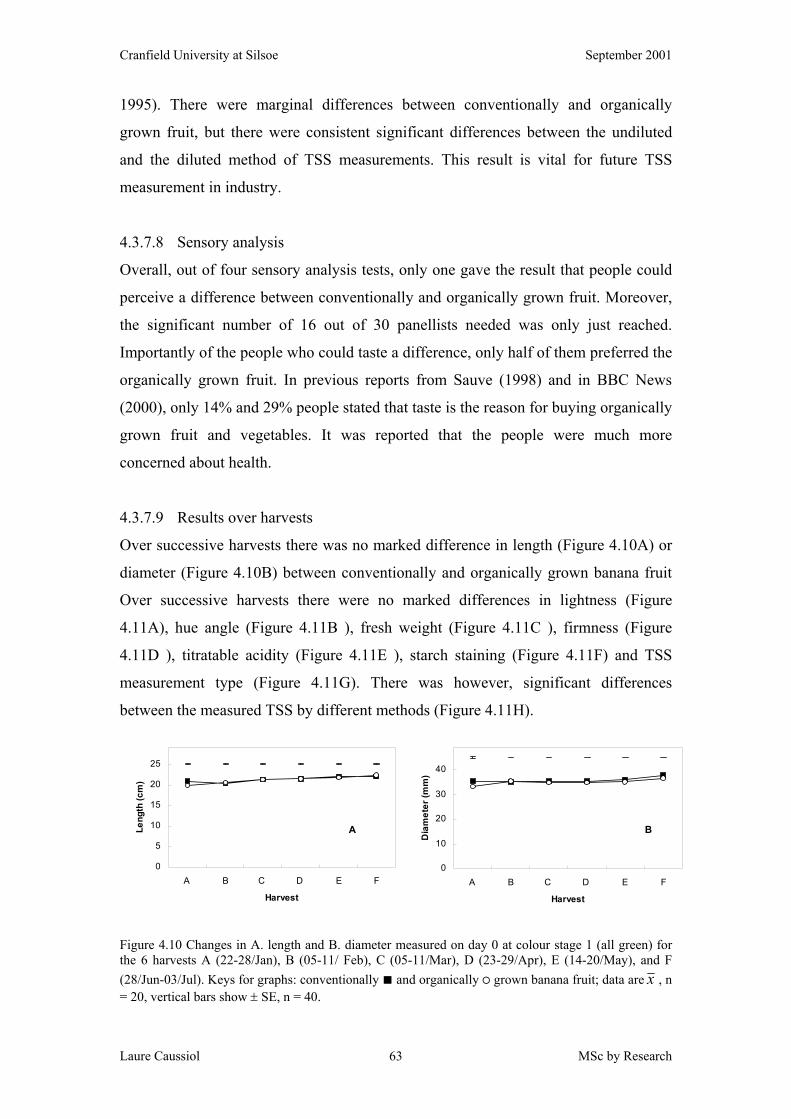
Cranfield University at Silsoe September 2001
Laure Caussiol MSc by Research 63
1995). There were marginal differences between conventionally and organically
grown fruit, but there were consistent significant differences between the undiluted
and the diluted method of TSS measurements. This result is vital for future TSS
measurement in industry.
4.3.7.8 Sensory analysis
Overall, out of four sensory analysis tests, only one gave the result that people could
perceive a difference between conventionally and organically grown fruit. Moreover,
the significant number of 16 out of 30 panellists needed was only just reached.
Importantly of the people who could taste a difference, only half of them preferred the
organically grown fruit. In previous reports from Sauve (1998) and in BBC News
(2000), only 14% and 29% people stated that taste is the reason for buying organically
grown fruit and vegetables. It was reported that the people were much more
concerned about health.
4.3.7.9 Results over harvests
Over successive harvests there was no marked difference in length (Figure 4.10A) or
diameter (Figure 4.10B) between conventionally and organically grown banana fruit
Over successive harvests there were no marked differences in lightness (Figure
4.11A), hue angle (Figure 4.11B ), fresh weight (Figure 4.11C ), firmness (Figure
4.11D ), titratable acidity (Figure 4.11E ), starch staining (Figure 4.11F) and TSS
measurement type (Figure 4.11G). There was however, significant differences
between the measured TSS by different methods (Figure 4.11H).
0
5
10
15
20
25
A B C D E F
Harvest
Leng
th (c
m)
A
0
10
20
30
40
A B C D E F
Harvest
Dia
met
er (m
m)
B
Figure 4.10 Changes in A. length and B. diameter measured on day 0 at colour stage 1 (all green) for the 6 harvests A (22-28/Jan), B (05-11/ Feb), C (05-11/Mar), D (23-29/Apr), E (14-20/May), and F (28/Jun-03/Jul). Keys for graphs: conventionally ■ and organically ○ grown banana fruit; data are x , n = 20, vertical bars show ± SE, n = 40.
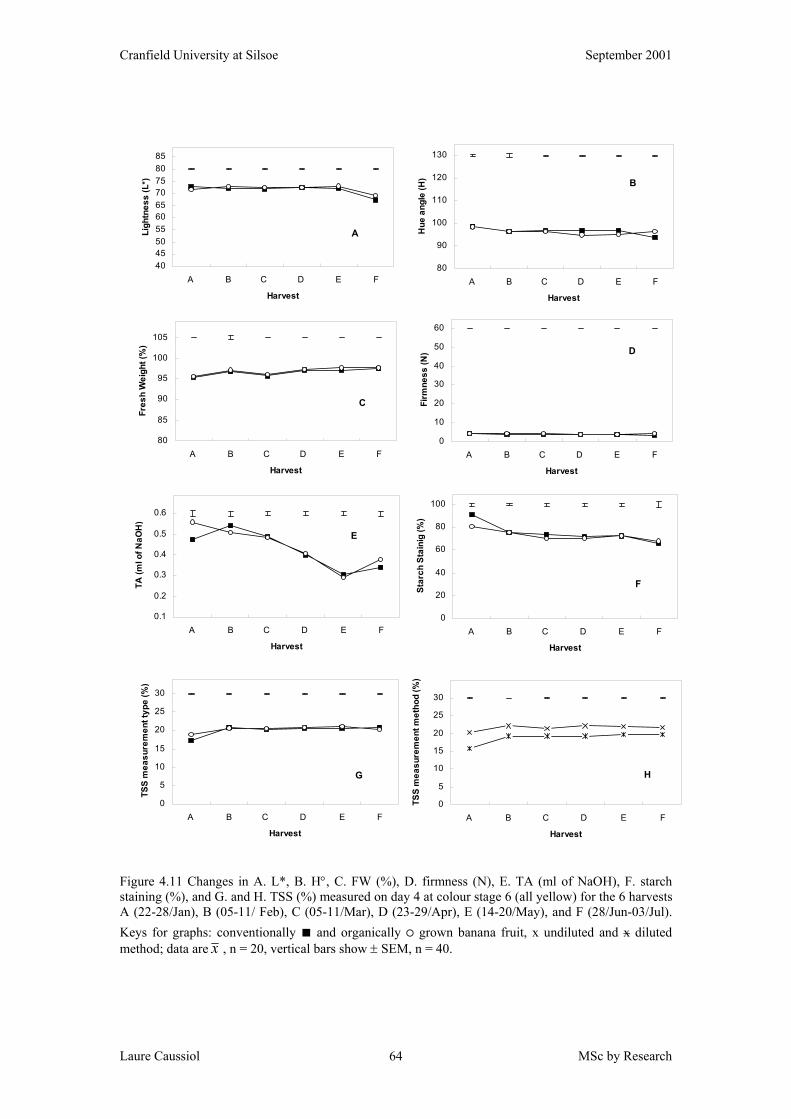
Cranfield University at Silsoe September 2001
Laure Caussiol MSc by Research 64
80
85
90
95
100
105
A B C D E F
Harvest
Fres
h W
eigh
t (%
)
C
40455055606570758085
A B C D E F
Harvest
Ligh
tnes
s (L
*)
A
80
90
100
110
120
130
A B C D E F
Harvest
Hue
ang
le (H
) B
0
10
20
30
40
50
60
A B C D E F
Harvest
Firm
ness
(N) D
0.1
0.2
0.3
0.4
0.5
0.6
A B C D E F
Harvest
TA (m
l of N
aOH
)
E
0
20
40
60
80
100
A B C D E F
Harvest
Star
ch S
tain
ig (%
)
F
0
5
10
15
20
25
30
A B C D E F
Harvest
TSS
mea
sure
men
t met
hod
(%)
H
0
5
10
15
20
25
30
A B C D E F
Harvest
TSS
mea
sure
men
t typ
e (%
)
G
Figure 4.11 Changes in A. L*, B. H°, C. FW (%), D. firmness (N), E. TA (ml of NaOH), F. starch staining (%), and G. and H. TSS (%) measured on day 4 at colour stage 6 (all yellow) for the 6 harvests A (22-28/Jan), B (05-11/ Feb), C (05-11/Mar), D (23-29/Apr), E (14-20/May), and F (28/Jun-03/Jul). Keys for graphs: conventionally ■ and organically ○ grown banana fruit, x undiluted and x diluted method; data are x , n = 20, vertical bars show ± SEM, n = 40.
Cranfield University at Silsoe September 2001
Laure Caussiol MSc by Research 65
4.3.7.10 Conclusions
There were no consistent significant differences in quality attributes between
conventionally and organically grown fruit from the same area in the Dominican
Republic. There was however, strong significant difference between methods for TSS
measurements. The undiluted method is inappropriate for TSS measurement on
banana fruit.
Cranfield University at Silsoe September 2001
Laure Caussiol MSc by Research 66
5 General discussion
There were significant differences (P≤0.05) in size between the two lots of
conventionally grown fruit from Costa Rica and organically grown fruit from the
Dominican Republic. However, this difference was because of their class difference
and does not reflect plantation management practices. Conventionally grown fruit
were class I as opposed to organically grown fruit, which are always class II (Ruel,
pers. comm.).
L* values of fruit skin increased until colour stage 6 (full yellow) and decreased
thereafter (Figures 3.6A, 4.4A, 4.5A, 4.6A, 4.7A, 4.8A, and 4.9A). H° decreased
markedly until fruit reached colour stage 6 (full yellow), and then continued to
decrease at a slower rate (Figures 3.6B, 4.4B, 4.5B, 4.6B, 4.7B, 4.8B, and 4.9B). The
colour stage changes are due to the breakdown of chlorophyll and the appearance of
carotenoids that occur during ripening (Marriott and Lancaster, 1983; Stover and
Simmonds, 1987, Seymour, 1993).
FW decreased consistently over the experimental period of 12 days. This was possibly
due to loss of moisture from the pulp and the peel as reported by Stover and
Simmonds (1987) (Figures 3.6C, 4.4C, 4.5C, 4.6C, 4.7C, 4.8C, and 4.9C). Firmness
decreased dramatically during the early colour change period and then decreased at a
very low rate thereafter (Figures 4.4D, 4.5D, 4.6D, 4.7D, 4.8D, and 4.9D). This
decline corresponds to tissue softening by pectin solubilisation in cell wall that occurs
during banana fruit ripening (Hultin and Levine, 1963, Smith et al., 1990).
TA tended to increase during ripening and decrease thereafter (Figures 3.7A, 3.7B,
4.4E, 4.5E, 4.6E, 4.7E, 4.8E, and 4.9E). However, this pattern of change was not
consistent between experiments. The ripening banana can show an increase in acidity
that may be due to the increase in malic acid (John and Marchal, 1995).
Starch staining decreased markedly during shelf life (3.7C, 3.7D, 4.4F, 4.5F, 4.6F,
4.7F, 4.8F, and 4.9F). This depicts one of the most important change that occurs
during banana ripening, the hydrolysis of starch into sugar (Marriott et al., 1981;
Cranfield University at Silsoe September 2001
Laure Caussiol MSc by Research 67
Garcia and Lajolo, 1988; Agravante et al., 1990, Chang and Hwang, 1990; Prahba and
Bhagylaksmi, 1998) and as well as can conversion of carbohydrate to CO2 by the
process of respiration (Marriott et al., 1981). The pulp starch content can drop from
25% in the preclimacteric phase to less than 1% during the climacteric period
(Cordenunsi and Lajolo, 1995). TSS increased markedly during ripening, this being
mainly the result of hydrolysis of starch by amylase and glucosidase into sugars
(Garcia and Lajolo, 1988; Agravante et al., 1990; Nascimento et al., 1997). Soluble
sugars, synthesised by SPS and SS in banana fruit are mainly comprised of sucrose,
glucose and fructose (Lizana, 1976; Marriott et al., 1981; Kanellis et al., 1989;
Agravante et al., 1990; Chang and Hwang, 1990; Cordenunsi and Lajolo, 1995).
In the preliminary technique development experiments, there were significant
differences (P≤0.05) between proximal, middle, and distal pulp tissue sampling
positions. There were also significant differences (P≤0.05) between the undiluted and
the diluted methods for TSS measurement. Testing of a pocket 0-30% refractometer,
the same pocket refractometer but scaled 0-50% and a digital refractometer against
sucrose solutions was conducted to directly compare the different devices for TSS
measurement.
Between conventional and organic plantations in the Dominican Republic there were
overall, only slight significant (P≤0.05) and largely inconsistent differences (P≤0.05)
in L*, H°, FW, firmness, TA, starch staining and TSS. Sensory analysis showed that
few people could not determine taste difference between conventionally and
organically grown fruit. Moreover, in that proportion of tasters who did correctly
determine a difference, only half of them said that they preferred the organically
grown fruit. This finding supports the assertion that generally, the consumption of
organic produce is rather a choice of health than a choice in taste (Sauve, 1998; BBC
News, 2000).
Cranfield University at Silsoe September 2001
Laure Caussiol MSc by Research 68
5.1 Conclusion
With regard to industry quality assessment, improvement, the following conclusions
are made: As TSS measurement varies (i.e. higher) towards the ends of banana fruit,
pulp tissue for TSS measurement should be sampled in the middle. The conventional
diluted method of TSS assessment is more appropriate than the novel undiluted
method, which does not measure TSS precisely. The use of a pocket refractometer
scaled 0-30% is well suited for TSS measurements.
With regard to organic versus conventional fruit: Significant differences (P≤0.05),
when found, were usually only marginal in term of magnitude and were not consistent
in across either harvest time or time of assessment during shelf life. Conventionally
and organically grown fruit from the same area in the Dominican Republic showed
similar postharvest qualities, including TSS. Sensory analysis confirmed that people
could not taste a difference between these conventionally and organically grown
banana fruit.
For future research, the following recommendations are made: Improving this study
could be achieved by using organic versus conventional banana fruit from the same
plantation if this were possible. Ideally, fruit of the same size would give more exact
basis for comparing them. Sensory analysis could be expanded to be done when
banana fruit are also at colour stage 4 and using larger numbers panel of panellists
with more varied backgrounds. To extend this study, future research could also
compare paired organic and conventional banana fruit samples from different
countries. Consumers have also complained about “dollar banana” from Costa Rica
being tasteless while Caribbean banana are tasteful (Ruel, pers. comm.). Furthermore,
in extending this idea, future research could look at specific management effects
relating to plantation size and individual cultural practices including those related to
edaphic factors.
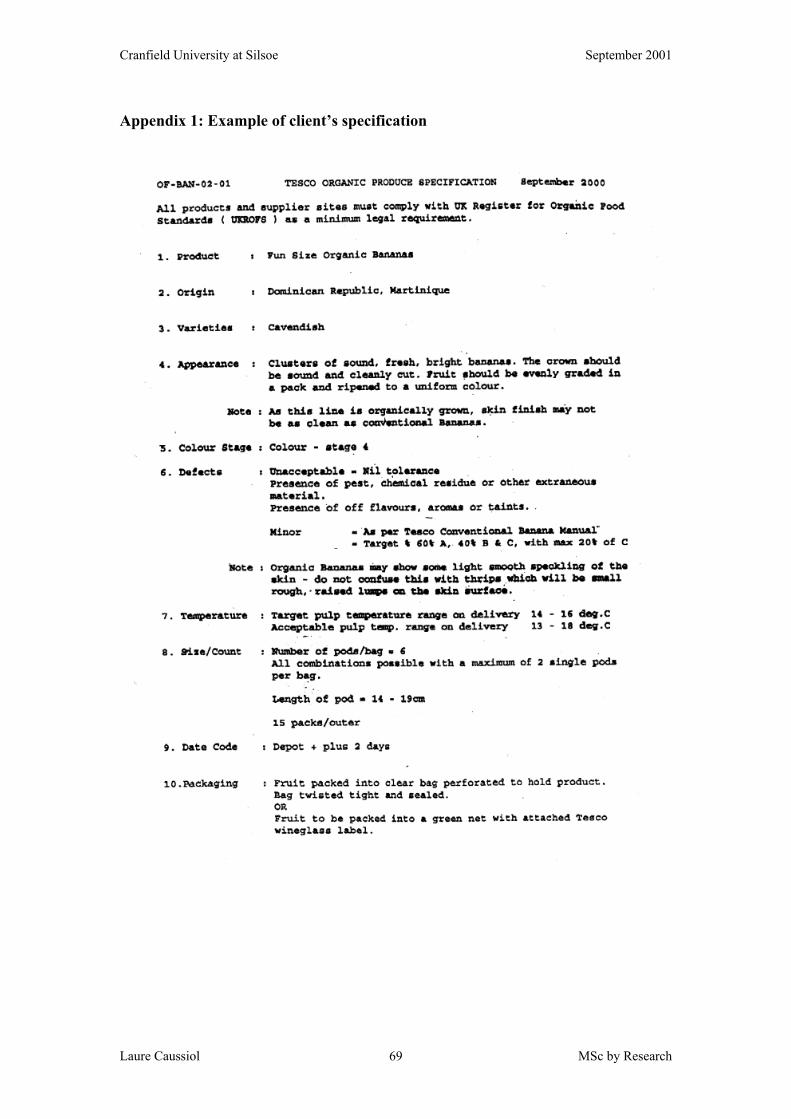
Cranfield University at Silsoe September 2001
Laure Caussiol MSc by Research 69
Appendix 1: Example of client’s specification
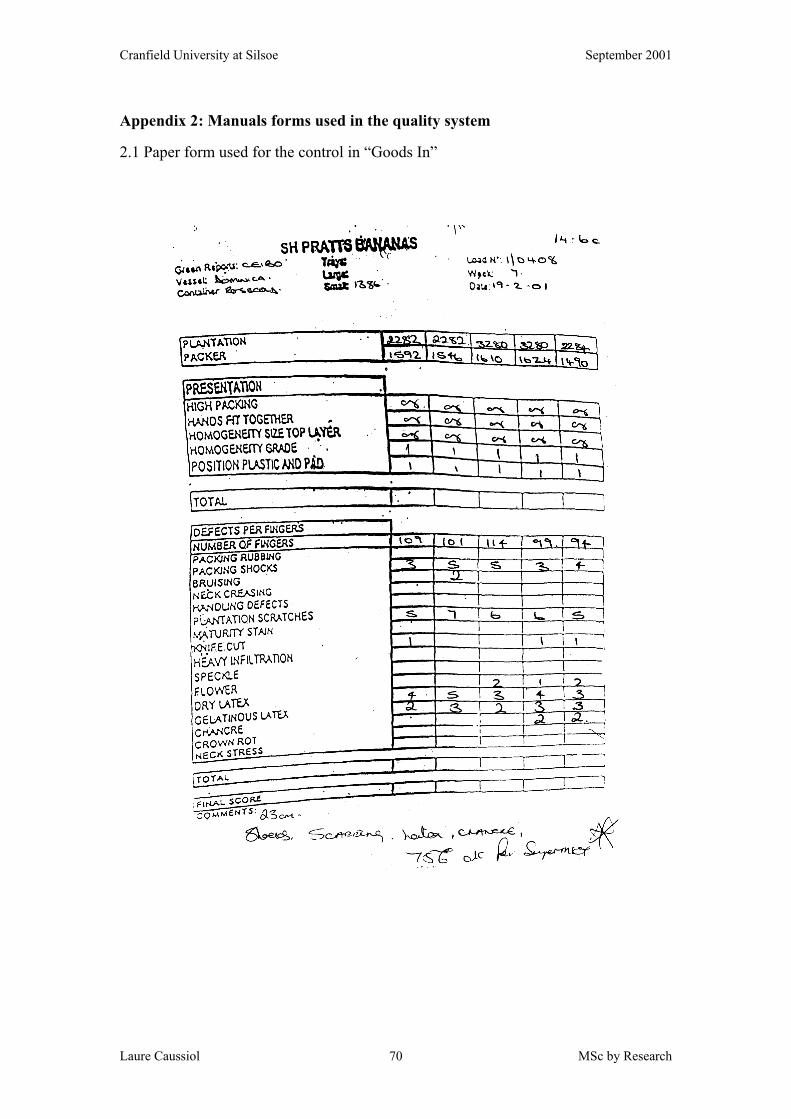
Cranfield University at Silsoe September 2001
Laure Caussiol MSc by Research 70
Appendix 2: Manuals forms used in the quality system
2.1 Paper form used for the control in “Goods In”
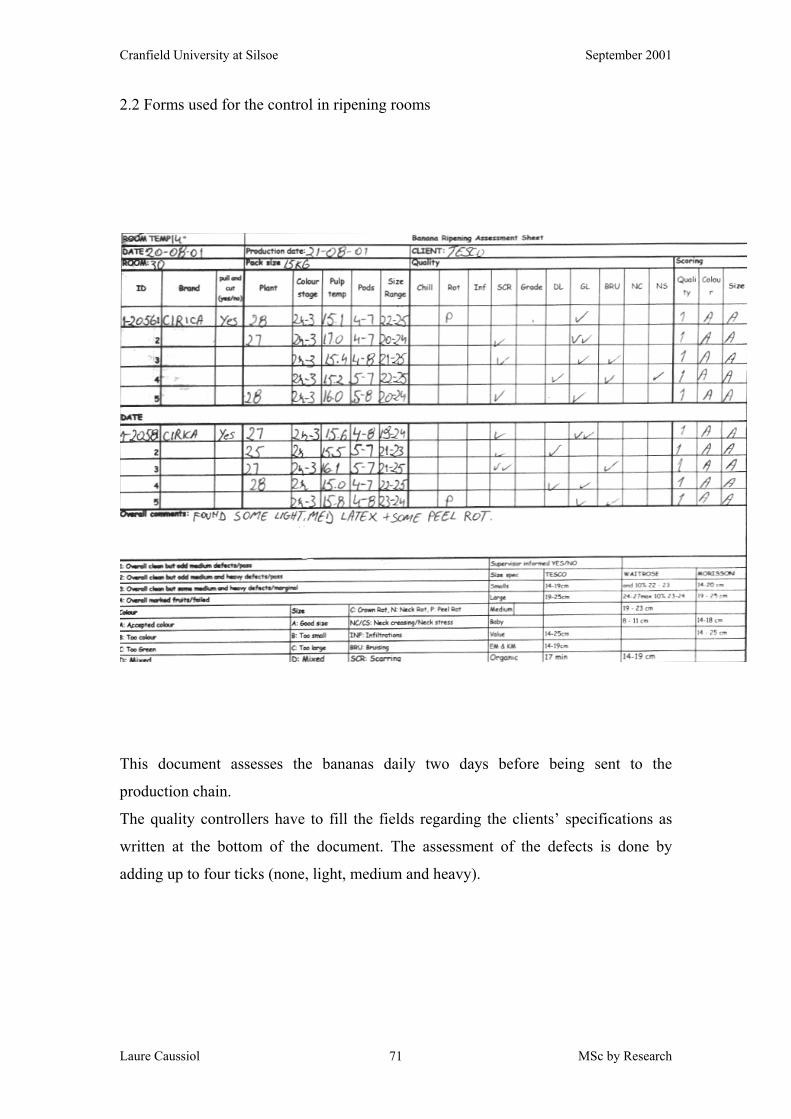
Cranfield University at Silsoe September 2001
Laure Caussiol MSc by Research 71
2.2 Forms used for the control in ripening rooms
This document assesses the bananas daily two days before being sent to the
production chain.
The quality controllers have to fill the fields regarding the clients’ specifications as
written at the bottom of the document. The assessment of the defects is done by
adding up to four ticks (none, light, medium and heavy).
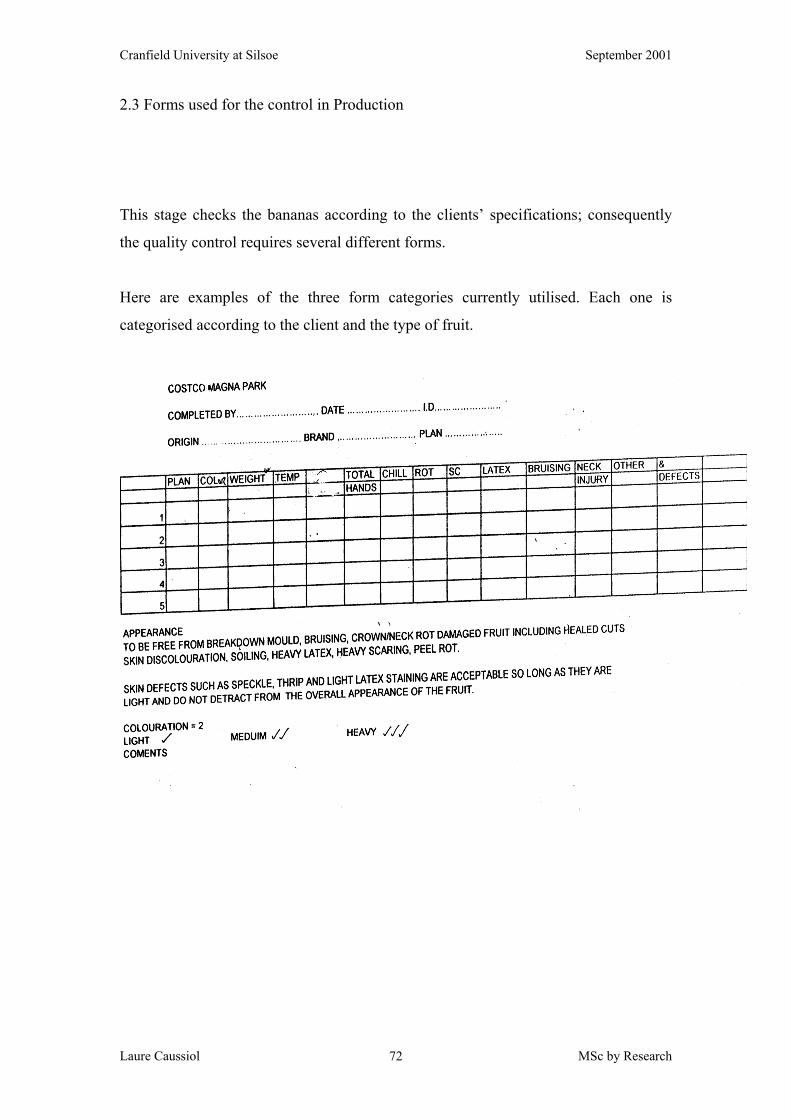
Cranfield University at Silsoe September 2001
Laure Caussiol MSc by Research 72
2.3 Forms used for the control in Production
This stage checks the bananas according to the clients’ specifications; consequently
the quality control requires several different forms.
Here are examples of the three form categories currently utilised. Each one is
categorised according to the client and the type of fruit.
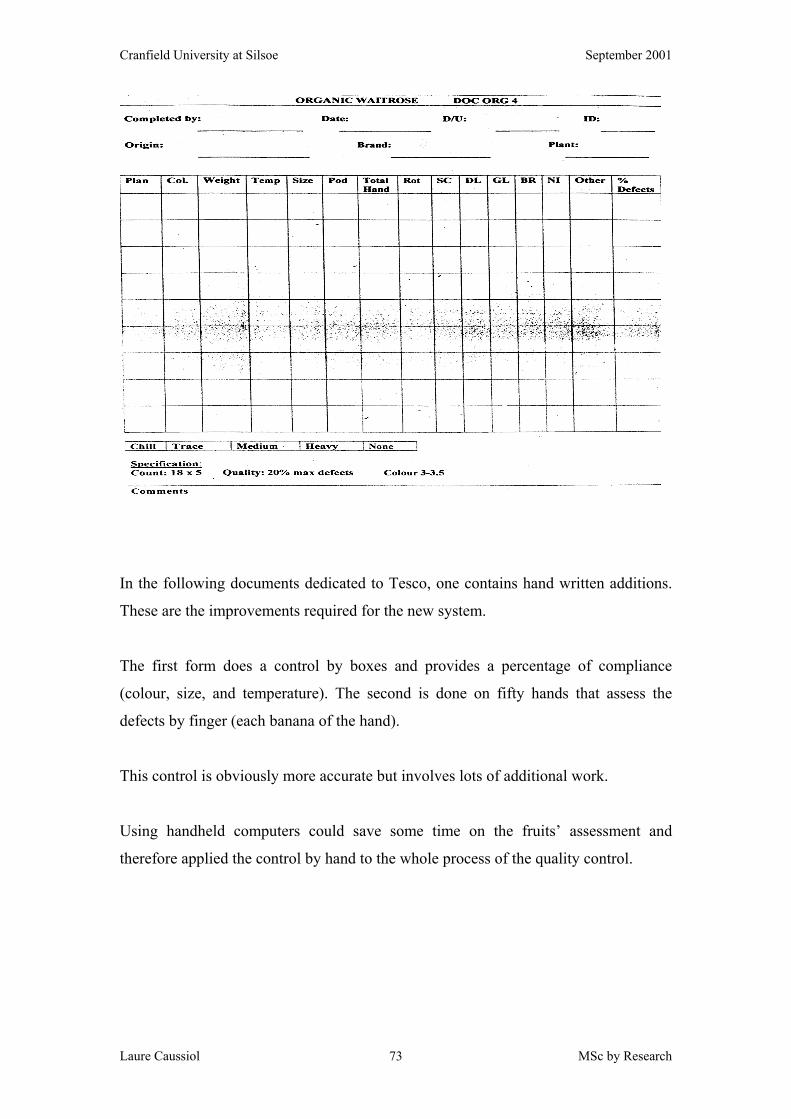
Cranfield University at Silsoe September 2001
Laure Caussiol MSc by Research 73
In the following documents dedicated to Tesco, one contains hand written additions.
These are the improvements required for the new system.
The first form does a control by boxes and provides a percentage of compliance
(colour, size, and temperature). The second is done on fifty hands that assess the
defects by finger (each banana of the hand).
This control is obviously more accurate but involves lots of additional work.
Using handheld computers could save some time on the fruits’ assessment and
therefore applied the control by hand to the whole process of the quality control.
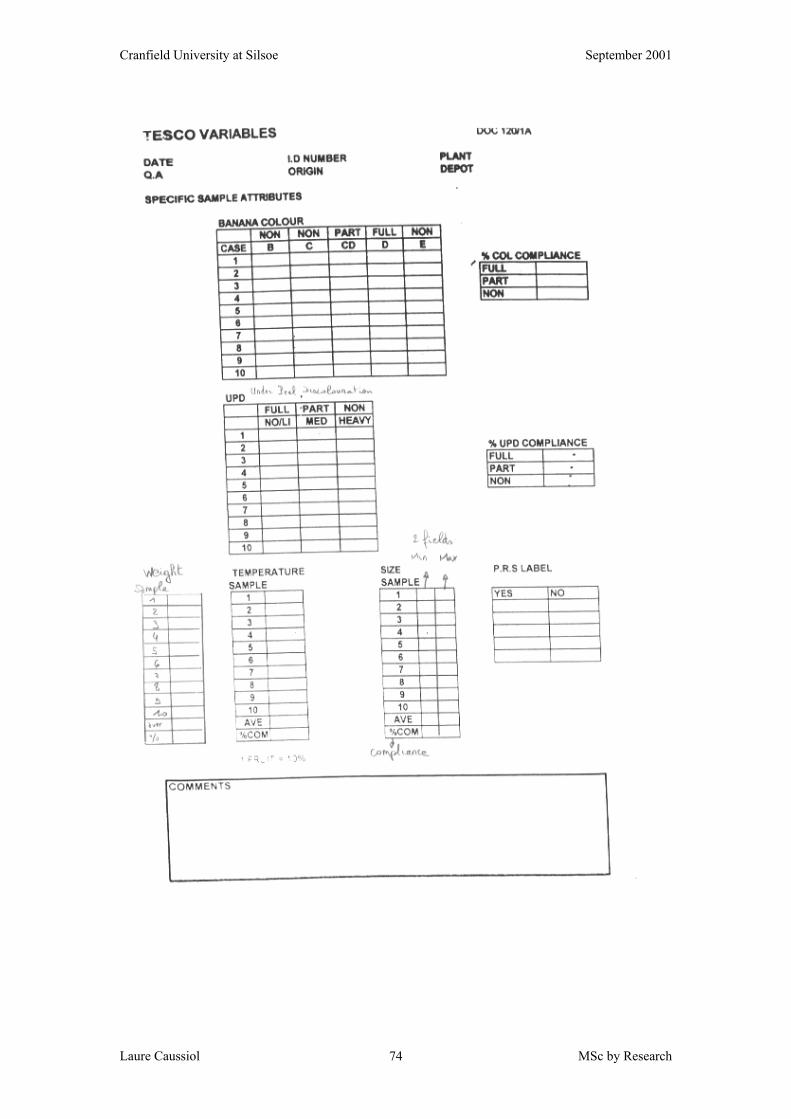
Cranfield University at Silsoe September 2001
Laure Caussiol MSc by Research 74
Cranfield University at Silsoe September 2001
Laure Caussiol MSc by Research 75
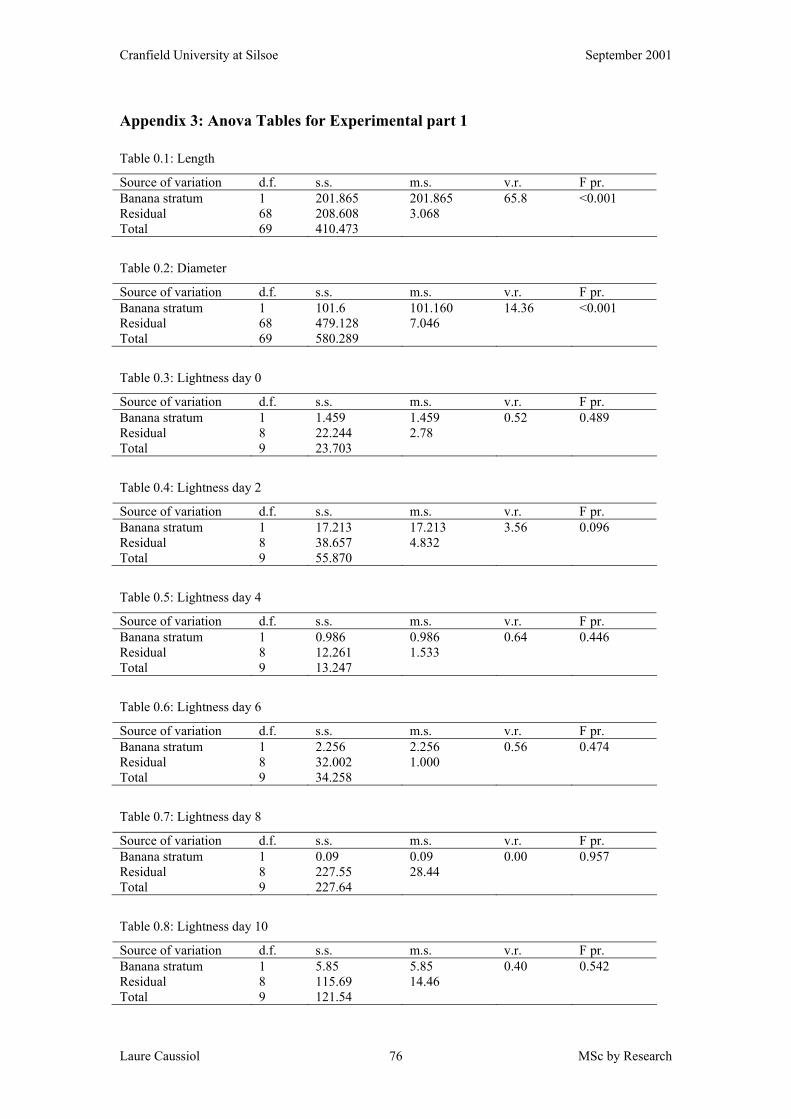
Cranfield University at Silsoe September 2001
Laure Caussiol MSc by Research 76
Appendix 3: Anova Tables for Experimental part 1
Table 0.1: Length
Source of variation d.f. s.s. m.s. v.r. F pr. Banana stratum 1 201.865 201.865 65.8 <0.001 Residual 68 208.608 3.068 Total 69 410.473
Table 0.2: Diameter
Source of variation d.f. s.s. m.s. v.r. F pr. Banana stratum 1 101.6 101.160 14.36 <0.001 Residual 68 479.128 7.046 Total 69 580.289
Table 0.3: Lightness day 0
Source of variation d.f. s.s. m.s. v.r. F pr. Banana stratum 1 1.459 1.459 0.52 0.489 Residual 8 22.244 2.78 Total 9 23.703
Table 0.4: Lightness day 2
Source of variation d.f. s.s. m.s. v.r. F pr. Banana stratum 1 17.213 17.213 3.56 0.096 Residual 8 38.657 4.832 Total 9 55.870
Table 0.5: Lightness day 4
Source of variation d.f. s.s. m.s. v.r. F pr. Banana stratum 1 0.986 0.986 0.64 0.446 Residual 8 12.261 1.533 Total 9 13.247
Table 0.6: Lightness day 6
Source of variation d.f. s.s. m.s. v.r. F pr. Banana stratum 1 2.256 2.256 0.56 0.474 Residual 8 32.002 1.000 Total 9 34.258
Table 0.7: Lightness day 8
Source of variation d.f. s.s. m.s. v.r. F pr. Banana stratum 1 0.09 0.09 0.00 0.957 Residual 8 227.55 28.44 Total 9 227.64
Table 0.8: Lightness day 10
Source of variation d.f. s.s. m.s. v.r. F pr. Banana stratum 1 5.85 5.85 0.40 0.542 Residual 8 115.69 14.46 Total 9 121.54
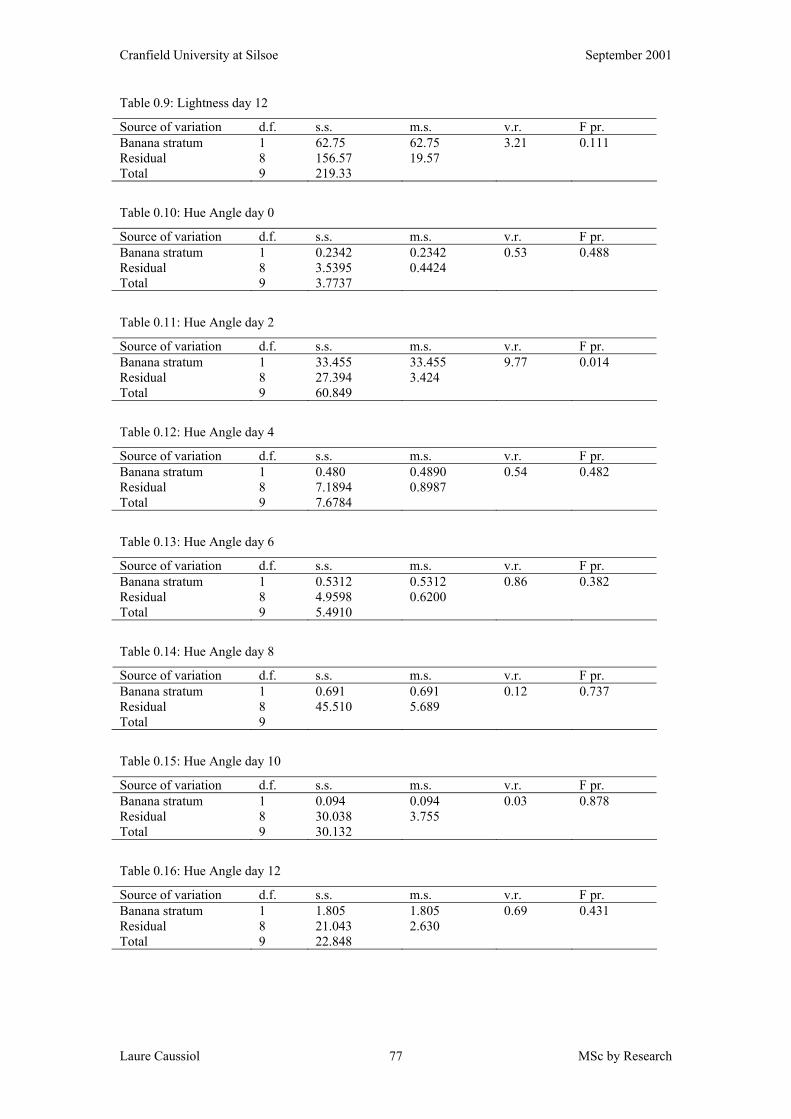
Cranfield University at Silsoe September 2001
Laure Caussiol MSc by Research 77
Table 0.9: Lightness day 12
Source of variation d.f. s.s. m.s. v.r. F pr. Banana stratum 1 62.75 62.75 3.21 0.111 Residual 8 156.57 19.57 Total 9 219.33
Table 0.10: Hue Angle day 0
Source of variation d.f. s.s. m.s. v.r. F pr. Banana stratum 1 0.2342 0.2342 0.53 0.488 Residual 8 3.5395 0.4424 Total 9 3.7737
Table 0.11: Hue Angle day 2
Source of variation d.f. s.s. m.s. v.r. F pr. Banana stratum 1 33.455 33.455 9.77 0.014 Residual 8 27.394 3.424 Total 9 60.849
Table 0.12: Hue Angle day 4
Source of variation d.f. s.s. m.s. v.r. F pr. Banana stratum 1 0.480 0.4890 0.54 0.482 Residual 8 7.1894 0.8987 Total 9 7.6784
Table 0.13: Hue Angle day 6
Source of variation d.f. s.s. m.s. v.r. F pr. Banana stratum 1 0.5312 0.5312 0.86 0.382 Residual 8 4.9598 0.6200 Total 9 5.4910
Table 0.14: Hue Angle day 8
Source of variation d.f. s.s. m.s. v.r. F pr. Banana stratum 1 0.691 0.691 0.12 0.737 Residual 8 45.510 5.689 Total 9
Table 0.15: Hue Angle day 10
Source of variation d.f. s.s. m.s. v.r. F pr. Banana stratum 1 0.094 0.094 0.03 0.878 Residual 8 30.038 3.755 Total 9 30.132
Table 0.16: Hue Angle day 12
Source of variation d.f. s.s. m.s. v.r. F pr. Banana stratum 1 1.805 1.805 0.69 0.431 Residual 8 21.043 2.630 Total 9 22.848
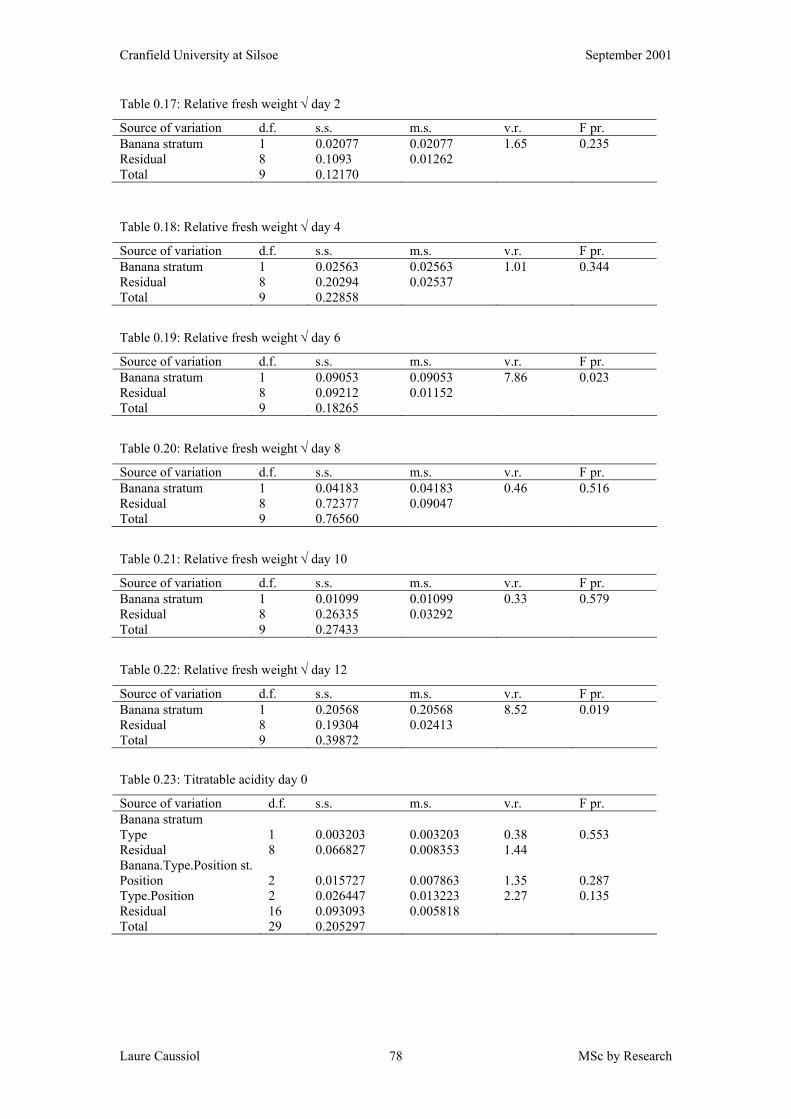
Cranfield University at Silsoe September 2001
Laure Caussiol MSc by Research 78
Table 0.17: Relative fresh weight √ day 2
Source of variation d.f. s.s. m.s. v.r. F pr. Banana stratum 1 0.02077 0.02077 1.65 0.235 Residual 8 0.1093 0.01262 Total 9 0.12170
Table 0.18: Relative fresh weight √ day 4
Source of variation d.f. s.s. m.s. v.r. F pr. Banana stratum 1 0.02563 0.02563 1.01 0.344 Residual 8 0.20294 0.02537 Total 9 0.22858
Table 0.19: Relative fresh weight √ day 6
Source of variation d.f. s.s. m.s. v.r. F pr. Banana stratum 1 0.09053 0.09053 7.86 0.023 Residual 8 0.09212 0.01152 Total 9 0.18265
Table 0.20: Relative fresh weight √ day 8
Source of variation d.f. s.s. m.s. v.r. F pr. Banana stratum 1 0.04183 0.04183 0.46 0.516 Residual 8 0.72377 0.09047 Total 9 0.76560
Table 0.21: Relative fresh weight √ day 10
Source of variation d.f. s.s. m.s. v.r. F pr. Banana stratum 1 0.01099 0.01099 0.33 0.579 Residual 8 0.26335 0.03292 Total 9 0.27433
Table 0.22: Relative fresh weight √ day 12
Source of variation d.f. s.s. m.s. v.r. F pr. Banana stratum 1 0.20568 0.20568 8.52 0.019 Residual 8 0.19304 0.02413 Total 9 0.39872
Table 0.23: Titratable acidity day 0
Source of variation d.f. s.s. m.s. v.r. F pr. Banana stratum Type 1 0.003203 0.003203 0.38 0.553 Residual 8 0.066827 0.008353 1.44 Banana.Type.Position st. Position 2 0.015727 0.007863 1.35 0.287 Type.Position 2 0.026447 0.013223 2.27 0.135 Residual 16 0.093093 0.005818 Total 29 0.205297
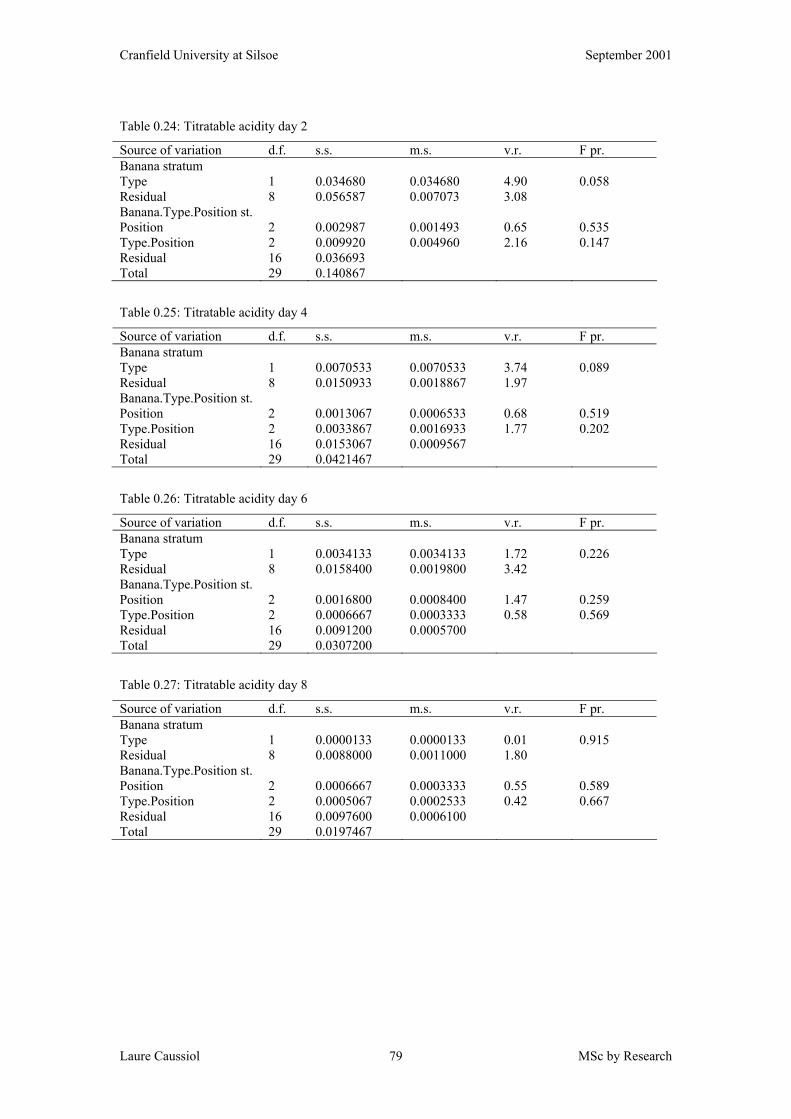
Cranfield University at Silsoe September 2001
Laure Caussiol MSc by Research 79
Table 0.24: Titratable acidity day 2
Source of variation d.f. s.s. m.s. v.r. F pr. Banana stratum Type 1 0.034680 0.034680 4.90 0.058 Residual 8 0.056587 0.007073 3.08 Banana.Type.Position st. Position 2 0.002987 0.001493 0.65 0.535 Type.Position 2 0.009920 0.004960 2.16 0.147 Residual 16 0.036693 Total 29 0.140867
Table 0.25: Titratable acidity day 4
Source of variation d.f. s.s. m.s. v.r. F pr. Banana stratum Type 1 0.0070533 0.0070533 3.74 0.089 Residual 8 0.0150933 0.0018867 1.97 Banana.Type.Position st. Position 2 0.0013067 0.0006533 0.68 0.519 Type.Position 2 0.0033867 0.0016933 1.77 0.202 Residual 16 0.0153067 0.0009567 Total 29 0.0421467
Table 0.26: Titratable acidity day 6
Source of variation d.f. s.s. m.s. v.r. F pr. Banana stratum Type 1 0.0034133 0.0034133 1.72 0.226 Residual 8 0.0158400 0.0019800 3.42 Banana.Type.Position st. Position 2 0.0016800 0.0008400 1.47 0.259 Type.Position 2 0.0006667 0.0003333 0.58 0.569 Residual 16 0.0091200 0.0005700 Total 29 0.0307200
Table 0.27: Titratable acidity day 8
Source of variation d.f. s.s. m.s. v.r. F pr. Banana stratum Type 1 0.0000133 0.0000133 0.01 0.915 Residual 8 0.0088000 0.0011000 1.80 Banana.Type.Position st. Position 2 0.0006667 0.0003333 0.55 0.589 Type.Position 2 0.0005067 0.0002533 0.42 0.667 Residual 16 0.0097600 0.0006100 Total 29 0.0197467
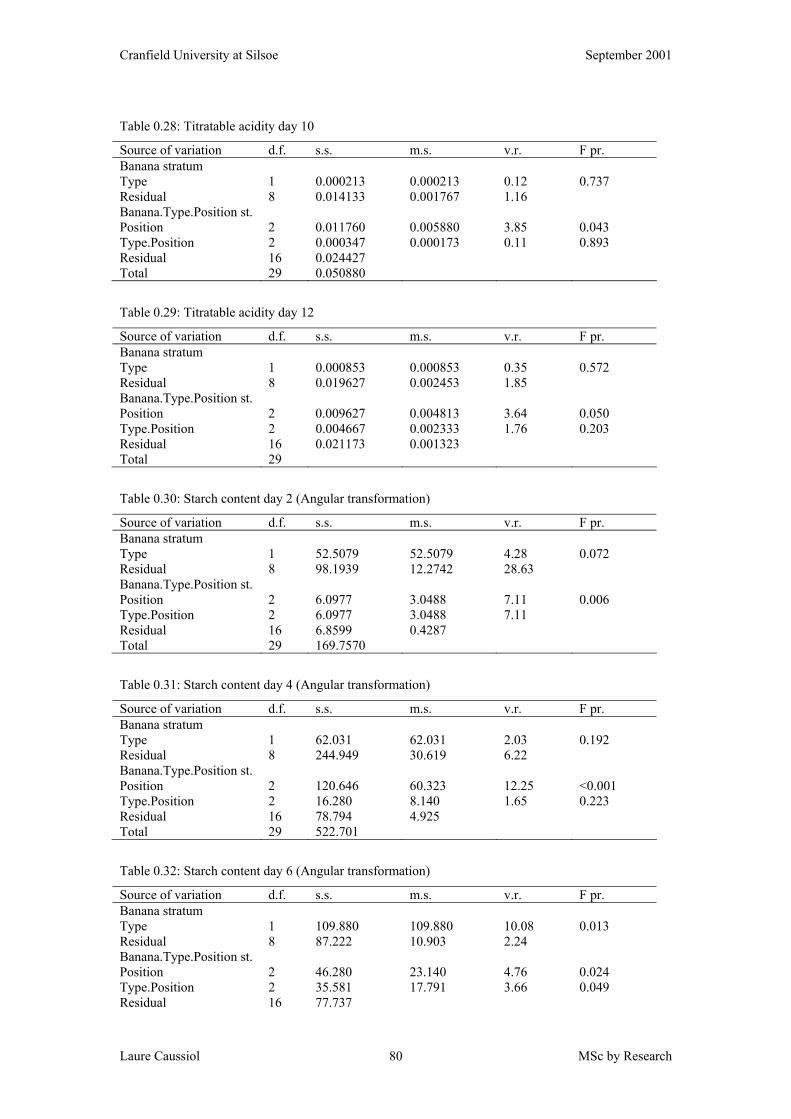
Cranfield University at Silsoe September 2001
Laure Caussiol MSc by Research 80
Table 0.28: Titratable acidity day 10
Source of variation d.f. s.s. m.s. v.r. F pr. Banana stratum Type 1 0.000213 0.000213 0.12 0.737 Residual 8 0.014133 0.001767 1.16 Banana.Type.Position st. Position 2 0.011760 0.005880 3.85 0.043 Type.Position 2 0.000347 0.000173 0.11 0.893 Residual 16 0.024427 Total 29 0.050880
Table 0.29: Titratable acidity day 12
Source of variation d.f. s.s. m.s. v.r. F pr. Banana stratum Type 1 0.000853 0.000853 0.35 0.572 Residual 8 0.019627 0.002453 1.85 Banana.Type.Position st. Position 2 0.009627 0.004813 3.64 0.050 Type.Position 2 0.004667 0.002333 1.76 0.203 Residual 16 0.021173 0.001323 Total 29
Table 0.30: Starch content day 2 (Angular transformation)
Source of variation d.f. s.s. m.s. v.r. F pr. Banana stratum Type 1 52.5079 52.5079 4.28 0.072 Residual 8 98.1939 12.2742 28.63 Banana.Type.Position st. Position 2 6.0977 3.0488 7.11 0.006 Type.Position 2 6.0977 3.0488 7.11 Residual 16 6.8599 0.4287 Total 29 169.7570
Table 0.31: Starch content day 4 (Angular transformation)
Source of variation d.f. s.s. m.s. v.r. F pr. Banana stratum Type 1 62.031 62.031 2.03 0.192 Residual 8 244.949 30.619 6.22 Banana.Type.Position st. Position 2 120.646 60.323 12.25 <0.001 Type.Position 2 16.280 8.140 1.65 0.223 Residual 16 78.794 4.925 Total 29 522.701
Table 0.32: Starch content day 6 (Angular transformation)
Source of variation d.f. s.s. m.s. v.r. F pr. Banana stratum Type 1 109.880 109.880 10.08 0.013 Residual 8 87.222 10.903 2.24 Banana.Type.Position st. Position 2 46.280 23.140 4.76 0.024 Type.Position 2 35.581 17.791 3.66 0.049 Residual 16 77.737
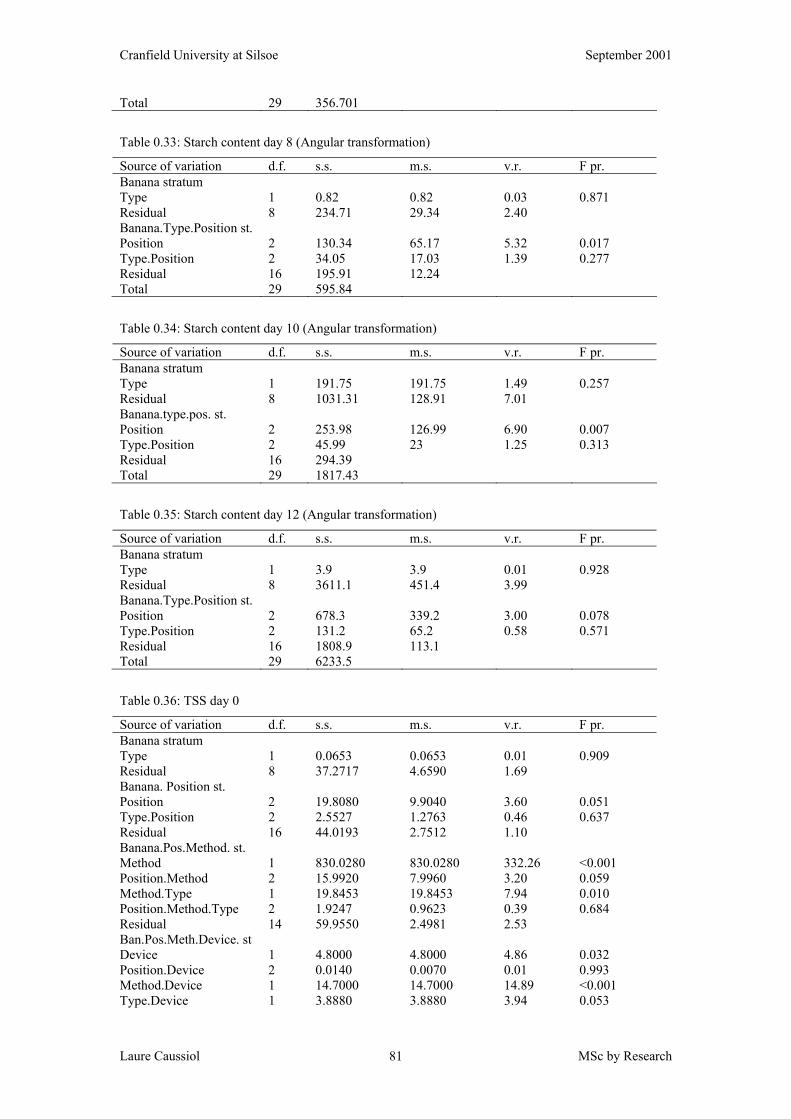
Cranfield University at Silsoe September 2001
Laure Caussiol MSc by Research 81
Total 29 356.701
Table 0.33: Starch content day 8 (Angular transformation)
Source of variation d.f. s.s. m.s. v.r. F pr. Banana stratum Type 1 0.82 0.82 0.03 0.871 Residual 8 234.71 29.34 2.40 Banana.Type.Position st. Position 2 130.34 65.17 5.32 0.017 Type.Position 2 34.05 17.03 1.39 0.277 Residual 16 195.91 12.24 Total 29 595.84
Table 0.34: Starch content day 10 (Angular transformation)
Source of variation d.f. s.s. m.s. v.r. F pr. Banana stratum Type 1 191.75 191.75 1.49 0.257 Residual 8 1031.31 128.91 7.01 Banana.type.pos. st. Position 2 253.98 126.99 6.90 0.007 Type.Position 2 45.99 23 1.25 0.313 Residual 16 294.39 Total 29 1817.43
Table 0.35: Starch content day 12 (Angular transformation)
Source of variation d.f. s.s. m.s. v.r. F pr. Banana stratum Type 1 3.9 3.9 0.01 0.928 Residual 8 3611.1 451.4 3.99 Banana.Type.Position st. Position 2 678.3 339.2 3.00 0.078 Type.Position 2 131.2 65.2 0.58 0.571 Residual 16 1808.9 113.1 Total 29 6233.5
Table 0.36: TSS day 0
Source of variation d.f. s.s. m.s. v.r. F pr. Banana stratum Type 1 0.0653 0.0653 0.01 0.909 Residual 8 37.2717 4.6590 1.69 Banana. Position st. Position 2 19.8080 9.9040 3.60 0.051 Type.Position 2 2.5527 1.2763 0.46 0.637 Residual 16 44.0193 2.7512 1.10 Banana.Pos.Method. st. Method 1 830.0280 830.0280 332.26 <0.001 Position.Method 2 15.9920 7.9960 3.20 0.059 Method.Type 1 19.8453 19.8453 7.94 0.010 Position.Method.Type 2 1.9247 0.9623 0.39 0.684 Residual 14 59.9550 2.4981 2.53 Ban.Pos.Meth.Device. st Device 1 4.8000 4.8000 4.86 0.032 Position.Device 2 0.0140 0.0070 0.01 0.993 Method.Device 1 14.7000 14.7000 14.89 <0.001 Type.Device 1 3.8880 3.8880 3.94 0.053
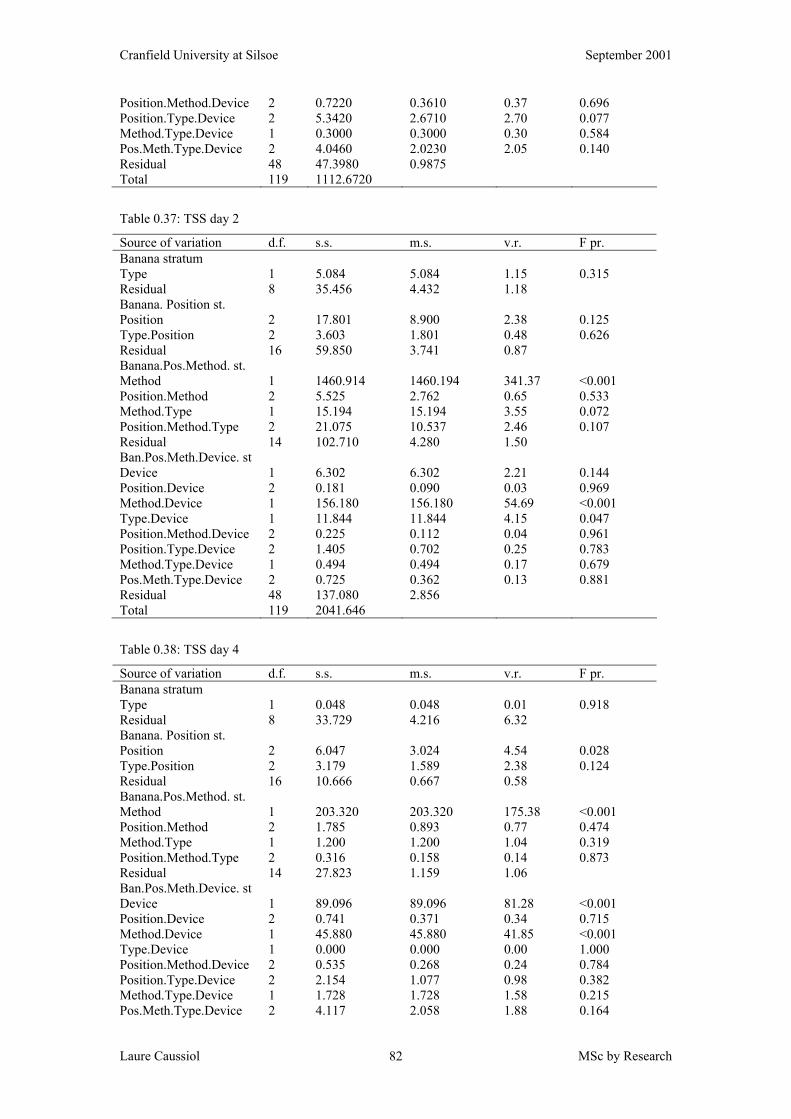
Cranfield University at Silsoe September 2001
Laure Caussiol MSc by Research 82
Position.Method.Device 2 0.7220 0.3610 0.37 0.696 Position.Type.Device 2 5.3420 2.6710 2.70 0.077 Method.Type.Device 1 0.3000 0.3000 0.30 0.584 Pos.Meth.Type.Device 2 4.0460 2.0230 2.05 0.140 Residual 48 47.3980 0.9875 Total 119 1112.6720
Table 0.37: TSS day 2
Source of variation d.f. s.s. m.s. v.r. F pr. Banana stratum Type 1 5.084 5.084 1.15 0.315 Residual 8 35.456 4.432 1.18 Banana. Position st. Position 2 17.801 8.900 2.38 0.125 Type.Position 2 3.603 1.801 0.48 0.626 Residual 16 59.850 3.741 0.87 Banana.Pos.Method. st. Method 1 1460.914 1460.194 341.37 <0.001 Position.Method 2 5.525 2.762 0.65 0.533 Method.Type 1 15.194 15.194 3.55 0.072 Position.Method.Type 2 21.075 10.537 2.46 0.107 Residual 14 102.710 4.280 1.50 Ban.Pos.Meth.Device. st Device 1 6.302 6.302 2.21 0.144 Position.Device 2 0.181 0.090 0.03 0.969 Method.Device 1 156.180 156.180 54.69 <0.001 Type.Device 1 11.844 11.844 4.15 0.047 Position.Method.Device 2 0.225 0.112 0.04 0.961 Position.Type.Device 2 1.405 0.702 0.25 0.783 Method.Type.Device 1 0.494 0.494 0.17 0.679 Pos.Meth.Type.Device 2 0.725 0.362 0.13 0.881 Residual 48 137.080 2.856 Total 119 2041.646
Table 0.38: TSS day 4
Source of variation d.f. s.s. m.s. v.r. F pr. Banana stratum Type 1 0.048 0.048 0.01 0.918 Residual 8 33.729 4.216 6.32 Banana. Position st. Position 2 6.047 3.024 4.54 0.028 Type.Position 2 3.179 1.589 2.38 0.124 Residual 16 10.666 0.667 0.58 Banana.Pos.Method. st. Method 1 203.320 203.320 175.38 <0.001 Position.Method 2 1.785 0.893 0.77 0.474 Method.Type 1 1.200 1.200 1.04 0.319 Position.Method.Type 2 0.316 0.158 0.14 0.873 Residual 14 27.823 1.159 1.06 Ban.Pos.Meth.Device. st Device 1 89.096 89.096 81.28 <0.001 Position.Device 2 0.741 0.371 0.34 0.715 Method.Device 1 45.880 45.880 41.85 <0.001 Type.Device 1 0.000 0.000 0.00 1.000 Position.Method.Device 2 0.535 0.268 0.24 0.784 Position.Type.Device 2 2.154 1.077 0.98 0.382 Method.Type.Device 1 1.728 1.728 1.58 0.215 Pos.Meth.Type.Device 2 4.117 2.058 1.88 0.164
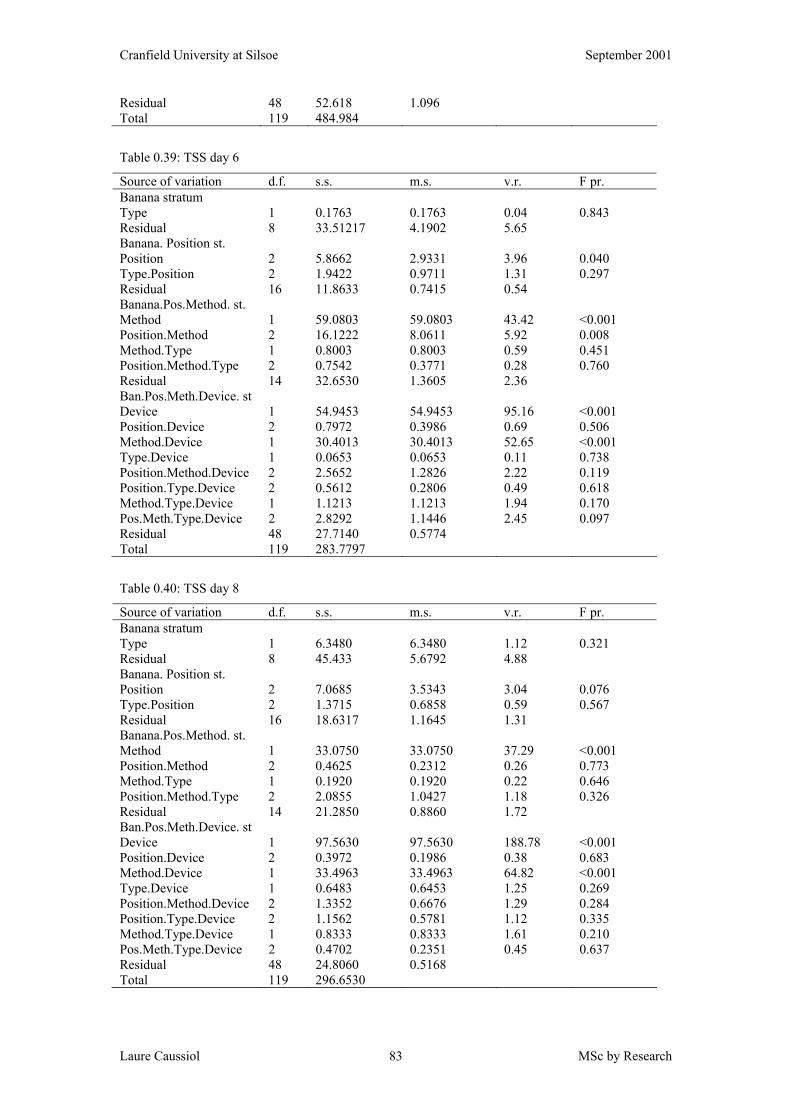
Cranfield University at Silsoe September 2001
Laure Caussiol MSc by Research 83
Residual 48 52.618 1.096 Total 119 484.984
Table 0.39: TSS day 6
Source of variation d.f. s.s. m.s. v.r. F pr. Banana stratum Type 1 0.1763 0.1763 0.04 0.843 Residual 8 33.51217 4.1902 5.65 Banana. Position st. Position 2 5.8662 2.9331 3.96 0.040 Type.Position 2 1.9422 0.9711 1.31 0.297 Residual 16 11.8633 0.7415 0.54 Banana.Pos.Method. st. Method 1 59.0803 59.0803 43.42 <0.001 Position.Method 2 16.1222 8.0611 5.92 0.008 Method.Type 1 0.8003 0.8003 0.59 0.451 Position.Method.Type 2 0.7542 0.3771 0.28 0.760 Residual 14 32.6530 1.3605 2.36 Ban.Pos.Meth.Device. st Device 1 54.9453 54.9453 95.16 <0.001 Position.Device 2 0.7972 0.3986 0.69 0.506 Method.Device 1 30.4013 30.4013 52.65 <0.001 Type.Device 1 0.0653 0.0653 0.11 0.738 Position.Method.Device 2 2.5652 1.2826 2.22 0.119 Position.Type.Device 2 0.5612 0.2806 0.49 0.618 Method.Type.Device 1 1.1213 1.1213 1.94 0.170 Pos.Meth.Type.Device 2 2.8292 1.1446 2.45 0.097 Residual 48 27.7140 0.5774 Total 119 283.7797
Table 0.40: TSS day 8
Source of variation d.f. s.s. m.s. v.r. F pr. Banana stratum Type 1 6.3480 6.3480 1.12 0.321 Residual 8 45.433 5.6792 4.88 Banana. Position st. Position 2 7.0685 3.5343 3.04 0.076 Type.Position 2 1.3715 0.6858 0.59 0.567 Residual 16 18.6317 1.1645 1.31 Banana.Pos.Method. st. Method 1 33.0750 33.0750 37.29 <0.001 Position.Method 2 0.4625 0.2312 0.26 0.773 Method.Type 1 0.1920 0.1920 0.22 0.646 Position.Method.Type 2 2.0855 1.0427 1.18 0.326 Residual 14 21.2850 0.8860 1.72 Ban.Pos.Meth.Device. st Device 1 97.5630 97.5630 188.78 <0.001 Position.Device 2 0.3972 0.1986 0.38 0.683 Method.Device 1 33.4963 33.4963 64.82 <0.001 Type.Device 1 0.6483 0.6453 1.25 0.269 Position.Method.Device 2 1.3352 0.6676 1.29 0.284 Position.Type.Device 2 1.1562 0.5781 1.12 0.335 Method.Type.Device 1 0.8333 0.8333 1.61 0.210 Pos.Meth.Type.Device 2 0.4702 0.2351 0.45 0.637 Residual 48 24.8060 0.5168 Total 119 296.6530
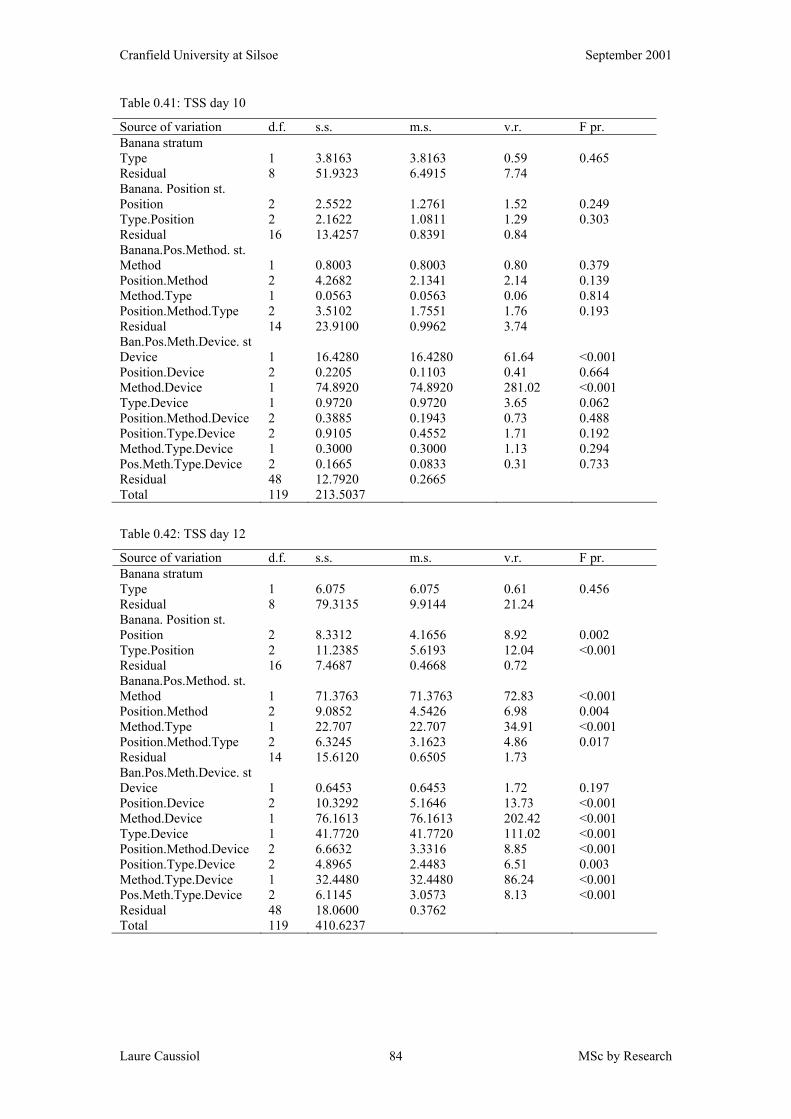
Cranfield University at Silsoe September 2001
Laure Caussiol MSc by Research 84
Table 0.41: TSS day 10
Source of variation d.f. s.s. m.s. v.r. F pr. Banana stratum Type 1 3.8163 3.8163 0.59 0.465 Residual 8 51.9323 6.4915 7.74 Banana. Position st. Position 2 2.5522 1.2761 1.52 0.249 Type.Position 2 2.1622 1.0811 1.29 0.303 Residual 16 13.4257 0.8391 0.84 Banana.Pos.Method. st. Method 1 0.8003 0.8003 0.80 0.379 Position.Method 2 4.2682 2.1341 2.14 0.139 Method.Type 1 0.0563 0.0563 0.06 0.814 Position.Method.Type 2 3.5102 1.7551 1.76 0.193 Residual 14 23.9100 0.9962 3.74 Ban.Pos.Meth.Device. st Device 1 16.4280 16.4280 61.64 <0.001 Position.Device 2 0.2205 0.1103 0.41 0.664 Method.Device 1 74.8920 74.8920 281.02 <0.001 Type.Device 1 0.9720 0.9720 3.65 0.062 Position.Method.Device 2 0.3885 0.1943 0.73 0.488 Position.Type.Device 2 0.9105 0.4552 1.71 0.192 Method.Type.Device 1 0.3000 0.3000 1.13 0.294 Pos.Meth.Type.Device 2 0.1665 0.0833 0.31 0.733 Residual 48 12.7920 0.2665 Total 119 213.5037
Table 0.42: TSS day 12
Source of variation d.f. s.s. m.s. v.r. F pr. Banana stratum Type 1 6.075 6.075 0.61 0.456 Residual 8 79.3135 9.9144 21.24 Banana. Position st. Position 2 8.3312 4.1656 8.92 0.002 Type.Position 2 11.2385 5.6193 12.04 <0.001 Residual 16 7.4687 0.4668 0.72 Banana.Pos.Method. st. Method 1 71.3763 71.3763 72.83 <0.001 Position.Method 2 9.0852 4.5426 6.98 0.004 Method.Type 1 22.707 22.707 34.91 <0.001 Position.Method.Type 2 6.3245 3.1623 4.86 0.017 Residual 14 15.6120 0.6505 1.73 Ban.Pos.Meth.Device. st Device 1 0.6453 0.6453 1.72 0.197 Position.Device 2 10.3292 5.1646 13.73 <0.001 Method.Device 1 76.1613 76.1613 202.42 <0.001 Type.Device 1 41.7720 41.7720 111.02 <0.001 Position.Method.Device 2 6.6632 3.3316 8.85 <0.001 Position.Type.Device 2 4.8965 2.4483 6.51 0.003 Method.Type.Device 1 32.4480 32.4480 86.24 <0.001 Pos.Meth.Type.Device 2 6.1145 3.0573 8.13 <0.001 Residual 48 18.0600 0.3762 Total 119 410.6237
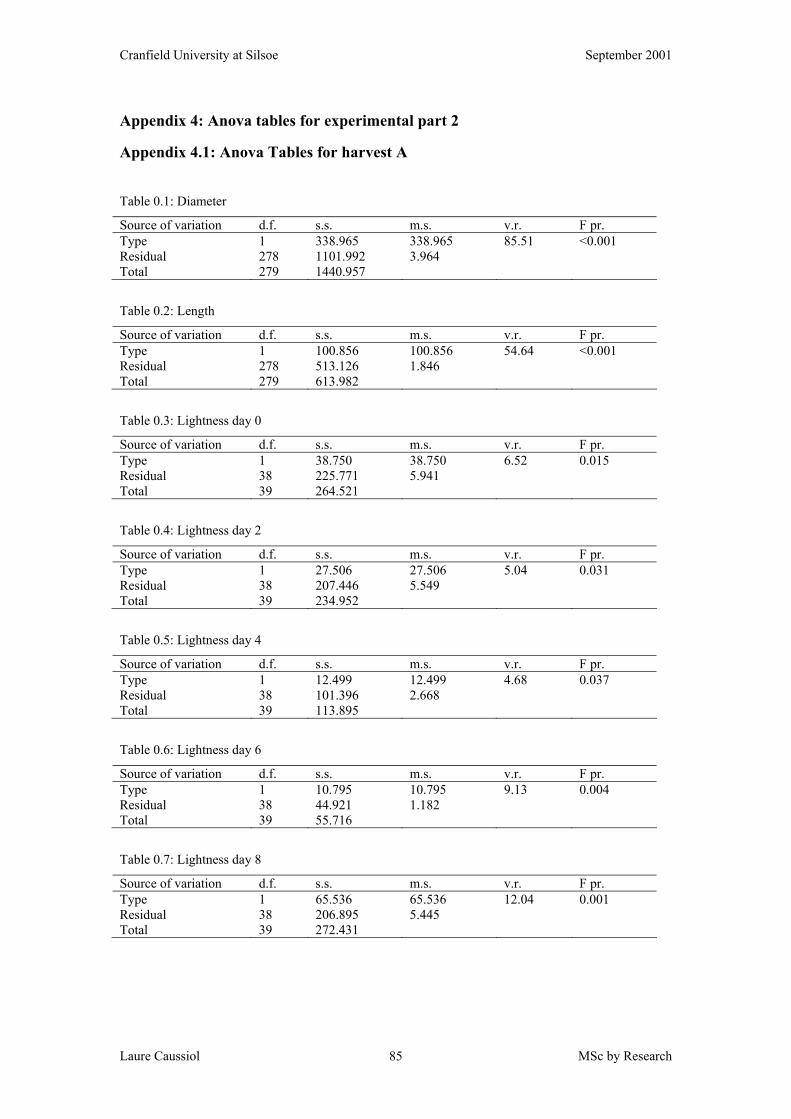
Cranfield University at Silsoe September 2001
Laure Caussiol MSc by Research 85
Appendix 4: Anova tables for experimental part 2
Appendix 4.1: Anova Tables for harvest A
Table 0.1: Diameter
Source of variation d.f. s.s. m.s. v.r. F pr. Type 1 338.965 338.965 85.51 <0.001 Residual 278 1101.992 3.964 Total 279 1440.957
Table 0.2: Length
Source of variation d.f. s.s. m.s. v.r. F pr. Type 1 100.856 100.856 54.64 <0.001 Residual 278 513.126 1.846 Total 279 613.982
Table 0.3: Lightness day 0
Source of variation d.f. s.s. m.s. v.r. F pr. Type 1 38.750 38.750 6.52 0.015 Residual 38 225.771 5.941 Total 39 264.521
Table 0.4: Lightness day 2
Source of variation d.f. s.s. m.s. v.r. F pr. Type 1 27.506 27.506 5.04 0.031 Residual 38 207.446 5.549 Total 39 234.952
Table 0.5: Lightness day 4
Source of variation d.f. s.s. m.s. v.r. F pr. Type 1 12.499 12.499 4.68 0.037 Residual 38 101.396 2.668 Total 39 113.895
Table 0.6: Lightness day 6
Source of variation d.f. s.s. m.s. v.r. F pr. Type 1 10.795 10.795 9.13 0.004 Residual 38 44.921 1.182 Total 39 55.716
Table 0.7: Lightness day 8
Source of variation d.f. s.s. m.s. v.r. F pr. Type 1 65.536 65.536 12.04 0.001 Residual 38 206.895 5.445 Total 39 272.431
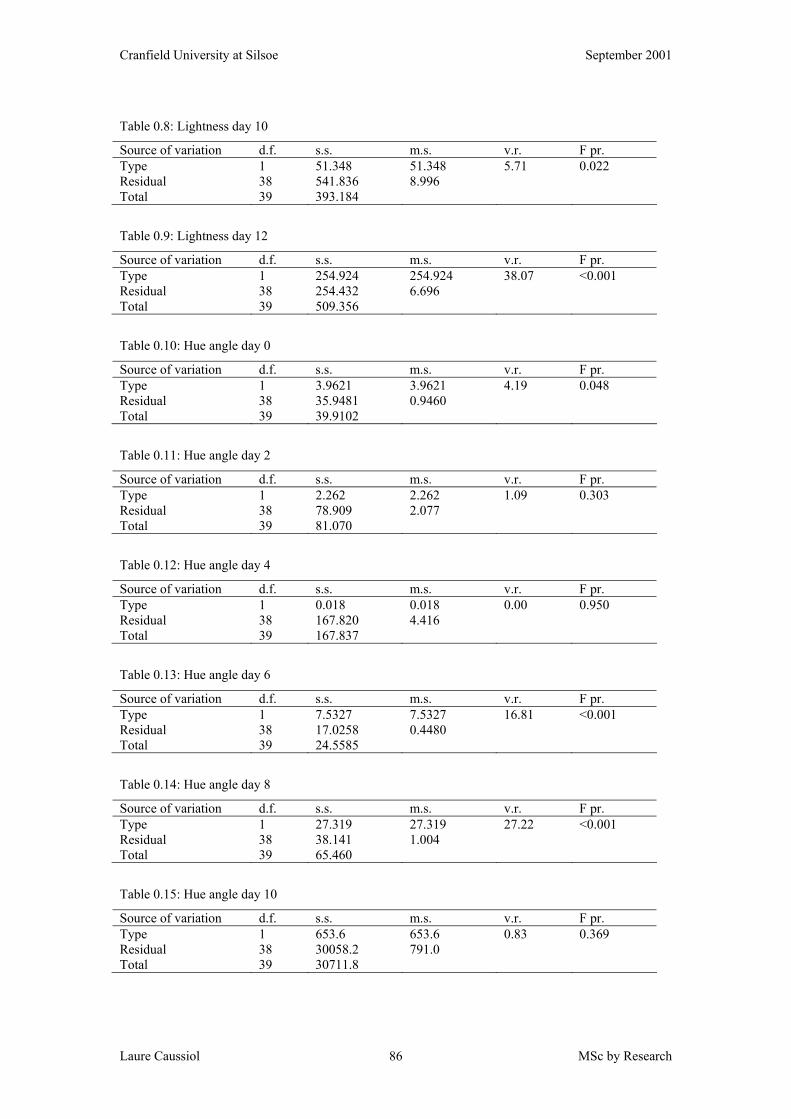
Cranfield University at Silsoe September 2001
Laure Caussiol MSc by Research 86
Table 0.8: Lightness day 10
Source of variation d.f. s.s. m.s. v.r. F pr. Type 1 51.348 51.348 5.71 0.022 Residual 38 541.836 8.996 Total 39 393.184
Table 0.9: Lightness day 12
Source of variation d.f. s.s. m.s. v.r. F pr. Type 1 254.924 254.924 38.07 <0.001 Residual 38 254.432 6.696 Total 39 509.356
Table 0.10: Hue angle day 0
Source of variation d.f. s.s. m.s. v.r. F pr. Type 1 3.9621 3.9621 4.19 0.048 Residual 38 35.9481 0.9460 Total 39 39.9102
Table 0.11: Hue angle day 2
Source of variation d.f. s.s. m.s. v.r. F pr. Type 1 2.262 2.262 1.09 0.303 Residual 38 78.909 2.077 Total 39 81.070
Table 0.12: Hue angle day 4
Source of variation d.f. s.s. m.s. v.r. F pr. Type 1 0.018 0.018 0.00 0.950 Residual 38 167.820 4.416 Total 39 167.837
Table 0.13: Hue angle day 6
Source of variation d.f. s.s. m.s. v.r. F pr. Type 1 7.5327 7.5327 16.81 <0.001 Residual 38 17.0258 0.4480 Total 39 24.5585
Table 0.14: Hue angle day 8
Source of variation d.f. s.s. m.s. v.r. F pr. Type 1 27.319 27.319 27.22 <0.001 Residual 38 38.141 1.004 Total 39 65.460
Table 0.15: Hue angle day 10
Source of variation d.f. s.s. m.s. v.r. F pr. Type 1 653.6 653.6 0.83 0.369 Residual 38 30058.2 791.0 Total 39 30711.8
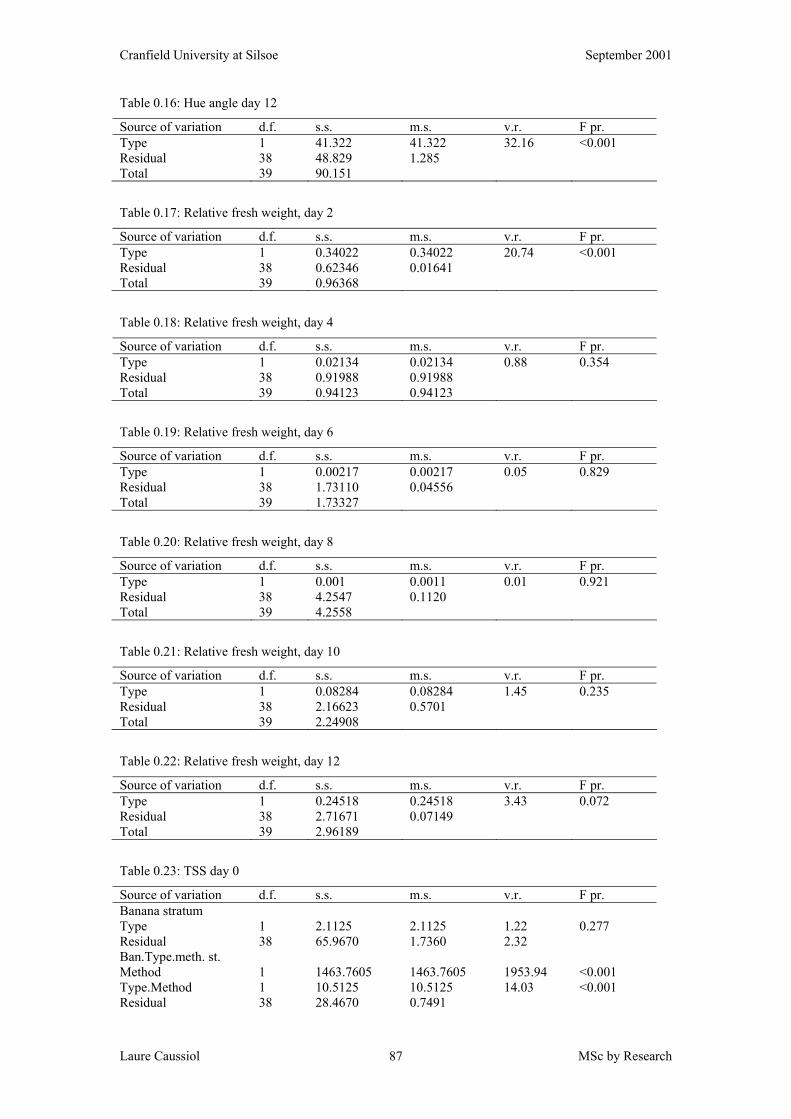
Cranfield University at Silsoe September 2001
Laure Caussiol MSc by Research 87
Table 0.16: Hue angle day 12
Source of variation d.f. s.s. m.s. v.r. F pr. Type 1 41.322 41.322 32.16 <0.001 Residual 38 48.829 1.285 Total 39 90.151
Table 0.17: Relative fresh weight, day 2
Source of variation d.f. s.s. m.s. v.r. F pr. Type 1 0.34022 0.34022 20.74 <0.001 Residual 38 0.62346 0.01641 Total 39 0.96368
Table 0.18: Relative fresh weight, day 4
Source of variation d.f. s.s. m.s. v.r. F pr. Type 1 0.02134 0.02134 0.88 0.354 Residual 38 0.91988 0.91988 Total 39 0.94123 0.94123
Table 0.19: Relative fresh weight, day 6
Source of variation d.f. s.s. m.s. v.r. F pr. Type 1 0.00217 0.00217 0.05 0.829 Residual 38 1.73110 0.04556 Total 39 1.73327
Table 0.20: Relative fresh weight, day 8
Source of variation d.f. s.s. m.s. v.r. F pr. Type 1 0.001 0.0011 0.01 0.921 Residual 38 4.2547 0.1120 Total 39 4.2558
Table 0.21: Relative fresh weight, day 10
Source of variation d.f. s.s. m.s. v.r. F pr. Type 1 0.08284 0.08284 1.45 0.235 Residual 38 2.16623 0.5701 Total 39 2.24908
Table 0.22: Relative fresh weight, day 12
Source of variation d.f. s.s. m.s. v.r. F pr. Type 1 0.24518 0.24518 3.43 0.072 Residual 38 2.71671 0.07149 Total 39 2.96189
Table 0.23: TSS day 0
Source of variation d.f. s.s. m.s. v.r. F pr. Banana stratum Type 1 2.1125 2.1125 1.22 0.277 Residual 38 65.9670 1.7360 2.32 Ban.Type.meth. st. Method 1 1463.7605 1463.7605 1953.94 <0.001 Type.Method 1 10.5125 10.5125 14.03 <0.001 Residual 38 28.4670 0.7491
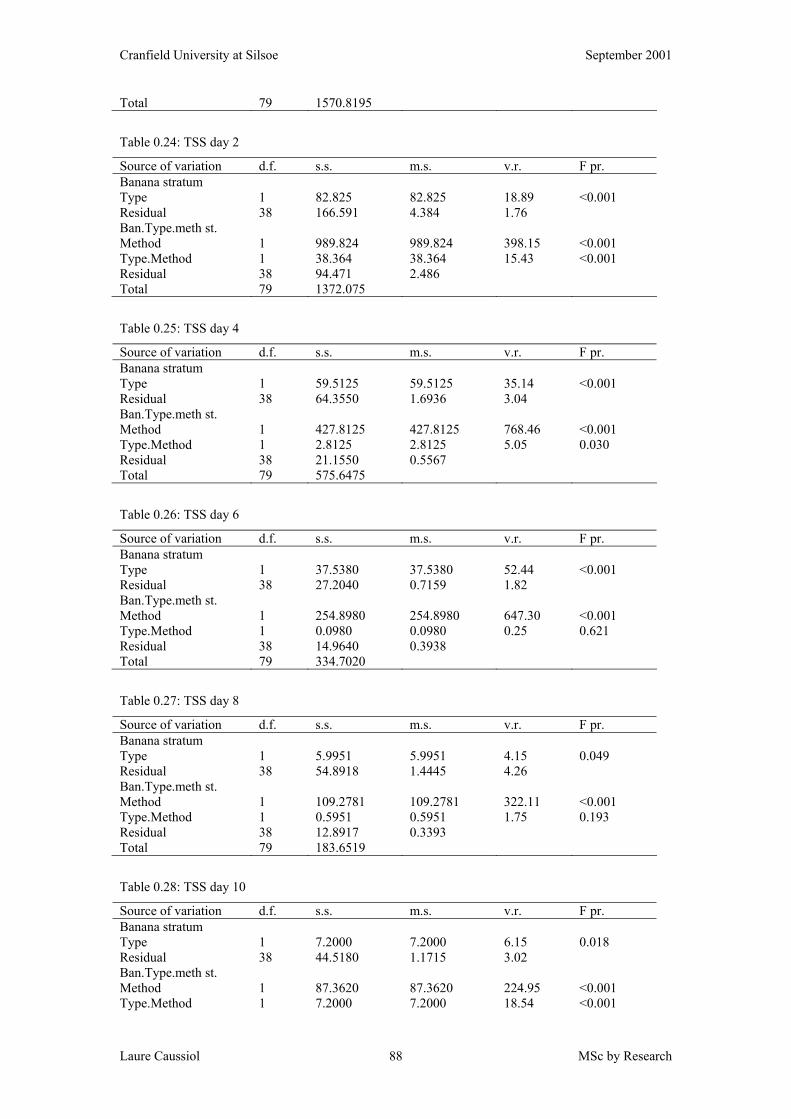
Cranfield University at Silsoe September 2001
Laure Caussiol MSc by Research 88
Total 79 1570.8195
Table 0.24: TSS day 2
Source of variation d.f. s.s. m.s. v.r. F pr. Banana stratum Type 1 82.825 82.825 18.89 <0.001 Residual 38 166.591 4.384 1.76 Ban.Type.meth st. Method 1 989.824 989.824 398.15 <0.001 Type.Method 1 38.364 38.364 15.43 <0.001 Residual 38 94.471 2.486 Total 79 1372.075
Table 0.25: TSS day 4
Source of variation d.f. s.s. m.s. v.r. F pr. Banana stratum Type 1 59.5125 59.5125 35.14 <0.001 Residual 38 64.3550 1.6936 3.04 Ban.Type.meth st. Method 1 427.8125 427.8125 768.46 <0.001 Type.Method 1 2.8125 2.8125 5.05 0.030 Residual 38 21.1550 0.5567 Total 79 575.6475
Table 0.26: TSS day 6
Source of variation d.f. s.s. m.s. v.r. F pr. Banana stratum Type 1 37.5380 37.5380 52.44 <0.001 Residual 38 27.2040 0.7159 1.82 Ban.Type.meth st. Method 1 254.8980 254.8980 647.30 <0.001 Type.Method 1 0.0980 0.0980 0.25 0.621 Residual 38 14.9640 0.3938 Total 79 334.7020
Table 0.27: TSS day 8
Source of variation d.f. s.s. m.s. v.r. F pr. Banana stratum Type 1 5.9951 5.9951 4.15 0.049 Residual 38 54.8918 1.4445 4.26 Ban.Type.meth st. Method 1 109.2781 109.2781 322.11 <0.001 Type.Method 1 0.5951 0.5951 1.75 0.193 Residual 38 12.8917 0.3393 Total 79 183.6519
Table 0.28: TSS day 10
Source of variation d.f. s.s. m.s. v.r. F pr. Banana stratum Type 1 7.2000 7.2000 6.15 0.018 Residual 38 44.5180 1.1715 3.02 Ban.Type.meth st. Method 1 87.3620 87.3620 224.95 <0.001 Type.Method 1 7.2000 7.2000 18.54 <0.001
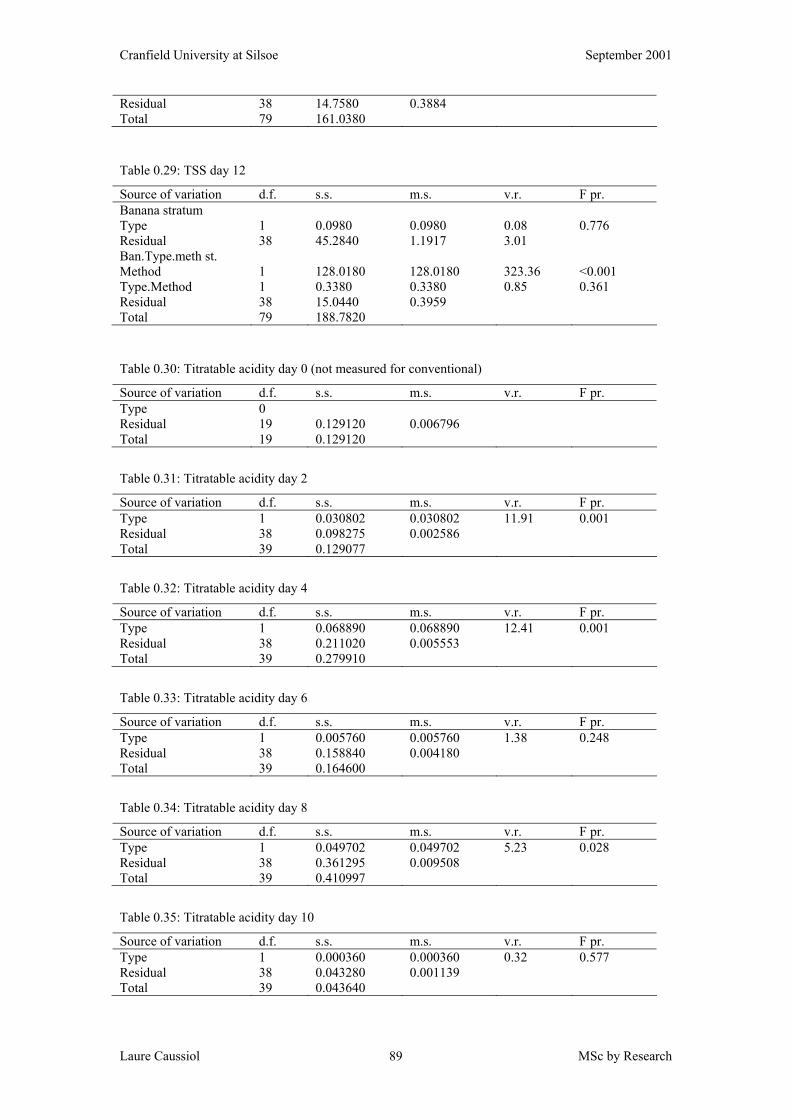
Cranfield University at Silsoe September 2001
Laure Caussiol MSc by Research 89
Residual 38 14.7580 0.3884 Total 79 161.0380
Table 0.29: TSS day 12
Source of variation d.f. s.s. m.s. v.r. F pr. Banana stratum Type 1 0.0980 0.0980 0.08 0.776 Residual 38 45.2840 1.1917 3.01 Ban.Type.meth st. Method 1 128.0180 128.0180 323.36 <0.001 Type.Method 1 0.3380 0.3380 0.85 0.361 Residual 38 15.0440 0.3959 Total 79 188.7820
Table 0.30: Titratable acidity day 0 (not measured for conventional)
Source of variation d.f. s.s. m.s. v.r. F pr. Type 0 Residual 19 0.129120 0.006796 Total 19 0.129120
Table 0.31: Titratable acidity day 2
Source of variation d.f. s.s. m.s. v.r. F pr. Type 1 0.030802 0.030802 11.91 0.001 Residual 38 0.098275 0.002586 Total 39 0.129077
Table 0.32: Titratable acidity day 4
Source of variation d.f. s.s. m.s. v.r. F pr. Type 1 0.068890 0.068890 12.41 0.001 Residual 38 0.211020 0.005553 Total 39 0.279910
Table 0.33: Titratable acidity day 6
Source of variation d.f. s.s. m.s. v.r. F pr. Type 1 0.005760 0.005760 1.38 0.248 Residual 38 0.158840 0.004180 Total 39 0.164600
Table 0.34: Titratable acidity day 8
Source of variation d.f. s.s. m.s. v.r. F pr. Type 1 0.049702 0.049702 5.23 0.028 Residual 38 0.361295 0.009508 Total 39 0.410997
Table 0.35: Titratable acidity day 10
Source of variation d.f. s.s. m.s. v.r. F pr. Type 1 0.000360 0.000360 0.32 0.577 Residual 38 0.043280 0.001139 Total 39 0.043640
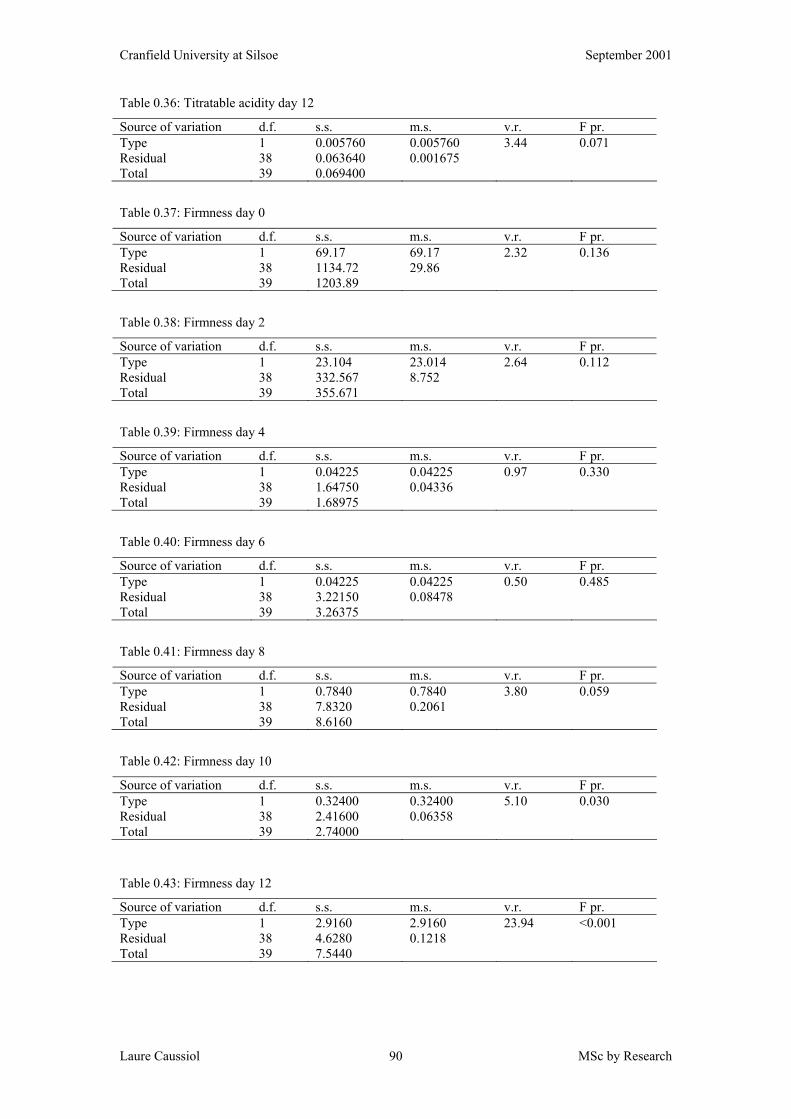
Cranfield University at Silsoe September 2001
Laure Caussiol MSc by Research 90
Table 0.36: Titratable acidity day 12
Source of variation d.f. s.s. m.s. v.r. F pr. Type 1 0.005760 0.005760 3.44 0.071 Residual 38 0.063640 0.001675 Total 39 0.069400
Table 0.37: Firmness day 0
Source of variation d.f. s.s. m.s. v.r. F pr. Type 1 69.17 69.17 2.32 0.136 Residual 38 1134.72 29.86 Total 39 1203.89
Table 0.38: Firmness day 2
Source of variation d.f. s.s. m.s. v.r. F pr. Type 1 23.104 23.014 2.64 0.112 Residual 38 332.567 8.752 Total 39 355.671
Table 0.39: Firmness day 4
Source of variation d.f. s.s. m.s. v.r. F pr. Type 1 0.04225 0.04225 0.97 0.330 Residual 38 1.64750 0.04336 Total 39 1.68975
Table 0.40: Firmness day 6
Source of variation d.f. s.s. m.s. v.r. F pr. Type 1 0.04225 0.04225 0.50 0.485 Residual 38 3.22150 0.08478 Total 39 3.26375
Table 0.41: Firmness day 8
Source of variation d.f. s.s. m.s. v.r. F pr. Type 1 0.7840 0.7840 3.80 0.059 Residual 38 7.8320 0.2061 Total 39 8.6160
Table 0.42: Firmness day 10
Source of variation d.f. s.s. m.s. v.r. F pr. Type 1 0.32400 0.32400 5.10 0.030 Residual 38 2.41600 0.06358 Total 39 2.74000
Table 0.43: Firmness day 12
Source of variation d.f. s.s. m.s. v.r. F pr. Type 1 2.9160 2.9160 23.94 <0.001 Residual 38 4.6280 0.1218 Total 39 7.5440
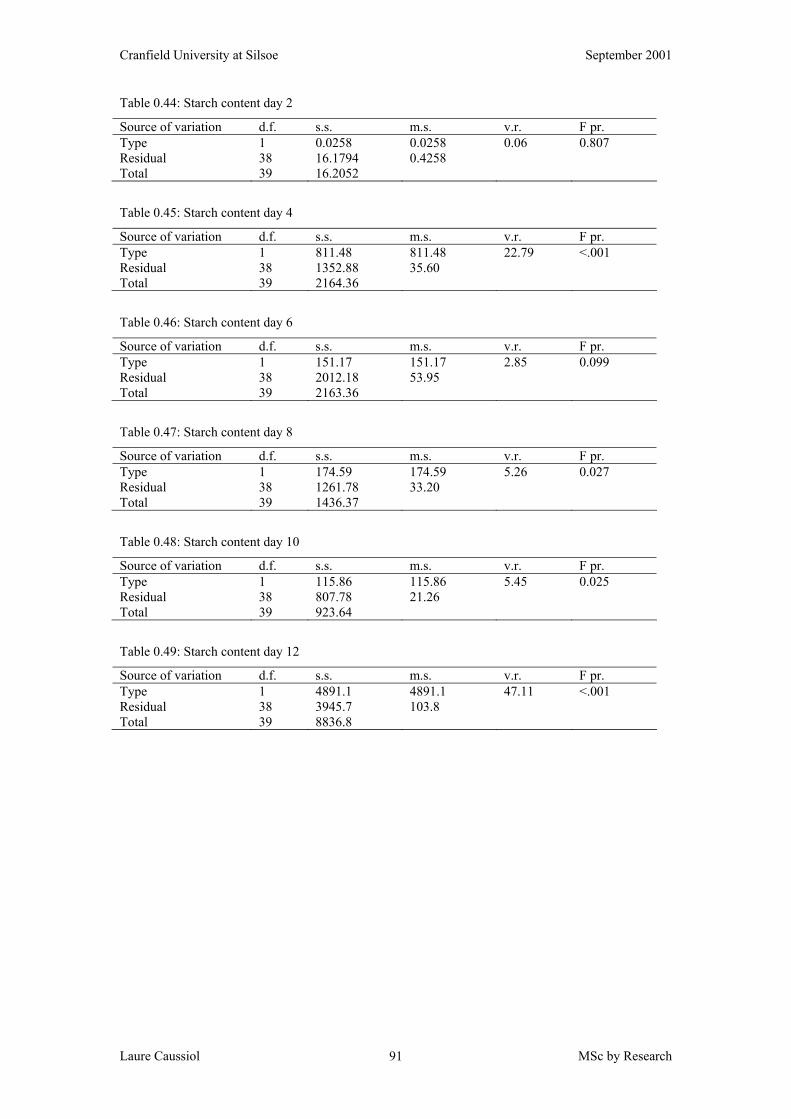
Cranfield University at Silsoe September 2001
Laure Caussiol MSc by Research 91
Table 0.44: Starch content day 2
Source of variation d.f. s.s. m.s. v.r. F pr. Type 1 0.0258 0.0258 0.06 0.807 Residual 38 16.1794 0.4258 Total 39 16.2052
Table 0.45: Starch content day 4
Source of variation d.f. s.s. m.s. v.r. F pr. Type 1 811.48 811.48 22.79 <.001 Residual 38 1352.88 35.60 Total 39 2164.36
Table 0.46: Starch content day 6
Source of variation d.f. s.s. m.s. v.r. F pr. Type 1 151.17 151.17 2.85 0.099 Residual 38 2012.18 53.95 Total 39 2163.36
Table 0.47: Starch content day 8
Source of variation d.f. s.s. m.s. v.r. F pr. Type 1 174.59 174.59 5.26 0.027 Residual 38 1261.78 33.20 Total 39 1436.37
Table 0.48: Starch content day 10
Source of variation d.f. s.s. m.s. v.r. F pr. Type 1 115.86 115.86 5.45 0.025 Residual 38 807.78 21.26 Total 39 923.64
Table 0.49: Starch content day 12
Source of variation d.f. s.s. m.s. v.r. F pr. Type 1 4891.1 4891.1 47.11 <.001 Residual 38 3945.7 103.8 Total 39 8836.8
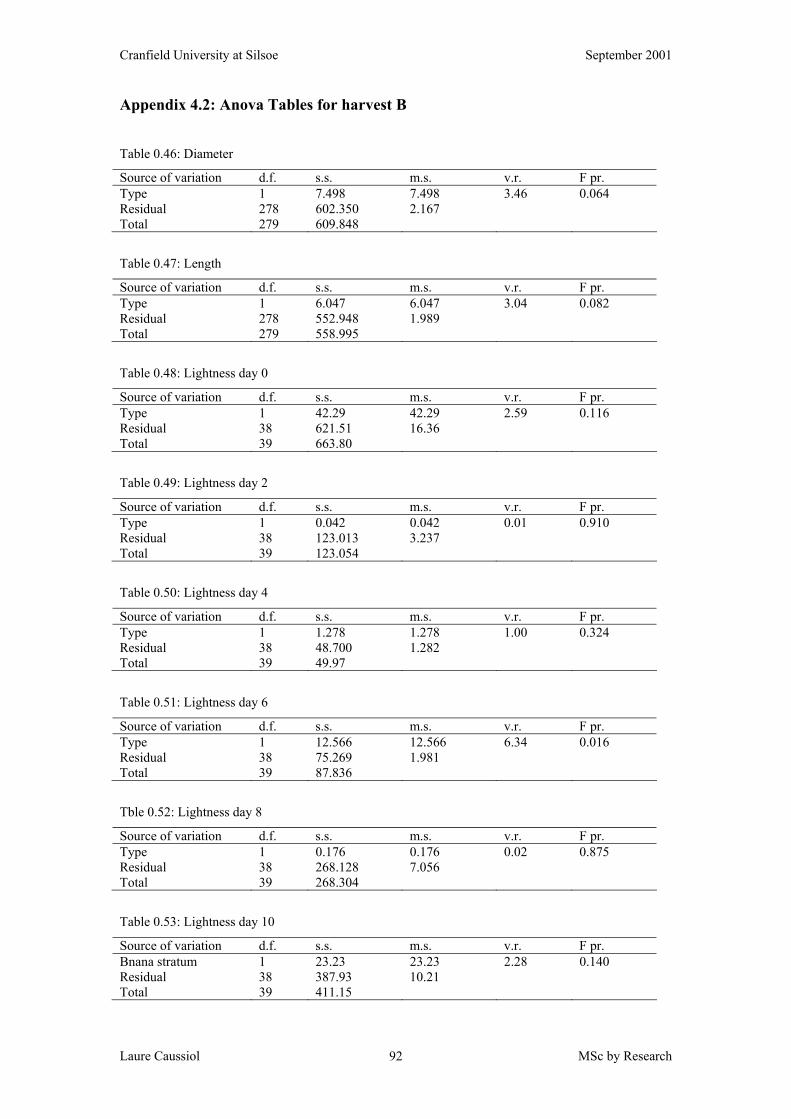
Cranfield University at Silsoe September 2001
Laure Caussiol MSc by Research 92
Appendix 4.2: Anova Tables for harvest B
Table 0.46: Diameter
Source of variation d.f. s.s. m.s. v.r. F pr. Type 1 7.498 7.498 3.46 0.064 Residual 278 602.350 2.167 Total 279 609.848
Table 0.47: Length
Source of variation d.f. s.s. m.s. v.r. F pr. Type 1 6.047 6.047 3.04 0.082 Residual 278 552.948 1.989 Total 279 558.995
Table 0.48: Lightness day 0
Source of variation d.f. s.s. m.s. v.r. F pr. Type 1 42.29 42.29 2.59 0.116 Residual 38 621.51 16.36 Total 39 663.80
Table 0.49: Lightness day 2
Source of variation d.f. s.s. m.s. v.r. F pr. Type 1 0.042 0.042 0.01 0.910 Residual 38 123.013 3.237 Total 39 123.054
Table 0.50: Lightness day 4
Source of variation d.f. s.s. m.s. v.r. F pr. Type 1 1.278 1.278 1.00 0.324 Residual 38 48.700 1.282 Total 39 49.97
Table 0.51: Lightness day 6
Source of variation d.f. s.s. m.s. v.r. F pr. Type 1 12.566 12.566 6.34 0.016 Residual 38 75.269 1.981 Total 39 87.836
Tble 0.52: Lightness day 8
Source of variation d.f. s.s. m.s. v.r. F pr. Type 1 0.176 0.176 0.02 0.875 Residual 38 268.128 7.056 Total 39 268.304
Table 0.53: Lightness day 10
Source of variation d.f. s.s. m.s. v.r. F pr. Bnana stratum 1 23.23 23.23 2.28 0.140 Residual 38 387.93 10.21 Total 39 411.15
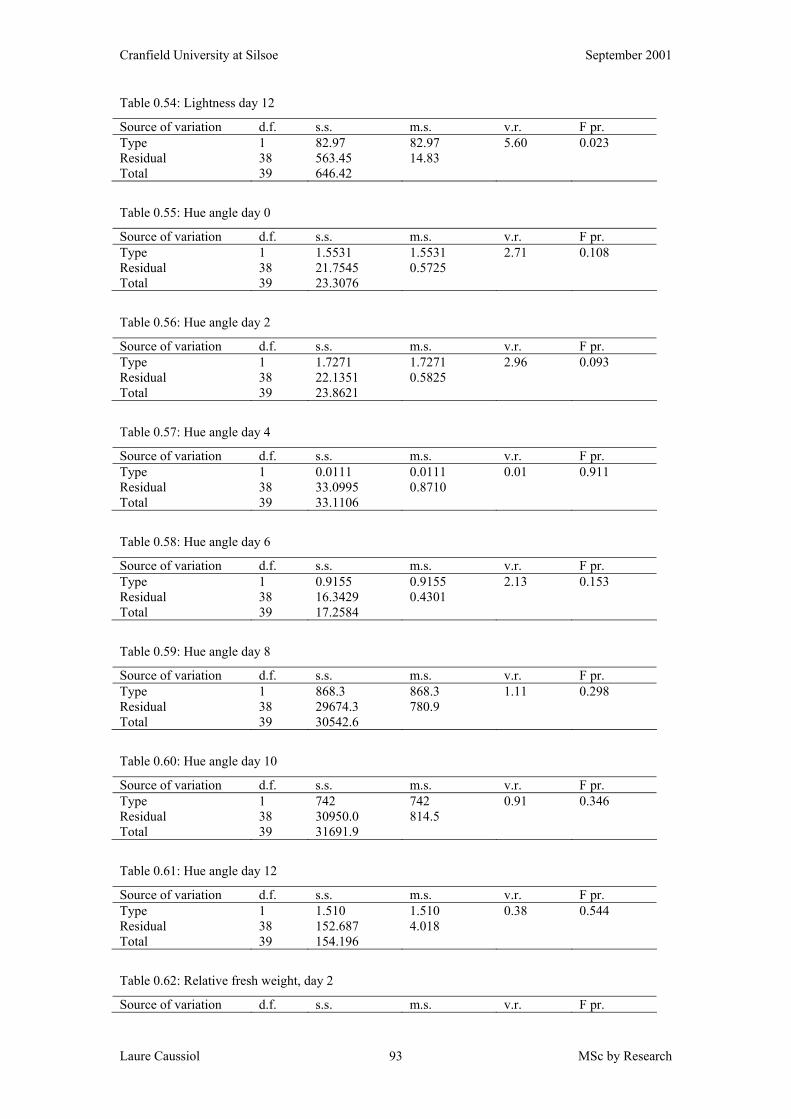
Cranfield University at Silsoe September 2001
Laure Caussiol MSc by Research 93
Table 0.54: Lightness day 12
Source of variation d.f. s.s. m.s. v.r. F pr. Type 1 82.97 82.97 5.60 0.023 Residual 38 563.45 14.83 Total 39 646.42
Table 0.55: Hue angle day 0
Source of variation d.f. s.s. m.s. v.r. F pr. Type 1 1.5531 1.5531 2.71 0.108 Residual 38 21.7545 0.5725 Total 39 23.3076
Table 0.56: Hue angle day 2
Source of variation d.f. s.s. m.s. v.r. F pr. Type 1 1.7271 1.7271 2.96 0.093 Residual 38 22.1351 0.5825 Total 39 23.8621
Table 0.57: Hue angle day 4
Source of variation d.f. s.s. m.s. v.r. F pr. Type 1 0.0111 0.0111 0.01 0.911 Residual 38 33.0995 0.8710 Total 39 33.1106
Table 0.58: Hue angle day 6
Source of variation d.f. s.s. m.s. v.r. F pr. Type 1 0.9155 0.9155 2.13 0.153 Residual 38 16.3429 0.4301 Total 39 17.2584
Table 0.59: Hue angle day 8
Source of variation d.f. s.s. m.s. v.r. F pr. Type 1 868.3 868.3 1.11 0.298 Residual 38 29674.3 780.9 Total 39 30542.6
Table 0.60: Hue angle day 10
Source of variation d.f. s.s. m.s. v.r. F pr. Type 1 742 742 0.91 0.346 Residual 38 30950.0 814.5 Total 39 31691.9
Table 0.61: Hue angle day 12
Source of variation d.f. s.s. m.s. v.r. F pr. Type 1 1.510 1.510 0.38 0.544 Residual 38 152.687 4.018 Total 39 154.196
Table 0.62: Relative fresh weight, day 2
Source of variation d.f. s.s. m.s. v.r. F pr.
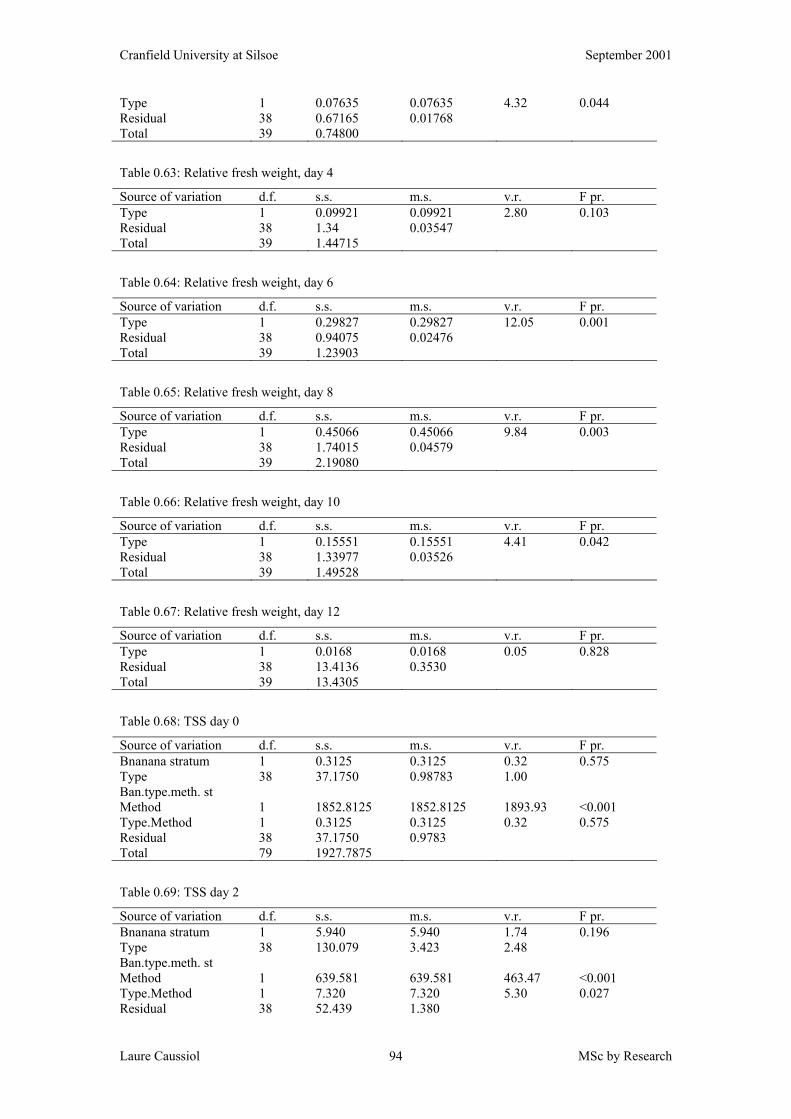
Cranfield University at Silsoe September 2001
Laure Caussiol MSc by Research 94
Type 1 0.07635 0.07635 4.32 0.044 Residual 38 0.67165 0.01768 Total 39 0.74800
Table 0.63: Relative fresh weight, day 4
Source of variation d.f. s.s. m.s. v.r. F pr. Type 1 0.09921 0.09921 2.80 0.103 Residual 38 1.34 0.03547 Total 39 1.44715
Table 0.64: Relative fresh weight, day 6
Source of variation d.f. s.s. m.s. v.r. F pr. Type 1 0.29827 0.29827 12.05 0.001 Residual 38 0.94075 0.02476 Total 39 1.23903
Table 0.65: Relative fresh weight, day 8
Source of variation d.f. s.s. m.s. v.r. F pr. Type 1 0.45066 0.45066 9.84 0.003 Residual 38 1.74015 0.04579 Total 39 2.19080
Table 0.66: Relative fresh weight, day 10
Source of variation d.f. s.s. m.s. v.r. F pr. Type 1 0.15551 0.15551 4.41 0.042 Residual 38 1.33977 0.03526 Total 39 1.49528
Table 0.67: Relative fresh weight, day 12
Source of variation d.f. s.s. m.s. v.r. F pr. Type 1 0.0168 0.0168 0.05 0.828 Residual 38 13.4136 0.3530 Total 39 13.4305
Table 0.68: TSS day 0
Source of variation d.f. s.s. m.s. v.r. F pr. Bnanana stratum 1 0.3125 0.3125 0.32 0.575 Type 38 37.1750 0.98783 1.00 Ban.type.meth. st Method 1 1852.8125 1852.8125 1893.93 <0.001 Type.Method 1 0.3125 0.3125 0.32 0.575 Residual 38 37.1750 0.9783 Total 79 1927.7875
Table 0.69: TSS day 2
Source of variation d.f. s.s. m.s. v.r. F pr. Bnanana stratum 1 5.940 5.940 1.74 0.196 Type 38 130.079 3.423 2.48 Ban.type.meth. st Method 1 639.581 639.581 463.47 <0.001 Type.Method 1 7.320 7.320 5.30 0.027 Residual 38 52.439 1.380
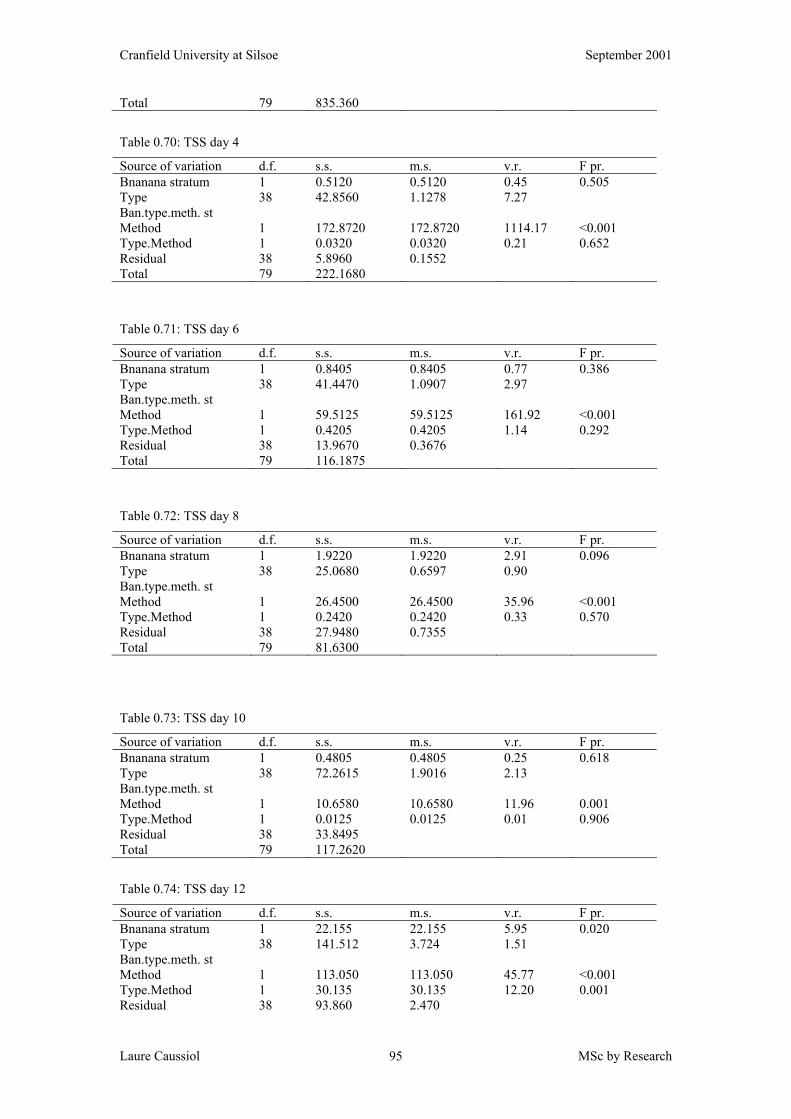
Cranfield University at Silsoe September 2001
Laure Caussiol MSc by Research 95
Total 79 835.360
Table 0.70: TSS day 4
Source of variation d.f. s.s. m.s. v.r. F pr. Bnanana stratum 1 0.5120 0.5120 0.45 0.505 Type 38 42.8560 1.1278 7.27 Ban.type.meth. st Method 1 172.8720 172.8720 1114.17 <0.001 Type.Method 1 0.0320 0.0320 0.21 0.652 Residual 38 5.8960 0.1552 Total 79 222.1680
Table 0.71: TSS day 6
Source of variation d.f. s.s. m.s. v.r. F pr. Bnanana stratum 1 0.8405 0.8405 0.77 0.386 Type 38 41.4470 1.0907 2.97 Ban.type.meth. st Method 1 59.5125 59.5125 161.92 <0.001 Type.Method 1 0.4205 0.4205 1.14 0.292 Residual 38 13.9670 0.3676 Total 79 116.1875
Table 0.72: TSS day 8
Source of variation d.f. s.s. m.s. v.r. F pr. Bnanana stratum 1 1.9220 1.9220 2.91 0.096 Type 38 25.0680 0.6597 0.90 Ban.type.meth. st Method 1 26.4500 26.4500 35.96 <0.001 Type.Method 1 0.2420 0.2420 0.33 0.570 Residual 38 27.9480 0.7355 Total 79 81.6300
Table 0.73: TSS day 10
Source of variation d.f. s.s. m.s. v.r. F pr. Bnanana stratum 1 0.4805 0.4805 0.25 0.618 Type 38 72.2615 1.9016 2.13 Ban.type.meth. st Method 1 10.6580 10.6580 11.96 0.001 Type.Method 1 0.0125 0.0125 0.01 0.906 Residual 38 33.8495 Total 79 117.2620
Table 0.74: TSS day 12
Source of variation d.f. s.s. m.s. v.r. F pr. Bnanana stratum 1 22.155 22.155 5.95 0.020 Type 38 141.512 3.724 1.51 Ban.type.meth. st Method 1 113.050 113.050 45.77 <0.001 Type.Method 1 30.135 30.135 12.20 0.001 Residual 38 93.860 2.470
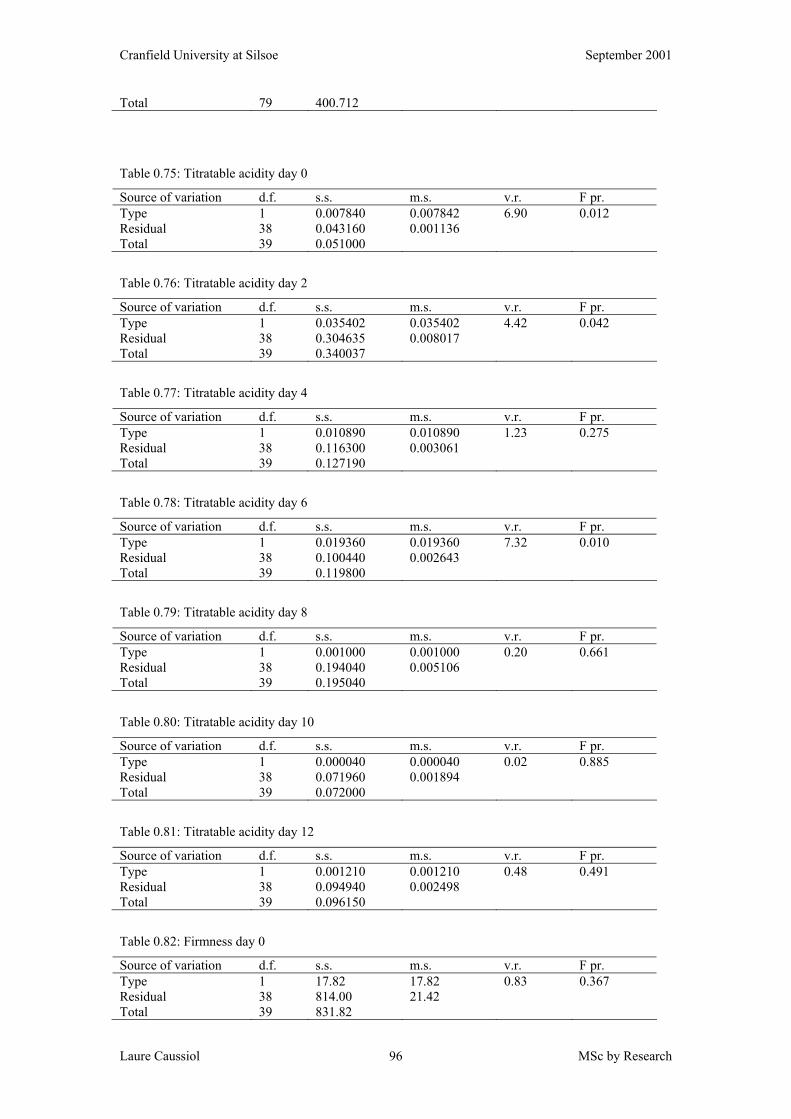
Cranfield University at Silsoe September 2001
Laure Caussiol MSc by Research 96
Total 79 400.712
Table 0.75: Titratable acidity day 0
Source of variation d.f. s.s. m.s. v.r. F pr. Type 1 0.007840 0.007842 6.90 0.012 Residual 38 0.043160 0.001136 Total 39 0.051000
Table 0.76: Titratable acidity day 2
Source of variation d.f. s.s. m.s. v.r. F pr. Type 1 0.035402 0.035402 4.42 0.042 Residual 38 0.304635 0.008017 Total 39 0.340037
Table 0.77: Titratable acidity day 4
Source of variation d.f. s.s. m.s. v.r. F pr. Type 1 0.010890 0.010890 1.23 0.275 Residual 38 0.116300 0.003061 Total 39 0.127190
Table 0.78: Titratable acidity day 6
Source of variation d.f. s.s. m.s. v.r. F pr. Type 1 0.019360 0.019360 7.32 0.010 Residual 38 0.100440 0.002643 Total 39 0.119800
Table 0.79: Titratable acidity day 8
Source of variation d.f. s.s. m.s. v.r. F pr. Type 1 0.001000 0.001000 0.20 0.661 Residual 38 0.194040 0.005106 Total 39 0.195040
Table 0.80: Titratable acidity day 10
Source of variation d.f. s.s. m.s. v.r. F pr. Type 1 0.000040 0.000040 0.02 0.885 Residual 38 0.071960 0.001894 Total 39 0.072000
Table 0.81: Titratable acidity day 12
Source of variation d.f. s.s. m.s. v.r. F pr. Type 1 0.001210 0.001210 0.48 0.491 Residual 38 0.094940 0.002498 Total 39 0.096150
Table 0.82: Firmness day 0
Source of variation d.f. s.s. m.s. v.r. F pr. Type 1 17.82 17.82 0.83 0.367 Residual 38 814.00 21.42 Total 39 831.82
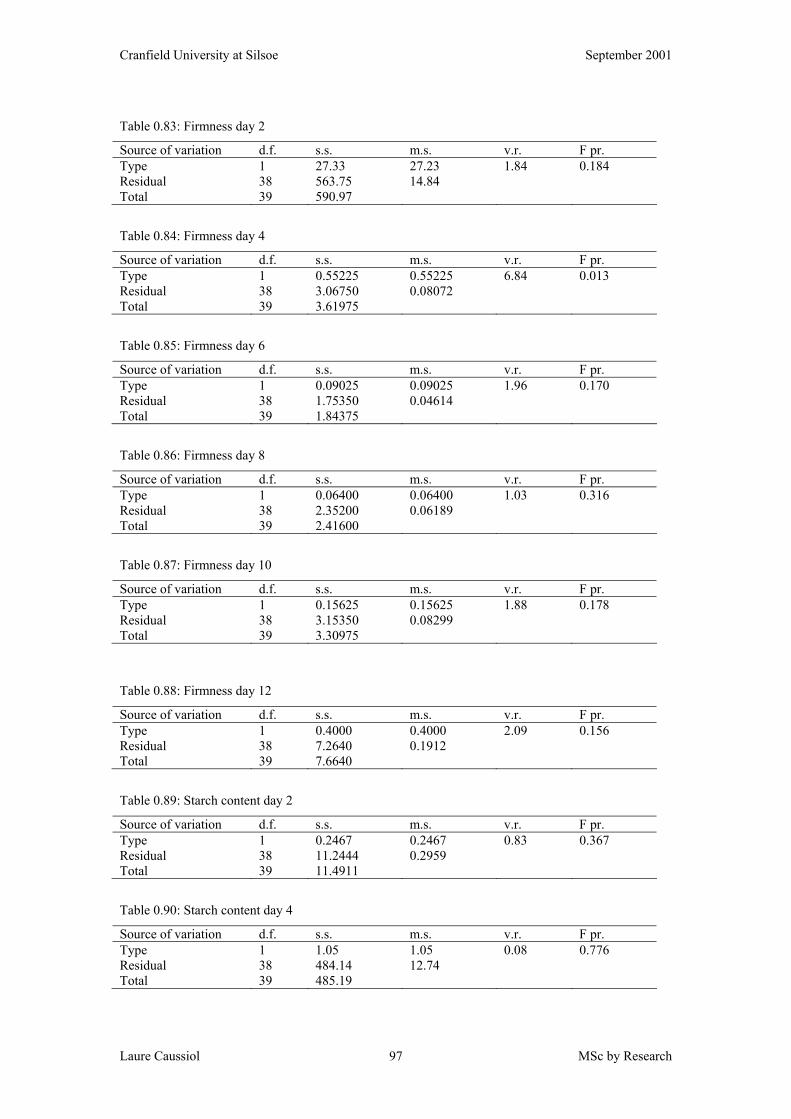
Cranfield University at Silsoe September 2001
Laure Caussiol MSc by Research 97
Table 0.83: Firmness day 2
Source of variation d.f. s.s. m.s. v.r. F pr. Type 1 27.33 27.23 1.84 0.184 Residual 38 563.75 14.84 Total 39 590.97
Table 0.84: Firmness day 4
Source of variation d.f. s.s. m.s. v.r. F pr. Type 1 0.55225 0.55225 6.84 0.013 Residual 38 3.06750 0.08072 Total 39 3.61975
Table 0.85: Firmness day 6
Source of variation d.f. s.s. m.s. v.r. F pr. Type 1 0.09025 0.09025 1.96 0.170 Residual 38 1.75350 0.04614 Total 39 1.84375
Table 0.86: Firmness day 8
Source of variation d.f. s.s. m.s. v.r. F pr. Type 1 0.06400 0.06400 1.03 0.316 Residual 38 2.35200 0.06189 Total 39 2.41600
Table 0.87: Firmness day 10
Source of variation d.f. s.s. m.s. v.r. F pr. Type 1 0.15625 0.15625 1.88 0.178 Residual 38 3.15350 0.08299 Total 39 3.30975
Table 0.88: Firmness day 12
Source of variation d.f. s.s. m.s. v.r. F pr. Type 1 0.4000 0.4000 2.09 0.156 Residual 38 7.2640 0.1912 Total 39 7.6640
Table 0.89: Starch content day 2
Source of variation d.f. s.s. m.s. v.r. F pr. Type 1 0.2467 0.2467 0.83 0.367 Residual 38 11.2444 0.2959 Total 39 11.4911
Table 0.90: Starch content day 4
Source of variation d.f. s.s. m.s. v.r. F pr. Type 1 1.05 1.05 0.08 0.776 Residual 38 484.14 12.74 Total 39 485.19
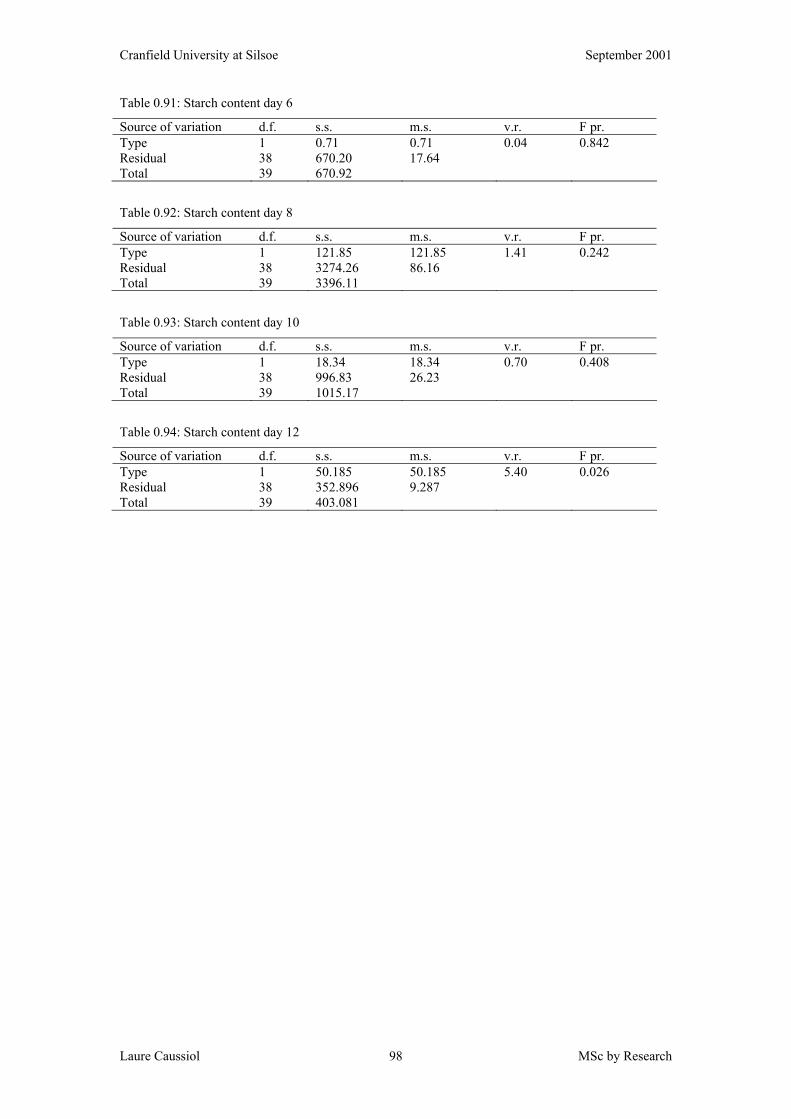
Cranfield University at Silsoe September 2001
Laure Caussiol MSc by Research 98
Table 0.91: Starch content day 6
Source of variation d.f. s.s. m.s. v.r. F pr. Type 1 0.71 0.71 0.04 0.842 Residual 38 670.20 17.64 Total 39 670.92
Table 0.92: Starch content day 8
Source of variation d.f. s.s. m.s. v.r. F pr. Type 1 121.85 121.85 1.41 0.242 Residual 38 3274.26 86.16 Total 39 3396.11
Table 0.93: Starch content day 10
Source of variation d.f. s.s. m.s. v.r. F pr. Type 1 18.34 18.34 0.70 0.408 Residual 38 996.83 26.23 Total 39 1015.17
Table 0.94: Starch content day 12
Source of variation d.f. s.s. m.s. v.r. F pr. Type 1 50.185 50.185 5.40 0.026 Residual 38 352.896 9.287 Total 39 403.081
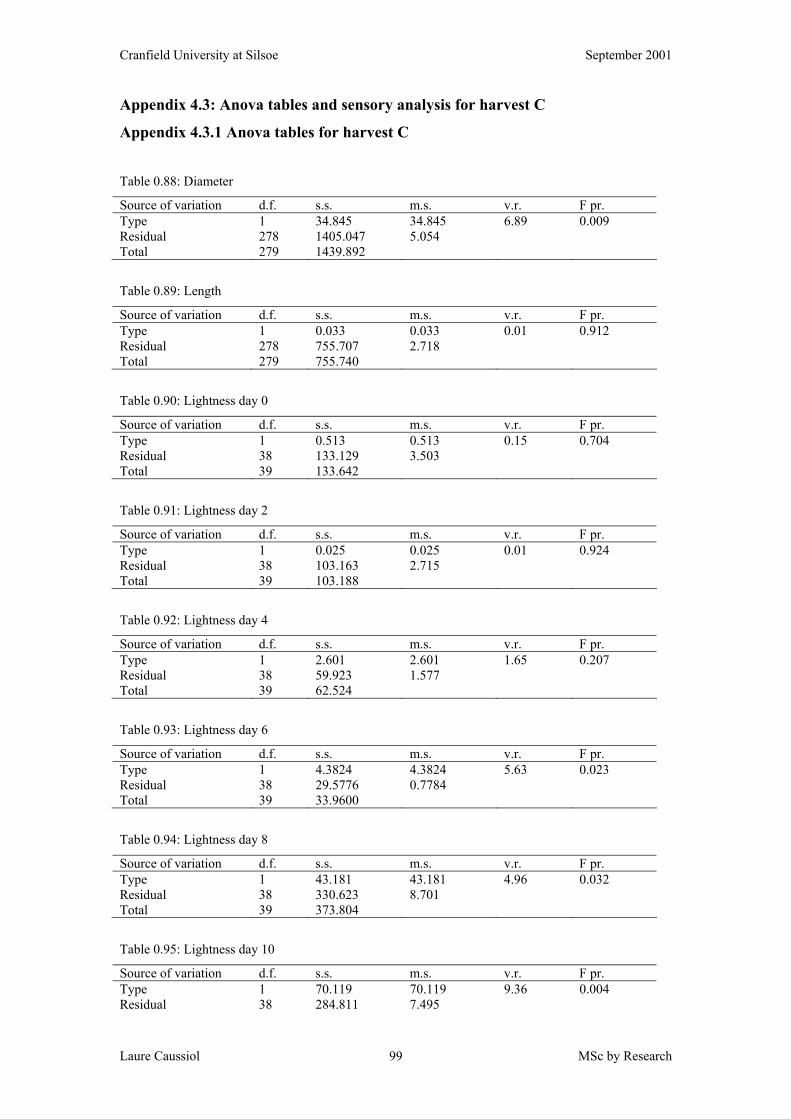
Cranfield University at Silsoe September 2001
Laure Caussiol MSc by Research 99
Appendix 4.3: Anova tables and sensory analysis for harvest C
Appendix 4.3.1 Anova tables for harvest C
Table 0.88: Diameter
Source of variation d.f. s.s. m.s. v.r. F pr. Type 1 34.845 34.845 6.89 0.009 Residual 278 1405.047 5.054 Total 279 1439.892
Table 0.89: Length
Source of variation d.f. s.s. m.s. v.r. F pr. Type 1 0.033 0.033 0.01 0.912 Residual 278 755.707 2.718 Total 279 755.740
Table 0.90: Lightness day 0
Source of variation d.f. s.s. m.s. v.r. F pr. Type 1 0.513 0.513 0.15 0.704 Residual 38 133.129 3.503 Total 39 133.642
Table 0.91: Lightness day 2
Source of variation d.f. s.s. m.s. v.r. F pr. Type 1 0.025 0.025 0.01 0.924 Residual 38 103.163 2.715 Total 39 103.188
Table 0.92: Lightness day 4
Source of variation d.f. s.s. m.s. v.r. F pr. Type 1 2.601 2.601 1.65 0.207 Residual 38 59.923 1.577 Total 39 62.524
Table 0.93: Lightness day 6
Source of variation d.f. s.s. m.s. v.r. F pr. Type 1 4.3824 4.3824 5.63 0.023 Residual 38 29.5776 0.7784 Total 39 33.9600
Table 0.94: Lightness day 8
Source of variation d.f. s.s. m.s. v.r. F pr. Type 1 43.181 43.181 4.96 0.032 Residual 38 330.623 8.701 Total 39 373.804
Table 0.95: Lightness day 10
Source of variation d.f. s.s. m.s. v.r. F pr. Type 1 70.119 70.119 9.36 0.004 Residual 38 284.811 7.495

Cranfield University at Silsoe September 2001
Laure Caussiol MSc by Research 100
Total 39 354.930
Table 0.96: Lightness day 12
Source of variation d.f. s.s. m.s. v.r. F pr. Type 1 20.22 20.22 1.73 0.196 Residual 38 443.79 11.68 Total 39 464.01
Table 0.97: Hue angle day 0
Source of variation d.f. s.s. m.s. v.r. F pr. Type 1 0.0894 0.0894 0.26 0.610 Residual 38 12.8658 0.3386 Total 39 12.9552
Table 0.98: Hue angle day 2
Source of variation d.f. s.s. m.s. v.r. F pr. Type 1 0.050 0.050 0.05 0.832 Residual 38 41.565 1.094 Total 39 41.615
Table 0.99: Hue angle day 4
Source of variation d.f. s.s. m.s. v.r. F pr. Type 1 1.9247 1.9247 2.47 0.125 Residual 38 29.6470 0.7802 Total 39 31.5718
Table 0.100: Hue angle day 6
Source of variation d.f. s.s. m.s. v.r. F pr. Type 1 1.3393 1.3393 5.62 0.023 Residual 38 9.0613 0.2385 Total 39 10.4006
Table 0.101: Hue angle day 8
Source of variation d.f. s.s. m.s. v.r. F pr. Type 1 15.760 15.760 8.23 0.007 Residual 38 72.787 1.915 Total 39 88.547
Table 0.102: Hue angle day 10
Source of variation d.f. s.s. m.s. v.r. F pr. Type 1 14.814 14.814 7.73 0.008 Residual 38 72.865 1.918 Total 39 87.679
Table 0.103: Hue angle day 12
Source of variation d.f. s.s. m.s. v.r. F pr. Type 1 9.373 9.373 3.72 0.061 Residual 38 95.842 2.522 Total 39 105.214
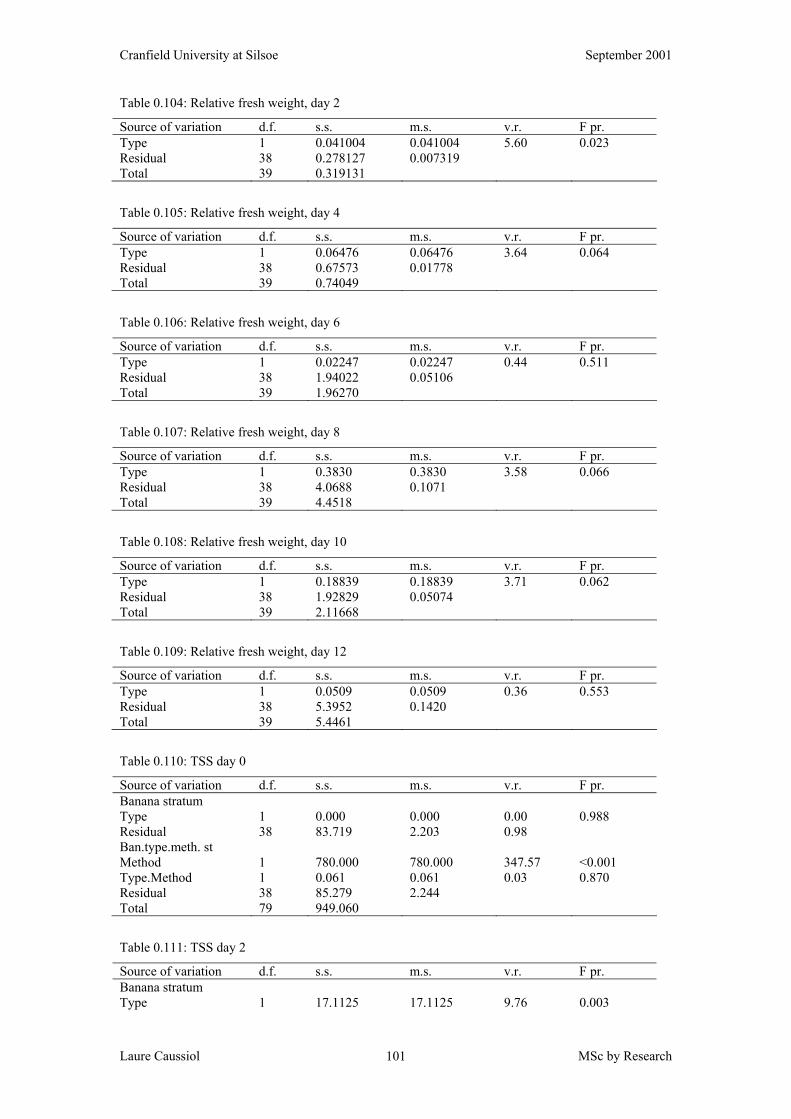
Cranfield University at Silsoe September 2001
Laure Caussiol MSc by Research 101
Table 0.104: Relative fresh weight, day 2
Source of variation d.f. s.s. m.s. v.r. F pr. Type 1 0.041004 0.041004 5.60 0.023 Residual 38 0.278127 0.007319 Total 39 0.319131
Table 0.105: Relative fresh weight, day 4
Source of variation d.f. s.s. m.s. v.r. F pr. Type 1 0.06476 0.06476 3.64 0.064 Residual 38 0.67573 0.01778 Total 39 0.74049
Table 0.106: Relative fresh weight, day 6
Source of variation d.f. s.s. m.s. v.r. F pr. Type 1 0.02247 0.02247 0.44 0.511 Residual 38 1.94022 0.05106 Total 39 1.96270
Table 0.107: Relative fresh weight, day 8
Source of variation d.f. s.s. m.s. v.r. F pr. Type 1 0.3830 0.3830 3.58 0.066 Residual 38 4.0688 0.1071 Total 39 4.4518
Table 0.108: Relative fresh weight, day 10
Source of variation d.f. s.s. m.s. v.r. F pr. Type 1 0.18839 0.18839 3.71 0.062 Residual 38 1.92829 0.05074 Total 39 2.11668
Table 0.109: Relative fresh weight, day 12
Source of variation d.f. s.s. m.s. v.r. F pr. Type 1 0.0509 0.0509 0.36 0.553 Residual 38 5.3952 0.1420 Total 39 5.4461
Table 0.110: TSS day 0
Source of variation d.f. s.s. m.s. v.r. F pr. Banana stratum Type 1 0.000 0.000 0.00 0.988 Residual 38 83.719 2.203 0.98 Ban.type.meth. st Method 1 780.000 780.000 347.57 <0.001 Type.Method 1 0.061 0.061 0.03 0.870 Residual 38 85.279 2.244 Total 79 949.060
Table 0.111: TSS day 2
Source of variation d.f. s.s. m.s. v.r. F pr. Banana stratum Type 1 17.1125 17.1125 9.76 0.003
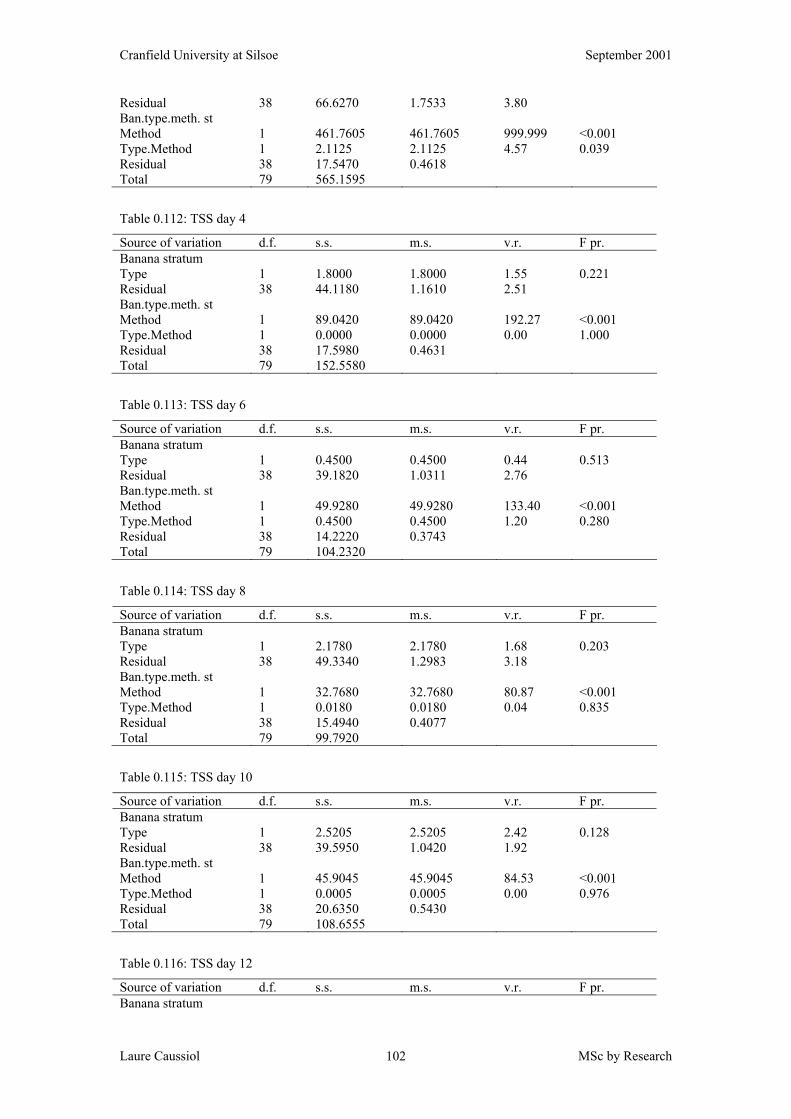
Cranfield University at Silsoe September 2001
Laure Caussiol MSc by Research 102
Residual 38 66.6270 1.7533 3.80 Ban.type.meth. st Method 1 461.7605 461.7605 999.999 <0.001 Type.Method 1 2.1125 2.1125 4.57 0.039 Residual 38 17.5470 0.4618 Total 79 565.1595
Table 0.112: TSS day 4
Source of variation d.f. s.s. m.s. v.r. F pr. Banana stratum Type 1 1.8000 1.8000 1.55 0.221 Residual 38 44.1180 1.1610 2.51 Ban.type.meth. st Method 1 89.0420 89.0420 192.27 <0.001 Type.Method 1 0.0000 0.0000 0.00 1.000 Residual 38 17.5980 0.4631 Total 79 152.5580
Table 0.113: TSS day 6
Source of variation d.f. s.s. m.s. v.r. F pr. Banana stratum Type 1 0.4500 0.4500 0.44 0.513 Residual 38 39.1820 1.0311 2.76 Ban.type.meth. st Method 1 49.9280 49.9280 133.40 <0.001 Type.Method 1 0.4500 0.4500 1.20 0.280 Residual 38 14.2220 0.3743 Total 79 104.2320
Table 0.114: TSS day 8
Source of variation d.f. s.s. m.s. v.r. F pr. Banana stratum Type 1 2.1780 2.1780 1.68 0.203 Residual 38 49.3340 1.2983 3.18 Ban.type.meth. st Method 1 32.7680 32.7680 80.87 <0.001 Type.Method 1 0.0180 0.0180 0.04 0.835 Residual 38 15.4940 0.4077 Total 79 99.7920
Table 0.115: TSS day 10
Source of variation d.f. s.s. m.s. v.r. F pr. Banana stratum Type 1 2.5205 2.5205 2.42 0.128 Residual 38 39.5950 1.0420 1.92 Ban.type.meth. st Method 1 45.9045 45.9045 84.53 <0.001 Type.Method 1 0.0005 0.0005 0.00 0.976 Residual 38 20.6350 0.5430 Total 79 108.6555
Table 0.116: TSS day 12
Source of variation d.f. s.s. m.s. v.r. F pr. Banana stratum
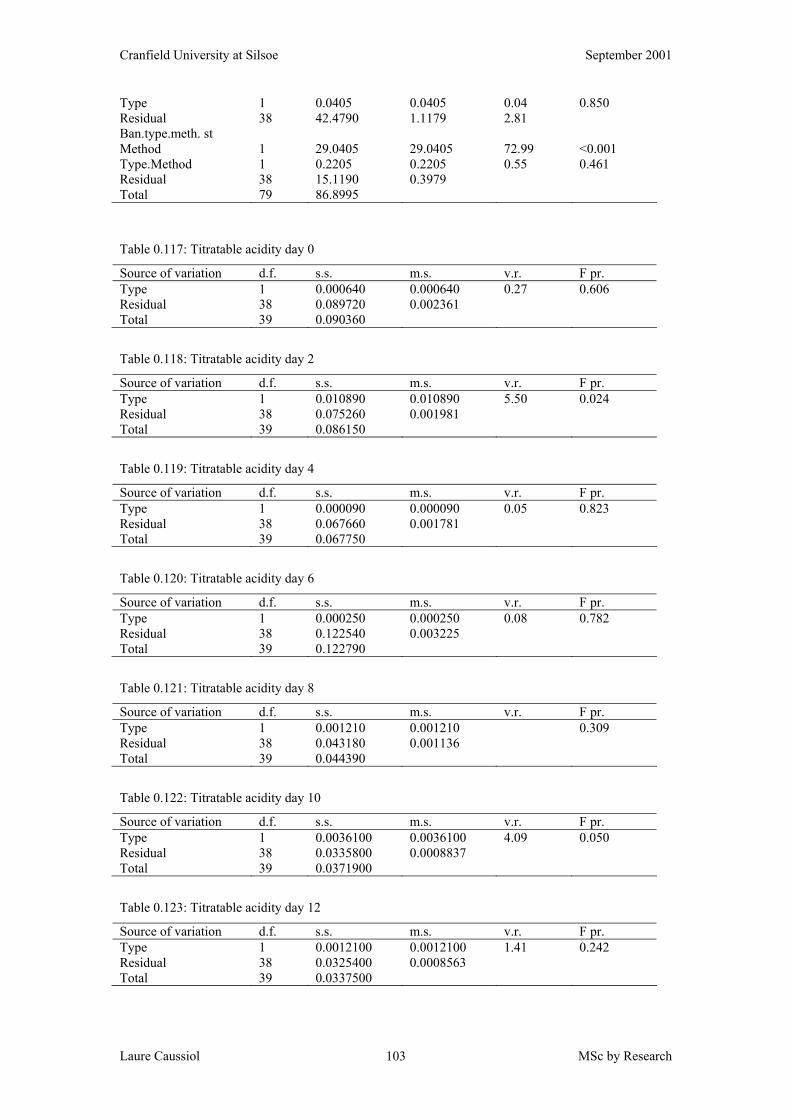
Cranfield University at Silsoe September 2001
Laure Caussiol MSc by Research 103
Type 1 0.0405 0.0405 0.04 0.850 Residual 38 42.4790 1.1179 2.81 Ban.type.meth. st Method 1 29.0405 29.0405 72.99 <0.001 Type.Method 1 0.2205 0.2205 0.55 0.461 Residual 38 15.1190 0.3979 Total 79 86.8995
Table 0.117: Titratable acidity day 0
Source of variation d.f. s.s. m.s. v.r. F pr. Type 1 0.000640 0.000640 0.27 0.606 Residual 38 0.089720 0.002361 Total 39 0.090360
Table 0.118: Titratable acidity day 2
Source of variation d.f. s.s. m.s. v.r. F pr. Type 1 0.010890 0.010890 5.50 0.024 Residual 38 0.075260 0.001981 Total 39 0.086150
Table 0.119: Titratable acidity day 4
Source of variation d.f. s.s. m.s. v.r. F pr. Type 1 0.000090 0.000090 0.05 0.823 Residual 38 0.067660 0.001781 Total 39 0.067750
Table 0.120: Titratable acidity day 6
Source of variation d.f. s.s. m.s. v.r. F pr. Type 1 0.000250 0.000250 0.08 0.782 Residual 38 0.122540 0.003225 Total 39 0.122790
Table 0.121: Titratable acidity day 8
Source of variation d.f. s.s. m.s. v.r. F pr. Type 1 0.001210 0.001210 0.309 Residual 38 0.043180 0.001136 Total 39 0.044390
Table 0.122: Titratable acidity day 10
Source of variation d.f. s.s. m.s. v.r. F pr. Type 1 0.0036100 0.0036100 4.09 0.050 Residual 38 0.0335800 0.0008837 Total 39 0.0371900
Table 0.123: Titratable acidity day 12
Source of variation d.f. s.s. m.s. v.r. F pr. Type 1 0.0012100 0.0012100 1.41 0.242 Residual 38 0.0325400 0.0008563 Total 39 0.0337500
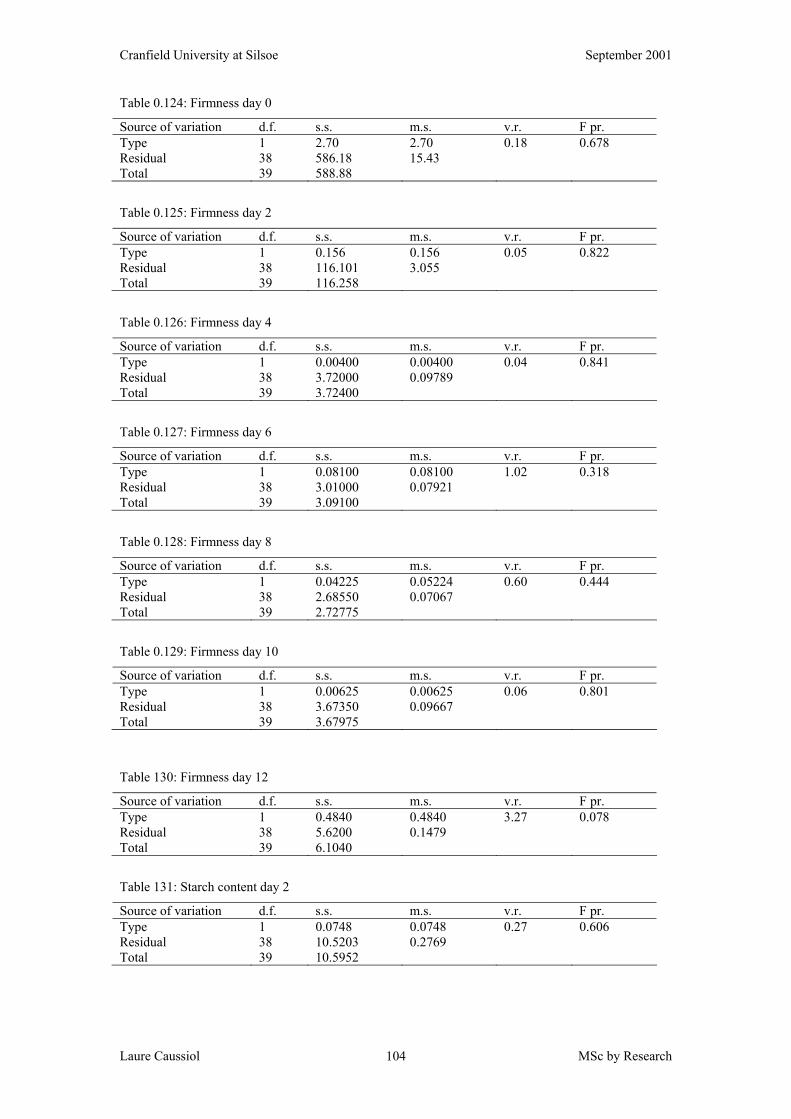
Cranfield University at Silsoe September 2001
Laure Caussiol MSc by Research 104
Table 0.124: Firmness day 0
Source of variation d.f. s.s. m.s. v.r. F pr. Type 1 2.70 2.70 0.18 0.678 Residual 38 586.18 15.43 Total 39 588.88
Table 0.125: Firmness day 2
Source of variation d.f. s.s. m.s. v.r. F pr. Type 1 0.156 0.156 0.05 0.822 Residual 38 116.101 3.055 Total 39 116.258
Table 0.126: Firmness day 4
Source of variation d.f. s.s. m.s. v.r. F pr. Type 1 0.00400 0.00400 0.04 0.841 Residual 38 3.72000 0.09789 Total 39 3.72400
Table 0.127: Firmness day 6
Source of variation d.f. s.s. m.s. v.r. F pr. Type 1 0.08100 0.08100 1.02 0.318 Residual 38 3.01000 0.07921 Total 39 3.09100
Table 0.128: Firmness day 8
Source of variation d.f. s.s. m.s. v.r. F pr. Type 1 0.04225 0.05224 0.60 0.444 Residual 38 2.68550 0.07067 Total 39 2.72775
Table 0.129: Firmness day 10
Source of variation d.f. s.s. m.s. v.r. F pr. Type 1 0.00625 0.00625 0.06 0.801 Residual 38 3.67350 0.09667 Total 39 3.67975
Table 130: Firmness day 12
Source of variation d.f. s.s. m.s. v.r. F pr. Type 1 0.4840 0.4840 3.27 0.078 Residual 38 5.6200 0.1479 Total 39 6.1040
Table 131: Starch content day 2
Source of variation d.f. s.s. m.s. v.r. F pr. Type 1 0.0748 0.0748 0.27 0.606 Residual 38 10.5203 0.2769 Total 39 10.5952
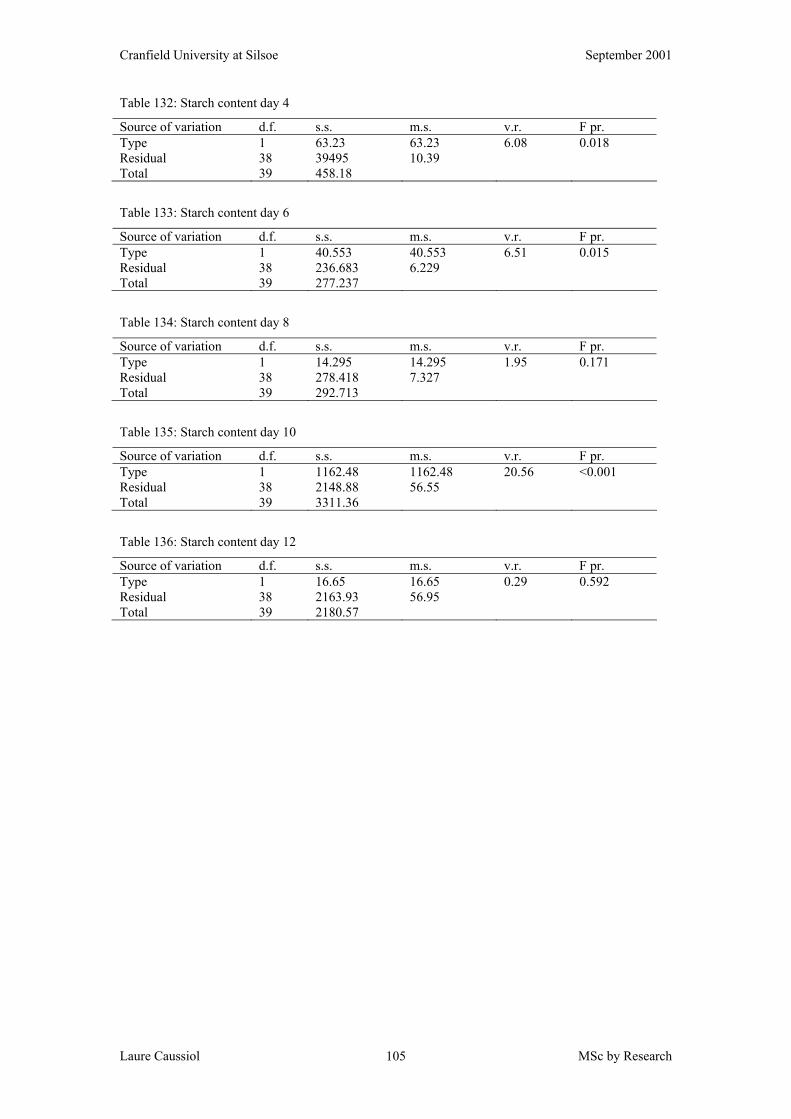
Cranfield University at Silsoe September 2001
Laure Caussiol MSc by Research 105
Table 132: Starch content day 4
Source of variation d.f. s.s. m.s. v.r. F pr. Type 1 63.23 63.23 6.08 0.018 Residual 38 39495 10.39 Total 39 458.18
Table 133: Starch content day 6
Source of variation d.f. s.s. m.s. v.r. F pr. Type 1 40.553 40.553 6.51 0.015 Residual 38 236.683 6.229 Total 39 277.237
Table 134: Starch content day 8
Source of variation d.f. s.s. m.s. v.r. F pr. Type 1 14.295 14.295 1.95 0.171 Residual 38 278.418 7.327 Total 39 292.713
Table 135: Starch content day 10
Source of variation d.f. s.s. m.s. v.r. F pr. Type 1 1162.48 1162.48 20.56 <0.001 Residual 38 2148.88 56.55 Total 39 3311.36
Table 136: Starch content day 12
Source of variation d.f. s.s. m.s. v.r. F pr. Type 1 16.65 16.65 0.29 0.592 Residual 38 2163.93 56.95 Total 39 2180.57
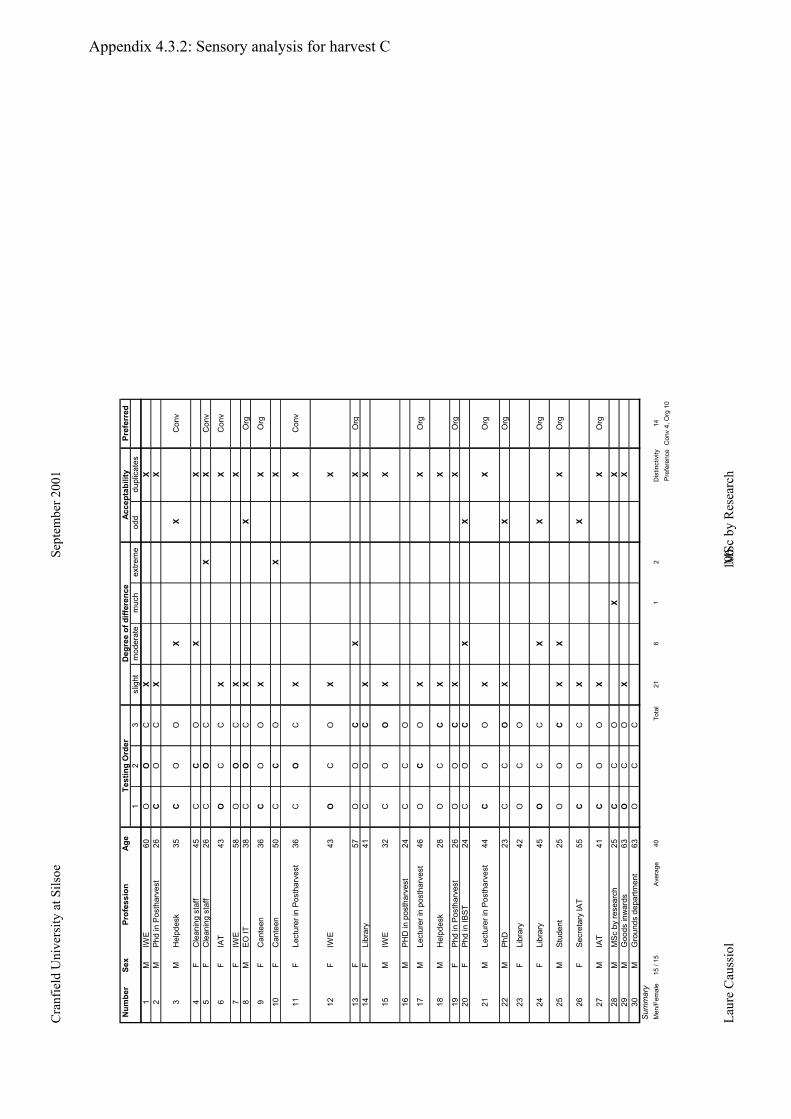
Cra
nfie
ld U
nive
rsity
at S
ilsoe
Sept
embe
r 200
1
Laur
e C
auss
iol
M
Sc b
y R
esea
rch
10
6
Num
ber
Sex
Prof
essi
onAg
ePr
efer
red
12
3sl
ight
mod
erat
em
uch
extre
me
odd
dupl
icat
es1
MIW
E60
OO
CX
X2
MPh
d in
Pos
thar
vest
26C
OC
XX
3M
Hel
pdes
k35
CO
OX
XC
onv
4F
Cle
anin
g st
aff
45C
CO
XX
5F
Cle
anin
g st
aff
26C
OC
XX
Con
v
6F
IAT
43O
CC
XX
Con
v
7F
IWE
58O
OC
XX
8M
EO IT
38C
OC
XX
Org
9F
Can
teen
36C
OO
XX
Org
10F
Can
teen
50C
CO
XX
11F
Lect
urer
in P
osth
arve
st36
CO
CX
XC
onv
12F
IWE
43O
CO
XX
13F
57O
OC
XX
Org
14F
Libr
ary
41C
OC
XX
15M
IWE
32C
OO
XX
16M
PHD
in p
osth
arve
st24
CC
O
17M
Lect
urer
in p
osth
arve
st46
OC
OX
XO
rg
18M
Hel
pdes
k28
OC
CX
X
19F
Phd
in P
osth
arve
st26
OO
CX
XO
rg20
FPh
d in
IBST
24C
OC
XX
21M
Lect
urer
in P
osth
arve
st44
CO
OX
XO
rg
22M
PhD
23
CC
OX
XO
rg
23F
Libr
ary
42O
CO
24F
Libr
ary
45O
CC
XX
Org
25M
Stud
ent
25O
OC
XX
XO
rg
26F
Secr
etar
y IA
T55
CO
CX
X
27M
IAT
41C
OO
XX
Org
28M
MS
c by
rese
arch
25C
CO
XX
29M
Goo
ds in
war
ds63
OC
OX
X30
MG
roun
ds d
epar
tmen
t63
OC
CSummary
Men
/Fem
ale
15 /
15A
vera
ge40
Tota
l21
61
2D
istin
ctiv
ity14
Pref
eren
ceC
onv
4, O
rg 1
0
Test
ing
Ord
erD
egre
e of
diff
eren
ceAc
cept
abili
ty
Appendix 4.3.2: Sensory analysis for harvest C
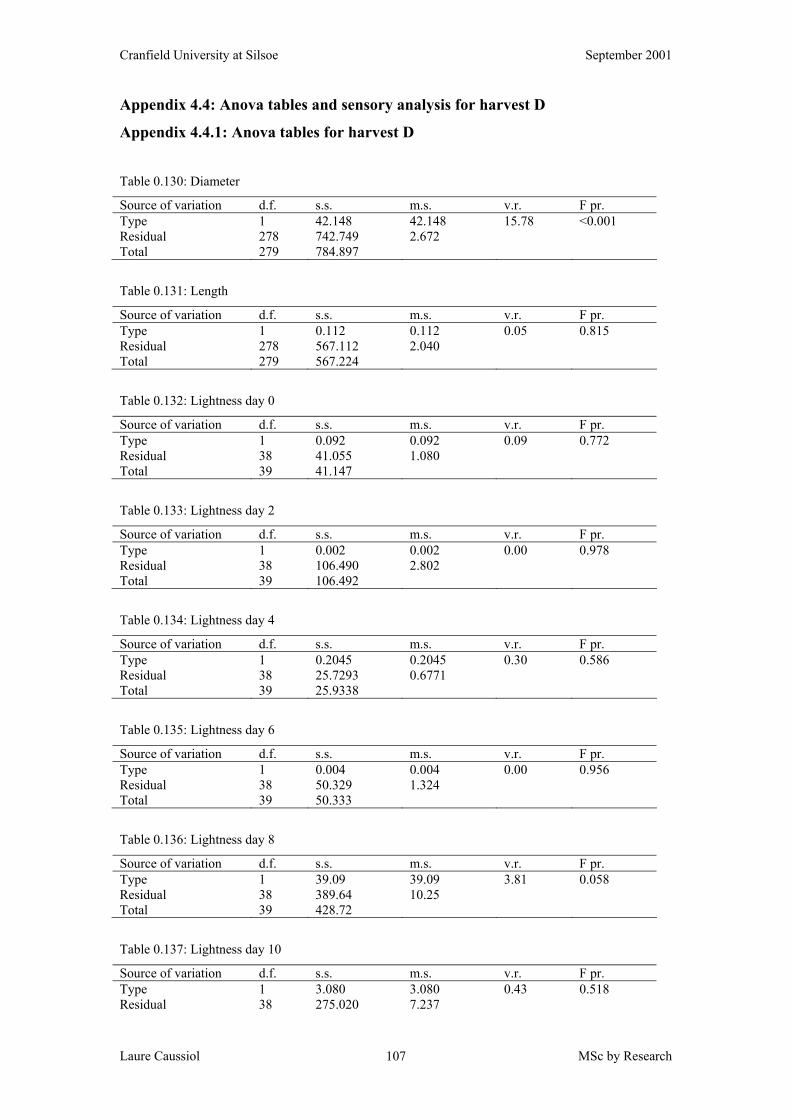
Cranfield University at Silsoe September 2001
Laure Caussiol MSc by Research 107
Appendix 4.4: Anova tables and sensory analysis for harvest D
Appendix 4.4.1: Anova tables for harvest D
Table 0.130: Diameter
Source of variation d.f. s.s. m.s. v.r. F pr. Type 1 42.148 42.148 15.78 <0.001 Residual 278 742.749 2.672 Total 279 784.897
Table 0.131: Length
Source of variation d.f. s.s. m.s. v.r. F pr. Type 1 0.112 0.112 0.05 0.815 Residual 278 567.112 2.040 Total 279 567.224
Table 0.132: Lightness day 0
Source of variation d.f. s.s. m.s. v.r. F pr. Type 1 0.092 0.092 0.09 0.772 Residual 38 41.055 1.080 Total 39 41.147
Table 0.133: Lightness day 2
Source of variation d.f. s.s. m.s. v.r. F pr. Type 1 0.002 0.002 0.00 0.978 Residual 38 106.490 2.802 Total 39 106.492
Table 0.134: Lightness day 4
Source of variation d.f. s.s. m.s. v.r. F pr. Type 1 0.2045 0.2045 0.30 0.586 Residual 38 25.7293 0.6771 Total 39 25.9338
Table 0.135: Lightness day 6
Source of variation d.f. s.s. m.s. v.r. F pr. Type 1 0.004 0.004 0.00 0.956 Residual 38 50.329 1.324 Total 39 50.333
Table 0.136: Lightness day 8
Source of variation d.f. s.s. m.s. v.r. F pr. Type 1 39.09 39.09 3.81 0.058 Residual 38 389.64 10.25 Total 39 428.72
Table 0.137: Lightness day 10
Source of variation d.f. s.s. m.s. v.r. F pr. Type 1 3.080 3.080 0.43 0.518 Residual 38 275.020 7.237
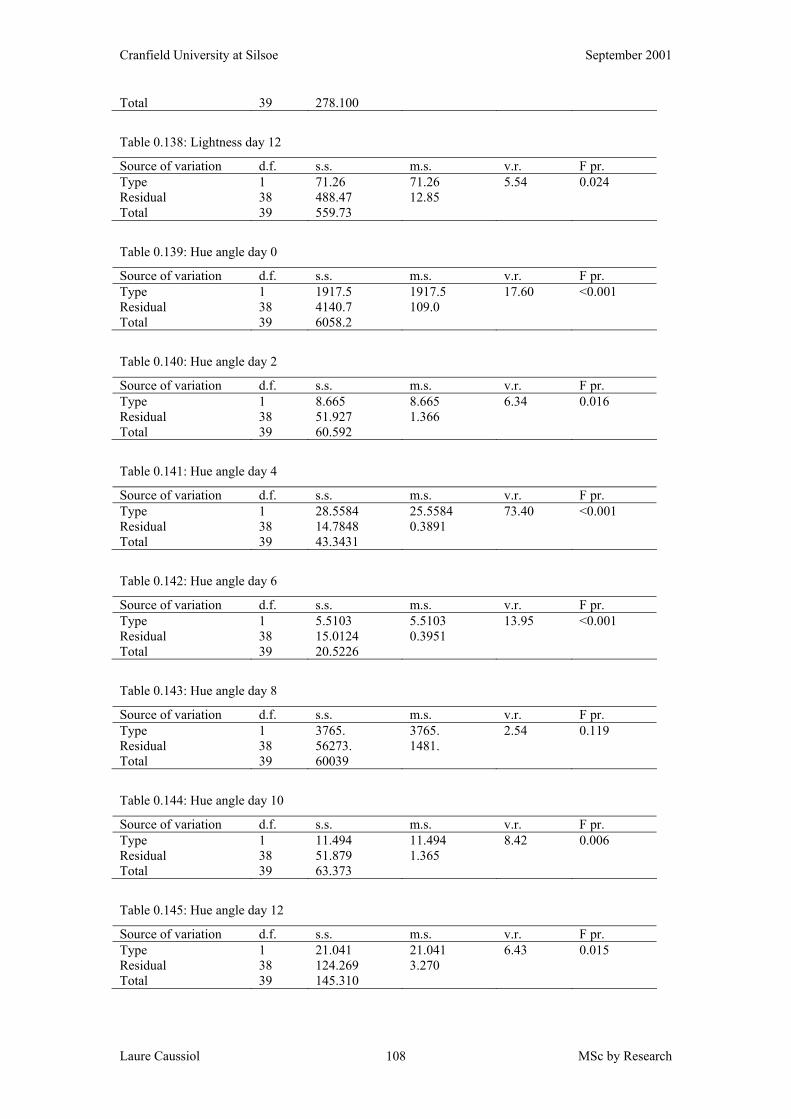
Cranfield University at Silsoe September 2001
Laure Caussiol MSc by Research 108
Total 39 278.100
Table 0.138: Lightness day 12
Source of variation d.f. s.s. m.s. v.r. F pr. Type 1 71.26 71.26 5.54 0.024 Residual 38 488.47 12.85 Total 39 559.73
Table 0.139: Hue angle day 0
Source of variation d.f. s.s. m.s. v.r. F pr. Type 1 1917.5 1917.5 17.60 <0.001 Residual 38 4140.7 109.0 Total 39 6058.2
Table 0.140: Hue angle day 2
Source of variation d.f. s.s. m.s. v.r. F pr. Type 1 8.665 8.665 6.34 0.016 Residual 38 51.927 1.366 Total 39 60.592
Table 0.141: Hue angle day 4
Source of variation d.f. s.s. m.s. v.r. F pr. Type 1 28.5584 25.5584 73.40 <0.001 Residual 38 14.7848 0.3891 Total 39 43.3431
Table 0.142: Hue angle day 6
Source of variation d.f. s.s. m.s. v.r. F pr. Type 1 5.5103 5.5103 13.95 <0.001 Residual 38 15.0124 0.3951 Total 39 20.5226
Table 0.143: Hue angle day 8
Source of variation d.f. s.s. m.s. v.r. F pr. Type 1 3765. 3765. 2.54 0.119 Residual 38 56273. 1481. Total 39 60039
Table 0.144: Hue angle day 10
Source of variation d.f. s.s. m.s. v.r. F pr. Type 1 11.494 11.494 8.42 0.006 Residual 38 51.879 1.365 Total 39 63.373
Table 0.145: Hue angle day 12
Source of variation d.f. s.s. m.s. v.r. F pr. Type 1 21.041 21.041 6.43 0.015 Residual 38 124.269 3.270 Total 39 145.310
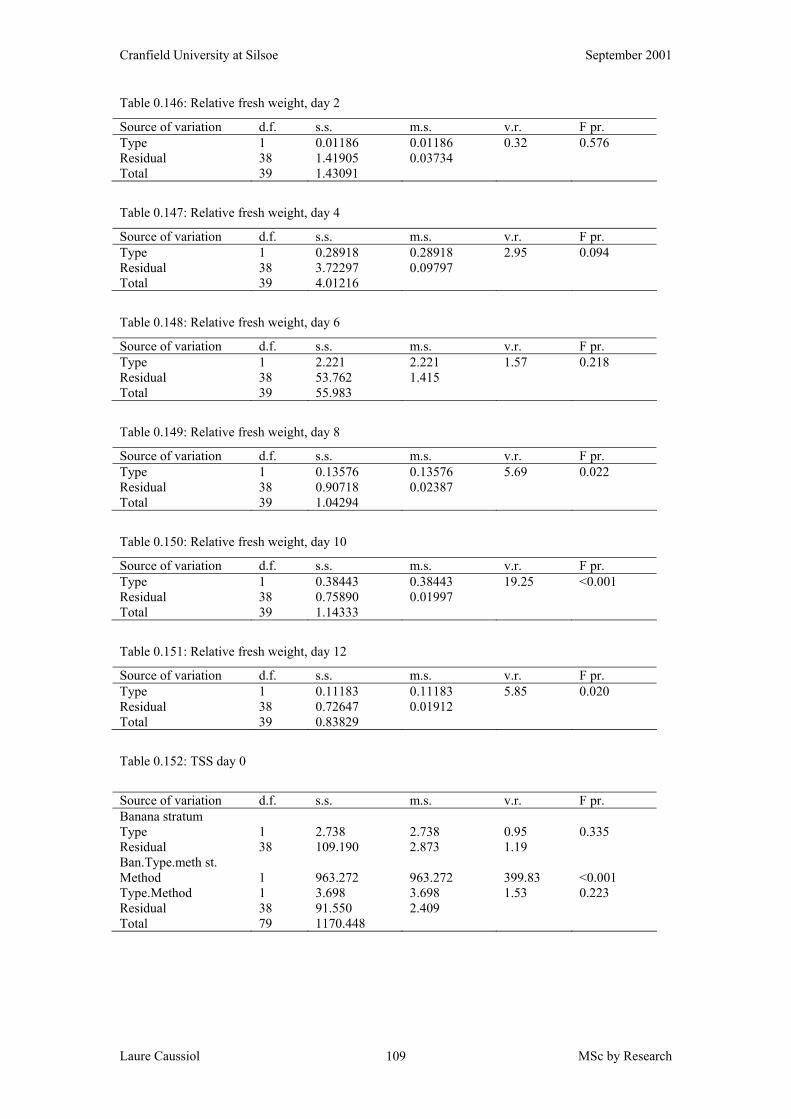
Cranfield University at Silsoe September 2001
Laure Caussiol MSc by Research 109
Table 0.146: Relative fresh weight, day 2
Source of variation d.f. s.s. m.s. v.r. F pr. Type 1 0.01186 0.01186 0.32 0.576 Residual 38 1.41905 0.03734 Total 39 1.43091
Table 0.147: Relative fresh weight, day 4
Source of variation d.f. s.s. m.s. v.r. F pr. Type 1 0.28918 0.28918 2.95 0.094 Residual 38 3.72297 0.09797 Total 39 4.01216
Table 0.148: Relative fresh weight, day 6
Source of variation d.f. s.s. m.s. v.r. F pr. Type 1 2.221 2.221 1.57 0.218 Residual 38 53.762 1.415 Total 39 55.983
Table 0.149: Relative fresh weight, day 8
Source of variation d.f. s.s. m.s. v.r. F pr. Type 1 0.13576 0.13576 5.69 0.022 Residual 38 0.90718 0.02387 Total 39 1.04294
Table 0.150: Relative fresh weight, day 10
Source of variation d.f. s.s. m.s. v.r. F pr. Type 1 0.38443 0.38443 19.25 <0.001 Residual 38 0.75890 0.01997 Total 39 1.14333
Table 0.151: Relative fresh weight, day 12
Source of variation d.f. s.s. m.s. v.r. F pr. Type 1 0.11183 0.11183 5.85 0.020 Residual 38 0.72647 0.01912 Total 39 0.83829
Table 0.152: TSS day 0
Source of variation d.f. s.s. m.s. v.r. F pr. Banana stratum Type 1 2.738 2.738 0.95 0.335 Residual 38 109.190 2.873 1.19 Ban.Type.meth st. Method 1 963.272 963.272 399.83 <0.001 Type.Method 1 3.698 3.698 1.53 0.223 Residual 38 91.550 2.409 Total 79 1170.448
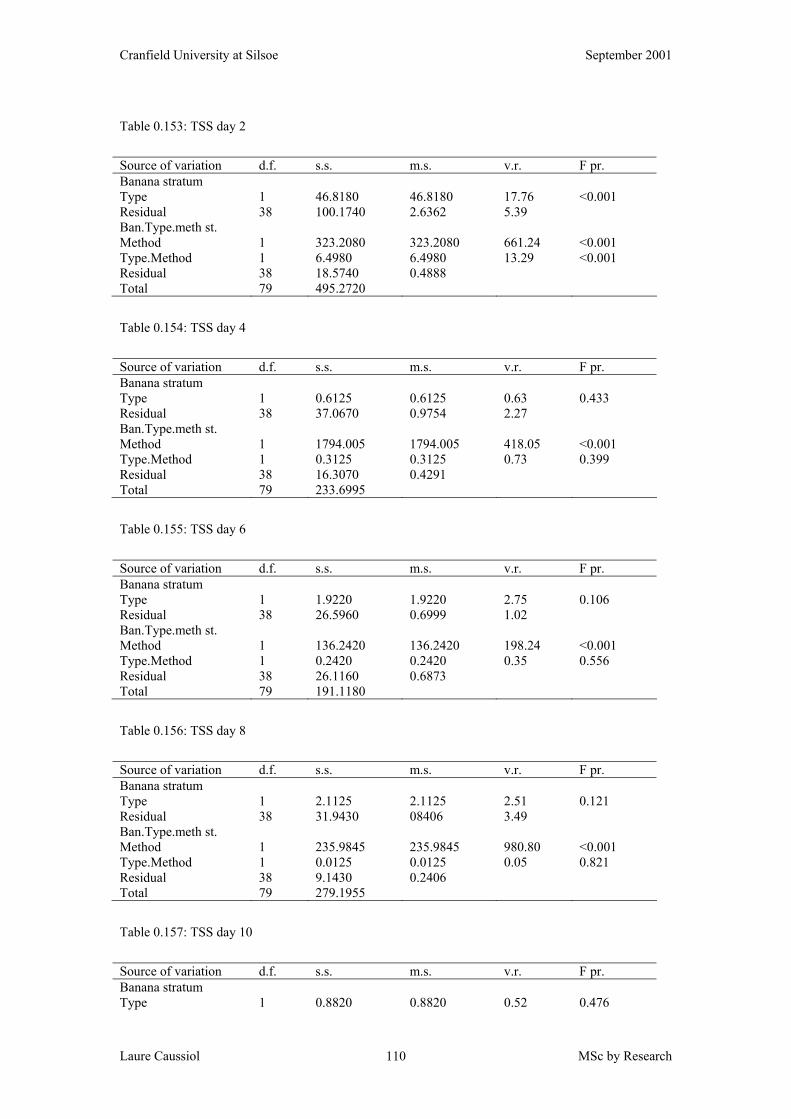
Cranfield University at Silsoe September 2001
Laure Caussiol MSc by Research 110
Table 0.153: TSS day 2
Source of variation d.f. s.s. m.s. v.r. F pr. Banana stratum Type 1 46.8180 46.8180 17.76 <0.001 Residual 38 100.1740 2.6362 5.39 Ban.Type.meth st. Method 1 323.2080 323.2080 661.24 <0.001 Type.Method 1 6.4980 6.4980 13.29 <0.001 Residual 38 18.5740 0.4888 Total 79 495.2720
Table 0.154: TSS day 4
Source of variation d.f. s.s. m.s. v.r. F pr. Banana stratum Type 1 0.6125 0.6125 0.63 0.433 Residual 38 37.0670 0.9754 2.27 Ban.Type.meth st. Method 1 1794.005 1794.005 418.05 <0.001 Type.Method 1 0.3125 0.3125 0.73 0.399 Residual 38 16.3070 0.4291 Total 79 233.6995
Table 0.155: TSS day 6
Source of variation d.f. s.s. m.s. v.r. F pr. Banana stratum Type 1 1.9220 1.9220 2.75 0.106 Residual 38 26.5960 0.6999 1.02 Ban.Type.meth st. Method 1 136.2420 136.2420 198.24 <0.001 Type.Method 1 0.2420 0.2420 0.35 0.556 Residual 38 26.1160 0.6873 Total 79 191.1180
Table 0.156: TSS day 8
Source of variation d.f. s.s. m.s. v.r. F pr. Banana stratum Type 1 2.1125 2.1125 2.51 0.121 Residual 38 31.9430 08406 3.49 Ban.Type.meth st. Method 1 235.9845 235.9845 980.80 <0.001 Type.Method 1 0.0125 0.0125 0.05 0.821 Residual 38 9.1430 0.2406 Total 79 279.1955
Table 0.157: TSS day 10
Source of variation d.f. s.s. m.s. v.r. F pr. Banana stratum Type 1 0.8820 0.8820 0.52 0.476
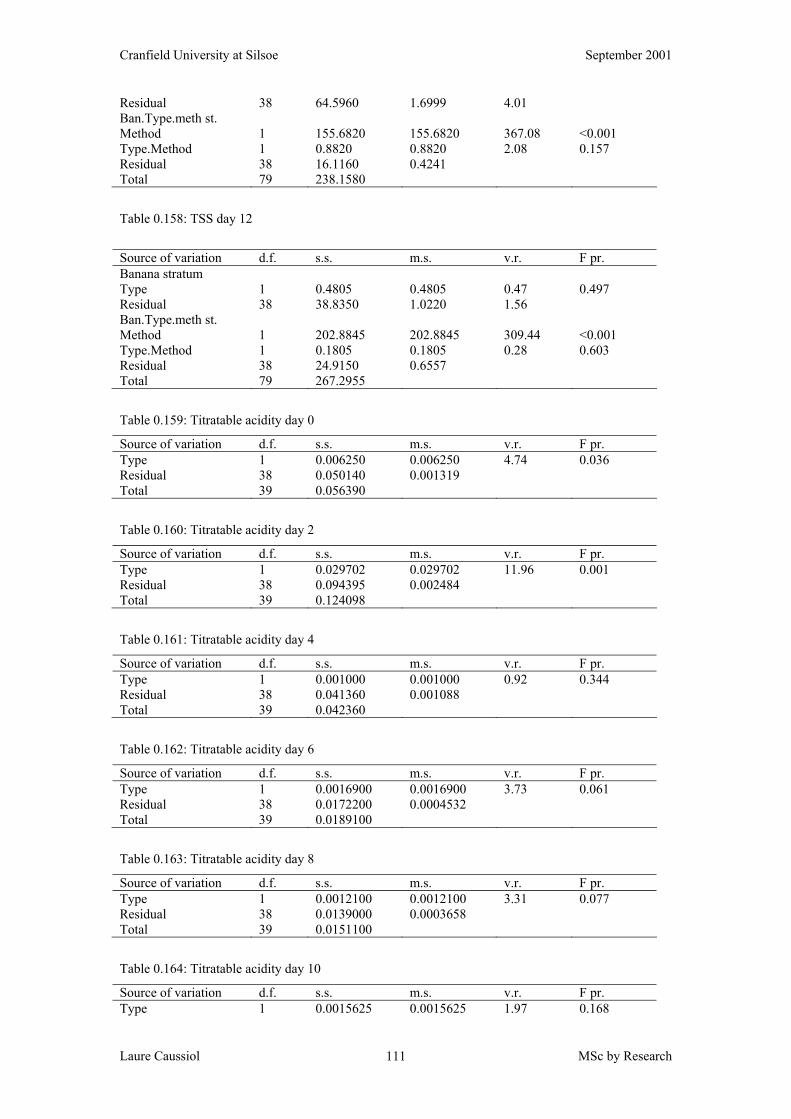
Cranfield University at Silsoe September 2001
Laure Caussiol MSc by Research 111
Residual 38 64.5960 1.6999 4.01 Ban.Type.meth st. Method 1 155.6820 155.6820 367.08 <0.001 Type.Method 1 0.8820 0.8820 2.08 0.157 Residual 38 16.1160 0.4241 Total 79 238.1580
Table 0.158: TSS day 12
Source of variation d.f. s.s. m.s. v.r. F pr. Banana stratum Type 1 0.4805 0.4805 0.47 0.497 Residual 38 38.8350 1.0220 1.56 Ban.Type.meth st. Method 1 202.8845 202.8845 309.44 <0.001 Type.Method 1 0.1805 0.1805 0.28 0.603 Residual 38 24.9150 0.6557 Total 79 267.2955
Table 0.159: Titratable acidity day 0
Source of variation d.f. s.s. m.s. v.r. F pr. Type 1 0.006250 0.006250 4.74 0.036 Residual 38 0.050140 0.001319 Total 39 0.056390
Table 0.160: Titratable acidity day 2
Source of variation d.f. s.s. m.s. v.r. F pr. Type 1 0.029702 0.029702 11.96 0.001 Residual 38 0.094395 0.002484 Total 39 0.124098
Table 0.161: Titratable acidity day 4
Source of variation d.f. s.s. m.s. v.r. F pr. Type 1 0.001000 0.001000 0.92 0.344 Residual 38 0.041360 0.001088 Total 39 0.042360
Table 0.162: Titratable acidity day 6
Source of variation d.f. s.s. m.s. v.r. F pr. Type 1 0.0016900 0.0016900 3.73 0.061 Residual 38 0.0172200 0.0004532 Total 39 0.0189100
Table 0.163: Titratable acidity day 8
Source of variation d.f. s.s. m.s. v.r. F pr. Type 1 0.0012100 0.0012100 3.31 0.077 Residual 38 0.0139000 0.0003658 Total 39 0.0151100
Table 0.164: Titratable acidity day 10
Source of variation d.f. s.s. m.s. v.r. F pr. Type 1 0.0015625 0.0015625 1.97 0.168
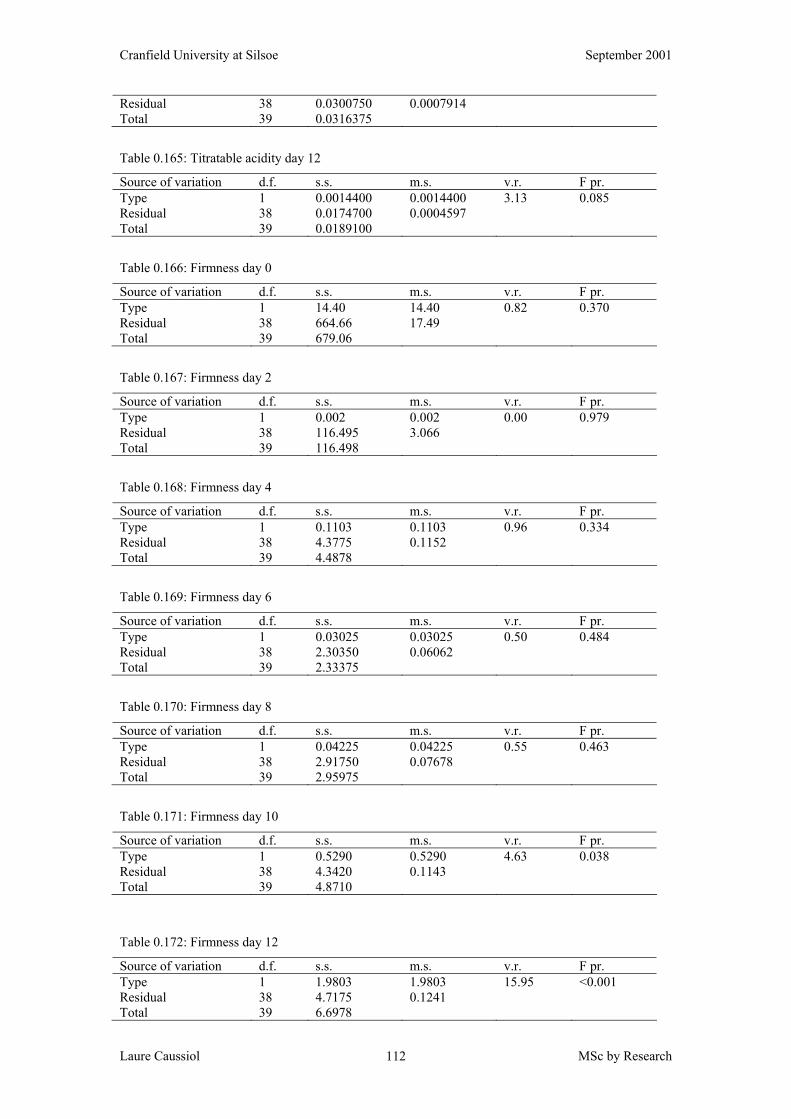
Cranfield University at Silsoe September 2001
Laure Caussiol MSc by Research 112
Residual 38 0.0300750 0.0007914 Total 39 0.0316375
Table 0.165: Titratable acidity day 12
Source of variation d.f. s.s. m.s. v.r. F pr. Type 1 0.0014400 0.0014400 3.13 0.085 Residual 38 0.0174700 0.0004597 Total 39 0.0189100
Table 0.166: Firmness day 0
Source of variation d.f. s.s. m.s. v.r. F pr. Type 1 14.40 14.40 0.82 0.370 Residual 38 664.66 17.49 Total 39 679.06
Table 0.167: Firmness day 2
Source of variation d.f. s.s. m.s. v.r. F pr. Type 1 0.002 0.002 0.00 0.979 Residual 38 116.495 3.066 Total 39 116.498
Table 0.168: Firmness day 4
Source of variation d.f. s.s. m.s. v.r. F pr. Type 1 0.1103 0.1103 0.96 0.334 Residual 38 4.3775 0.1152 Total 39 4.4878
Table 0.169: Firmness day 6
Source of variation d.f. s.s. m.s. v.r. F pr. Type 1 0.03025 0.03025 0.50 0.484 Residual 38 2.30350 0.06062 Total 39 2.33375
Table 0.170: Firmness day 8
Source of variation d.f. s.s. m.s. v.r. F pr. Type 1 0.04225 0.04225 0.55 0.463 Residual 38 2.91750 0.07678 Total 39 2.95975
Table 0.171: Firmness day 10
Source of variation d.f. s.s. m.s. v.r. F pr. Type 1 0.5290 0.5290 4.63 0.038 Residual 38 4.3420 0.1143 Total 39 4.8710
Table 0.172: Firmness day 12
Source of variation d.f. s.s. m.s. v.r. F pr. Type 1 1.9803 1.9803 15.95 <0.001 Residual 38 4.7175 0.1241 Total 39 6.6978
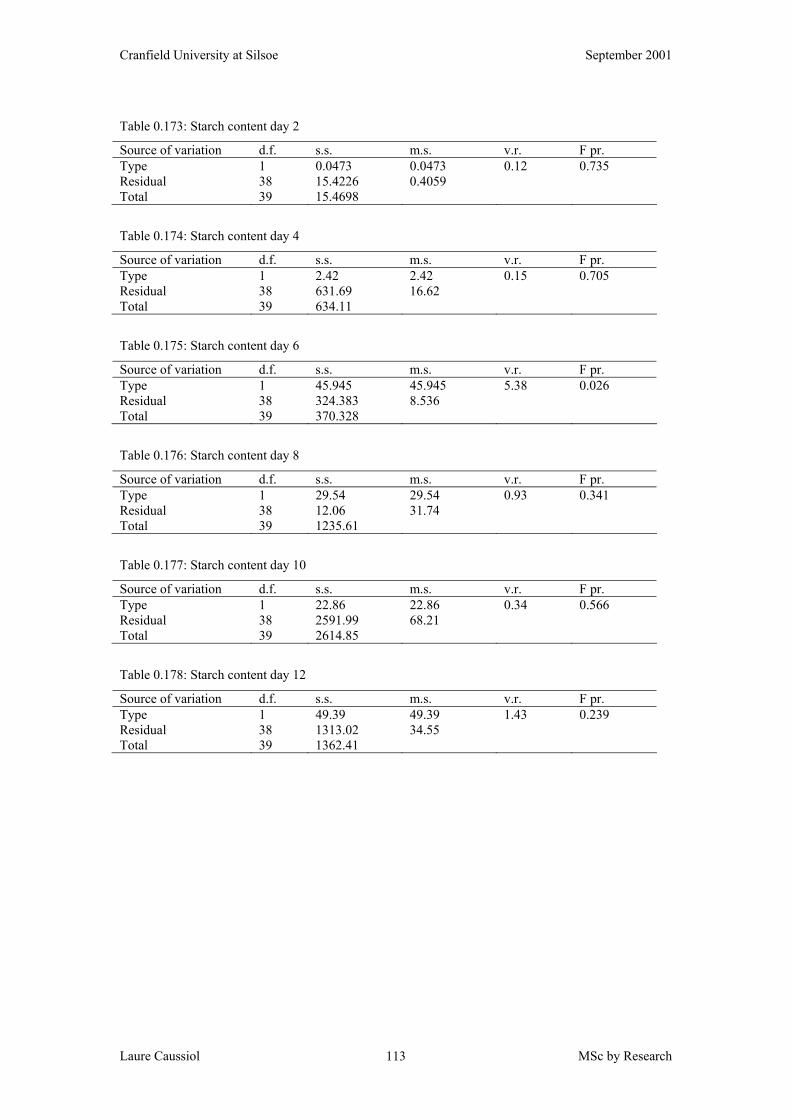
Cranfield University at Silsoe September 2001
Laure Caussiol MSc by Research 113
Table 0.173: Starch content day 2
Source of variation d.f. s.s. m.s. v.r. F pr. Type 1 0.0473 0.0473 0.12 0.735 Residual 38 15.4226 0.4059 Total 39 15.4698
Table 0.174: Starch content day 4
Source of variation d.f. s.s. m.s. v.r. F pr. Type 1 2.42 2.42 0.15 0.705 Residual 38 631.69 16.62 Total 39 634.11
Table 0.175: Starch content day 6
Source of variation d.f. s.s. m.s. v.r. F pr. Type 1 45.945 45.945 5.38 0.026 Residual 38 324.383 8.536 Total 39 370.328
Table 0.176: Starch content day 8
Source of variation d.f. s.s. m.s. v.r. F pr. Type 1 29.54 29.54 0.93 0.341 Residual 38 12.06 31.74 Total 39 1235.61
Table 0.177: Starch content day 10
Source of variation d.f. s.s. m.s. v.r. F pr. Type 1 22.86 22.86 0.34 0.566 Residual 38 2591.99 68.21 Total 39 2614.85
Table 0.178: Starch content day 12
Source of variation d.f. s.s. m.s. v.r. F pr. Type 1 49.39 49.39 1.43 0.239 Residual 38 1313.02 34.55 Total 39 1362.41
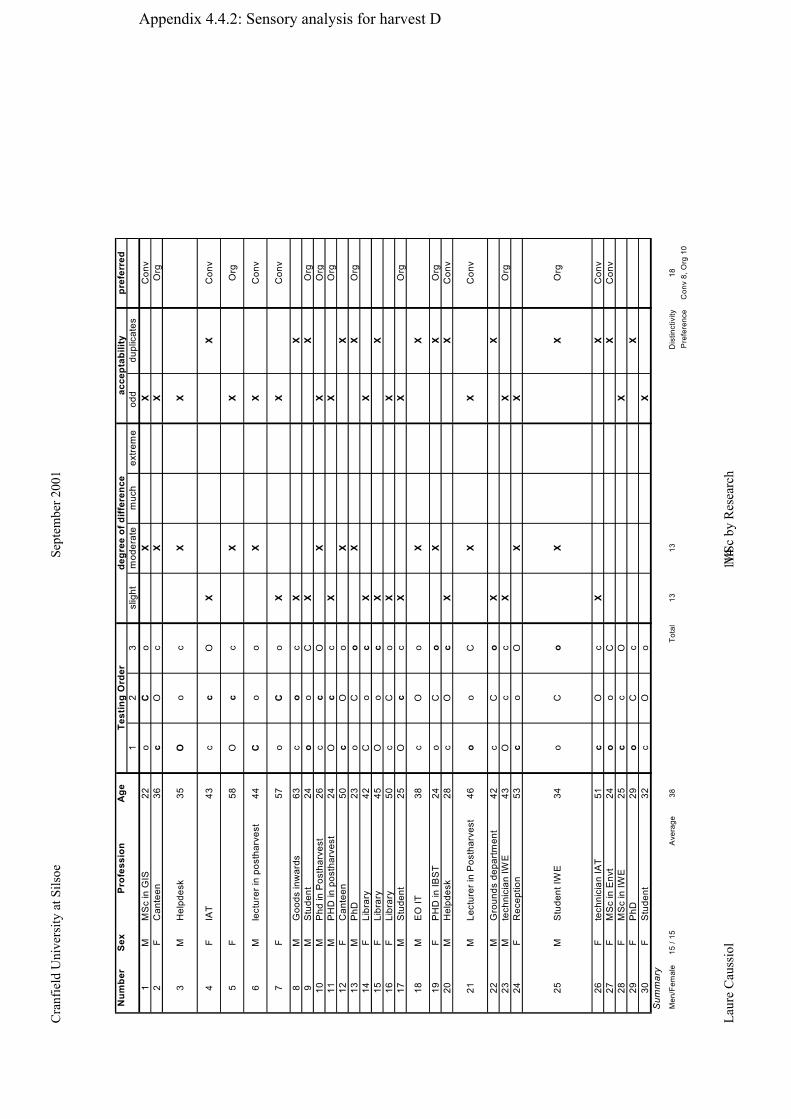
Cra
nfie
ld U
nive
rsity
at S
ilsoe
Sept
embe
r 200
1
Laur
e C
auss
iol
M
Sc b
y R
esea
rch
11
4
Num
ber
Sex
Pro
fess
ion
Age
pref
erre
d1
23
slig
htm
oder
ate
muc
hex
trem
eod
d du
plic
ates
1M
MS
c in
GIS
22o
Co
XX
Con
v2
FC
ante
en36
cO
cX
XO
rg
3M
Hel
pdes
k35
Oo
cX
X
4F
IAT
43c
cO
XX
Con
v
5F
58O
cc
XX
Org
6M
lect
urer
in p
osth
arve
st44
Co
oX
XC
onv
7F
57o
Co
XX
Con
v
8M
Goo
ds in
war
ds63
co
cX
X9
MS
tude
nt24
oo
CX
XO
rg10
MP
hd in
Pos
thar
vest
26c
cO
XX
Org
11M
PH
D in
pos
thar
vest
24O
cc
XX
Org
12F
Can
teen
50c
Oo
XX
13M
PhD
23
oC
oX
XO
rg14
FLi
brar
y42
Co
cX
X15
FLi
brar
y45
Oo
cX
X16
FLi
brar
y50
cC
oX
X17
MS
tude
nt25
Oc
cX
XO
rg
18M
EO
IT38
cO
oX
X
19F
PH
D in
IBS
T24
oC
oX
XO
rg20
MH
elpd
esk
28c
Oc
XX
Con
v
21M
Lect
urer
in P
osth
arve
st46
oo
CX
XC
onv
22M
Gro
unds
dep
artm
ent
42c
Co
XX
23M
tech
nici
an IW
E43
Oc
cX
XO
rg24
FR
ecep
tion
53c
oO
XX
25M
Stu
dent
IWE
34o
Co
XX
Org
26F
tech
nici
an IA
T51
cO
cX
XC
onv
27F
MS
c in
Env
t24
oo
CX
Con
v28
FM
Sc
in IW
E25
cc
OX
29F
PhD
29
oC
cX
30F
Stu
dent
32c
Oo
XSummary
Men
/Fem
ale
15 /
15A
vera
ge38
Tota
l13
13D
istin
ctiv
ity18
Pre
fere
nce
Con
v 8,
Org
10
Test
ing
Ord
erde
gree
of d
iffer
ence
acce
ptab
ility
Appendix 4.4.2: Sensory analysis for harvest D
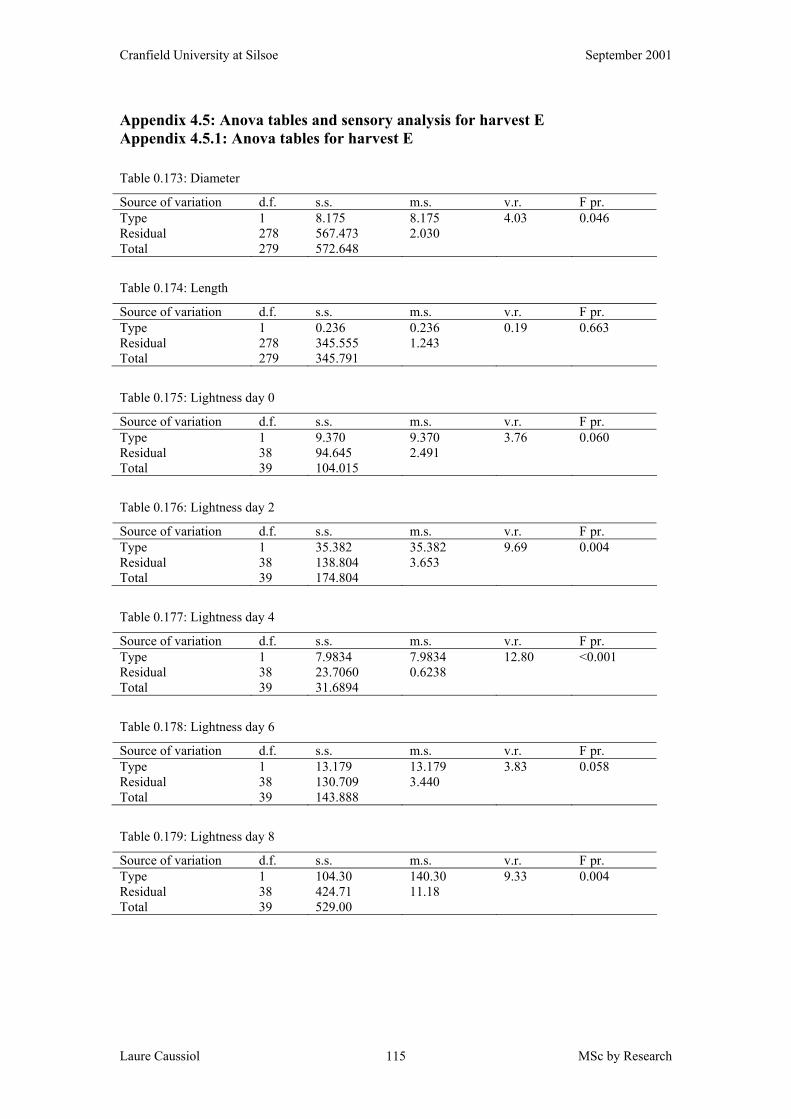
Cranfield University at Silsoe September 2001
Laure Caussiol MSc by Research 115
Appendix 4.5: Anova tables and sensory analysis for harvest E Appendix 4.5.1: Anova tables for harvest E
Table 0.173: Diameter
Source of variation d.f. s.s. m.s. v.r. F pr. Type 1 8.175 8.175 4.03 0.046 Residual 278 567.473 2.030 Total 279 572.648
Table 0.174: Length
Source of variation d.f. s.s. m.s. v.r. F pr. Type 1 0.236 0.236 0.19 0.663 Residual 278 345.555 1.243 Total 279 345.791
Table 0.175: Lightness day 0
Source of variation d.f. s.s. m.s. v.r. F pr. Type 1 9.370 9.370 3.76 0.060 Residual 38 94.645 2.491 Total 39 104.015
Table 0.176: Lightness day 2
Source of variation d.f. s.s. m.s. v.r. F pr. Type 1 35.382 35.382 9.69 0.004 Residual 38 138.804 3.653 Total 39 174.804
Table 0.177: Lightness day 4
Source of variation d.f. s.s. m.s. v.r. F pr. Type 1 7.9834 7.9834 12.80 <0.001 Residual 38 23.7060 0.6238 Total 39 31.6894
Table 0.178: Lightness day 6
Source of variation d.f. s.s. m.s. v.r. F pr. Type 1 13.179 13.179 3.83 0.058 Residual 38 130.709 3.440 Total 39 143.888
Table 0.179: Lightness day 8
Source of variation d.f. s.s. m.s. v.r. F pr. Type 1 104.30 140.30 9.33 0.004 Residual 38 424.71 11.18 Total 39 529.00
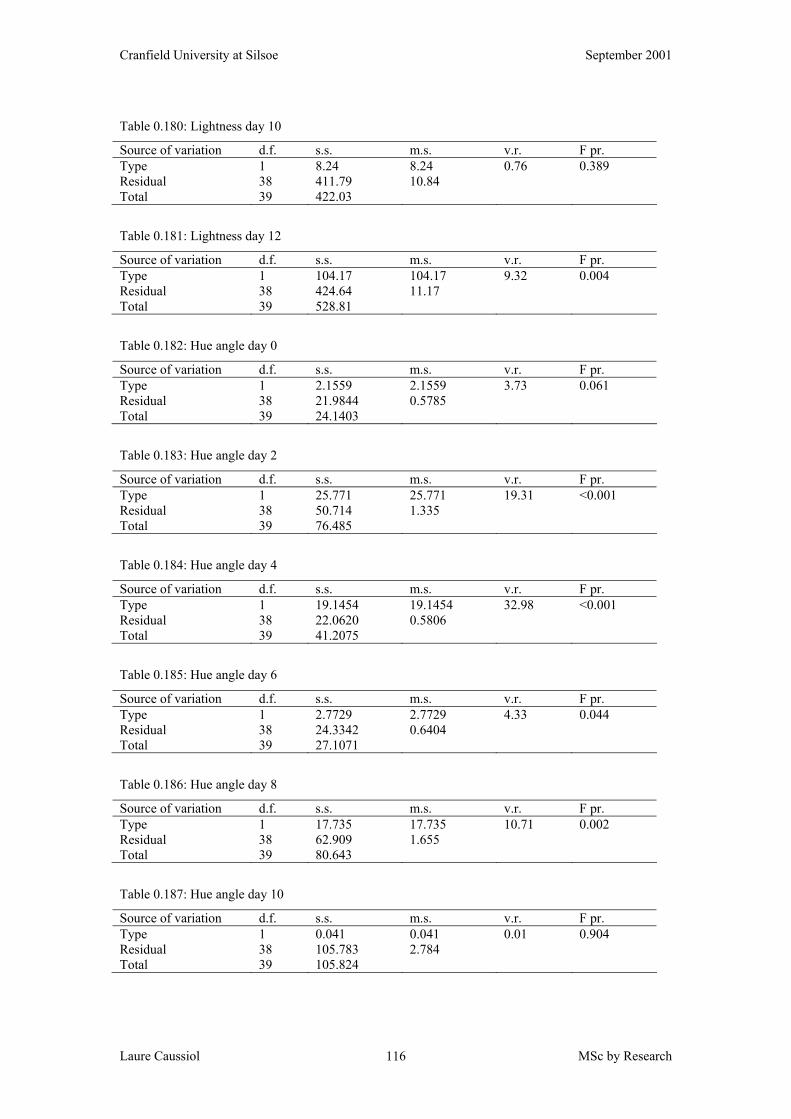
Cranfield University at Silsoe September 2001
Laure Caussiol MSc by Research 116
Table 0.180: Lightness day 10
Source of variation d.f. s.s. m.s. v.r. F pr. Type 1 8.24 8.24 0.76 0.389 Residual 38 411.79 10.84 Total 39 422.03
Table 0.181: Lightness day 12
Source of variation d.f. s.s. m.s. v.r. F pr. Type 1 104.17 104.17 9.32 0.004 Residual 38 424.64 11.17 Total 39 528.81
Table 0.182: Hue angle day 0
Source of variation d.f. s.s. m.s. v.r. F pr. Type 1 2.1559 2.1559 3.73 0.061 Residual 38 21.9844 0.5785 Total 39 24.1403
Table 0.183: Hue angle day 2
Source of variation d.f. s.s. m.s. v.r. F pr. Type 1 25.771 25.771 19.31 <0.001 Residual 38 50.714 1.335 Total 39 76.485
Table 0.184: Hue angle day 4
Source of variation d.f. s.s. m.s. v.r. F pr. Type 1 19.1454 19.1454 32.98 <0.001 Residual 38 22.0620 0.5806 Total 39 41.2075
Table 0.185: Hue angle day 6
Source of variation d.f. s.s. m.s. v.r. F pr. Type 1 2.7729 2.7729 4.33 0.044 Residual 38 24.3342 0.6404 Total 39 27.1071
Table 0.186: Hue angle day 8
Source of variation d.f. s.s. m.s. v.r. F pr. Type 1 17.735 17.735 10.71 0.002 Residual 38 62.909 1.655 Total 39 80.643
Table 0.187: Hue angle day 10
Source of variation d.f. s.s. m.s. v.r. F pr. Type 1 0.041 0.041 0.01 0.904 Residual 38 105.783 2.784 Total 39 105.824
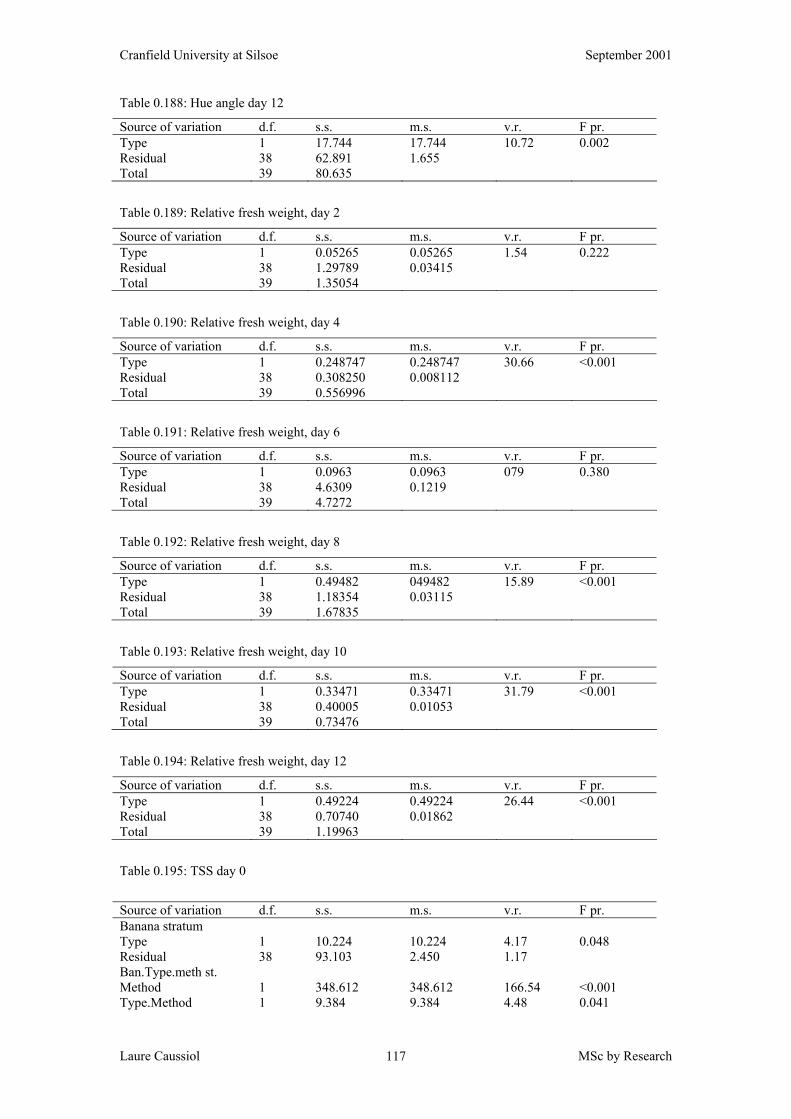
Cranfield University at Silsoe September 2001
Laure Caussiol MSc by Research 117
Table 0.188: Hue angle day 12
Source of variation d.f. s.s. m.s. v.r. F pr. Type 1 17.744 17.744 10.72 0.002 Residual 38 62.891 1.655 Total 39 80.635
Table 0.189: Relative fresh weight, day 2
Source of variation d.f. s.s. m.s. v.r. F pr. Type 1 0.05265 0.05265 1.54 0.222 Residual 38 1.29789 0.03415 Total 39 1.35054
Table 0.190: Relative fresh weight, day 4
Source of variation d.f. s.s. m.s. v.r. F pr. Type 1 0.248747 0.248747 30.66 <0.001 Residual 38 0.308250 0.008112 Total 39 0.556996
Table 0.191: Relative fresh weight, day 6
Source of variation d.f. s.s. m.s. v.r. F pr. Type 1 0.0963 0.0963 079 0.380 Residual 38 4.6309 0.1219 Total 39 4.7272
Table 0.192: Relative fresh weight, day 8
Source of variation d.f. s.s. m.s. v.r. F pr. Type 1 0.49482 049482 15.89 <0.001 Residual 38 1.18354 0.03115 Total 39 1.67835
Table 0.193: Relative fresh weight, day 10
Source of variation d.f. s.s. m.s. v.r. F pr. Type 1 0.33471 0.33471 31.79 <0.001 Residual 38 0.40005 0.01053 Total 39 0.73476
Table 0.194: Relative fresh weight, day 12
Source of variation d.f. s.s. m.s. v.r. F pr. Type 1 0.49224 0.49224 26.44 <0.001 Residual 38 0.70740 0.01862 Total 39 1.19963
Table 0.195: TSS day 0
Source of variation d.f. s.s. m.s. v.r. F pr. Banana stratum Type 1 10.224 10.224 4.17 0.048 Residual 38 93.103 2.450 1.17 Ban.Type.meth st. Method 1 348.612 348.612 166.54 <0.001 Type.Method 1 9.384 9.384 4.48 0.041
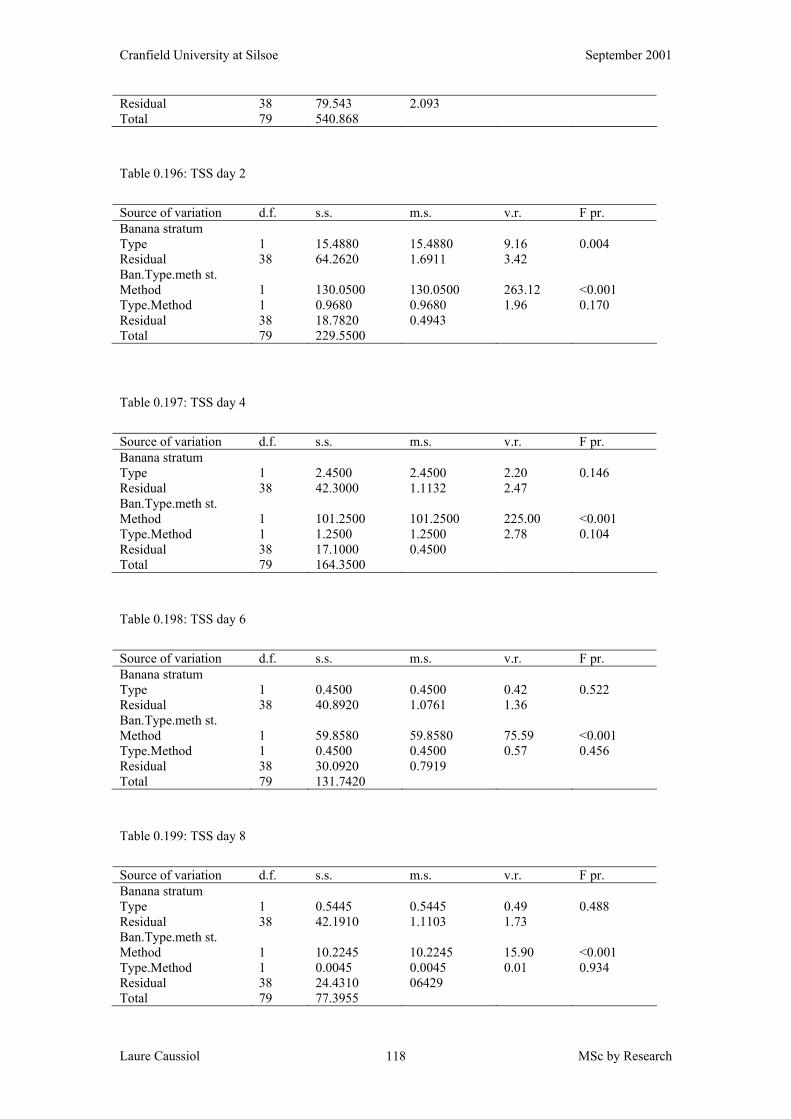
Cranfield University at Silsoe September 2001
Laure Caussiol MSc by Research 118
Residual 38 79.543 2.093 Total 79 540.868
Table 0.196: TSS day 2
Source of variation d.f. s.s. m.s. v.r. F pr. Banana stratum Type 1 15.4880 15.4880 9.16 0.004 Residual 38 64.2620 1.6911 3.42 Ban.Type.meth st. Method 1 130.0500 130.0500 263.12 <0.001 Type.Method 1 0.9680 0.9680 1.96 0.170 Residual 38 18.7820 0.4943 Total 79 229.5500
Table 0.197: TSS day 4
Source of variation d.f. s.s. m.s. v.r. F pr. Banana stratum Type 1 2.4500 2.4500 2.20 0.146 Residual 38 42.3000 1.1132 2.47 Ban.Type.meth st. Method 1 101.2500 101.2500 225.00 <0.001 Type.Method 1 1.2500 1.2500 2.78 0.104 Residual 38 17.1000 0.4500 Total 79 164.3500
Table 0.198: TSS day 6
Source of variation d.f. s.s. m.s. v.r. F pr. Banana stratum Type 1 0.4500 0.4500 0.42 0.522 Residual 38 40.8920 1.0761 1.36 Ban.Type.meth st. Method 1 59.8580 59.8580 75.59 <0.001 Type.Method 1 0.4500 0.4500 0.57 0.456 Residual 38 30.0920 0.7919 Total 79 131.7420
Table 0.199: TSS day 8
Source of variation d.f. s.s. m.s. v.r. F pr. Banana stratum Type 1 0.5445 0.5445 0.49 0.488 Residual 38 42.1910 1.1103 1.73 Ban.Type.meth st. Method 1 10.2245 10.2245 15.90 <0.001 Type.Method 1 0.0045 0.0045 0.01 0.934 Residual 38 24.4310 06429 Total 79 77.3955
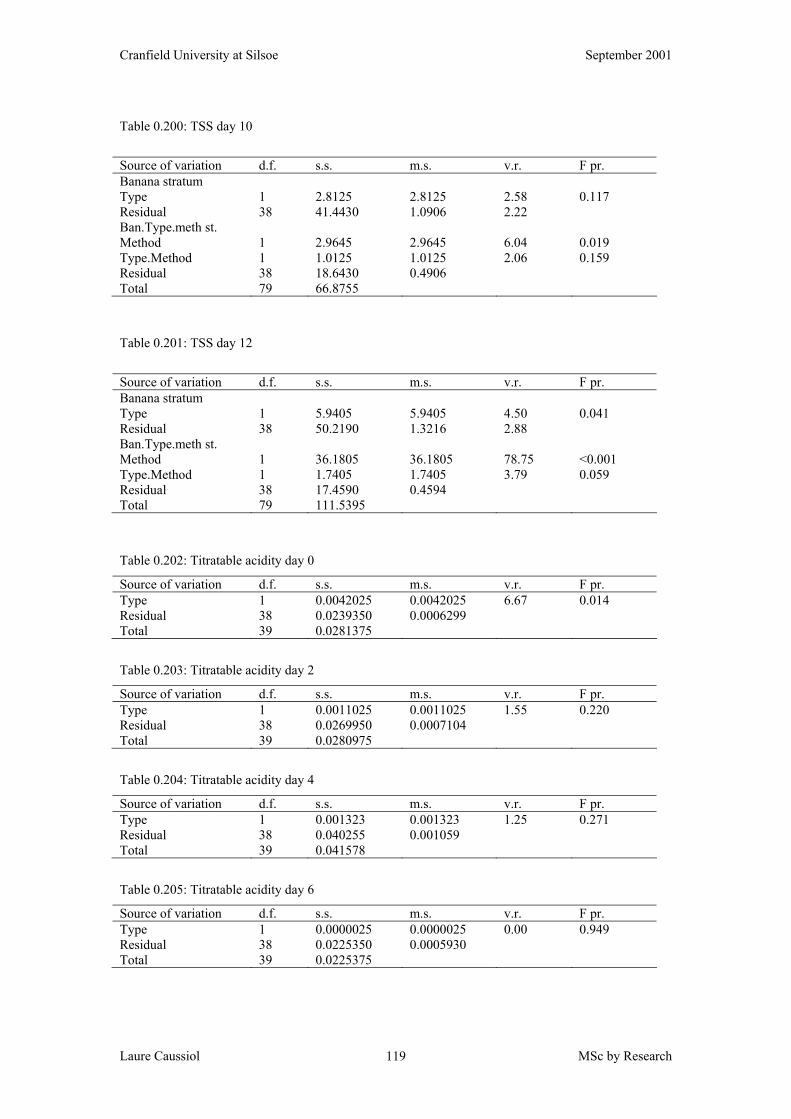
Cranfield University at Silsoe September 2001
Laure Caussiol MSc by Research 119
Table 0.200: TSS day 10
Source of variation d.f. s.s. m.s. v.r. F pr. Banana stratum Type 1 2.8125 2.8125 2.58 0.117 Residual 38 41.4430 1.0906 2.22 Ban.Type.meth st. Method 1 2.9645 2.9645 6.04 0.019 Type.Method 1 1.0125 1.0125 2.06 0.159 Residual 38 18.6430 0.4906 Total 79 66.8755
Table 0.201: TSS day 12
Source of variation d.f. s.s. m.s. v.r. F pr. Banana stratum Type 1 5.9405 5.9405 4.50 0.041 Residual 38 50.2190 1.3216 2.88 Ban.Type.meth st. Method 1 36.1805 36.1805 78.75 <0.001 Type.Method 1 1.7405 1.7405 3.79 0.059 Residual 38 17.4590 0.4594 Total 79 111.5395
Table 0.202: Titratable acidity day 0
Source of variation d.f. s.s. m.s. v.r. F pr. Type 1 0.0042025 0.0042025 6.67 0.014 Residual 38 0.0239350 0.0006299 Total 39 0.0281375
Table 0.203: Titratable acidity day 2
Source of variation d.f. s.s. m.s. v.r. F pr. Type 1 0.0011025 0.0011025 1.55 0.220 Residual 38 0.0269950 0.0007104 Total 39 0.0280975
Table 0.204: Titratable acidity day 4
Source of variation d.f. s.s. m.s. v.r. F pr. Type 1 0.001323 0.001323 1.25 0.271 Residual 38 0.040255 0.001059 Total 39 0.041578
Table 0.205: Titratable acidity day 6
Source of variation d.f. s.s. m.s. v.r. F pr. Type 1 0.0000025 0.0000025 0.00 0.949 Residual 38 0.0225350 0.0005930 Total 39 0.0225375
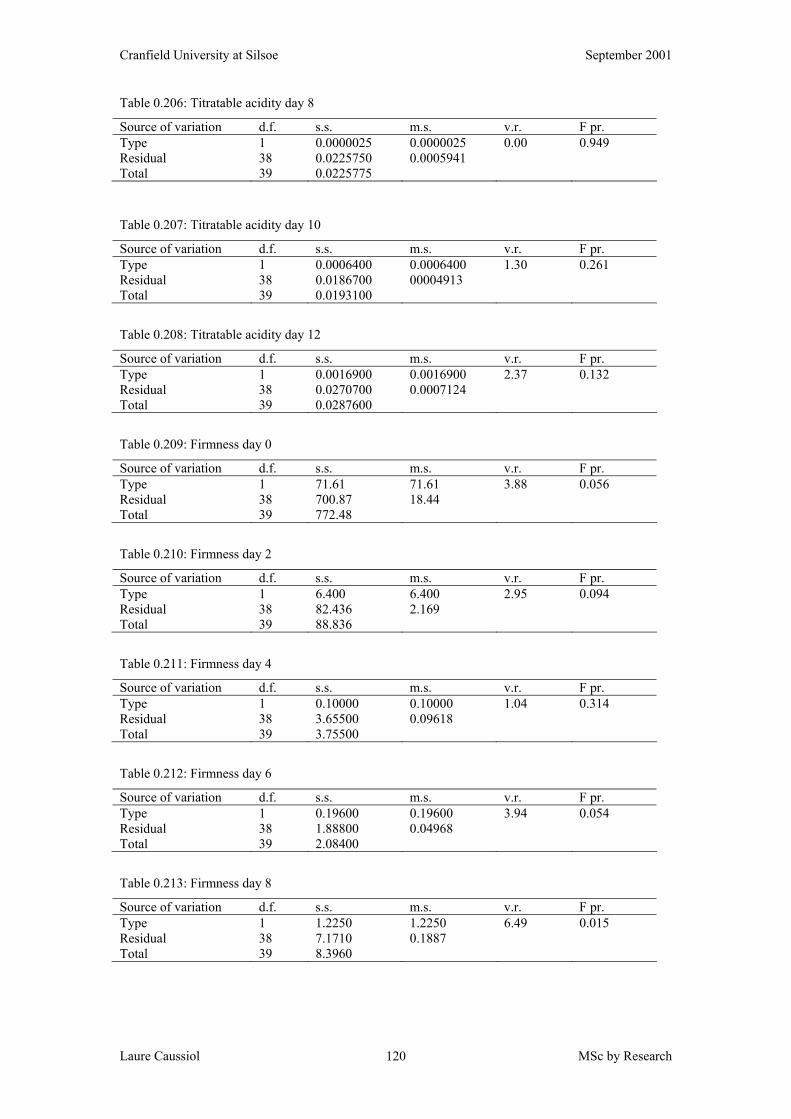
Cranfield University at Silsoe September 2001
Laure Caussiol MSc by Research 120
Table 0.206: Titratable acidity day 8
Source of variation d.f. s.s. m.s. v.r. F pr. Type 1 0.0000025 0.0000025 0.00 0.949 Residual 38 0.0225750 0.0005941 Total 39 0.0225775
Table 0.207: Titratable acidity day 10
Source of variation d.f. s.s. m.s. v.r. F pr. Type 1 0.0006400 0.0006400 1.30 0.261 Residual 38 0.0186700 00004913 Total 39 0.0193100
Table 0.208: Titratable acidity day 12
Source of variation d.f. s.s. m.s. v.r. F pr. Type 1 0.0016900 0.0016900 2.37 0.132 Residual 38 0.0270700 0.0007124 Total 39 0.0287600
Table 0.209: Firmness day 0
Source of variation d.f. s.s. m.s. v.r. F pr. Type 1 71.61 71.61 3.88 0.056 Residual 38 700.87 18.44 Total 39 772.48
Table 0.210: Firmness day 2
Source of variation d.f. s.s. m.s. v.r. F pr. Type 1 6.400 6.400 2.95 0.094 Residual 38 82.436 2.169 Total 39 88.836
Table 0.211: Firmness day 4
Source of variation d.f. s.s. m.s. v.r. F pr. Type 1 0.10000 0.10000 1.04 0.314 Residual 38 3.65500 0.09618 Total 39 3.75500
Table 0.212: Firmness day 6
Source of variation d.f. s.s. m.s. v.r. F pr. Type 1 0.19600 0.19600 3.94 0.054 Residual 38 1.88800 0.04968 Total 39 2.08400
Table 0.213: Firmness day 8
Source of variation d.f. s.s. m.s. v.r. F pr. Type 1 1.2250 1.2250 6.49 0.015 Residual 38 7.1710 0.1887 Total 39 8.3960
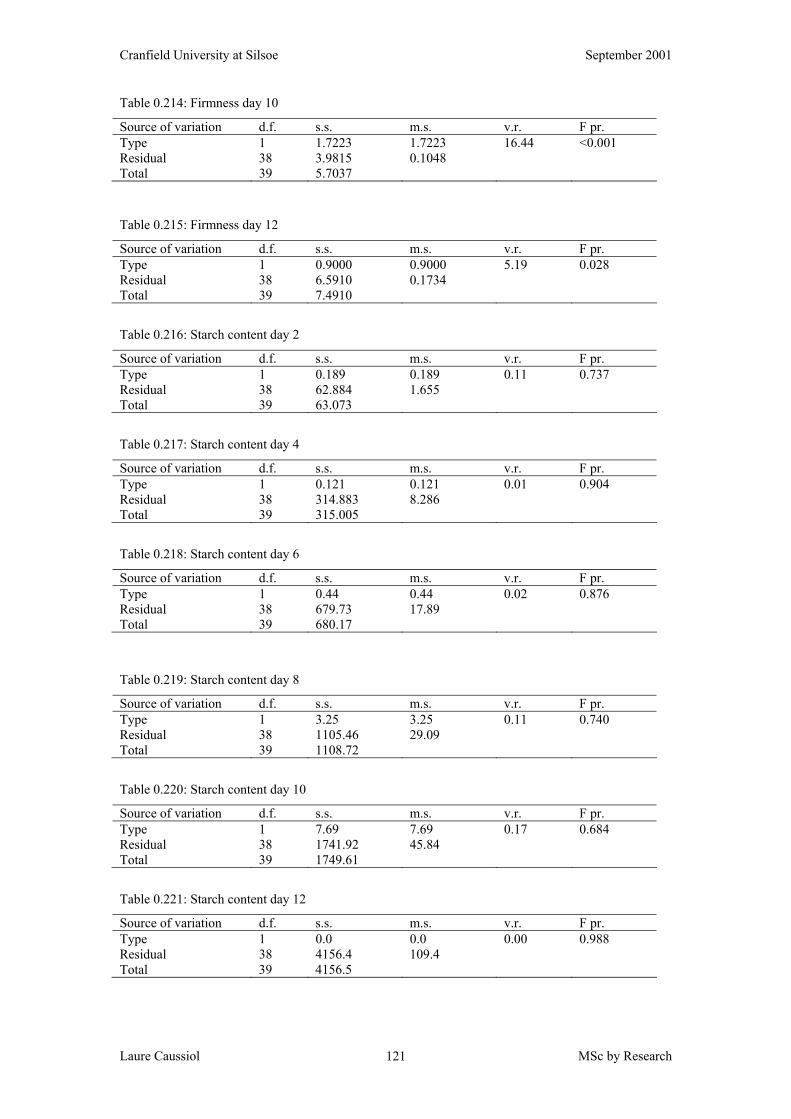
Cranfield University at Silsoe September 2001
Laure Caussiol MSc by Research 121
Table 0.214: Firmness day 10
Source of variation d.f. s.s. m.s. v.r. F pr. Type 1 1.7223 1.7223 16.44 <0.001 Residual 38 3.9815 0.1048 Total 39 5.7037
Table 0.215: Firmness day 12
Source of variation d.f. s.s. m.s. v.r. F pr. Type 1 0.9000 0.9000 5.19 0.028 Residual 38 6.5910 0.1734 Total 39 7.4910
Table 0.216: Starch content day 2
Source of variation d.f. s.s. m.s. v.r. F pr. Type 1 0.189 0.189 0.11 0.737 Residual 38 62.884 1.655 Total 39 63.073
Table 0.217: Starch content day 4
Source of variation d.f. s.s. m.s. v.r. F pr. Type 1 0.121 0.121 0.01 0.904 Residual 38 314.883 8.286 Total 39 315.005
Table 0.218: Starch content day 6
Source of variation d.f. s.s. m.s. v.r. F pr. Type 1 0.44 0.44 0.02 0.876 Residual 38 679.73 17.89 Total 39 680.17
Table 0.219: Starch content day 8
Source of variation d.f. s.s. m.s. v.r. F pr. Type 1 3.25 3.25 0.11 0.740 Residual 38 1105.46 29.09 Total 39 1108.72
Table 0.220: Starch content day 10
Source of variation d.f. s.s. m.s. v.r. F pr. Type 1 7.69 7.69 0.17 0.684 Residual 38 1741.92 45.84 Total 39 1749.61
Table 0.221: Starch content day 12
Source of variation d.f. s.s. m.s. v.r. F pr. Type 1 0.0 0.0 0.00 0.988 Residual 38 4156.4 109.4 Total 39 4156.5
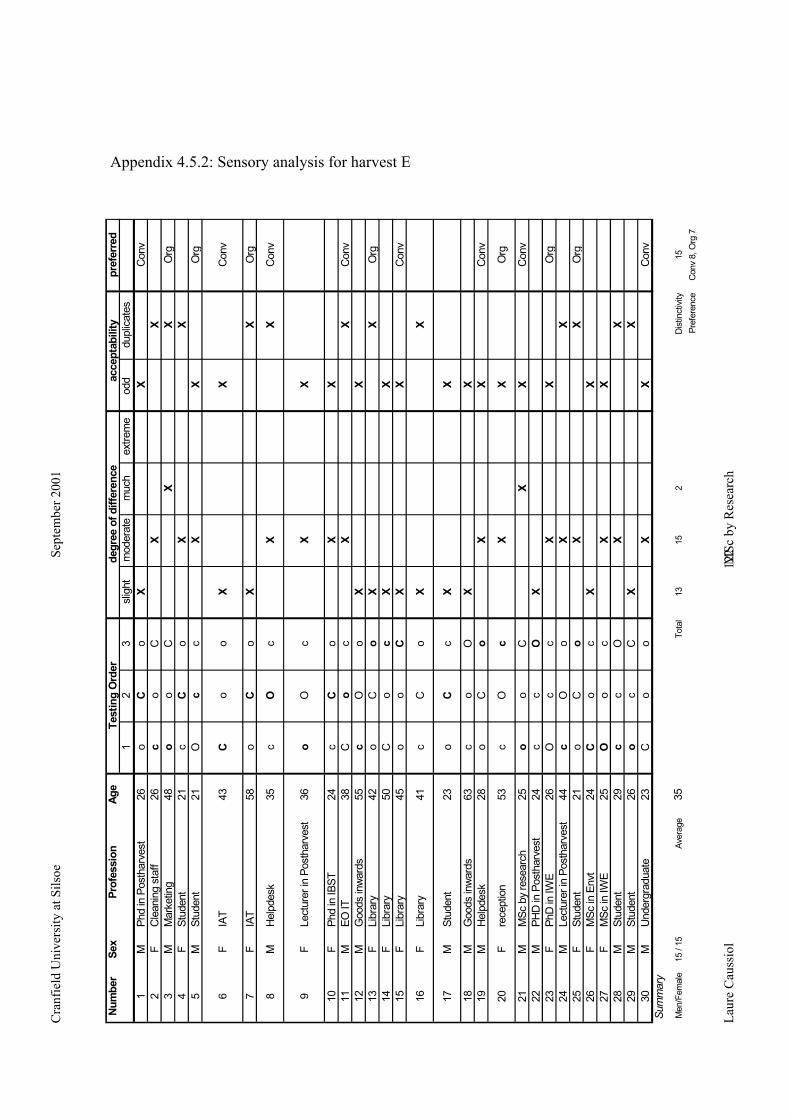
Cra
nfie
ld U
nive
rsity
at S
ilsoe
Sept
embe
r 200
1
Laur
e C
auss
iol
M
Sc b
y R
esea
rch
12
2
Num
ber
Sex
Prof
essi
onAg
epr
efer
red
12
3sl
ight
mod
erat
em
uch
extre
me
odd
dupl
icat
es1
MPh
d in
Pos
thar
vest
26o
Co
XX
Con
v2
FC
lean
ing
staf
f26
co
CX
X3
MM
arke
ting
48o
oC
XX
Org
4F
Stud
ent
21c
Co
XX
5M
Stud
ent
21O
cc
XX
Org
6F
IAT
43C
oo
XX
Con
v
7F
IAT
58o
Co
XX
Org
8M
Hel
pdes
k35
cO
cX
XC
onv
9F
Lect
urer
in P
osth
arve
st36
oO
cX
X
10F
Phd
in IB
ST24
cC
oX
X11
MEO
IT38
Co
cX
XC
onv
12M
Goo
ds in
ward
s55
cO
oX
X13
FLi
brar
y42
oC
oX
XO
rg14
FLi
brar
y50
Co
cX
X15
FLi
brar
y45
oo
CX
XC
onv
16F
Libr
ary
41c
Co
XX
17M
Stud
ent
23o
Cc
XX
18M
Goo
ds in
ward
s63
co
OX
X19
MH
elpd
esk
28o
Co
XX
Con
v
20F
rece
ptio
n53
cO
cX
XO
rg
21M
MSc
by
rese
arch
25o
oC
XX
Con
v22
MPH
D in
Pos
thar
vest
24c
cO
X23
FPh
D in
IWE
26O
cc
XX
Org
24M
Lect
urer
in P
osth
arve
st44
cO
oX
X25
FSt
uden
t21
oC
oX
XO
rg26
FM
Sc in
Env
t24
Co
cX
X27
FM
Sc in
IWE
25O
oc
XX
28M
Stud
ent
29c
cO
XX
29M
Stud
ent
26o
cC
XX
30M
Und
ergr
adua
te
23C
oo
XX
Con
vSummary
Men
/Fem
ale
15 /
15Av
erag
e35
Tota
l13
152
Dis
tinct
ivity
15Pr
efer
ence
Con
v 8,
Org
7
Test
ing
Ord
erde
gree
of d
iffer
ence
acce
ptab
ility
Appendix 4.5.2: Sensory analysis for harvest E
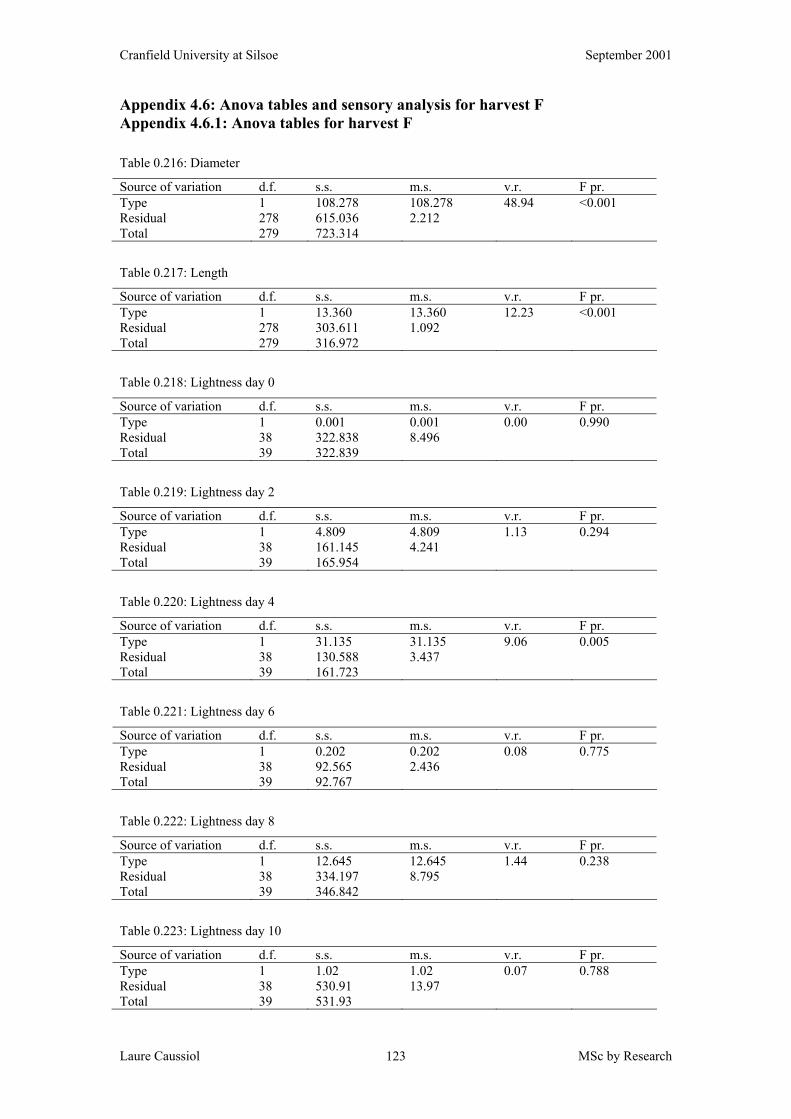
Cranfield University at Silsoe September 2001
Laure Caussiol MSc by Research 123
Appendix 4.6: Anova tables and sensory analysis for harvest F Appendix 4.6.1: Anova tables for harvest F
Table 0.216: Diameter
Source of variation d.f. s.s. m.s. v.r. F pr. Type 1 108.278 108.278 48.94 <0.001 Residual 278 615.036 2.212 Total 279 723.314
Table 0.217: Length
Source of variation d.f. s.s. m.s. v.r. F pr. Type 1 13.360 13.360 12.23 <0.001 Residual 278 303.611 1.092 Total 279 316.972
Table 0.218: Lightness day 0
Source of variation d.f. s.s. m.s. v.r. F pr. Type 1 0.001 0.001 0.00 0.990 Residual 38 322.838 8.496 Total 39 322.839
Table 0.219: Lightness day 2
Source of variation d.f. s.s. m.s. v.r. F pr. Type 1 4.809 4.809 1.13 0.294 Residual 38 161.145 4.241 Total 39 165.954
Table 0.220: Lightness day 4
Source of variation d.f. s.s. m.s. v.r. F pr. Type 1 31.135 31.135 9.06 0.005 Residual 38 130.588 3.437 Total 39 161.723
Table 0.221: Lightness day 6
Source of variation d.f. s.s. m.s. v.r. F pr. Type 1 0.202 0.202 0.08 0.775 Residual 38 92.565 2.436 Total 39 92.767
Table 0.222: Lightness day 8
Source of variation d.f. s.s. m.s. v.r. F pr. Type 1 12.645 12.645 1.44 0.238 Residual 38 334.197 8.795 Total 39 346.842
Table 0.223: Lightness day 10
Source of variation d.f. s.s. m.s. v.r. F pr. Type 1 1.02 1.02 0.07 0.788 Residual 38 530.91 13.97 Total 39 531.93

Cranfield University at Silsoe September 2001
Laure Caussiol MSc by Research 124
Table 0.224: Lightness day 12
Source of variation d.f. s.s. m.s. v.r. F pr. Type 1 0.04 0.04 0.00 0.977 Residual 38 1769.90 46.58 Total 39 169.94
Table 0.225: Hue angle day 0
Source of variation d.f. s.s. m.s. v.r. F pr. Type 1 927.7 927.7 2.45 0.126 Residual 38 14405.9 379.1 Total 39 15333.7
Table 0.226: Hue angle day 2
Source of variation d.f. s.s. m.s. v.r. F pr. Type 1 79.612 79.612 47.89 <0.001 Residual 38 63.168 1.662 Total 39 142.780
Table 0.227: Hue angle day 4
Source of variation d.f. s.s. m.s. v.r. F pr. Type 1 57.183 57.183 50.46 <0.001 Residual 38 43.063 1.133 Total 39 100.246
Table 0.228: Hue angle day 6
Source of variation d.f. s.s. m.s. v.r. F pr. Type 1 0.5038 0.5038 1.02 0.318 Residual 38 18.6880 0.4918 Total 39 19.1918
Table 0.229: Hue angle day 8
Source of variation d.f. s.s. m.s. v.r. F pr. Type 1 1.171 1.171 0.39 0.535 Residual 38 113.275 2.981 Total 39 114.446
Table 0.230: Hue angle day 10
Source of variation d.f. s.s. m.s. v.r. F pr. Type 1 8.161 8.161 1.28 0.265 Residual 38 241.797 6.363 Total 39 249.958
Table 0.231: Hue angle day 12
Source of variation d.f. s.s. m.s. v.r. F pr. Type 1 0.039 0.039 0.01 0.936 Residual 38 228.146 6.004 Total 39 228.185
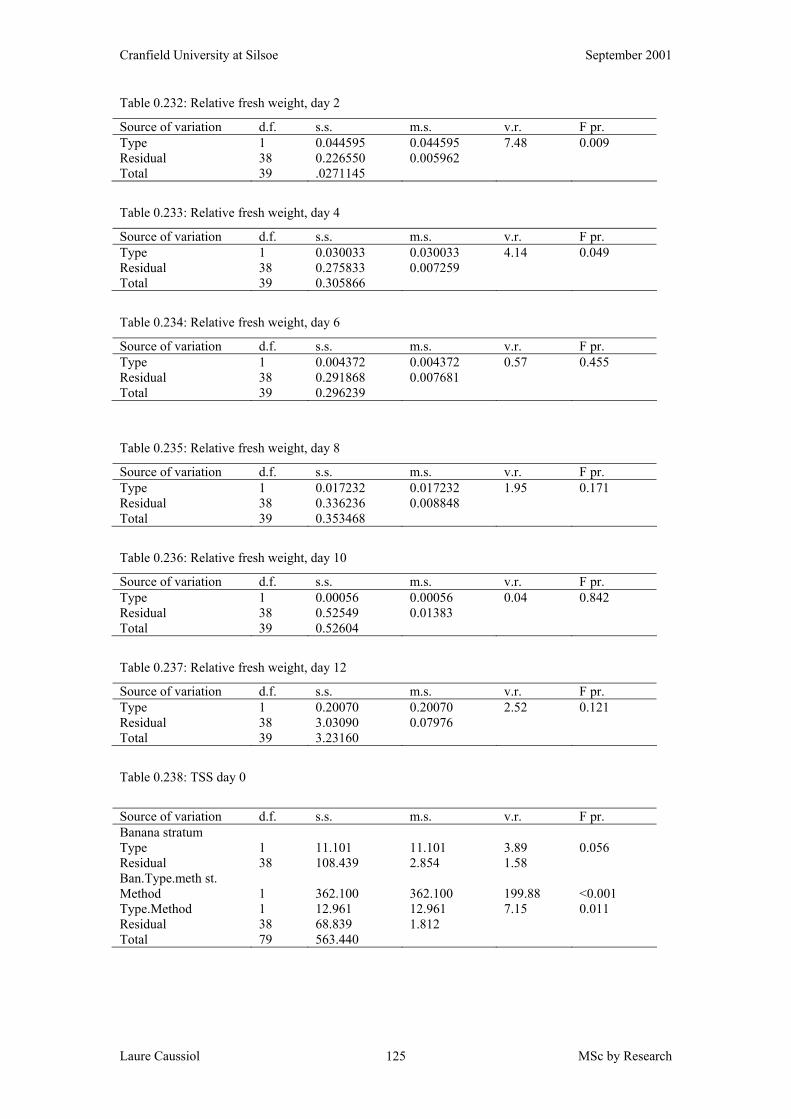
Cranfield University at Silsoe September 2001
Laure Caussiol MSc by Research 125
Table 0.232: Relative fresh weight, day 2
Source of variation d.f. s.s. m.s. v.r. F pr. Type 1 0.044595 0.044595 7.48 0.009 Residual 38 0.226550 0.005962 Total 39 .0271145
Table 0.233: Relative fresh weight, day 4
Source of variation d.f. s.s. m.s. v.r. F pr. Type 1 0.030033 0.030033 4.14 0.049 Residual 38 0.275833 0.007259 Total 39 0.305866
Table 0.234: Relative fresh weight, day 6
Source of variation d.f. s.s. m.s. v.r. F pr. Type 1 0.004372 0.004372 0.57 0.455 Residual 38 0.291868 0.007681 Total 39 0.296239
Table 0.235: Relative fresh weight, day 8
Source of variation d.f. s.s. m.s. v.r. F pr. Type 1 0.017232 0.017232 1.95 0.171 Residual 38 0.336236 0.008848 Total 39 0.353468
Table 0.236: Relative fresh weight, day 10
Source of variation d.f. s.s. m.s. v.r. F pr. Type 1 0.00056 0.00056 0.04 0.842 Residual 38 0.52549 0.01383 Total 39 0.52604
Table 0.237: Relative fresh weight, day 12
Source of variation d.f. s.s. m.s. v.r. F pr. Type 1 0.20070 0.20070 2.52 0.121 Residual 38 3.03090 0.07976 Total 39 3.23160
Table 0.238: TSS day 0
Source of variation d.f. s.s. m.s. v.r. F pr. Banana stratum Type 1 11.101 11.101 3.89 0.056 Residual 38 108.439 2.854 1.58 Ban.Type.meth st. Method 1 362.100 362.100 199.88 <0.001 Type.Method 1 12.961 12.961 7.15 0.011 Residual 38 68.839 1.812 Total 79 563.440
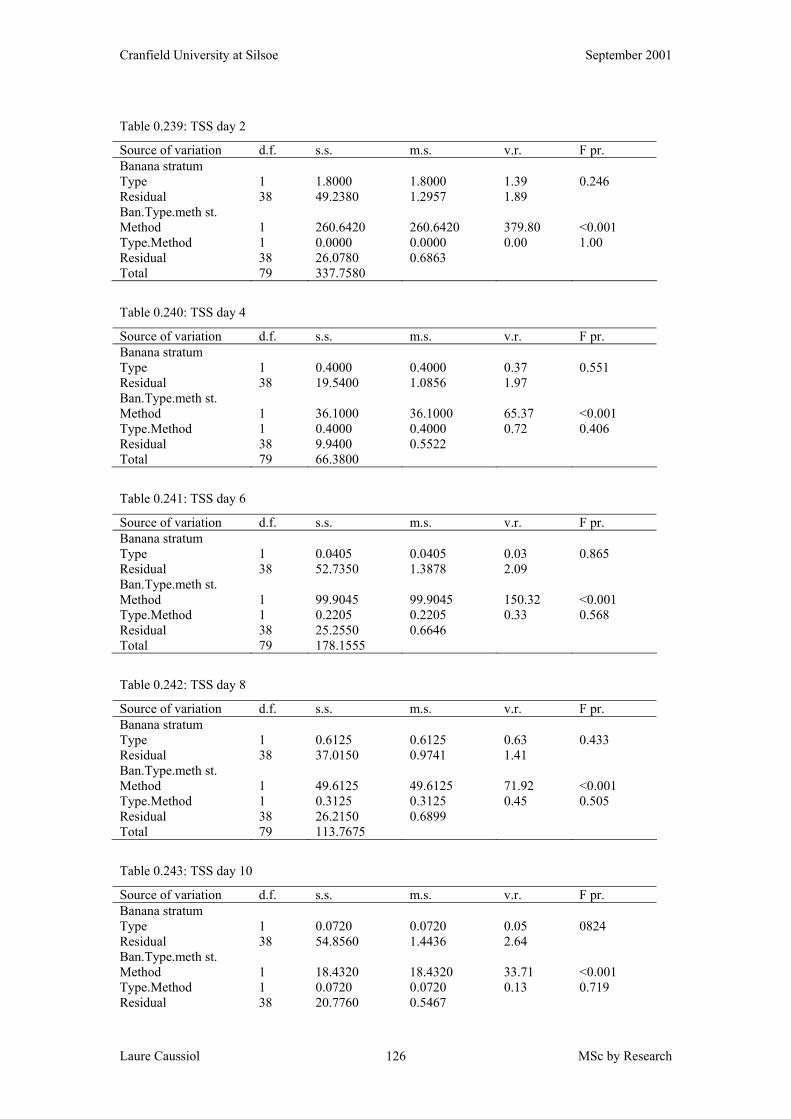
Cranfield University at Silsoe September 2001
Laure Caussiol MSc by Research 126
Table 0.239: TSS day 2
Source of variation d.f. s.s. m.s. v.r. F pr. Banana stratum Type 1 1.8000 1.8000 1.39 0.246 Residual 38 49.2380 1.2957 1.89 Ban.Type.meth st. Method 1 260.6420 260.6420 379.80 <0.001 Type.Method 1 0.0000 0.0000 0.00 1.00 Residual 38 26.0780 0.6863 Total 79 337.7580
Table 0.240: TSS day 4
Source of variation d.f. s.s. m.s. v.r. F pr. Banana stratum Type 1 0.4000 0.4000 0.37 0.551 Residual 38 19.5400 1.0856 1.97 Ban.Type.meth st. Method 1 36.1000 36.1000 65.37 <0.001 Type.Method 1 0.4000 0.4000 0.72 0.406 Residual 38 9.9400 0.5522 Total 79 66.3800
Table 0.241: TSS day 6
Source of variation d.f. s.s. m.s. v.r. F pr. Banana stratum Type 1 0.0405 0.0405 0.03 0.865 Residual 38 52.7350 1.3878 2.09 Ban.Type.meth st. Method 1 99.9045 99.9045 150.32 <0.001 Type.Method 1 0.2205 0.2205 0.33 0.568 Residual 38 25.2550 0.6646 Total 79 178.1555
Table 0.242: TSS day 8
Source of variation d.f. s.s. m.s. v.r. F pr. Banana stratum Type 1 0.6125 0.6125 0.63 0.433 Residual 38 37.0150 0.9741 1.41 Ban.Type.meth st. Method 1 49.6125 49.6125 71.92 <0.001 Type.Method 1 0.3125 0.3125 0.45 0.505 Residual 38 26.2150 0.6899 Total 79 113.7675
Table 0.243: TSS day 10
Source of variation d.f. s.s. m.s. v.r. F pr. Banana stratum Type 1 0.0720 0.0720 0.05 0824 Residual 38 54.8560 1.4436 2.64 Ban.Type.meth st. Method 1 18.4320 18.4320 33.71 <0.001 Type.Method 1 0.0720 0.0720 0.13 0.719 Residual 38 20.7760 0.5467
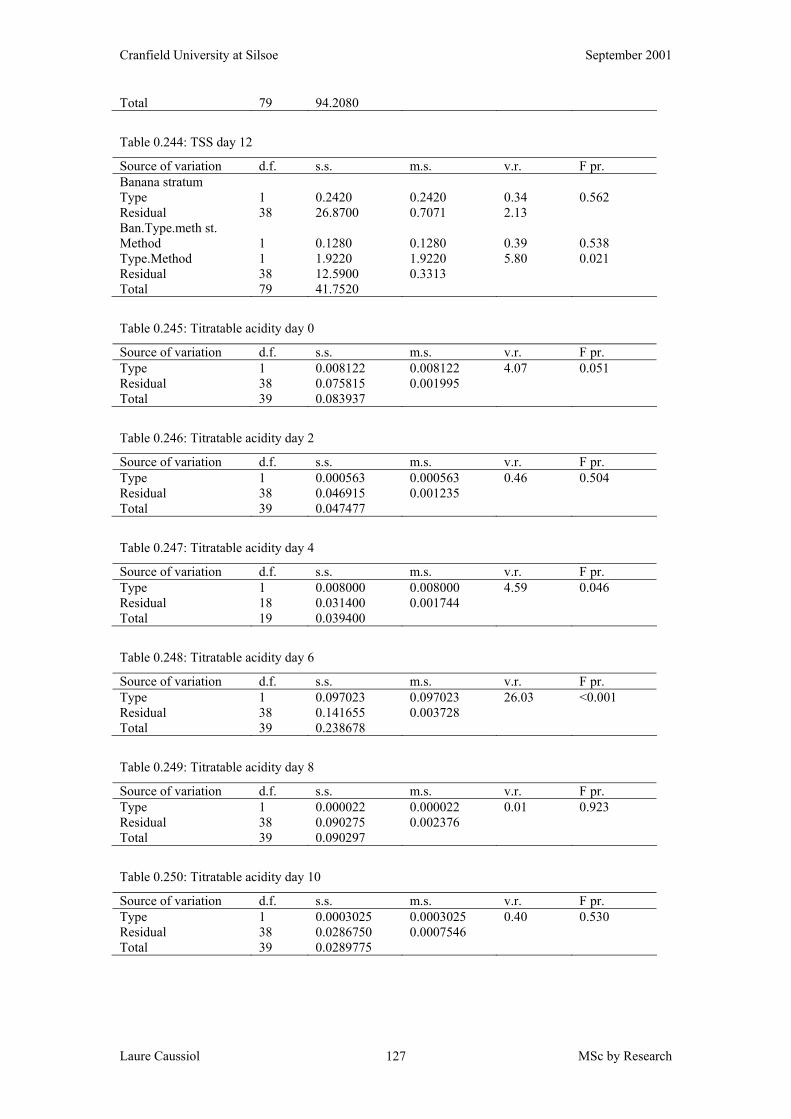
Cranfield University at Silsoe September 2001
Laure Caussiol MSc by Research 127
Total 79 94.2080
Table 0.244: TSS day 12
Source of variation d.f. s.s. m.s. v.r. F pr. Banana stratum Type 1 0.2420 0.2420 0.34 0.562 Residual 38 26.8700 0.7071 2.13 Ban.Type.meth st. Method 1 0.1280 0.1280 0.39 0.538 Type.Method 1 1.9220 1.9220 5.80 0.021 Residual 38 12.5900 0.3313 Total 79 41.7520
Table 0.245: Titratable acidity day 0
Source of variation d.f. s.s. m.s. v.r. F pr. Type 1 0.008122 0.008122 4.07 0.051 Residual 38 0.075815 0.001995 Total 39 0.083937
Table 0.246: Titratable acidity day 2
Source of variation d.f. s.s. m.s. v.r. F pr. Type 1 0.000563 0.000563 0.46 0.504 Residual 38 0.046915 0.001235 Total 39 0.047477
Table 0.247: Titratable acidity day 4
Source of variation d.f. s.s. m.s. v.r. F pr. Type 1 0.008000 0.008000 4.59 0.046 Residual 18 0.031400 0.001744 Total 19 0.039400
Table 0.248: Titratable acidity day 6
Source of variation d.f. s.s. m.s. v.r. F pr. Type 1 0.097023 0.097023 26.03 <0.001 Residual 38 0.141655 0.003728 Total 39 0.238678
Table 0.249: Titratable acidity day 8
Source of variation d.f. s.s. m.s. v.r. F pr. Type 1 0.000022 0.000022 0.01 0.923 Residual 38 0.090275 0.002376 Total 39 0.090297
Table 0.250: Titratable acidity day 10
Source of variation d.f. s.s. m.s. v.r. F pr. Type 1 0.0003025 0.0003025 0.40 0.530 Residual 38 0.0286750 0.0007546 Total 39 0.0289775
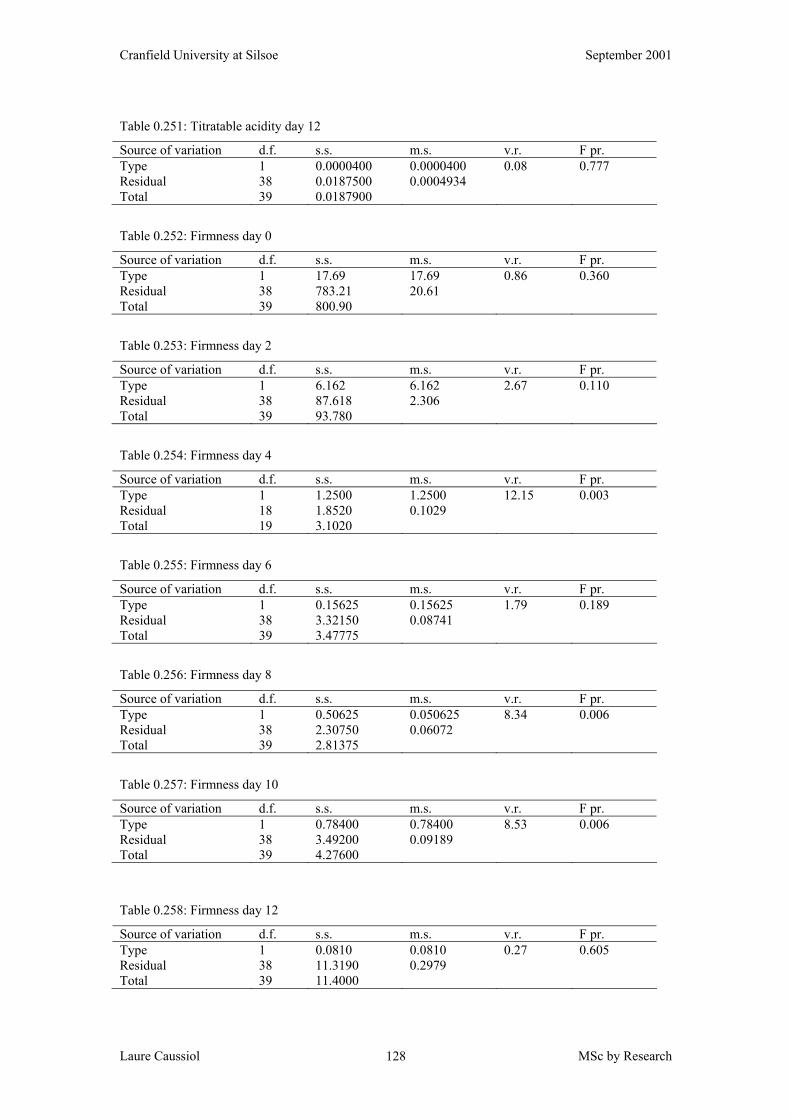
Cranfield University at Silsoe September 2001
Laure Caussiol MSc by Research 128
Table 0.251: Titratable acidity day 12
Source of variation d.f. s.s. m.s. v.r. F pr. Type 1 0.0000400 0.0000400 0.08 0.777 Residual 38 0.0187500 0.0004934 Total 39 0.0187900
Table 0.252: Firmness day 0
Source of variation d.f. s.s. m.s. v.r. F pr. Type 1 17.69 17.69 0.86 0.360 Residual 38 783.21 20.61 Total 39 800.90
Table 0.253: Firmness day 2
Source of variation d.f. s.s. m.s. v.r. F pr. Type 1 6.162 6.162 2.67 0.110 Residual 38 87.618 2.306 Total 39 93.780
Table 0.254: Firmness day 4
Source of variation d.f. s.s. m.s. v.r. F pr. Type 1 1.2500 1.2500 12.15 0.003 Residual 18 1.8520 0.1029 Total 19 3.1020
Table 0.255: Firmness day 6
Source of variation d.f. s.s. m.s. v.r. F pr. Type 1 0.15625 0.15625 1.79 0.189 Residual 38 3.32150 0.08741 Total 39 3.47775
Table 0.256: Firmness day 8
Source of variation d.f. s.s. m.s. v.r. F pr. Type 1 0.50625 0.050625 8.34 0.006 Residual 38 2.30750 0.06072 Total 39 2.81375
Table 0.257: Firmness day 10
Source of variation d.f. s.s. m.s. v.r. F pr. Type 1 0.78400 0.78400 8.53 0.006 Residual 38 3.49200 0.09189 Total 39 4.27600
Table 0.258: Firmness day 12
Source of variation d.f. s.s. m.s. v.r. F pr. Type 1 0.0810 0.0810 0.27 0.605 Residual 38 11.3190 0.2979 Total 39 11.4000
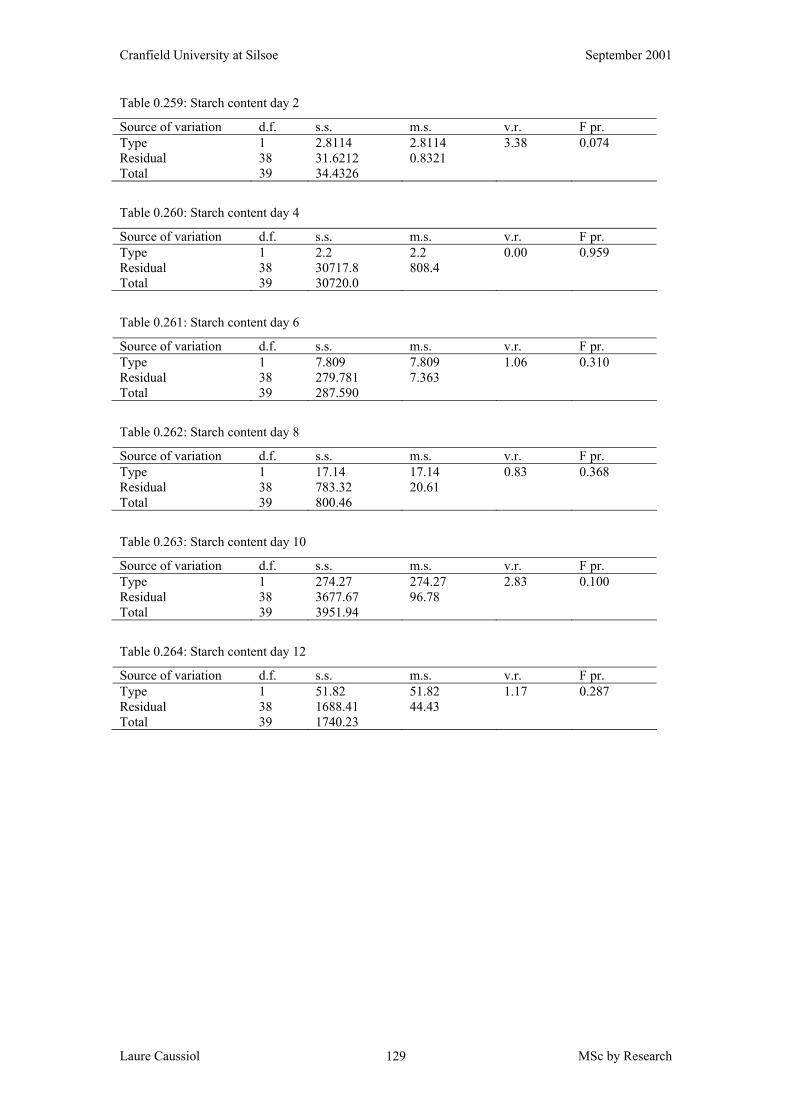
Cranfield University at Silsoe September 2001
Laure Caussiol MSc by Research 129
Table 0.259: Starch content day 2
Source of variation d.f. s.s. m.s. v.r. F pr. Type 1 2.8114 2.8114 3.38 0.074 Residual 38 31.6212 0.8321 Total 39 34.4326
Table 0.260: Starch content day 4
Source of variation d.f. s.s. m.s. v.r. F pr. Type 1 2.2 2.2 0.00 0.959 Residual 38 30717.8 808.4 Total 39 30720.0
Table 0.261: Starch content day 6
Source of variation d.f. s.s. m.s. v.r. F pr. Type 1 7.809 7.809 1.06 0.310 Residual 38 279.781 7.363 Total 39 287.590
Table 0.262: Starch content day 8
Source of variation d.f. s.s. m.s. v.r. F pr. Type 1 17.14 17.14 0.83 0.368 Residual 38 783.32 20.61 Total 39 800.46
Table 0.263: Starch content day 10
Source of variation d.f. s.s. m.s. v.r. F pr. Type 1 274.27 274.27 2.83 0.100 Residual 38 3677.67 96.78 Total 39 3951.94
Table 0.264: Starch content day 12
Source of variation d.f. s.s. m.s. v.r. F pr. Type 1 51.82 51.82 1.17 0.287 Residual 38 1688.41 44.43 Total 39 1740.23
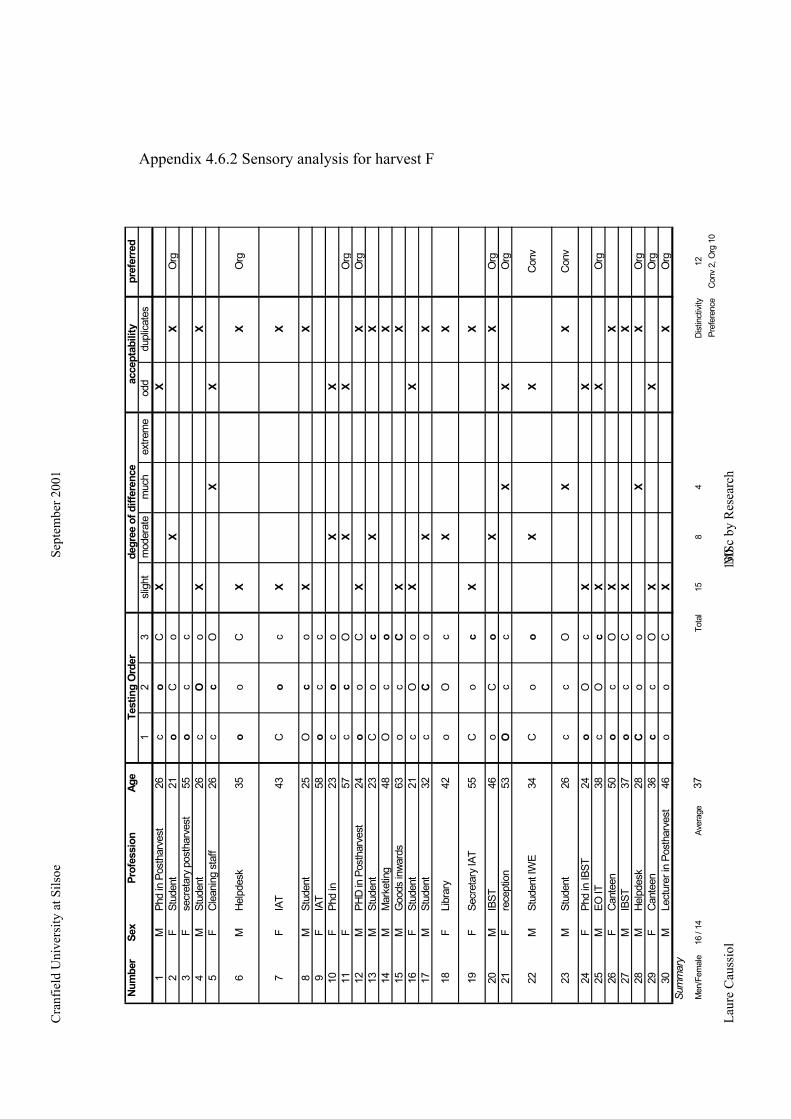
Cra
nfie
ld U
nive
rsity
at S
ilsoe
Sept
embe
r 200
1
Laur
e C
auss
iol
M
Sc b
y R
esea
rch
13
0
Num
ber
Sex
Prof
essi
onAg
epr
efer
red
12
3sl
igh t
mod
erat
em
uch
extre
me
odd
dupl
icate
s1
MPh
d in
Pos
thar
vest
26c
oC
XX
2F
Stud
ent
21o
Co
XX
Org
3F
secr
etar
y po
stha
rves
t55
oc
c4
MSt
uden
t 26
cO
oX
X5
FCl
eani
ng s
taff
26c
cO
XX
6M
Help
desk
35o
oC
XX
Org
7F
IAT
43C
oc
XX
8M
Stud
ent
25O
co
XX
9F
IAT
58o
cc
10F
Phd
in
23c
oo
XX
11F
57c
cO
XX
Org
12M
PHD
in P
osth
arve
st24
oo
CX
XO
rg13
MSt
uden
t23
Co
cX
X14
MM
arke
ting
48O
co
X15
MG
oods
inwa
rds
63o
cC
XX
16F
Stud
ent
21c
Oo
XX
17M
Stud
ent
32c
Co
XX
18F
Libr
ary
42o
Oc
XX
19F
Secr
etar
y IA
T55
Co
cX
X
20M
IBST
46o
Co
XX
Org
21F
rece
ptio
n53
Oc
cX
XO
rg
22M
Stud
ent I
WE
34C
oo
XX
Con
v
23M
Stud
ent
26c
cO
XX
Con
v
24F
Phd
in IB
ST24
oO
cX
X25
MEO
IT38
cO
cX
XO
rg26
FCa
ntee
n50
oc
OX
X27
MIB
ST37
oc
CX
X28
MHe
lpde
sk28
Co
oX
XO
rg29
FCa
ntee
n36
cc
OX
XO
rg30
MLe
ctur
er in
Pos
thar
vest
46o
oC
XX
Org
Summary
Men
/Fem
ale
16 /
14Av
erag
e37
Tota
l15
84
Dist
inct
ivity
12Pr
efer
ence
Conv
2, O
rg 1
0
Test
ing
Ord
erde
gree
of d
iffer
ence
acce
ptab
ility
Appendix 4.6.2 Sensory analysis for harvest F
Cranfield University at Silsoe September 2001
Laure Caussiol MSc by Research 131
References
Abdullah, H., Lizada, M. C. C., Tan, S. C. Pantastico, E. B., and Tongdee, S. C. 1990.
Storage of banana. IN: Hassan, A., and Pantastico, E. B. 1990. Banana fruit
development, postharvest physiology, handling and marketing in ASEAN. pp. 44-64.
Agravante J. U., Matsui T., and Kitagawa H., 1990. Starch breakdown and changes in
amylase activity during ripening of ethylene- and ethanol-treated bananas. Tropical
Fruit in International Trade. Acta Horticulturae 269, 133-140.
Almazan, A. M., 1991. Chemical changes in some cooking banana and plantain
cultivars during ripening. Tropical Science 31: 335-346.
Americafruit, 2001. Banana industry addressing US market challenges. April/ May,
pp. 20-22.
Badran and Lima, 1969. cited by Hewage, S. K., Wainwright, H., Swinburne, T. N.,
and Wijerathnam, R. S. W., 1994. Modified atmosphere storage of bananas at chilling
temperatures. IN: Champ, B. R., Highley, E., and Johnson, G. I., 1994. Postharvest
handling of tropicalfruits: procedures of an international conference held at Chang
Mai, Thailand, 19-23 July. ACIAR Proceedings N 50, 500 p.
Balagon Grower’s Association/ Alter Trade Corporation, 1998. Organic banana
production for alternative trade, Philippines. IN: Astorga, Y. The Environmental
impact of the banana industry: a case study of Costa Rica. Appendix 2.
Baldry, J. Coursey D. G., and Howard, G. E., 1981. The comparative consumer
acceptability of triploid and tetraploid banana fruit. Tropical Science 23 (1).
BBC News, 2000. Millions Turn to organic. February. Internet site
http://www.news.bbc.co.uk
Cranfield University at Silsoe September 2001
Laure Caussiol MSc by Research 132
Beaudry, R. M., Paz, N., Black, C. C., and Kays, S. J. 1987. Banana ripening:
Implications of changes in internal ethylene and CO2 concentrations, pulp fructose,
2,6-biphosphate concentration, and activity of some glycolitic enzymes, Plant
physiology 85, pp. 277-282.
Beverly, R. B., Latimer, J. G., and Smittle, D. A. 1992. Postharvest handling: a
systems approach IN: Preharvest Physiological and cultural effects on postharvest
quality, chapter 4, pp. 73-98.
Biale, J. B., Young, R. E., and Olmstead A. J., 1953. Fruit Respiration and ethylene
production. Plant physiology pp.168-174.
Blankenship, S. M., and Herdeman R. W., 1995. High relative humidity after ethylene
gassing is important to banana fruit quality. Horticulture Technology 5 (2).
Burg, S. P. and Burg, E. A., 1965. Ethylene action and the ripening of fruits. Ethylene
influences the growth and developments of plants and is the hormone, which initiates
fruit ripening. Science 148: 1190-1196, NY.
Chandler S., 1995. The nutritional value of bananas IN: Gowen S. 1995. Bananas and
plantains. Natural Resources Institute and Department of Agriculture University of
Reading, UK, Chapman & Hall.
Chang, W. H., Hwang, Y. J., and Wei, T. C., 1990. Chemical composition and
enzyme activity of Taiwan northern banana fruit of different maturity and harvested in
different seasons. Acta Horticulturae 275, Tropical and Subtropical fruits, pp. 621-
629.
Chang, W. H., and Hwang, Y. J., 1990. Effect of some inhibitors on carbohydrate
content and related enzyme activity during ripening of Taiwan northern banana fruit.
Acta Horticulturae 275, Tropical and subtropical fruits, pp. 611-619.
Cranfield University at Silsoe September 2001
Laure Caussiol MSc by Research 133
Chu, C. L., 1988. Starch-iodine test for determining maturity and harvest dates of
empire, Idared and Spartan apples. Horticultural research Institute of Ontario,
Vineland station, order no 88-090.
CIRAD, INIBAP, IPGRI, Descriptors for banana (Musa spp.)
Clendennen, S. K., Kipp, P. B., and May, G. G., 1997. The role of ethylene in banana
fruit ripening. IN: Kanellis et al. Biology of the plant hormone ethylene, pp. 141-148.
CODEX Alimentarius, Vol 2B IN: MAFFF/HSE. 1996. Annual Report of the
Working Party on Pesticide Residues.
Commonwealth Scientific and Industrial Research Organisation, (CSIRO). Banana
ripening guide. Division of Food Research, circular 8.
Commonwealth Scientific and Industrial Research Organisation, (CSIRO). Colour
chart.
Cordenunsi, B. R., and Lajolo, F. M., 1995. Starch breakdown during banana
ripening: sucrose synthase and sucrose phosphate synthase. Journal of Agriculture
and Chemistry 43: 347-351.
Coursey, D. G., Mariott, J., New, S., Howard, G. E., Bauldry, J., Caygill J. C. and
Wallbridge, A., 1974. Experimental parameters of fruit quality in new banana
cultivars. Procession IV International Congress Food Science and Technology. II, 70-
79.
De Haen, H., 1999. Producing and marketing quality organic products, opportunities
and challenges. FAO, 1999. Sixth IFOAM trade conference, Quality and
communication for the organic market, Florence, 23rd October.
De Swardt G. H. and Maxie, E. C., 1967. Pectin methyl esterase in the ripening
banana. South African Journal of agricultural sciences 10: 501-506.
Cranfield University at Silsoe September 2001
Laure Caussiol MSc by Research 134
Dominguez, M., Vendrell, M., 1994. Effect of ethylene treatment on ethylene
production, EFE activity and ACC levels in peel and pulp of banana fruit. Postharvest
biology and technology 4: 167-177.
Dominguez, M. Vendrell, M., 1930. Ethylene biosynthesis in banana fruit: evolution
of EFE activity and ACC levels in peel and pulp during ripening. Journal of
horticutural science 68: (1), 63-40.
Eurofruit, 2001. Organic bananas advance in Europe. May, pp.40-42.
FAO. 2000. Statistics, internet site http://www.fao.org
FAO. 1999a. Statistics, internet site http://www.fao.org
FAO. 1999b. Projections for supply and demand of Bananas to 2005. Committee on
commodity problems, Intergovernmental group on banana and tropical fruits, First
session, Gold coast, Australia, 4-8 May.
FAO. 1999c. The market for organic and fair-trade bananas. Committee on
commodity problems, intergovernmental group on banana and tropical fruits, first
session, Gold coast, Australia, 4-8 May.
FAO. 2001. Guidelines for the production, processing, labelling and marketing of
organically produced foods, GL 32-1999, Rev. 1-2001.
Frijters, J. E. R., undated. Sensory difference testing and the measurement of sensory
discriminability.
Frison, E. A, and Sharrock S., 1999. The potential for use of disease-resistant varieties
as organic bananas. IN: Holderness, M., Sharrock, S., Frison, E., and Kairo, M.
Organic banana 2000: Towards an organic banana initiative in the Caribbean. pp. 143-
150.
Cranfield University at Silsoe September 2001
Laure Caussiol MSc by Research 135
Gane, R., 1937. The respiration of bananas in presence of ethylene. New physiologist
36: 170-178.
Garcia, 1976. Cited by Abdullah, H., Lizada, M. C. C., Tan, S. C. Pantastico, E. B.,
and Tongdee, S. C. 1990. Storage of banana. IN: Hassan, A., and Pantastico, E. B.
1990. Banana fruit development, postharvest physiology, handling and marketing in
ASEAN. pp. 44-64.
Garcia, E., and Lajolo, F. M., 1988. Starch transformation during banana ripening: the
amylase and glucosidase behaviour. Journal of food science 53: (4), pp.1881-1886.
Gelido, 1986. Cited by Munasque, V. S., Abdullah, H., Gelido, M. E. R. A., Rohaya,
M. A., and Zaipun, M. Z., 1990. Fruit growth and maturation of Banana, IN: Hassan,
A., and Pantastico, E. B., 1990. Banana fruit development, postharvest physiology,
handling and marketing in ASEAN. pp. 33-43.
Golding J. B., Shearer D., McGlasson W. B., and Wyllie S. G., 1999. Relationship
between respiration, ethylene, and aroma production in ripening banana. Journal of
Agriculture, Food and Chemistry 47: pp.1646-1651.
Gowen S. R., 1995. Bananas and plantains. Natural Resources Institute and
Department of Agriculture University of Reading, UK, Chapman & Hall.
Gowen S. R., 1995. Pests IN: Gowen S. Bananas and plantains. Natural Resources
Institute and Department of Agriculture University of Reading, UK, Chapman & Hall.
Gottreich, M., Temkin-Gorodeiski, N., Peled, A., Spodheim R., and Aharoni, Y.,
1969. The determination of the stage of ripeness of bananas by colorimetry. Tropical
Agriculture, Trinidad 46 (3) pp.239-245.
Haest, C., 1999. European market potential for organic produce and supply and
quality assurance requirements. IN: Holderness, M., Sharrock, S., Frison, E., and
Kairo, M. Organic banana 2000: Towards an organic banana initiative in the
Caribbean. pp. 95-110.
Cranfield University at Silsoe September 2001
Laure Caussiol MSc by Research 136
Harris, D. R., Seberry, D. R., Wills R. B. H., Spohr L. J., 2000. Effect of fruit
maturity on efficiency of 1-methylcyclopropene to delay the ripening of bananas.
Postharvest biology and technology 20: 303-308.
Harwood, J. 1995. Postharvest quality challenges for producers. Conference
Proceedings, Postharvest quality assessment, Silsoe college, The Association of
Applied Biologists and The Institution of Agricultural Engineers, Postharvest News
and information 6 (3).
Hassan, A., and Pantastico, E. B., 1990. Banana fruit development. Postharvest
physiology, handling and marketing in ASEAN.
Hewage, S. K., Wainwright, H., Swinburne, T. N., and Wijerathnam, R. S. W., 1994.
Modified atmosphere storage of bananas at chilling temperatures. IN: Champ, B. R.,
Hewage, H. X. S., Waineright, H., and Luo, Y., 1995. Effect of ethanol and
acetaldehyde on banana ripening. Journal of horticultural science 70 (1), 51-55.
Highley, E., and Johnson, G. I. Postharvest handling of tropical fruits, IN:
Proceedings of an international conference held at Chang Mai, Thailand, 19-23 July.
ACIAR Proceedings. N°50. pp. 491-421.
Hill, S. A., and Rees, T. A., 1994. Fluxes of carbohydrate metabolism in ripening
bananas. Planta 192: 52-60.
Hofman, P. J. and Smith, L. G. 1993. Preharvest effects on postharvest quality of
subtropical and tropical fruit. IN: Proceedings of an international conference held at
Chang Mai, Thailand, 19-23 July. ACIAR Proceedings. N°50.
Holderness, M. Bridge, J., and Gold, C. S., 1999. Pest mananagement in organic
systems. IN: Holderness, M., Sharrock, S., Frison, E., and Kairo, M. Organic banana
2000: Towards an organic banana initiative in the Caribbean. pp. 133-142.
Cranfield University at Silsoe September 2001
Laure Caussiol MSc by Research 137
Holl, W., 1977. Plant research and development 05: 63. pp. 118-126.
Hultin. H. O., and Levine. A. S. 1963. Pectin methyl esterase in the ripening banana.
917-921.
Hubbard, N. L., Pharr, D. M., and Huber, S. C., 1990. Role of sucrose phosphate
synthase in sucrose biosynthesis in ripening bananas and its relationship to the
respiratory climacteric. Plant physiology 94: 201-208.
Inaba and Nakamura, 1988. Cited by John, P. and Marchal J. 1995. Ripening and
biochemistry of the fruit, IN: Gowen S. Bananas and plantains, Natural Resources
Institute and Department of Agriculture University of Reading, UK, Chapman & Hall.
INIBAP, 2000. Internet site http://www.inibap.org/new/genomics_fre.htm
Jeger, M. J., Edengreen, S., Thresh, J. M., Johanson, A., Waller, J. M., and Brown, A.
E. 1995. Banana disease IN: Gowen S. Bananas and plantains, Natural Resources
Institute and Department of Agriculture University of Reading, UK, Chapman & Hall.
John, P. and Marchal J. 1995. Ripening and biochemistry of the fruit, IN: Gowen S.
Bananas and plantains, Natural Resources Institute and Department of Agriculture
University of Reading, UK, Chapman & Hall.
Jones, D. R., 1999. Diseases of Banana, Abaca and Enset. CAB international.
Jurg, H. O., and Yang, S. F. undated.
Kader, A. A. and Kashmire, R. F., 1984. Effects of ethylene on horticultural
commodities during postharvest handling. Produce Marketing Almanac Supplement,
5-7.
Cranfield University at Silsoe September 2001
Laure Caussiol MSc by Research 138
Kader, A. A., 1985. Ethylene-induced senescence and physiological disorders in
harvested horticultural crops. Proceedings of the symposium, Ethylene in postharvest
biology and technology of horticultural crops. HortScience, 20(1),
Kader, A. A., 1992. Postharvest technology of Horticultural crops. University of
California, division of Agriculture and Natural Resources, second edition, publication
3311. (quality and safety factors, definition and evaluation for fresh horticultural
crops)
Kader, 1999. Bananas, recommendations for maintaining postharvest quality,
http://www.ethylenecontrol.com/technical.htlm.
Kanellis, A. K., Solomos, T., and Mattoo, A. K., 1989. Changes in sugars, enzymic
activities and acid phosphatase isoenzyme profiles of bananas ripened in air or stored
in 2.5% O2 with and without ethylene. Plant Physiology 90: 251-258.
Kashmire, R. F. and Ahrens, M. J., 1992. Transportation of fresh market horticultural
crops. IN: Kader, A. A., 1992. Postharvest technology of Horticultural crops.
University of California, division of Agriculture and Natural Resources, second
edition, publication 3311.
Kashmire, R. F., and Ahrens, M. J., 1992. Handling of Horticultural crops at
destination market, IN: Kader, A. A., 1992. Postharvest technology of Horticultural
crops. University of California, division of Agriculture and Natural Resources, second
edition, publication 3311.
Klein, J. D., and Lurie, S., 1991. Postharvest heat treatment and fruit quality.
Postharvest news and information 2 (1), pp.15-19.
Kojima, K., Sakurai, N., Kuraishi. S., yamoto, R., and Inaba, A., 1992. Physical
measurements of firmness of banana fruit pulp: determination of optimum conditions
for measurement. Postharvest biology and technology 2 pp.41-49.
Cranfield University at Silsoe September 2001
Laure Caussiol MSc by Research 139
Kurien, S. Anil, B. K., Rajeevan, P. K., Bharathan, V., Krishnan, S., 2000.
Phosphorus mobilisation to uneconomic tissues and effects of bunch trimming
regimes in banana. Scientia Horticultura 83: 25-32.
Lahav, E., 1995. Banana nutrition. IN: Gowen S. Bananas and plantains. Natural
Resources Institute and Department of Agriculture University of Reading, UK,
Chapman & Hall, pp. 258-315.
Larmond, E., 1977. Laboratory methods for sensory evaluation of food, Research
branch, Canada Department of Agriculture, publication 1637.
Lawes Agricultural Trust (Rothamsted Experimental Station), 1996. Genstat for
Windows. Command language manual, 2nd edition.
Legge, A., 1999. Organic bananas-from harvest to consumer. IN: Holderness, M.,
Sharrock, S., Frison, E., and Kairo, M., 1999. Organic banana 2000: Towards an
organic banana initiative in the Caribbean. pp. 123-126.
Lee, S. K., and Kader, A. A., 2000. Preharvest and postharvest factors influencing
vitamin C content of horticultural crops. Postharvest biology and technology, 20: 207-
200.
Leopold, A. C., and Kriedmann, P. E. undated. Plant growth development.
L’homme, C., Peschet J. L., Puigserver, A., Biagini, A., 2001. Evaluation of fructans
in various fresh and stewed fruits by high-performance anion exchange
chromatography with pulsed amperometric detection. Journal of chromatography A
920: 921-927.
Lizada, M. C. C., Pantastico, E. B., Shukor, A. R. A., and Sabari, S. D., 1990.
Changes during ripening of banana, ripening of banana. IN: Hassan, A., and
Pantastico, E. B., 1995. Banana fruit development, postharvest physiology, handling
and marketing in ASEAN. pp. 65-71.
Cranfield University at Silsoe September 2001
Laure Caussiol MSc by Research 140
Lizada and Novenario, 1983 cited by Abdullah, H., Lizada, M. C. C., Tan, S. C.
Pantastico, E. B., and Tongdee, S. C. 1990. Storage of banana. IN: Hassan, A., and
Pantastico, E. B. 1990. Banana fruit development, postharvest physiology, handling
and marketing in ASEAN. pp. 44-64.
Lizana, L. A., 1976. Quantitative evolution of sugars in banana fruit ripening at
normal to elevated temperatures. Acta Horticulturae 57, Tropical and Subtropical
fruits, 163-177.
Loeillet, D., 1999. Banane, Produits tropicaux. CIRAD.
Loesecke, 1950. Cited by Sen et al. 1982. Some aspects of physico-chemical changes
in ripening bananas during ripening in storages. Prog. Hort. 14(1). pp. 79-84.
Loesecke, 1949. Cited by Garcia, E., and Franco, M. L., 1988. Starch transformation
during banana ripening: the amylase and glucosidase behaviour. Journal of food
science 53: (4), pp.1881-1886.
Lopez, C.E., 1999. The Dominican Republic experience. IN: Holderness, M.,
Sharrock, S., Frison, E., and Kairo, M., 1999. Organic banana 2000: Towards an
organic banana initiative in the Caribbean. pp. 67-70.
Madrid M. and Lopez-lee, F., 1998. Differences in ripening characteristics of
controlled atmosphere or air-stored bananas. Acta Horticulturae 464.
Madamba, L. S. P., Baes A. U., and Mendoza, D. B., 1977. Effect of maturity on
some biochemical changes during ripening of banana (Musa sapientum L. c. v.
Lakatan). Food Chemistry 2: 177-183.
Malins A., 1995. Out-turn quality of tropical products arriving in the UK. Conference
Proceedings, Postharvest quality assessment, Silsoe college, The Association of
Applied Biologists and The Institution of Agricultural Engineers, Postharvest News
and information 6 (3).
Cranfield University at Silsoe September 2001
Laure Caussiol MSc by Research 141
Mao and Kinsella, 1981. cited by Garcia, E., and Franco, M. L., 1988. Starch
transformation during banana ripening: the amylase and glucosidase behaviour.
Journal of food science 53: (4), pp.1881-1886.
Mapson, L. W., and Robinson, J. E., 1966. Relationship between oxygen tension,
biosynthesis of ethylene, respiration and ripening changes in banana fruit. Journal of
Food Technology 1: 215-225.
Marini, R. P., 1999. Are nonsignificant differences really not significant? Hortscience
34(5) pp.761-762
Marriott, J., Robinson, M., and Karikari, S. K., 1981. Starch and sugar transformation
during the ripening of plantains and bananas. Journal of Science, Food and
Agriculture 1021-1026.
Marriott, J., and Lancaster, P. A., 1983. Bananas and Plantains. IN: Harvey, T., and
Chan, J. R., 1983 Handbook of tropical foods, U.S.D.A.
McGlasson, W. B., 1985. Ethylene and fruit ripening. Proceedings of the symposium,
Ethylene in postharvest biology and technology of horticultural crops. HortScience 20
(1),
McGuire R. C., 1992. Reporting of objective color measurments. Hortscience 27 (12).
pp. 1254-1255.
Medlicott A. P., Semple, A. J., Thompson A. J., Blackbourne H. R., and Thompson
A. K., 1992. Measurement of colour changes in ripening bananas and mangoes by
instrumental, chemical and visual assessments. Tropical Agriculture Trinidad 69 (2),
161-166.
Meteo France, 1999. internet site: http://www.meteo.fr/meteonet/
Ministry of Agriculture, Fisheries and Food (MAFF), 1987. Fruit maturity testing,
refractometer use. HPP 212.
Cranfield University at Silsoe September 2001
Laure Caussiol MSc by Research 142
Mizrahi and Hobson, 1988. Cited by Shewfelt 1992. IN: Shewfelt, R. L., and Prussia,
S. E. 1992. Postharvest Handling, a systems approach. Academic press, USA.
Mintel, 2000. Fresh fruit and vegetables.
Mintel, 2001. News. http://sinatra2.mintel.com/sinatra/alldbs/x/y/home?
Mitchell F. G., and Kader A. A., 1992. Postharvest treatments for insect control. IN:
Kader, A. A., 1992. Postharvest technology of Horticultural crops. University of
California, division of Agriculture and Natural Resources, second edition, Publication
3311.
Mitchell, F. G., 1992. Cooling horticultural commodities, IN: Kader, A. A., 1992.
Postharvest technology of horticultural crops. University of California, division of
Agriculture and Natural Resources, second edition, Publication 3311.
Munasque, V. S., Abdullah, H., Gelido, M. E. R. A., Rohaya, M. A., and Zaipun, M.
Z., 1990. Fruit growth and maturation of Banana, IN: Hassan, A., and Pantastico, E.
B., 1990. Banana fruit development, postharvest physiology, handling and marketing
in ASEAN. pp. 33-43.
Musalogue, 2000. A catalogue of Musa germplasm, Diversity in the genus Musa.
INIBAP, CTA, CIRAD, CRPB, Queensland government, NARO.
Mustaffa, R., Osman, A., Yusof S. and Mohamed, S., 1998. Physico-chemical
changes in Cavendish banana (Musa cavendishii L var Montel), at different positions
within a bunch during development and Maturation. Journal of Science of Food and
Agriculture 78, 201-207.
Nascimento J. R. O., Cordenunsi B. R., Lajolo F. M., and Alcocer M. J. C., 1997.
Banana sucrose-phosphate synthase gene expression during fruit ripening. Planta 203:
283-288.
Cranfield University at Silsoe September 2001
Laure Caussiol MSc by Research 143
Orchard, J. and Krauss, U., 1999. Scope for organic management of postharvest
diseases and disorders of bananas. IN: Holderness, M., Sharrock, S., Frison, E., and
Kairo, M., 1999. Organic banana 2000: Towards an organic banana initiative in the
Caribbean. pp. 151-154.
Ortiz, R., Ferris, R. S. B., and Vuylsteke, D. R., 1995. Banana and plaintain breeding.
IN: Gowen S., 1995. Bananas and plantains, Natural Resources Institute and
Department of Agriculture University of Reading, UK, Chapman & Hall. pp. 110-145
Pangborn, R. V. undated. Sensory techniques of food analysis, p56. IN: Ian Crawford,
(Marketing professor at Cranfield University at Silsoe) 2000. Lectures of sensory
analysis.
Pantastico, E. B., Azizan, M. A., Abdullah, H., Acedo, A. L., Dasuki, I. M., and
Kosiyachinda, S., 1990. Physiological disorders of banana fruit. IN: Hassan, A., and
Pantastico, E. B., 1990. Banana fruit development, postharvest physiology, handling
and marketing in ASEAN. pp. 85-103.
Peacock, B. C. and Blake, J. R., 1970. Some effects of non-damaging temperatures on
the life and respiratory behaviour of bananas. Queensland Journal of Agricultural and
Animal Sciences 27: 147-168.
Peacock, B. C., 1972. Role of ethylene in the initiation of fruit ripening. Queensland
Journal of Agricultural and Animal Sciences 29: 137-145.
Peacock, B. C., 1980. Banana ripening, Effect of temperature on fruit quality.
Queensland journal of agricultural and animal sciences 37: (1), 39-45.
Prussia, S. E., and Shewfelt, R. L., 1993. Systems approach to postharvest handling,
Postharvest handling: a systems approach. chapter 3, pp. 44-68.
Prabha T. N., and Bhagyalakshmi, N. 1998. Carbohydrate metabolism in ripening
banana fruit, Phytochemistry, 48 (6) 915-919.
Cranfield University at Silsoe September 2001
Laure Caussiol MSc by Research 144
Reid, M. S., 1992. Ethylene in Postharvest Technology IN: Kader A. A. Postharvest
technology of Horticultural crops, second edition, technical editor, University of
California, division of Agriculture and Natural Resources, Publication 3311. pp. 97-
108.
Reid, M. S., 1985. Ehtylene and abscisssion. Proceedings of the symposium, Ethylene
in postharvest biology and technology of horticultural crops. HortScience 20(1),
Rippon, L. E. and Trochoulias, T. 1977. Improved ripening of bananas. Reprinted
from the Agricultural Gazette of N. S. W. 88 (1).
Robinson, J. C., 1995. Systems of cultivation and management. IN: Gowen S., 1995.
Bananas and plantains. Natural Resources Institute and Department of Agriculture
University of Reading, UK, Chapman & Hall.
Robinson, J. C. 1995. Ripening, biochemistry and uses. IN: Gowen S., 1995. Bananas
and plantains, Natural Resources Institute and Department of Agriculture University
of Reading, UK, Chapman & Hall
Roland P. C, David H. L., Terry A. H., 1986. Guidelines for sensory analysis in Food
Product and Quality control, 2nd edition, p. 43
Sanchez Nieva, F., Hernanadez, I., and Bueso de Vinas, C. undated. Ripening of
Montecristo Bananas, Journal of agriculture of university of Puerto Rico 274-283.
Saltveit, M. E., 1999. Effect of ethylene on quality of fresh fruits and vegetables.
Postharvest biology and technology 15: 276-292.
Satyan and Parwardhan, 1984. Cited by John, P. and Marchal J. 1995. Ripening and
biochemistry of the fruit, IN: Gowen S. Bananas and plantains, Natural Resources
Institute and Department of Agriculture University of Reading, UK, Chapman & Hall.
Sauve, E., 1998. The global market for organic bananas. INIBAP, Montpellier,
France.
Cranfield University at Silsoe September 2001
Laure Caussiol MSc by Research 145
Sen, S., Chakkrabarty, S., and Chatterjee, B. K. 1982. Some aspect of physico-
chemical changes in bananas during ripening in storages. Prog. Hort. 14(1), 79-84.
Sepiah, M., Acedo, A. L., Sabari, S. D., Ilag, L. L., and Kuthubutheen, A. J., 1990.
Postharvest pathology of banana, Postharvest pathology and entomology of banana.
IN: Hassan, A., and Pantastico, E. B., 1990. Banana fruit development, postharvest
physiology, handling and marketing in ASEAN. pp. 104-111.
Seymour, 1993. Banana. IN: Seymour, G. Taylor, J. E., and Tucker, G. A., 1993.
Biochemistry of fruit ripening. Chapman and Hall, London.
Shamsudin, O., and Suphrangkasen, P., 1990. Postharvest insect pests and their
control in banana, Postharvest pathology and entomology of banana. IN: Hassan, A.,
and Pantastico, E. B., 1990. Banana fruit development, postharvest physiology,
handling and marketing in ASEAN. pp. 85-103.
Shewfelt, R. L., 1992. Applications of a system approach to postharvest handling. IN:
Shewfelt, R. L., and Prussia, S. E. 1992. Postharvest Handling, a systems approach.
Academic press, USA.
Shewfelt, R. L., 1993. Measuring quality and maturity, Postharvest handling: a
systems approach. chapter 5, pp. 100-119.
Shewfelt, R. L., 1999. What is quality? Postharvest biology and technology 15: 197-
200.
SH Pratt’s and Co. (Luton, UK), Colour chart.
SICABAM, 1998. Le manuel du planteur.
Smith, N. J., Seymour, G. B., Jeger, M. J., G. A. Tucker, G. A., 1990. Cell wall
changes in bananas and plantains. Tropical Fruit in International Trade, pp. 283-289.
Acta Horticulturae 269.
Cranfield University at Silsoe September 2001
Laure Caussiol MSc by Research 146
Smith, N. J. S., 1995. Recognising and achieving commercial quality in fresh
produce. Conference Proceedings, Postharvest quality assessment, Silsoe college, The
Association of Applied Biologists and The Institution of Agricultural Engineers,
Postharvest News and information 6 (3), 28-30.
Snedecor, G. W., Cochran W. G., 1967. Statistical methods. The Iowa State
University Press, Ames, Iowa, USA, 6th edition.
Soil association, 2000. Ethylene use in the ripening of organic bananas. briefing
paper.
Sommer, N. F., Fortlage, R. J., and Edwards, D. C., 1992. Postharvest diseases of
selected commodities. IN: Kader, A. A., 1992. Postharvest technology of
Horticultural crops. Second edition, technical editor, University of California, division
of Agriculture and Natural Resources, Publication 3311.
Sommer N. F., and Arpaia, M. L., 1992. Postharvest handling systems: tropical fruits
IN: Kader, A. A., 1992. Postharvest technology of Horticultural crops. Second
edition, technical editor, University of California, division of Agriculture and Natural
Resources, Publication 3311. pp.
Srivastava, M. K., Dwivedi, U. N., 2000. Delayed ripening of banana fruit by
salycylic acid. Plant science 158: 87-96.
Ssemwanga J. K., and Thompson, A. K., 1996. Factors likely to influence
acceptability and preference for new Matooke banana cultivars in Uganda, A
qualitative and quantitative investigation. PhD, Cranfield university.
Ssemwanga J. K., and Thompson A. K., 1994. Investigation of postharvest and eating
qualities likely to influence acceptability of Matooke banana cultivars to be
introduced in Uganda. Aspects of applied biology 39: 207-213.
Cranfield University at Silsoe September 2001
Laure Caussiol MSc by Research 147
Stover R. H. and Simmonds, N. W., 1987. Bananas. Longman, Tropical agricultural
series, third edition.
Steel, R. G. D., Torrie, J. H., 1960. Principles and procedures of statistics with special
references to the biological sciences. McGraw-Hill book company, inc.
Stevens and Rudich, 1978. IN: Beverly, R. B., Latimer, J. G., and Smittle, D. A.
1992. Postharvest handling: a systems approach IN: Preharvest Physiological and
cultural effects on postharvest quality, pp. 73-98.
Stevens, 1985. Cited by Shewfelt 1992. IN: Shewfelt, R. L., and Prussia, S. E. 1992.
Postharvest Handling, a systems approach. Academic press, USA.
The banana group, 2000. The banana, SH Pratt’s & Co.
Thomas P., Paul P., Nagaraja N., and Dalal V. B., 1983. Physico-chemical and
respiratory changes in Dwarf cavendish variety of bananas during growth and
maturation. Journal of Food Science and Technology 20: 51-56.
Thompson, A. K., and Burden O. J., 1995. Harvesting and fruit care. IN: Gowen S.,
1995. Bananas and plantains. Natural Resources Institute and Department of
Agriculture University of Reading, UK, Chapman & Hall.
Thompson, A. K. 1995. Foreword of the Conference Proceedings, Postharvest quality
assessment, Silsoe college, The Association of Applied Biologists and The Institution
of Agricultural Engineers, Postharvest News and information 6 (3), 28-30.
Thompson, A. K. 1996. Fruit ripening conditions, recommended ripening of fruit.
Vendrell, M., 1985. Effect of abscisic acid and ethephon on several parameters of
ripening in banana fruit tissue. Plant science 40: 19-24.
Wainwright, H., and Hughes, P., 1990. Changes in banana pulp colour during
ripening. Fruits 45 (1), pp. 25-28.
Cranfield University at Silsoe September 2001
Laure Caussiol MSc by Research 148
Wijeratnam, R. S. W., Jayatilake, S., Hewage, S. K., Perera, L. R.,
Paranerupasingham, S., and Peiris, C. N., 1992. Determination of maturity indices for
Sri Lankan Embul bananas. Postharvest Technology Unit, CISIR. P.O. Box 787,
Colombo 7, Sri lanka.
Wills, R., Mc Glasson, B., Graham, D., Joyce, D., 1998. Postharvest, an introduction
to the physiology and handling of fruit, vegetables and ornamentals, 4th edition, CABI
international.
Winban, 1993. Banana grower’s manual, A guide to successful banana production in
the Winwards Islands. Voice Publishing Company (1953) Ltd.
Woltering, E. J., and De Vrije Truus, 1995. Ethylene, a tiny molecule with great
potential. BioEssays 17: (4), pp. 287-289.
Wyam and Palmer, 1964. IN: Marriott, J., and Lancaster, P. A., 1983. Bananas and
Plantains. IN: Harvey, T., and Chan, J. R., 1983 Handbook of tropical foods,
U.S.D.A.
Yang, S. F., 1985. Biosynthethis and action of ethylene. Proceedings of the
symposium, Ethylene in postharvest biology and technology of horticultural crops.
HortScience 20(1), pp. 41-45.
Related Documents