Postgres Enterprise Manager Release 7.16 PEM Enterprise Features Guide Mar 16, 2021

Welcome message from author
This document is posted to help you gain knowledge. Please leave a comment to let me know what you think about it! Share it to your friends and learn new things together.
Transcript
Postgres Enterprise ManagerRelease 7.16
PEM Enterprise Features Guide
Mar 16, 2021
Contents
1 What’s New 2
2 The PEM Query Tool 42.1 The SQL Editor Panel . . . . . . . . . . . . . . . . . . . . . . . . . . . . . . . . 102.2 The Data Output Panel . . . . . . . . . . . . . . . . . . . . . . . . . . . . . . . . 14
2.2.1 Data Output Tab . . . . . . . . . . . . . . . . . . . . . . . . . . . . . . . 142.2.2 Explain Tab . . . . . . . . . . . . . . . . . . . . . . . . . . . . . . . . . 162.2.3 Graphical Tab . . . . . . . . . . . . . . . . . . . . . . . . . . . . . . . . 162.2.4 Analysis Tab . . . . . . . . . . . . . . . . . . . . . . . . . . . . . . . . 172.2.5 Statistics Tab . . . . . . . . . . . . . . . . . . . . . . . . . . . . . . . . 182.2.6 Messages Tab . . . . . . . . . . . . . . . . . . . . . . . . . . . . . . . . 192.2.7 Notifications Tab . . . . . . . . . . . . . . . . . . . . . . . . . . . . . . 21
2.3 Query History Panel . . . . . . . . . . . . . . . . . . . . . . . . . . . . . . . . . 222.4 Connection Status . . . . . . . . . . . . . . . . . . . . . . . . . . . . . . . . . . 23
3 The PEM Schema Diff Tool 243.1 The Schema Diff Object Comparison Panel . . . . . . . . . . . . . . . . . . . . . 263.2 Schema Diff DDL Comparison Panel . . . . . . . . . . . . . . . . . . . . . . . . 28
4 Performance Monitoring and Management 314.1 Using Dashboards to View Performance Information . . . . . . . . . . . . . . . . 334.2 Managing Custom Dashboards . . . . . . . . . . . . . . . . . . . . . . . . . . . . 36
4.2.1 Creating a Custom Dashboard . . . . . . . . . . . . . . . . . . . . . . . 374.2.2 Creating an Ops Dashboard . . . . . . . . . . . . . . . . . . . . . . . . . 41
4.3 Using the Manage Charts tab . . . . . . . . . . . . . . . . . . . . . . . . . . . . 424.3.1 Creating a Custom Chart . . . . . . . . . . . . . . . . . . . . . . . . . . 444.3.2 Importing a Capacity Manager Template . . . . . . . . . . . . . . . . . . 49
4.4 Probes . . . . . . . . . . . . . . . . . . . . . . . . . . . . . . . . . . . . . . . . 534.5 Customizing Probes . . . . . . . . . . . . . . . . . . . . . . . . . . . . . . . . . 68
i
4.5.1 Creating a Custom Probe . . . . . . . . . . . . . . . . . . . . . . . . . . 704.5.2 Deleting a Probe . . . . . . . . . . . . . . . . . . . . . . . . . . . . . . 774.5.3 Copying a Probe . . . . . . . . . . . . . . . . . . . . . . . . . . . . . . 78
4.6 Alerting . . . . . . . . . . . . . . . . . . . . . . . . . . . . . . . . . . . . . . . . 794.6.1 Using the Alerts Dashboard . . . . . . . . . . . . . . . . . . . . . . . . . 814.6.2 Using the Manage Alerts Tab . . . . . . . . . . . . . . . . . . . . . . . . 83
Creating a Custom Alert Template . . . . . . . . . . . . . . . . . . . . . . 84Creating a New Alert . . . . . . . . . . . . . . . . . . . . . . . . . . . . . 89Modifying or Deleting an Alert . . . . . . . . . . . . . . . . . . . . . . . 95Copying an Alert . . . . . . . . . . . . . . . . . . . . . . . . . . . . . . . 98Audit Log Alerting . . . . . . . . . . . . . . . . . . . . . . . . . . . . . . 99Creating an Email Group . . . . . . . . . . . . . . . . . . . . . . . . . . . 100Schedule Alert Blackout . . . . . . . . . . . . . . . . . . . . . . . . . . . 103
4.6.3 Using PEM with Nagios . . . . . . . . . . . . . . . . . . . . . . . . . . 108Enabling Nagios Notification for an Alert . . . . . . . . . . . . . . . . . . 109Configuring Nagios-related behavior of the PEM Server . . . . . . . . . . 111Creating the hosts.cfg and services.cfg File . . . . . . . . . . . . . . . . . 113Modifying the Nagios Configuration File . . . . . . . . . . . . . . . . . . 114
5 Capacity Manager 1155.1 Capacity Manager Templates . . . . . . . . . . . . . . . . . . . . . . . . . . . . 121
6 Audit Manager 1236.1 Setting the Advanced Server Instance Service ID . . . . . . . . . . . . . . . . . . 1246.2 Setting the EDB Audit Configuration Probe . . . . . . . . . . . . . . . . . . . . . 1256.3 Configuring Audit Logging with the Audit Manager . . . . . . . . . . . . . . . . 1266.4 Viewing the Log with the Audit Log Dashboard . . . . . . . . . . . . . . . . . . 133
7 Log Manager 1357.1 Reviewing the Server Log Analysis Dashboard . . . . . . . . . . . . . . . . . . . 146
8 Postgres Log Analysis Expert 1488.1 Reviewing the Postgres Log Analysis Expert Report . . . . . . . . . . . . . . . . 154
9 SQL Profiling and Analysis 1559.1 Creating a New SQL Trace . . . . . . . . . . . . . . . . . . . . . . . . . . . . . . 157
9.1.1 Creating a Trace . . . . . . . . . . . . . . . . . . . . . . . . . . . . . . . 1579.1.2 Opening an Existing Trace . . . . . . . . . . . . . . . . . . . . . . . . . 1609.1.3 Filtering a Trace . . . . . . . . . . . . . . . . . . . . . . . . . . . . . . . 1619.1.4 Deleting a Trace . . . . . . . . . . . . . . . . . . . . . . . . . . . . . . . 1639.1.5 Viewing Scheduled Traces . . . . . . . . . . . . . . . . . . . . . . . . . 164
9.2 Using the Index Advisor . . . . . . . . . . . . . . . . . . . . . . . . . . . . . . . 165
10 Tuning Wizard 166
11 Postgres Expert - Best Practice Enforcement 174
ii
11.1 Using the Postgres Expert Wizard . . . . . . . . . . . . . . . . . . . . . . . . . . 17511.2 Reviewing Postgres Expert Recommendations . . . . . . . . . . . . . . . . . . . 178
12 Reports 18012.1 System Configuration Report . . . . . . . . . . . . . . . . . . . . . . . . . . . . 18112.2 Core Usage Report . . . . . . . . . . . . . . . . . . . . . . . . . . . . . . . . . . 185
13 Monitoring Failover Manager 18613.1 Replacing a Primary Node . . . . . . . . . . . . . . . . . . . . . . . . . . . . . . 18813.2 Switchover EFM Cluster . . . . . . . . . . . . . . . . . . . . . . . . . . . . . . . 189
14 Monitoring an xDB Replication Cluster 190
15 Performance Diagnostic 193
16 Reference 20016.1 PEM Server Configuration Parameters - Reference . . . . . . . . . . . . . . . . . 20016.2 Capacity Manager Metrics - Reference . . . . . . . . . . . . . . . . . . . . . . . 21416.3 PEM Probes – Reference . . . . . . . . . . . . . . . . . . . . . . . . . . . . . . . 21816.4 PEM Pre-defined Alert Templates – Reference . . . . . . . . . . . . . . . . . . . 225
16.4.1 Templates applicable on Agent . . . . . . . . . . . . . . . . . . . . . . . 22516.4.2 Templates applicable on Server . . . . . . . . . . . . . . . . . . . . . . . 22616.4.3 Templates applicable on Database . . . . . . . . . . . . . . . . . . . . . 23016.4.4 Templates applicable on Schema . . . . . . . . . . . . . . . . . . . . . . 23416.4.5 Templates applicable on Table . . . . . . . . . . . . . . . . . . . . . . . 23616.4.6 Global Templates . . . . . . . . . . . . . . . . . . . . . . . . . . . . . . 236
17 Conclusion 237
Index 240
iii
Postgres Enterprise Manager, Release 7.16
This guide will acquaint you with the tools and wizards that are built into the Postgres EnterpriseManager™ (PEM) web interface that make it easier for you to monitor and manage your system.
This guide is not a comprehensive resource; rather, it is meant to serve as an aid to help youevaluate the tool and bring you up to speed with the basics of how to use the product. For moredetailed information about using PEM’s functionality, please see the online help made available bythe PEM client.
This document uses Postgres to mean either the PostgreSQL or EDB Postgres Advanced Serverdatabase.
Contents 1
CHAPTER 1
What’s New
The following features have been added to Postgres Enterprise Manager 7.16:
• Enhanced BART Integration: You can now automate the cleanup of obselete backups,allow incremental backups from a parent backup in a tar.gz format, and manage theBART scanner via the PEM Console.
• Enhanced EFM Integration: You can now perform cluster switchover and mon-itor cluster property values such as missingnodes, minimumstandbys andmembershipcoordinators for a Failover Manager cluster via the PEM Console.
• Auto discovery of server clusters on Debian Platforms: You can now quickly locate thedatabase servers that reside on the monitored system.
• Extended the REST API on alerts states for agents, servers and databases: PEM hasnow exposed endpoints to:
– Current threshold alert violations
– State change history on available alerts for agent, server, and database.
– Current state of all agents and monitored servers
• Other features and changes include:
– You can use the same agent-id on agent registration using--force-registration, and regenerate the certificates.
– Documentation now includes information about defining and monitoring postgres in-stances on AWS EC2 and RDS.
– The Query Tool now provides SQL Formatter support.
2
Postgres Enterprise Manager, Release 7.16
– The Query Tool toolbar now has a button to provide easy access to a new query toolwindow.
– The modified Schema diff tool will now compare two databases instead of twoschemas.
– Added High Contrast (Beta) theme support.
– A warning now alerts the user when connecting to a server version that is no longersupported.
– The management user-interface for EDB Ark is no longer distributed with PEM.
3
CHAPTER 2
The PEM Query Tool
PEM contains a feature-rich Interactive Development Environment (IDE) that allows you to issuead-hoc SQL queries against Postgres servers.
You can access the Query Tool via the Query Toolmenu option on the Toolsmenu, or throughthe context menu of select nodes of the Browser tree control. The Query Tool allows you to:
• Issue ad-hoc SQL queries.
• Execute arbitrary SQL commands.
• Edit the result set of a SELECT query if it is updatable.
• Displays current connection and transaction status as configured by the user.
• Save the data displayed in the output panel to a CSV file.
• Review the execution plan of a SQL statement in either a text, a graphical format or a tableformat (similar to https://explain.depesz.com).
• View analytical information about a SQL statement.
4
Postgres Enterprise Manager, Release 7.16
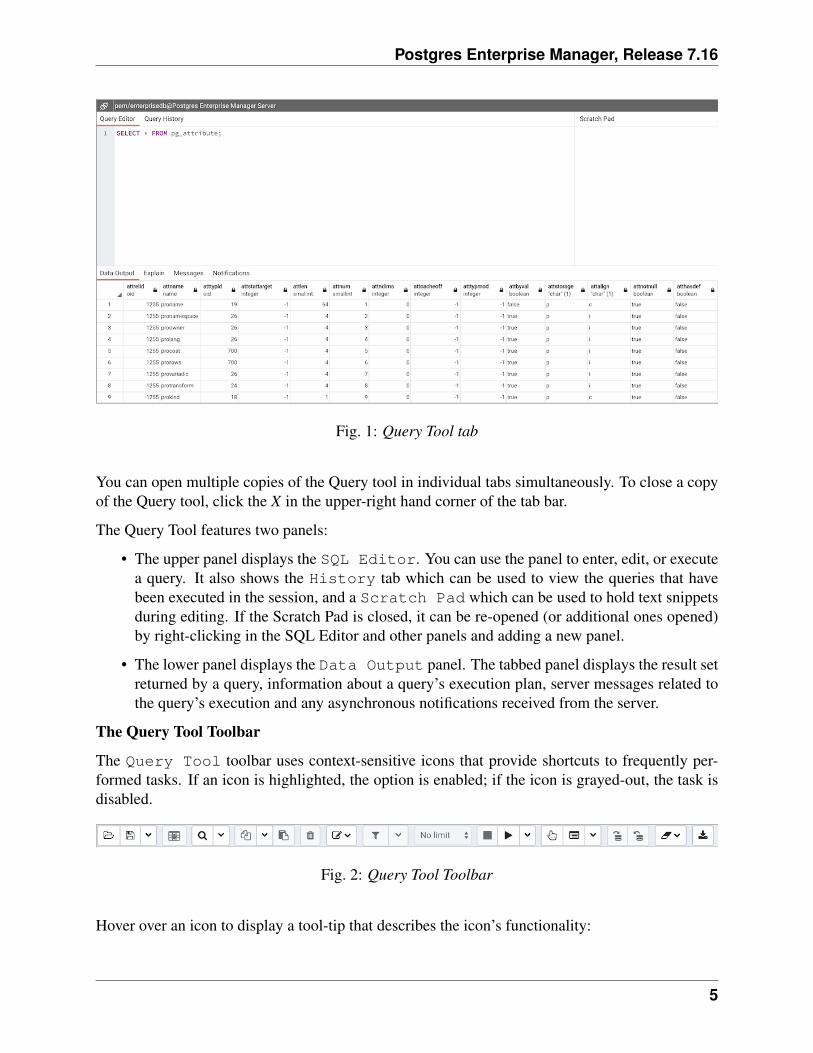
Fig. 1: Query Tool tab
You can open multiple copies of the Query tool in individual tabs simultaneously. To close a copyof the Query tool, click the X in the upper-right hand corner of the tab bar.
The Query Tool features two panels:
• The upper panel displays the SQL Editor. You can use the panel to enter, edit, or executea query. It also shows the History tab which can be used to view the queries that havebeen executed in the session, and a Scratch Pad which can be used to hold text snippetsduring editing. If the Scratch Pad is closed, it can be re-opened (or additional ones opened)by right-clicking in the SQL Editor and other panels and adding a new panel.
• The lower panel displays the Data Output panel. The tabbed panel displays the result setreturned by a query, information about a query’s execution plan, server messages related tothe query’s execution and any asynchronous notifications received from the server.
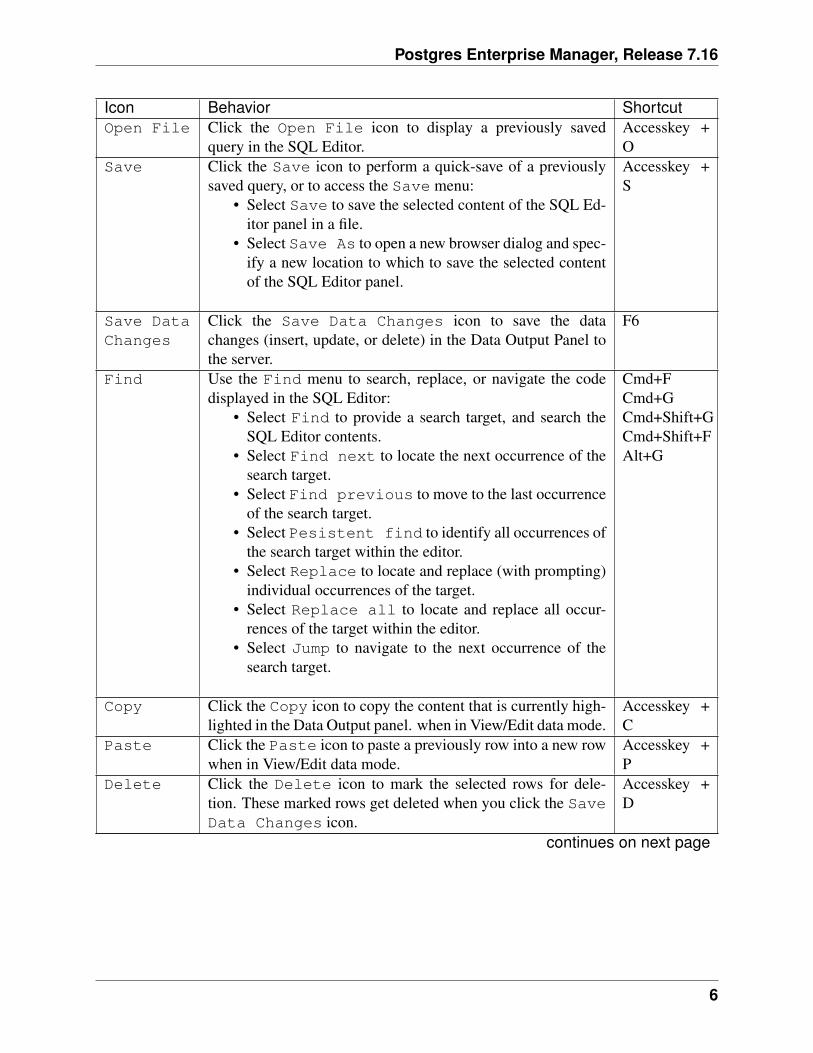
The Query Tool Toolbar
The Query Tool toolbar uses context-sensitive icons that provide shortcuts to frequently per-formed tasks. If an icon is highlighted, the option is enabled; if the icon is grayed-out, the task isdisabled.
Fig. 2: Query Tool Toolbar
Hover over an icon to display a tool-tip that describes the icon’s functionality:
5
Postgres Enterprise Manager, Release 7.16
Icon Behavior ShortcutOpen File Click the Open File icon to display a previously saved
query in the SQL Editor.Accesskey +O
Save Click the Save icon to perform a quick-save of a previouslysaved query, or to access the Save menu:
• Select Save to save the selected content of the SQL Ed-itor panel in a file.
• Select Save As to open a new browser dialog and spec-ify a new location to which to save the selected contentof the SQL Editor panel.
Accesskey +S
Save DataChanges
Click the Save Data Changes icon to save the datachanges (insert, update, or delete) in the Data Output Panel tothe server.
F6
Find Use the Find menu to search, replace, or navigate the codedisplayed in the SQL Editor:
• Select Find to provide a search target, and search theSQL Editor contents.
• Select Find next to locate the next occurrence of thesearch target.
• Select Find previous to move to the last occurrenceof the search target.
• Select Pesistent find to identify all occurrences ofthe search target within the editor.
• Select Replace to locate and replace (with prompting)individual occurrences of the target.
• Select Replace all to locate and replace all occur-rences of the target within the editor.
• Select Jump to navigate to the next occurrence of thesearch target.
Cmd+FCmd+GCmd+Shift+GCmd+Shift+FAlt+G
Copy Click the Copy icon to copy the content that is currently high-lighted in the Data Output panel. when in View/Edit data mode.
Accesskey +C
Paste Click the Paste icon to paste a previously row into a new rowwhen in View/Edit data mode.
Accesskey +P
Delete Click the Delete icon to mark the selected rows for dele-tion. These marked rows get deleted when you click the SaveData Changes icon.
Accesskey +D
continues on next page
6
Postgres Enterprise Manager, Release 7.16
Table 1 – continued from previous pageIcon Behavior ShortcutEdit Use options on the Edit menu to access text editing tools; the
options operate on the text displayed in the SQL Editor panelwhen in Query Tool mode:
• Select Indent Selection to indent the currently se-lected text.
• Select Unindent Selection to remove indentationfrom the currently selected text.
• Select Inline Comment Selection to encloseany lines that contain the selection in SQL style com-ment notation.
• Select Inline Uncomment Selection to removeSQL style comment notation from the selected line.
• Select Block Comment to enclose all lines that con-tain the selection in C style comment notation. This op-tion acts as a toggle.
TabShift+TabCmd+/Cmd+.Shift+Cmd+/
Filter Click the Filter icon to set filtering and sorting criteria forthe data when in View/Edit data mode. Click the down arrowto access other filtering and sorting options:
• Click Sort/Filter to open the sorting and filteringdialogue.
• Click Filter by Selection to show only the rowscontaining the values in the selected cells.
• Click Exclude by Selection to show only therows that do not contain the values in the selected cells.
• Click Remove Sort/Filter to remove any previ-ously selected sort or filtering options.
Accesskey +F
LimitSelector
Select a value in the Limit Selector to limit the size ofthe dataset to a number of rows.
Accesskey +R
Stop Click the Stop icon to cancel the execution of the currentlyrunning query.
Accesskey +Q
continues on next page
7
Postgres Enterprise Manager, Release 7.16
Table 1 – continued from previous pageIcon Behavior ShortcutExecute/Refresh
Click the Execute/Refresh icon to either execute or re-fresh the query highlighted in the SQL editor panel. Click thedown arrow to access other execution options:
• Add a check next to Auto-Rollback to instruct theserver to automatically roll back a transaction if an erroroccurs during the transaction.
• Add a check next to Auto-Commit to instruct theserver to automatically commit each transaction. Anychanges made by the transaction will be visible to oth-ers, and durable in the event of a crash.
F5
Explain Click the Explain icon to view an explanation plan for thecurrent query. The result of EXPLAIN is displayed graphicallyon the Explain tab of the output panel, and in text form onthe Data Output tab.
F7
Explainanalyze
Click the Explain analyze icon to invoke an EXPLAINANALYZE command on the current query.Navigate through the Explain Options menu to select op-tions for the EXPLAIN command:
• Select Verbose to display additional information re-garding the query plan.
• Select Costs to include information on the estimatedstartup and total cost of each plan node, as well as the es-timated number of rows and the estimated width of eachrow.
• Select Buffers to include information on buffer usage.• Select Timing to include information about the startup
time and the amount of time spent in each node of thequery.
• Select Summary to include the summary informationabout the query plan.
Shift+F7
Commit Click the Commit icon to commit the transaction. Shift+CTRL+MRollback Click the Rollback icon to rollback the transaction. Shift+CTRL+RClear Use options on the Clear drop-down menu to erase display
contents:• Select Clear Query Window to erase the content of
the SQL Editor panel.• Select Clear History to erase the content of theHistory tab.
Accesskey +L
continues on next page
8
Postgres Enterprise Manager, Release 7.16
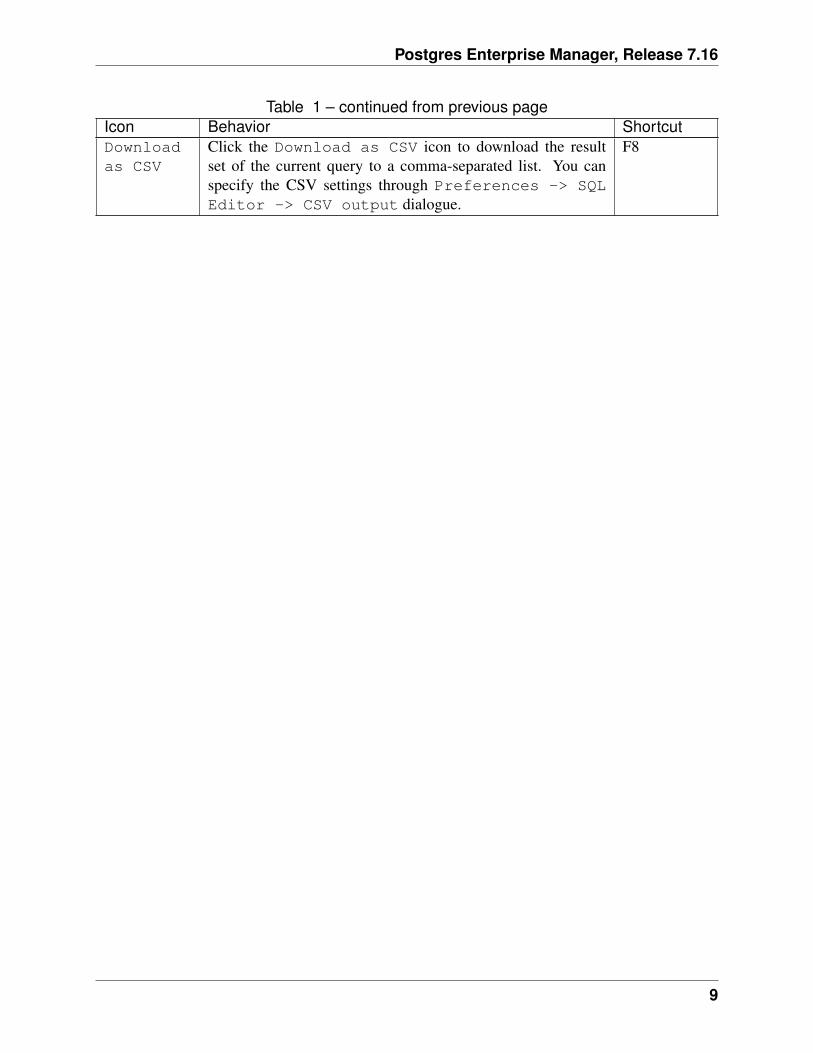
Table 1 – continued from previous pageIcon Behavior ShortcutDownloadas CSV
Click the Download as CSV icon to download the resultset of the current query to a comma-separated list. You canspecify the CSV settings through Preferences -> SQLEditor -> CSV output dialogue.
F8
9
Postgres Enterprise Manager, Release 7.16
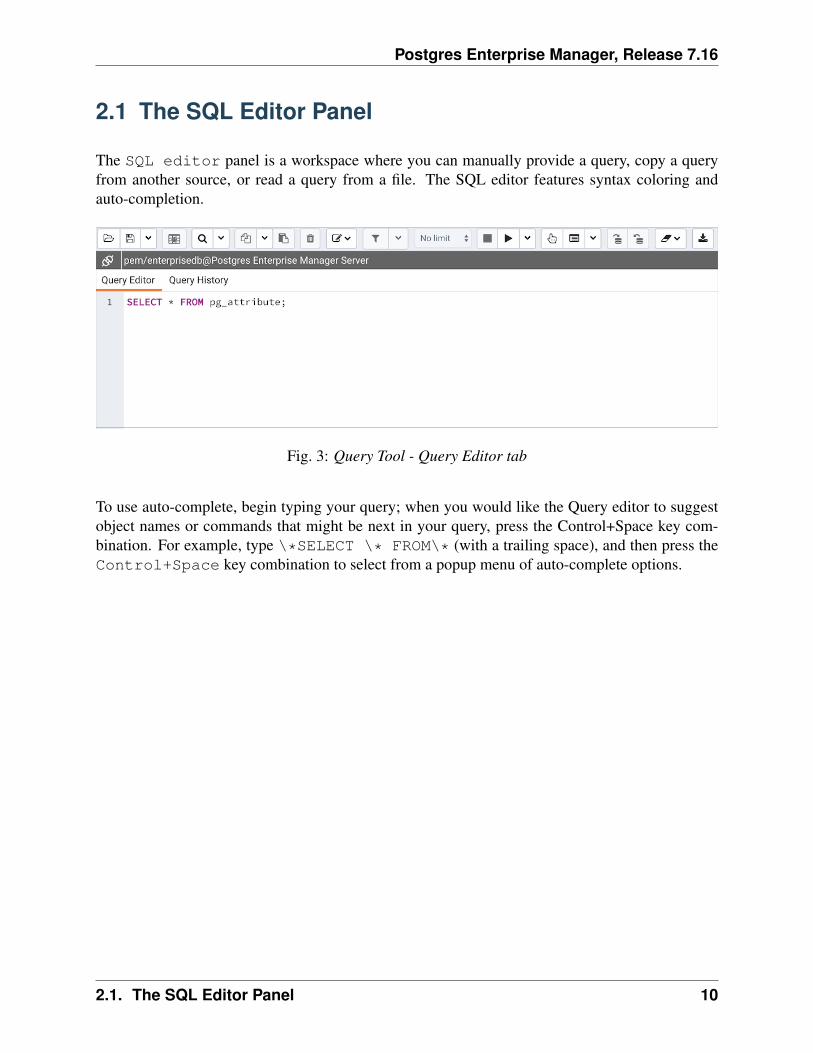
2.1 The SQL Editor Panel
The SQL editor panel is a workspace where you can manually provide a query, copy a queryfrom another source, or read a query from a file. The SQL editor features syntax coloring andauto-completion.
Fig. 3: Query Tool - Query Editor tab
To use auto-complete, begin typing your query; when you would like the Query editor to suggestobject names or commands that might be next in your query, press the Control+Space key com-bination. For example, type \*SELECT \* FROM\* (with a trailing space), and then press theControl+Space key combination to select from a popup menu of auto-complete options.
2.1. The SQL Editor Panel 10
Postgres Enterprise Manager, Release 7.16
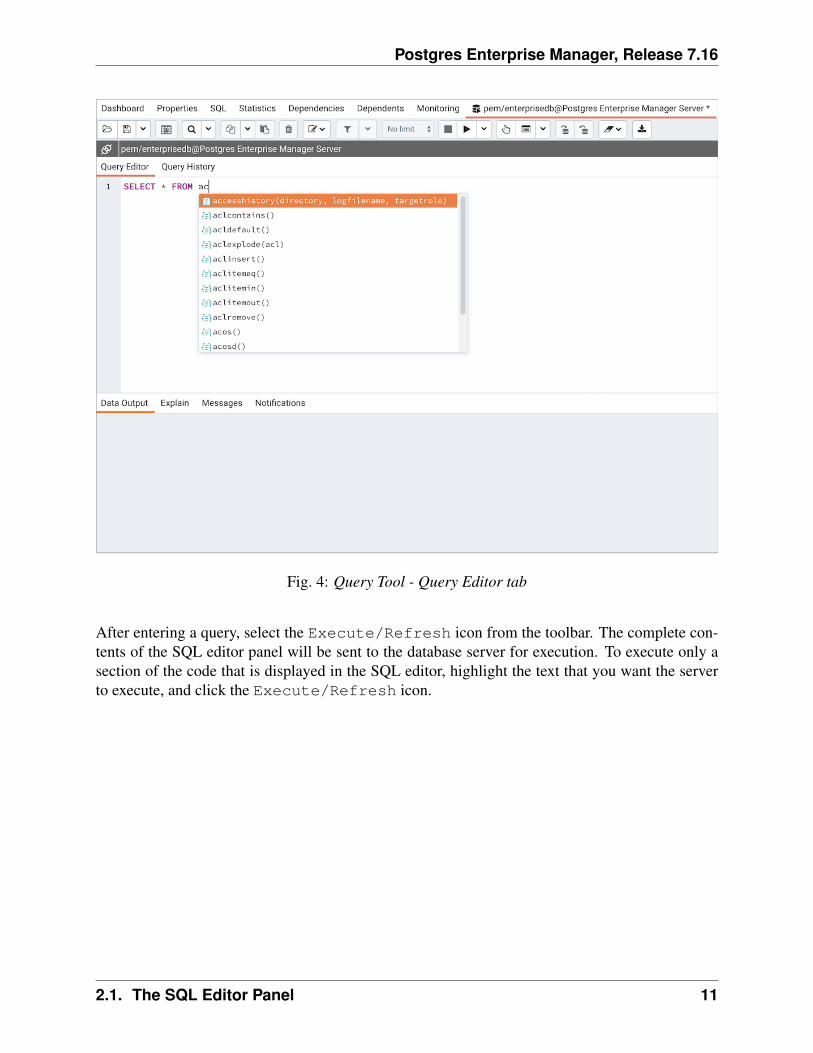
Fig. 4: Query Tool - Query Editor tab
After entering a query, select the Execute/Refresh icon from the toolbar. The complete con-tents of the SQL editor panel will be sent to the database server for execution. To execute only asection of the code that is displayed in the SQL editor, highlight the text that you want the serverto execute, and click the Execute/Refresh icon.
2.1. The SQL Editor Panel 11
Postgres Enterprise Manager, Release 7.16
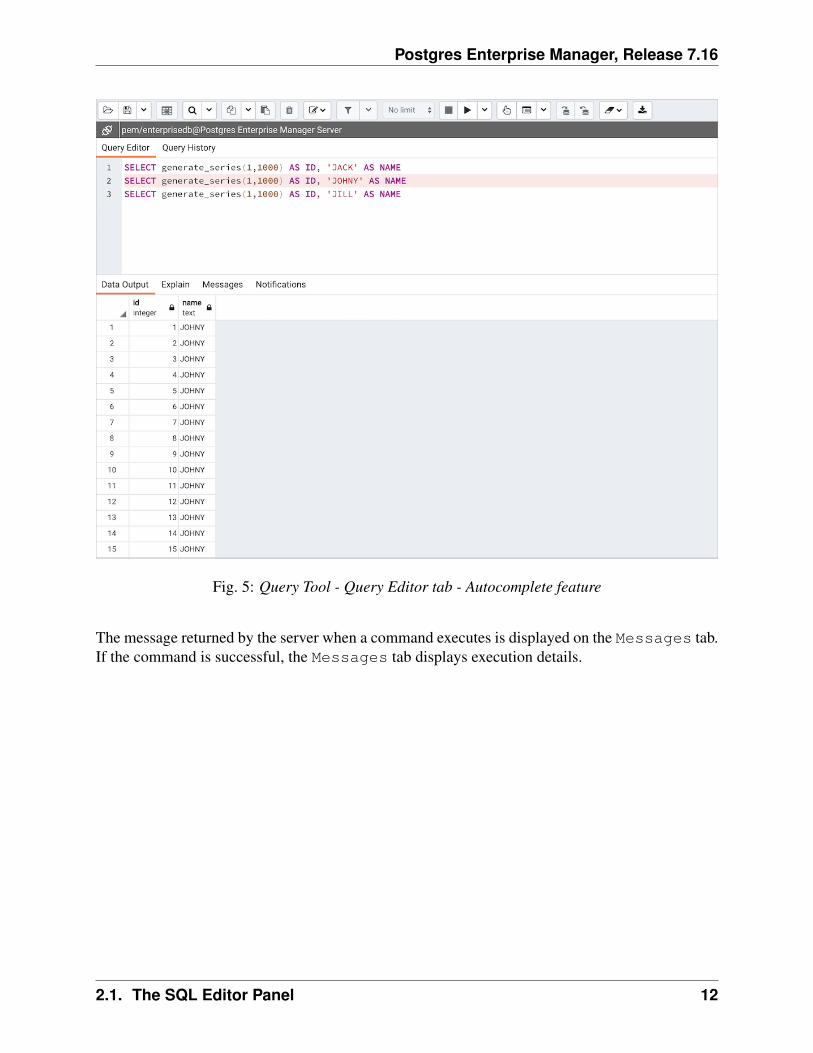
Fig. 5: Query Tool - Query Editor tab - Autocomplete feature
The message returned by the server when a command executes is displayed on the Messages tab.If the command is successful, the Messages tab displays execution details.
2.1. The SQL Editor Panel 12
Postgres Enterprise Manager, Release 7.16
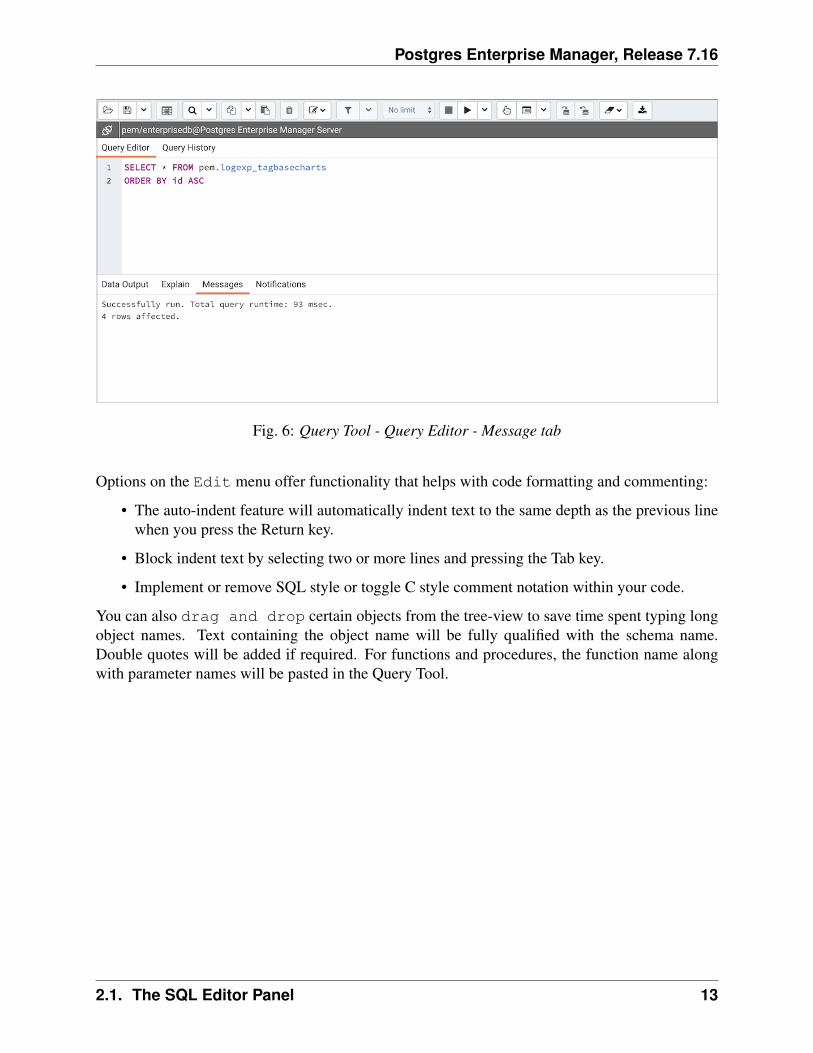
Fig. 6: Query Tool - Query Editor - Message tab
Options on the Edit menu offer functionality that helps with code formatting and commenting:
• The auto-indent feature will automatically indent text to the same depth as the previous linewhen you press the Return key.
• Block indent text by selecting two or more lines and pressing the Tab key.
• Implement or remove SQL style or toggle C style comment notation within your code.
You can also drag and drop certain objects from the tree-view to save time spent typing longobject names. Text containing the object name will be fully qualified with the schema name.Double quotes will be added if required. For functions and procedures, the function name alongwith parameter names will be pasted in the Query Tool.
2.1. The SQL Editor Panel 13
Postgres Enterprise Manager, Release 7.16
2.2 The Data Output Panel
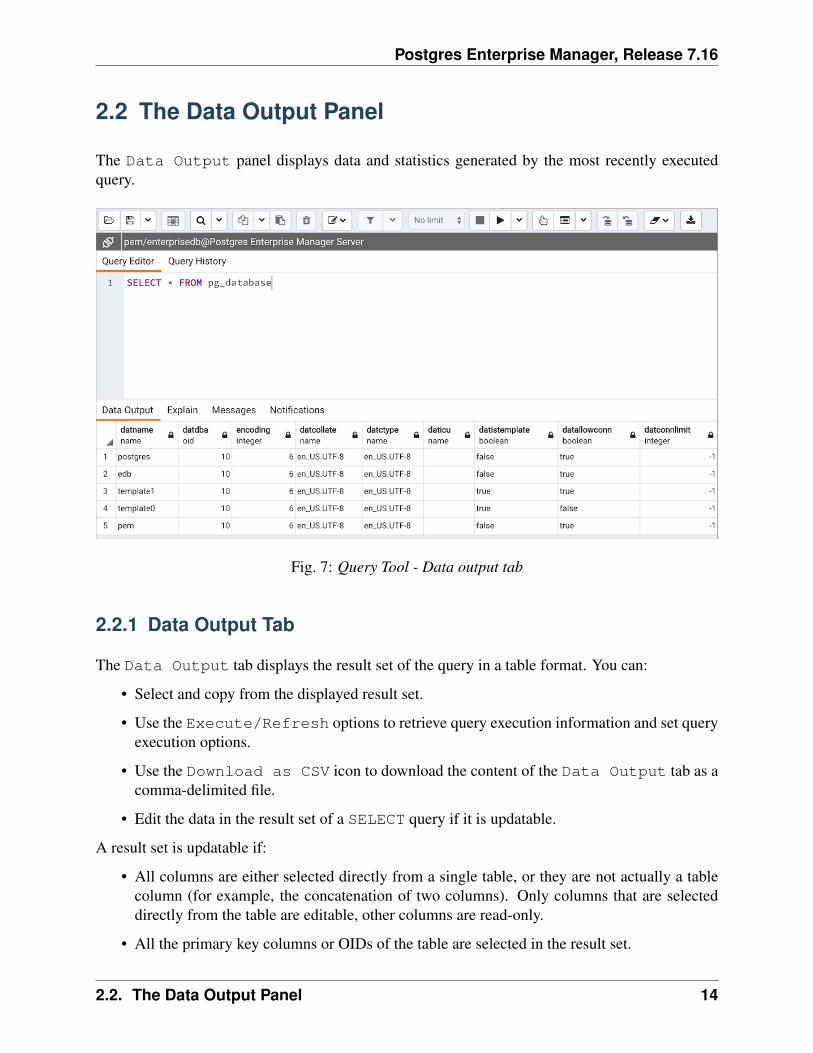
The Data Output panel displays data and statistics generated by the most recently executedquery.
Fig. 7: Query Tool - Data output tab
2.2.1 Data Output Tab
The Data Output tab displays the result set of the query in a table format. You can:
• Select and copy from the displayed result set.
• Use the Execute/Refresh options to retrieve query execution information and set queryexecution options.
• Use the Download as CSV icon to download the content of the Data Output tab as acomma-delimited file.
• Edit the data in the result set of a SELECT query if it is updatable.
A result set is updatable if:
• All columns are either selected directly from a single table, or they are not actually a tablecolumn (for example, the concatenation of two columns). Only columns that are selecteddirectly from the table are editable, other columns are read-only.
• All the primary key columns or OIDs of the table are selected in the result set.
2.2. The Data Output Panel 14
Postgres Enterprise Manager, Release 7.16
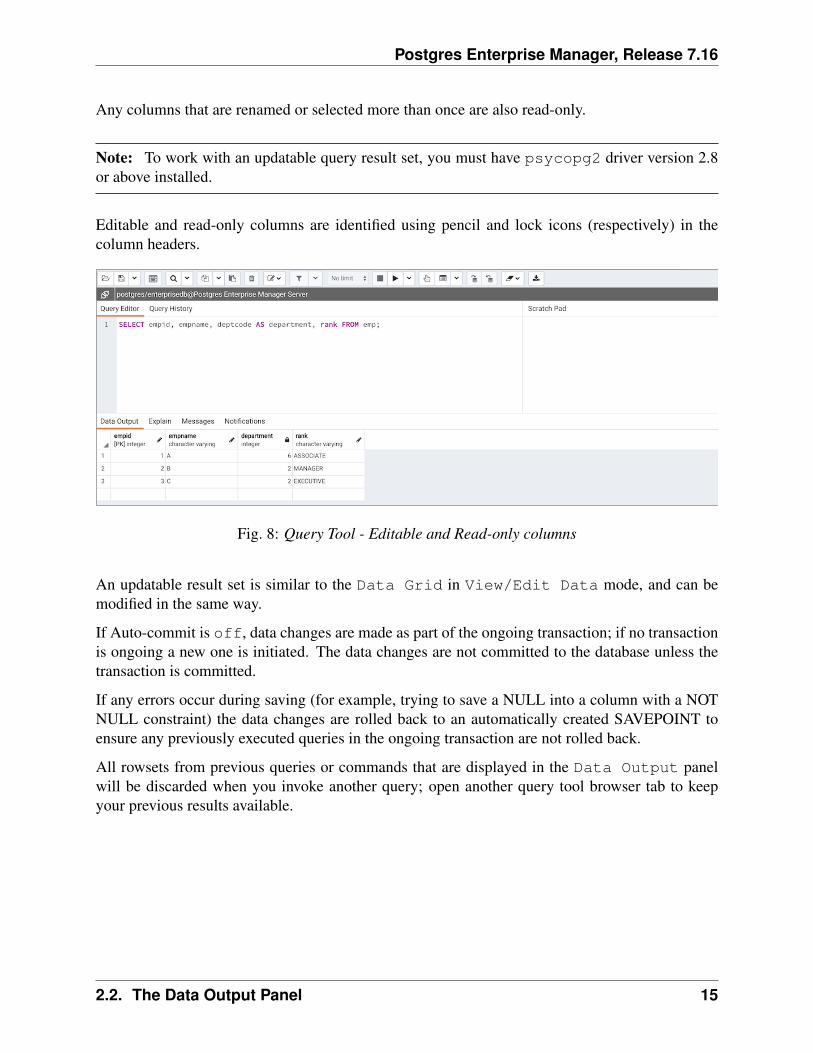
Any columns that are renamed or selected more than once are also read-only.
Note: To work with an updatable query result set, you must have psycopg2 driver version 2.8or above installed.
Editable and read-only columns are identified using pencil and lock icons (respectively) in thecolumn headers.
Fig. 8: Query Tool - Editable and Read-only columns
An updatable result set is similar to the Data Grid in View/Edit Data mode, and can bemodified in the same way.
If Auto-commit is off, data changes are made as part of the ongoing transaction; if no transactionis ongoing a new one is initiated. The data changes are not committed to the database unless thetransaction is committed.
If any errors occur during saving (for example, trying to save a NULL into a column with a NOTNULL constraint) the data changes are rolled back to an automatically created SAVEPOINT toensure any previously executed queries in the ongoing transaction are not rolled back.
All rowsets from previous queries or commands that are displayed in the Data Output panelwill be discarded when you invoke another query; open another query tool browser tab to keepyour previous results available.
2.2. The Data Output Panel 15
Postgres Enterprise Manager, Release 7.16
2.2.2 Explain Tab
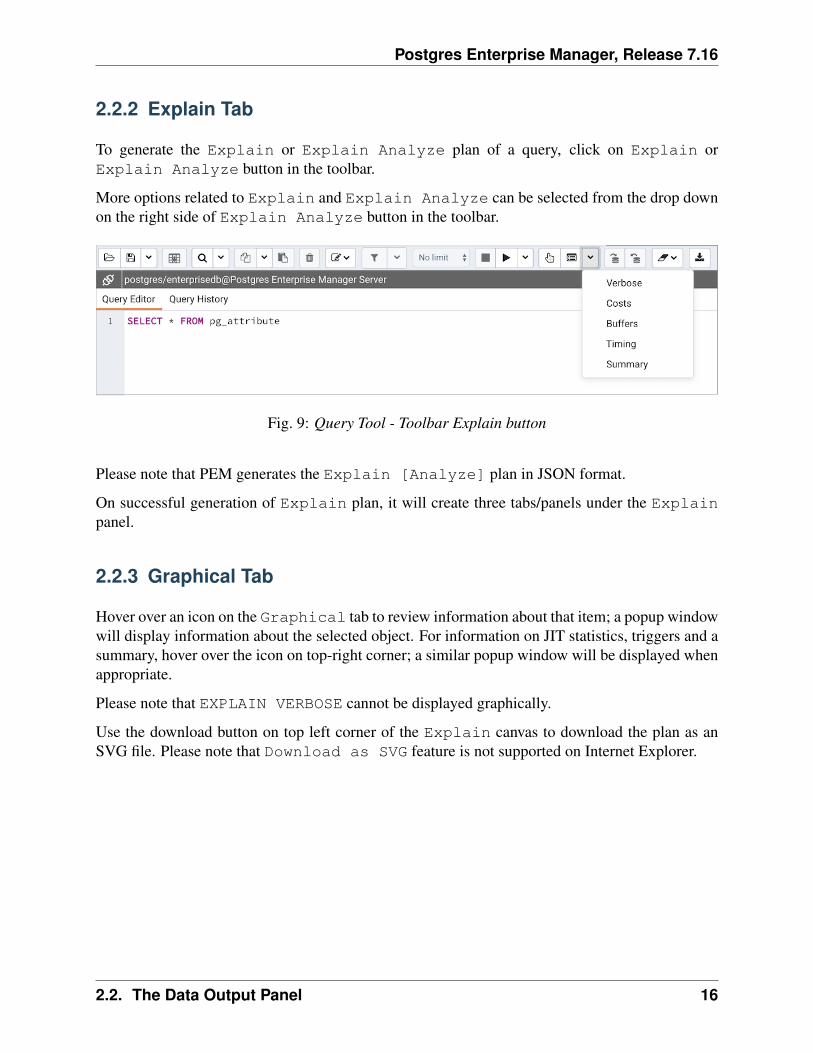
To generate the Explain or Explain Analyze plan of a query, click on Explain orExplain Analyze button in the toolbar.
More options related to Explain and Explain Analyze can be selected from the drop downon the right side of Explain Analyze button in the toolbar.
Fig. 9: Query Tool - Toolbar Explain button
Please note that PEM generates the Explain [Analyze] plan in JSON format.
On successful generation of Explain plan, it will create three tabs/panels under the Explainpanel.
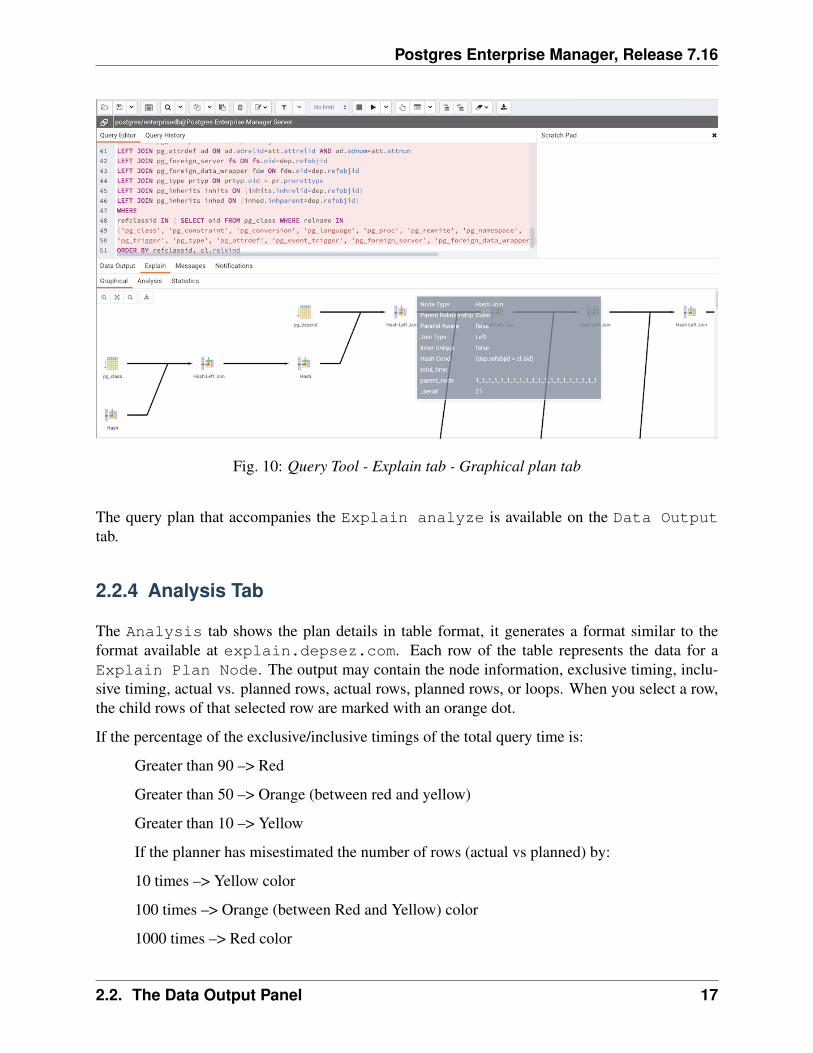
2.2.3 Graphical Tab
Hover over an icon on the Graphical tab to review information about that item; a popup windowwill display information about the selected object. For information on JIT statistics, triggers and asummary, hover over the icon on top-right corner; a similar popup window will be displayed whenappropriate.
Please note that EXPLAIN VERBOSE cannot be displayed graphically.
Use the download button on top left corner of the Explain canvas to download the plan as anSVG file. Please note that Download as SVG feature is not supported on Internet Explorer.
2.2. The Data Output Panel 16
Postgres Enterprise Manager, Release 7.16
Fig. 10: Query Tool - Explain tab - Graphical plan tab
The query plan that accompanies the Explain analyze is available on the Data Outputtab.
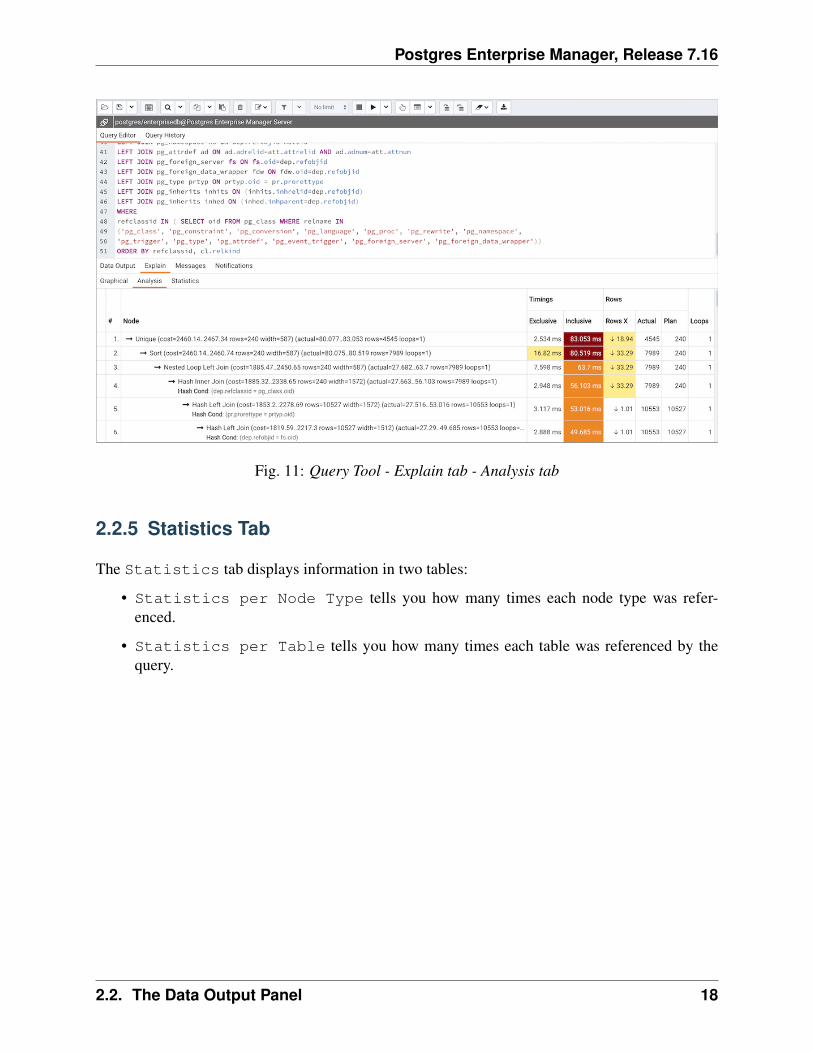
2.2.4 Analysis Tab
The Analysis tab shows the plan details in table format, it generates a format similar to theformat available at explain.depsez.com. Each row of the table represents the data for aExplain Plan Node. The output may contain the node information, exclusive timing, inclu-sive timing, actual vs. planned rows, actual rows, planned rows, or loops. When you select a row,the child rows of that selected row are marked with an orange dot.
If the percentage of the exclusive/inclusive timings of the total query time is:
Greater than 90 –> Red
Greater than 50 –> Orange (between red and yellow)
Greater than 10 –> Yellow
If the planner has misestimated the number of rows (actual vs planned) by:
10 times –> Yellow color
100 times –> Orange (between Red and Yellow) color
1000 times –> Red color
2.2. The Data Output Panel 17
Postgres Enterprise Manager, Release 7.16
Fig. 11: Query Tool - Explain tab - Analysis tab
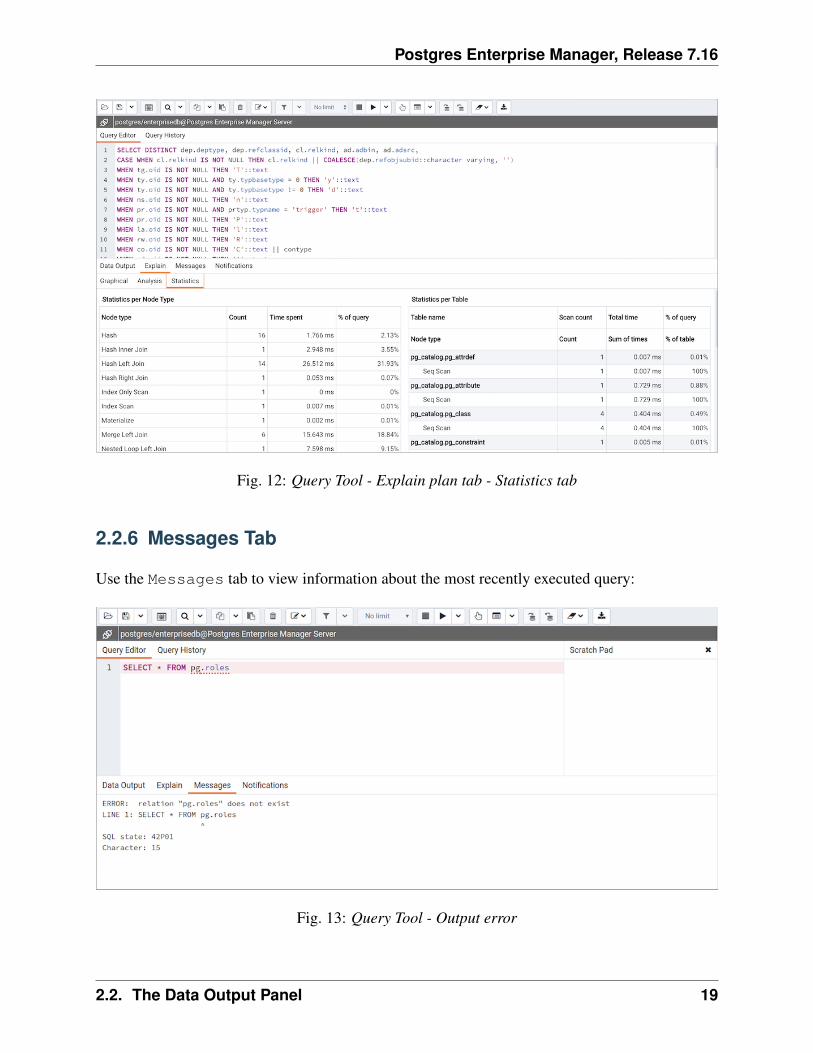
2.2.5 Statistics Tab
The Statistics tab displays information in two tables:
• Statistics per Node Type tells you how many times each node type was refer-enced.
• Statistics per Table tells you how many times each table was referenced by thequery.
2.2. The Data Output Panel 18
Postgres Enterprise Manager, Release 7.16
Fig. 12: Query Tool - Explain plan tab - Statistics tab
2.2.6 Messages Tab
Use the Messages tab to view information about the most recently executed query:
Fig. 13: Query Tool - Output error
2.2. The Data Output Panel 19
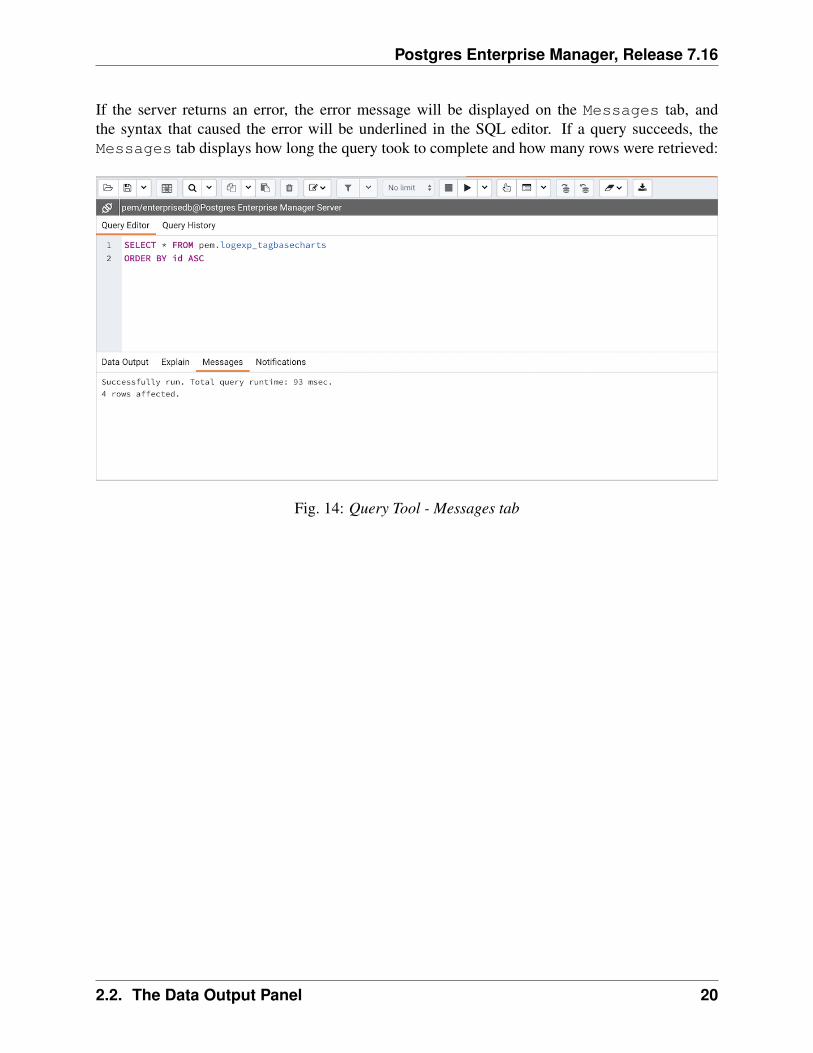
Postgres Enterprise Manager, Release 7.16
If the server returns an error, the error message will be displayed on the Messages tab, andthe syntax that caused the error will be underlined in the SQL editor. If a query succeeds, theMessages tab displays how long the query took to complete and how many rows were retrieved:
Fig. 14: Query Tool - Messages tab
2.2. The Data Output Panel 20
Postgres Enterprise Manager, Release 7.16
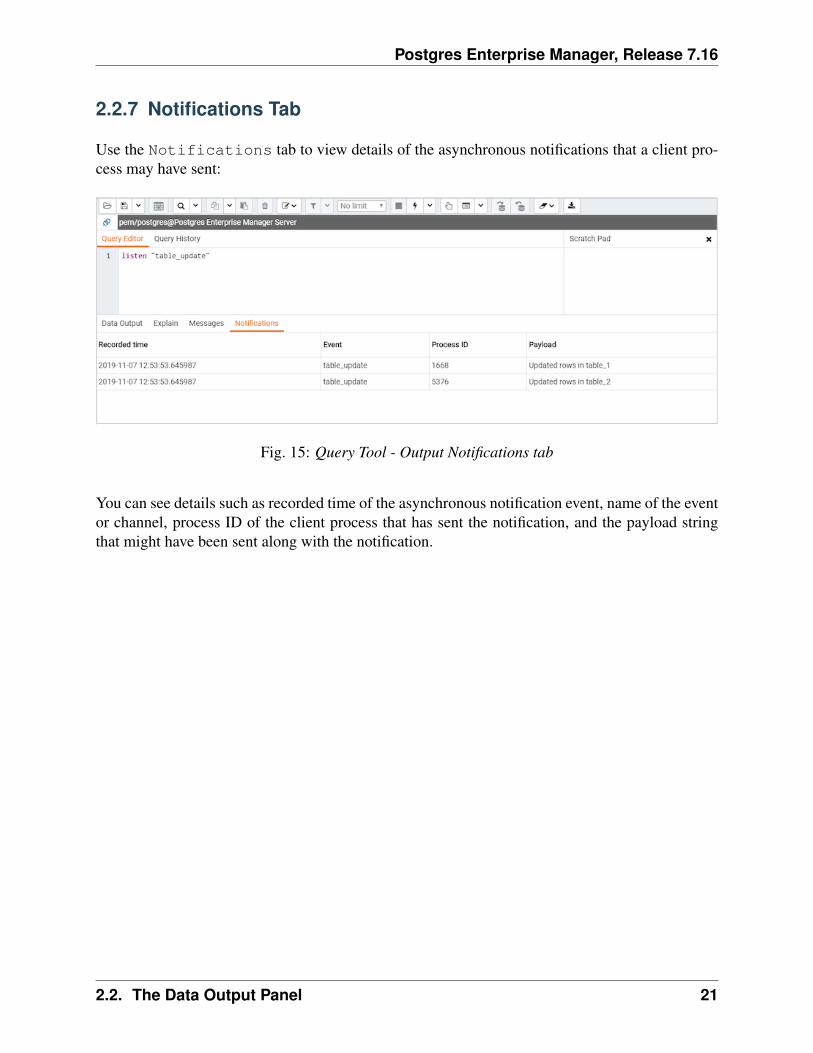
2.2.7 Notifications Tab
Use the Notifications tab to view details of the asynchronous notifications that a client pro-cess may have sent:
Fig. 15: Query Tool - Output Notifications tab
You can see details such as recorded time of the asynchronous notification event, name of the eventor channel, process ID of the client process that has sent the notification, and the payload stringthat might have been sent along with the notification.
2.2. The Data Output Panel 21
Postgres Enterprise Manager, Release 7.16
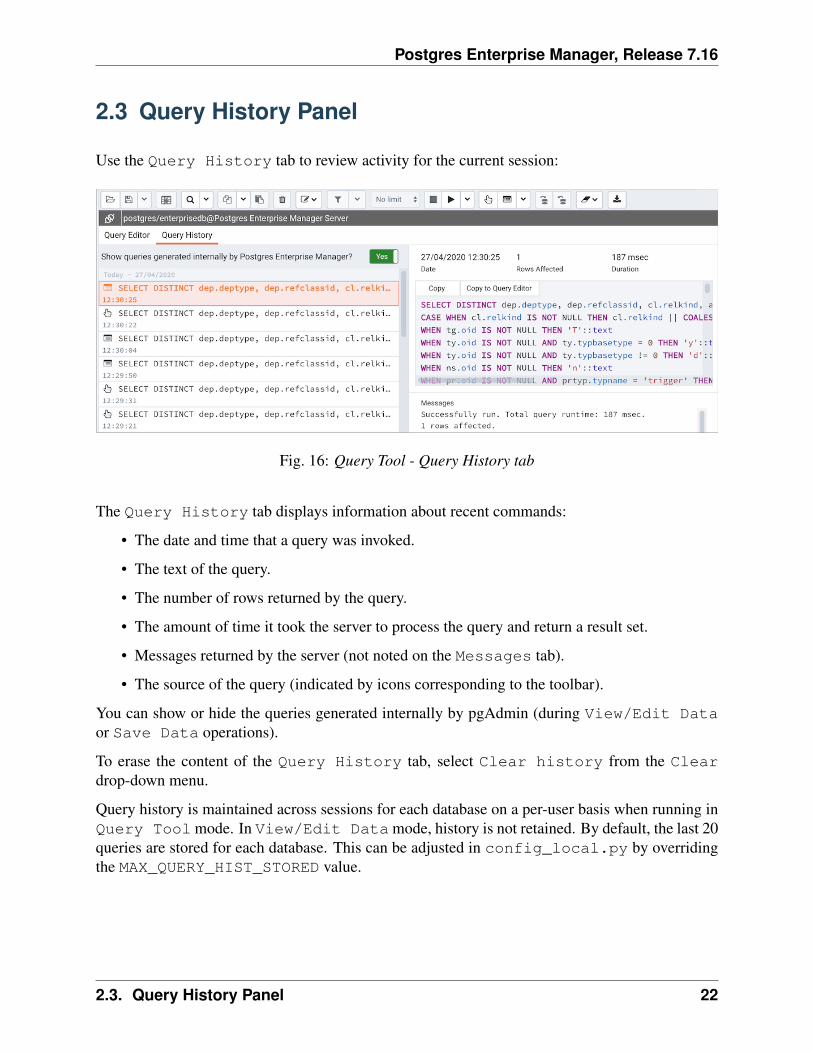
2.3 Query History Panel
Use the Query History tab to review activity for the current session:
Fig. 16: Query Tool - Query History tab
The Query History tab displays information about recent commands:
• The date and time that a query was invoked.
• The text of the query.
• The number of rows returned by the query.
• The amount of time it took the server to process the query and return a result set.
• Messages returned by the server (not noted on the Messages tab).
• The source of the query (indicated by icons corresponding to the toolbar).
You can show or hide the queries generated internally by pgAdmin (during View/Edit Dataor Save Data operations).
To erase the content of the Query History tab, select Clear history from the Cleardrop-down menu.
Query history is maintained across sessions for each database on a per-user basis when running inQuery Tool mode. In View/Edit Data mode, history is not retained. By default, the last 20queries are stored for each database. This can be adjusted in config_local.py by overridingthe MAX_QUERY_HIST_STORED value.
2.3. Query History Panel 22
Postgres Enterprise Manager, Release 7.16
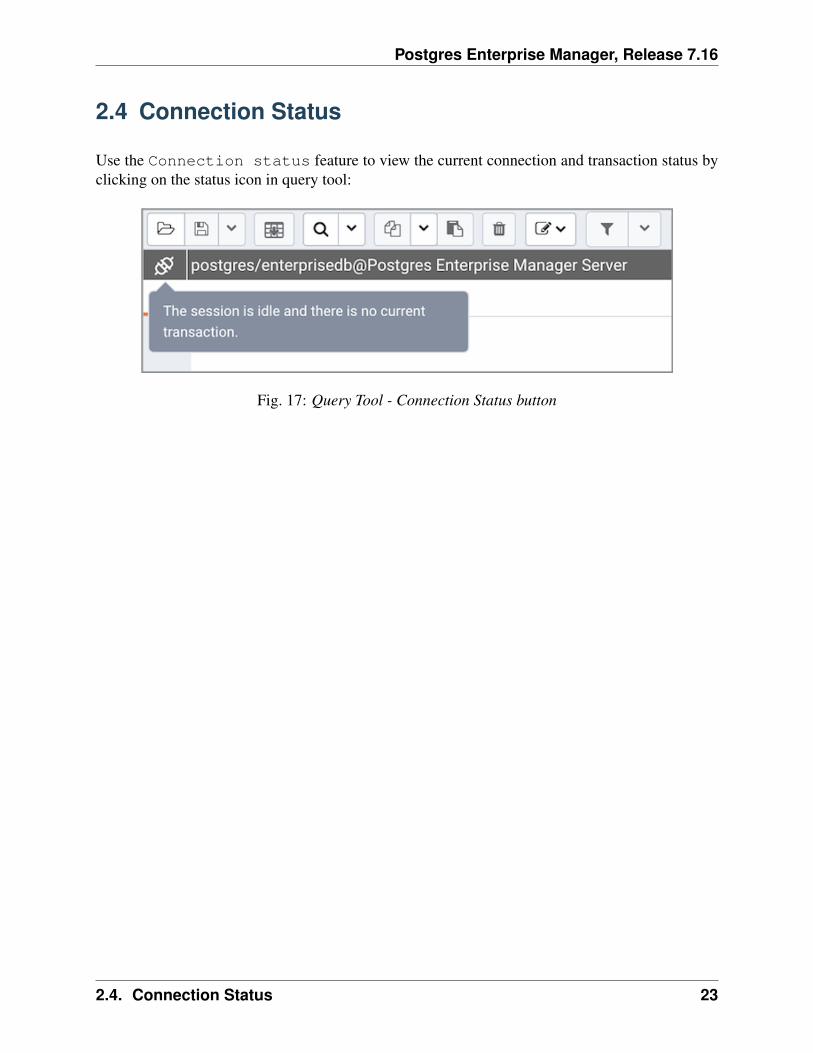
2.4 Connection Status
Use the Connection status feature to view the current connection and transaction status byclicking on the status icon in query tool:
Fig. 17: Query Tool - Connection Status button
2.4. Connection Status 23
CHAPTER 3
The PEM Schema Diff Tool
Schema Diff is a feature that allows you to compare schema objects between two databaseschemas. Use the Tools menu to access Schema Diff.
The Schema Diff feature allows you to:
• Compare and synchronize the database schemas (from source to target).
• Visualize the differences between database schemas.
• List the differences in SQL statement for target schema objects.
• Generate synchronization scripts.
Note - The source and target databases must be of the same major version.
Click on Schema Diff under the Tools menu to open a selection panel. Choose the sourceand target servers, databases, and schemas that will be compared. After selecting the objects, clickon the Compare button.
You can open multiple copies of Schema Diff in individual tabs simultaneously. To close a tab,click the X in the upper-right hand corner of the tab bar.
24
Postgres Enterprise Manager, Release 7.16
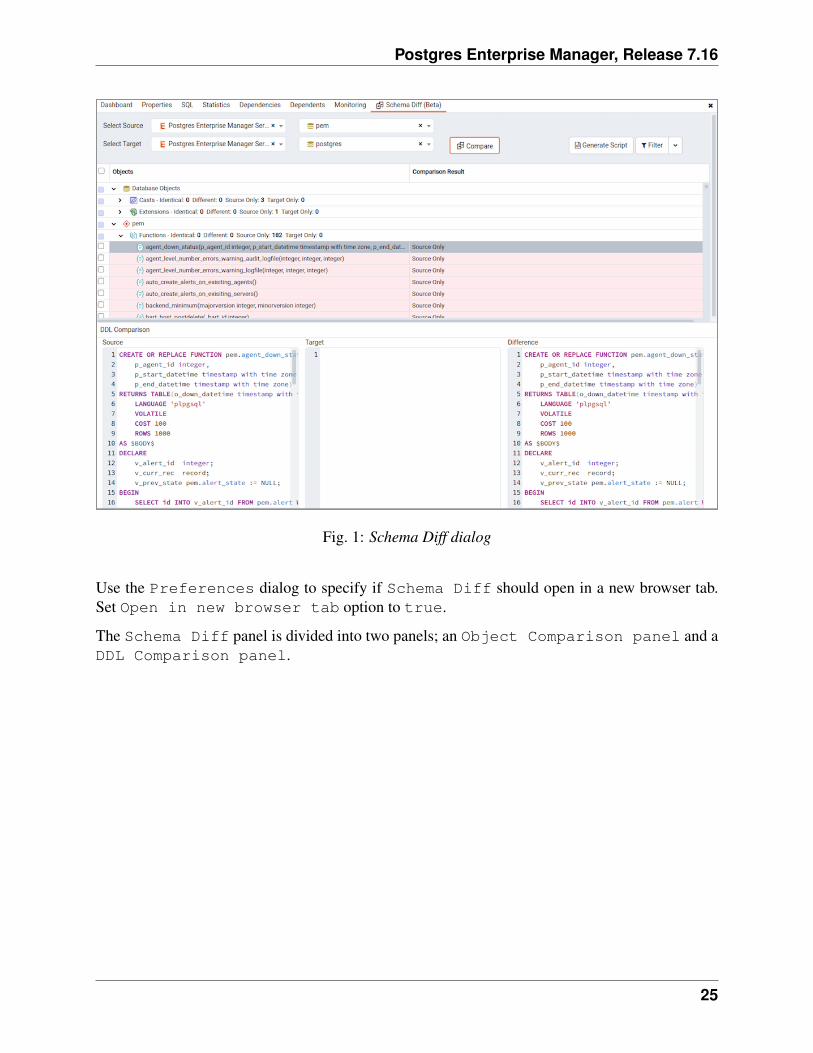
Fig. 1: Schema Diff dialog
Use the Preferences dialog to specify if Schema Diff should open in a new browser tab.Set Open in new browser tab option to true.
The Schema Diff panel is divided into two panels; an Object Comparison panel and aDDL Comparison panel.
25
Postgres Enterprise Manager, Release 7.16
3.1 The Schema Diff Object Comparison Panel
In the object comparison panel, you can select the source and target servers of the same majorversion, databases, and schemas to be compared. You can select any server listed under the browsertree whether it is connected or disconnected. If you select a server that is not connected then it willprompt you for the password before using the server.
Next, select the databases that will be compared. The databases can be the same or different (andwithin the same server or from different servers).
Lastly, select the source and target schemas which will be compared.
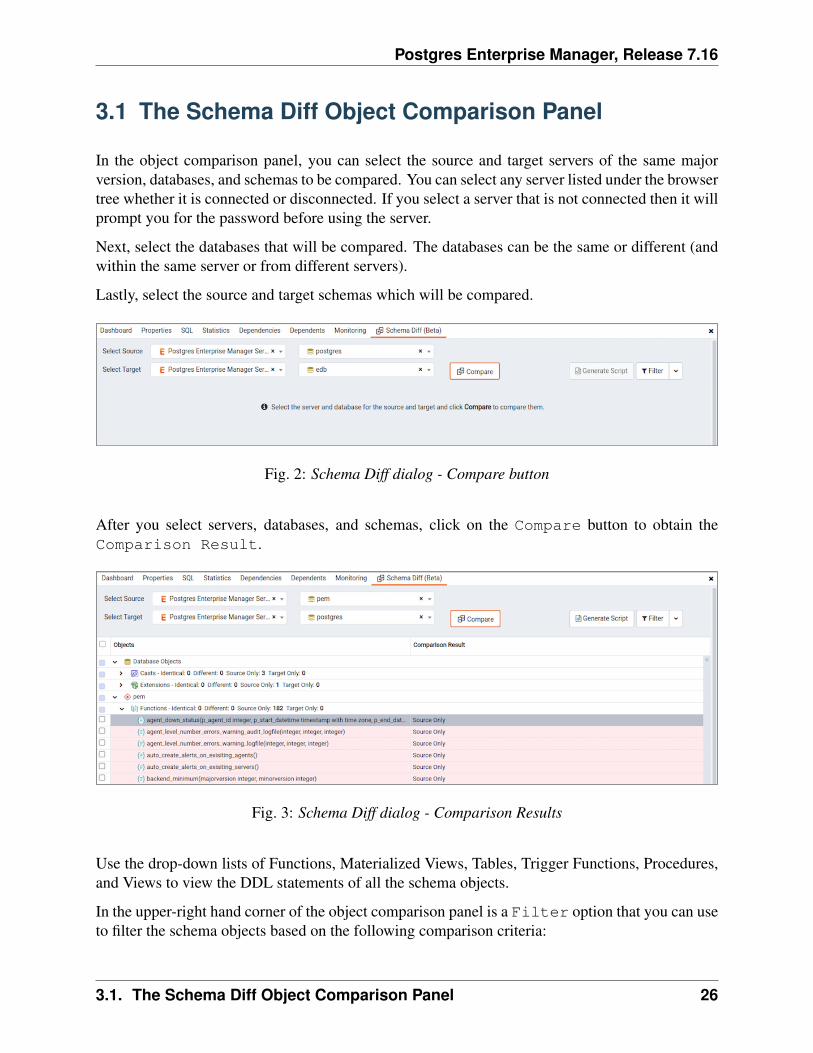
Fig. 2: Schema Diff dialog - Compare button
After you select servers, databases, and schemas, click on the Compare button to obtain theComparison Result.
Fig. 3: Schema Diff dialog - Comparison Results
Use the drop-down lists of Functions, Materialized Views, Tables, Trigger Functions, Procedures,and Views to view the DDL statements of all the schema objects.
In the upper-right hand corner of the object comparison panel is a Filter option that you can useto filter the schema objects based on the following comparison criteria:
3.1. The Schema Diff Object Comparison Panel 26
Postgres Enterprise Manager, Release 7.16
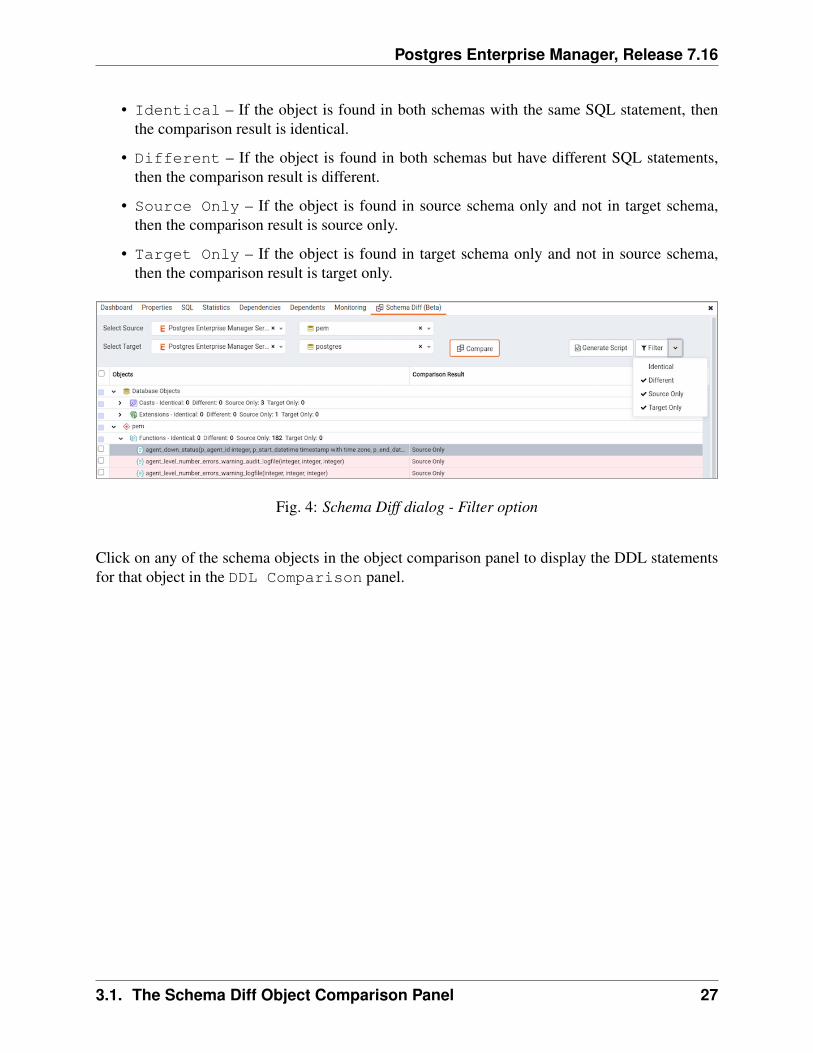
• Identical – If the object is found in both schemas with the same SQL statement, thenthe comparison result is identical.
• Different – If the object is found in both schemas but have different SQL statements,then the comparison result is different.
• Source Only – If the object is found in source schema only and not in target schema,then the comparison result is source only.
• Target Only – If the object is found in target schema only and not in source schema,then the comparison result is target only.
Fig. 4: Schema Diff dialog - Filter option
Click on any of the schema objects in the object comparison panel to display the DDL statementsfor that object in the DDL Comparison panel.
3.1. The Schema Diff Object Comparison Panel 27
Postgres Enterprise Manager, Release 7.16
3.2 Schema Diff DDL Comparison Panel
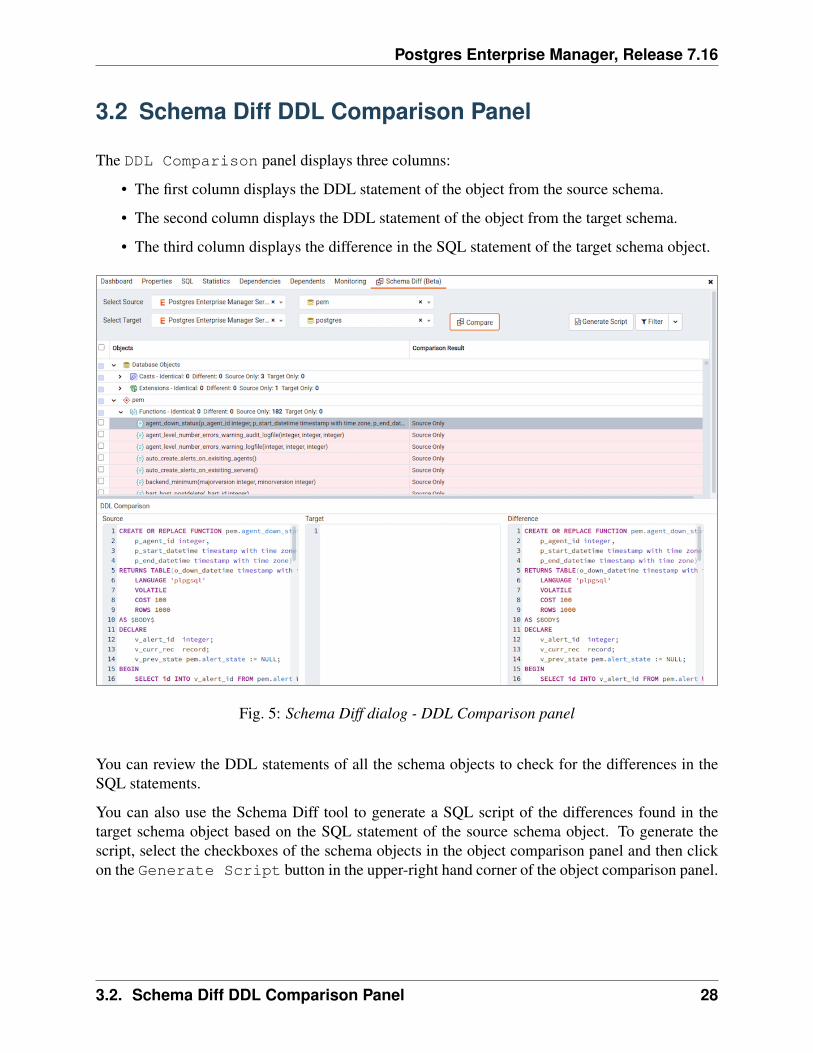
The DDL Comparison panel displays three columns:
• The first column displays the DDL statement of the object from the source schema.
• The second column displays the DDL statement of the object from the target schema.
• The third column displays the difference in the SQL statement of the target schema object.
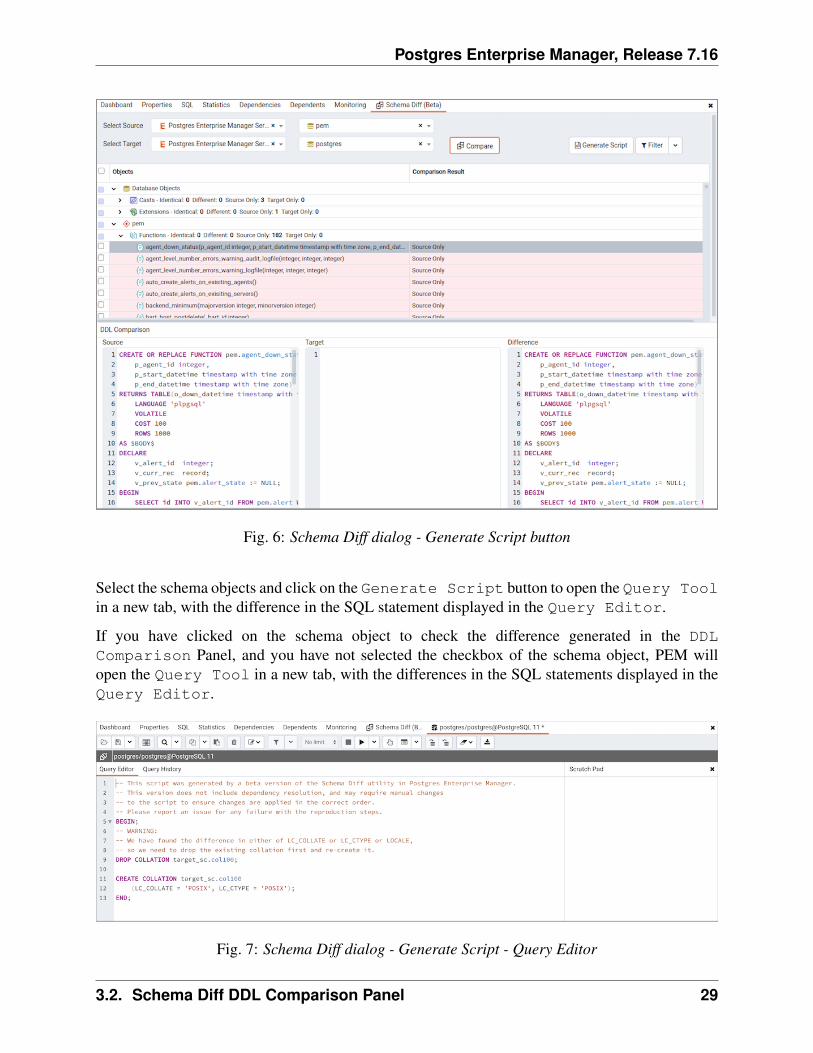
Fig. 5: Schema Diff dialog - DDL Comparison panel
You can review the DDL statements of all the schema objects to check for the differences in theSQL statements.
You can also use the Schema Diff tool to generate a SQL script of the differences found in thetarget schema object based on the SQL statement of the source schema object. To generate thescript, select the checkboxes of the schema objects in the object comparison panel and then clickon the Generate Script button in the upper-right hand corner of the object comparison panel.
3.2. Schema Diff DDL Comparison Panel 28
Postgres Enterprise Manager, Release 7.16
Fig. 6: Schema Diff dialog - Generate Script button
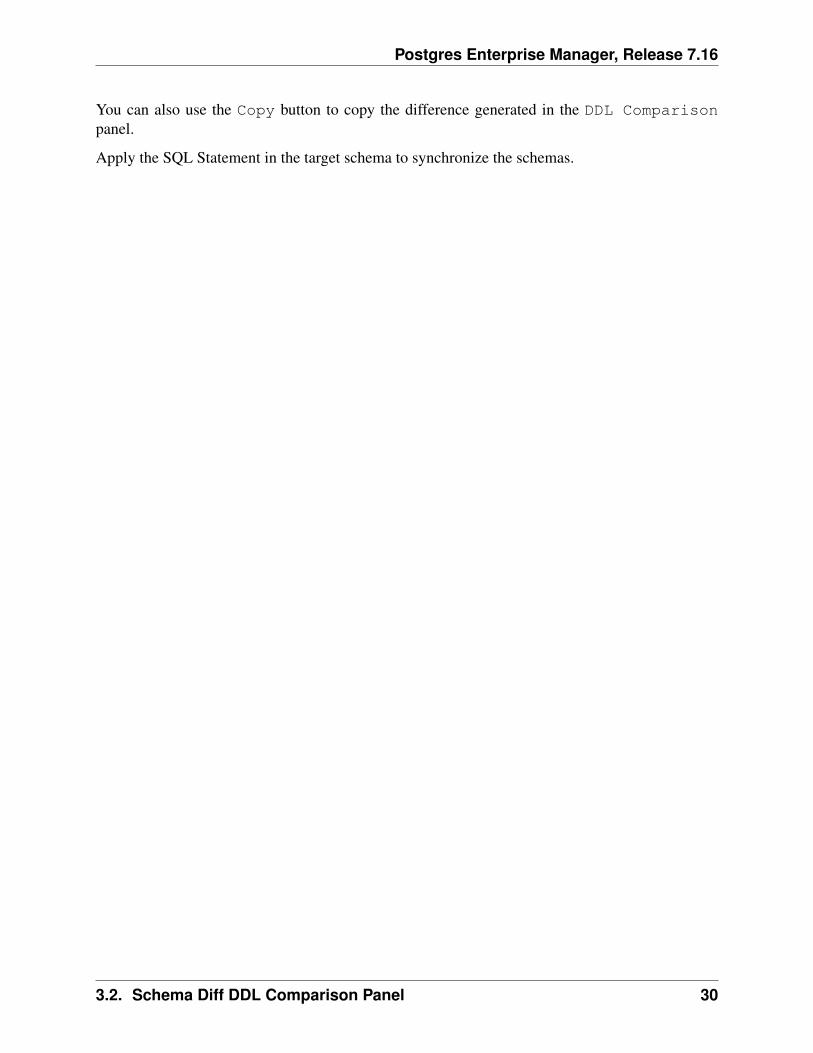
Select the schema objects and click on the Generate Script button to open the Query Toolin a new tab, with the difference in the SQL statement displayed in the Query Editor.
If you have clicked on the schema object to check the difference generated in the DDLComparison Panel, and you have not selected the checkbox of the schema object, PEM willopen the Query Tool in a new tab, with the differences in the SQL statements displayed in theQuery Editor.
Fig. 7: Schema Diff dialog - Generate Script - Query Editor
3.2. Schema Diff DDL Comparison Panel 29
Postgres Enterprise Manager, Release 7.16
You can also use the Copy button to copy the difference generated in the DDL Comparisonpanel.
Apply the SQL Statement in the target schema to synchronize the schemas.
3.2. Schema Diff DDL Comparison Panel 30
CHAPTER 4
Performance Monitoring and Management
PEM contains built-in functionality that implements enterprise-wide performance monitoring of allmanaged servers. While you can customize many aspects of the various performance monitoringaspects of PEM, you can also elect to accept the recommended defaults that come out-of-the-boxwith the product.
31
Postgres Enterprise Manager, Release 7.16
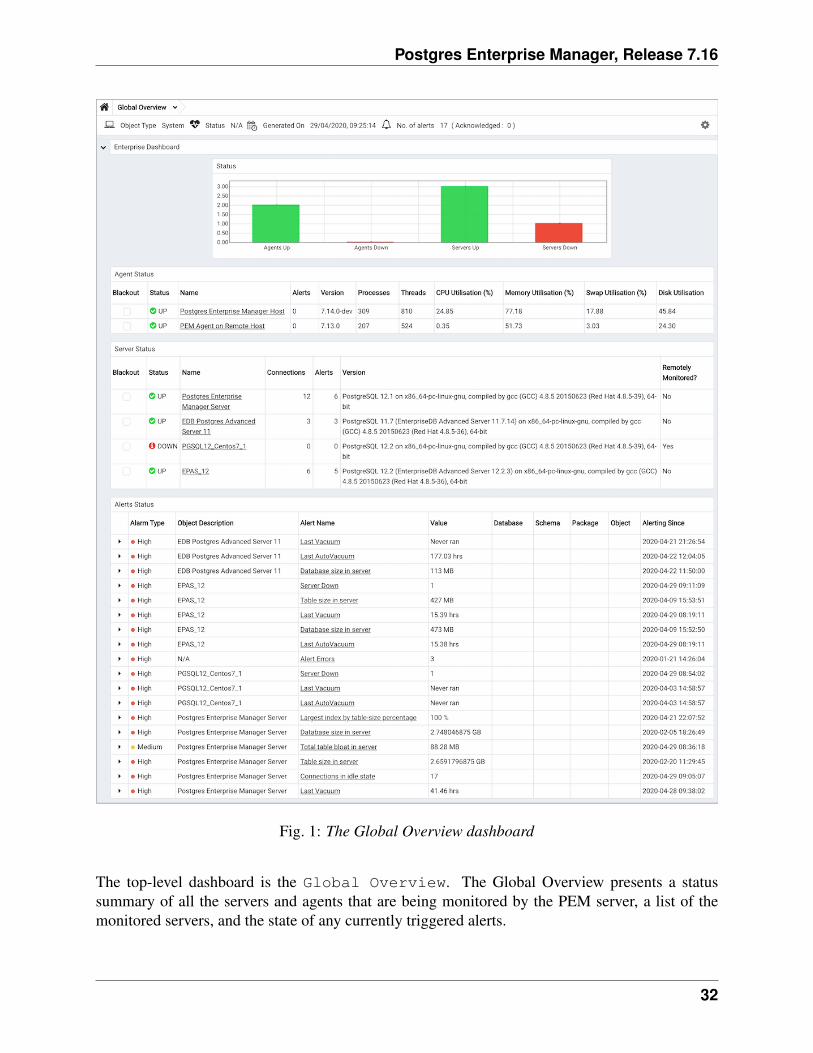
Fig. 1: The Global Overview dashboard
The top-level dashboard is the Global Overview. The Global Overview presents a statussummary of all the servers and agents that are being monitored by the PEM server, a list of themonitored servers, and the state of any currently triggered alerts.
32
Postgres Enterprise Manager, Release 7.16
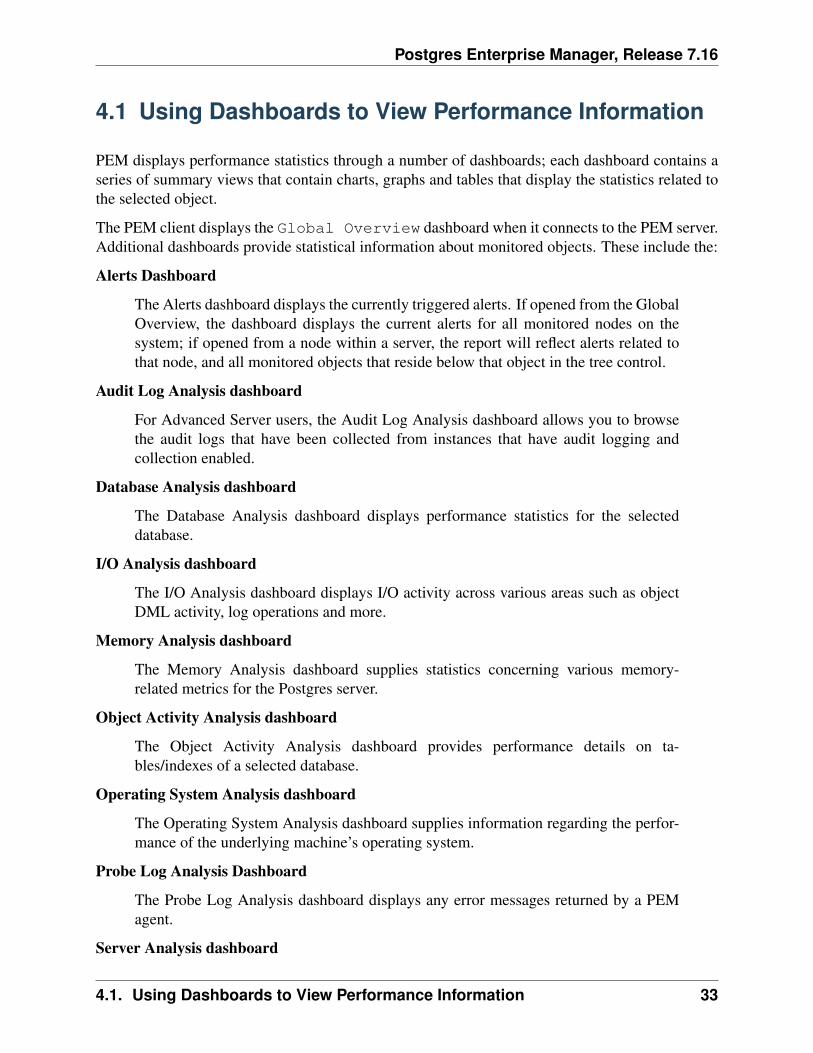
4.1 Using Dashboards to View Performance Information
PEM displays performance statistics through a number of dashboards; each dashboard contains aseries of summary views that contain charts, graphs and tables that display the statistics related tothe selected object.
The PEM client displays the Global Overview dashboard when it connects to the PEM server.Additional dashboards provide statistical information about monitored objects. These include the:
Alerts Dashboard
The Alerts dashboard displays the currently triggered alerts. If opened from the GlobalOverview, the dashboard displays the current alerts for all monitored nodes on thesystem; if opened from a node within a server, the report will reflect alerts related tothat node, and all monitored objects that reside below that object in the tree control.
Audit Log Analysis dashboard
For Advanced Server users, the Audit Log Analysis dashboard allows you to browsethe audit logs that have been collected from instances that have audit logging andcollection enabled.
Database Analysis dashboard
The Database Analysis dashboard displays performance statistics for the selecteddatabase.
I/O Analysis dashboard
The I/O Analysis dashboard displays I/O activity across various areas such as objectDML activity, log operations and more.
Memory Analysis dashboard
The Memory Analysis dashboard supplies statistics concerning various memory-related metrics for the Postgres server.
Object Activity Analysis dashboard
The Object Activity Analysis dashboard provides performance details on ta-bles/indexes of a selected database.
Operating System Analysis dashboard
The Operating System Analysis dashboard supplies information regarding the perfor-mance of the underlying machine’s operating system.
Probe Log Analysis Dashboard
The Probe Log Analysis dashboard displays any error messages returned by a PEMagent.
Server Analysis dashboard
4.1. Using Dashboards to View Performance Information 33
Postgres Enterprise Manager, Release 7.16
The Server Analysis dashboard provides general performance information about theoverall operations of a selected Postgres server.
Server Log Analysis dashboard
The Server Log Analysis dashboard allows you to filter and review the contents ofserver logs that are stored on the PEM server.
Session Activity Analysis dashboard
The Session Activity Analysis dashboard provides information about the session work-load and lock activity for the selected server
Session Waits Analysis dashboard
The Session Waits Analysis dashboard provides an overview of the current DRITAwait events for an Advanced Server session.
Storage Analysis dashboard
The Storage Analysis dashboard displays space-related metrics for tablespaces andobjects.
System Waits Analysis dashboard
The System Waits Analysis dashboard displays a graphical analysis of system waitinformation for an Advanced Server session.
Streaming Replication Analysis dashboard
The Streaming Replication Analysis dashboard displays statistical information aboutWAL activity for a monitored server and allows you to monitor the status of FailoverManager clusters.
There are two ways to open a dashboard; you can:
• Select an active dashboard name from the Dashboards menu (accessed via the Manage-ment menu).
• Right click on the name of a monitored object in the tree control and select the name of thedashboard you would like to review from the Dashboards menu.
Each dashboard is displayed on the Monitoring tab in the main panel of the client window.After opening a dashboard, you can navigate to other dashboards within the same tab.
Each dashboard header includes navigation menus that allow you to navigate to other dashboards;use your browsers forward and back icons to scroll through previously-viewed dashboards. Usethe Refresh icon to update the current dashboard.
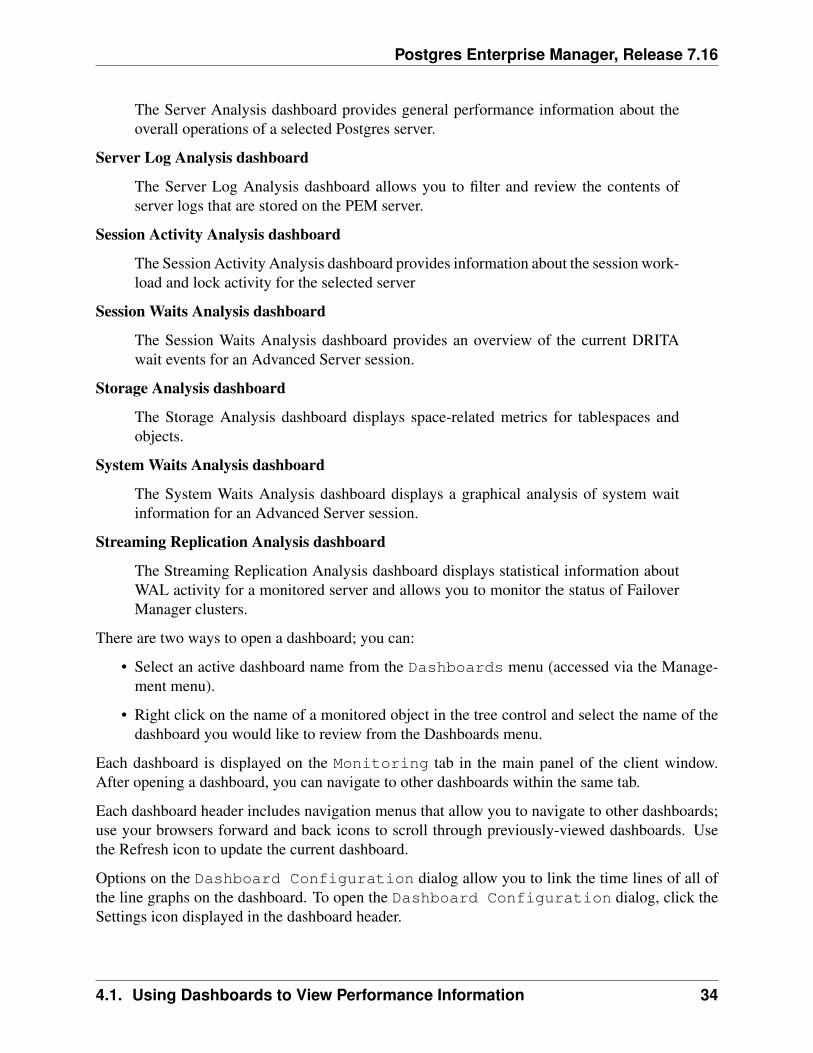
Options on the Dashboard Configuration dialog allow you to link the time lines of all ofthe line graphs on the dashboard. To open the Dashboard Configuration dialog, click theSettings icon displayed in the dashboard header.
4.1. Using Dashboards to View Performance Information 34
Postgres Enterprise Manager, Release 7.16
Fig. 2: The Dashboard Configuration dialog
Use fields on the Dashboard Configuration dialog to control attributes of the charts dis-played on the dashboard:
• Set the Link timelines of all the line charts slider to Enable to indicate that the specifiedtimeline should be applied to line graphs displayed on the dashboard; if set to Disable, yourpreferences will be preserved for later use, but will not modify the amount of data displayed.
• Use the Days selector to specify the number of days of gathered data that should be dis-played on line graphs.
• Use the Hour(s) selector to specify the number of hours of gathered data that should bedisplayed on line graphs.
• Check the box next to Remember configuration for this dashboard to indicate that the cus-tomized time span should be applied to the current dashboard only; if left unchecked, thetime span will be applied globally to line graphs on all dashboards.
Please note that settings specified on the Dashboard Configuration dialog are applied onlyto the current user’s session.
4.1. Using Dashboards to View Performance Information 35
Postgres Enterprise Manager, Release 7.16
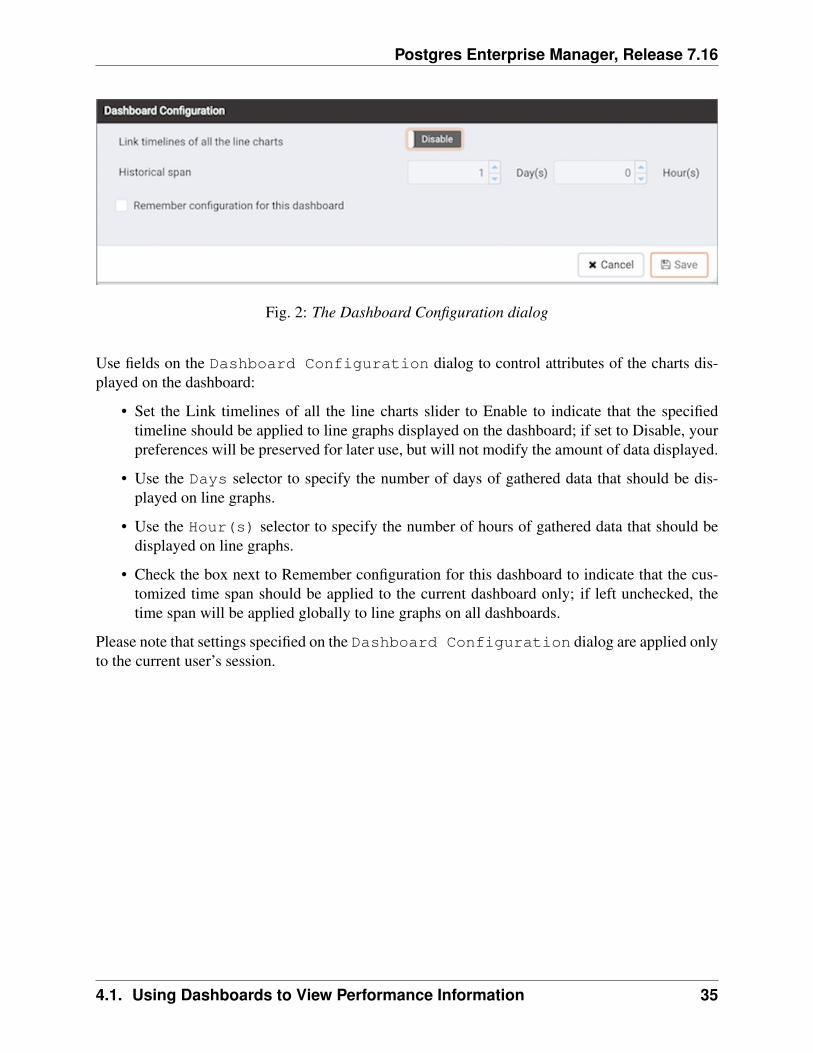
4.2 Managing Custom Dashboards
PEM displays performance statistics through a number of system-defined dashboards; each dash-board contains a series of summary views that contain charts, graphs and tables that display statis-tics related to the selected object. You can use the Manage Dashboards tab to create andmanage custom dashboards that display the information that is most relevant to your system.
Fig. 3: The Manage Dashboards tab
To create a custom dashboard, click the Create New Dashboard link (located in the QuickLinks section of the Manage Dashboards tab).
To modify an existing dashboard, click the edit icon to the left of a dashboard name. The dashboardeditor will open, displaying the definition of the dashboard. When you’ve finished modifying thedashboard’s definition, click the Save button to preserve your changes; click Cancel to exitwithout saving your changes.
To delete a dashboard, click the delete icon to the left of a dashboard name. A popup will ask youto confirm that you wish to delete the dashboard; click OK to delete the selected dashboard.
4.2. Managing Custom Dashboards 36
Postgres Enterprise Manager, Release 7.16
4.2.1 Creating a Custom Dashboard
You can use the PEM dashboard editor to create or modify a user-defined dashboard. The customdashboard may include pre-defined charts, user-defined charts or a mix of pre-defined and user-defined charts.
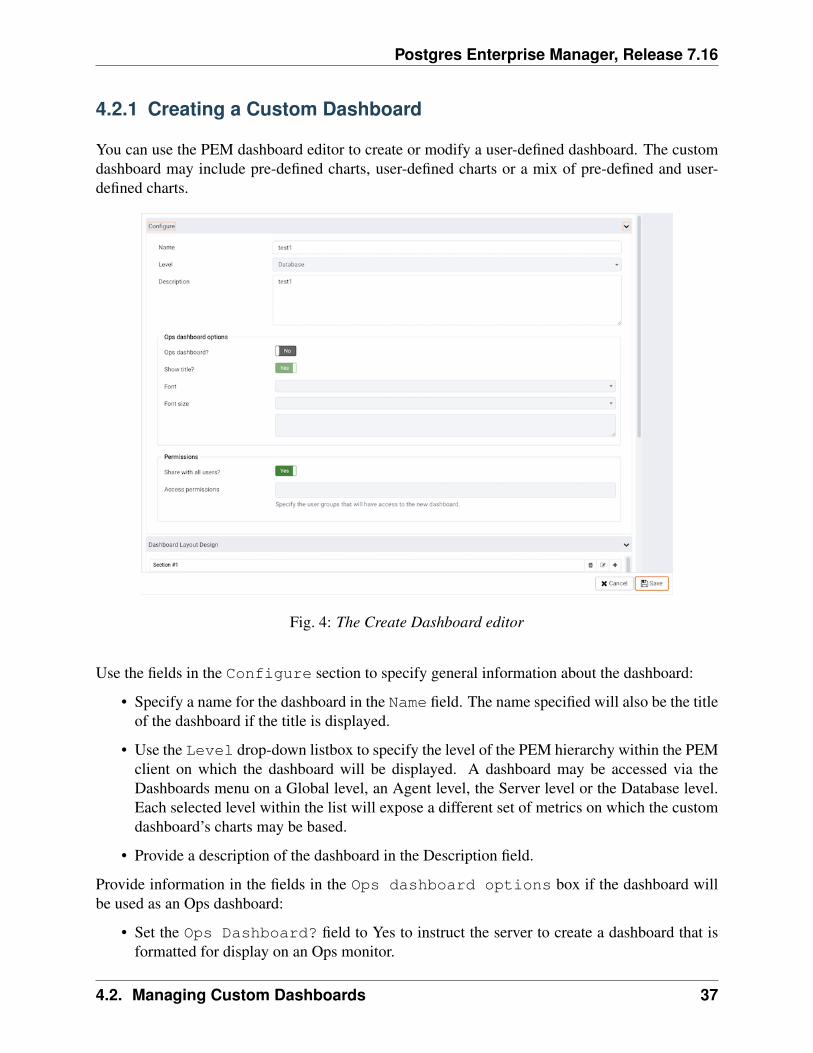
Fig. 4: The Create Dashboard editor
Use the fields in the Configure section to specify general information about the dashboard:
• Specify a name for the dashboard in the Name field. The name specified will also be the titleof the dashboard if the title is displayed.
• Use the Level drop-down listbox to specify the level of the PEM hierarchy within the PEMclient on which the dashboard will be displayed. A dashboard may be accessed via theDashboards menu on a Global level, an Agent level, the Server level or the Database level.Each selected level within the list will expose a different set of metrics on which the customdashboard’s charts may be based.
• Provide a description of the dashboard in the Description field.
Provide information in the fields in the Ops dashboard options box if the dashboard willbe used as an Ops dashboard:
• Set the Ops Dashboard? field to Yes to instruct the server to create a dashboard that isformatted for display on an Ops monitor.
4.2. Managing Custom Dashboards 37
Postgres Enterprise Manager, Release 7.16
• Set the Show Title? field to Yes to display the dashboard name at the top of the Opsdashboard.
• Use the Font drop-down list box to select a custom font style for the title. The selected fontstyle will be displayed in the Preview box.
• Use the Font size drop-down list box to select a custom font size for the title. Theselected font style will be displayed in the Preview box.
Use the Permissions box to specify the users that will be able to view the new dashboard:
• Set the Share with all slider to Yes to instruct the server to allow all Teams toaccess the dashboard, or set Share with all to No to enable the Access permissions field.
• Use the Access permissions field to specify which roles can view the new dashboard.Click in the field, and select from the list of users to add a role to the list of users withdashboard access.
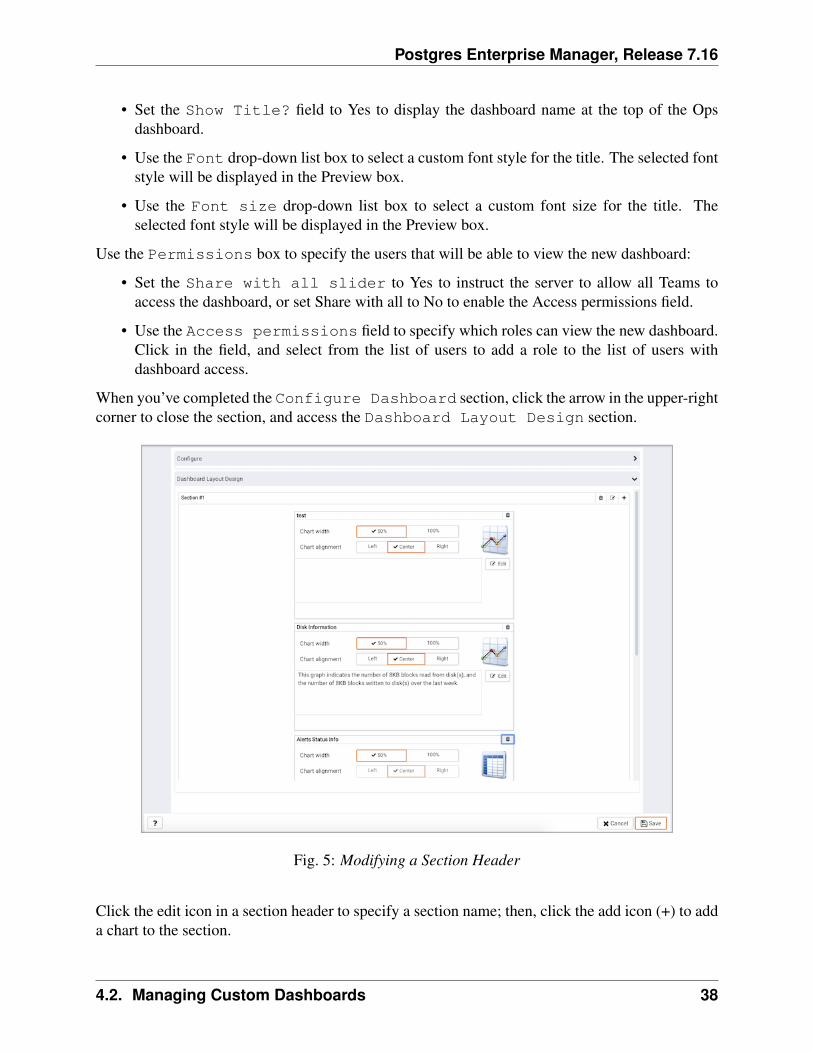
When you’ve completed the Configure Dashboard section, click the arrow in the upper-rightcorner to close the section, and access the Dashboard Layout Design section.
Fig. 5: Modifying a Section Header
Click the edit icon in a section header to specify a section name; then, click the add icon (+) to adda chart to the section.
4.2. Managing Custom Dashboards 38
Postgres Enterprise Manager, Release 7.16
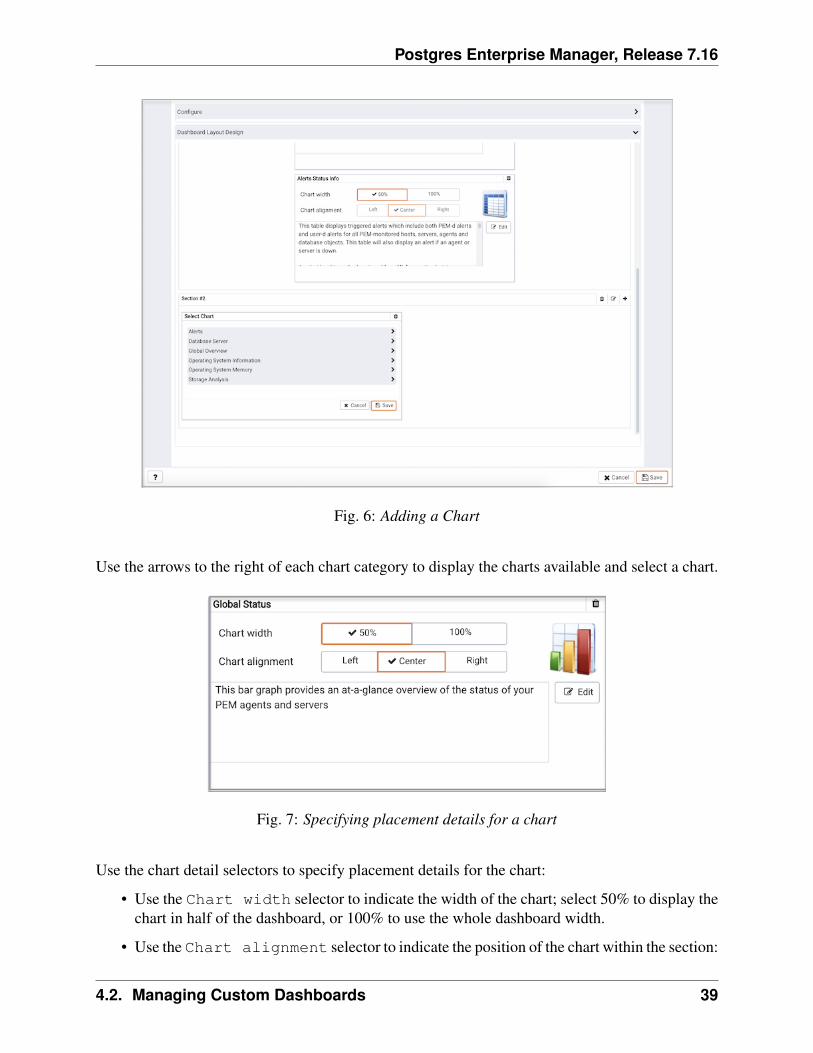
Fig. 6: Adding a Chart
Use the arrows to the right of each chart category to display the charts available and select a chart.
Fig. 7: Specifying placement details for a chart
Use the chart detail selectors to specify placement details for the chart:
• Use the Chart width selector to indicate the width of the chart; select 50% to display thechart in half of the dashboard, or 100% to use the whole dashboard width.
• Use the Chart alignment selector to indicate the position of the chart within the section:
4.2. Managing Custom Dashboards 39
Postgres Enterprise Manager, Release 7.16
Select Left to indicate that the chart should be left-justified.
Select Center to indicate that the chart should be centered.
Select Right to indicate that the chart should be right-justified.
Please note that tables are always displayed centered.
When creating or editing a custom dashboard, you can use drag and drop to re-arrange the chartswithin a section or to move a chart to a different section.
To add another chart to your dashboard, click the add icon (+) in the section header. When you’vefinished editing the dashboard, click the Save button to save your edits and exit.
To exit without saving your changes, click the Cancel button.
4.2. Managing Custom Dashboards 40
Postgres Enterprise Manager, Release 7.16
4.2.2 Creating an Ops Dashboard
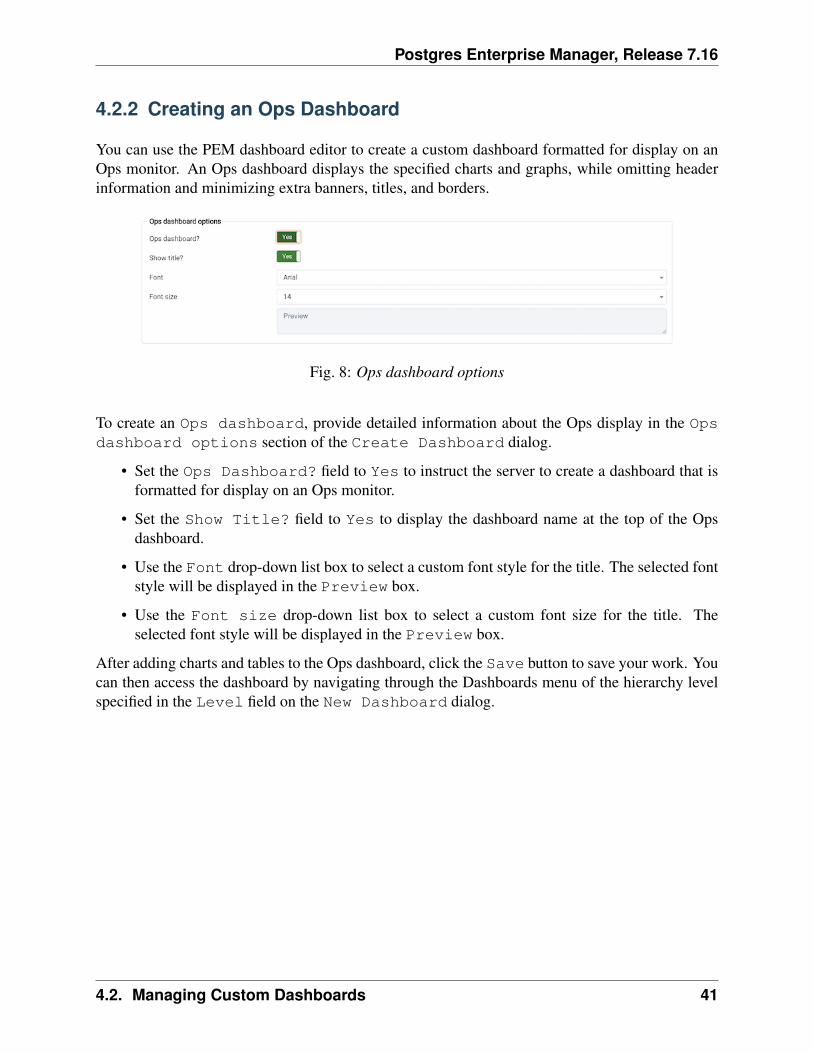
You can use the PEM dashboard editor to create a custom dashboard formatted for display on anOps monitor. An Ops dashboard displays the specified charts and graphs, while omitting headerinformation and minimizing extra banners, titles, and borders.
Fig. 8: Ops dashboard options
To create an Ops dashboard, provide detailed information about the Ops display in the Opsdashboard options section of the Create Dashboard dialog.
• Set the Ops Dashboard? field to Yes to instruct the server to create a dashboard that isformatted for display on an Ops monitor.
• Set the Show Title? field to Yes to display the dashboard name at the top of the Opsdashboard.
• Use the Font drop-down list box to select a custom font style for the title. The selected fontstyle will be displayed in the Preview box.
• Use the Font size drop-down list box to select a custom font size for the title. Theselected font style will be displayed in the Preview box.
After adding charts and tables to the Ops dashboard, click the Save button to save your work. Youcan then access the dashboard by navigating through the Dashboards menu of the hierarchy levelspecified in the Level field on the New Dashboard dialog.
4.2. Managing Custom Dashboards 41
Postgres Enterprise Manager, Release 7.16
4.3 Using the Manage Charts tab
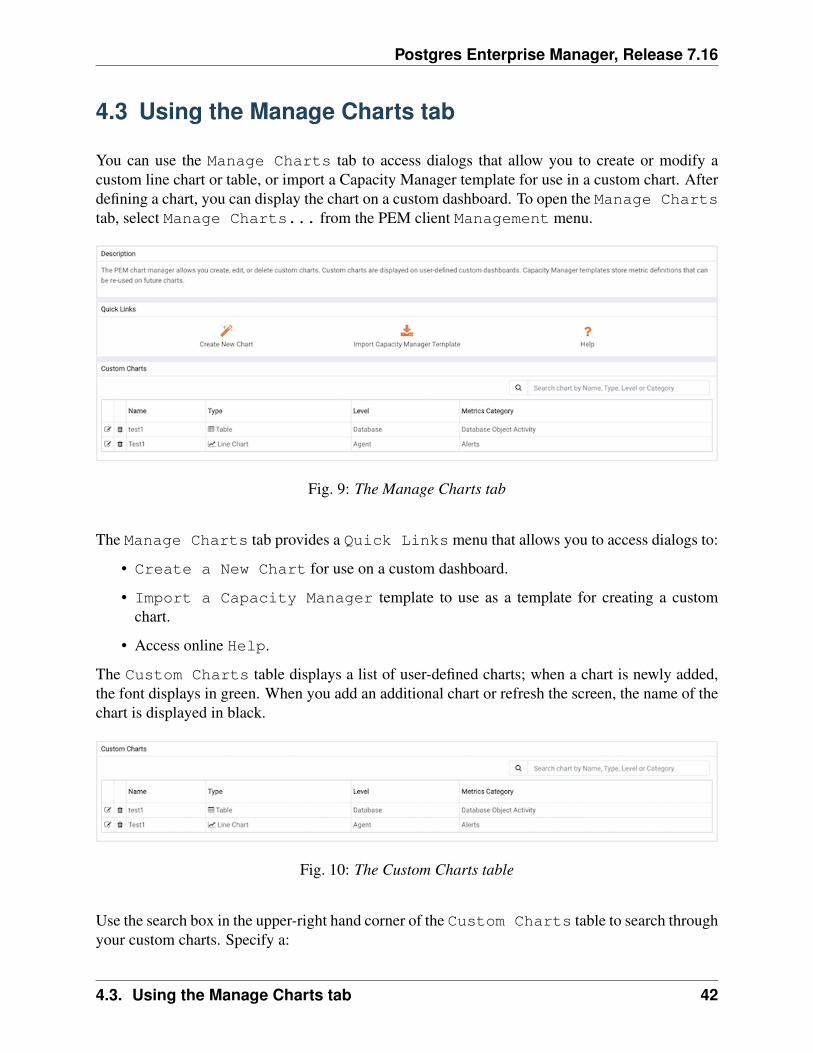
You can use the Manage Charts tab to access dialogs that allow you to create or modify acustom line chart or table, or import a Capacity Manager template for use in a custom chart. Afterdefining a chart, you can display the chart on a custom dashboard. To open the Manage Chartstab, select Manage Charts... from the PEM client Management menu.
Fig. 9: The Manage Charts tab
The Manage Charts tab provides a Quick Links menu that allows you to access dialogs to:
• Create a New Chart for use on a custom dashboard.
• Import a Capacity Manager template to use as a template for creating a customchart.
• Access online Help.
The Custom Charts table displays a list of user-defined charts; when a chart is newly added,the font displays in green. When you add an additional chart or refresh the screen, the name of thechart is displayed in black.
Fig. 10: The Custom Charts table
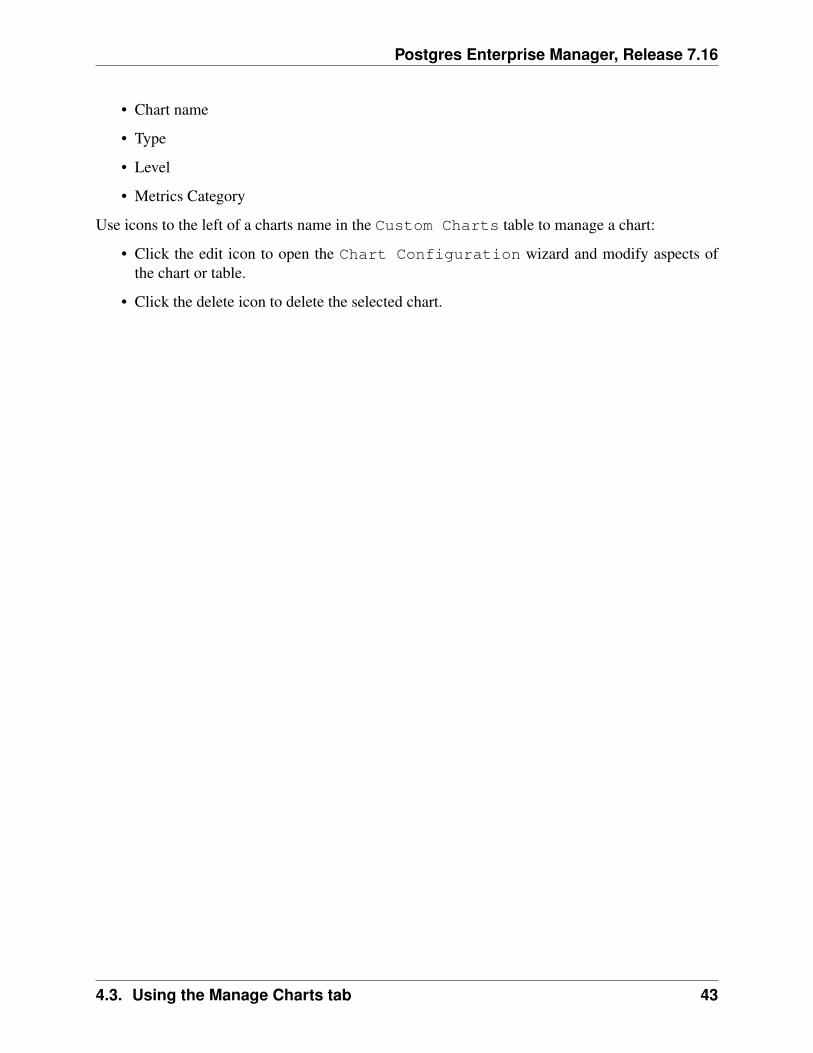
Use the search box in the upper-right hand corner of the Custom Charts table to search throughyour custom charts. Specify a:
4.3. Using the Manage Charts tab 42
Postgres Enterprise Manager, Release 7.16
• Chart name
• Type
• Level
• Metrics Category
Use icons to the left of a charts name in the Custom Charts table to manage a chart:
• Click the edit icon to open the Chart Configuration wizard and modify aspects ofthe chart or table.
• Click the delete icon to delete the selected chart.
4.3. Using the Manage Charts tab 43
Postgres Enterprise Manager, Release 7.16
4.3.1 Creating a Custom Chart
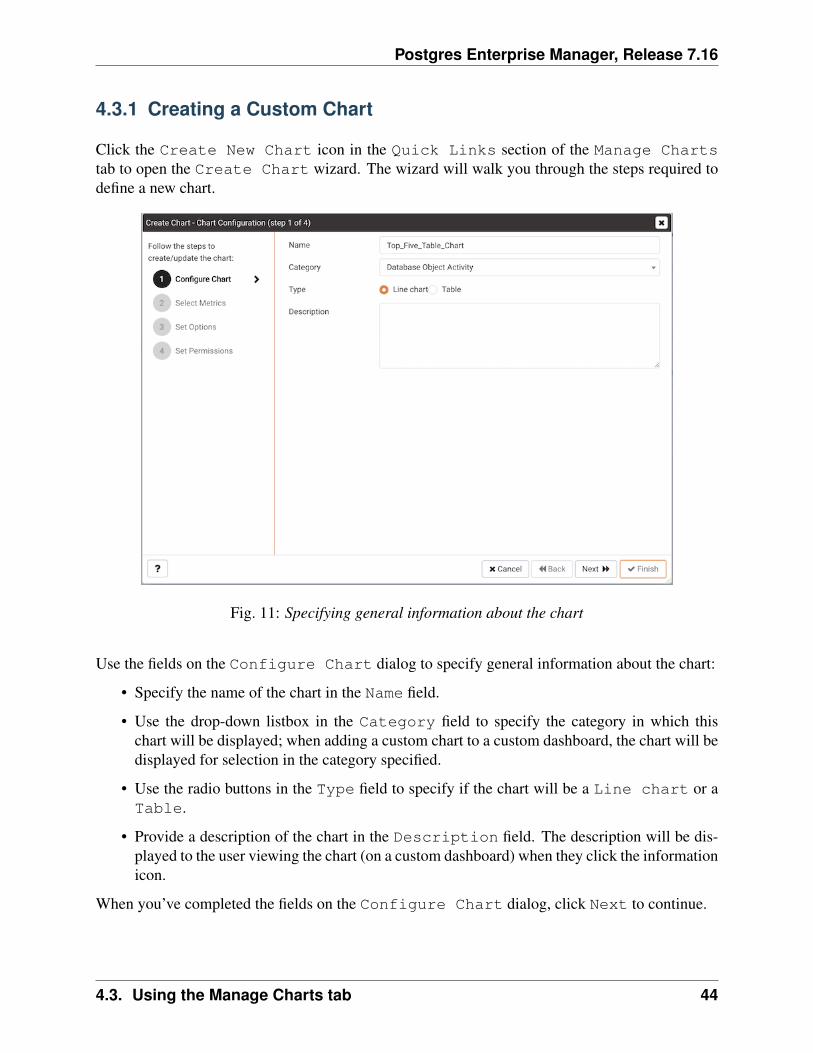
Click the Create New Chart icon in the Quick Links section of the Manage Chartstab to open the Create Chart wizard. The wizard will walk you through the steps required todefine a new chart.
Fig. 11: Specifying general information about the chart
Use the fields on the Configure Chart dialog to specify general information about the chart:
• Specify the name of the chart in the Name field.
• Use the drop-down listbox in the Category field to specify the category in which thischart will be displayed; when adding a custom chart to a custom dashboard, the chart will bedisplayed for selection in the category specified.
• Use the radio buttons in the Type field to specify if the chart will be a Line chart or aTable.
• Provide a description of the chart in the Description field. The description will be dis-played to the user viewing the chart (on a custom dashboard) when they click the informationicon.
When you’ve completed the fields on the Configure Chart dialog, click Next to continue.
4.3. Using the Manage Charts tab 44
Postgres Enterprise Manager, Release 7.16
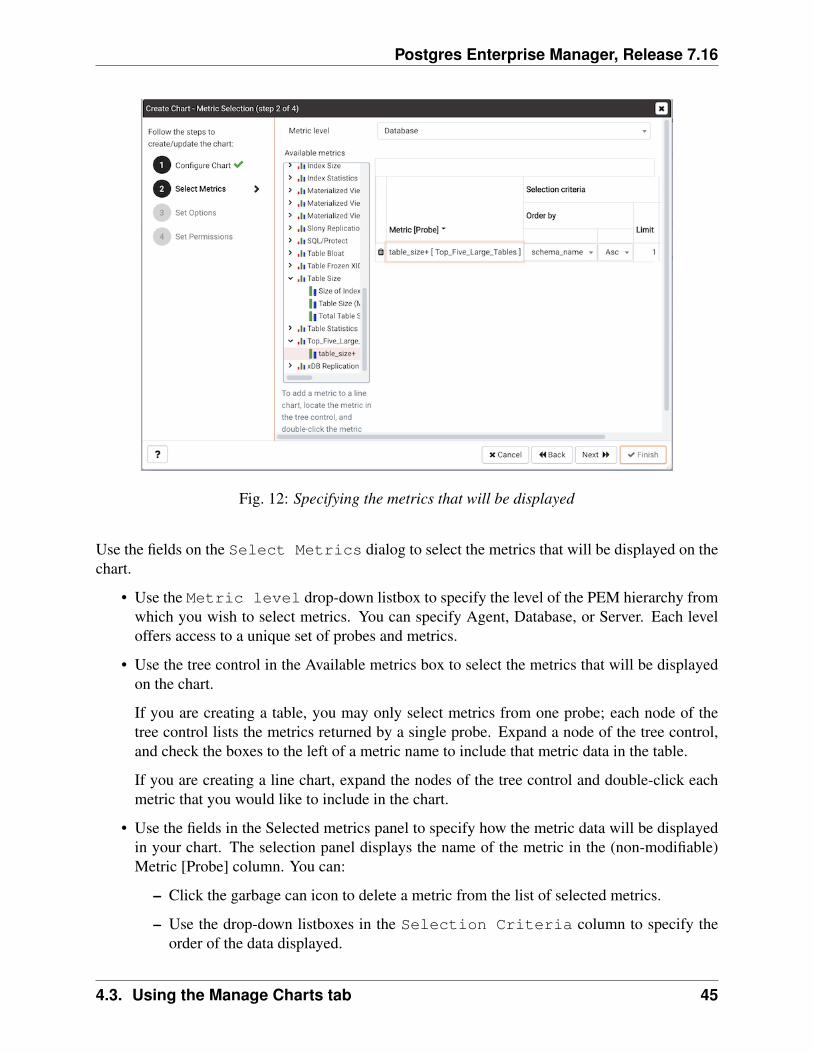
Fig. 12: Specifying the metrics that will be displayed
Use the fields on the Select Metrics dialog to select the metrics that will be displayed on thechart.
• Use the Metric level drop-down listbox to specify the level of the PEM hierarchy fromwhich you wish to select metrics. You can specify Agent, Database, or Server. Each leveloffers access to a unique set of probes and metrics.
• Use the tree control in the Available metrics box to select the metrics that will be displayedon the chart.
If you are creating a table, you may only select metrics from one probe; each node of thetree control lists the metrics returned by a single probe. Expand a node of the tree control,and check the boxes to the left of a metric name to include that metric data in the table.
If you are creating a line chart, expand the nodes of the tree control and double-click eachmetric that you would like to include in the chart.
• Use the fields in the Selected metrics panel to specify how the metric data will be displayedin your chart. The selection panel displays the name of the metric in the (non-modifiable)Metric [Probe] column. You can:
– Click the garbage can icon to delete a metric from the list of selected metrics.
– Use the drop-down listboxes in the Selection Criteria column to specify theorder of the data displayed.
4.3. Using the Manage Charts tab 45
Postgres Enterprise Manager, Release 7.16
– Use the Limit field to specify the number of rows in a table or lines in a chart:
The maximum number of lines allowed in a chart is 32.
The maximum number of rows allowed in a table is 100.
• If you are creating a line chart, PEM supports comparisons of cross-hierarchy metrics.
– Click the compare icon to open a selection box that allows you to select one ormore probe-specific attributes (i.e. CPUs, interfaces, databases, etc.) to compare in thechart.
– Click the copy icon to apply your selections to all of the metrics for the same probe.When the popup opens, click Yes to confirm that other selections for the same probewill be overwritten, or No to exit the popup without copying the attributes.
When you’ve completed the fields on the Select Metrics dialog, click Next to continue.
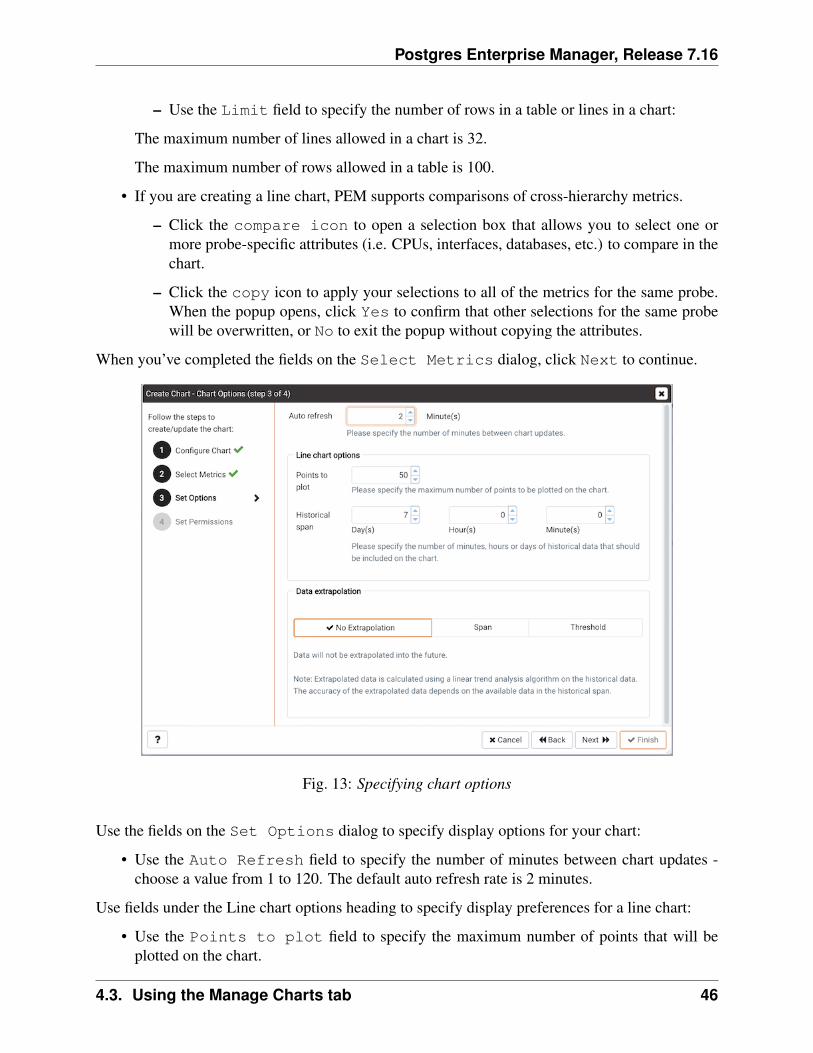
Fig. 13: Specifying chart options
Use the fields on the Set Options dialog to specify display options for your chart:
• Use the Auto Refresh field to specify the number of minutes between chart updates -choose a value from 1 to 120. The default auto refresh rate is 2 minutes.
Use fields under the Line chart options heading to specify display preferences for a line chart:
• Use the Points to plot field to specify the maximum number of points that will beplotted on the chart.
4.3. Using the Manage Charts tab 46
Postgres Enterprise Manager, Release 7.16
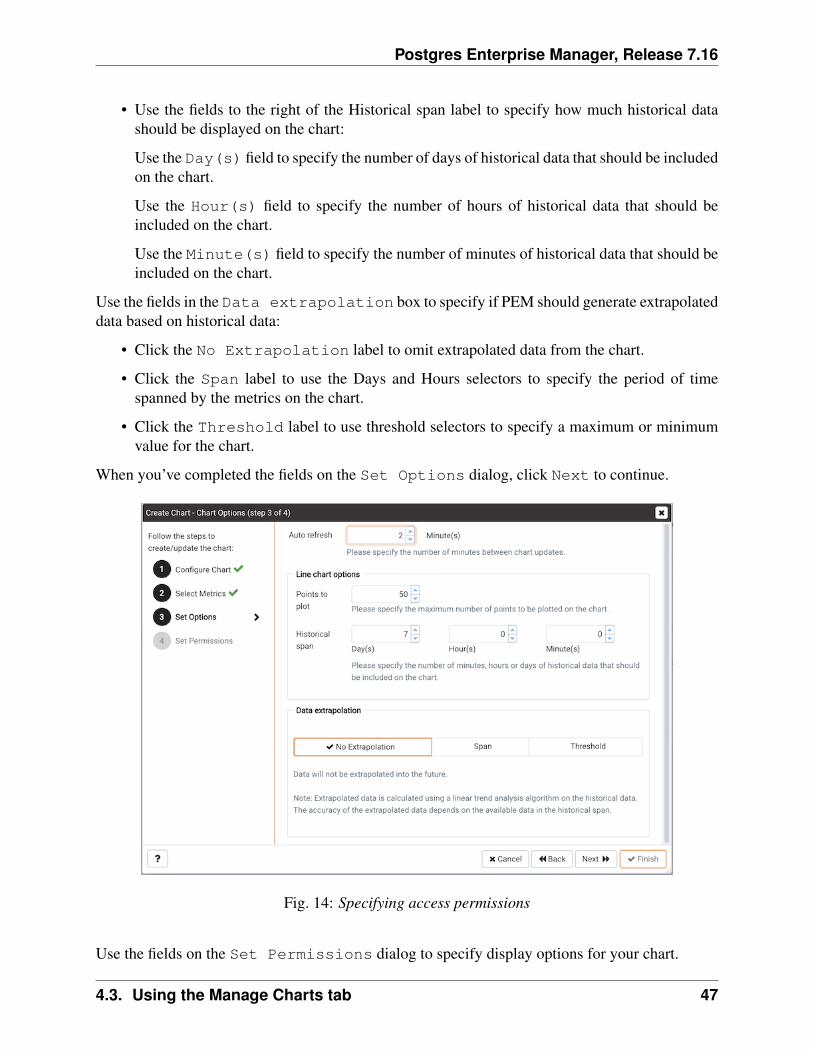
• Use the fields to the right of the Historical span label to specify how much historical datashould be displayed on the chart:
Use the Day(s) field to specify the number of days of historical data that should be includedon the chart.
Use the Hour(s) field to specify the number of hours of historical data that should beincluded on the chart.
Use the Minute(s) field to specify the number of minutes of historical data that should beincluded on the chart.
Use the fields in the Data extrapolation box to specify if PEM should generate extrapolateddata based on historical data:
• Click the No Extrapolation label to omit extrapolated data from the chart.
• Click the Span label to use the Days and Hours selectors to specify the period of timespanned by the metrics on the chart.
• Click the Threshold label to use threshold selectors to specify a maximum or minimumvalue for the chart.
When you’ve completed the fields on the Set Options dialog, click Next to continue.
Fig. 14: Specifying access permissions
Use the fields on the Set Permissions dialog to specify display options for your chart.
4.3. Using the Manage Charts tab 47
Postgres Enterprise Manager, Release 7.16
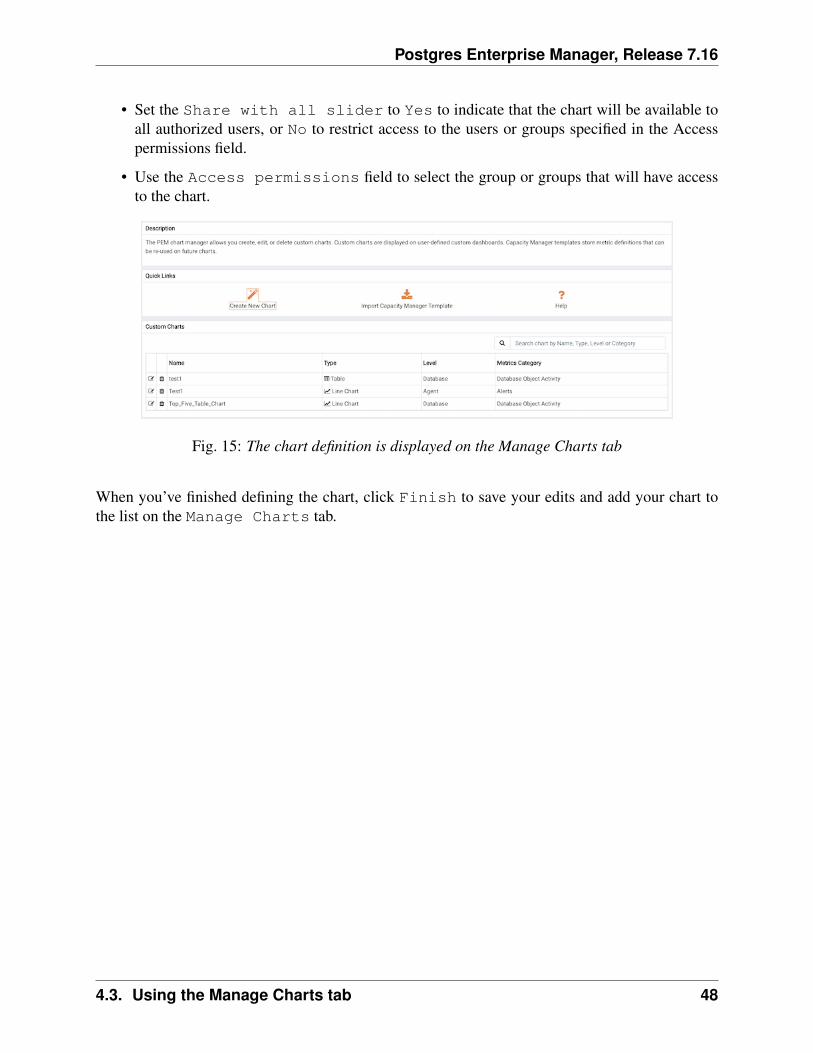
• Set the Share with all slider to Yes to indicate that the chart will be available toall authorized users, or No to restrict access to the users or groups specified in the Accesspermissions field.
• Use the Access permissions field to select the group or groups that will have accessto the chart.
Fig. 15: The chart definition is displayed on the Manage Charts tab
When you’ve finished defining the chart, click Finish to save your edits and add your chart tothe list on the Manage Charts tab.
4.3. Using the Manage Charts tab 48
Postgres Enterprise Manager, Release 7.16
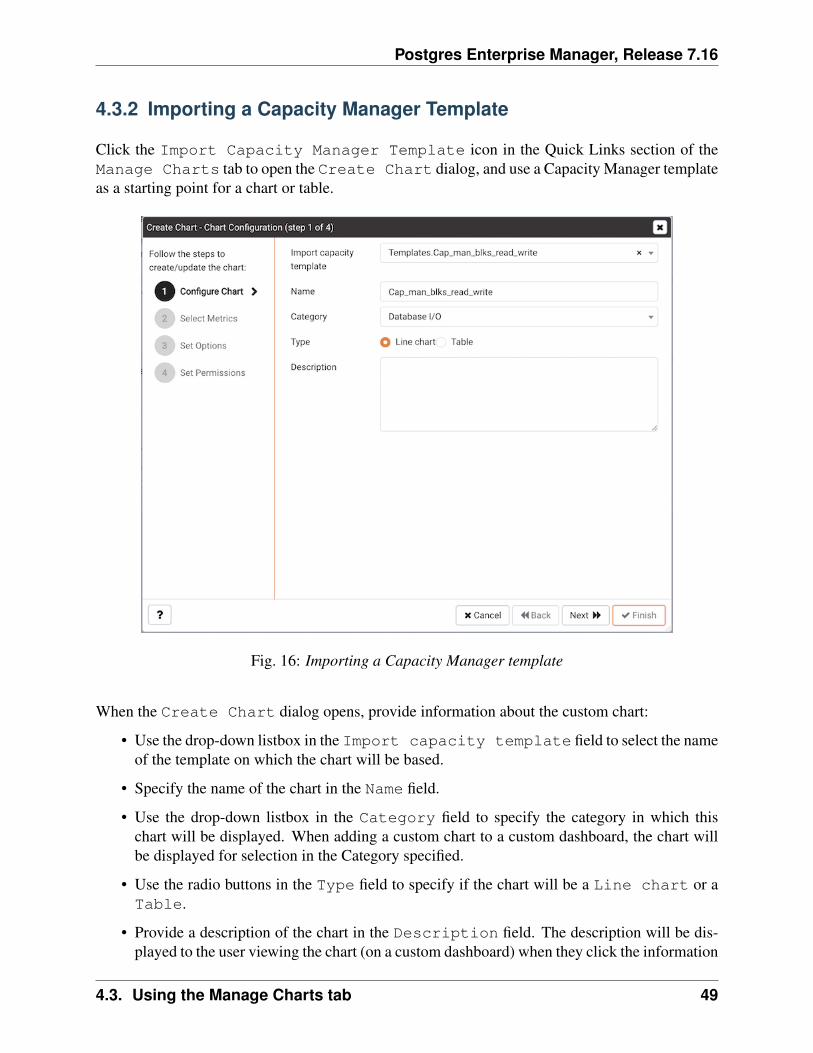
4.3.2 Importing a Capacity Manager Template
Click the Import Capacity Manager Template icon in the Quick Links section of theManage Charts tab to open the Create Chart dialog, and use a Capacity Manager templateas a starting point for a chart or table.
Fig. 16: Importing a Capacity Manager template
When the Create Chart dialog opens, provide information about the custom chart:
• Use the drop-down listbox in the Import capacity template field to select the nameof the template on which the chart will be based.
• Specify the name of the chart in the Name field.
• Use the drop-down listbox in the Category field to specify the category in which thischart will be displayed. When adding a custom chart to a custom dashboard, the chart willbe displayed for selection in the Category specified.
• Use the radio buttons in the Type field to specify if the chart will be a Line chart or aTable.
• Provide a description of the chart in the Description field. The description will be dis-played to the user viewing the chart (on a custom dashboard) when they click the information
4.3. Using the Manage Charts tab 49
Postgres Enterprise Manager, Release 7.16
icon.
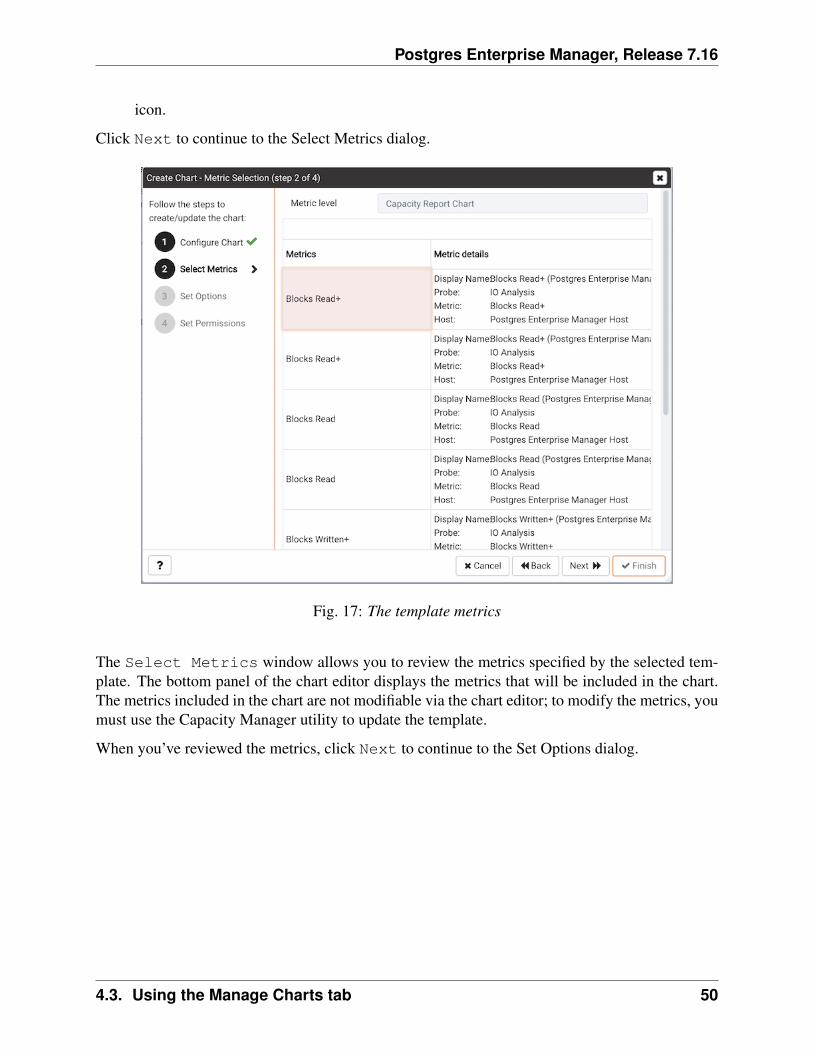
Click Next to continue to the Select Metrics dialog.
Fig. 17: The template metrics
The Select Metrics window allows you to review the metrics specified by the selected tem-plate. The bottom panel of the chart editor displays the metrics that will be included in the chart.The metrics included in the chart are not modifiable via the chart editor; to modify the metrics, youmust use the Capacity Manager utility to update the template.
When you’ve reviewed the metrics, click Next to continue to the Set Options dialog.
4.3. Using the Manage Charts tab 50
Postgres Enterprise Manager, Release 7.16
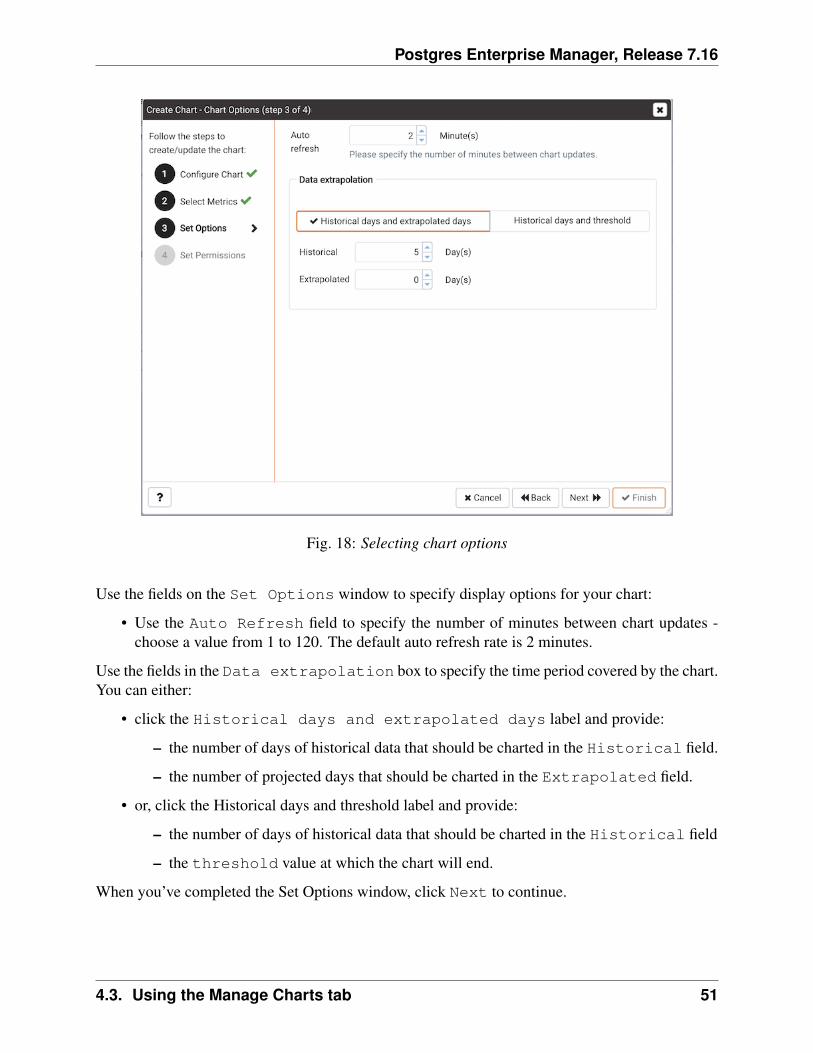
Fig. 18: Selecting chart options
Use the fields on the Set Options window to specify display options for your chart:
• Use the Auto Refresh field to specify the number of minutes between chart updates -choose a value from 1 to 120. The default auto refresh rate is 2 minutes.
Use the fields in the Data extrapolation box to specify the time period covered by the chart.You can either:
• click the Historical days and extrapolated days label and provide:
– the number of days of historical data that should be charted in the Historical field.
– the number of projected days that should be charted in the Extrapolated field.
• or, click the Historical days and threshold label and provide:
– the number of days of historical data that should be charted in the Historical field
– the threshold value at which the chart will end.
When you’ve completed the Set Options window, click Next to continue.
4.3. Using the Manage Charts tab 51
Postgres Enterprise Manager, Release 7.16
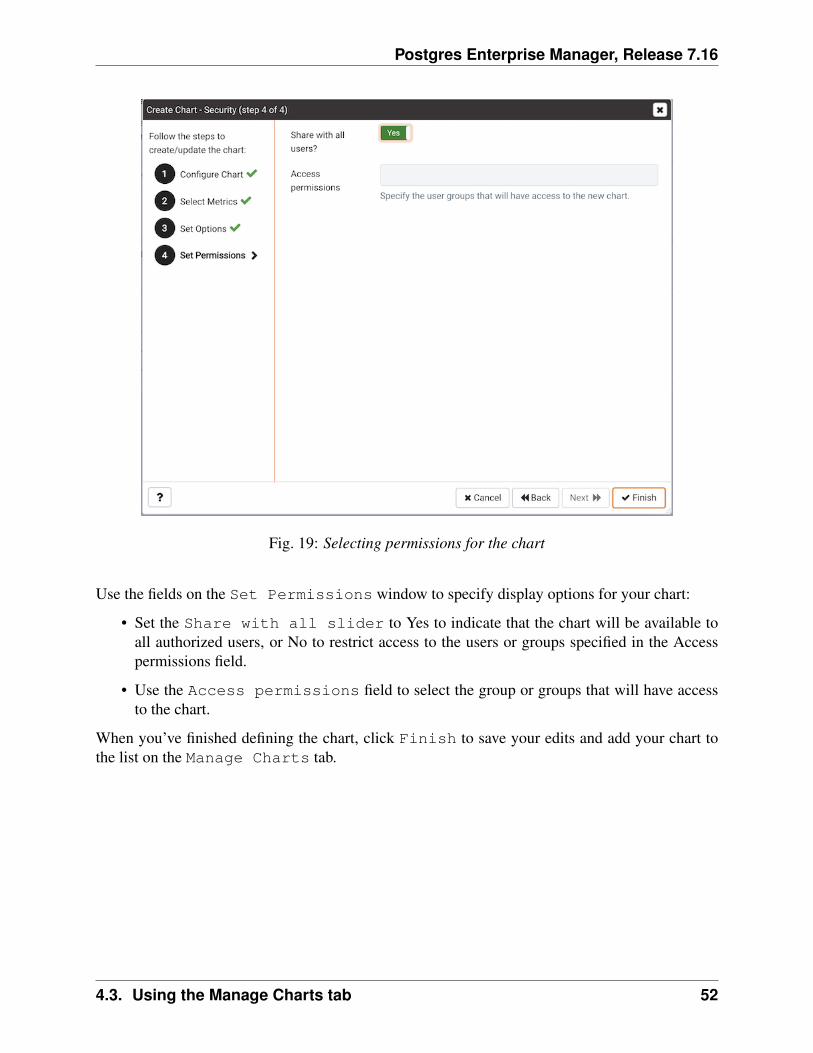
Fig. 19: Selecting permissions for the chart
Use the fields on the Set Permissions window to specify display options for your chart:
• Set the Share with all slider to Yes to indicate that the chart will be available toall authorized users, or No to restrict access to the users or groups specified in the Accesspermissions field.
• Use the Access permissions field to select the group or groups that will have accessto the chart.
When you’ve finished defining the chart, click Finish to save your edits and add your chart tothe list on the Manage Charts tab.
4.3. Using the Manage Charts tab 52
Postgres Enterprise Manager, Release 7.16
4.4 Probes
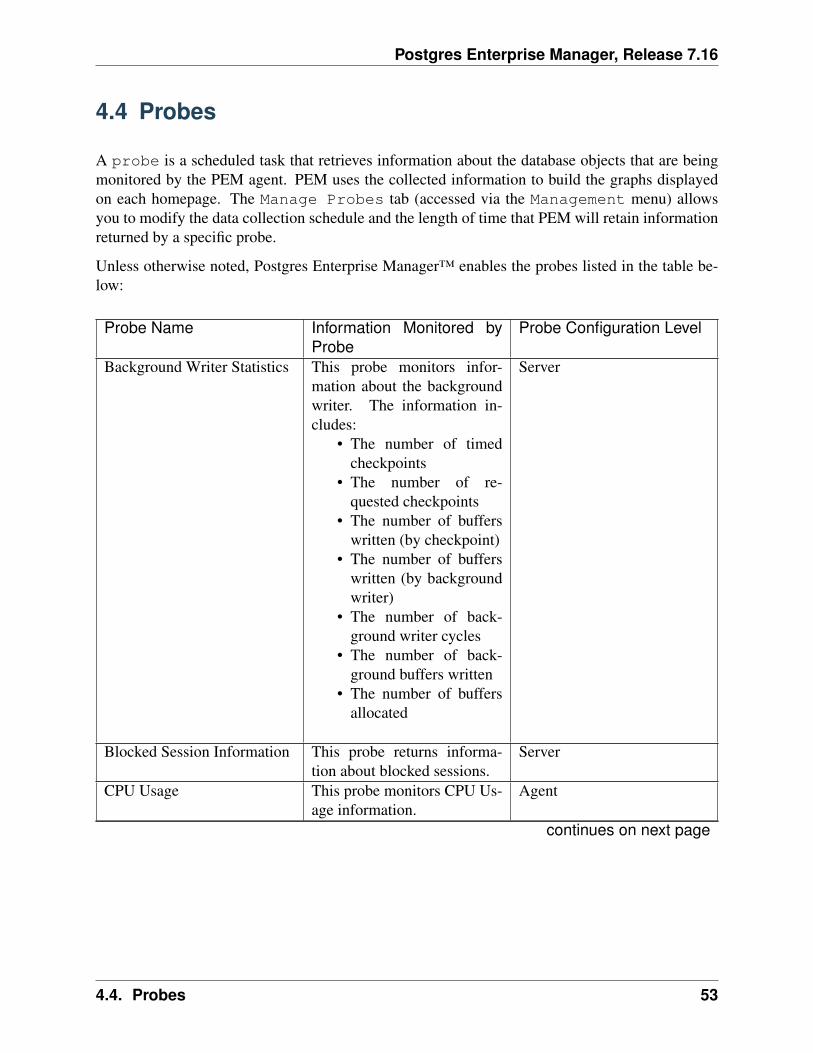
A probe is a scheduled task that retrieves information about the database objects that are beingmonitored by the PEM agent. PEM uses the collected information to build the graphs displayedon each homepage. The Manage Probes tab (accessed via the Management menu) allowsyou to modify the data collection schedule and the length of time that PEM will retain informationreturned by a specific probe.
Unless otherwise noted, Postgres Enterprise Manager™ enables the probes listed in the table be-low:
Probe Name Information Monitored byProbe
Probe Configuration Level
Background Writer Statistics This probe monitors infor-mation about the backgroundwriter. The information in-cludes:
• The number of timedcheckpoints
• The number of re-quested checkpoints
• The number of bufferswritten (by checkpoint)
• The number of bufferswritten (by backgroundwriter)
• The number of back-ground writer cycles
• The number of back-ground buffers written
• The number of buffersallocated
Server
Blocked Session Information This probe returns informa-tion about blocked sessions.
Server
CPU Usage This probe monitors CPU Us-age information.
Agent
continues on next page
4.4. Probes 53
Postgres Enterprise Manager, Release 7.16
Table 1 – continued from previous pageProbe Name Information Monitored by
ProbeProbe Configuration Level
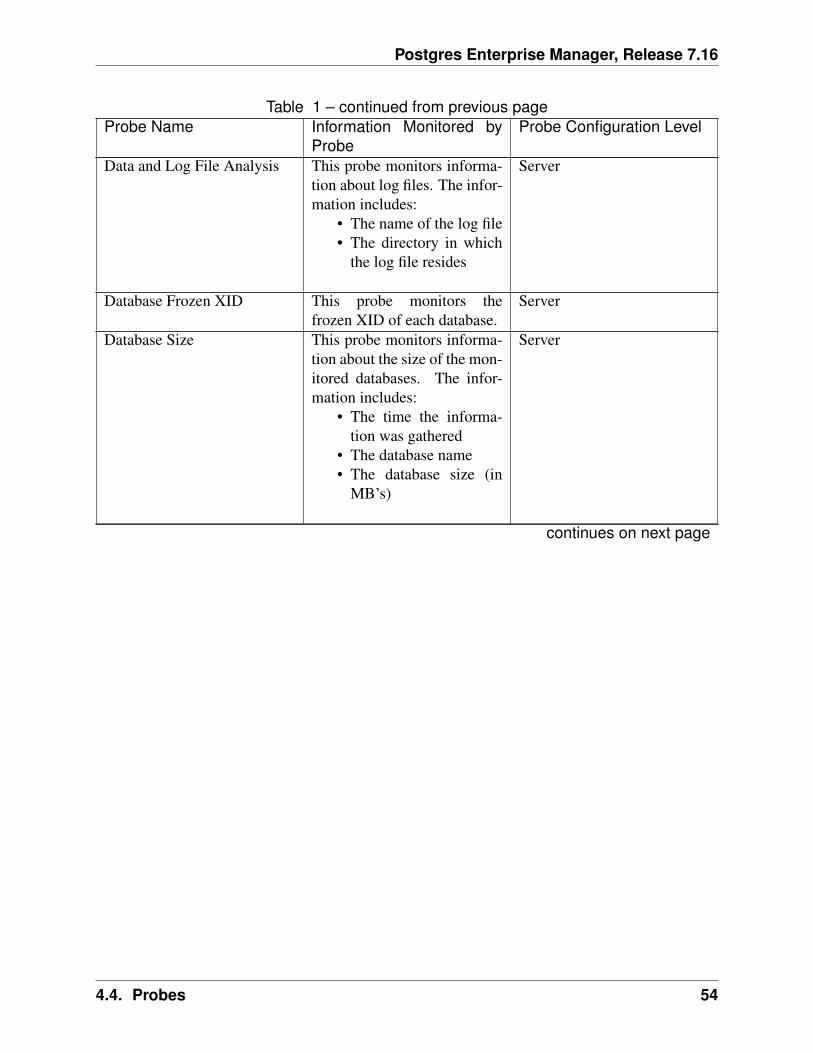
Data and Log File Analysis This probe monitors informa-tion about log files. The infor-mation includes:
• The name of the log file• The directory in which
the log file resides
Server
Database Frozen XID This probe monitors thefrozen XID of each database.
Server
Database Size This probe monitors informa-tion about the size of the mon-itored databases. The infor-mation includes:
• The time the informa-tion was gathered
• The database name• The database size (in
MB’s)
Server
continues on next page
4.4. Probes 54
Postgres Enterprise Manager, Release 7.16
Table 1 – continued from previous pageProbe Name Information Monitored by
ProbeProbe Configuration Level
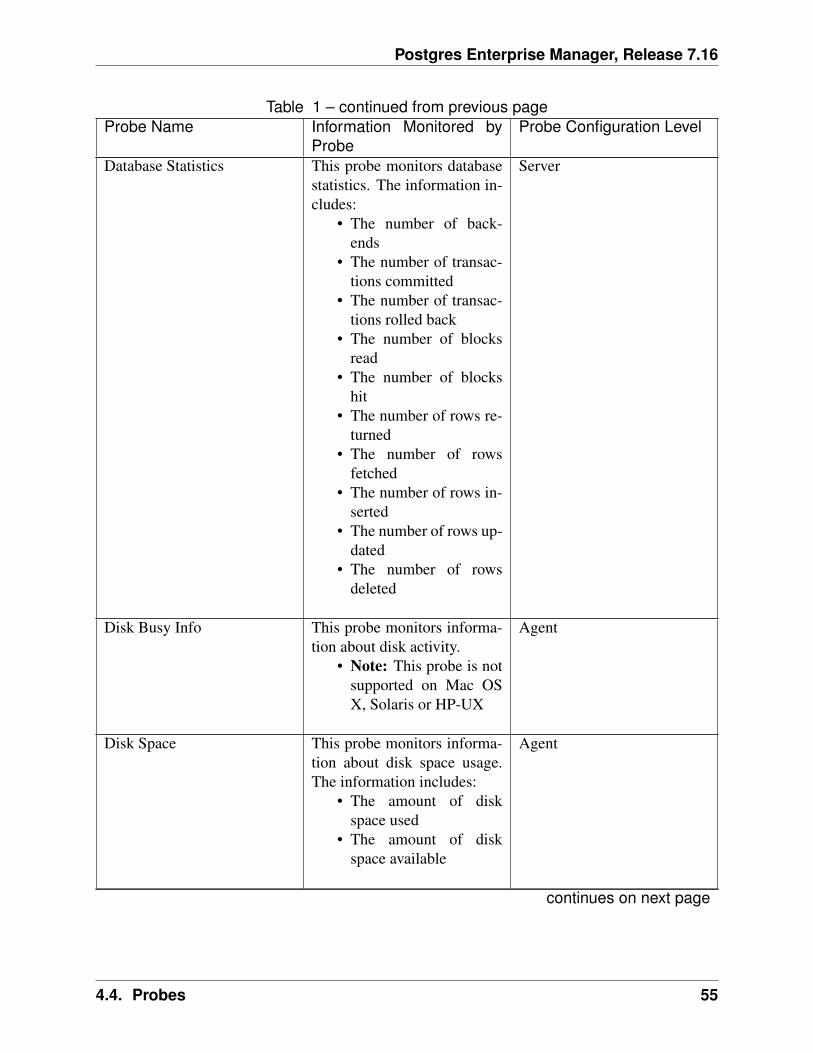
Database Statistics This probe monitors databasestatistics. The information in-cludes:
• The number of back-ends
• The number of transac-tions committed
• The number of transac-tions rolled back
• The number of blocksread
• The number of blockshit
• The number of rows re-turned
• The number of rowsfetched
• The number of rows in-serted
• The number of rows up-dated
• The number of rowsdeleted
Server
Disk Busy Info This probe monitors informa-tion about disk activity.
• Note: This probe is notsupported on Mac OSX, Solaris or HP-UX
Agent
Disk Space This probe monitors informa-tion about disk space usage.The information includes:
• The amount of diskspace used
• The amount of diskspace available
Agent
continues on next page
4.4. Probes 55
Postgres Enterprise Manager, Release 7.16
Table 1 – continued from previous pageProbe Name Information Monitored by
ProbeProbe Configuration Level
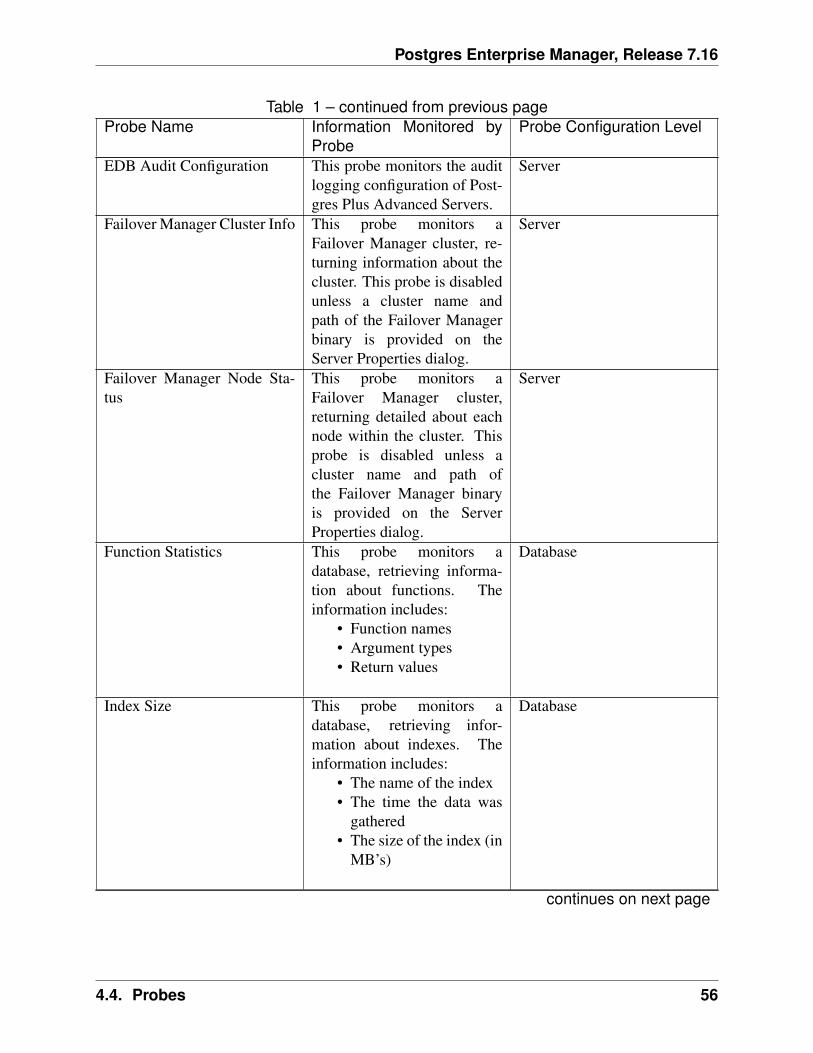
EDB Audit Configuration This probe monitors the auditlogging configuration of Post-gres Plus Advanced Servers.
Server
Failover Manager Cluster Info This probe monitors aFailover Manager cluster, re-turning information about thecluster. This probe is disabledunless a cluster name andpath of the Failover Managerbinary is provided on theServer Properties dialog.
Server
Failover Manager Node Sta-tus
This probe monitors aFailover Manager cluster,returning detailed about eachnode within the cluster. Thisprobe is disabled unless acluster name and path ofthe Failover Manager binaryis provided on the ServerProperties dialog.
Server
Function Statistics This probe monitors adatabase, retrieving informa-tion about functions. Theinformation includes:
• Function names• Argument types• Return values
Database
Index Size This probe monitors adatabase, retrieving infor-mation about indexes. Theinformation includes:
• The name of the index• The time the data was
gathered• The size of the index (in
MB’s)
Database
continues on next page
4.4. Probes 56
Postgres Enterprise Manager, Release 7.16
Table 1 – continued from previous pageProbe Name Information Monitored by
ProbeProbe Configuration Level
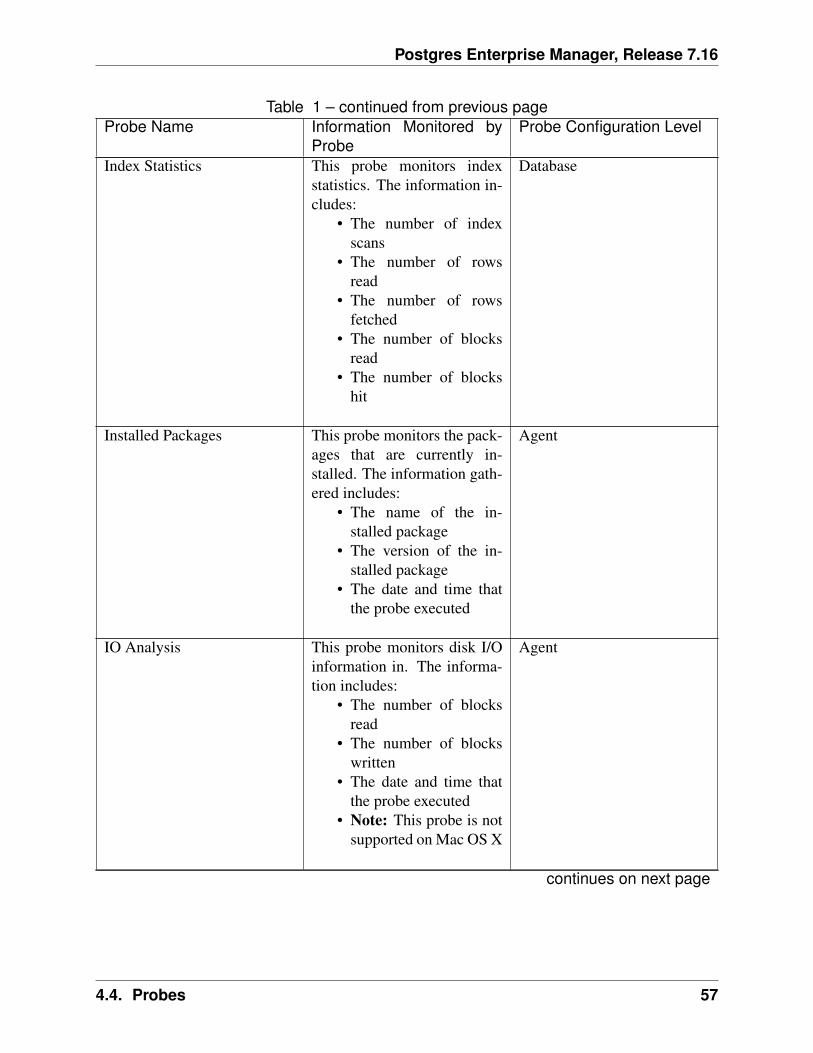
Index Statistics This probe monitors indexstatistics. The information in-cludes:
• The number of indexscans
• The number of rowsread
• The number of rowsfetched
• The number of blocksread
• The number of blockshit
Database
Installed Packages This probe monitors the pack-ages that are currently in-stalled. The information gath-ered includes:
• The name of the in-stalled package
• The version of the in-stalled package
• The date and time thatthe probe executed
Agent
IO Analysis This probe monitors disk I/Oinformation in. The informa-tion includes:
• The number of blocksread
• The number of blockswritten
• The date and time thatthe probe executed
• Note: This probe is notsupported on Mac OS X
Agent
continues on next page
4.4. Probes 57
Postgres Enterprise Manager, Release 7.16
Table 1 – continued from previous pageProbe Name Information Monitored by
ProbeProbe Configuration Level
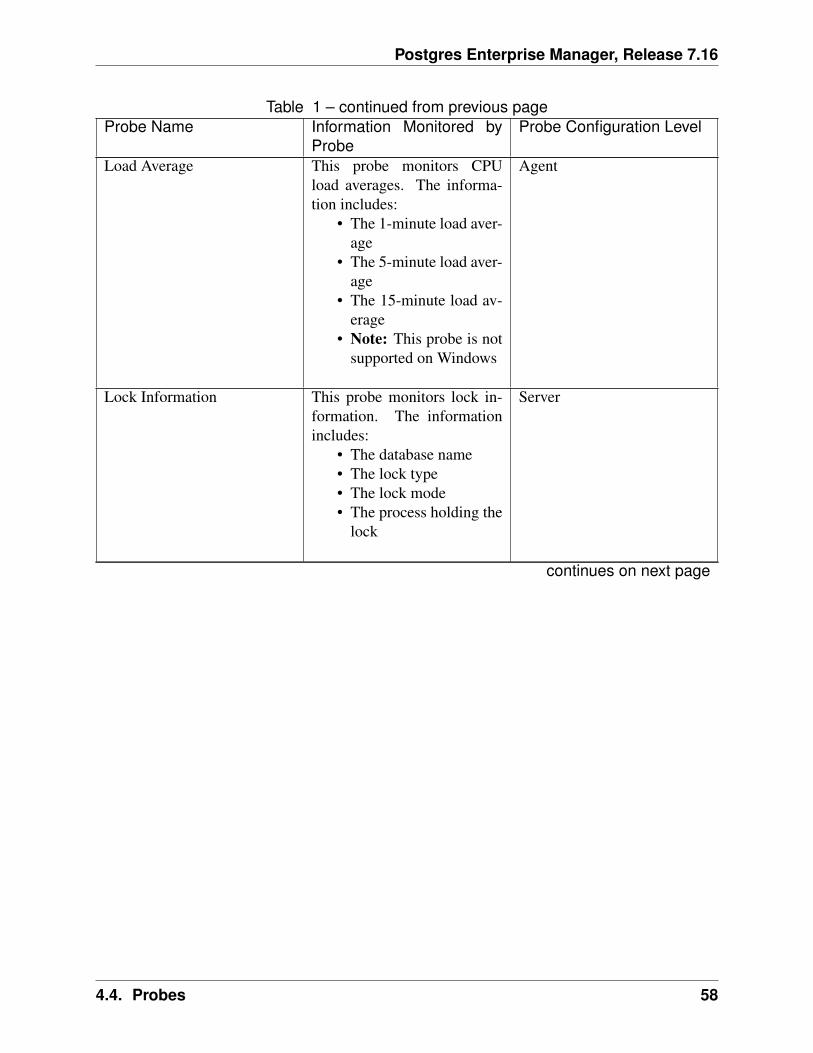
Load Average This probe monitors CPUload averages. The informa-tion includes:
• The 1-minute load aver-age
• The 5-minute load aver-age
• The 15-minute load av-erage
• Note: This probe is notsupported on Windows
Agent
Lock Information This probe monitors lock in-formation. The informationincludes:
• The database name• The lock type• The lock mode• The process holding the
lock
Server
continues on next page
4.4. Probes 58
Postgres Enterprise Manager, Release 7.16
Table 1 – continued from previous pageProbe Name Information Monitored by
ProbeProbe Configuration Level
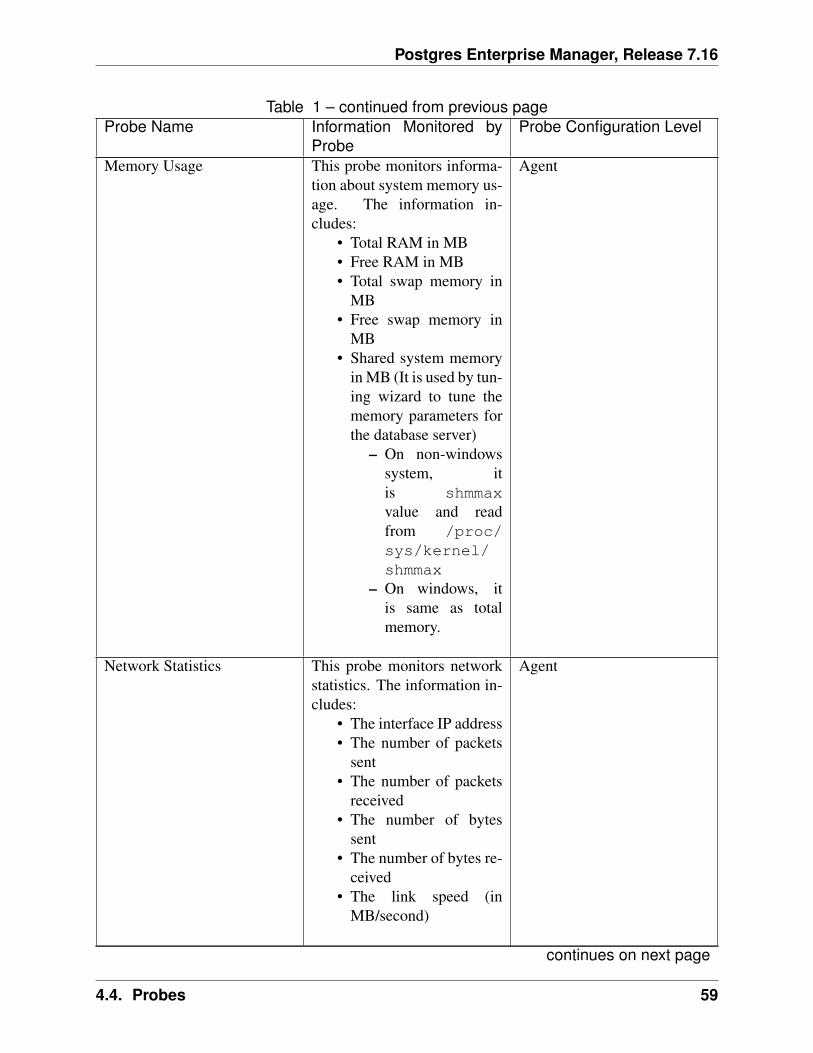
Memory Usage This probe monitors informa-tion about system memory us-age. The information in-cludes:
• Total RAM in MB• Free RAM in MB• Total swap memory in
MB• Free swap memory in
MB• Shared system memory
in MB (It is used by tun-ing wizard to tune thememory parameters forthe database server)
– On non-windowssystem, itis shmmaxvalue and readfrom /proc/sys/kernel/shmmax
– On windows, itis same as totalmemory.
Agent
Network Statistics This probe monitors networkstatistics. The information in-cludes:
• The interface IP address• The number of packets
sent• The number of packets
received• The number of bytes
sent• The number of bytes re-
ceived• The link speed (in
MB/second)
Agent
continues on next page
4.4. Probes 59
Postgres Enterprise Manager, Release 7.16
Table 1 – continued from previous pageProbe Name Information Monitored by
ProbeProbe Configuration Level
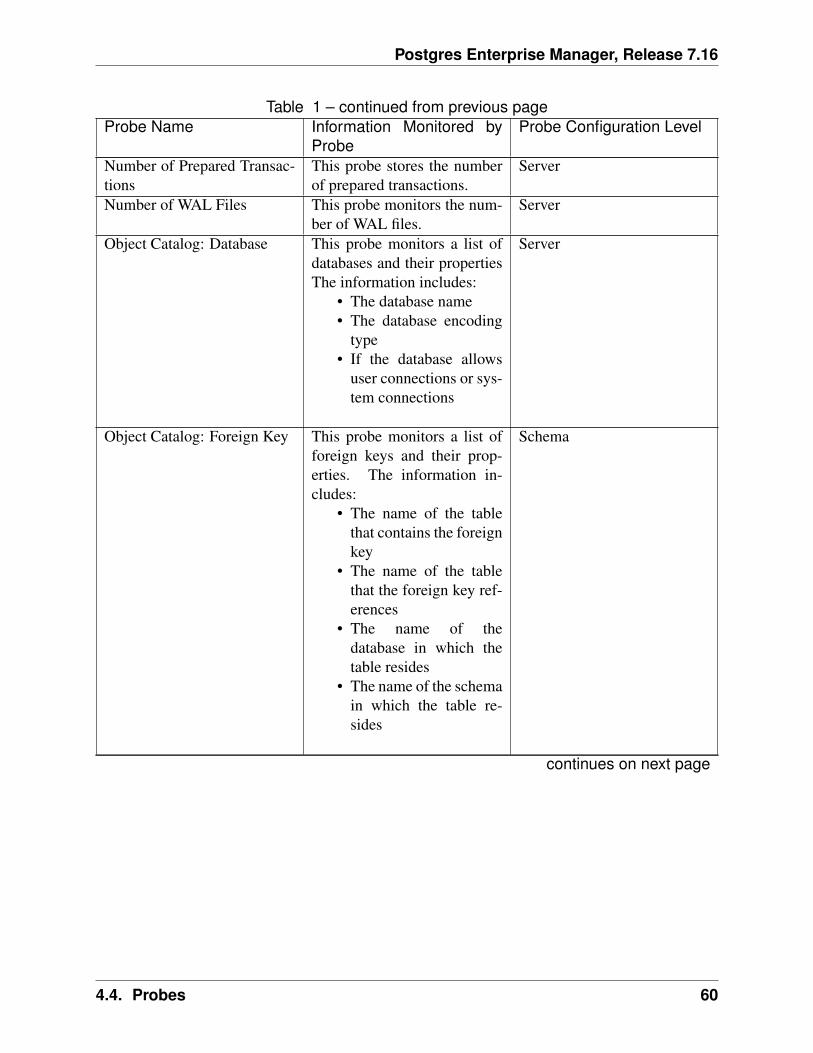
Number of Prepared Transac-tions
This probe stores the numberof prepared transactions.
Server
Number of WAL Files This probe monitors the num-ber of WAL files.
Server
Object Catalog: Database This probe monitors a list ofdatabases and their propertiesThe information includes:
• The database name• The database encoding
type• If the database allows
user connections or sys-tem connections
Server
Object Catalog: Foreign Key This probe monitors a list offoreign keys and their prop-erties. The information in-cludes:
• The name of the tablethat contains the foreignkey
• The name of the tablethat the foreign key ref-erences
• The name of thedatabase in which thetable resides
• The name of the schemain which the table re-sides
Schema
continues on next page
4.4. Probes 60
Postgres Enterprise Manager, Release 7.16
Table 1 – continued from previous pageProbe Name Information Monitored by
ProbeProbe Configuration Level
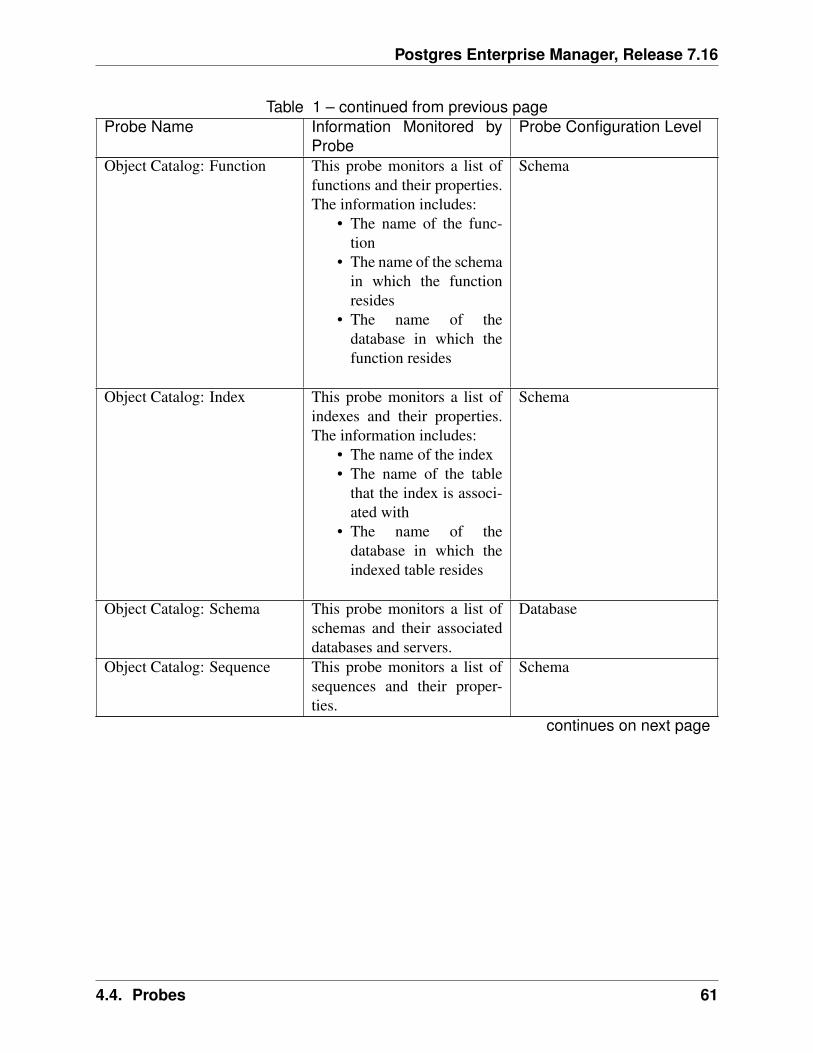
Object Catalog: Function This probe monitors a list offunctions and their properties.The information includes:
• The name of the func-tion
• The name of the schemain which the functionresides
• The name of thedatabase in which thefunction resides
Schema
Object Catalog: Index This probe monitors a list ofindexes and their properties.The information includes:
• The name of the index• The name of the table
that the index is associ-ated with
• The name of thedatabase in which theindexed table resides
Schema
Object Catalog: Schema This probe monitors a list ofschemas and their associateddatabases and servers.
Database
Object Catalog: Sequence This probe monitors a list ofsequences and their proper-ties.
Schema
continues on next page
4.4. Probes 61
Postgres Enterprise Manager, Release 7.16
Table 1 – continued from previous pageProbe Name Information Monitored by
ProbeProbe Configuration Level
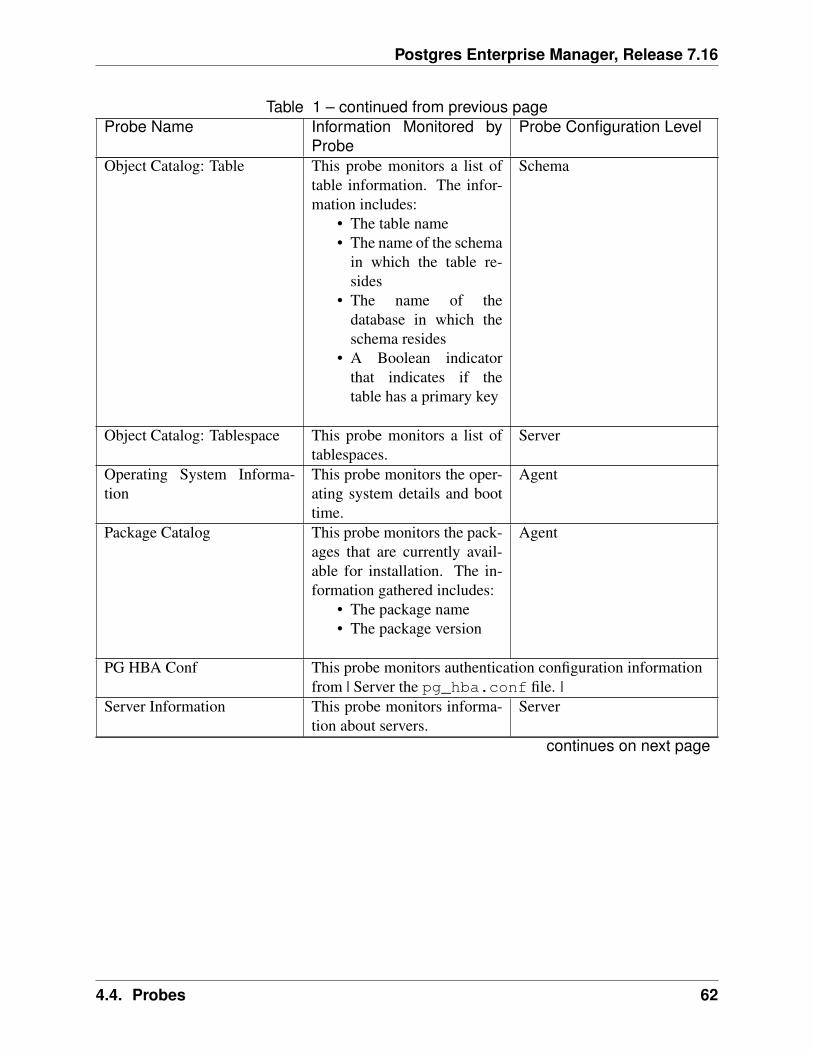
Object Catalog: Table This probe monitors a list oftable information. The infor-mation includes:
• The table name• The name of the schema
in which the table re-sides
• The name of thedatabase in which theschema resides
• A Boolean indicatorthat indicates if thetable has a primary key
Schema
Object Catalog: Tablespace This probe monitors a list oftablespaces.
Server
Operating System Informa-tion
This probe monitors the oper-ating system details and boottime.
Agent
Package Catalog This probe monitors the pack-ages that are currently avail-able for installation. The in-formation gathered includes:
• The package name• The package version
Agent
PG HBA Conf This probe monitors authentication configuration informationfrom | Server the pg_hba.conf file. |
Server Information This probe monitors informa-tion about servers.
Server
continues on next page
4.4. Probes 62
Postgres Enterprise Manager, Release 7.16
Table 1 – continued from previous pageProbe Name Information Monitored by
ProbeProbe Configuration Level
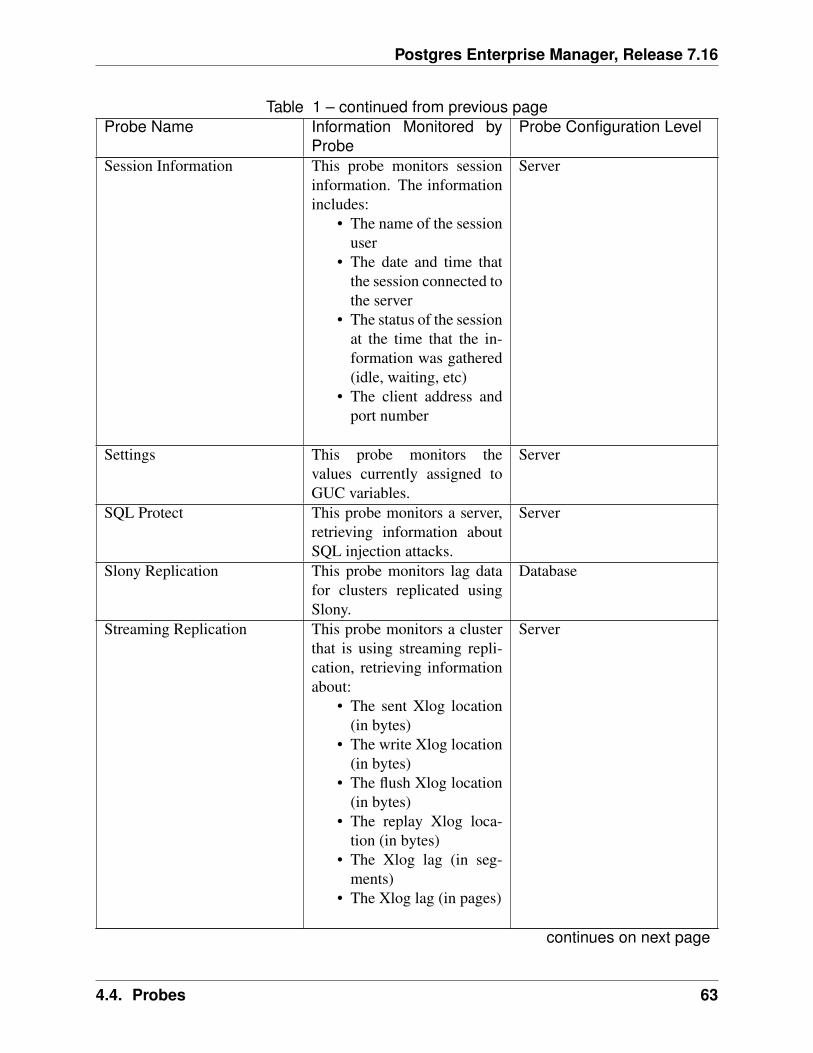
Session Information This probe monitors sessioninformation. The informationincludes:
• The name of the sessionuser
• The date and time thatthe session connected tothe server
• The status of the sessionat the time that the in-formation was gathered(idle, waiting, etc)
• The client address andport number
Server
Settings This probe monitors thevalues currently assigned toGUC variables.
Server
SQL Protect This probe monitors a server,retrieving information aboutSQL injection attacks.
Server
Slony Replication This probe monitors lag datafor clusters replicated usingSlony.
Database
Streaming Replication This probe monitors a clusterthat is using streaming repli-cation, retrieving informationabout:
• The sent Xlog location(in bytes)
• The write Xlog location(in bytes)
• The flush Xlog location(in bytes)
• The replay Xlog loca-tion (in bytes)
• The Xlog lag (in seg-ments)
• The Xlog lag (in pages)
Server
continues on next page
4.4. Probes 63
Postgres Enterprise Manager, Release 7.16
Table 1 – continued from previous pageProbe Name Information Monitored by
ProbeProbe Configuration Level
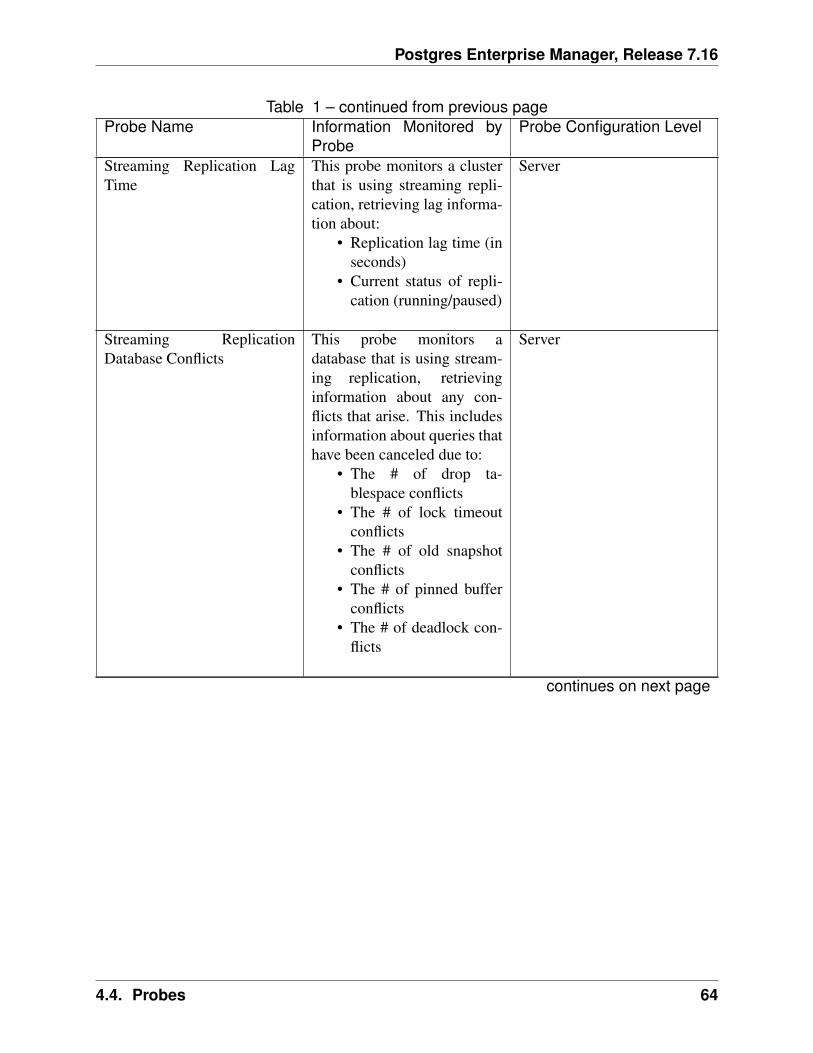
Streaming Replication LagTime
This probe monitors a clusterthat is using streaming repli-cation, retrieving lag informa-tion about:
• Replication lag time (inseconds)
• Current status of repli-cation (running/paused)
Server
Streaming ReplicationDatabase Conflicts
This probe monitors adatabase that is using stream-ing replication, retrievinginformation about any con-flicts that arise. This includesinformation about queries thathave been canceled due to:
• The # of drop ta-blespace conflicts
• The # of lock timeoutconflicts
• The # of old snapshotconflicts
• The # of pinned bufferconflicts
• The # of deadlock con-flicts
Server
continues on next page
4.4. Probes 64
Postgres Enterprise Manager, Release 7.16
Table 1 – continued from previous pageProbe Name Information Monitored by
ProbeProbe Configuration Level
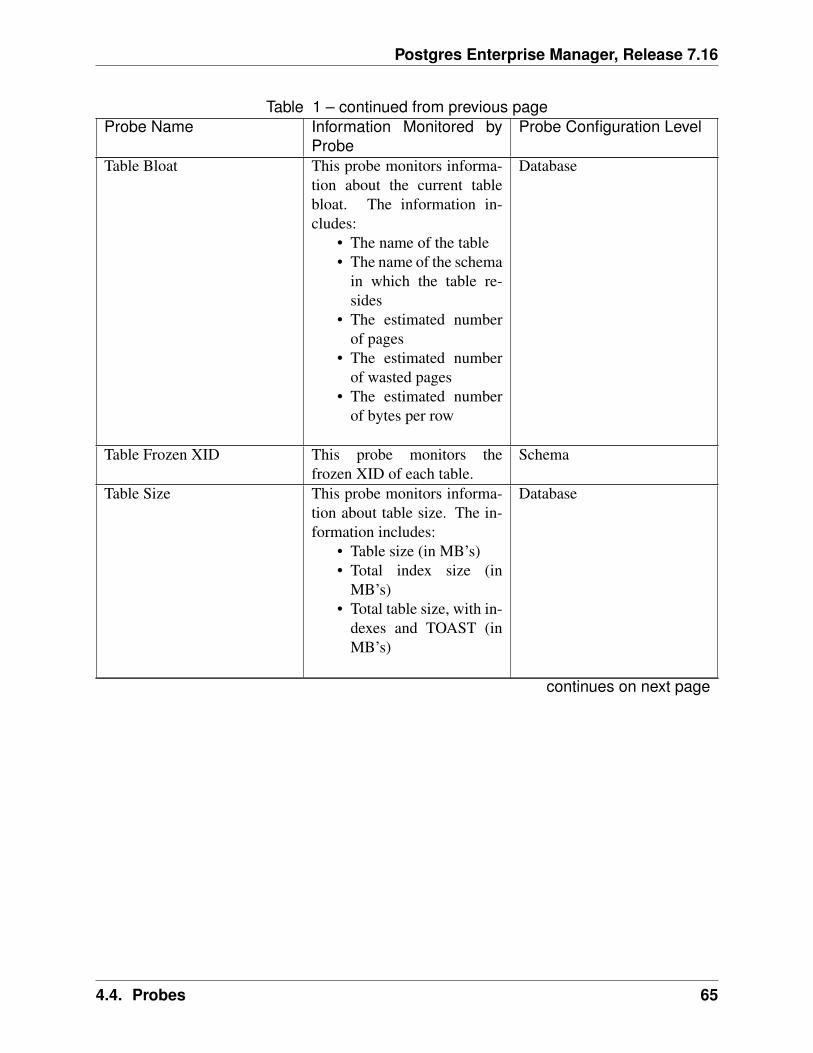
Table Bloat This probe monitors informa-tion about the current tablebloat. The information in-cludes:
• The name of the table• The name of the schema
in which the table re-sides
• The estimated numberof pages
• The estimated numberof wasted pages
• The estimated numberof bytes per row
Database
Table Frozen XID This probe monitors thefrozen XID of each table.
Schema
Table Size This probe monitors informa-tion about table size. The in-formation includes:
• Table size (in MB’s)• Total index size (in
MB’s)• Total table size, with in-
dexes and TOAST (inMB’s)
Database
continues on next page
4.4. Probes 65
Postgres Enterprise Manager, Release 7.16
Table 1 – continued from previous pageProbe Name Information Monitored by
ProbeProbe Configuration Level
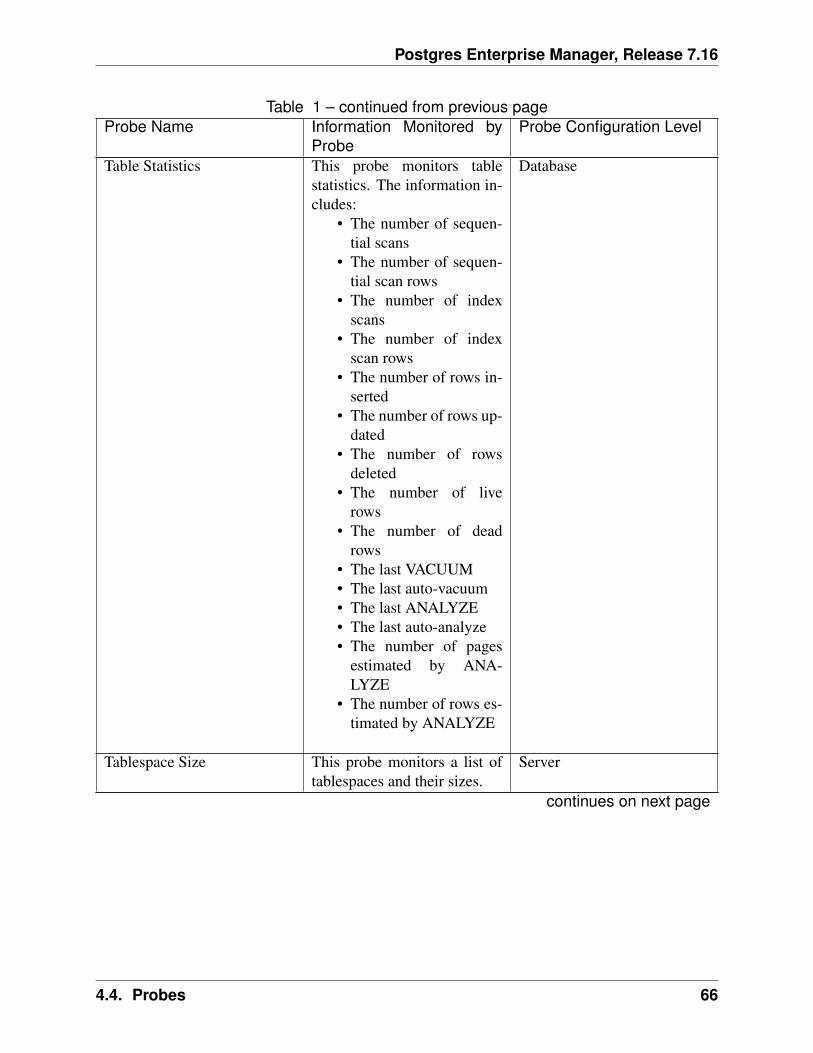
Table Statistics This probe monitors tablestatistics. The information in-cludes:
• The number of sequen-tial scans
• The number of sequen-tial scan rows
• The number of indexscans
• The number of indexscan rows
• The number of rows in-serted
• The number of rows up-dated
• The number of rowsdeleted
• The number of liverows
• The number of deadrows
• The last VACUUM• The last auto-vacuum• The last ANALYZE• The last auto-analyze• The number of pages
estimated by ANA-LYZE
• The number of rows es-timated by ANALYZE
Database
Tablespace Size This probe monitors a list oftablespaces and their sizes.
Server
continues on next page
4.4. Probes 66
Postgres Enterprise Manager, Release 7.16
Table 1 – continued from previous pageProbe Name Information Monitored by
ProbeProbe Configuration Level
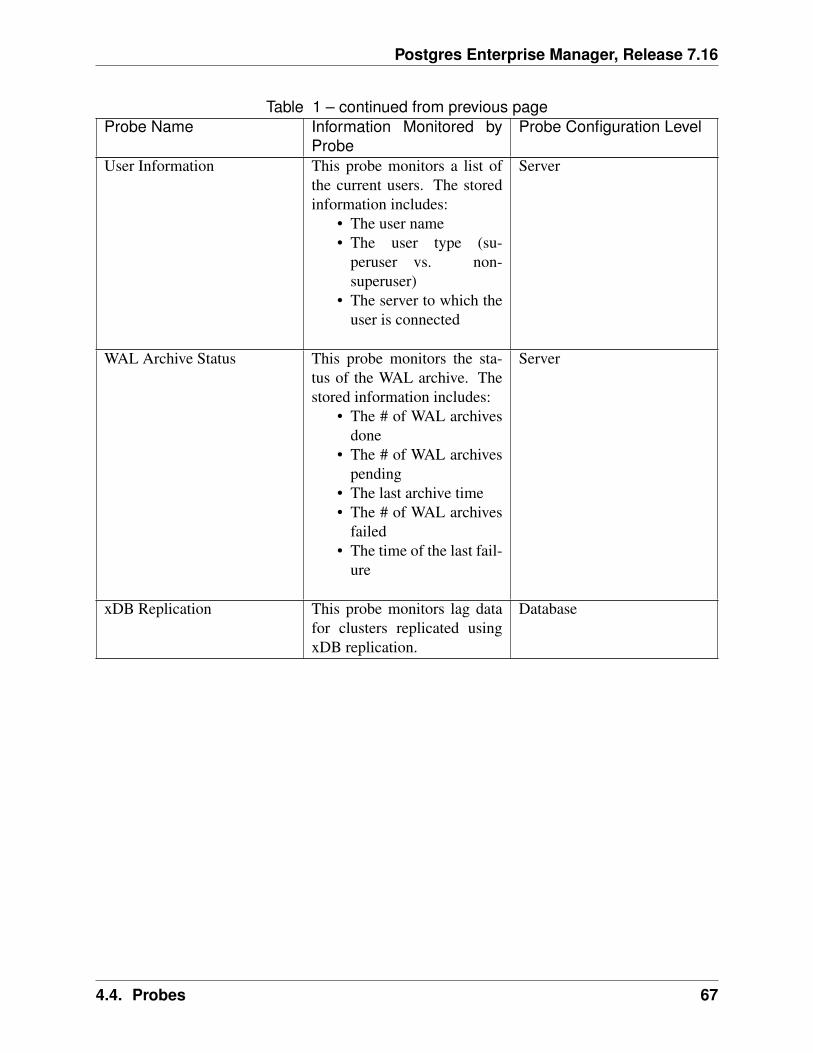
User Information This probe monitors a list ofthe current users. The storedinformation includes:
• The user name• The user type (su-
peruser vs. non-superuser)
• The server to which theuser is connected
Server
WAL Archive Status This probe monitors the sta-tus of the WAL archive. Thestored information includes:
• The # of WAL archivesdone
• The # of WAL archivespending
• The last archive time• The # of WAL archives
failed• The time of the last fail-
ure
Server
xDB Replication This probe monitors lag datafor clusters replicated usingxDB replication.
Database
4.4. Probes 67
Postgres Enterprise Manager, Release 7.16
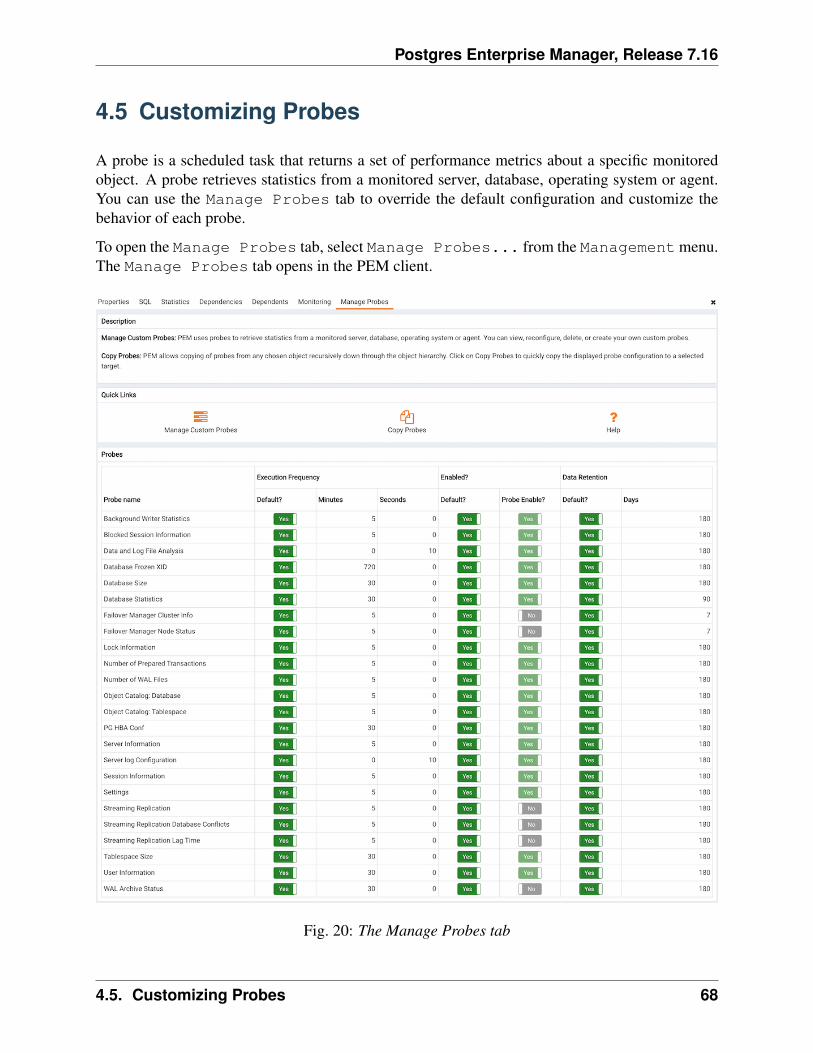
4.5 Customizing Probes
A probe is a scheduled task that returns a set of performance metrics about a specific monitoredobject. A probe retrieves statistics from a monitored server, database, operating system or agent.You can use the Manage Probes tab to override the default configuration and customize thebehavior of each probe.
To open the Manage Probes tab, select Manage Probes... from the Management menu.The Manage Probes tab opens in the PEM client.
Fig. 20: The Manage Probes tab
4.5. Customizing Probes 68
Postgres Enterprise Manager, Release 7.16
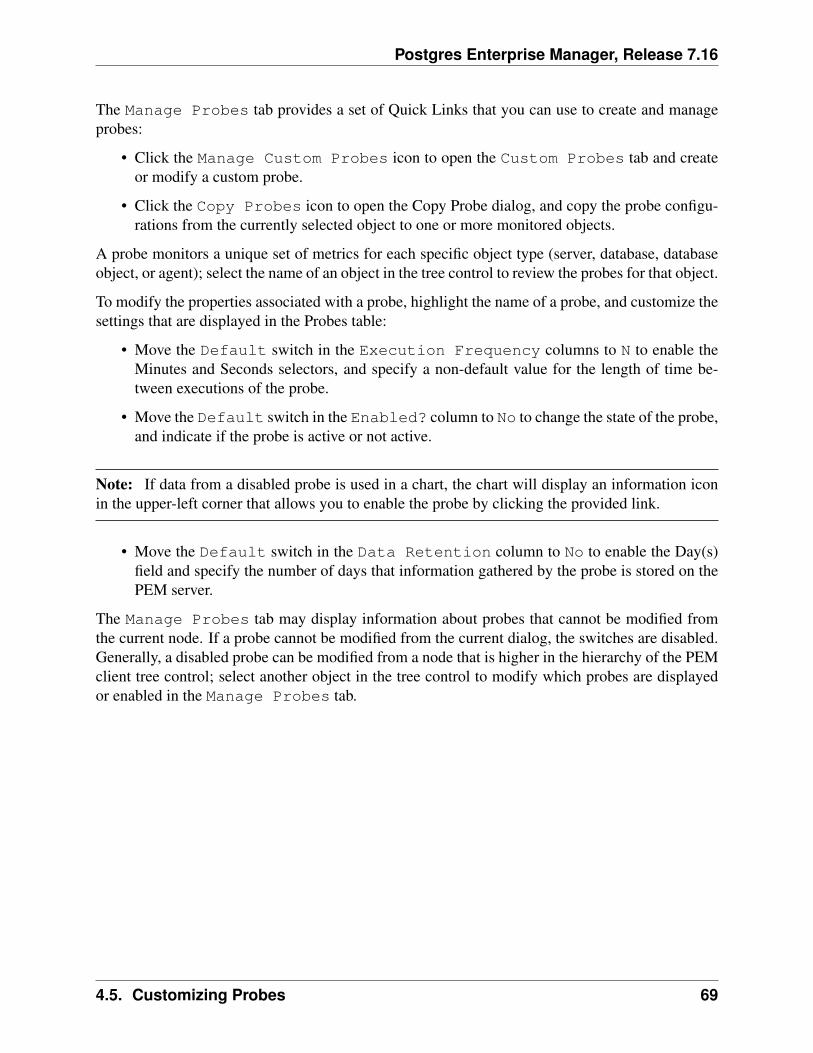
The Manage Probes tab provides a set of Quick Links that you can use to create and manageprobes:
• Click the Manage Custom Probes icon to open the Custom Probes tab and createor modify a custom probe.
• Click the Copy Probes icon to open the Copy Probe dialog, and copy the probe configu-rations from the currently selected object to one or more monitored objects.
A probe monitors a unique set of metrics for each specific object type (server, database, databaseobject, or agent); select the name of an object in the tree control to review the probes for that object.
To modify the properties associated with a probe, highlight the name of a probe, and customize thesettings that are displayed in the Probes table:
• Move the Default switch in the Execution Frequency columns to N to enable theMinutes and Seconds selectors, and specify a non-default value for the length of time be-tween executions of the probe.
• Move the Default switch in the Enabled? column to No to change the state of the probe,and indicate if the probe is active or not active.
Note: If data from a disabled probe is used in a chart, the chart will display an information iconin the upper-left corner that allows you to enable the probe by clicking the provided link.
• Move the Default switch in the Data Retention column to No to enable the Day(s)field and specify the number of days that information gathered by the probe is stored on thePEM server.
The Manage Probes tab may display information about probes that cannot be modified fromthe current node. If a probe cannot be modified from the current dialog, the switches are disabled.Generally, a disabled probe can be modified from a node that is higher in the hierarchy of the PEMclient tree control; select another object in the tree control to modify which probes are displayedor enabled in the Manage Probes tab.
4.5. Customizing Probes 69
Postgres Enterprise Manager, Release 7.16
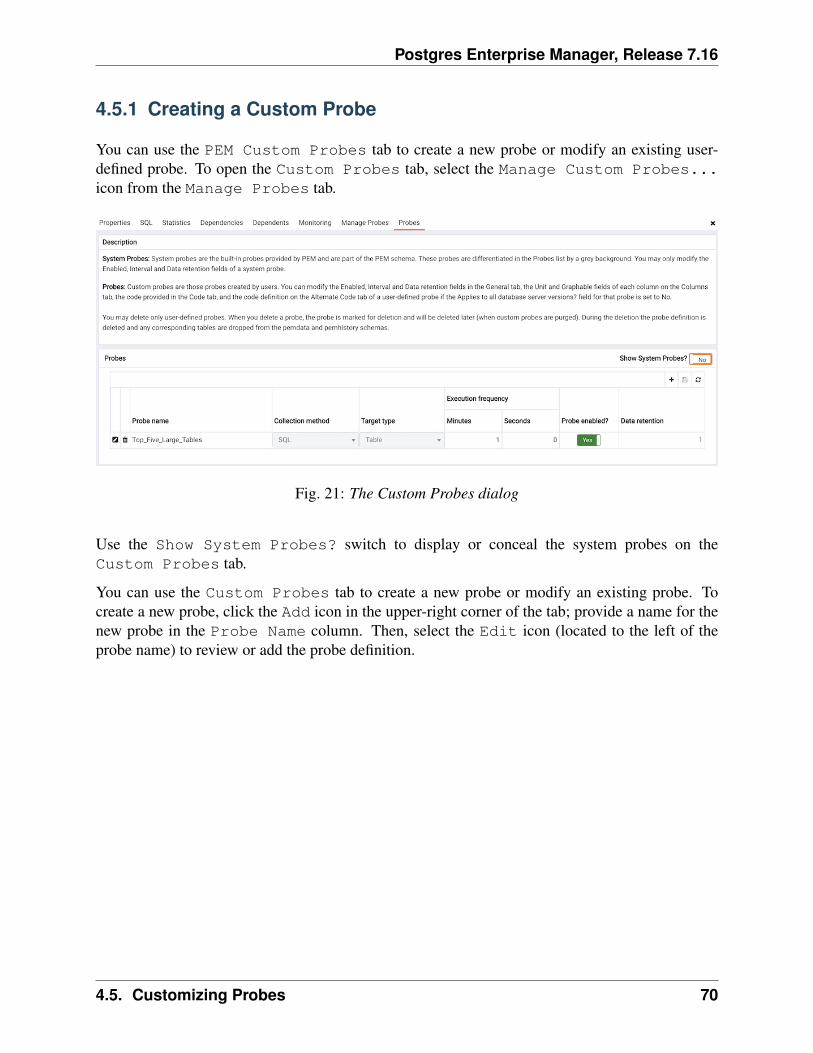
4.5.1 Creating a Custom Probe
You can use the PEM Custom Probes tab to create a new probe or modify an existing user-defined probe. To open the Custom Probes tab, select the Manage Custom Probes...icon from the Manage Probes tab.
Fig. 21: The Custom Probes dialog
Use the Show System Probes? switch to display or conceal the system probes on theCustom Probes tab.
You can use the Custom Probes tab to create a new probe or modify an existing probe. Tocreate a new probe, click the Add icon in the upper-right corner of the tab; provide a name for thenew probe in the Probe Name column. Then, select the Edit icon (located to the left of theprobe name) to review or add the probe definition.
4.5. Customizing Probes 70
Postgres Enterprise Manager, Release 7.16
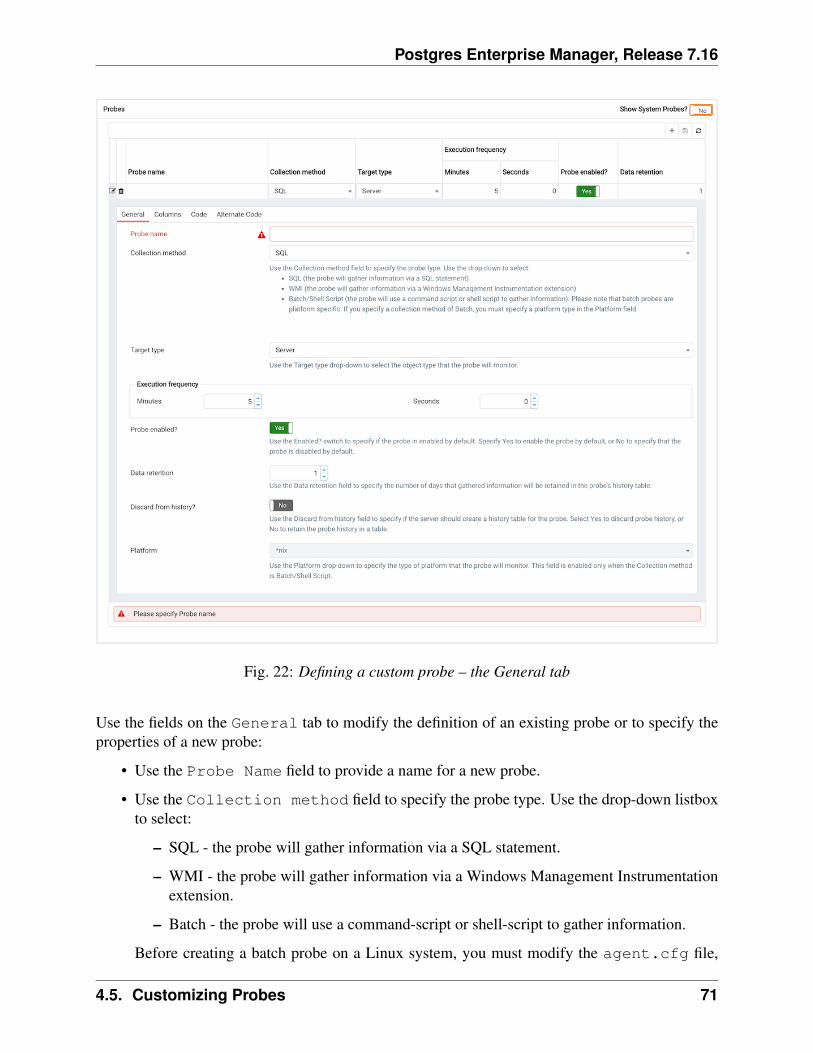
Fig. 22: Defining a custom probe – the General tab
Use the fields on the General tab to modify the definition of an existing probe or to specify theproperties of a new probe:
• Use the Probe Name field to provide a name for a new probe.
• Use the Collection method field to specify the probe type. Use the drop-down listboxto select:
– SQL - the probe will gather information via a SQL statement.
– WMI - the probe will gather information via a Windows Management Instrumentationextension.
– Batch - the probe will use a command-script or shell-script to gather information.
Before creating a batch probe on a Linux system, you must modify the agent.cfg file,
4.5. Customizing Probes 71
Postgres Enterprise Manager, Release 7.16
setting the allow_batch_probes parameter equal to true, and restart the PEM agent.The agent.cfg file is located in one of the following directories:
– If you have installed PEM using graphical installer: /opt/edb/pem/agent/etc/agent.cfg
– If you have installed PEM using RPM: /usr/edb/pem/agent/etc/agent.cfg
On 64-bit Windows systems, agent settings are stored in the registry. Before creating a batchprobe, modify the registry entry for the AllowBatchProbes registry entry and restart thePEM agent. PEM registry entries are located in HKEY_LOCAL_MACHINE\Software\Wow6432Node\EnterpriseDB\PEM\agent.
Please note that batch probes are platform-specific. If you specify a collection method ofBatch, you must specify a platform type in the Platform field.
To invoke a script on a Linux system, you must modify the entry forbatch_script_user parameter of agent.cfg file and specify the user thatshould be used to run the script. You can either specify a non-root user or root for thisparameter. If you do not specify a user, or the specified user does not exist, then the scriptwill not be executed. Restart the agent after modifying the file.
To invoke a script on a Windows system, set the registry entry for AllowBatchJobStepsto true and restart the PEM agent.
• Use the Target Type drop-down listbox to select the object type that the probe will mon-itor. Target type is disabled if Collection method is WMI.
• Use the Minutes and Seconds selectors to specify how often the probe will collect data.
• Use the Probe Enable? switch to specify if the probe in enabled by default. Specify Yesto enable the probe by default, or No to specify that the probe is disabled by default.
Note: If data from a disabled probe is used in a chart, the chart will display an information iconin the upper-left corner that allows you to enable the probe by clicking the provided link.
• Use the Data Retention field to specify the number of days that gathered informationwill be retained in the probe’s history table.
• Use the switch next to Discard from history to specify if the server should create ahistory table for the probe. Select Yes to discard probe history, or No to retain the probehistory in a table.
• Use the Platform drop-down listbox to specify the type of platform that the probe willmonitor. This field is enabled only when the Collection method is Batch.
4.5. Customizing Probes 72
Postgres Enterprise Manager, Release 7.16
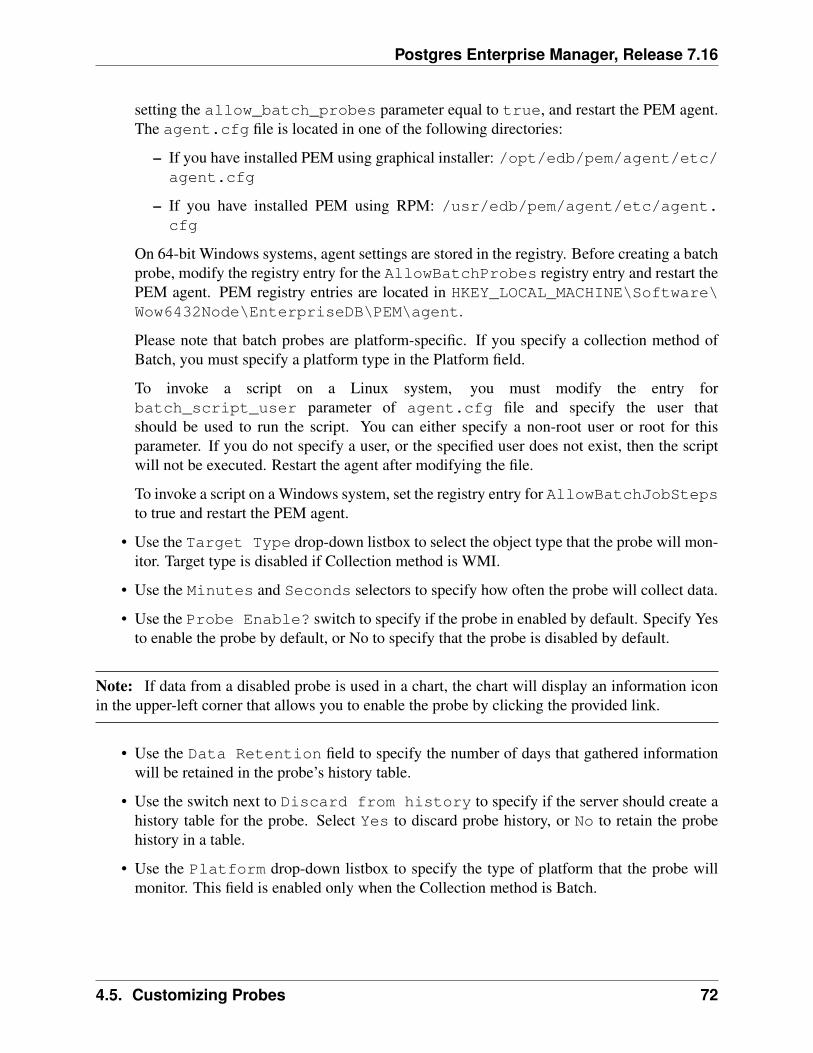
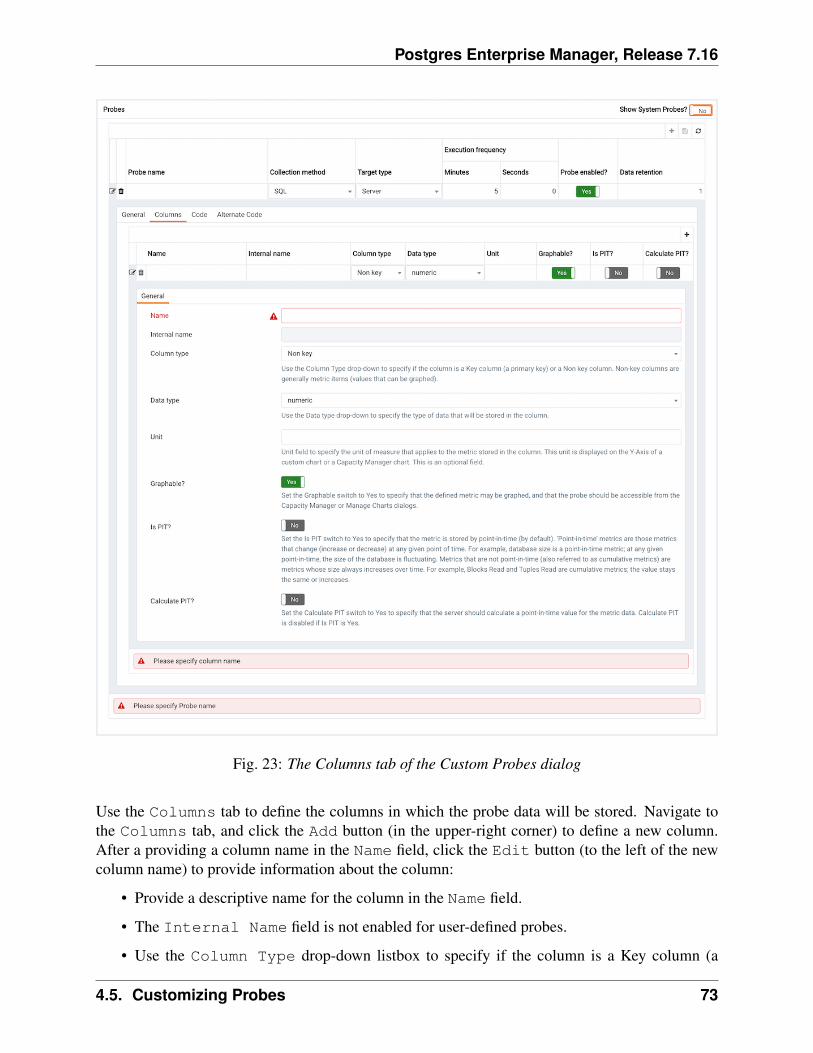
Fig. 23: The Columns tab of the Custom Probes dialog
Use the Columns tab to define the columns in which the probe data will be stored. Navigate tothe Columns tab, and click the Add button (in the upper-right corner) to define a new column.After a providing a column name in the Name field, click the Edit button (to the left of the newcolumn name) to provide information about the column:
• Provide a descriptive name for the column in the Name field.
• The Internal Name field is not enabled for user-defined probes.
• Use the Column Type drop-down listbox to specify if the column is a Key column (a
4.5. Customizing Probes 73
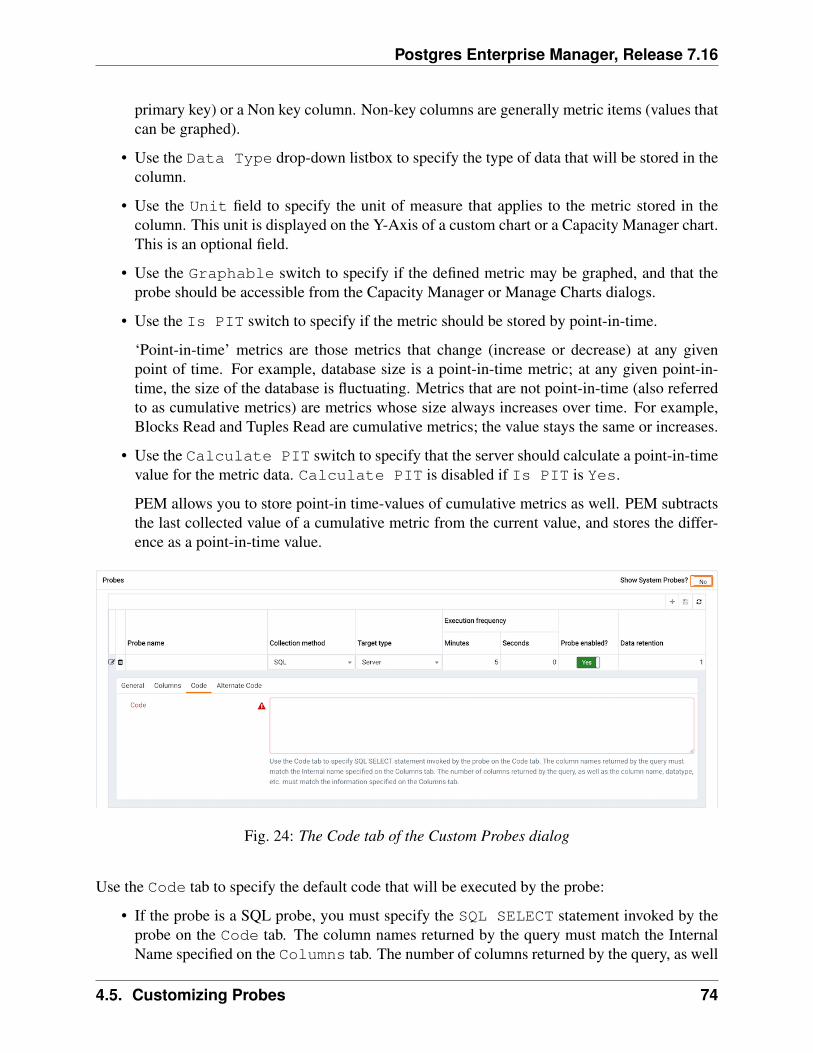
Postgres Enterprise Manager, Release 7.16
primary key) or a Non key column. Non-key columns are generally metric items (values thatcan be graphed).
• Use the Data Type drop-down listbox to specify the type of data that will be stored in thecolumn.
• Use the Unit field to specify the unit of measure that applies to the metric stored in thecolumn. This unit is displayed on the Y-Axis of a custom chart or a Capacity Manager chart.This is an optional field.
• Use the Graphable switch to specify if the defined metric may be graphed, and that theprobe should be accessible from the Capacity Manager or Manage Charts dialogs.
• Use the Is PIT switch to specify if the metric should be stored by point-in-time.
‘Point-in-time’ metrics are those metrics that change (increase or decrease) at any givenpoint of time. For example, database size is a point-in-time metric; at any given point-in-time, the size of the database is fluctuating. Metrics that are not point-in-time (also referredto as cumulative metrics) are metrics whose size always increases over time. For example,Blocks Read and Tuples Read are cumulative metrics; the value stays the same or increases.
• Use the Calculate PIT switch to specify that the server should calculate a point-in-timevalue for the metric data. Calculate PIT is disabled if Is PIT is Yes.
PEM allows you to store point-in time-values of cumulative metrics as well. PEM subtractsthe last collected value of a cumulative metric from the current value, and stores the differ-ence as a point-in-time value.
Fig. 24: The Code tab of the Custom Probes dialog
Use the Code tab to specify the default code that will be executed by the probe:
• If the probe is a SQL probe, you must specify the SQL SELECT statement invoked by theprobe on the Code tab. The column names returned by the query must match the InternalName specified on the Columns tab. The number of columns returned by the query, as well
4.5. Customizing Probes 74
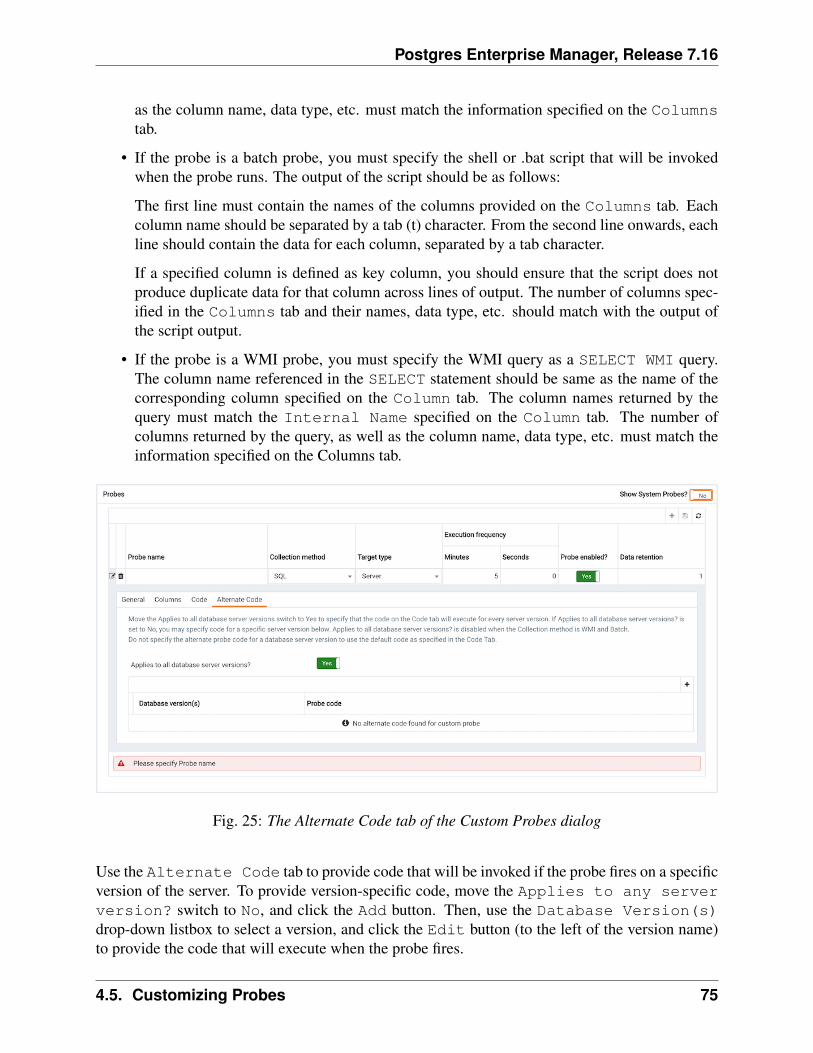
Postgres Enterprise Manager, Release 7.16
as the column name, data type, etc. must match the information specified on the Columnstab.
• If the probe is a batch probe, you must specify the shell or .bat script that will be invokedwhen the probe runs. The output of the script should be as follows:
The first line must contain the names of the columns provided on the Columns tab. Eachcolumn name should be separated by a tab (t) character. From the second line onwards, eachline should contain the data for each column, separated by a tab character.
If a specified column is defined as key column, you should ensure that the script does notproduce duplicate data for that column across lines of output. The number of columns spec-ified in the Columns tab and their names, data type, etc. should match with the output ofthe script output.
• If the probe is a WMI probe, you must specify the WMI query as a SELECT WMI query.The column name referenced in the SELECT statement should be same as the name of thecorresponding column specified on the Column tab. The column names returned by thequery must match the Internal Name specified on the Column tab. The number ofcolumns returned by the query, as well as the column name, data type, etc. must match theinformation specified on the Columns tab.
Fig. 25: The Alternate Code tab of the Custom Probes dialog
Use the Alternate Code tab to provide code that will be invoked if the probe fires on a specificversion of the server. To provide version-specific code, move the Applies to any serverversion? switch to No, and click the Add button. Then, use the Database Version(s)drop-down listbox to select a version, and click the Edit button (to the left of the version name)to provide the code that will execute when the probe fires.
4.5. Customizing Probes 75
Postgres Enterprise Manager, Release 7.16
If you select a database version, and leave the Probe Code column blank, PEM will invoke thecode specified on the Code tab when the probe executes on a server that matches that version.
When you’ve finished defining the probe, click the Save icon (in the corner of the CustomProbes tab) to save the definition, and make the probe data available for use on custom chartsand graphs.
4.5. Customizing Probes 76
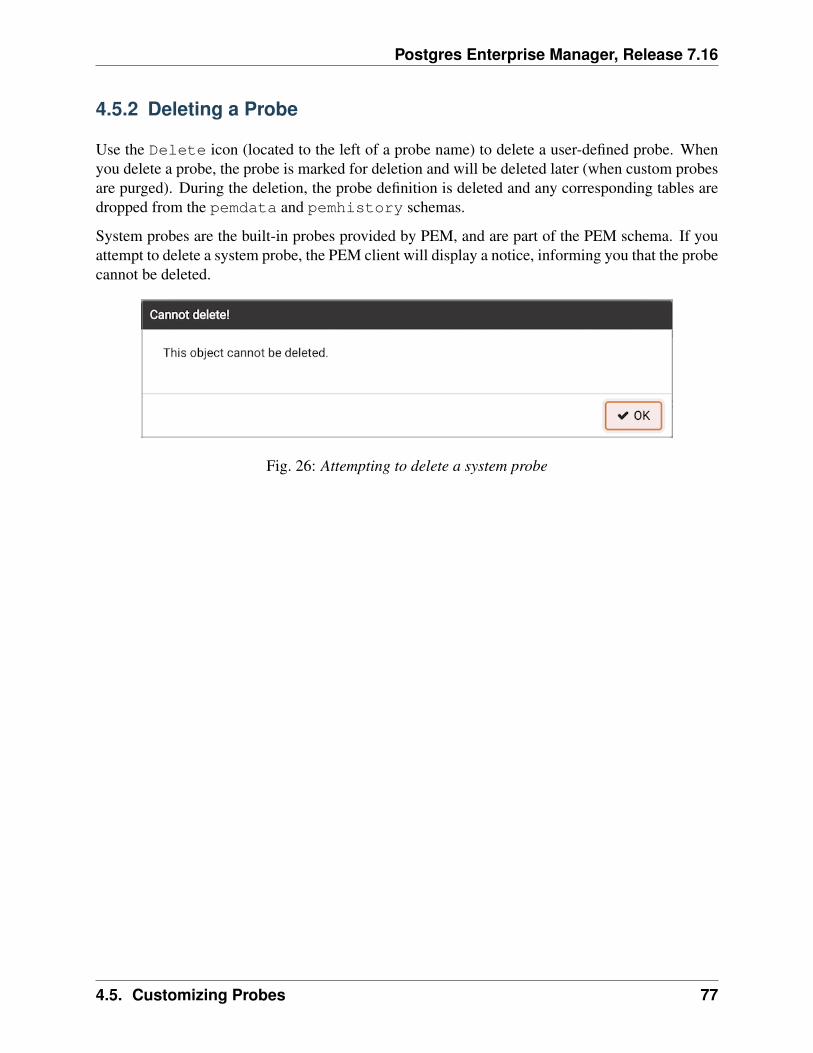
Postgres Enterprise Manager, Release 7.16
4.5.2 Deleting a Probe
Use the Delete icon (located to the left of a probe name) to delete a user-defined probe. Whenyou delete a probe, the probe is marked for deletion and will be deleted later (when custom probesare purged). During the deletion, the probe definition is deleted and any corresponding tables aredropped from the pemdata and pemhistory schemas.
System probes are the built-in probes provided by PEM, and are part of the PEM schema. If youattempt to delete a system probe, the PEM client will display a notice, informing you that the probecannot be deleted.
Fig. 26: Attempting to delete a system probe
4.5. Customizing Probes 77
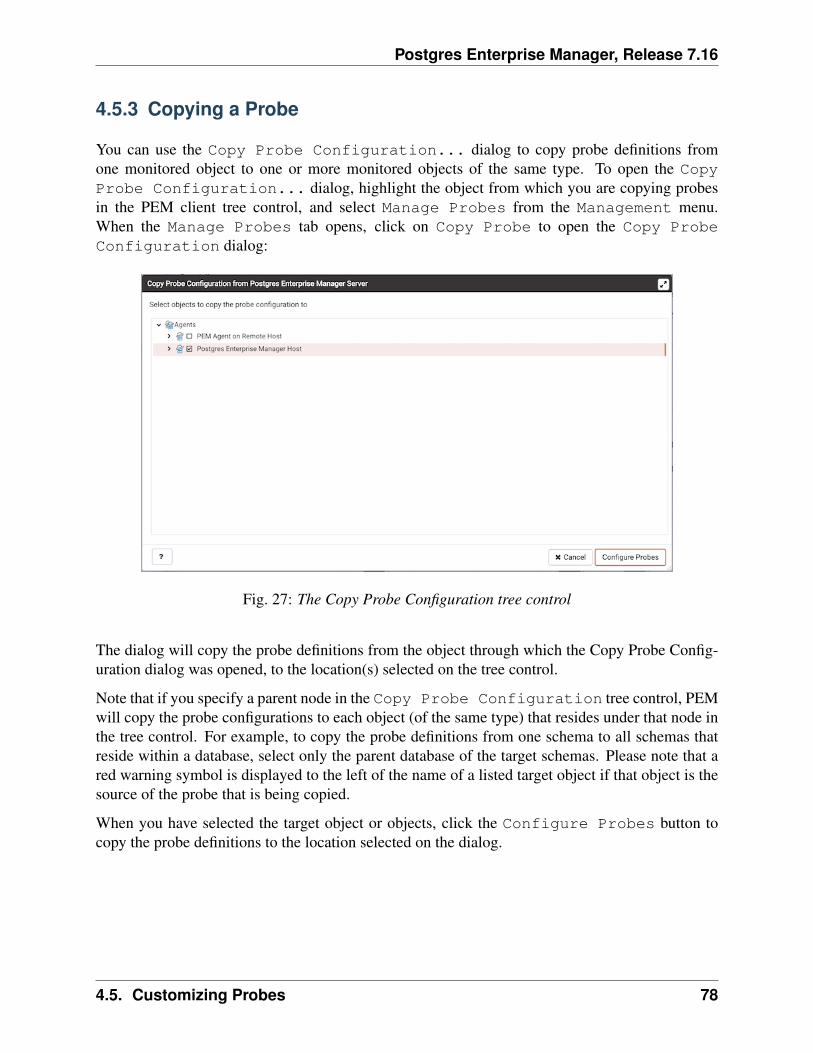
Postgres Enterprise Manager, Release 7.16
4.5.3 Copying a Probe
You can use the Copy Probe Configuration... dialog to copy probe definitions fromone monitored object to one or more monitored objects of the same type. To open the CopyProbe Configuration... dialog, highlight the object from which you are copying probesin the PEM client tree control, and select Manage Probes from the Management menu.When the Manage Probes tab opens, click on Copy Probe to open the Copy ProbeConfiguration dialog:
Fig. 27: The Copy Probe Configuration tree control
The dialog will copy the probe definitions from the object through which the Copy Probe Config-uration dialog was opened, to the location(s) selected on the tree control.
Note that if you specify a parent node in the Copy Probe Configuration tree control, PEMwill copy the probe configurations to each object (of the same type) that resides under that node inthe tree control. For example, to copy the probe definitions from one schema to all schemas thatreside within a database, select only the parent database of the target schemas. Please note that ared warning symbol is displayed to the left of the name of a listed target object if that object is thesource of the probe that is being copied.
When you have selected the target object or objects, click the Configure Probes button tocopy the probe definitions to the location selected on the dialog.
4.5. Customizing Probes 78
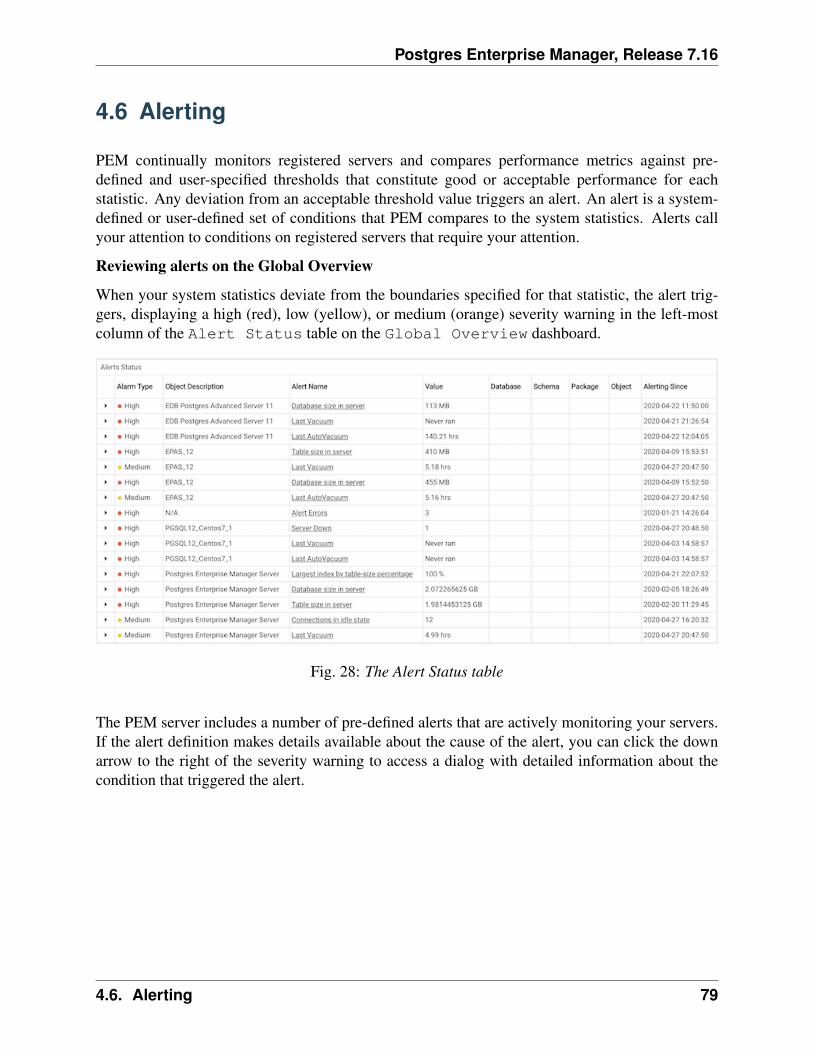
Postgres Enterprise Manager, Release 7.16
4.6 Alerting
PEM continually monitors registered servers and compares performance metrics against pre-defined and user-specified thresholds that constitute good or acceptable performance for eachstatistic. Any deviation from an acceptable threshold value triggers an alert. An alert is a system-defined or user-defined set of conditions that PEM compares to the system statistics. Alerts callyour attention to conditions on registered servers that require your attention.
Reviewing alerts on the Global Overview
When your system statistics deviate from the boundaries specified for that statistic, the alert trig-gers, displaying a high (red), low (yellow), or medium (orange) severity warning in the left-mostcolumn of the Alert Status table on the Global Overview dashboard.
Fig. 28: The Alert Status table
The PEM server includes a number of pre-defined alerts that are actively monitoring your servers.If the alert definition makes details available about the cause of the alert, you can click the downarrow to the right of the severity warning to access a dialog with detailed information about thecondition that triggered the alert.
4.6. Alerting 79
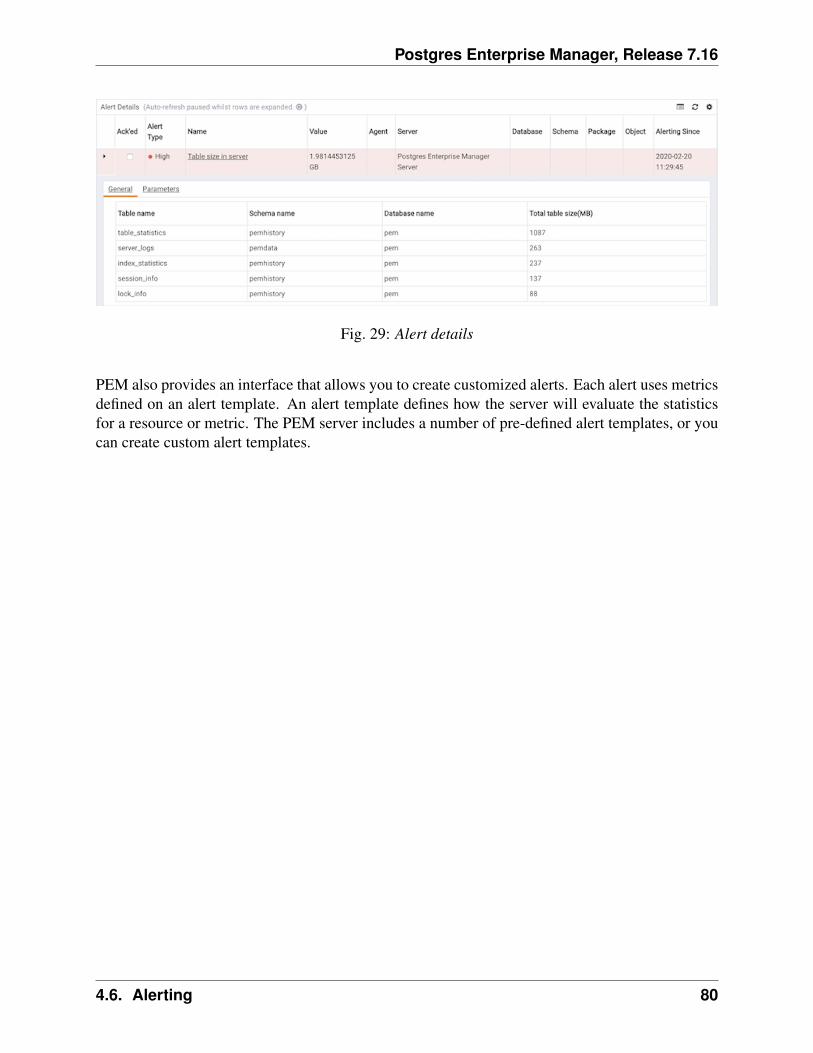
Postgres Enterprise Manager, Release 7.16
Fig. 29: Alert details
PEM also provides an interface that allows you to create customized alerts. Each alert uses metricsdefined on an alert template. An alert template defines how the server will evaluate the statisticsfor a resource or metric. The PEM server includes a number of pre-defined alert templates, or youcan create custom alert templates.
4.6. Alerting 80
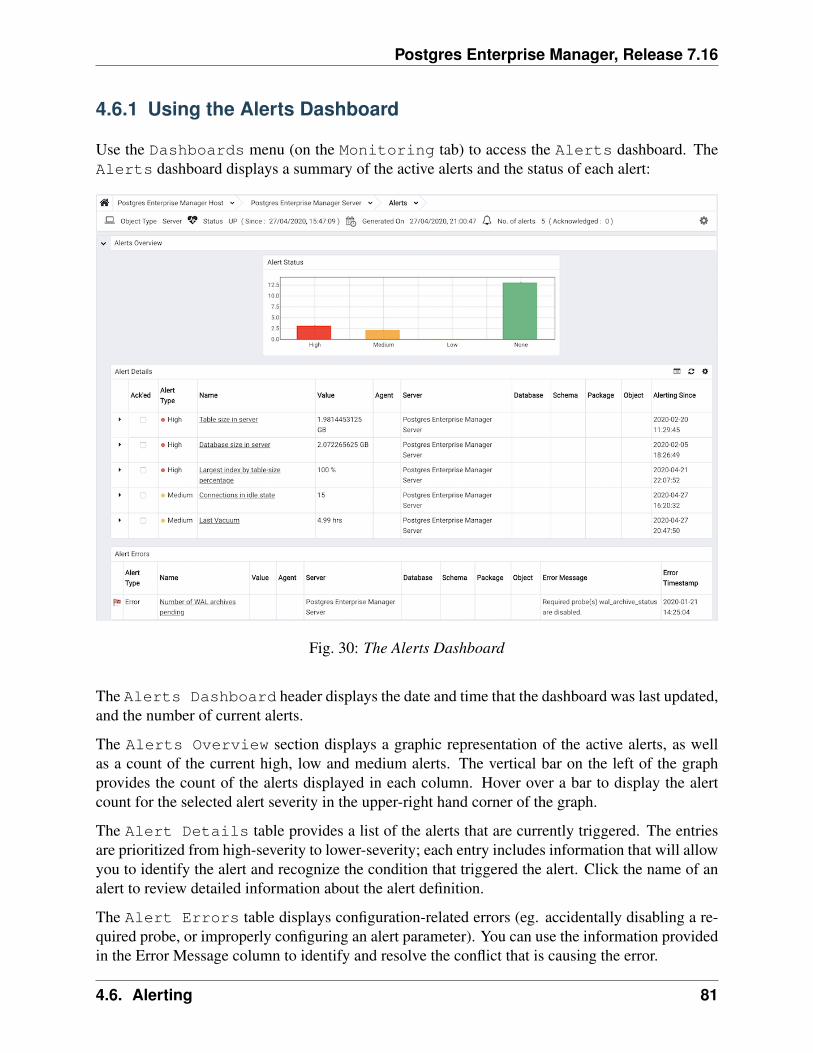
Postgres Enterprise Manager, Release 7.16
4.6.1 Using the Alerts Dashboard
Use the Dashboards menu (on the Monitoring tab) to access the Alerts dashboard. TheAlerts dashboard displays a summary of the active alerts and the status of each alert:
Fig. 30: The Alerts Dashboard
The Alerts Dashboard header displays the date and time that the dashboard was last updated,and the number of current alerts.
The Alerts Overview section displays a graphic representation of the active alerts, as wellas a count of the current high, low and medium alerts. The vertical bar on the left of the graphprovides the count of the alerts displayed in each column. Hover over a bar to display the alertcount for the selected alert severity in the upper-right hand corner of the graph.
The Alert Details table provides a list of the alerts that are currently triggered. The entriesare prioritized from high-severity to lower-severity; each entry includes information that will allowyou to identify the alert and recognize the condition that triggered the alert. Click the name of analert to review detailed information about the alert definition.
The Alert Errors table displays configuration-related errors (eg. accidentally disabling a re-quired probe, or improperly configuring an alert parameter). You can use the information providedin the Error Message column to identify and resolve the conflict that is causing the error.
4.6. Alerting 81
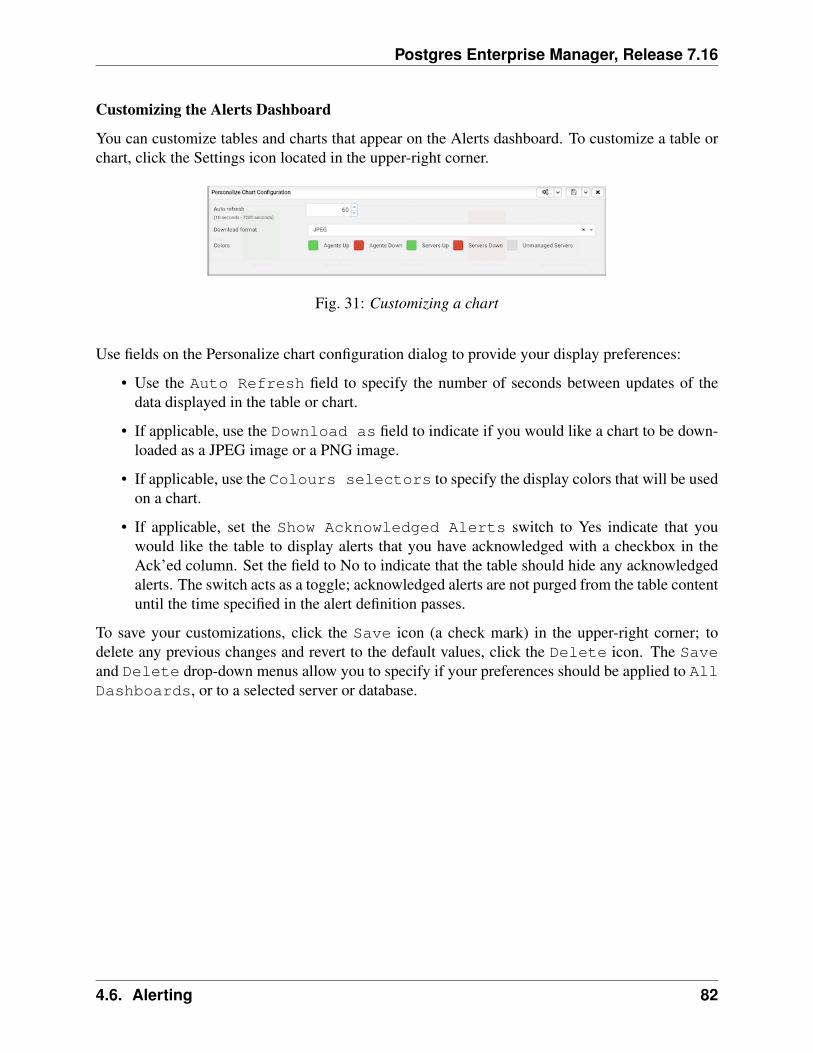
Postgres Enterprise Manager, Release 7.16
Customizing the Alerts Dashboard
You can customize tables and charts that appear on the Alerts dashboard. To customize a table orchart, click the Settings icon located in the upper-right corner.
Fig. 31: Customizing a chart
Use fields on the Personalize chart configuration dialog to provide your display preferences:
• Use the Auto Refresh field to specify the number of seconds between updates of thedata displayed in the table or chart.
• If applicable, use the Download as field to indicate if you would like a chart to be down-loaded as a JPEG image or a PNG image.
• If applicable, use the Colours selectors to specify the display colors that will be usedon a chart.
• If applicable, set the Show Acknowledged Alerts switch to Yes indicate that youwould like the table to display alerts that you have acknowledged with a checkbox in theAck’ed column. Set the field to No to indicate that the table should hide any acknowledgedalerts. The switch acts as a toggle; acknowledged alerts are not purged from the table contentuntil the time specified in the alert definition passes.
To save your customizations, click the Save icon (a check mark) in the upper-right corner; todelete any previous changes and revert to the default values, click the Delete icon. The Saveand Delete drop-down menus allow you to specify if your preferences should be applied to AllDashboards, or to a selected server or database.
4.6. Alerting 82
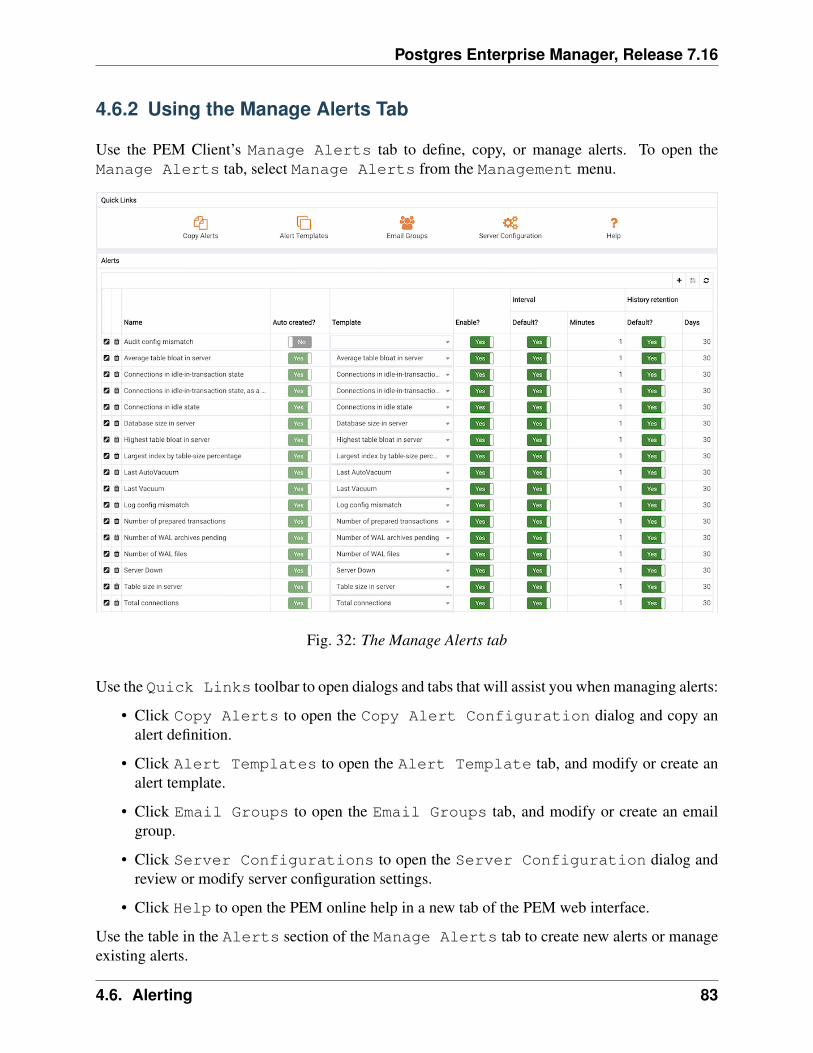
Postgres Enterprise Manager, Release 7.16
4.6.2 Using the Manage Alerts Tab
Use the PEM Client’s Manage Alerts tab to define, copy, or manage alerts. To open theManage Alerts tab, select Manage Alerts from the Management menu.
Fig. 32: The Manage Alerts tab
Use the Quick Links toolbar to open dialogs and tabs that will assist you when managing alerts:
• Click Copy Alerts to open the Copy Alert Configuration dialog and copy analert definition.
• Click Alert Templates to open the Alert Template tab, and modify or create analert template.
• Click Email Groups to open the Email Groups tab, and modify or create an emailgroup.
• Click Server Configurations to open the Server Configuration dialog andreview or modify server configuration settings.
• Click Help to open the PEM online help in a new tab of the PEM web interface.
Use the table in the Alerts section of the Manage Alerts tab to create new alerts or manageexisting alerts.
4.6. Alerting 83
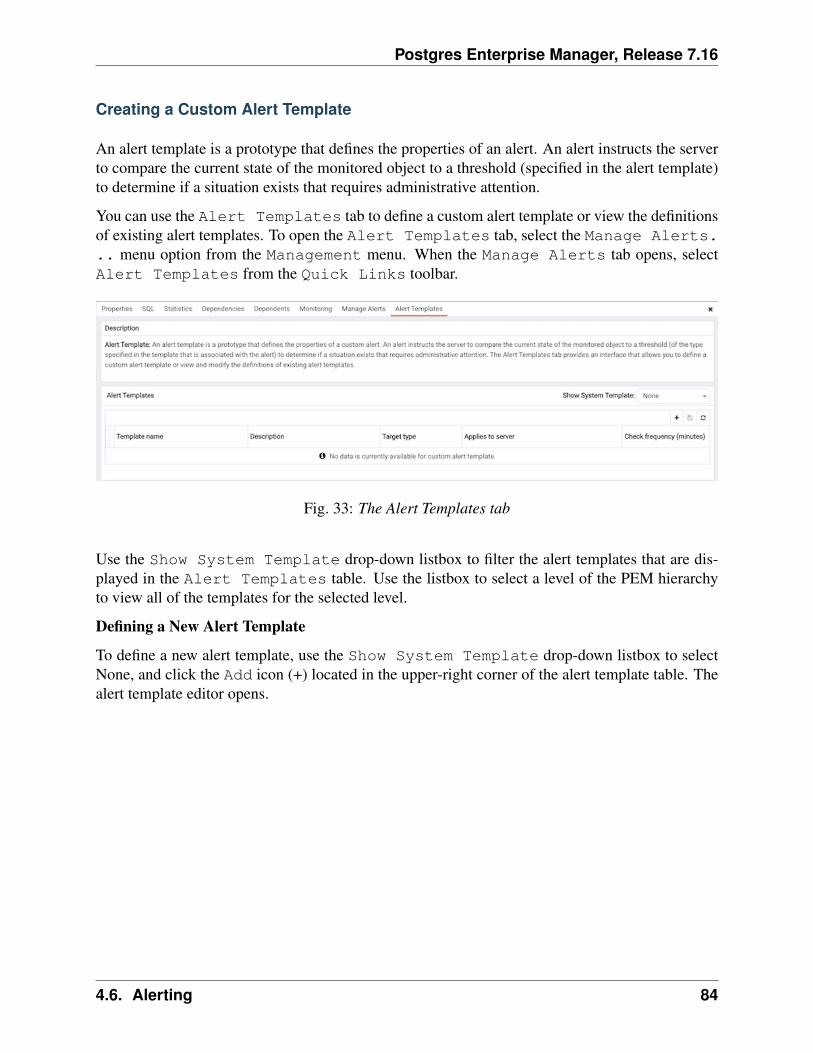
Postgres Enterprise Manager, Release 7.16
Creating a Custom Alert Template
An alert template is a prototype that defines the properties of an alert. An alert instructs the serverto compare the current state of the monitored object to a threshold (specified in the alert template)to determine if a situation exists that requires administrative attention.
You can use the Alert Templates tab to define a custom alert template or view the definitionsof existing alert templates. To open the Alert Templates tab, select the Manage Alerts... menu option from the Management menu. When the Manage Alerts tab opens, selectAlert Templates from the Quick Links toolbar.
Fig. 33: The Alert Templates tab
Use the Show System Template drop-down listbox to filter the alert templates that are dis-played in the Alert Templates table. Use the listbox to select a level of the PEM hierarchyto view all of the templates for the selected level.
Defining a New Alert Template
To define a new alert template, use the Show System Template drop-down listbox to selectNone, and click the Add icon (+) located in the upper-right corner of the alert template table. Thealert template editor opens.
4.6. Alerting 84
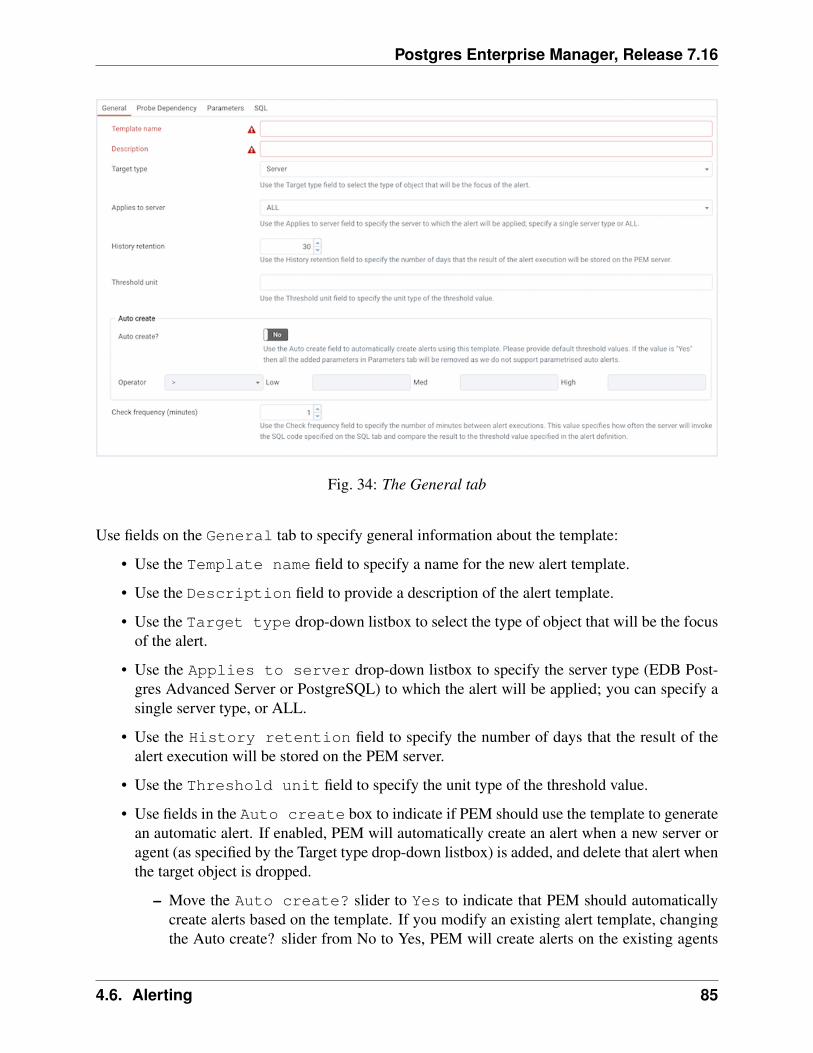
Postgres Enterprise Manager, Release 7.16
Fig. 34: The General tab
Use fields on the General tab to specify general information about the template:
• Use the Template name field to specify a name for the new alert template.
• Use the Description field to provide a description of the alert template.
• Use the Target type drop-down listbox to select the type of object that will be the focusof the alert.
• Use the Applies to server drop-down listbox to specify the server type (EDB Post-gres Advanced Server or PostgreSQL) to which the alert will be applied; you can specify asingle server type, or ALL.
• Use the History retention field to specify the number of days that the result of thealert execution will be stored on the PEM server.
• Use the Threshold unit field to specify the unit type of the threshold value.
• Use fields in the Auto create box to indicate if PEM should use the template to generatean automatic alert. If enabled, PEM will automatically create an alert when a new server oragent (as specified by the Target type drop-down listbox) is added, and delete that alert whenthe target object is dropped.
– Move the Auto create? slider to Yes to indicate that PEM should automaticallycreate alerts based on the template. If you modify an existing alert template, changingthe Auto create? slider from No to Yes, PEM will create alerts on the existing agents
4.6. Alerting 85
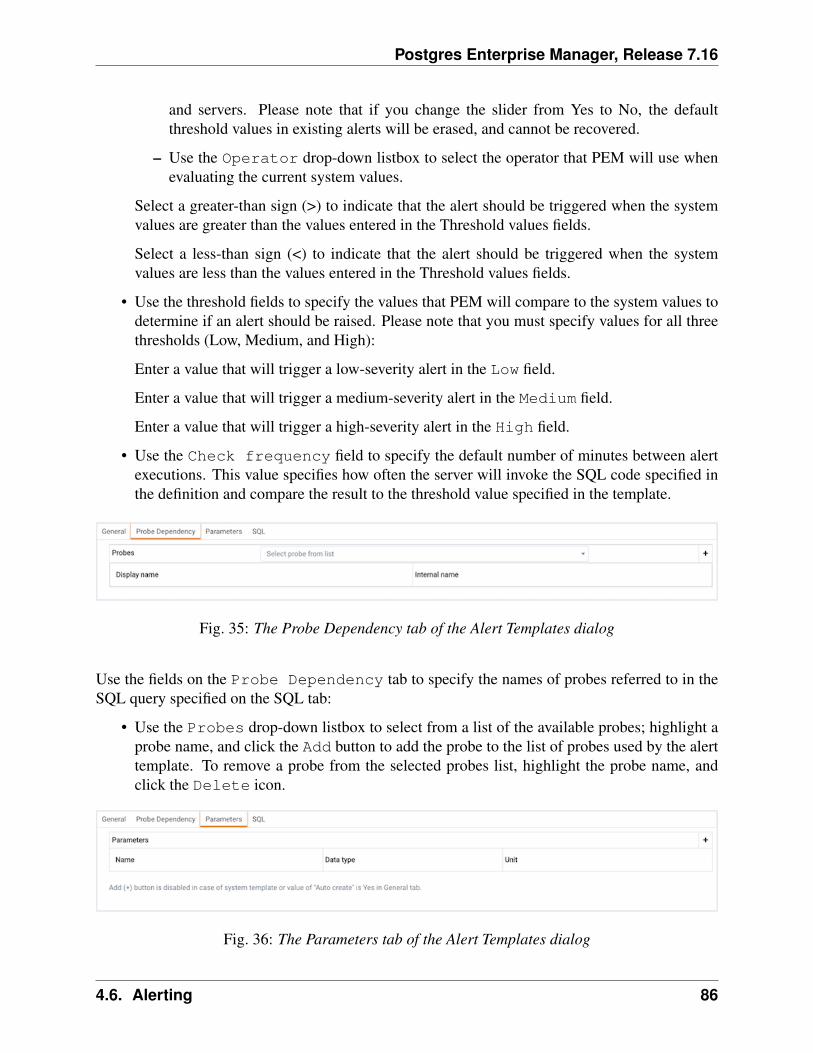
Postgres Enterprise Manager, Release 7.16
and servers. Please note that if you change the slider from Yes to No, the defaultthreshold values in existing alerts will be erased, and cannot be recovered.
– Use the Operator drop-down listbox to select the operator that PEM will use whenevaluating the current system values.
Select a greater-than sign (>) to indicate that the alert should be triggered when the systemvalues are greater than the values entered in the Threshold values fields.
Select a less-than sign (<) to indicate that the alert should be triggered when the systemvalues are less than the values entered in the Threshold values fields.
• Use the threshold fields to specify the values that PEM will compare to the system values todetermine if an alert should be raised. Please note that you must specify values for all threethresholds (Low, Medium, and High):
Enter a value that will trigger a low-severity alert in the Low field.
Enter a value that will trigger a medium-severity alert in the Medium field.
Enter a value that will trigger a high-severity alert in the High field.
• Use the Check frequency field to specify the default number of minutes between alertexecutions. This value specifies how often the server will invoke the SQL code specified inthe definition and compare the result to the threshold value specified in the template.
Fig. 35: The Probe Dependency tab of the Alert Templates dialog
Use the fields on the Probe Dependency tab to specify the names of probes referred to in theSQL query specified on the SQL tab:
• Use the Probes drop-down listbox to select from a list of the available probes; highlight aprobe name, and click the Add button to add the probe to the list of probes used by the alerttemplate. To remove a probe from the selected probes list, highlight the probe name, andclick the Delete icon.
Fig. 36: The Parameters tab of the Alert Templates dialog
4.6. Alerting 86
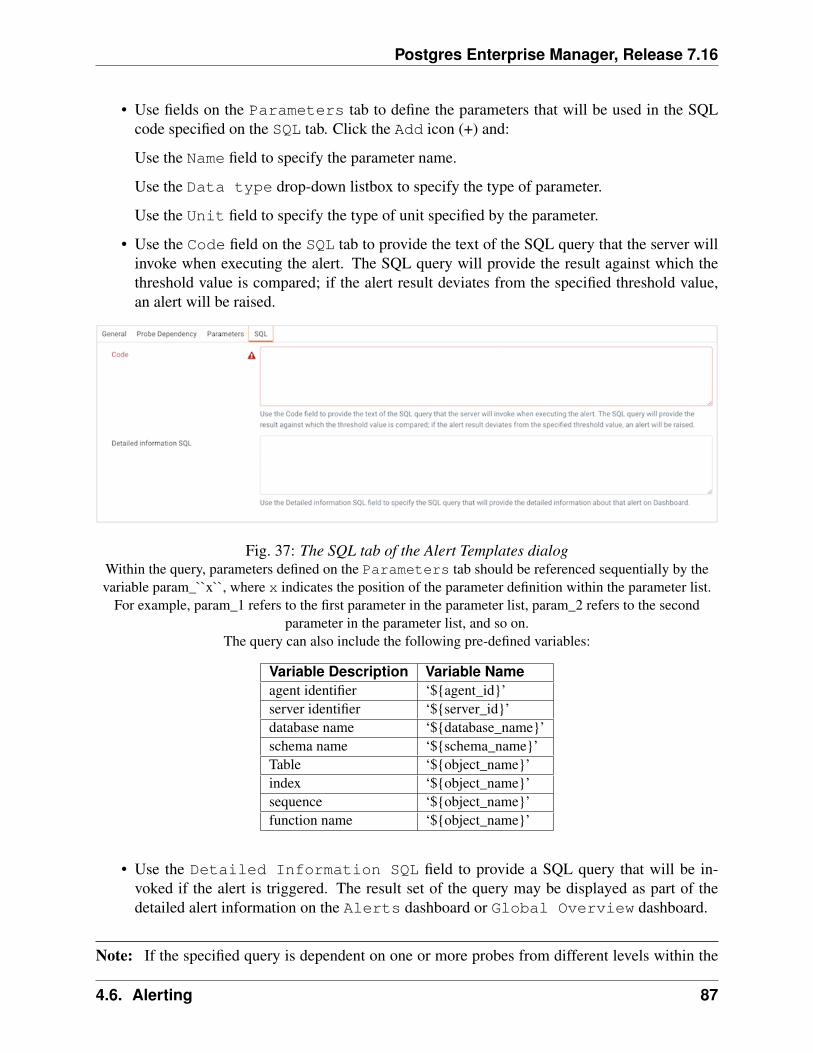
Postgres Enterprise Manager, Release 7.16
• Use fields on the Parameters tab to define the parameters that will be used in the SQLcode specified on the SQL tab. Click the Add icon (+) and:
Use the Name field to specify the parameter name.
Use the Data type drop-down listbox to specify the type of parameter.
Use the Unit field to specify the type of unit specified by the parameter.
• Use the Code field on the SQL tab to provide the text of the SQL query that the server willinvoke when executing the alert. The SQL query will provide the result against which thethreshold value is compared; if the alert result deviates from the specified threshold value,an alert will be raised.
Fig. 37: The SQL tab of the Alert Templates dialogWithin the query, parameters defined on the Parameters tab should be referenced sequentially by thevariable param_``x``, where x indicates the position of the parameter definition within the parameter list.
For example, param_1 refers to the first parameter in the parameter list, param_2 refers to the secondparameter in the parameter list, and so on.
The query can also include the following pre-defined variables:
Variable Description Variable Nameagent identifier ‘${agent_id}’server identifier ‘${server_id}’database name ‘${database_name}’schema name ‘${schema_name}’Table ‘${object_name}’index ‘${object_name}’sequence ‘${object_name}’function name ‘${object_name}’
• Use the Detailed Information SQL field to provide a SQL query that will be in-voked if the alert is triggered. The result set of the query may be displayed as part of thedetailed alert information on the Alerts dashboard or Global Overview dashboard.
Note: If the specified query is dependent on one or more probes from different levels within the
4.6. Alerting 87
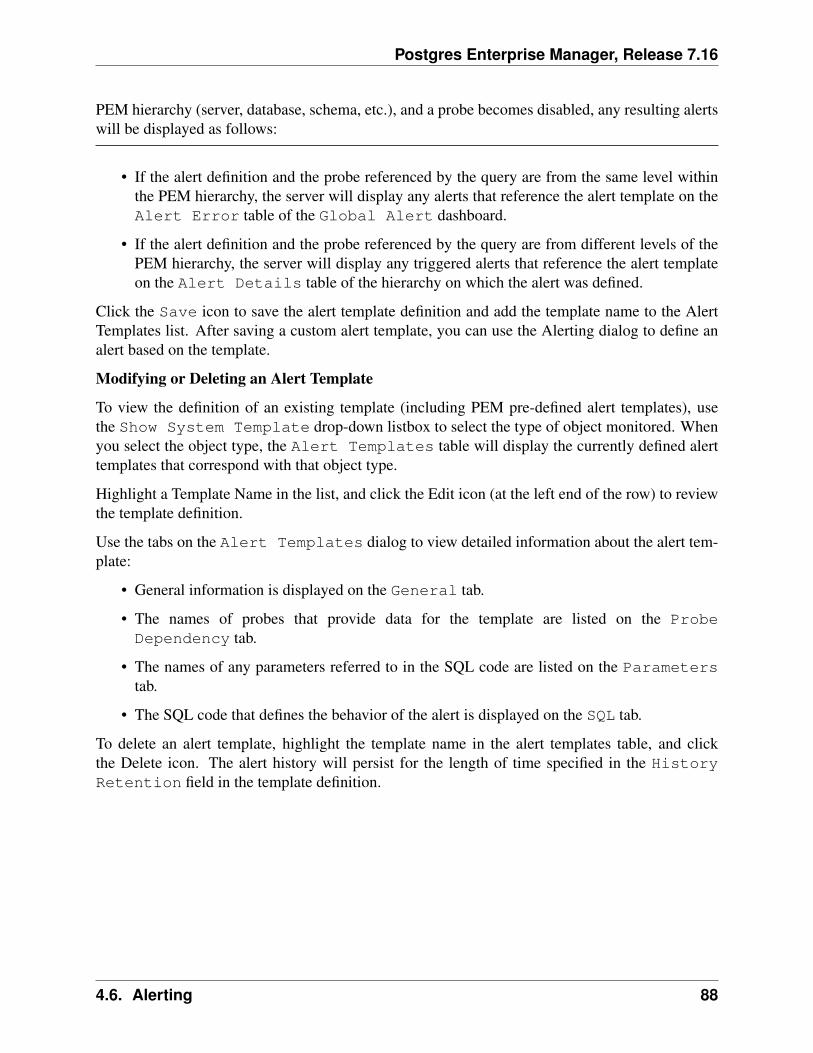
Postgres Enterprise Manager, Release 7.16
PEM hierarchy (server, database, schema, etc.), and a probe becomes disabled, any resulting alertswill be displayed as follows:
• If the alert definition and the probe referenced by the query are from the same level withinthe PEM hierarchy, the server will display any alerts that reference the alert template on theAlert Error table of the Global Alert dashboard.
• If the alert definition and the probe referenced by the query are from different levels of thePEM hierarchy, the server will display any triggered alerts that reference the alert templateon the Alert Details table of the hierarchy on which the alert was defined.
Click the Save icon to save the alert template definition and add the template name to the AlertTemplates list. After saving a custom alert template, you can use the Alerting dialog to define analert based on the template.
Modifying or Deleting an Alert Template
To view the definition of an existing template (including PEM pre-defined alert templates), usethe Show System Template drop-down listbox to select the type of object monitored. Whenyou select the object type, the Alert Templates table will display the currently defined alerttemplates that correspond with that object type.
Highlight a Template Name in the list, and click the Edit icon (at the left end of the row) to reviewthe template definition.
Use the tabs on the Alert Templates dialog to view detailed information about the alert tem-plate:
• General information is displayed on the General tab.
• The names of probes that provide data for the template are listed on the ProbeDependency tab.
• The names of any parameters referred to in the SQL code are listed on the Parameterstab.
• The SQL code that defines the behavior of the alert is displayed on the SQL tab.
To delete an alert template, highlight the template name in the alert templates table, and clickthe Delete icon. The alert history will persist for the length of time specified in the HistoryRetention field in the template definition.
4.6. Alerting 88
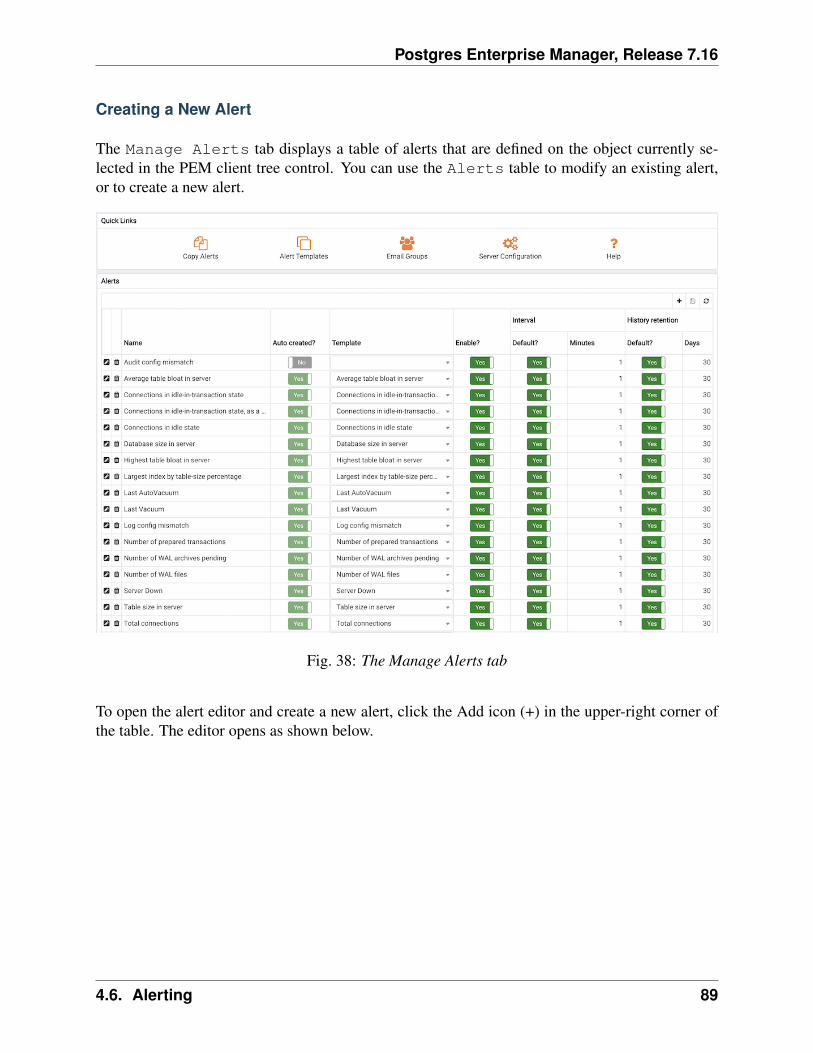
Postgres Enterprise Manager, Release 7.16
Creating a New Alert
The Manage Alerts tab displays a table of alerts that are defined on the object currently se-lected in the PEM client tree control. You can use the Alerts table to modify an existing alert,or to create a new alert.
Fig. 38: The Manage Alerts tab
To open the alert editor and create a new alert, click the Add icon (+) in the upper-right corner ofthe table. The editor opens as shown below.
4.6. Alerting 89
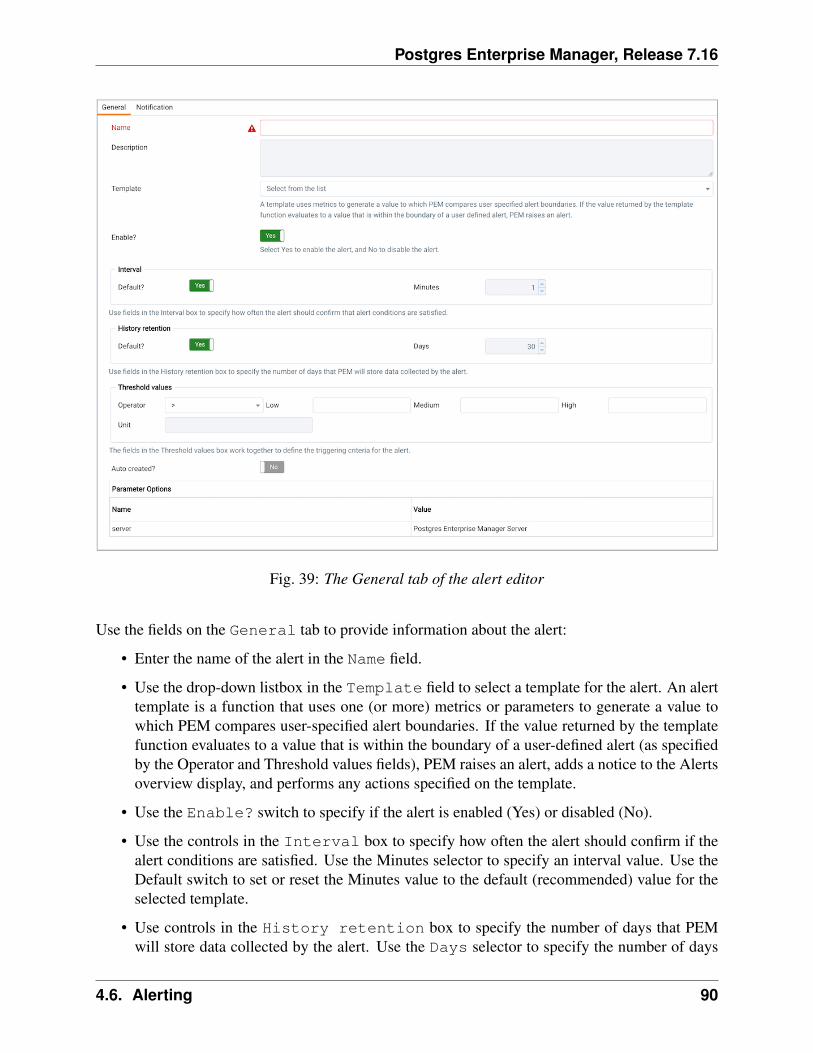
Postgres Enterprise Manager, Release 7.16
Fig. 39: The General tab of the alert editor
Use the fields on the General tab to provide information about the alert:
• Enter the name of the alert in the Name field.
• Use the drop-down listbox in the Template field to select a template for the alert. An alerttemplate is a function that uses one (or more) metrics or parameters to generate a value towhich PEM compares user-specified alert boundaries. If the value returned by the templatefunction evaluates to a value that is within the boundary of a user-defined alert (as specifiedby the Operator and Threshold values fields), PEM raises an alert, adds a notice to the Alertsoverview display, and performs any actions specified on the template.
• Use the Enable? switch to specify if the alert is enabled (Yes) or disabled (No).
• Use the controls in the Interval box to specify how often the alert should confirm if thealert conditions are satisfied. Use the Minutes selector to specify an interval value. Use theDefault switch to set or reset the Minutes value to the default (recommended) value for theselected template.
• Use controls in the History retention box to specify the number of days that PEMwill store data collected by the alert. Use the Days selector to specify the number of days
4.6. Alerting 90
Postgres Enterprise Manager, Release 7.16
that the data will be stored. Use the Default switch to set or reset the Days value to thedefault value (30 days).
• Use controls in the Threshold values box to define the triggering criteria for the alert.When the value specified in the Threshold Values fields evaluates to greater-than or less-thanthe system value (as specified with the Operator), PEM will raise a Low, Medium or Highlevel alert:
• Use the Operator drop-down listbox to select the operator that PEM will use when evalu-ating the current system values:
– Select a greater-than sign (>) to indicate that the alert should be triggered when thesystem values are greater than the values entered in the Threshold values fields.
– Select a less-than sign (<) to indicate that the alert should be triggered when the systemvalues are less than the values entered in the Threshold values fields.
• Use the threshold fields to specify the values that PEM will compare to the system valuesto determine if an alert should be raised. Please note that you must specify values for all threethresholds (Low, Medium, and High):
– Enter a value that will trigger a low-severity alert in the Low field.
– Enter a value that will trigger a medium-severity alert in the Medium field.
– Enter a value that will trigger a high-severity alert in the High field.
The Parameter Options table contains a list of parameters that are required by the selectedtemplate; the table displays both pre-defined parameters, and parameters for which you must spec-ify a value. Please note that you must specify a value for any parameter that displays a prompt inthe Value column.
PEM can send a notification or execute a script if an alert is triggered, or if an alert is cleared. Usethe Notification tab to specify how PEM will behave if an alert is raised.
4.6. Alerting 91
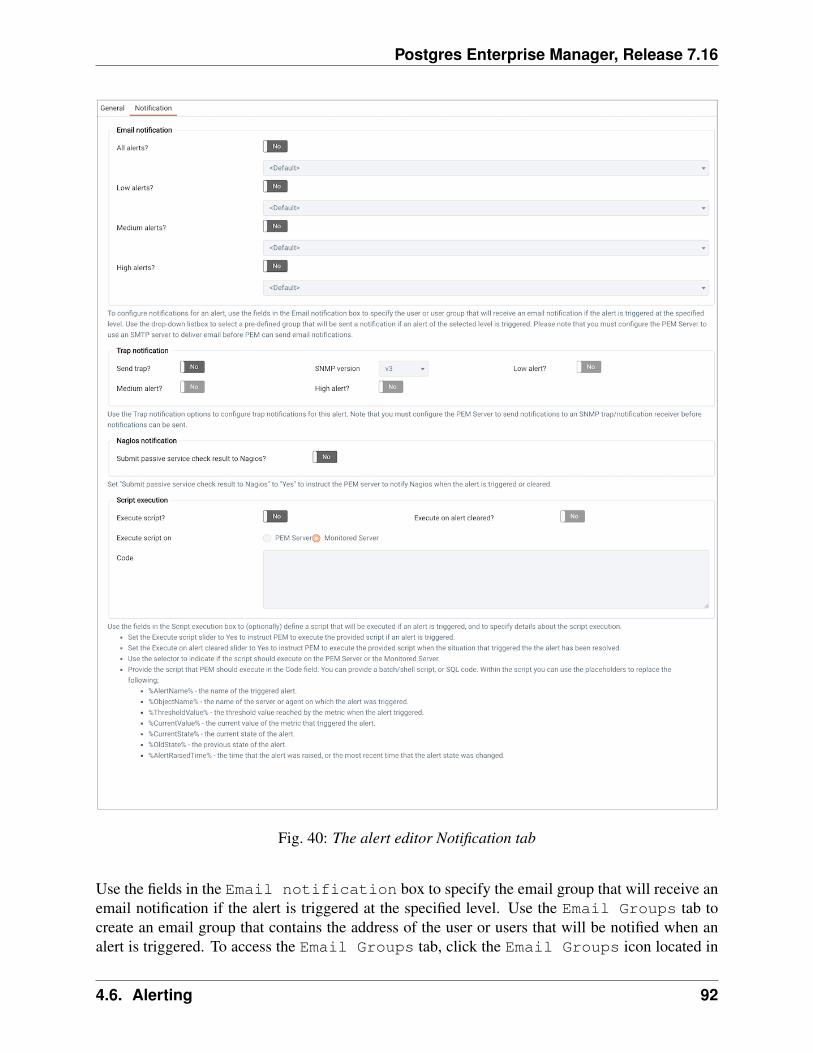
Postgres Enterprise Manager, Release 7.16
Fig. 40: The alert editor Notification tab
Use the fields in the Email notification box to specify the email group that will receive anemail notification if the alert is triggered at the specified level. Use the Email Groups tab tocreate an email group that contains the address of the user or users that will be notified when analert is triggered. To access the Email Groups tab, click the Email Groups icon located in
4.6. Alerting 92
Postgres Enterprise Manager, Release 7.16
the Quick Links menu of the Manage Alerts tab.
• To instruct PEM to send an email when a specific alert level is reached, set the slider next toan alert level to Yes, and use the drop-down listbox to select the pre-defined user or groupthat will be notified.
Please note that you must configure the PEM Server to use an SMTP server to deliver email beforePEM can send email notifications.
Use the Trap notification options to configure trap notifications for this alert:
• Set the Send trap slider to Yes to send SNMP trap notifications when the state of thisalert changes.
• Set the SNMP Ver to v1, v2, or v3 to identify the SNMP version.
• Use the Low alert, Med alert and High alert sliders to select the level(s) of alertthat will trigger the trap. For example, if you set the slider next to High alert to Yes, PEMwill send a notification when an alert with a high severity level is triggered.
Please note that you must configure the PEM Server to send notifications to an SNMPtrap/notification receiver before notifications can be sent. For sending SNMP v3 traps, pemA-gent will use ‘User Security Model(USM)’ which is in charge of authenticating, encrypting, anddecrypting SNMP packets.
Also note while sending SNMP v3 traps, agent will create snmp_boot_counter file. This file willget created in location mentioned by batch_script_dir parameter in agent.cfg, if this parameter isnot configured or if directory is not accessible due to authentication restrictions then in operatingsystems temporary directory, if that is also not possible then in user’s home directory.
Use the field in the Nagios notification box to instruct the PEM server to notify Nagiosnetwork-alerting software when the alert is triggered or cleared.
• Set the Submit passive service check result to Nagios switch to Yes toinstruct the PEM server to notify Nagios when the alert is triggered or cleared.
Use the fields in the Script execution box to (optionally) define a script that will be executedif an alert is triggered, and to specify details about the script execution.
• Set the Execute script slider to Yes to instruct PEM to execute the provided script ifan alert is triggered.
• Set the Execute on alert cleared slider to Yes to instruct PEM to execute theprovided script when the situation that triggered the alert has been resolved.
• Use the radio buttons next to Execute script on to indicate that the script shouldexecute on the PEM Server or the Monitored Server.
• Provide the script that PEM should execute in the Code field. You can provide a batch/shellscript, or SQL code. Within the script, you can use placeholders for the following:
%AlertName% - this placeholder will be replaced with the name of the triggered alert.
4.6. Alerting 93
Postgres Enterprise Manager, Release 7.16
%ObjectName% - this placeholder will be replaced with the name of the server or agent onwhich the alert was triggered.
%ThresholdValue% - this placeholder will be replaced with the threshold value reachedby the metric when the alert triggered.
%CurrentValue% - this placeholder will be replaced with the current value of the metricthat triggered the alert.
%CurrentState% - this placeholder will be replaced with the current state of the alert.
%OldState% - this placeholder will be replaced with the previous state of the alert.
%AlertRaisedTime% - this placeholder will be replaced with the time that the alert wasraised, or the most recent time that the alert state was changed.
To invoke a script on a Linux system, you must modify the entry for thebatch_script_user parameter of the agent.cfg file and specify the user that shouldbe used to run the script. You can either specify a non-root user or root for this parameter.If you do not specify a user, or the specified user does not exist, then the script will not beexecuted. Restart the agent after modifying the file.
To invoke a script on a Windows system, set the registry entry for AllowBatchJobStepsto true and restart the PEM agent. PEM registry entries are located inHKEY_LOCAL_MACHINE/Software/Wow6432Node/EnterpriseDB/PEM/agent.
When you have defined the alert attributes, click the edit icon to close the alert definition editor,and then the save icon (in the upper-right corner of the Alerts table). To discard your changes,click the refresh icon; a popup will ask you to confirm that you wish to discard the changes.
4.6. Alerting 94
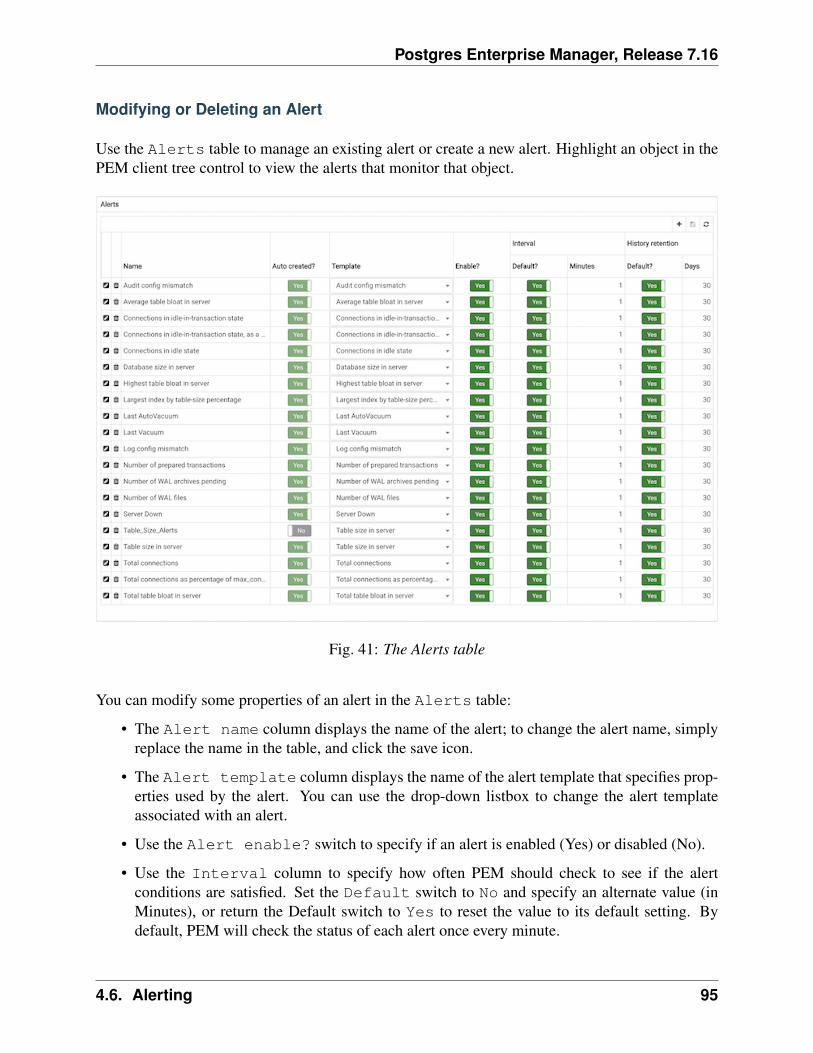
Postgres Enterprise Manager, Release 7.16
Modifying or Deleting an Alert
Use the Alerts table to manage an existing alert or create a new alert. Highlight an object in thePEM client tree control to view the alerts that monitor that object.
Fig. 41: The Alerts table
You can modify some properties of an alert in the Alerts table:
• The Alert name column displays the name of the alert; to change the alert name, simplyreplace the name in the table, and click the save icon.
• The Alert template column displays the name of the alert template that specifies prop-erties used by the alert. You can use the drop-down listbox to change the alert templateassociated with an alert.
• Use the Alert enable? switch to specify if an alert is enabled (Yes) or disabled (No).
• Use the Interval column to specify how often PEM should check to see if the alertconditions are satisfied. Set the Default switch to No and specify an alternate value (inMinutes), or return the Default switch to Yes to reset the value to its default setting. Bydefault, PEM will check the status of each alert once every minute.
4.6. Alerting 95
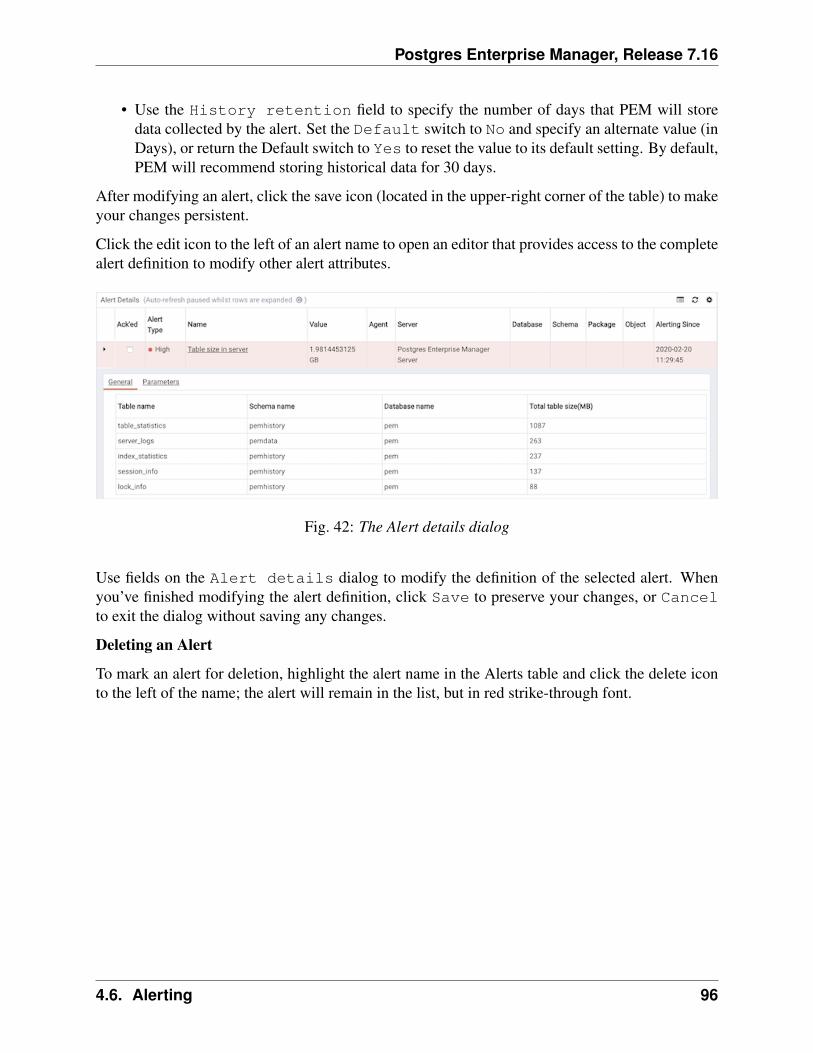
Postgres Enterprise Manager, Release 7.16
• Use the History retention field to specify the number of days that PEM will storedata collected by the alert. Set the Default switch to No and specify an alternate value (inDays), or return the Default switch to Yes to reset the value to its default setting. By default,PEM will recommend storing historical data for 30 days.
After modifying an alert, click the save icon (located in the upper-right corner of the table) to makeyour changes persistent.
Click the edit icon to the left of an alert name to open an editor that provides access to the completealert definition to modify other alert attributes.
Fig. 42: The Alert details dialog
Use fields on the Alert details dialog to modify the definition of the selected alert. Whenyou’ve finished modifying the alert definition, click Save to preserve your changes, or Cancelto exit the dialog without saving any changes.
Deleting an Alert
To mark an alert for deletion, highlight the alert name in the Alerts table and click the delete iconto the left of the name; the alert will remain in the list, but in red strike-through font.
4.6. Alerting 96
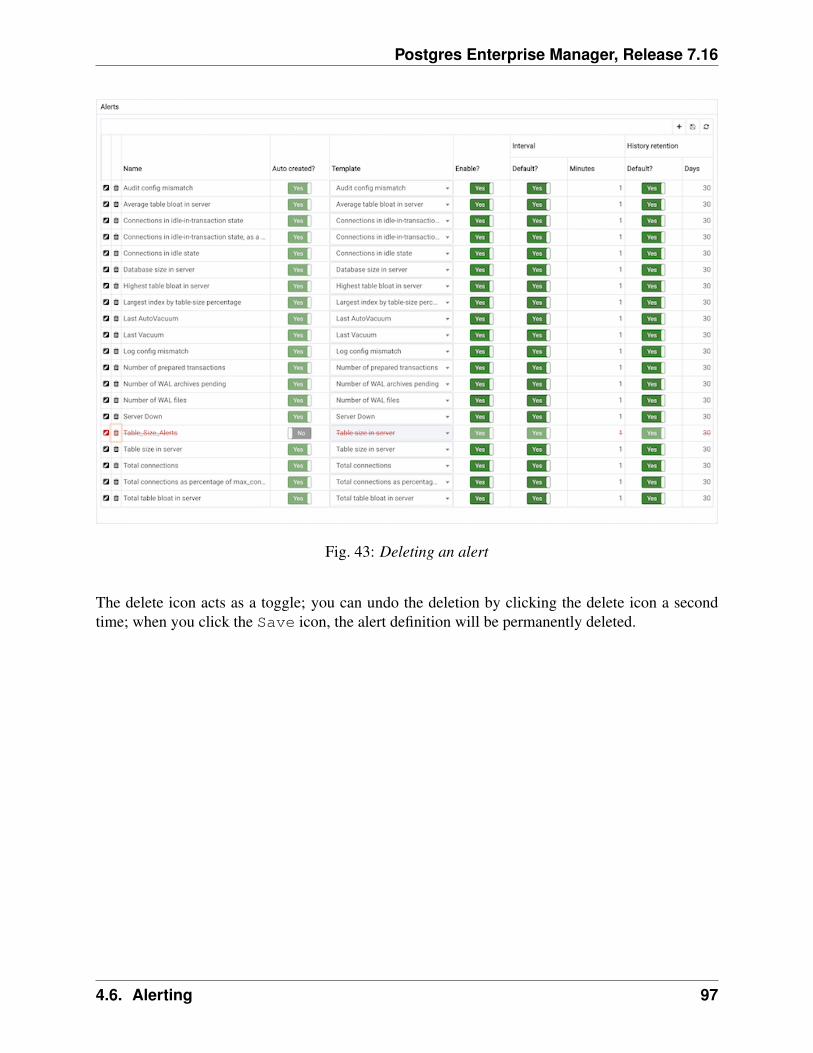
Postgres Enterprise Manager, Release 7.16
Fig. 43: Deleting an alert
The delete icon acts as a toggle; you can undo the deletion by clicking the delete icon a secondtime; when you click the Save icon, the alert definition will be permanently deleted.
4.6. Alerting 97
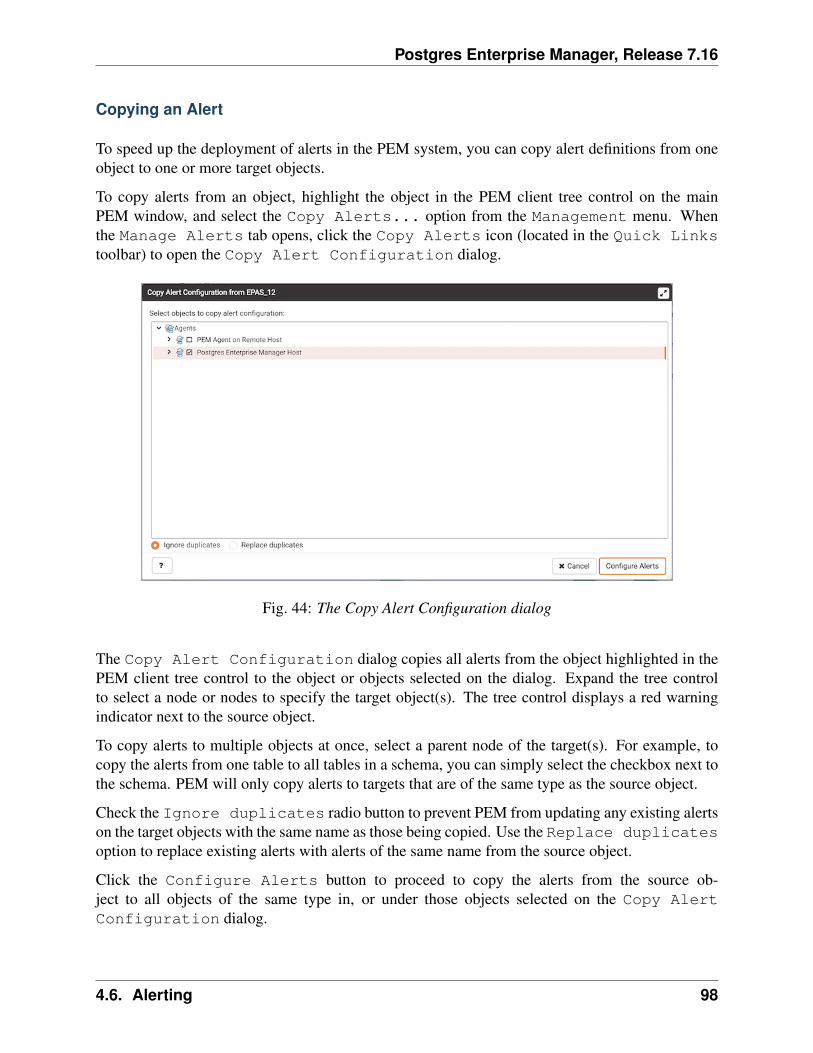
Postgres Enterprise Manager, Release 7.16
Copying an Alert
To speed up the deployment of alerts in the PEM system, you can copy alert definitions from oneobject to one or more target objects.
To copy alerts from an object, highlight the object in the PEM client tree control on the mainPEM window, and select the Copy Alerts... option from the Management menu. Whenthe Manage Alerts tab opens, click the Copy Alerts icon (located in the Quick Linkstoolbar) to open the Copy Alert Configuration dialog.
Fig. 44: The Copy Alert Configuration dialog
The Copy Alert Configuration dialog copies all alerts from the object highlighted in thePEM client tree control to the object or objects selected on the dialog. Expand the tree controlto select a node or nodes to specify the target object(s). The tree control displays a red warningindicator next to the source object.
To copy alerts to multiple objects at once, select a parent node of the target(s). For example, tocopy the alerts from one table to all tables in a schema, you can simply select the checkbox next tothe schema. PEM will only copy alerts to targets that are of the same type as the source object.
Check the Ignore duplicates radio button to prevent PEM from updating any existing alertson the target objects with the same name as those being copied. Use the Replace duplicatesoption to replace existing alerts with alerts of the same name from the source object.
Click the Configure Alerts button to proceed to copy the alerts from the source ob-ject to all objects of the same type in, or under those objects selected on the Copy AlertConfiguration dialog.
4.6. Alerting 98
Postgres Enterprise Manager, Release 7.16
Audit Log Alerting
PEM provides alert templates that allow you to use the Alerting dialog to create an alert thatwill trigger when an ERROR or WARNING statement is written to a log file for a specific server oragent. To open the Alerting dialog, highlight the name of the server or agent in the PEM clientObject browser tree control, and select Alerting... from the Management menu.
To create an alert that will notify you of ERROR or WARNING messages in the log file for aspecific server, create an alert that uses one of the following alert templates:
Number of ERRORS in the logfile on server M in last X hours
Number of WARNINGS in the logfile on server M in last X hours
Number of ERRORS or WARNINGS in the logfile on server M in last X hours
To create an alert that will notify you of ERROR or WARNING messages for a specific agent,create an alert that uses one of the following alert templates:
Number of ERRORS in the logfile on agent M in last X hours
Number of WARNINGS in the logfile on agent M in last X hours
Number of ERRORS or WARNINGS in the logfile on agent M in last X hours
Please note that this functionality is supported only on Advanced Server.
4.6. Alerting 99
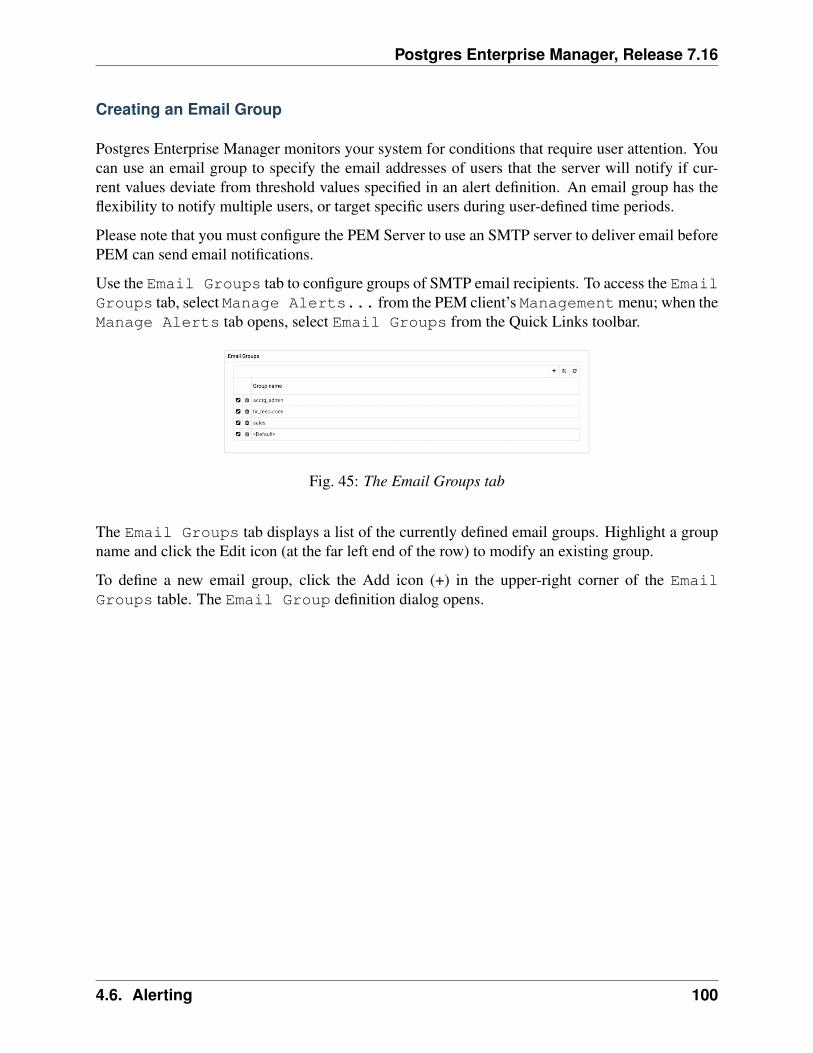
Postgres Enterprise Manager, Release 7.16
Creating an Email Group
Postgres Enterprise Manager monitors your system for conditions that require user attention. Youcan use an email group to specify the email addresses of users that the server will notify if cur-rent values deviate from threshold values specified in an alert definition. An email group has theflexibility to notify multiple users, or target specific users during user-defined time periods.
Please note that you must configure the PEM Server to use an SMTP server to deliver email beforePEM can send email notifications.
Use the Email Groups tab to configure groups of SMTP email recipients. To access the EmailGroups tab, select Manage Alerts... from the PEM client’s Managementmenu; when theManage Alerts tab opens, select Email Groups from the Quick Links toolbar.
Fig. 45: The Email Groups tab
The Email Groups tab displays a list of the currently defined email groups. Highlight a groupname and click the Edit icon (at the far left end of the row) to modify an existing group.
To define a new email group, click the Add icon (+) in the upper-right corner of the EmailGroups table. The Email Group definition dialog opens.
4.6. Alerting 100
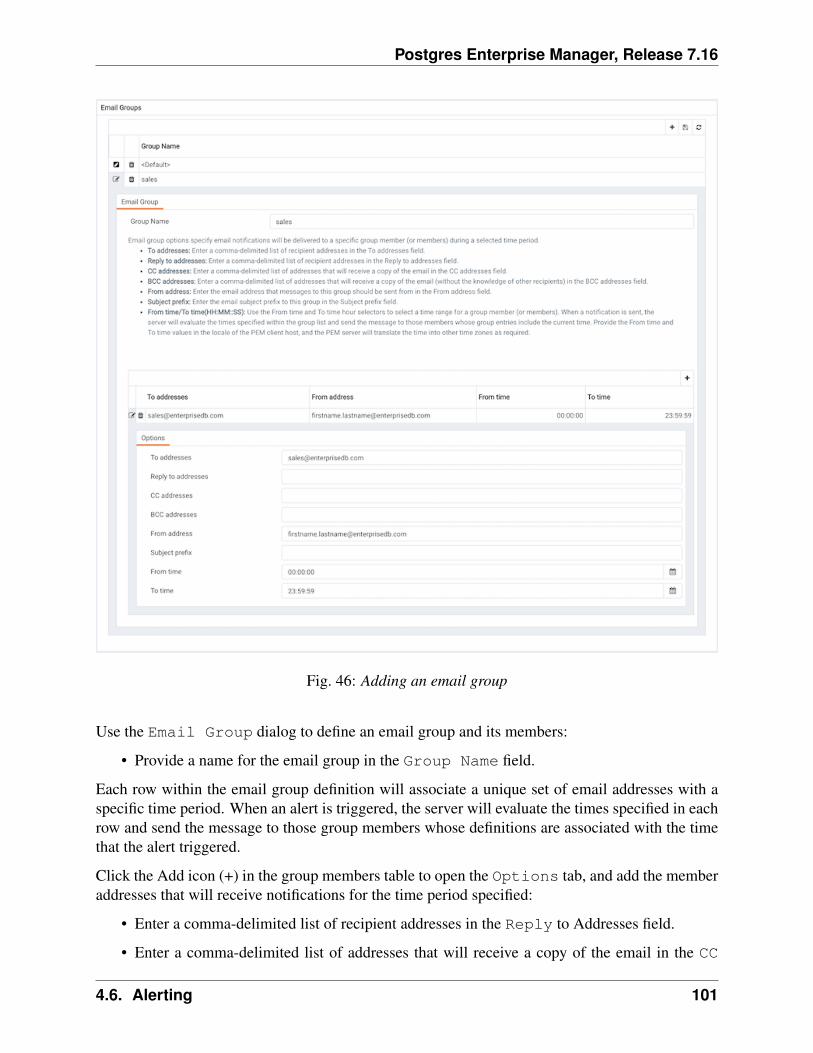
Postgres Enterprise Manager, Release 7.16
Fig. 46: Adding an email group
Use the Email Group dialog to define an email group and its members:
• Provide a name for the email group in the Group Name field.
Each row within the email group definition will associate a unique set of email addresses with aspecific time period. When an alert is triggered, the server will evaluate the times specified in eachrow and send the message to those group members whose definitions are associated with the timethat the alert triggered.
Click the Add icon (+) in the group members table to open the Options tab, and add the memberaddresses that will receive notifications for the time period specified:
• Enter a comma-delimited list of recipient addresses in the Reply to Addresses field.
• Enter a comma-delimited list of addresses that will receive a copy of the email in the CC
4.6. Alerting 101
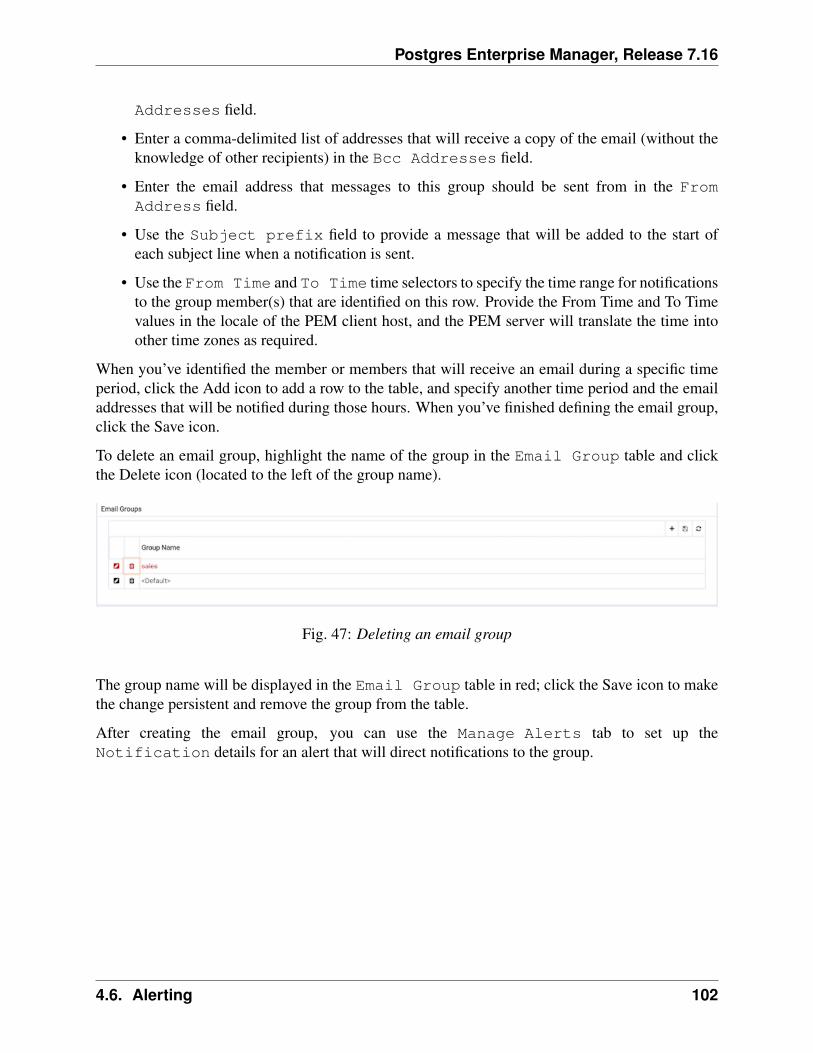
Postgres Enterprise Manager, Release 7.16
Addresses field.
• Enter a comma-delimited list of addresses that will receive a copy of the email (without theknowledge of other recipients) in the Bcc Addresses field.
• Enter the email address that messages to this group should be sent from in the FromAddress field.
• Use the Subject prefix field to provide a message that will be added to the start ofeach subject line when a notification is sent.
• Use the From Time and To Time time selectors to specify the time range for notificationsto the group member(s) that are identified on this row. Provide the From Time and To Timevalues in the locale of the PEM client host, and the PEM server will translate the time intoother time zones as required.
When you’ve identified the member or members that will receive an email during a specific timeperiod, click the Add icon to add a row to the table, and specify another time period and the emailaddresses that will be notified during those hours. When you’ve finished defining the email group,click the Save icon.
To delete an email group, highlight the name of the group in the Email Group table and clickthe Delete icon (located to the left of the group name).
Fig. 47: Deleting an email group
The group name will be displayed in the Email Group table in red; click the Save icon to makethe change persistent and remove the group from the table.
After creating the email group, you can use the Manage Alerts tab to set up theNotification details for an alert that will direct notifications to the group.
4.6. Alerting 102
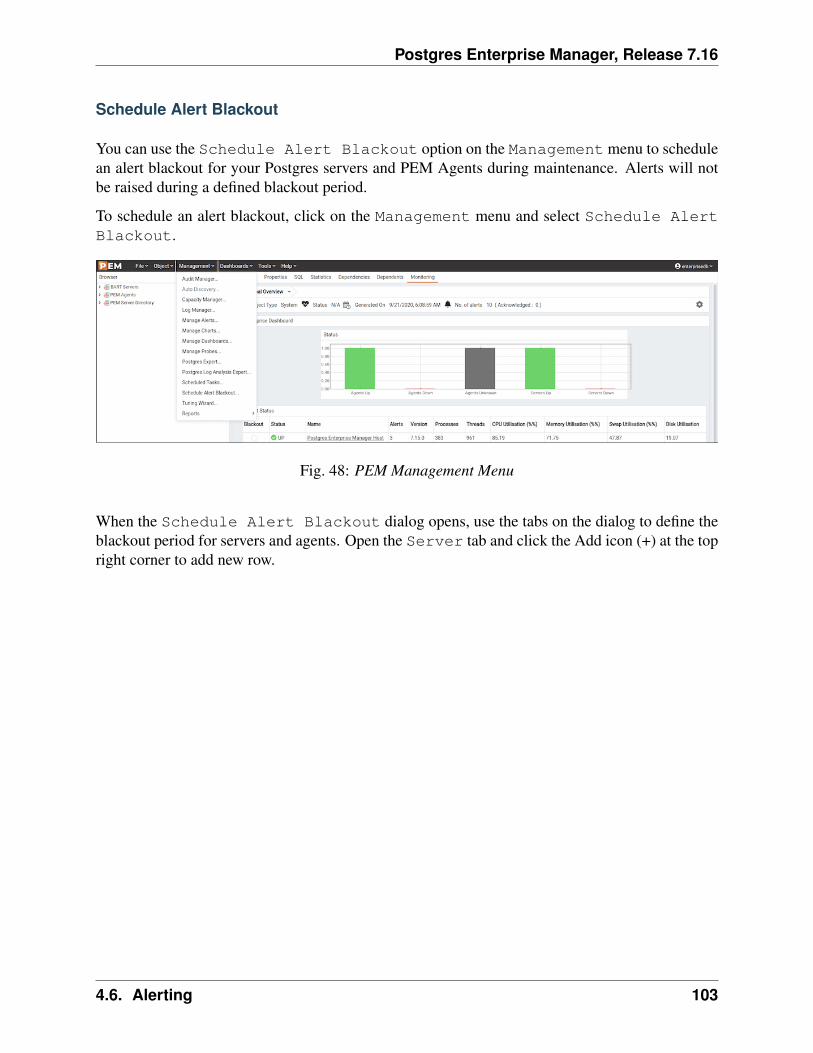
Postgres Enterprise Manager, Release 7.16
Schedule Alert Blackout
You can use the Schedule Alert Blackout option on the Management menu to schedulean alert blackout for your Postgres servers and PEM Agents during maintenance. Alerts will notbe raised during a defined blackout period.
To schedule an alert blackout, click on the Management menu and select Schedule AlertBlackout.
Fig. 48: PEM Management Menu
When the Schedule Alert Blackout dialog opens, use the tabs on the dialog to define theblackout period for servers and agents. Open the Server tab and click the Add icon (+) at the topright corner to add new row.
4.6. Alerting 103
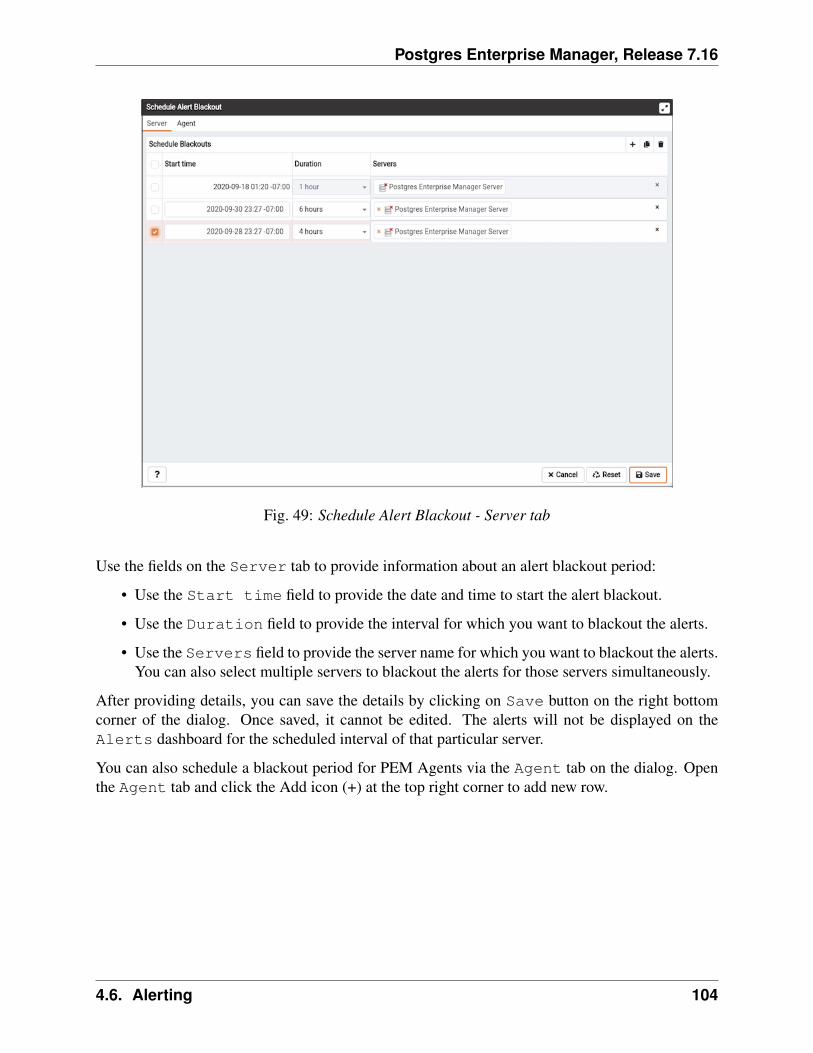
Postgres Enterprise Manager, Release 7.16
Fig. 49: Schedule Alert Blackout - Server tab
Use the fields on the Server tab to provide information about an alert blackout period:
• Use the Start time field to provide the date and time to start the alert blackout.
• Use the Duration field to provide the interval for which you want to blackout the alerts.
• Use the Servers field to provide the server name for which you want to blackout the alerts.You can also select multiple servers to blackout the alerts for those servers simultaneously.
After providing details, you can save the details by clicking on Save button on the right bottomcorner of the dialog. Once saved, it cannot be edited. The alerts will not be displayed on theAlerts dashboard for the scheduled interval of that particular server.
You can also schedule a blackout period for PEM Agents via the Agent tab on the dialog. Openthe Agent tab and click the Add icon (+) at the top right corner to add new row.
4.6. Alerting 104
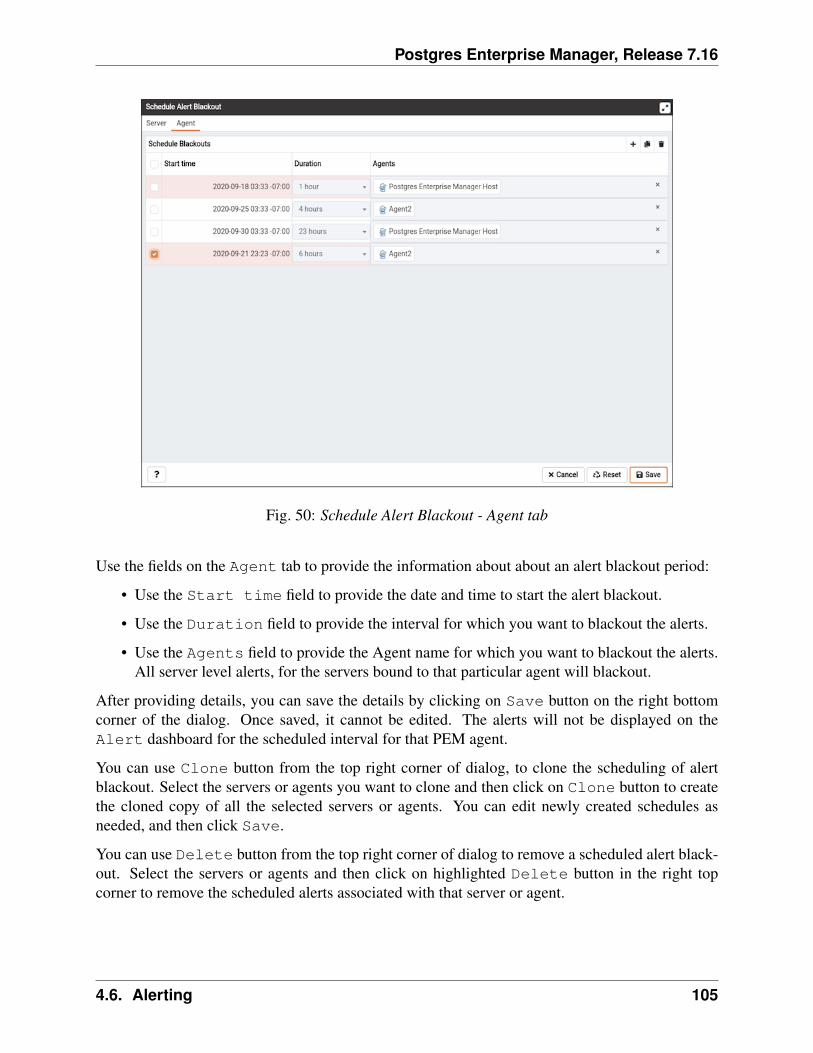
Postgres Enterprise Manager, Release 7.16
Fig. 50: Schedule Alert Blackout - Agent tab
Use the fields on the Agent tab to provide the information about about an alert blackout period:
• Use the Start time field to provide the date and time to start the alert blackout.
• Use the Duration field to provide the interval for which you want to blackout the alerts.
• Use the Agents field to provide the Agent name for which you want to blackout the alerts.All server level alerts, for the servers bound to that particular agent will blackout.
After providing details, you can save the details by clicking on Save button on the right bottomcorner of the dialog. Once saved, it cannot be edited. The alerts will not be displayed on theAlert dashboard for the scheduled interval for that PEM agent.
You can use Clone button from the top right corner of dialog, to clone the scheduling of alertblackout. Select the servers or agents you want to clone and then click on Clone button to createthe cloned copy of all the selected servers or agents. You can edit newly created schedules asneeded, and then click Save.
You can use Delete button from the top right corner of dialog to remove a scheduled alert black-out. Select the servers or agents and then click on highlighted Delete button in the right topcorner to remove the scheduled alerts associated with that server or agent.
4.6. Alerting 105
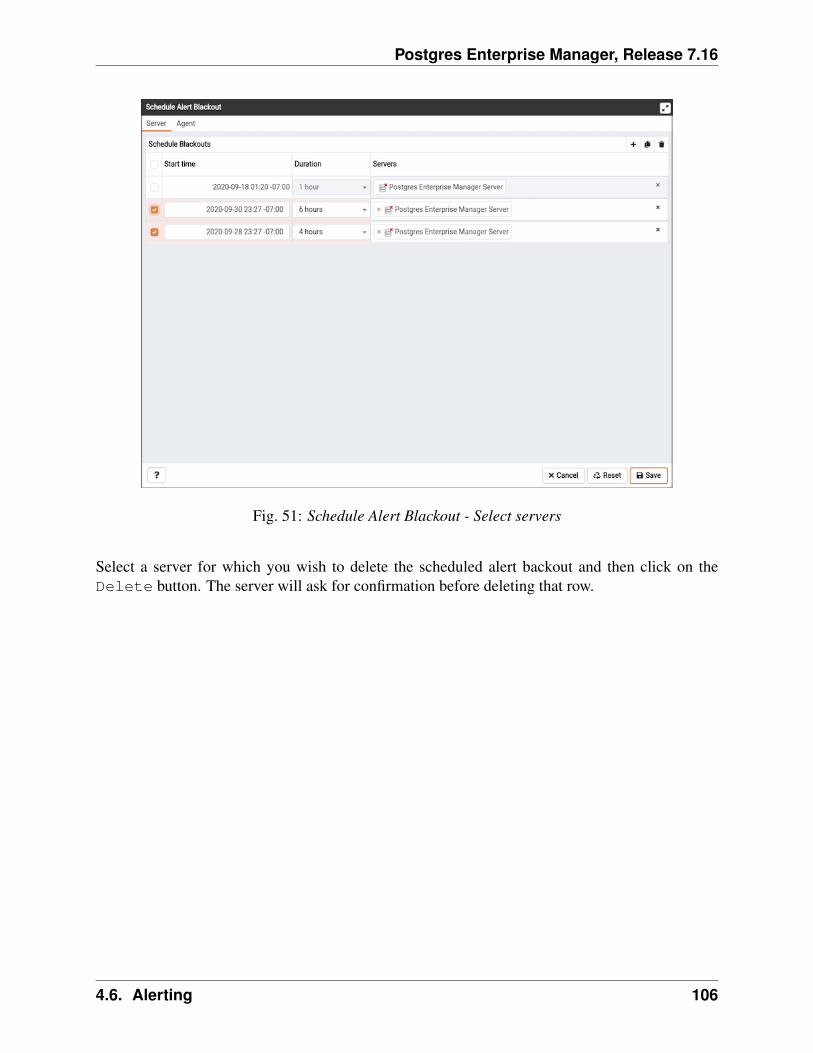
Postgres Enterprise Manager, Release 7.16
Fig. 51: Schedule Alert Blackout - Select servers
Select a server for which you wish to delete the scheduled alert backout and then click on theDelete button. The server will ask for confirmation before deleting that row.
4.6. Alerting 106
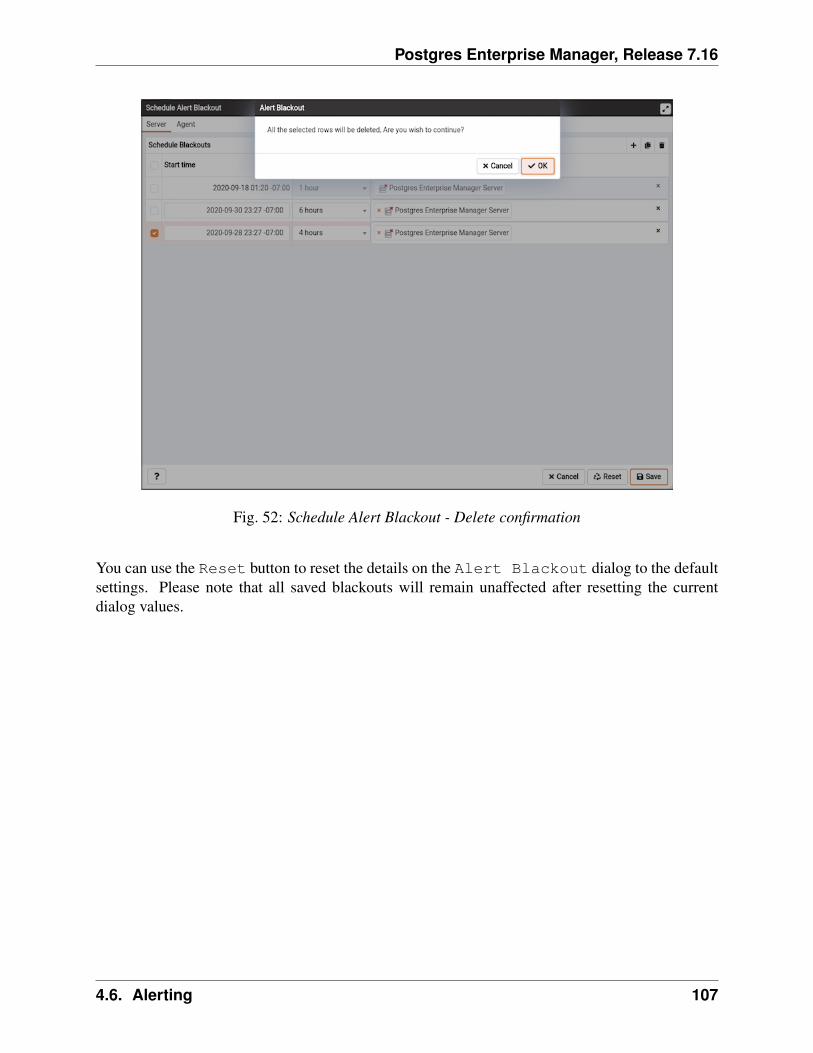
Postgres Enterprise Manager, Release 7.16
Fig. 52: Schedule Alert Blackout - Delete confirmation
You can use the Reset button to reset the details on the Alert Blackout dialog to the defaultsettings. Please note that all saved blackouts will remain unaffected after resetting the currentdialog values.
4.6. Alerting 107
Postgres Enterprise Manager, Release 7.16
4.6.3 Using PEM with Nagios
The PEM server can send a passive alert result to Nagios network-alerting software when a user-defined alert is triggered. To instruct the PEM server to notify Nagios of a triggered alert, youmust:
• Enable Nagios notification for each alert that will trigger a notification from the PEM serverto Nagios. Please note that PEM alerting must be configured before you create the host.cfg file, the services.cfg file, or configure Nagios.
• Configure Nagios-related behaviors of the PEM server.
• Create the host.cfg and services.cfg configuration files.
• If necessary, modify the Nagios configuration file and restart the server.
After configuring the server to enable Nagios alerting, any triggered alerts will send a passivecheck result to the Nagios service. The syntax of a passive alert is:
<timestamp> PROCESS_SERVICE_CHECK_RESULT; <host_name> ;<service_name> ; <service_status> ;
Where:
timestamp is the date and time that the alert was triggered.
host_name is the name of the server or agent.
service_name is the name of the alert.
service_status is the numeric service status value:
0 if the service status is OK1 if the service status is WARNING2 if the service status is CRITICAL3 if the service status is UNKNOWN
The PEM server uses the following rules to evaluate the service status:
• If the PEM alert level is CLEARED, the warning message will read OK.
• If the PEM alert level is LOW, the warning message will read WARNING.
• If the is_nagios_medium_alert_as_critical flag (specified in the PEM serverconfiguration dialog) is set to FALSE and the alert level MEDIUM, the warning messagewill read WARNING.
• If the is_nagios_medium_alert_as_critical flag (specified in the PEM serverconfiguration dialog) is set to TRUE and the alert level is MEDIUM, the warning messagewill read CRITICAL.
• If the PEM alert level is HIGH, the warning message will read CRITICAL.
4.6. Alerting 108
Postgres Enterprise Manager, Release 7.16
Enabling Nagios Notification for an Alert
The PEM server maintains a unique set of notification properties for each enabled alert. Use theNotification tab of the Manage Alerts tab to specify that (when triggered), a given alertwill send an alert notice to Nagios.
To modify the notification properties of an alert, right-click on the name of the object monitoredby the alert, and select Manage Alerts... from the Management menu. When the ManageAlerts tab opens, locate the alert, and then click the edit button to the left of the alert name inthe Alerts list. When the edit pane opens, select the Notification tab.
4.6. Alerting 109
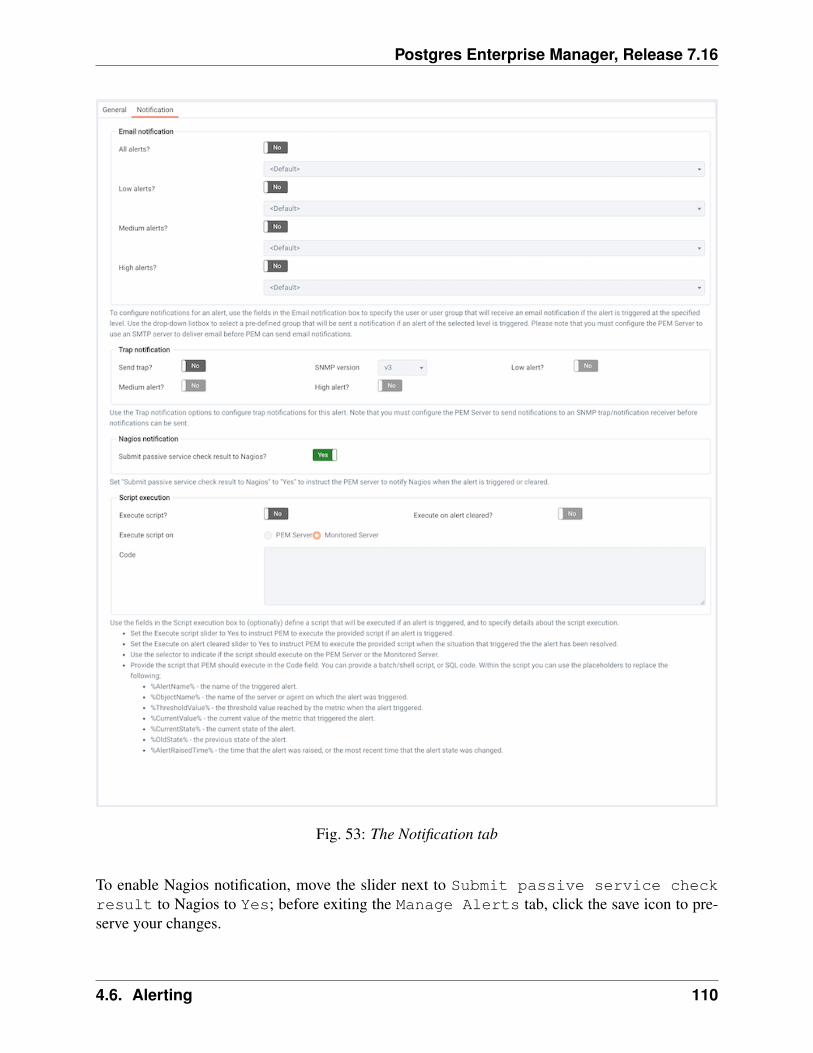
Postgres Enterprise Manager, Release 7.16
Fig. 53: The Notification tab
To enable Nagios notification, move the slider next to Submit passive service checkresult to Nagios to Yes; before exiting the Manage Alerts tab, click the save icon to pre-serve your changes.
4.6. Alerting 110
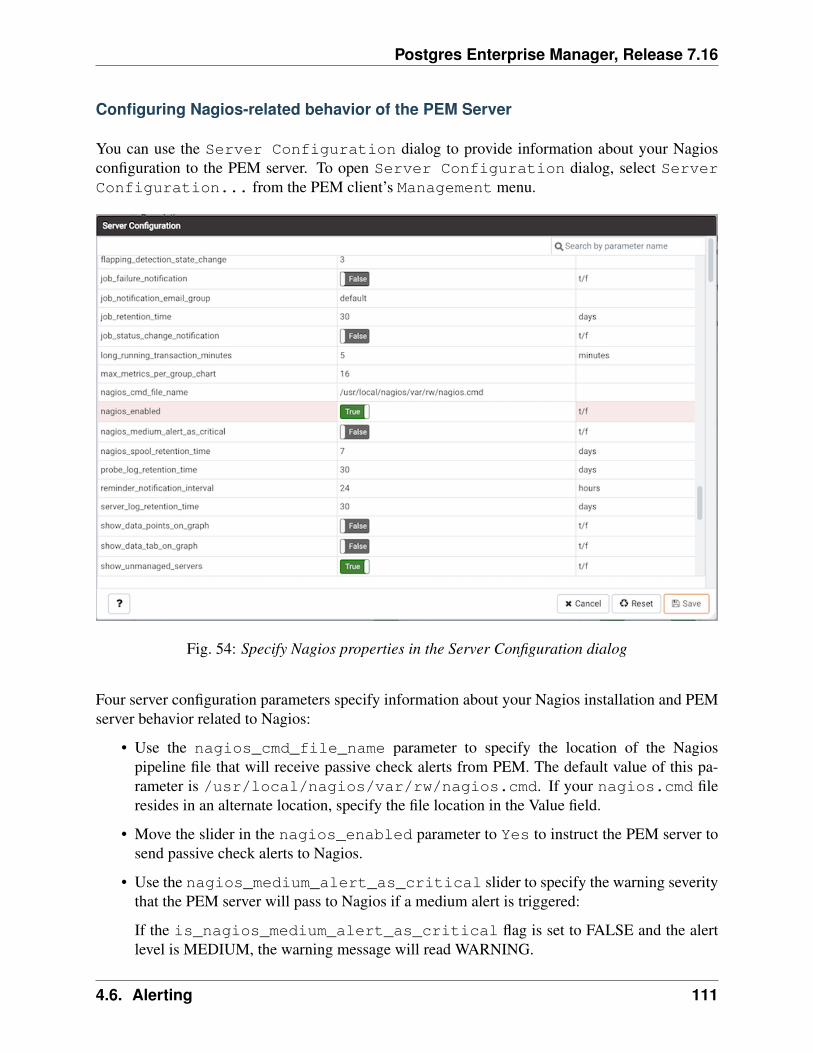
Postgres Enterprise Manager, Release 7.16
Configuring Nagios-related behavior of the PEM Server
You can use the Server Configuration dialog to provide information about your Nagiosconfiguration to the PEM server. To open Server Configuration dialog, select ServerConfiguration... from the PEM client’s Management menu.
Fig. 54: Specify Nagios properties in the Server Configuration dialog
Four server configuration parameters specify information about your Nagios installation and PEMserver behavior related to Nagios:
• Use the nagios_cmd_file_name parameter to specify the location of the Nagiospipeline file that will receive passive check alerts from PEM. The default value of this pa-rameter is /usr/local/nagios/var/rw/nagios.cmd. If your nagios.cmd fileresides in an alternate location, specify the file location in the Value field.
• Move the slider in the nagios_enabled parameter to Yes to instruct the PEM server tosend passive check alerts to Nagios.
• Use the nagios_medium_alert_as_critical slider to specify the warning severitythat the PEM server will pass to Nagios if a medium alert is triggered:
If the is_nagios_medium_alert_as_critical flag is set to FALSE and the alertlevel is MEDIUM, the warning message will read WARNING.
4.6. Alerting 111
Postgres Enterprise Manager, Release 7.16
If the is_nagios_medium_alert_as_critical flag is set to TRUE and the alertlevel is MEDIUM, the warning message will read CRITICAL.
• Use the nagios_spool_retention_time parameter to specify the number of days ofnotification history that will be stored on the PEM server. The default value is 7 days.
After modifying parameter values, click the save icon (in the upper-right corner of the ServerConfiguration dialog) to preserve your changes.
4.6. Alerting 112
Postgres Enterprise Manager, Release 7.16
Creating the hosts.cfg and services.cfg File
The templates.cfg file (by default, located in /usr/local/nagios/etc/objects)specifies the properties of a generic-host and generic-service. The properties specify the parametersused in the hosts.cfg and services.cfg files.
In most cases (when PEM is installed in a default configuration), you will not be required tomodify the templates.cfg file before creating the hosts.cfg and services.cfg files.If necessary, you can modify the templates.cfg file to specify alternate values for parametersor to create new templates.
Before modifying the Nagios configuration file, use the following command to create a hosts.cfg file that contains information about the PEM hosts that reside on the local system:
psql -U postgres -p 5433 -d pem -A -t -c "select pem.create_nagios_host_config('generic-host')" > /usr/local/nagios/etc/objects/hosts.cfg
Then, use the following command to create a services.cfg file that contains information aboutthe PEM services that reside on the local system:
psql -U postgres -p 5433 -d pem -A -t -c "select pem.create_nagios_service_config('generic-service')" > /usr/local/nagios/etc/objects/services.cfg
If you wish to use a custom template.cfg file entry, specify the entry name in place ofgeneric-host or generic-service in the above commands.
4.6. Alerting 113
Postgres Enterprise Manager, Release 7.16
Modifying the Nagios Configuration File
After creating the host.cfg and services.cfg files, you must specify their location in theNagios configuration file (by default, /usr/local/nagios/etc/nagios.cfg). Modifythe configuration file, adding entries that specify the location of the files:
cfg_file=/usr/local/etc/objects/hosts.cfg
cfg_file=/usr/local/etc/objects/services.cfg
You can use the following command to confirm that Nagios is properly configured:
/usr/local/nagios/bin/nagios -v /usr/local/nagios/etc/nagios.cfg
After confirming that Nagios is configured correctly, restart the Nagios service:
/usr/local/nagios/bin/nagios -d /usr/local/nagios/etc/nagios.cfg
4.6. Alerting 114
CHAPTER 5
Capacity Manager
PEM’s Capacity Manager analyzes collected statistics (metrics) to generate a graph or table thatdisplays the historical usage statistics of an object, and can project the anticipated usage statisticsfor an object. You can configure Capacity Manager to collect and analyze metrics for a specifichost, server, database, or database object.
You can tailor the content of the Capacity Manager report by choosing a specific metric (or metrics)to include in the report, the time range over which the metrics were gathered, and a high or lowthreshold for the metrics analyzed. You can also specify a start and end date for the CapacityManager report. If the end date of the report specifies a time in the future, Capacity Manager willanalyze the historical usage of the selected object to extrapolate the projected object usage in thefuture.
To open Capacity Manager, select the Capacity Manager... option from the PEM clientManagement menu; the Capacity Manager wizard opens, displaying a tree control on theMetrics tab.
115
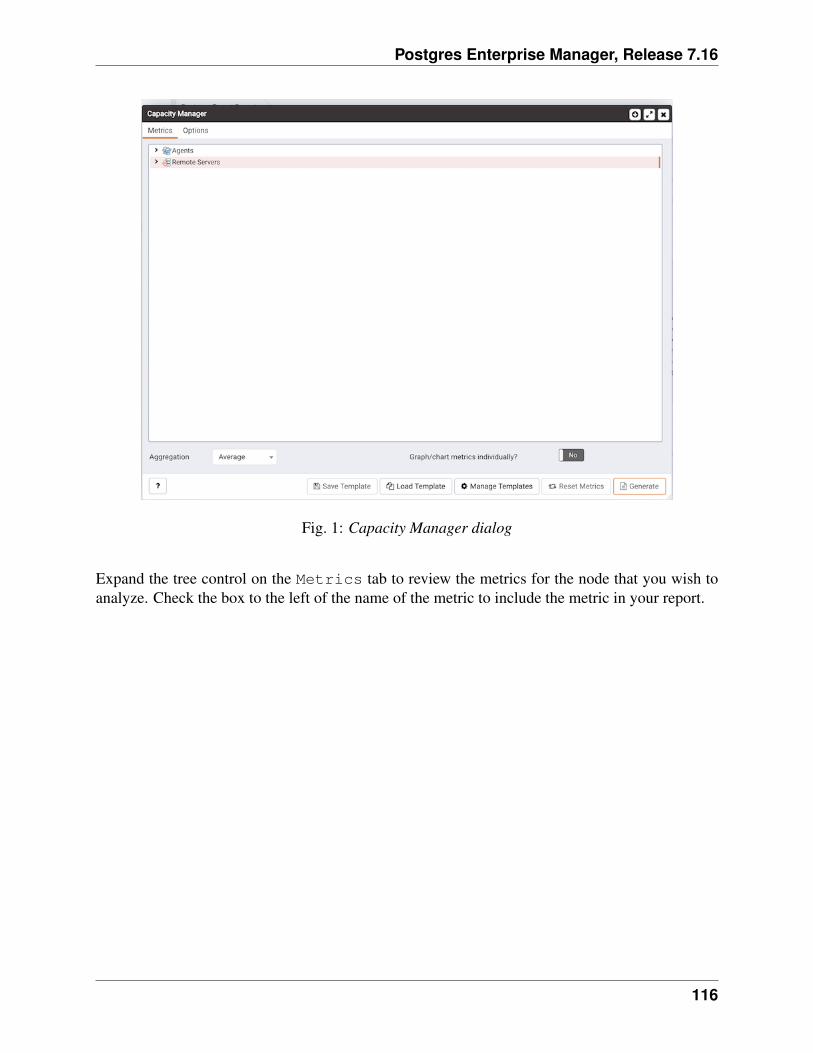
Postgres Enterprise Manager, Release 7.16
Fig. 1: Capacity Manager dialog
Expand the tree control on the Metrics tab to review the metrics for the node that you wish toanalyze. Check the box to the left of the name of the metric to include the metric in your report.
116
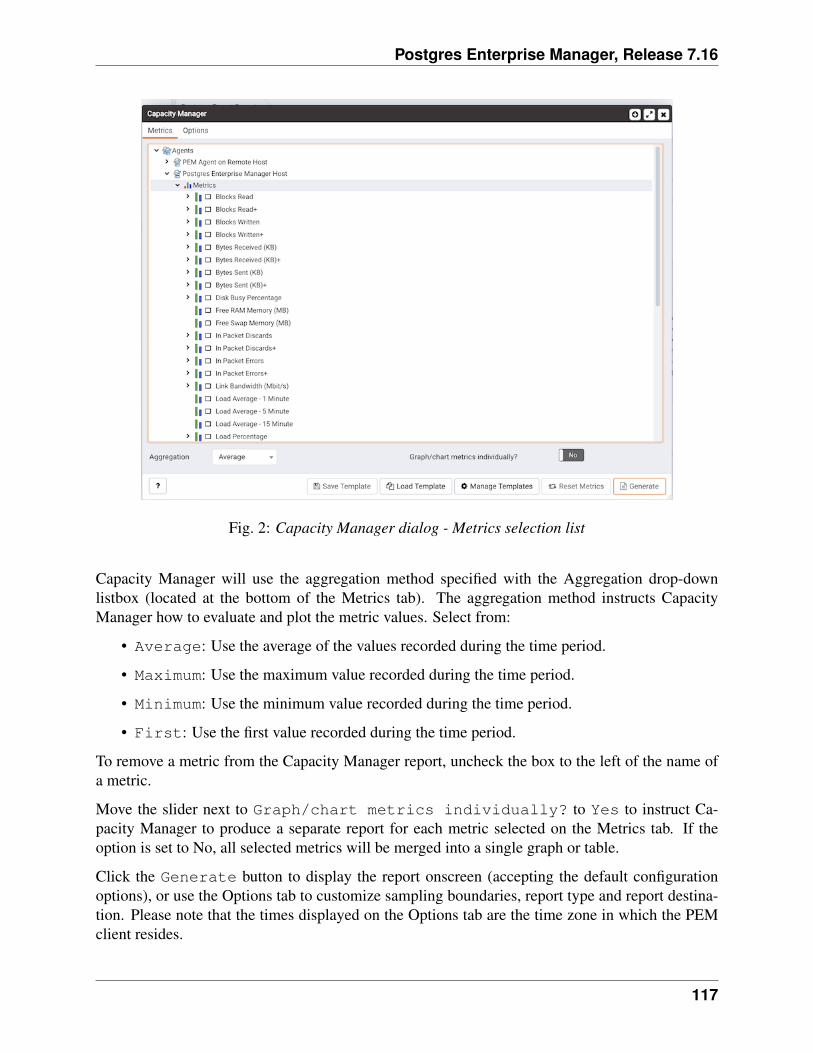
Postgres Enterprise Manager, Release 7.16
Fig. 2: Capacity Manager dialog - Metrics selection list
Capacity Manager will use the aggregation method specified with the Aggregation drop-downlistbox (located at the bottom of the Metrics tab). The aggregation method instructs CapacityManager how to evaluate and plot the metric values. Select from:
• Average: Use the average of the values recorded during the time period.
• Maximum: Use the maximum value recorded during the time period.
• Minimum: Use the minimum value recorded during the time period.
• First: Use the first value recorded during the time period.
To remove a metric from the Capacity Manager report, uncheck the box to the left of the name ofa metric.
Move the slider next to Graph/chart metrics individually? to Yes to instruct Ca-pacity Manager to produce a separate report for each metric selected on the Metrics tab. If theoption is set to No, all selected metrics will be merged into a single graph or table.
Click the Generate button to display the report onscreen (accepting the default configurationoptions), or use the Options tab to customize sampling boundaries, report type and report destina-tion. Please note that the times displayed on the Options tab are the time zone in which the PEMclient resides.
117
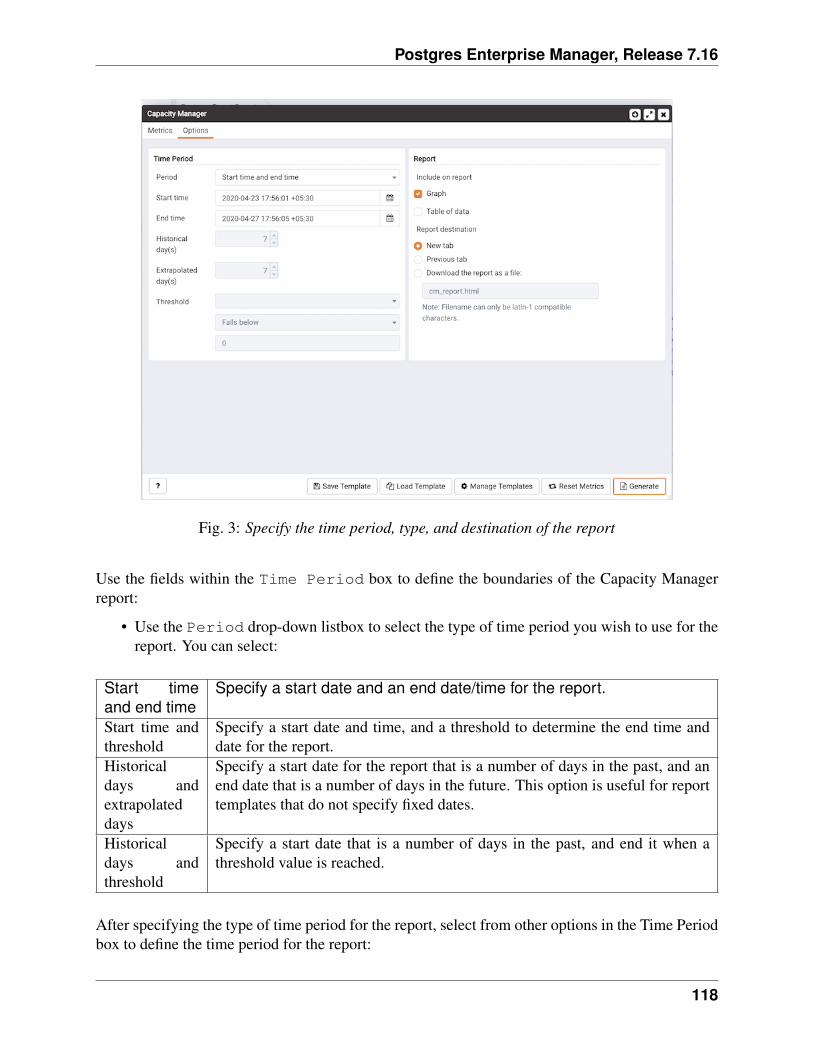
Postgres Enterprise Manager, Release 7.16
Fig. 3: Specify the time period, type, and destination of the report
Use the fields within the Time Period box to define the boundaries of the Capacity Managerreport:
• Use the Period drop-down listbox to select the type of time period you wish to use for thereport. You can select:
Start timeand end time
Specify a start date and an end date/time for the report.
Start time andthreshold
Specify a start date and time, and a threshold to determine the end time anddate for the report.
Historicaldays andextrapolateddays
Specify a start date for the report that is a number of days in the past, and anend date that is a number of days in the future. This option is useful for reporttemplates that do not specify fixed dates.
Historicaldays andthreshold
Specify a start date that is a number of days in the past, and end it when athreshold value is reached.
After specifying the type of time period for the report, select from other options in the Time Periodbox to define the time period for the report:
118
Postgres Enterprise Manager, Release 7.16
• Use the date and time selectors next to the Start time field to specify the starting dateand time of the sampling period, or select the number of Historical day(s) of data to includein the report. The date and time specified in the Start time field must not be later than thecurrent date/time.
By default, Capacity Manager will select a start time that is one week prior to the currentdate and time.
• The end boundary for the report can be a time, a number of days in the future, or the pointat which a selected metric reaches a user-specified threshold value. Use the date and timeselectors next to the End time field to specify an end boundary for the report, or select thenumber of Extrapolated day(s) of data to include in the report. The time specified in the Endtime field must be later than the time specified in the Start time field.
Note that if you select an end date and time in the future, Capacity Manager will use histor-ical usage information to extrapolate anticipated future usage. Since the projected usage isbased on the sampling of historical data, the accuracy of the future usage trend will improvewith a longer sampling period.
To specify a threshold value, use the drop-down listbox in the Threshold field to select ametric, an operator (Exceeds or Falls below), and enter a target value for the metric. If youchoose to define the end of the report using a threshold, the Capacity Manager report willterminate when the value for the selected metric exceeds or falls below the specified value.
The cm_max_end_date_in_years configuration parameter defines a default time value forthe end boundary of a Capacity Manager report. If you specify a threshold value as the end bound-ary of a report, and the anticipated usage of the boundary is not met before the maximum time haspassed, the report will terminate at the time specified by the cm_max_date_in_years parameter. Bydefault, cm_max_end_date_in_years is 5; you can use the Server Configuration dialog to modifythe value of cm_max_end_date_in_years.
The fields in the Report box specify the report type and destination. Use the Include onreport radio buttons to specify the type of report produced by Capacity Manager:
• Select Graph to instruct Capacity Manager to display the report in the form of a line graphin the PEM client window.
• Select Table of data to instruct Capacity Manager to display a table containing thereport data in the PEM client window.
• Select Graph and table of data to instruct Capacity Manager to display both a linegraph and a data table in the PEM client window.
Use the Report destination radio buttons to instruct Capacity Manager where to display orsave the report:
• Select New tab to instruct Capacity Manager to display the report on a new tab in the PEMclient. You must select New tab to display the first generation of a Capacity Manager report;for subsequent reports, you may select Previous tab.
119
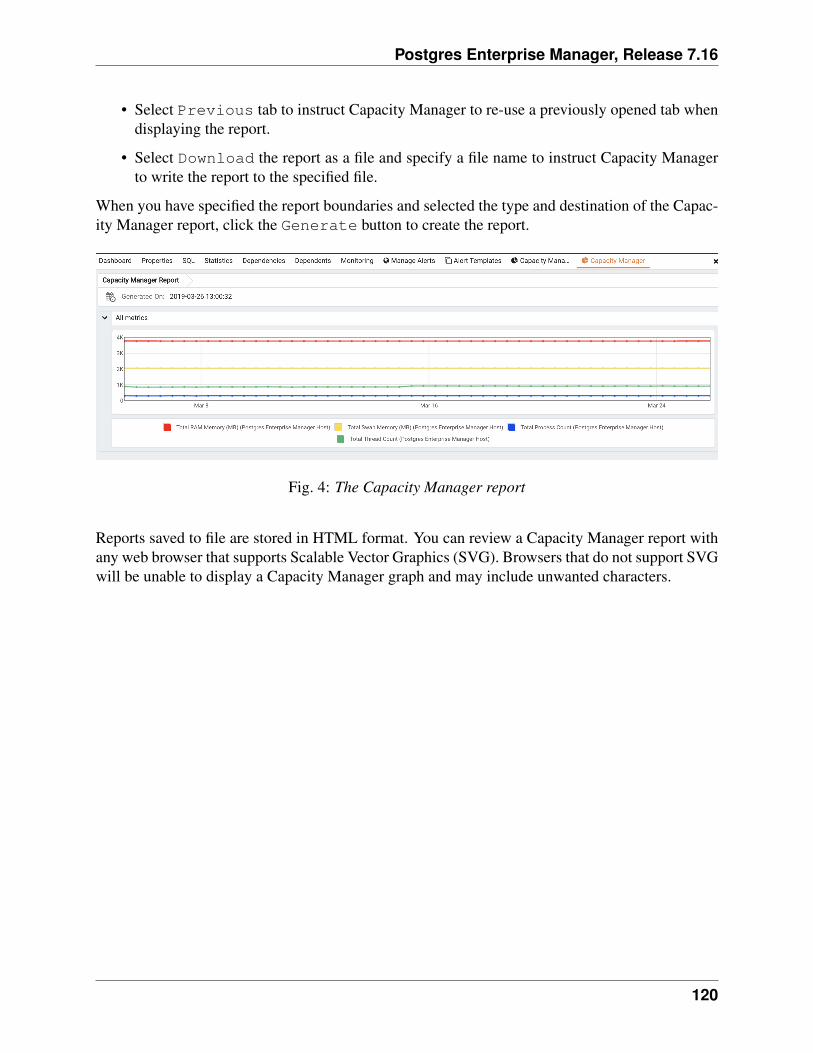
Postgres Enterprise Manager, Release 7.16
• Select Previous tab to instruct Capacity Manager to re-use a previously opened tab whendisplaying the report.
• Select Download the report as a file and specify a file name to instruct Capacity Managerto write the report to the specified file.
When you have specified the report boundaries and selected the type and destination of the Capac-ity Manager report, click the Generate button to create the report.
Fig. 4: The Capacity Manager report
Reports saved to file are stored in HTML format. You can review a Capacity Manager report withany web browser that supports Scalable Vector Graphics (SVG). Browsers that do not support SVGwill be unable to display a Capacity Manager graph and may include unwanted characters.
120
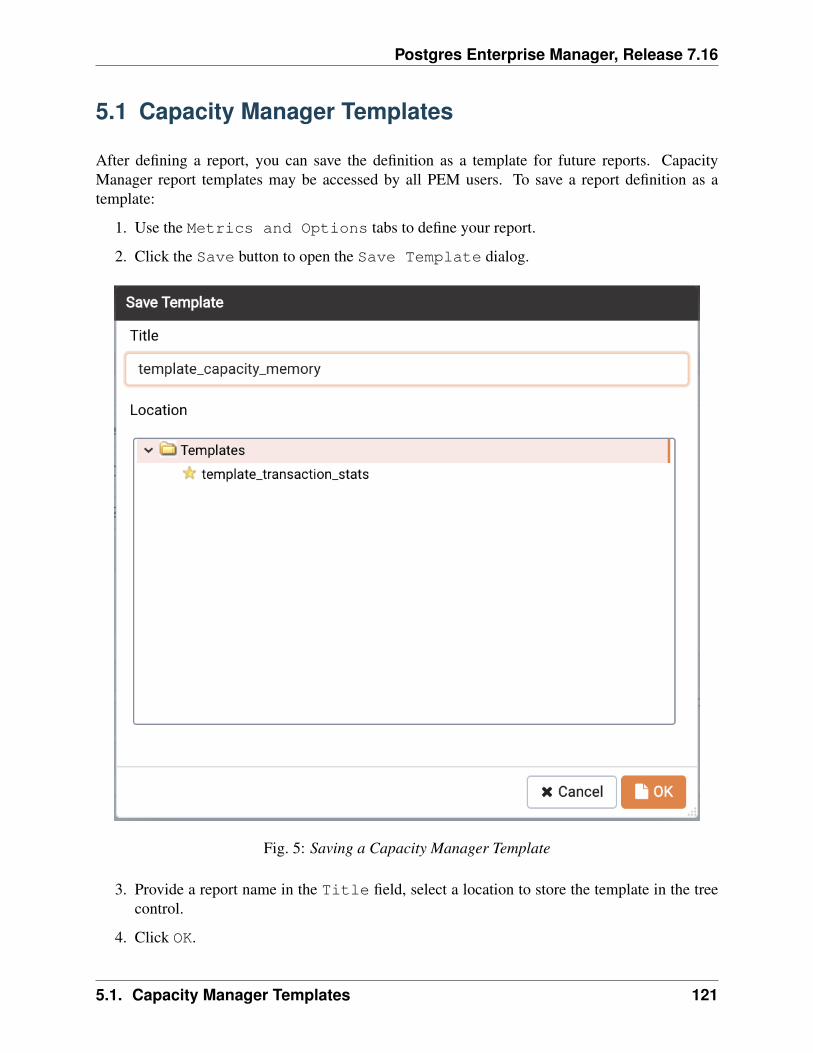
Postgres Enterprise Manager, Release 7.16
5.1 Capacity Manager Templates
After defining a report, you can save the definition as a template for future reports. CapacityManager report templates may be accessed by all PEM users. To save a report definition as atemplate:
1. Use the Metrics and Options tabs to define your report.
2. Click the Save button to open the Save Template dialog.
Fig. 5: Saving a Capacity Manager Template
3. Provide a report name in the Title field, select a location to store the template in the treecontrol.
4. Click OK.
5.1. Capacity Manager Templates 121
Postgres Enterprise Manager, Release 7.16
When creating a report, you can use the Load Template button to browse and open an existingtemplate. Once opened, the report definition may be modified if required, and optionally savedagain, either as a new template, or overwriting the original template.
Use the Manage Templates button open a dialog that allows you to rename or remove un-wanted templates.
5.1. Capacity Manager Templates 122

CHAPTER 6
Audit Manager
You can use the PEM Audit Manager to simplify audit log configuration for Advanced Serverinstances. With the Audit Manager, you can configure logging attributes such as:
• How often log files are to be collected by PEM
• The type of database activities that are included in the log files
• How often (and when) log files are to be rotated
Audit logs may include the following activities:
• All connections made to the database instance
• Failed connection attempts
• Disconnections from the database instance
• All queries (SELECT statements)
• All DML statements (INSERT, UPDATE, DELETE)
• All DDL statements (e.g., CREATE, DROP, ALTER)
Once the audit logs are stored on the PEM server, you can use the Audit Log dashboard to reviewthe information in an easy-to-read form. The Audit Log dashboard allows you to filter the log fileby timestamp range (when an activity occurred), the database on which the activity occurred, theuser performing the activity, or the type of command being invoked.
123
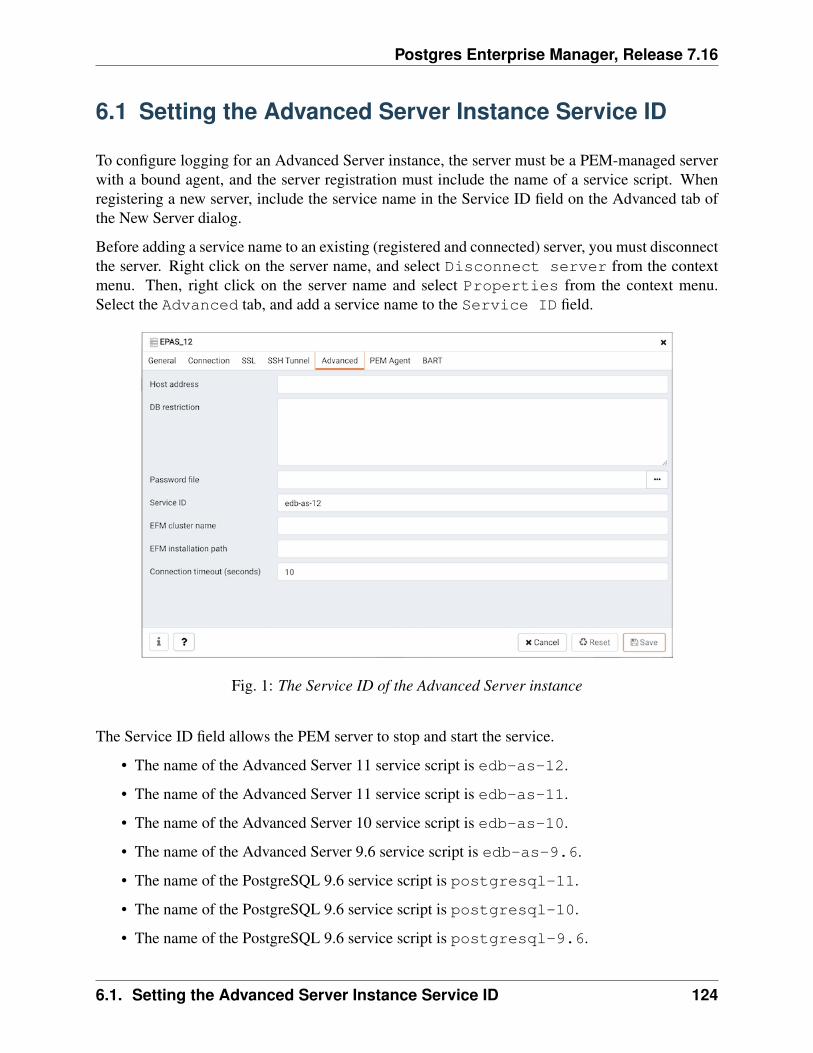
Postgres Enterprise Manager, Release 7.16
6.1 Setting the Advanced Server Instance Service ID
To configure logging for an Advanced Server instance, the server must be a PEM-managed serverwith a bound agent, and the server registration must include the name of a service script. Whenregistering a new server, include the service name in the Service ID field on the Advanced tab ofthe New Server dialog.
Before adding a service name to an existing (registered and connected) server, you must disconnectthe server. Right click on the server name, and select Disconnect server from the contextmenu. Then, right click on the server name and select Properties from the context menu.Select the Advanced tab, and add a service name to the Service ID field.
Fig. 1: The Service ID of the Advanced Server instance
The Service ID field allows the PEM server to stop and start the service.
• The name of the Advanced Server 11 service script is edb-as-12.
• The name of the Advanced Server 11 service script is edb-as-11.
• The name of the Advanced Server 10 service script is edb-as-10.
• The name of the Advanced Server 9.6 service script is edb-as-9.6.
• The name of the PostgreSQL 9.6 service script is postgresql-11.
• The name of the PostgreSQL 9.6 service script is postgresql-10.
• The name of the PostgreSQL 9.6 service script is postgresql-9.6.
6.1. Setting the Advanced Server Instance Service ID 124
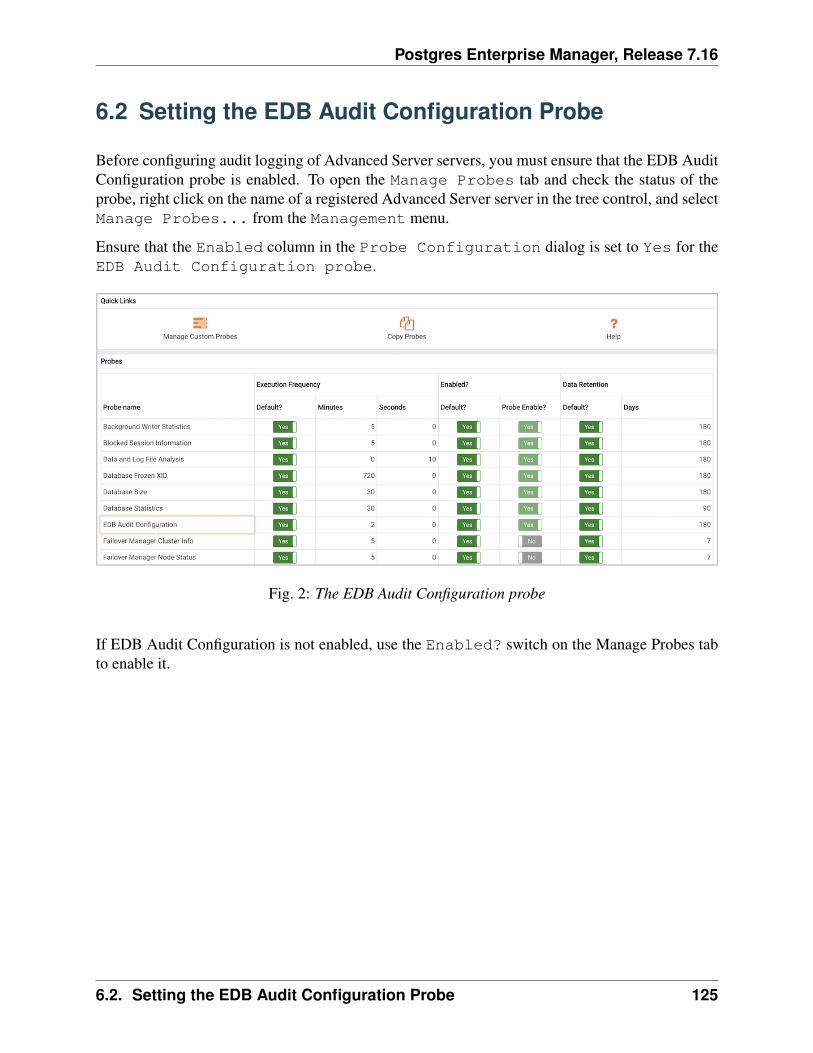
Postgres Enterprise Manager, Release 7.16
6.2 Setting the EDB Audit Configuration Probe
Before configuring audit logging of Advanced Server servers, you must ensure that the EDB AuditConfiguration probe is enabled. To open the Manage Probes tab and check the status of theprobe, right click on the name of a registered Advanced Server server in the tree control, and selectManage Probes... from the Management menu.
Ensure that the Enabled column in the Probe Configuration dialog is set to Yes for theEDB Audit Configuration probe.
Fig. 2: The EDB Audit Configuration probe
If EDB Audit Configuration is not enabled, use the Enabled? switch on the Manage Probes tabto enable it.
6.2. Setting the EDB Audit Configuration Probe 125
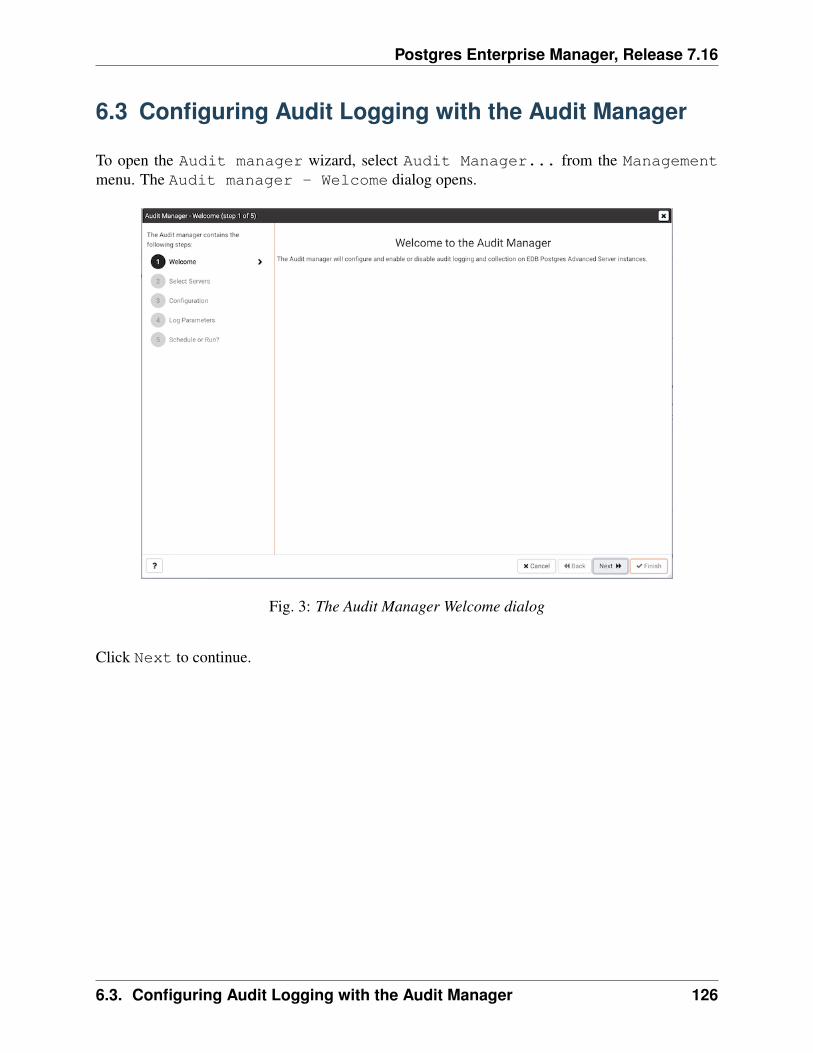
Postgres Enterprise Manager, Release 7.16
6.3 Configuring Audit Logging with the Audit Manager
To open the Audit manager wizard, select Audit Manager... from the Managementmenu. The Audit manager - Welcome dialog opens.
Fig. 3: The Audit Manager Welcome dialog
Click Next to continue.
6.3. Configuring Audit Logging with the Audit Manager 126
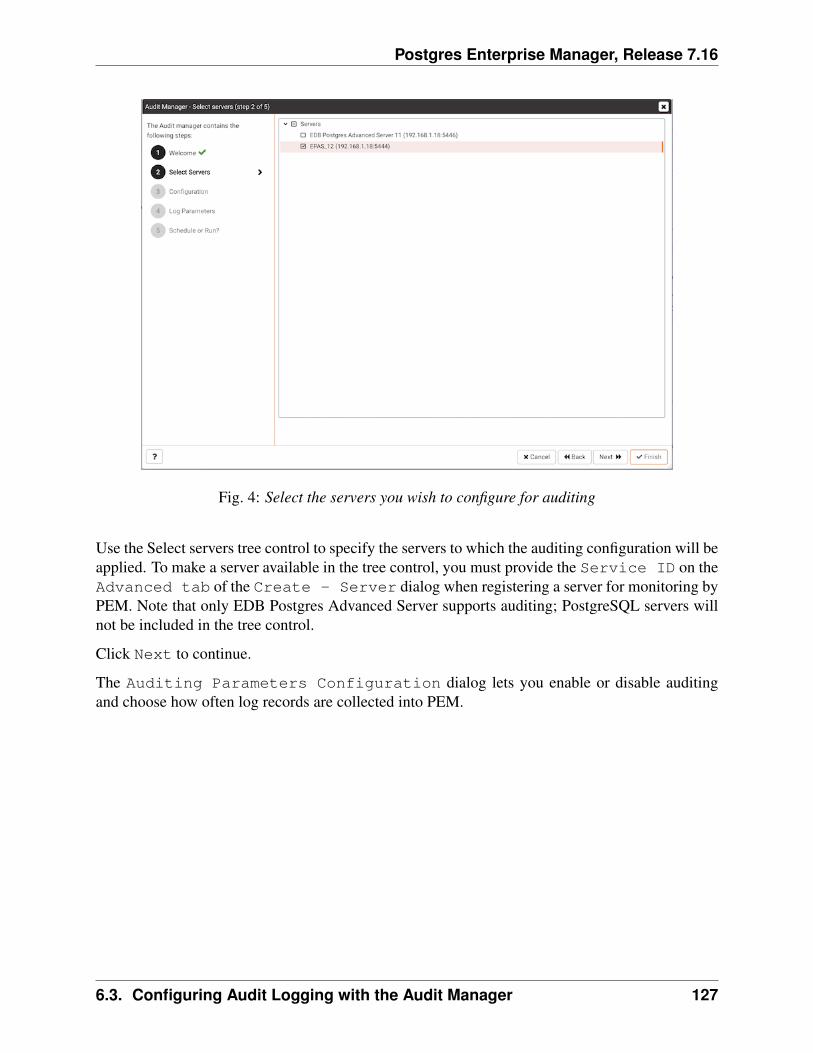
Postgres Enterprise Manager, Release 7.16
Fig. 4: Select the servers you wish to configure for auditing
Use the Select servers tree control to specify the servers to which the auditing configuration will beapplied. To make a server available in the tree control, you must provide the Service ID on theAdvanced tab of the Create - Server dialog when registering a server for monitoring byPEM. Note that only EDB Postgres Advanced Server supports auditing; PostgreSQL servers willnot be included in the tree control.
Click Next to continue.
The Auditing Parameters Configuration dialog lets you enable or disable auditingand choose how often log records are collected into PEM.
6.3. Configuring Audit Logging with the Audit Manager 127
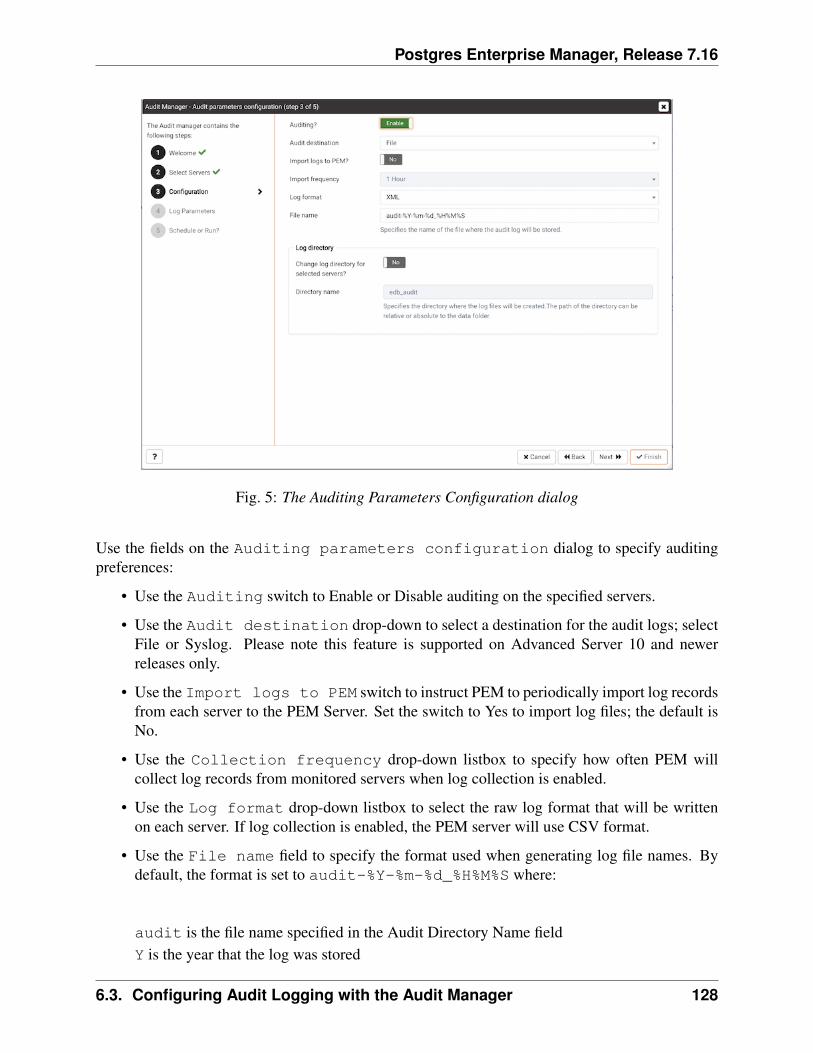
Postgres Enterprise Manager, Release 7.16
Fig. 5: The Auditing Parameters Configuration dialog
Use the fields on the Auditing parameters configuration dialog to specify auditingpreferences:
• Use the Auditing switch to Enable or Disable auditing on the specified servers.
• Use the Audit destination drop-down to select a destination for the audit logs; selectFile or Syslog. Please note this feature is supported on Advanced Server 10 and newerreleases only.
• Use the Import logs to PEM switch to instruct PEM to periodically import log recordsfrom each server to the PEM Server. Set the switch to Yes to import log files; the default isNo.
• Use the Collection frequency drop-down listbox to specify how often PEM willcollect log records from monitored servers when log collection is enabled.
• Use the Log format drop-down listbox to select the raw log format that will be writtenon each server. If log collection is enabled, the PEM server will use CSV format.
• Use the File name field to specify the format used when generating log file names. Bydefault, the format is set to audit-%Y-%m-%d_%H%M%S where:
audit is the file name specified in the Audit Directory Name fieldY is the year that the log was stored
6.3. Configuring Audit Logging with the Audit Manager 128
Postgres Enterprise Manager, Release 7.16
m is the month that the log was storedd is the day that the log was storedH is the hour that the log was storedM is the minute that the log was storedS is the second that the log was stored
• Check the box next to Change Log Directory for selected servers? anduse the Audit Directory Name field to specify a directory name to which the auditlogs will be written. The directory will reside beneath the data directory on the PEM server.
Use fields in the Log directory box to specify information about the directory in which thelog files will be saved:
• Move the Change log directory for selected servers? switch to Yes toenable the Directory name field.
• Use the Directory name field to specify the name of the directory on each server intowhich audit logs will be written. The directory specified will be created as a sub-directoryof the data directory on the server.
Click Next to continue.
The Audit log configuration dialog is only available if you have enabled auditing on theAuditing parameters configuration dialog.
6.3. Configuring Audit Logging with the Audit Manager 129
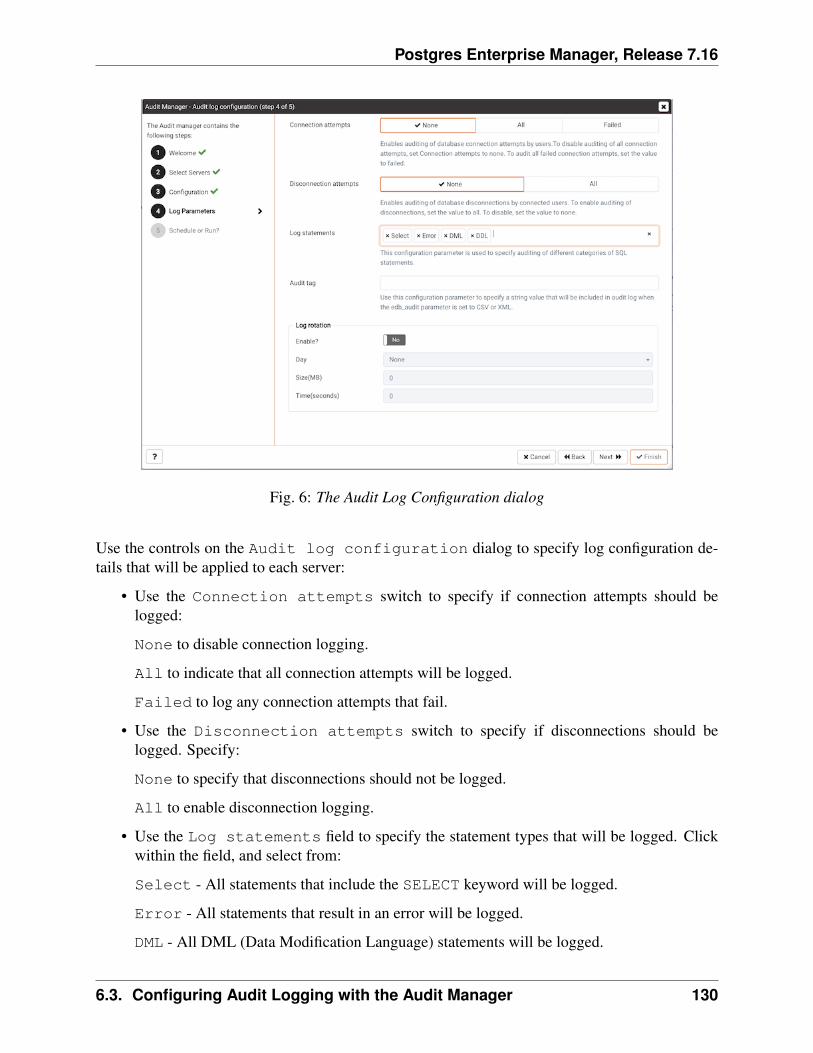
Postgres Enterprise Manager, Release 7.16
Fig. 6: The Audit Log Configuration dialog
Use the controls on the Audit log configuration dialog to specify log configuration de-tails that will be applied to each server:
• Use the Connection attempts switch to specify if connection attempts should belogged:
None to disable connection logging.
All to indicate that all connection attempts will be logged.
Failed to log any connection attempts that fail.
• Use the Disconnection attempts switch to specify if disconnections should belogged. Specify:
None to specify that disconnections should not be logged.
All to enable disconnection logging.
• Use the Log statements field to specify the statement types that will be logged. Clickwithin the field, and select from:
Select - All statements that include the SELECT keyword will be logged.
Error - All statements that result in an error will be logged.
DML - All DML (Data Modification Language) statements will be logged.
6.3. Configuring Audit Logging with the Audit Manager 130
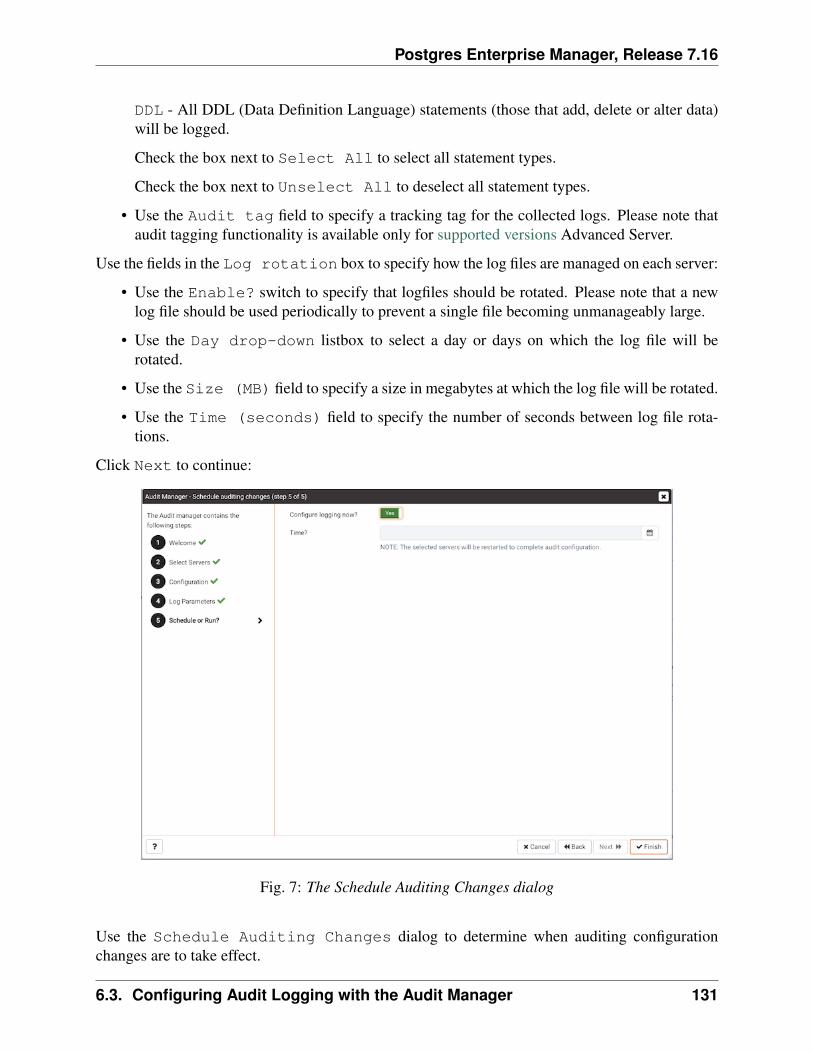
Postgres Enterprise Manager, Release 7.16
DDL - All DDL (Data Definition Language) statements (those that add, delete or alter data)will be logged.
Check the box next to Select All to select all statement types.
Check the box next to Unselect All to deselect all statement types.
• Use the Audit tag field to specify a tracking tag for the collected logs. Please note thataudit tagging functionality is available only for supported versions Advanced Server.
Use the fields in the Log rotation box to specify how the log files are managed on each server:
• Use the Enable? switch to specify that logfiles should be rotated. Please note that a newlog file should be used periodically to prevent a single file becoming unmanageably large.
• Use the Day drop-down listbox to select a day or days on which the log file will berotated.
• Use the Size (MB) field to specify a size in megabytes at which the log file will be rotated.
• Use the Time (seconds) field to specify the number of seconds between log file rota-tions.
Click Next to continue:
Fig. 7: The Schedule Auditing Changes dialog
Use the Schedule Auditing Changes dialog to determine when auditing configurationchanges are to take effect.
6.3. Configuring Audit Logging with the Audit Manager 131
Postgres Enterprise Manager, Release 7.16
• Select Configure logging now? if you want the auditing configuration changes totake place immediately. The affected database servers will be restarted so the auditingchanges can take effect.
• Use the Time? selector to schedule the auditing configuration changes to take place at somepoint in the future. Select the desired date and time from the drop-down lists. The affecteddatabase servers will be restarted at the specified date/time to put the auditing changes intoeffect.
Click Finish to complete the auditing configuration process.
The Audit Manager will schedule a job to apply the configuration to each server. The job willconsist of two tasks: one to update the audit logging configuration on the server, and one to restartthe server with the new configuration.
You can use the Scheduled Tasks tab to review a list of Scheduled jobs. To open theScheduled Tasks tab, highlight the name of a server or agent and select ScheduledTasks... from the Management menu.
6.3. Configuring Audit Logging with the Audit Manager 132
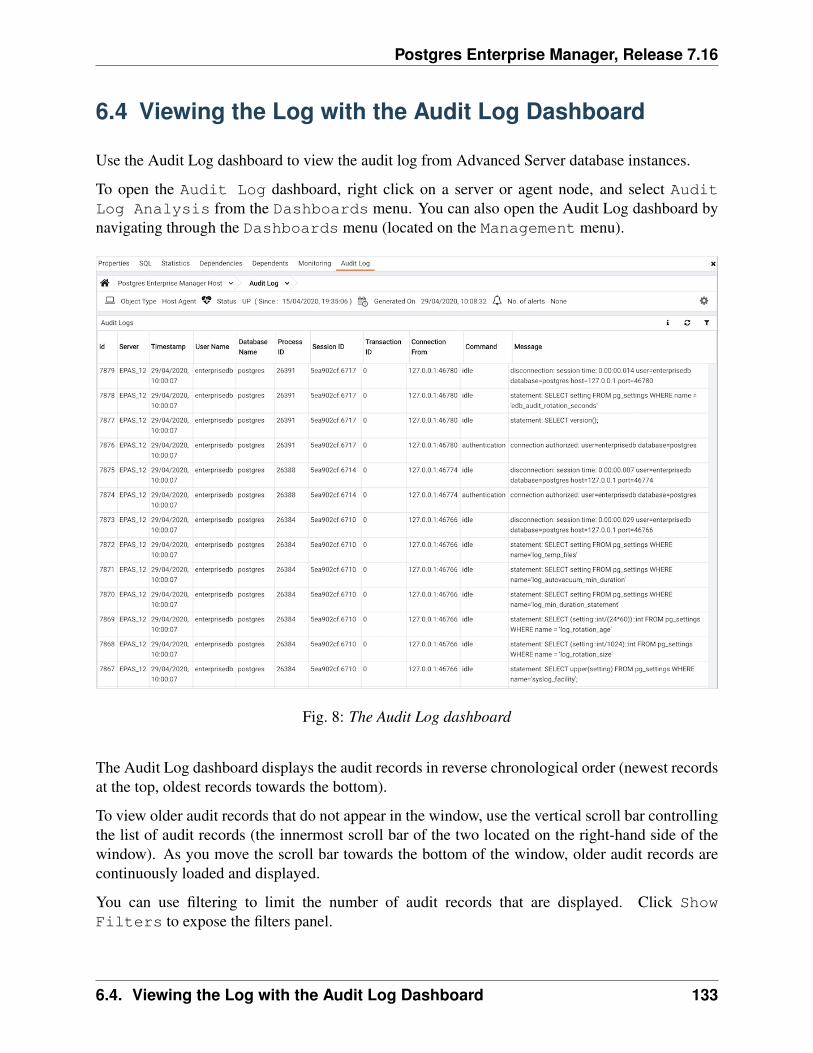
Postgres Enterprise Manager, Release 7.16
6.4 Viewing the Log with the Audit Log Dashboard
Use the Audit Log dashboard to view the audit log from Advanced Server database instances.
To open the Audit Log dashboard, right click on a server or agent node, and select AuditLog Analysis from the Dashboards menu. You can also open the Audit Log dashboard bynavigating through the Dashboards menu (located on the Management menu).
Fig. 8: The Audit Log dashboard
The Audit Log dashboard displays the audit records in reverse chronological order (newest recordsat the top, oldest records towards the bottom).
To view older audit records that do not appear in the window, use the vertical scroll bar controllingthe list of audit records (the innermost scroll bar of the two located on the right-hand side of thewindow). As you move the scroll bar towards the bottom of the window, older audit records arecontinuously loaded and displayed.
You can use filtering to limit the number of audit records that are displayed. Click ShowFilters to expose the filters panel.
6.4. Viewing the Log with the Audit Log Dashboard 133
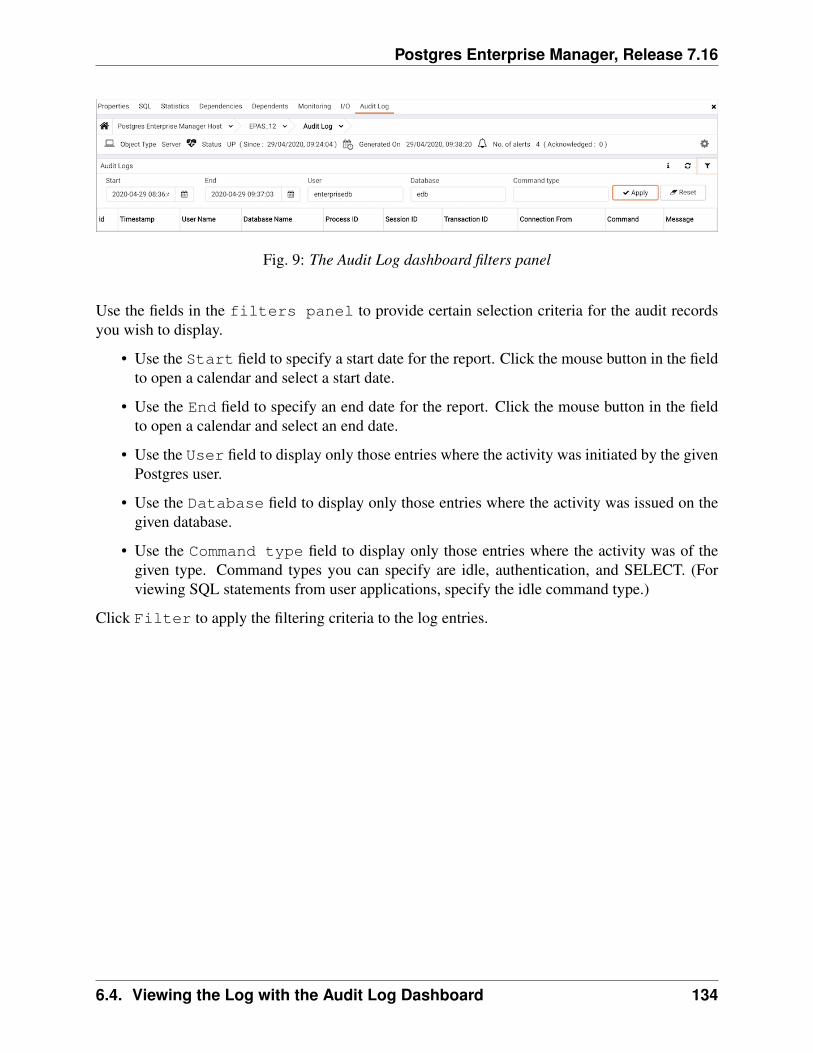
Postgres Enterprise Manager, Release 7.16
Fig. 9: The Audit Log dashboard filters panel
Use the fields in the filters panel to provide certain selection criteria for the audit recordsyou wish to display.
• Use the Start field to specify a start date for the report. Click the mouse button in the fieldto open a calendar and select a start date.
• Use the End field to specify an end date for the report. Click the mouse button in the fieldto open a calendar and select an end date.
• Use the User field to display only those entries where the activity was initiated by the givenPostgres user.
• Use the Database field to display only those entries where the activity was issued on thegiven database.
• Use the Command type field to display only those entries where the activity was of thegiven type. Command types you can specify are idle, authentication, and SELECT. (Forviewing SQL statements from user applications, specify the idle command type.)
Click Filter to apply the filtering criteria to the log entries.
6.4. Viewing the Log with the Audit Log Dashboard 134
CHAPTER 7
Log Manager
You can use the PEM Log Manager to simplify server log configuration for Postgres instances.With the Log Manager, you can modify all of your server log parameters with a click:
• Where log files are written
• How often log files are written
• The type of information written to log files
• The format of log file entries
• Log rotation properties
To configure logging for a Postgres instance, the server must be registered as a PEM-managedserver, and the registration information must include the name of a service script.
To open the Log Manager, select the Log Manager... option from the Managementmenuof the PEM client. The wizard opens, welcoming you to the Log Manager.
135
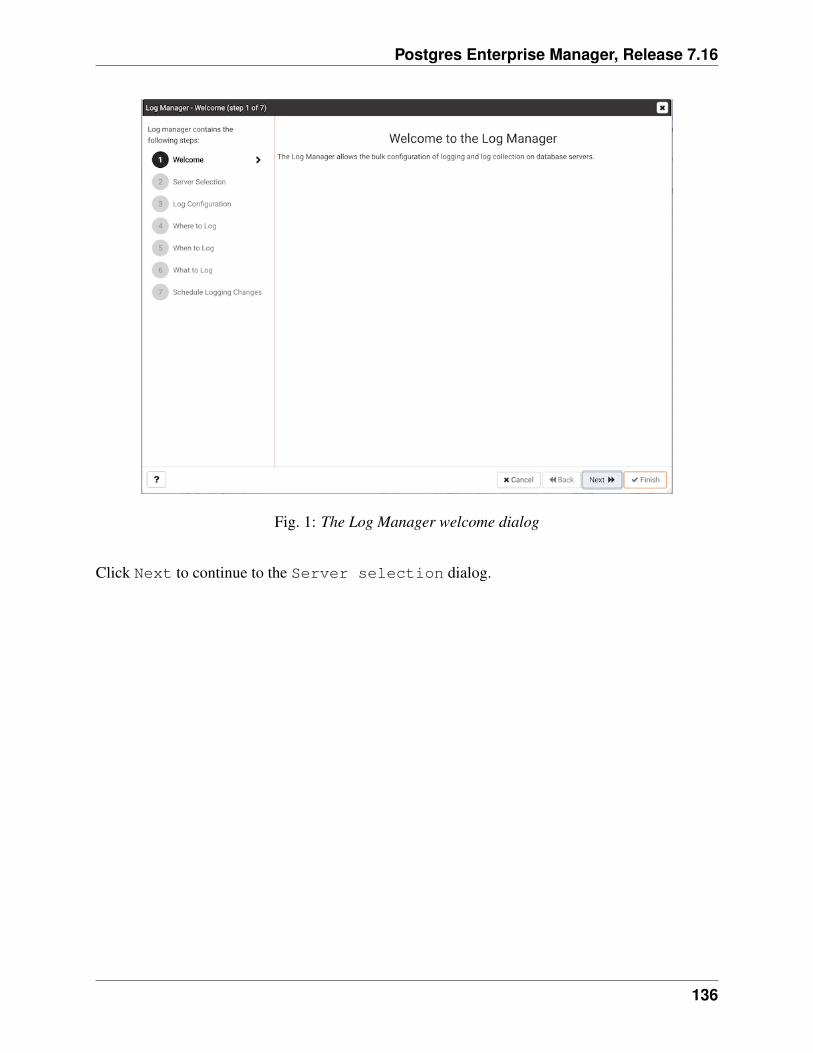
Postgres Enterprise Manager, Release 7.16
Fig. 1: The Log Manager welcome dialog
Click Next to continue to the Server selection dialog.
136
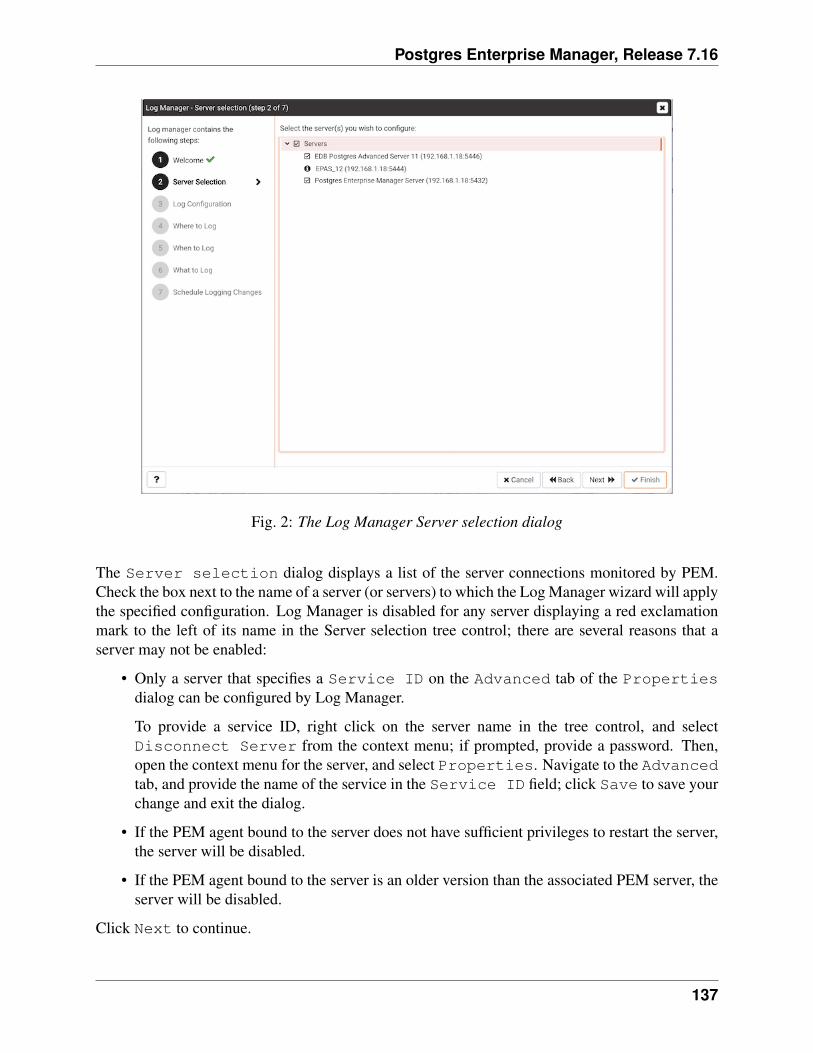
Postgres Enterprise Manager, Release 7.16
Fig. 2: The Log Manager Server selection dialog
The Server selection dialog displays a list of the server connections monitored by PEM.Check the box next to the name of a server (or servers) to which the Log Manager wizard will applythe specified configuration. Log Manager is disabled for any server displaying a red exclamationmark to the left of its name in the Server selection tree control; there are several reasons that aserver may not be enabled:
• Only a server that specifies a Service ID on the Advanced tab of the Propertiesdialog can be configured by Log Manager.
To provide a service ID, right click on the server name in the tree control, and selectDisconnect Server from the context menu; if prompted, provide a password. Then,open the context menu for the server, and select Properties. Navigate to the Advancedtab, and provide the name of the service in the Service ID field; click Save to save yourchange and exit the dialog.
• If the PEM agent bound to the server does not have sufficient privileges to restart the server,the server will be disabled.
• If the PEM agent bound to the server is an older version than the associated PEM server, theserver will be disabled.
Click Next to continue.
137
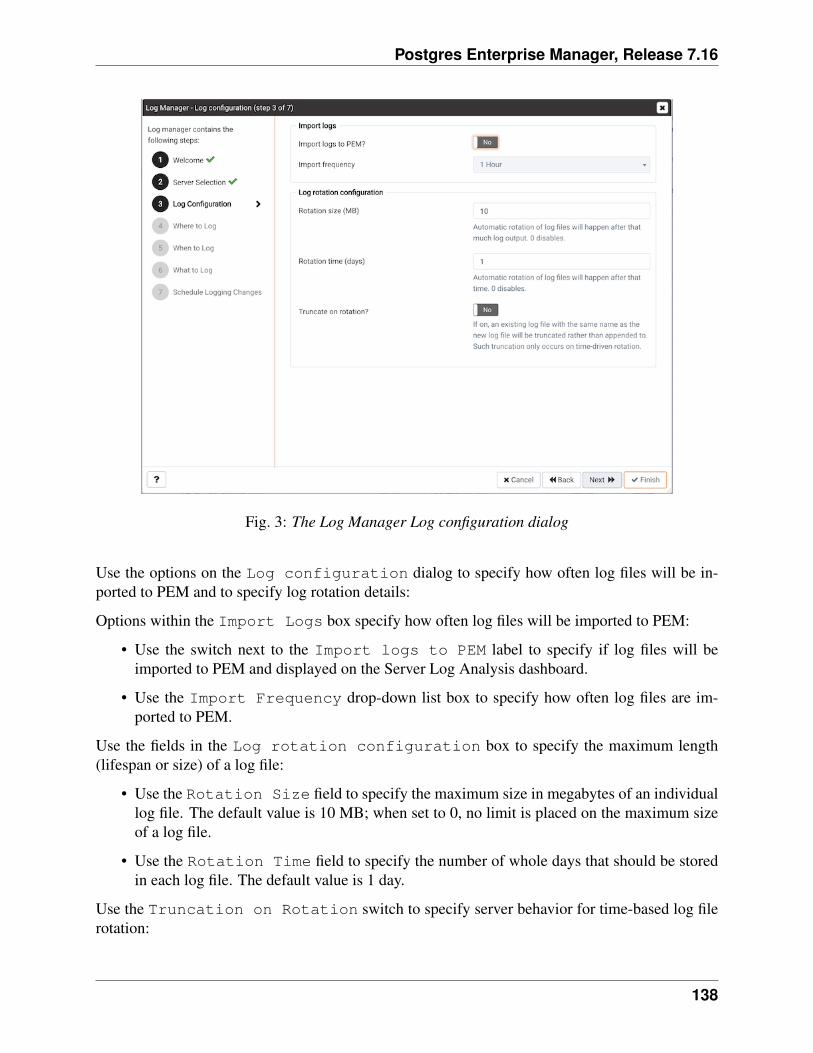
Postgres Enterprise Manager, Release 7.16
Fig. 3: The Log Manager Log configuration dialog
Use the options on the Log configuration dialog to specify how often log files will be in-ported to PEM and to specify log rotation details:
Options within the Import Logs box specify how often log files will be imported to PEM:
• Use the switch next to the Import logs to PEM label to specify if log files will beimported to PEM and displayed on the Server Log Analysis dashboard.
• Use the Import Frequency drop-down list box to specify how often log files are im-ported to PEM.
Use the fields in the Log rotation configuration box to specify the maximum length(lifespan or size) of a log file:
• Use the Rotation Size field to specify the maximum size in megabytes of an individuallog file. The default value is 10 MB; when set to 0, no limit is placed on the maximum sizeof a log file.
• Use the Rotation Time field to specify the number of whole days that should be storedin each log file. The default value is 1 day.
Use the Truncation on Rotation switch to specify server behavior for time-based log filerotation:
138
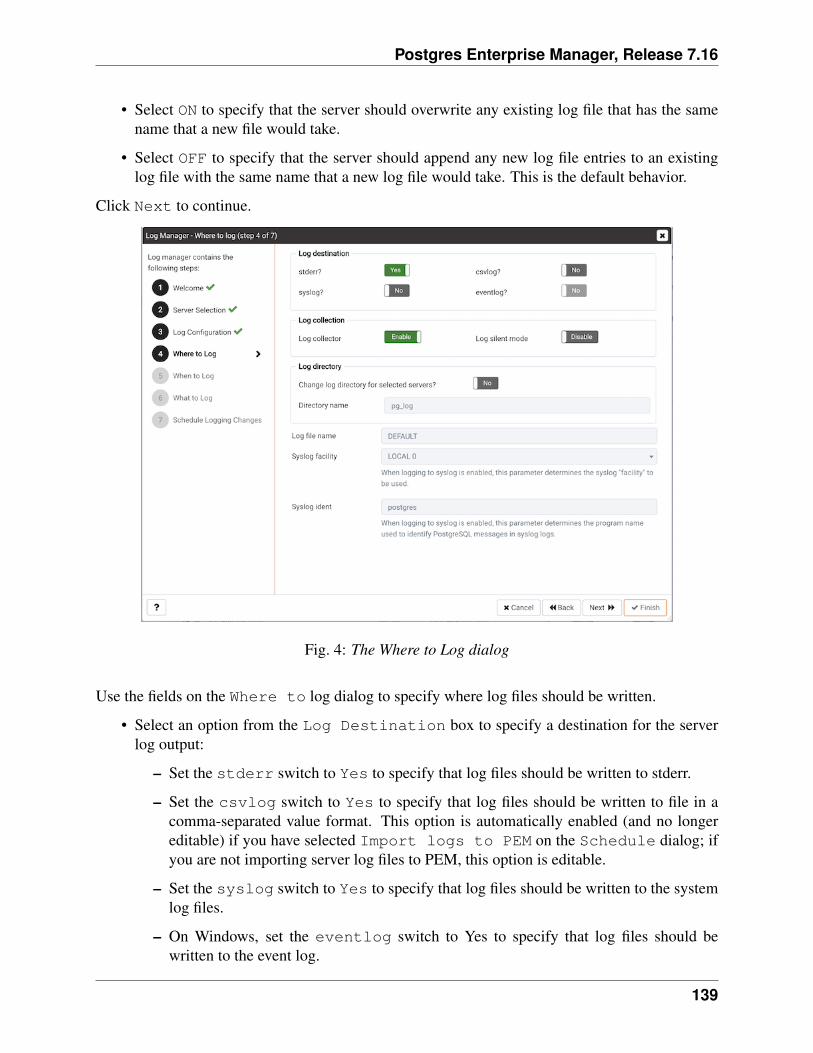
Postgres Enterprise Manager, Release 7.16
• Select ON to specify that the server should overwrite any existing log file that has the samename that a new file would take.
• Select OFF to specify that the server should append any new log file entries to an existinglog file with the same name that a new log file would take. This is the default behavior.
Click Next to continue.
Fig. 4: The Where to Log dialog
Use the fields on the Where to log dialog to specify where log files should be written.
• Select an option from the Log Destination box to specify a destination for the serverlog output:
– Set the stderr switch to Yes to specify that log files should be written to stderr.
– Set the csvlog switch to Yes to specify that log files should be written to file in acomma-separated value format. This option is automatically enabled (and no longereditable) if you have selected Import logs to PEM on the Schedule dialog; ifyou are not importing server log files to PEM, this option is editable.
– Set the syslog switch to Yes to specify that log files should be written to the systemlog files.
– On Windows, set the eventlog switch to Yes to specify that log files should bewritten to the event log.
139
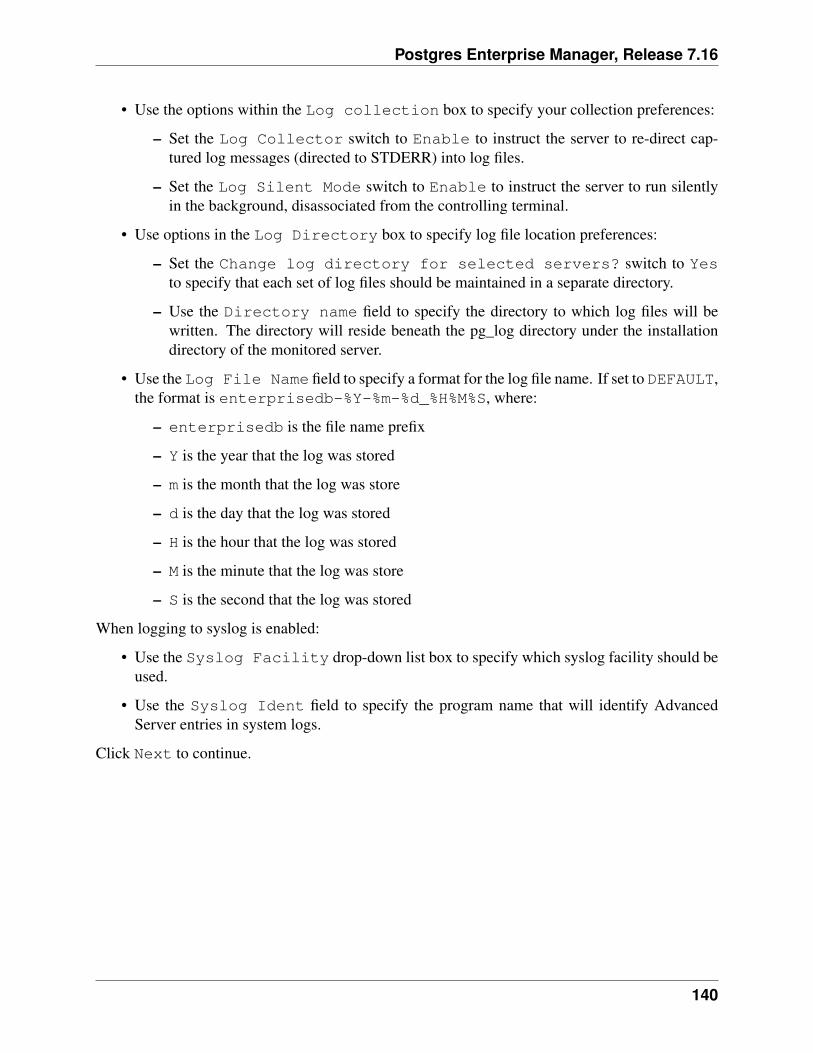
Postgres Enterprise Manager, Release 7.16
• Use the options within the Log collection box to specify your collection preferences:
– Set the Log Collector switch to Enable to instruct the server to re-direct cap-tured log messages (directed to STDERR) into log files.
– Set the Log Silent Mode switch to Enable to instruct the server to run silentlyin the background, disassociated from the controlling terminal.
• Use options in the Log Directory box to specify log file location preferences:
– Set the Change log directory for selected servers? switch to Yesto specify that each set of log files should be maintained in a separate directory.
– Use the Directory name field to specify the directory to which log files will bewritten. The directory will reside beneath the pg_log directory under the installationdirectory of the monitored server.
• Use the Log File Name field to specify a format for the log file name. If set to DEFAULT,the format is enterprisedb-%Y-%m-%d_%H%M%S, where:
– enterprisedb is the file name prefix
– Y is the year that the log was stored
– m is the month that the log was store
– d is the day that the log was stored
– H is the hour that the log was stored
– M is the minute that the log was store
– S is the second that the log was stored
When logging to syslog is enabled:
• Use the Syslog Facility drop-down list box to specify which syslog facility should beused.
• Use the Syslog Ident field to specify the program name that will identify AdvancedServer entries in system logs.
Click Next to continue.
140
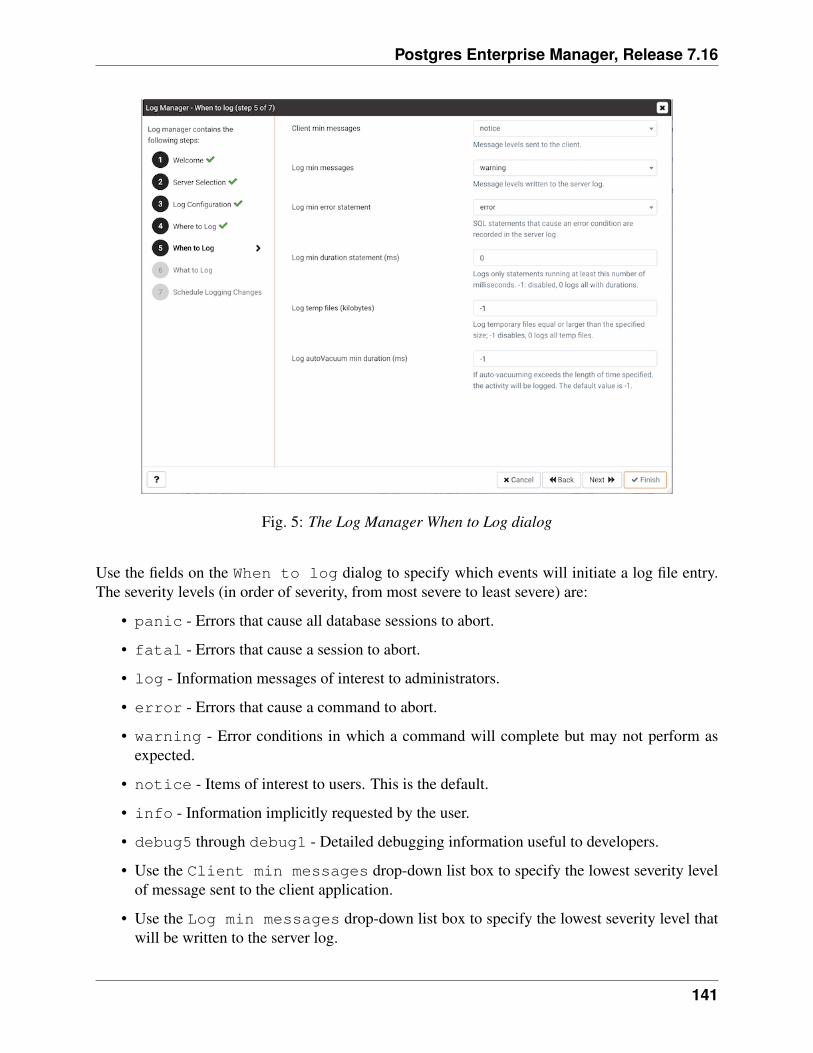
Postgres Enterprise Manager, Release 7.16
Fig. 5: The Log Manager When to Log dialog
Use the fields on the When to log dialog to specify which events will initiate a log file entry.The severity levels (in order of severity, from most severe to least severe) are:
• panic - Errors that cause all database sessions to abort.
• fatal - Errors that cause a session to abort.
• log - Information messages of interest to administrators.
• error - Errors that cause a command to abort.
• warning - Error conditions in which a command will complete but may not perform asexpected.
• notice - Items of interest to users. This is the default.
• info - Information implicitly requested by the user.
• debug5 through debug1 - Detailed debugging information useful to developers.
• Use the Client min messages drop-down list box to specify the lowest severity levelof message sent to the client application.
• Use the Log min messages drop-down list box to specify the lowest severity level thatwill be written to the server log.
141
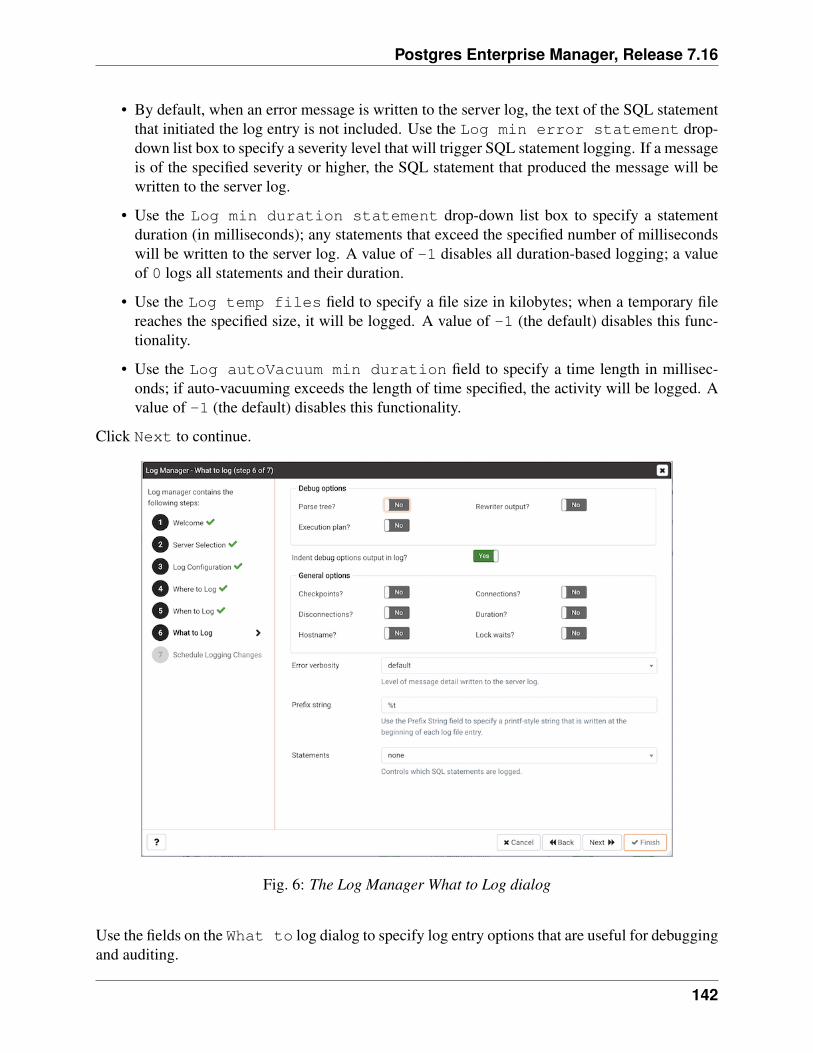
Postgres Enterprise Manager, Release 7.16
• By default, when an error message is written to the server log, the text of the SQL statementthat initiated the log entry is not included. Use the Log min error statement drop-down list box to specify a severity level that will trigger SQL statement logging. If a messageis of the specified severity or higher, the SQL statement that produced the message will bewritten to the server log.
• Use the Log min duration statement drop-down list box to specify a statementduration (in milliseconds); any statements that exceed the specified number of millisecondswill be written to the server log. A value of -1 disables all duration-based logging; a valueof 0 logs all statements and their duration.
• Use the Log temp files field to specify a file size in kilobytes; when a temporary filereaches the specified size, it will be logged. A value of -1 (the default) disables this func-tionality.
• Use the Log autoVacuum min duration field to specify a time length in millisec-onds; if auto-vacuuming exceeds the length of time specified, the activity will be logged. Avalue of -1 (the default) disables this functionality.
Click Next to continue.
Fig. 6: The Log Manager What to Log dialog
Use the fields on the What to log dialog to specify log entry options that are useful for debuggingand auditing.
142
Postgres Enterprise Manager, Release 7.16
The switches in the Debug options box instruct the server to include information in the logfiles related to query execution that may be of interest to a developer:
• Set the Parse tree switch to Yes to instruct the server to include the parse tree in the logfile.
• Set the Rewriter output switch to Yes to instruct the server to include query rewriteroutput in the log file.
• Set the Execution plan switch to Yes to instruct the server to include the execution planfor each executed query in the log file.
When the Indent Debug Options Output in Log switch is set to Yes, the server in-dents each line that contains a parse tree entry, a query rewriter entry or query execution plan entry.While indentation makes the resulting log file more readable, it does result in a longer log file.
Use the switches in the General Options box to instruct the server to include auditing infor-mation in the log file:
• Set the Checkpoints switch to Yes to include checkpoints and restartpoints in the serverlog.
• Set the Connections switch to Yes to include each attempted connection to the server(as well as successfully authenticated connections) in the server log.
• Set the Disconnections switch to Yes to include a server log entry for each terminatedsession that provides the session information and session duration.
• Set the Duration switch to Yes to include the amount of time required to execute eachlogged statement in the server log.
• Set the Hostname switch to Yes to include both the IP address and host name in eachserver log entry (by default, only the IP address is logged). Please note that this may cause aperformance penalty.
• Set the Lock Waits switch to Yes to instruct the server to write a log entry for any sessionthat waits longer than the time specified in the deadlock_timeout parameter to acquire a lock.This is useful when trying to determine if lock waits are the cause of poor performance.
Use the Error verbosity drop-down list box to specify the detail written to each entry in theserver log:
• Select default to include the error message, DETAIL, HINT, QUERY and CONTEXT ineach server log entry.
• Select terse to log only the error message.
• Select verbose to include the error message, the DETAIL, HINT, QUERY and CONTEXTerror information, SQLSTATE error code and source code file name, the function name, andthe line number that generated the error.
143
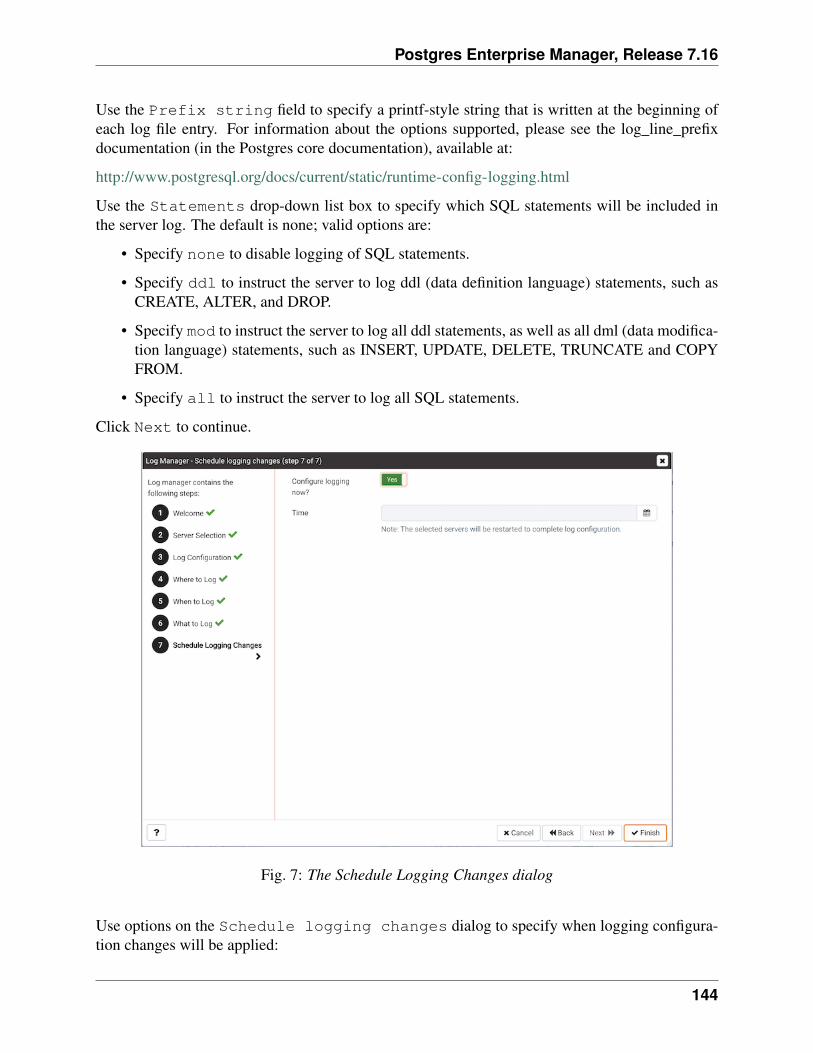
Postgres Enterprise Manager, Release 7.16
Use the Prefix string field to specify a printf-style string that is written at the beginning ofeach log file entry. For information about the options supported, please see the log_line_prefixdocumentation (in the Postgres core documentation), available at:
http://www.postgresql.org/docs/current/static/runtime-config-logging.html
Use the Statements drop-down list box to specify which SQL statements will be included inthe server log. The default is none; valid options are:
• Specify none to disable logging of SQL statements.
• Specify ddl to instruct the server to log ddl (data definition language) statements, such asCREATE, ALTER, and DROP.
• Specify mod to instruct the server to log all ddl statements, as well as all dml (data modifica-tion language) statements, such as INSERT, UPDATE, DELETE, TRUNCATE and COPYFROM.
• Specify all to instruct the server to log all SQL statements.
Click Next to continue.
Fig. 7: The Schedule Logging Changes dialog
Use options on the Schedule logging changes dialog to specify when logging configura-tion changes will be applied:
144
Postgres Enterprise Manager, Release 7.16
• Set the Configure logging now switch to Yes to specify that your configuration pref-erences will be enabled, and the server will restart when you have completed the Log Man-ager wizard.
• Set Configure logging now to No to use the Schedule it for some other time calendarselector to specify a convenient time for logging configuration preferences to be applied, andthe server to restart.
Note that when you apply the configuration changes specified by the Log Manager wizard, theserver restart will temporarily interrupting use of the database server for users.
Click Finish to exit the wizard, and either restart the server, or schedule the server restart for thetime specified on the scheduling dialog.
145
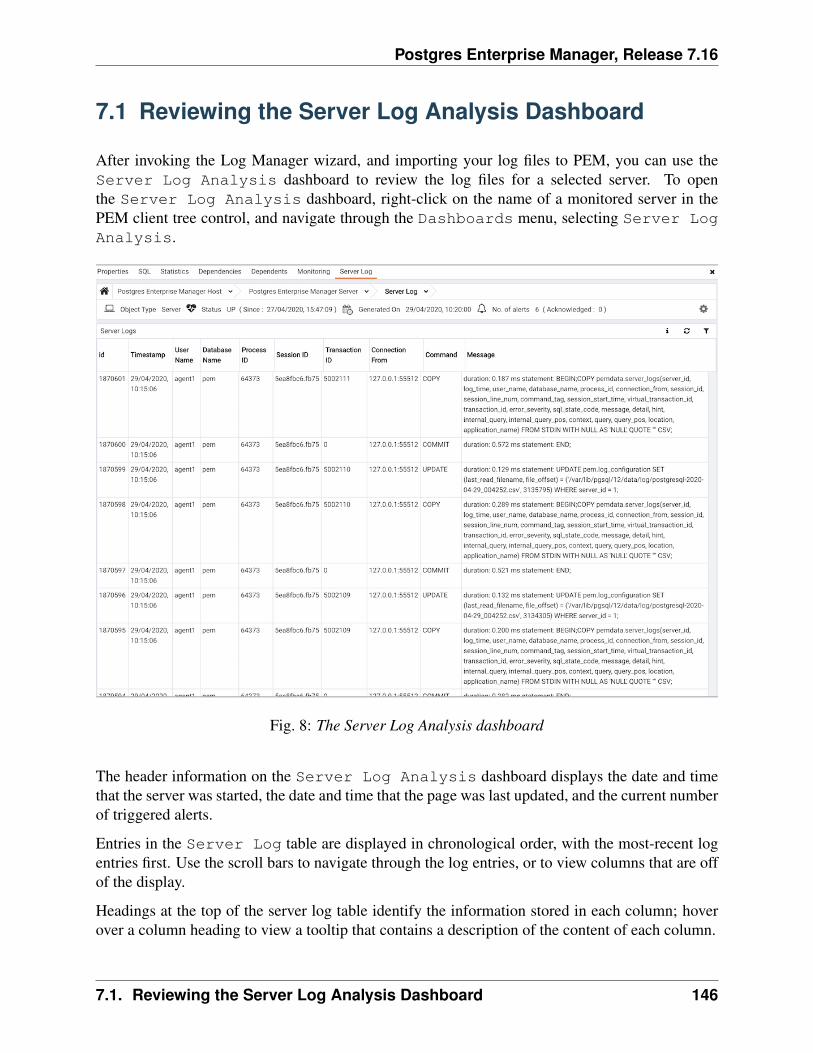
Postgres Enterprise Manager, Release 7.16
7.1 Reviewing the Server Log Analysis Dashboard
After invoking the Log Manager wizard, and importing your log files to PEM, you can use theServer Log Analysis dashboard to review the log files for a selected server. To openthe Server Log Analysis dashboard, right-click on the name of a monitored server in thePEM client tree control, and navigate through the Dashboards menu, selecting Server LogAnalysis.
Fig. 8: The Server Log Analysis dashboard
The header information on the Server Log Analysis dashboard displays the date and timethat the server was started, the date and time that the page was last updated, and the current numberof triggered alerts.
Entries in the Server Log table are displayed in chronological order, with the most-recent logentries first. Use the scroll bars to navigate through the log entries, or to view columns that are offof the display.
Headings at the top of the server log table identify the information stored in each column; hoverover a column heading to view a tooltip that contains a description of the content of each column.
7.1. Reviewing the Server Log Analysis Dashboard 146
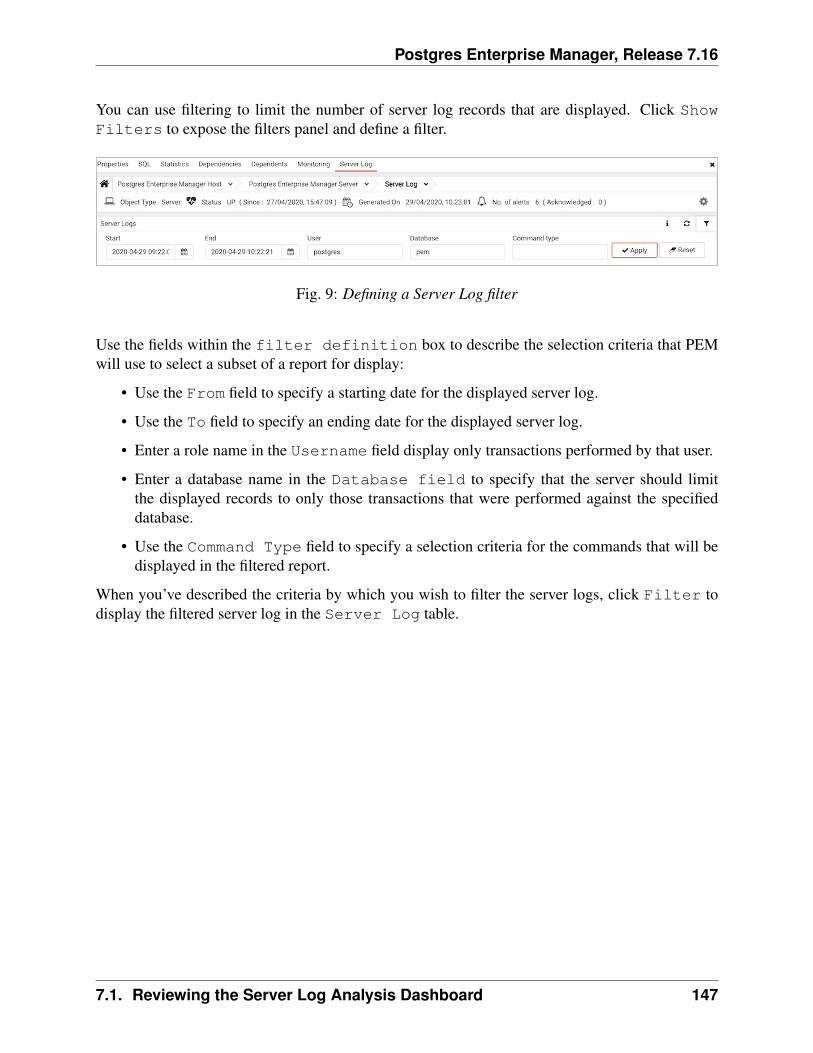
Postgres Enterprise Manager, Release 7.16
You can use filtering to limit the number of server log records that are displayed. Click ShowFilters to expose the filters panel and define a filter.
Fig. 9: Defining a Server Log filter
Use the fields within the filter definition box to describe the selection criteria that PEMwill use to select a subset of a report for display:
• Use the From field to specify a starting date for the displayed server log.
• Use the To field to specify an ending date for the displayed server log.
• Enter a role name in the Username field display only transactions performed by that user.
• Enter a database name in the Database field to specify that the server should limitthe displayed records to only those transactions that were performed against the specifieddatabase.
• Use the Command Type field to specify a selection criteria for the commands that will bedisplayed in the filtered report.
When you’ve described the criteria by which you wish to filter the server logs, click Filter todisplay the filtered server log in the Server Log table.
7.1. Reviewing the Server Log Analysis Dashboard 147
CHAPTER 8
Postgres Log Analysis Expert
The PEM Log Analysis Expert analyzes the log files of servers that are registered with PostgresEnterprise Manager, and produces a report that provides an analysis of your Postgres cluster’susage based on log file entries. You can use information on the Log Analysis Expert reports tomake decisions about optimizing your cluster usage and configuration to improve performance.
Before using the PEM Log Analysis Expert, you must specify the Service ID on the Advanced tabof the Server Properties dialog, and use the Log Manager wizard to enable log collection by thePEM server.
To open the Postgres Log Analysis Expert wizard, select the Postgres LogAnalysis Expert... option from the Management menu of the PEM client. The wizard’sWelcome dialog opens; click Next to continue:
148
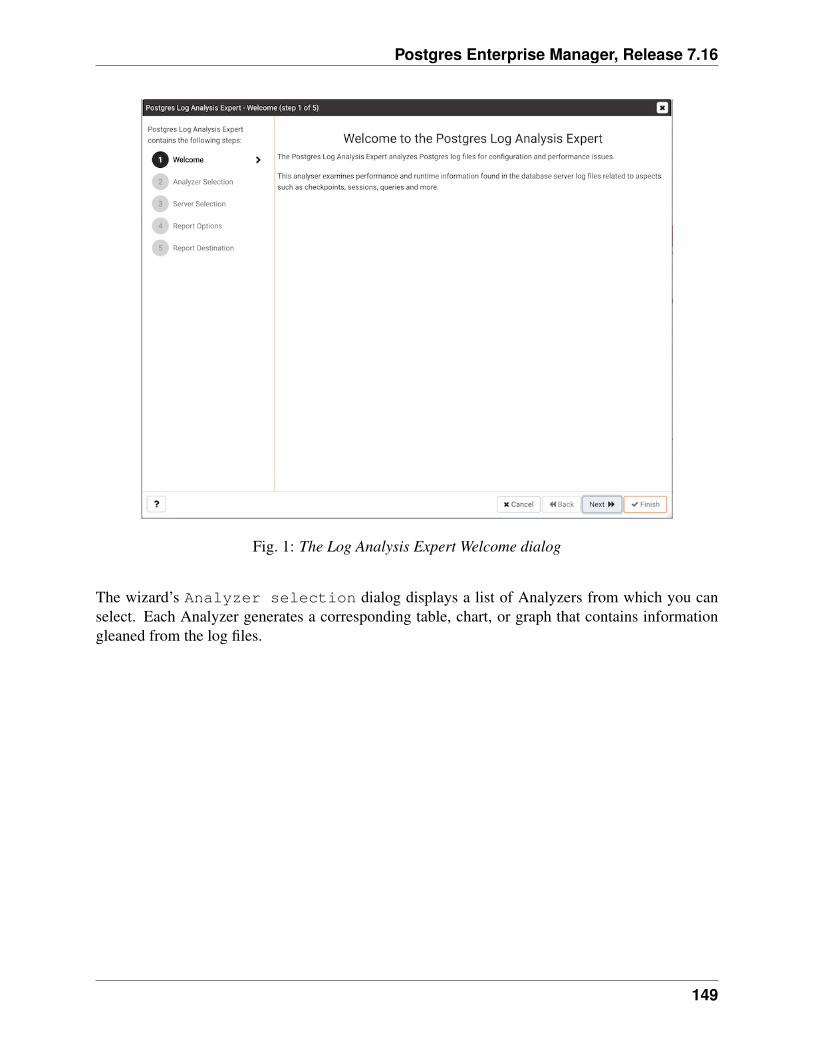
Postgres Enterprise Manager, Release 7.16
Fig. 1: The Log Analysis Expert Welcome dialog
The wizard’s Analyzer selection dialog displays a list of Analyzers from which you canselect. Each Analyzer generates a corresponding table, chart, or graph that contains informationgleaned from the log files.
149
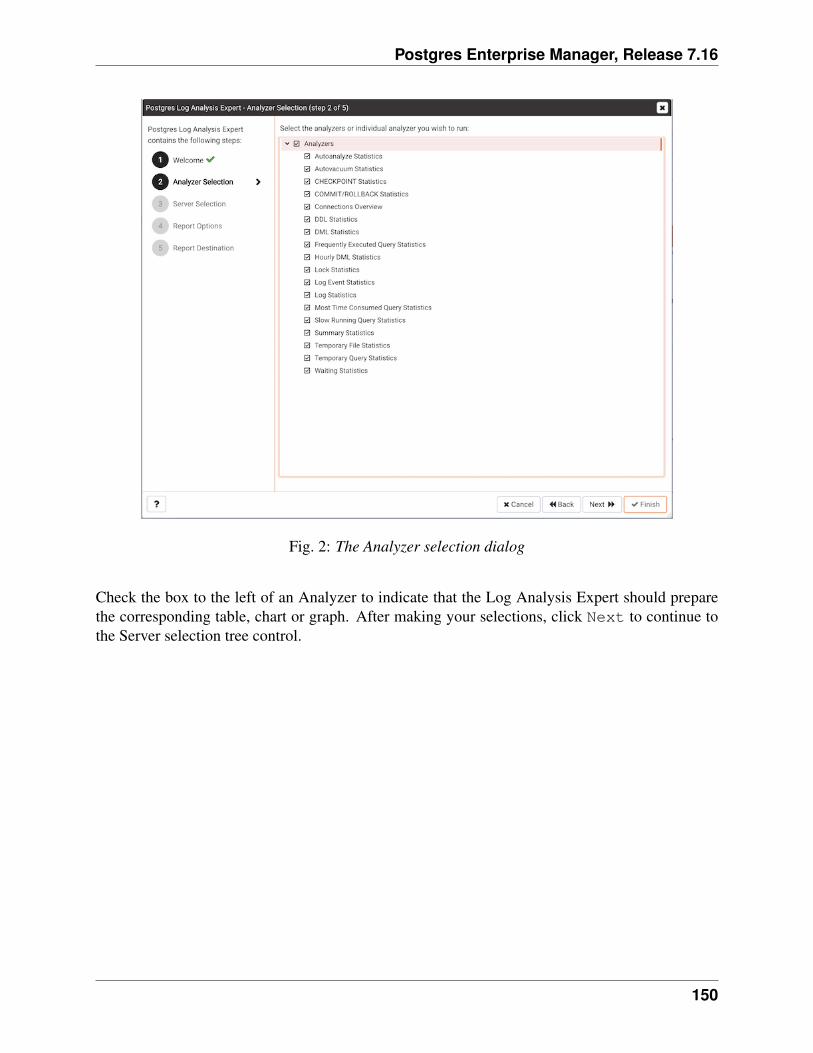
Postgres Enterprise Manager, Release 7.16
Fig. 2: The Analyzer selection dialog
Check the box to the left of an Analyzer to indicate that the Log Analysis Expert should preparethe corresponding table, chart or graph. After making your selections, click Next to continue tothe Server selection tree control.
150
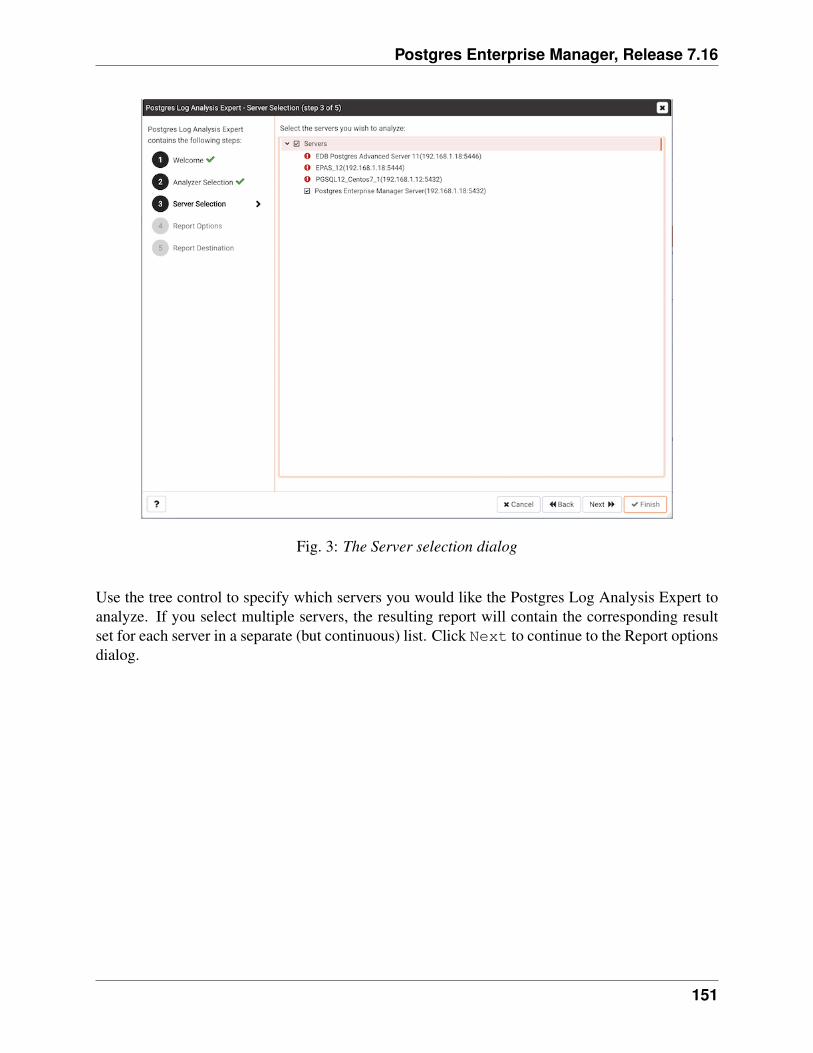
Postgres Enterprise Manager, Release 7.16
Fig. 3: The Server selection dialog
Use the tree control to specify which servers you would like the Postgres Log Analysis Expert toanalyze. If you select multiple servers, the resulting report will contain the corresponding resultset for each server in a separate (but continuous) list. Click Next to continue to the Report optionsdialog.
151
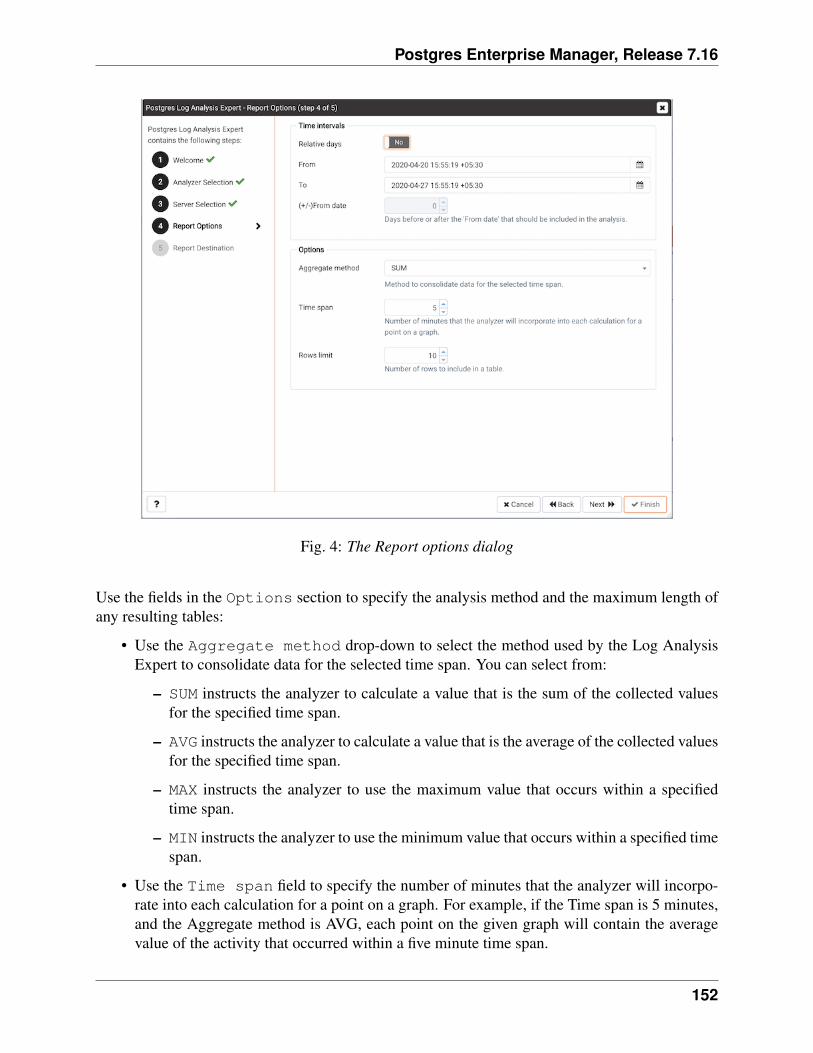
Postgres Enterprise Manager, Release 7.16
Fig. 4: The Report options dialog
Use the fields in the Options section to specify the analysis method and the maximum length ofany resulting tables:
• Use the Aggregate method drop-down to select the method used by the Log AnalysisExpert to consolidate data for the selected time span. You can select from:
– SUM instructs the analyzer to calculate a value that is the sum of the collected valuesfor the specified time span.
– AVG instructs the analyzer to calculate a value that is the average of the collected valuesfor the specified time span.
– MAX instructs the analyzer to use the maximum value that occurs within a specifiedtime span.
– MIN instructs the analyzer to use the minimum value that occurs within a specified timespan.
• Use the Time span field to specify the number of minutes that the analyzer will incorpo-rate into each calculation for a point on a graph. For example, if the Time span is 5 minutes,and the Aggregate method is AVG, each point on the given graph will contain the averagevalue of the activity that occurred within a five minute time span.
152
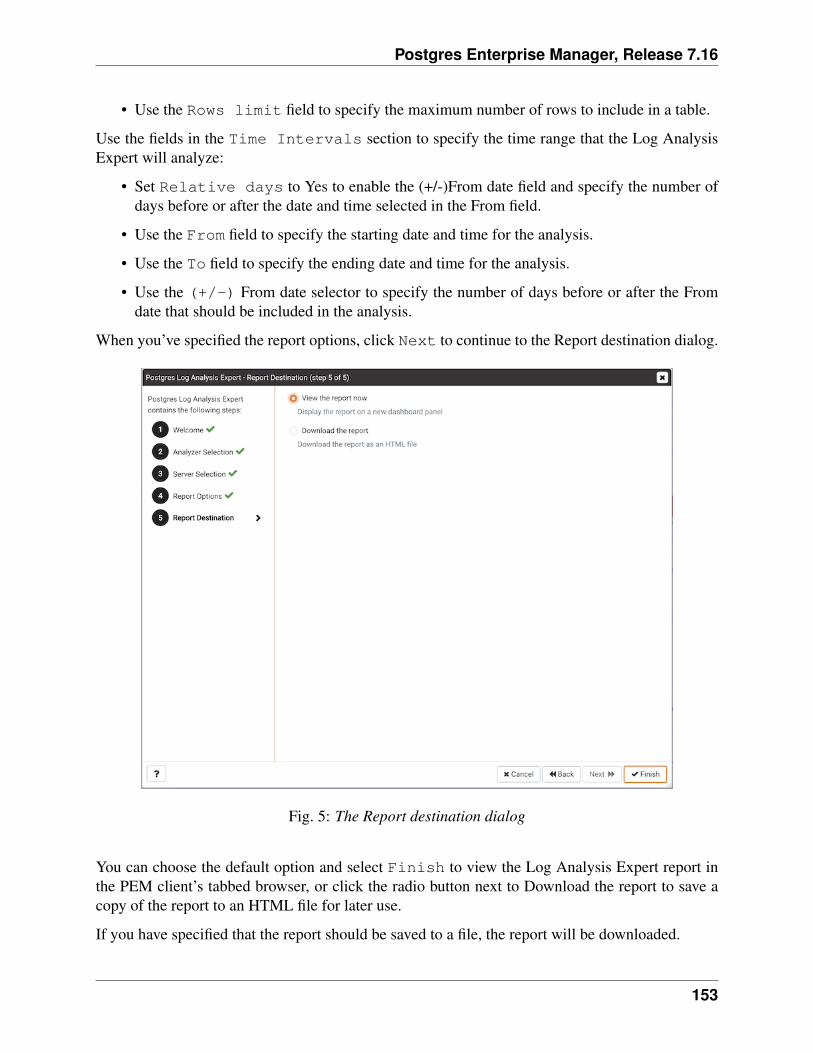
Postgres Enterprise Manager, Release 7.16
• Use the Rows limit field to specify the maximum number of rows to include in a table.
Use the fields in the Time Intervals section to specify the time range that the Log AnalysisExpert will analyze:
• Set Relative days to Yes to enable the (+/-)From date field and specify the number ofdays before or after the date and time selected in the From field.
• Use the From field to specify the starting date and time for the analysis.
• Use the To field to specify the ending date and time for the analysis.
• Use the (+/-) From date selector to specify the number of days before or after the Fromdate that should be included in the analysis.
When you’ve specified the report options, click Next to continue to the Report destination dialog.
Fig. 5: The Report destination dialog
You can choose the default option and select Finish to view the Log Analysis Expert report inthe PEM client’s tabbed browser, or click the radio button next to Download the report to save acopy of the report to an HTML file for later use.
If you have specified that the report should be saved to a file, the report will be downloaded.
153
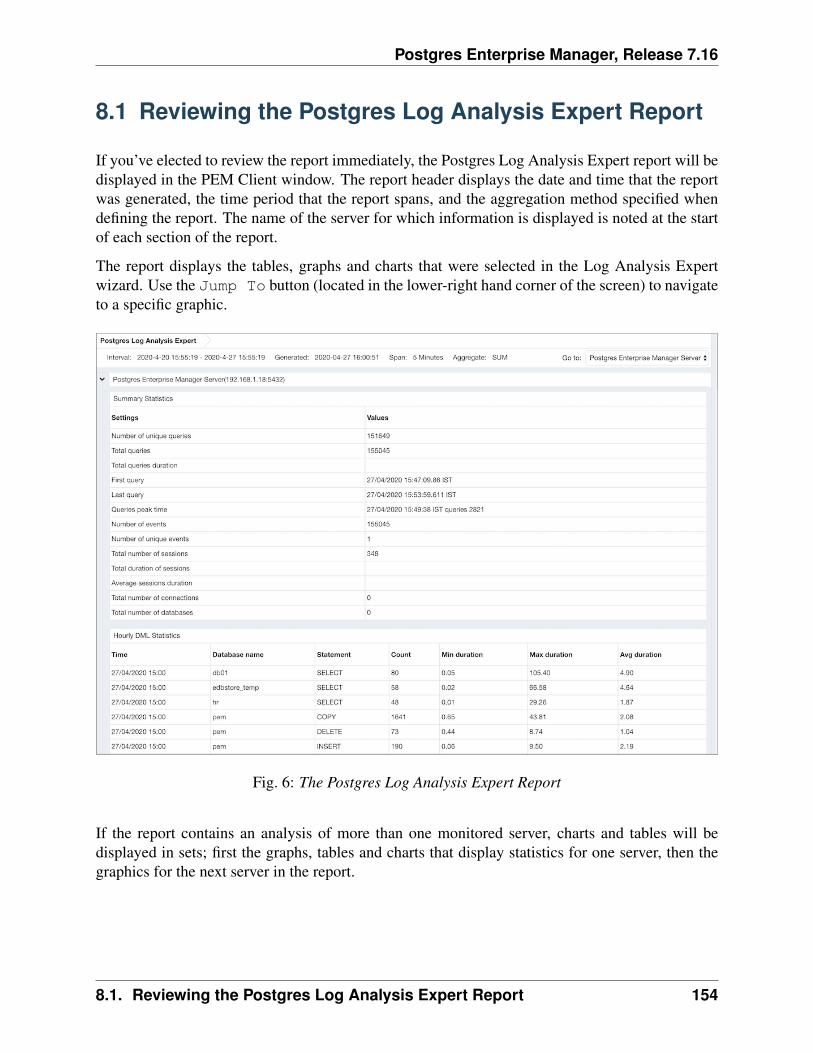
Postgres Enterprise Manager, Release 7.16
8.1 Reviewing the Postgres Log Analysis Expert Report
If you’ve elected to review the report immediately, the Postgres Log Analysis Expert report will bedisplayed in the PEM Client window. The report header displays the date and time that the reportwas generated, the time period that the report spans, and the aggregation method specified whendefining the report. The name of the server for which information is displayed is noted at the startof each section of the report.
The report displays the tables, graphs and charts that were selected in the Log Analysis Expertwizard. Use the Jump To button (located in the lower-right hand corner of the screen) to navigateto a specific graphic.
Fig. 6: The Postgres Log Analysis Expert Report
If the report contains an analysis of more than one monitored server, charts and tables will bedisplayed in sets; first the graphs, tables and charts that display statistics for one server, then thegraphics for the next server in the report.
8.1. Reviewing the Postgres Log Analysis Expert Report 154
CHAPTER 9
SQL Profiling and Analysis
Most RDBMS experts agree that inefficient SQL code is the leading cause of most database per-formance problems. The challenge for DBAs and developers is to locate the poorly-running SQLcode in large and complex systems, and then optimize that code for better performance.
The SQL Profiler component allows a database superuser to locate and optimize poorly-runningSQL code. Users of Microsoft SQL Server’s Profiler will find PEM’s SQL Profiler very similar inoperation and capabilities. SQL Profiler is installed with each Advanced Server instance; if youare using PostgreSQL, you must download the SQL Profiler installer, and install the SQL Profilerproduct into each managed database instance you wish to profile.
For each database monitored by SQL Profiler, you must:
1. Edit the postgresql.conf file; you must include the SQL Profiler library in theshared_preload_libraries configuration parameter.
For Linux installations, the parameter value should include:
$libdir/sql-profiler
on Windows, the parameter value should include:
$libdir/sql-profiler.dll
2. Create the functions used by SQL Profiler in your database. The SQL Profiler installa-tion program places a SQL script (named sql-profiler.sql) in the share/postgresql/contrib subdirectory of the main PostgreSQL installation directory on Linux systems.On Windows systems, this script is located in the share subdirectory. You must invoke thisscript on the maintenance database specified when registering the server with PEM.
3. Stop and re-start the server for the changes to take effect.
155
Postgres Enterprise Manager, Release 7.16
Please note: if you have connected to the PEM server with the PEM client before configuring SQLProfiler, you must disconnect and reconnect with the server to enable SQL Profiler functionality.For more detailed information about installing and configuring the SQL Profiler plugin, pleaserefer to the PEM Installation Guide, available from the EDB website at:
http://enterprisedb.com/products-services-training/products/documentation
156
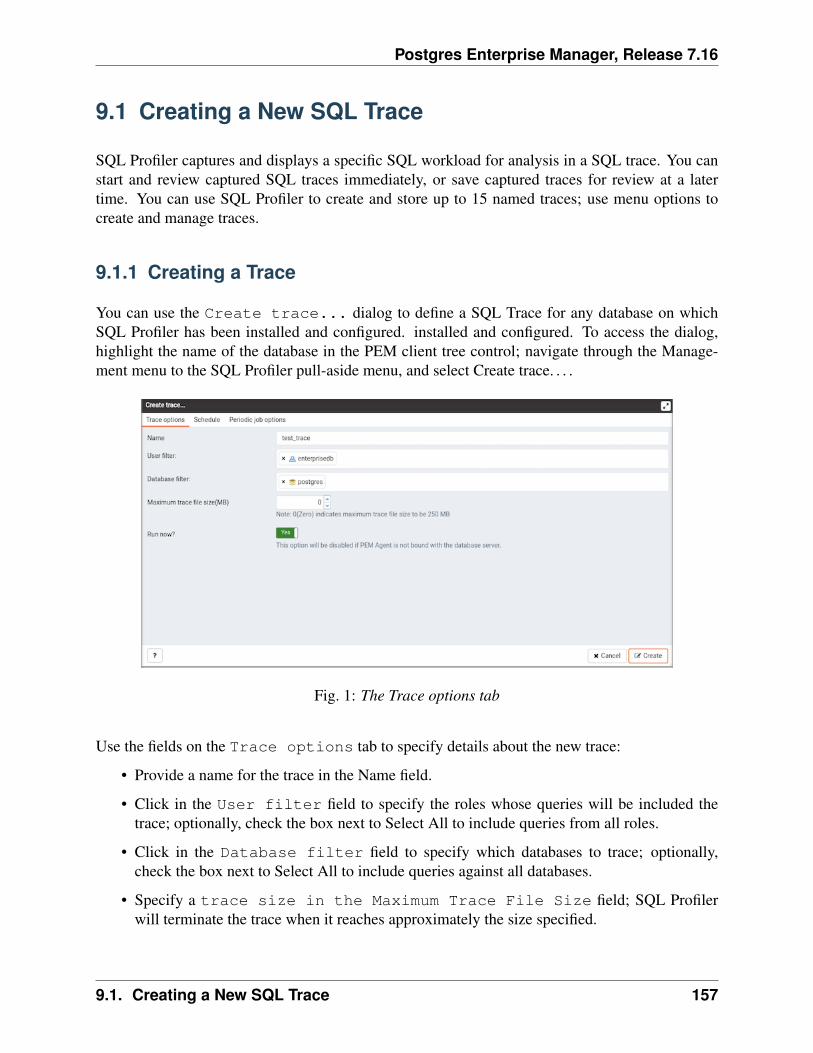
Postgres Enterprise Manager, Release 7.16
9.1 Creating a New SQL Trace
SQL Profiler captures and displays a specific SQL workload for analysis in a SQL trace. You canstart and review captured SQL traces immediately, or save captured traces for review at a latertime. You can use SQL Profiler to create and store up to 15 named traces; use menu options tocreate and manage traces.
9.1.1 Creating a Trace
You can use the Create trace... dialog to define a SQL Trace for any database on whichSQL Profiler has been installed and configured. installed and configured. To access the dialog,highlight the name of the database in the PEM client tree control; navigate through the Manage-ment menu to the SQL Profiler pull-aside menu, and select Create trace. . . .
Fig. 1: The Trace options tab
Use the fields on the Trace options tab to specify details about the new trace:
• Provide a name for the trace in the Name field.
• Click in the User filter field to specify the roles whose queries will be included thetrace; optionally, check the box next to Select All to include queries from all roles.
• Click in the Database filter field to specify which databases to trace; optionally,check the box next to Select All to include queries against all databases.
• Specify a trace size in the Maximum Trace File Size field; SQL Profilerwill terminate the trace when it reaches approximately the size specified.
9.1. Creating a New SQL Trace 157
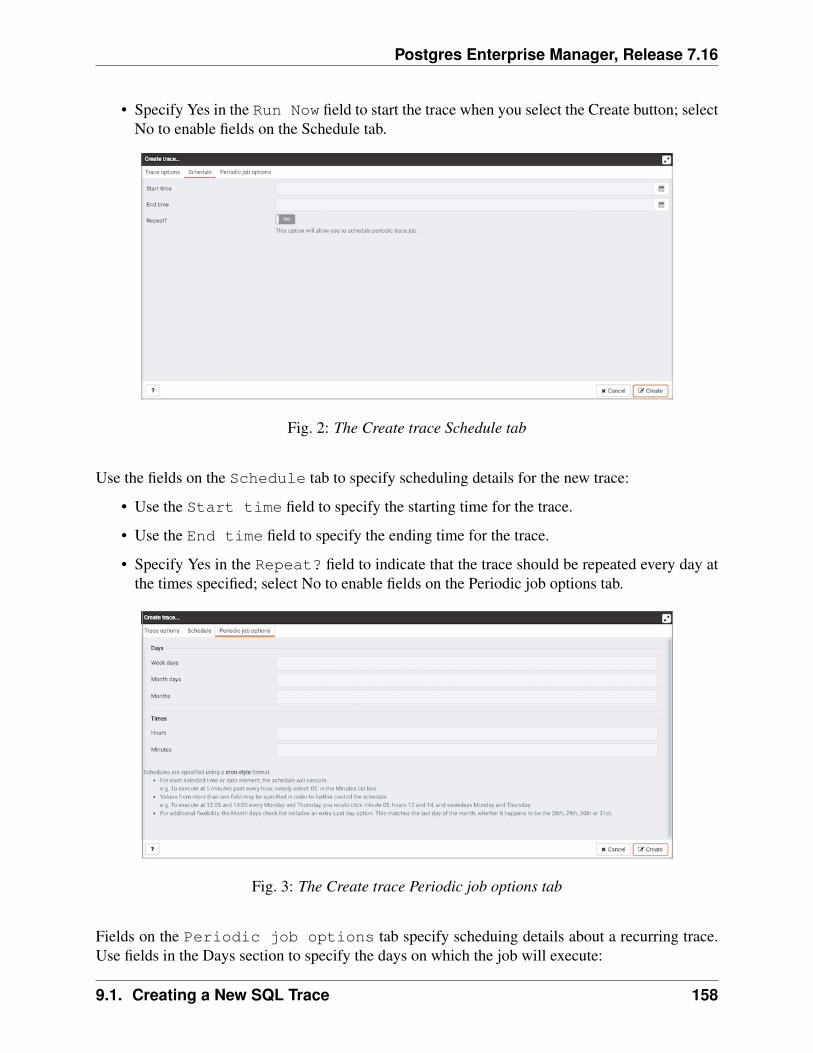
Postgres Enterprise Manager, Release 7.16
• Specify Yes in the Run Now field to start the trace when you select the Create button; selectNo to enable fields on the Schedule tab.
Fig. 2: The Create trace Schedule tab
Use the fields on the Schedule tab to specify scheduling details for the new trace:
• Use the Start time field to specify the starting time for the trace.
• Use the End time field to specify the ending time for the trace.
• Specify Yes in the Repeat? field to indicate that the trace should be repeated every day atthe times specified; select No to enable fields on the Periodic job options tab.
Fig. 3: The Create trace Periodic job options tab
Fields on the Periodic job options tab specify scheduing details about a recurring trace.Use fields in the Days section to specify the days on which the job will execute:
9.1. Creating a New SQL Trace 158
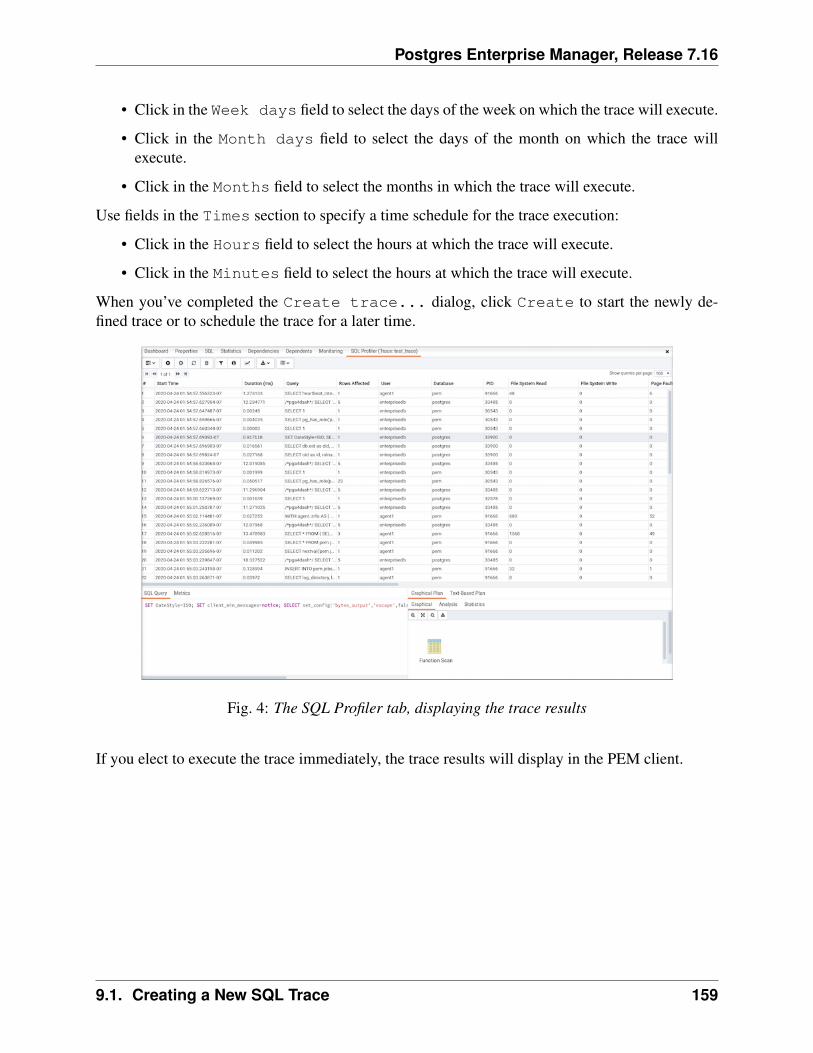
Postgres Enterprise Manager, Release 7.16
• Click in the Week days field to select the days of the week on which the trace will execute.
• Click in the Month days field to select the days of the month on which the trace willexecute.
• Click in the Months field to select the months in which the trace will execute.
Use fields in the Times section to specify a time schedule for the trace execution:
• Click in the Hours field to select the hours at which the trace will execute.
• Click in the Minutes field to select the hours at which the trace will execute.
When you’ve completed the Create trace... dialog, click Create to start the newly de-fined trace or to schedule the trace for a later time.
Fig. 4: The SQL Profiler tab, displaying the trace results
If you elect to execute the trace immediately, the trace results will display in the PEM client.
9.1. Creating a New SQL Trace 159
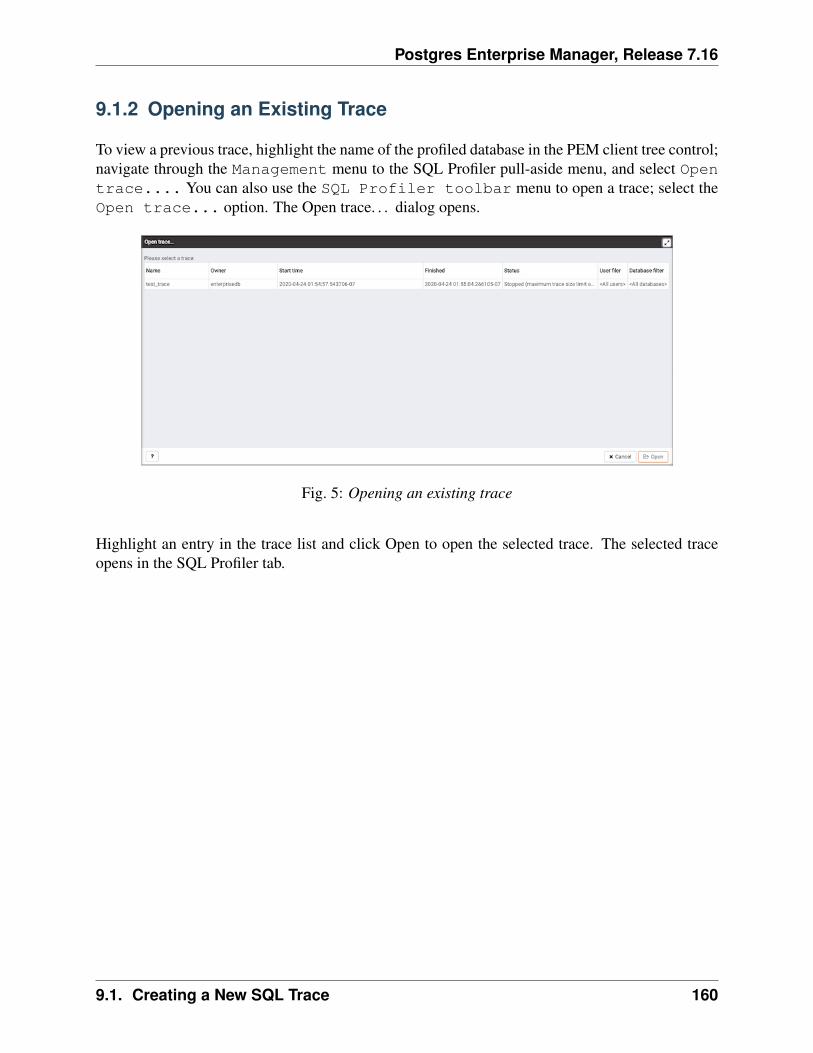
Postgres Enterprise Manager, Release 7.16
9.1.2 Opening an Existing Trace
To view a previous trace, highlight the name of the profiled database in the PEM client tree control;navigate through the Management menu to the SQL Profiler pull-aside menu, and select Opentrace.... You can also use the SQL Profiler toolbar menu to open a trace; select theOpen trace... option. The Open trace. . . dialog opens.
Fig. 5: Opening an existing trace
Highlight an entry in the trace list and click Open to open the selected trace. The selected traceopens in the SQL Profiler tab.
9.1. Creating a New SQL Trace 160
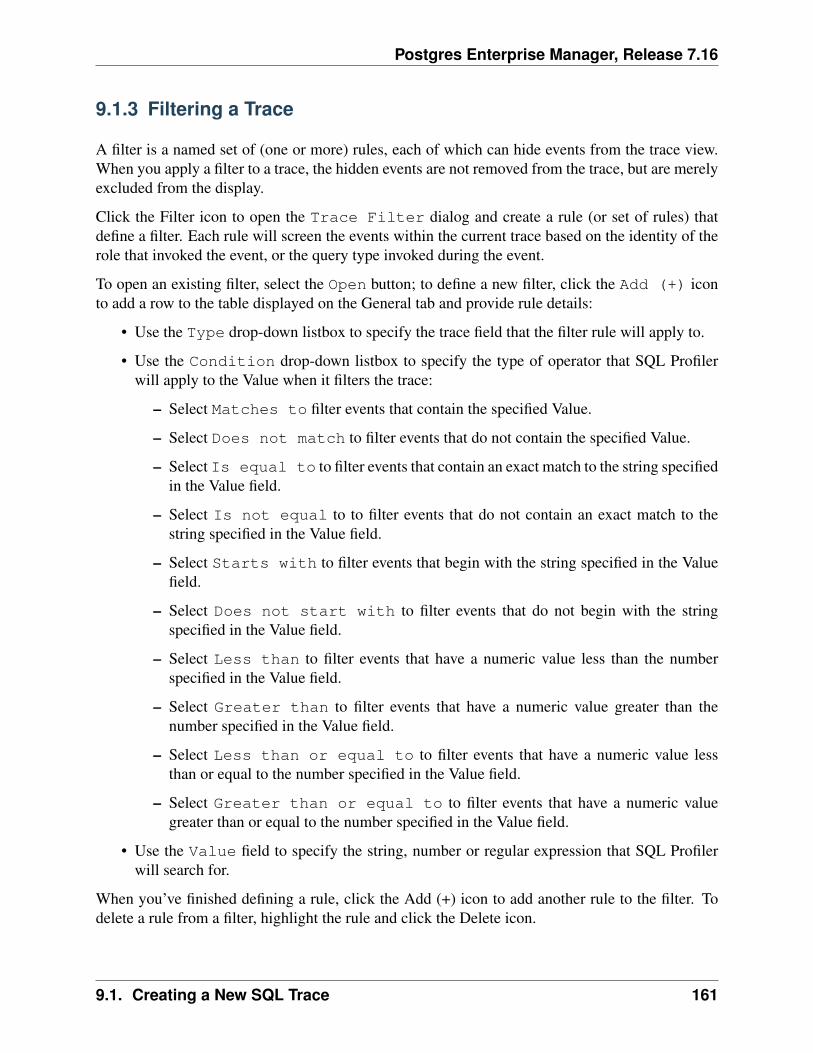
Postgres Enterprise Manager, Release 7.16
9.1.3 Filtering a Trace
A filter is a named set of (one or more) rules, each of which can hide events from the trace view.When you apply a filter to a trace, the hidden events are not removed from the trace, but are merelyexcluded from the display.
Click the Filter icon to open the Trace Filter dialog and create a rule (or set of rules) thatdefine a filter. Each rule will screen the events within the current trace based on the identity of therole that invoked the event, or the query type invoked during the event.
To open an existing filter, select the Open button; to define a new filter, click the Add (+) iconto add a row to the table displayed on the General tab and provide rule details:
• Use the Type drop-down listbox to specify the trace field that the filter rule will apply to.
• Use the Condition drop-down listbox to specify the type of operator that SQL Profilerwill apply to the Value when it filters the trace:
– Select Matches to filter events that contain the specified Value.
– Select Does not match to filter events that do not contain the specified Value.
– Select Is equal to to filter events that contain an exact match to the string specifiedin the Value field.
– Select Is not equal to to filter events that do not contain an exact match to thestring specified in the Value field.
– Select Starts with to filter events that begin with the string specified in the Valuefield.
– Select Does not start with to filter events that do not begin with the stringspecified in the Value field.
– Select Less than to filter events that have a numeric value less than the numberspecified in the Value field.
– Select Greater than to filter events that have a numeric value greater than thenumber specified in the Value field.
– Select Less than or equal to to filter events that have a numeric value lessthan or equal to the number specified in the Value field.
– Select Greater than or equal to to filter events that have a numeric valuegreater than or equal to the number specified in the Value field.
• Use the Value field to specify the string, number or regular expression that SQL Profilerwill search for.
When you’ve finished defining a rule, click the Add (+) icon to add another rule to the filter. Todelete a rule from a filter, highlight the rule and click the Delete icon.
9.1. Creating a New SQL Trace 161
Postgres Enterprise Manager, Release 7.16
Click the Save button to save the filter definition to a file without applying the filter; to apply thefilter, click OK. Select Cancel to exit the dialog and discard any changes to the filter.
9.1. Creating a New SQL Trace 162
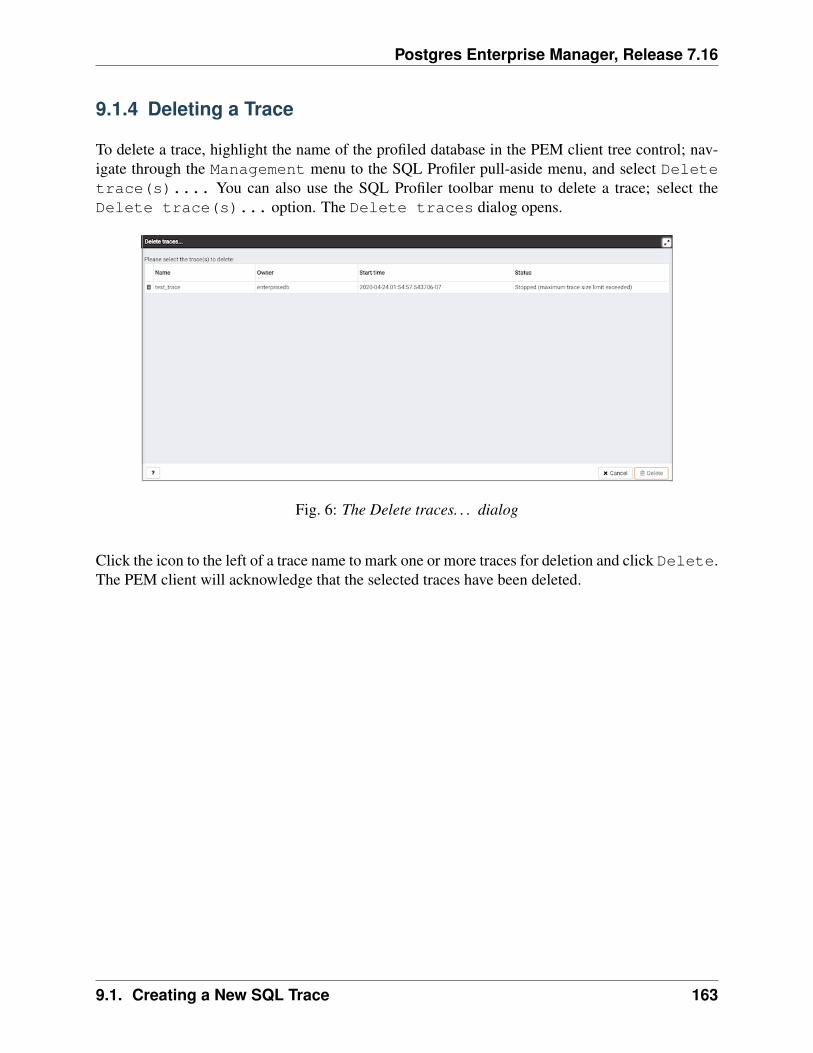
Postgres Enterprise Manager, Release 7.16
9.1.4 Deleting a Trace
To delete a trace, highlight the name of the profiled database in the PEM client tree control; nav-igate through the Management menu to the SQL Profiler pull-aside menu, and select Deletetrace(s).... You can also use the SQL Profiler toolbar menu to delete a trace; select theDelete trace(s)... option. The Delete traces dialog opens.
Fig. 6: The Delete traces. . . dialog
Click the icon to the left of a trace name to mark one or more traces for deletion and click Delete.The PEM client will acknowledge that the selected traces have been deleted.
9.1. Creating a New SQL Trace 163
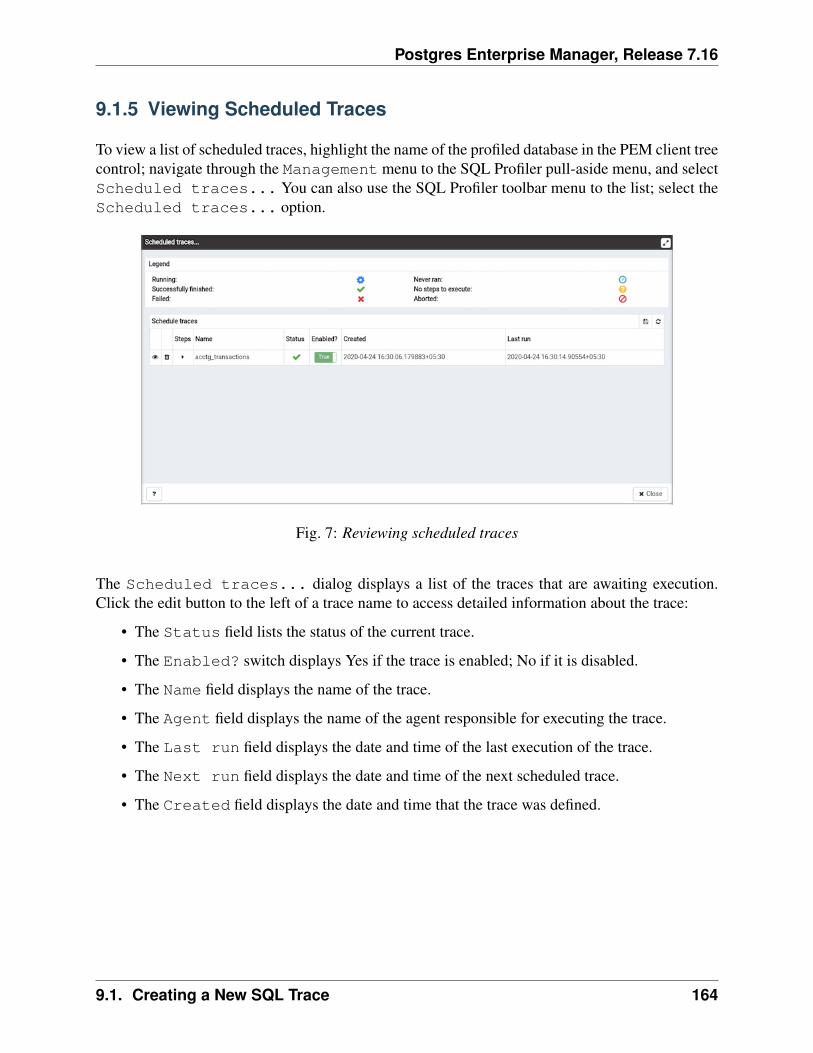
Postgres Enterprise Manager, Release 7.16
9.1.5 Viewing Scheduled Traces
To view a list of scheduled traces, highlight the name of the profiled database in the PEM client treecontrol; navigate through the Management menu to the SQL Profiler pull-aside menu, and selectScheduled traces... You can also use the SQL Profiler toolbar menu to the list; select theScheduled traces... option.
Fig. 7: Reviewing scheduled traces
The Scheduled traces... dialog displays a list of the traces that are awaiting execution.Click the edit button to the left of a trace name to access detailed information about the trace:
• The Status field lists the status of the current trace.
• The Enabled? switch displays Yes if the trace is enabled; No if it is disabled.
• The Name field displays the name of the trace.
• The Agent field displays the name of the agent responsible for executing the trace.
• The Last run field displays the date and time of the last execution of the trace.
• The Next run field displays the date and time of the next scheduled trace.
• The Created field displays the date and time that the trace was defined.
9.1. Creating a New SQL Trace 164
Postgres Enterprise Manager, Release 7.16
9.2 Using the Index Advisor
Index Advisor is distributed with supported versions of Advanced Server. Index Advisor workswith SQL Profiler by examining collected SQL statements and making indexing recommendationsfor any underlying tables to improve SQL response time. The Index Advisor works on all DML(INSERT, UPDATE, DELETE) and SELECT statements that are invoked by a superuser.
Diagnostic output from the Index Advisor includes:
• Forecasted performance benefits from any recommended indexes
• The predicted size of any recommended indexes
• DDL statements you can use to create the recommended indexes
Before using Index Advisor, you must:
1. Modify the postgresql.conf file on each Advanced Server host, adding the in-dex_advisor library to the shared_preload_libraries parameter.
2. Install the Index Advisor contrib module. To install the module, use the psql clientor PEM Query Tool to connect to the database, and invoke the following command:
\i <complete_path>/share/contrib/index_advisor.sql
3. Restart the server for your changes to take effect.
Index Advisor can make indexing recommendations based on trace data captured by SQL Profiler.Simply highlight one or more queries in the SQL Profiler Trace Data pane, and click theIndex Advisor toolbar button (or select Index Advisor from the View menu). For detailedusage information about Index Advisor, please see the EDB Postgres Advanced Server Guide.
Please note: Index Advisor cannot analyze statements invoked by a non-superuser. If you attemptto analyze statements invoked by a non-superuser, the server log will include the following error:
ERROR: access to library "index_advisor" is not allowed
For more information about configuring and using Index Advisor, please see the EDB PostgresAdvanced Server Guide, available from EDB at:
https://www.enterprisedb.com/resources/product-documentation
9.2. Using the Index Advisor 165
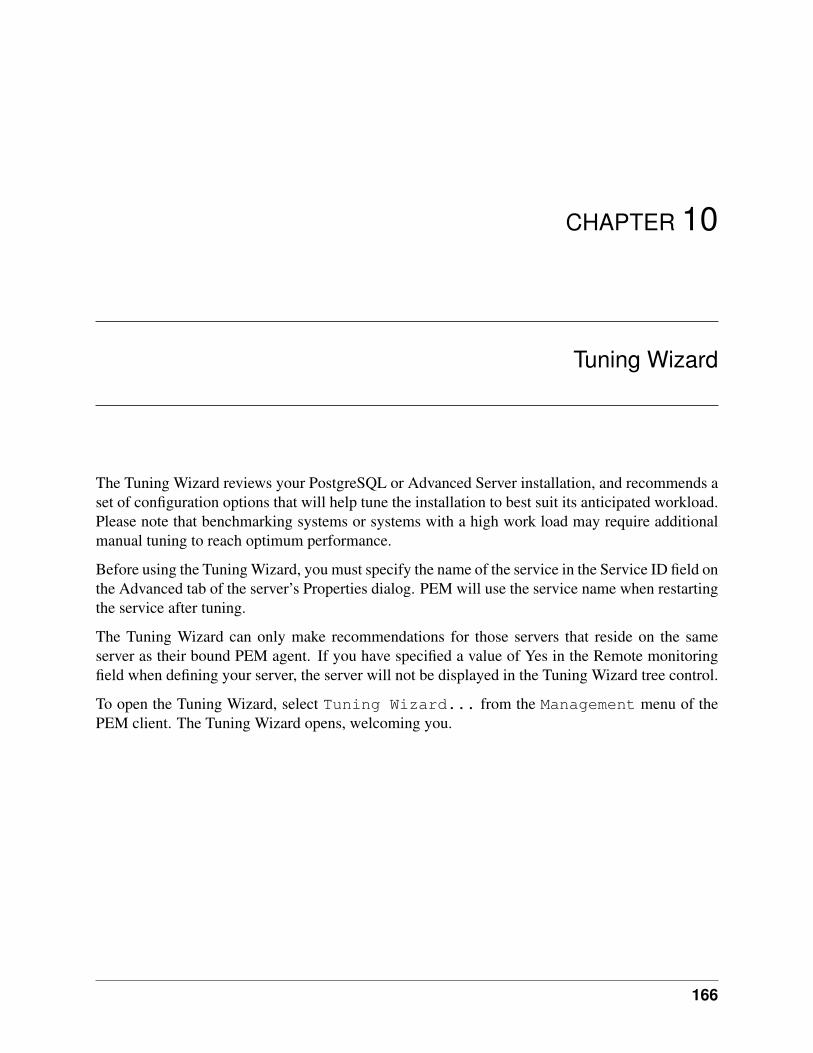
CHAPTER 10
Tuning Wizard
The Tuning Wizard reviews your PostgreSQL or Advanced Server installation, and recommends aset of configuration options that will help tune the installation to best suit its anticipated workload.Please note that benchmarking systems or systems with a high work load may require additionalmanual tuning to reach optimum performance.
Before using the Tuning Wizard, you must specify the name of the service in the Service ID field onthe Advanced tab of the server’s Properties dialog. PEM will use the service name when restartingthe service after tuning.
The Tuning Wizard can only make recommendations for those servers that reside on the sameserver as their bound PEM agent. If you have specified a value of Yes in the Remote monitoringfield when defining your server, the server will not be displayed in the Tuning Wizard tree control.
To open the Tuning Wizard, select Tuning Wizard... from the Management menu of thePEM client. The Tuning Wizard opens, welcoming you.
166
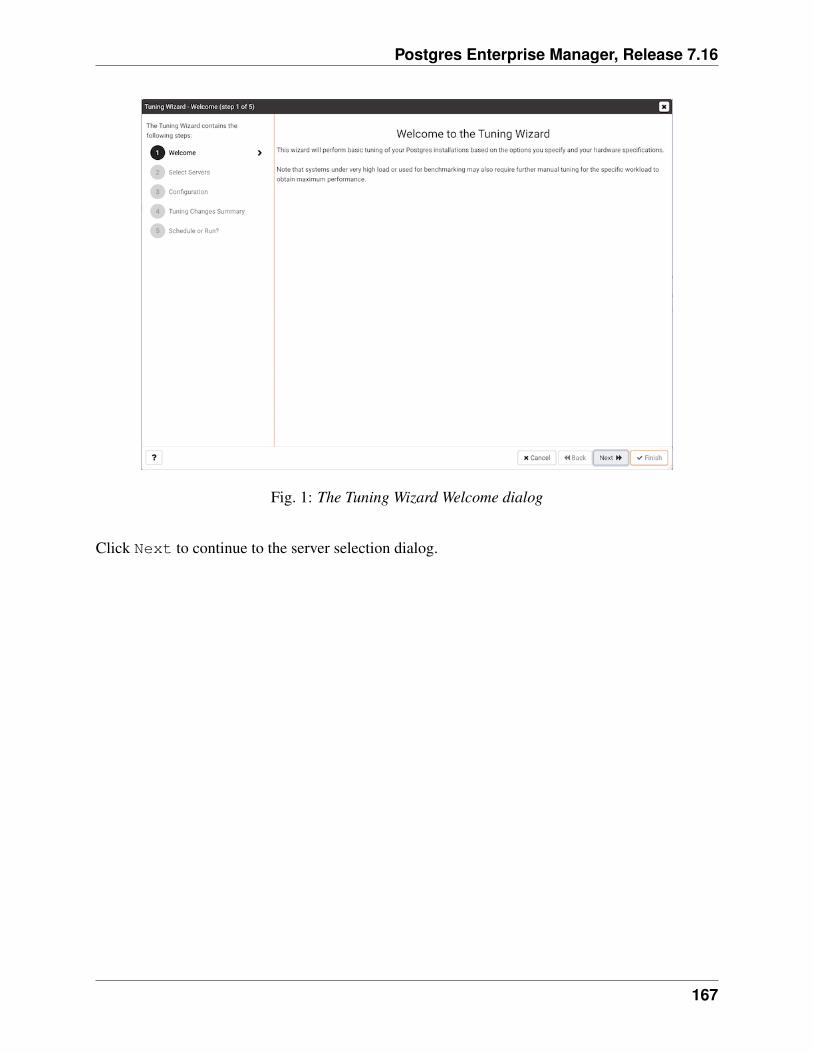
Postgres Enterprise Manager, Release 7.16
Fig. 1: The Tuning Wizard Welcome dialog
Click Next to continue to the server selection dialog.
167
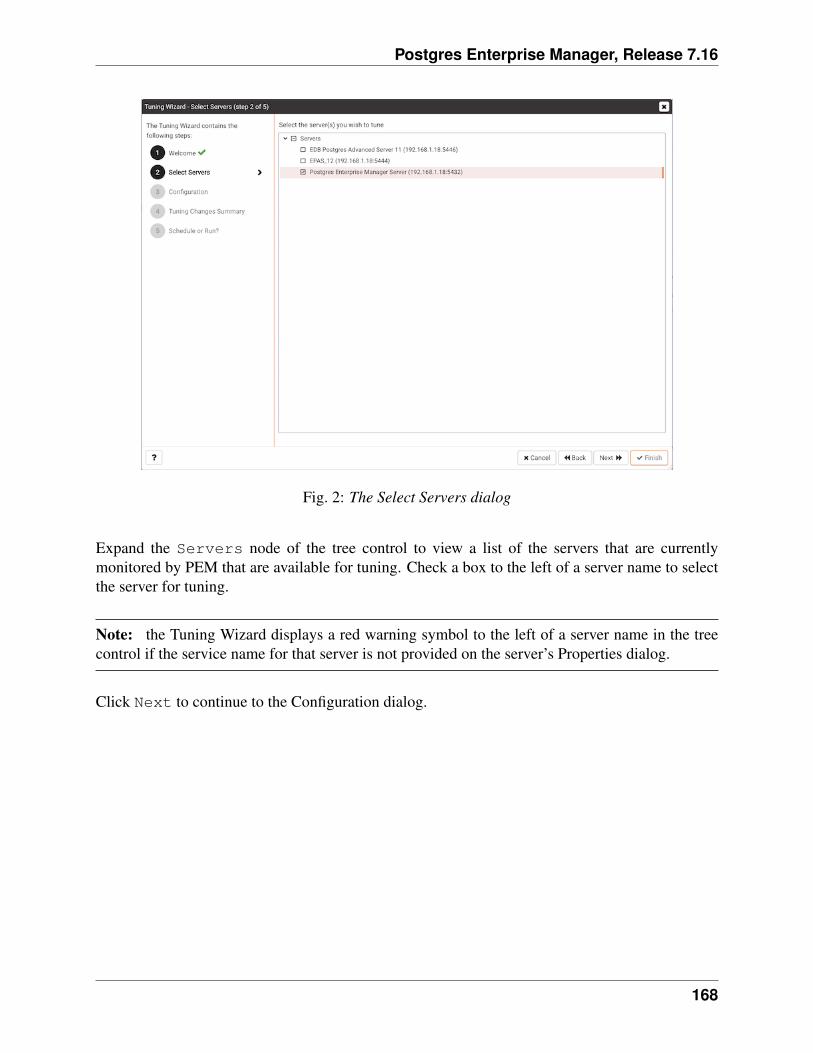
Postgres Enterprise Manager, Release 7.16
Fig. 2: The Select Servers dialog
Expand the Servers node of the tree control to view a list of the servers that are currentlymonitored by PEM that are available for tuning. Check a box to the left of a server name to selectthe server for tuning.
Note: the Tuning Wizard displays a red warning symbol to the left of a server name in the treecontrol if the service name for that server is not provided on the server’s Properties dialog.
Click Next to continue to the Configuration dialog.
168
Postgres Enterprise Manager, Release 7.16
Fig. 3: The Configuration dialog
Select an option in the Machine utilization field to specify the type of work performed bythe selected servers. The type of work performed by the server determines how the tuning wizardwill allocate system resources:
• Select Dedicated to dedicate the majority of the system resources to the database server.
• Select Mixed use to dedicate a moderate amount of system resources to the databaseserver.
• Select Developer workstation to dedicate a relatively small amount of system re-sources to the database server.
Select an option in the Workload Selection field to specify the type of workload typicallyperformed on the selected server:
• Select OLTP if the selected server is used primarily to process online transaction workloads.
• Select Mixed if the selected server provides a mix of transaction processing and data re-porting.
• Select Data warehouse if the server is used for heavy data reporting.
Click Next to continue to the Tuning Changes Summary dialog.
169
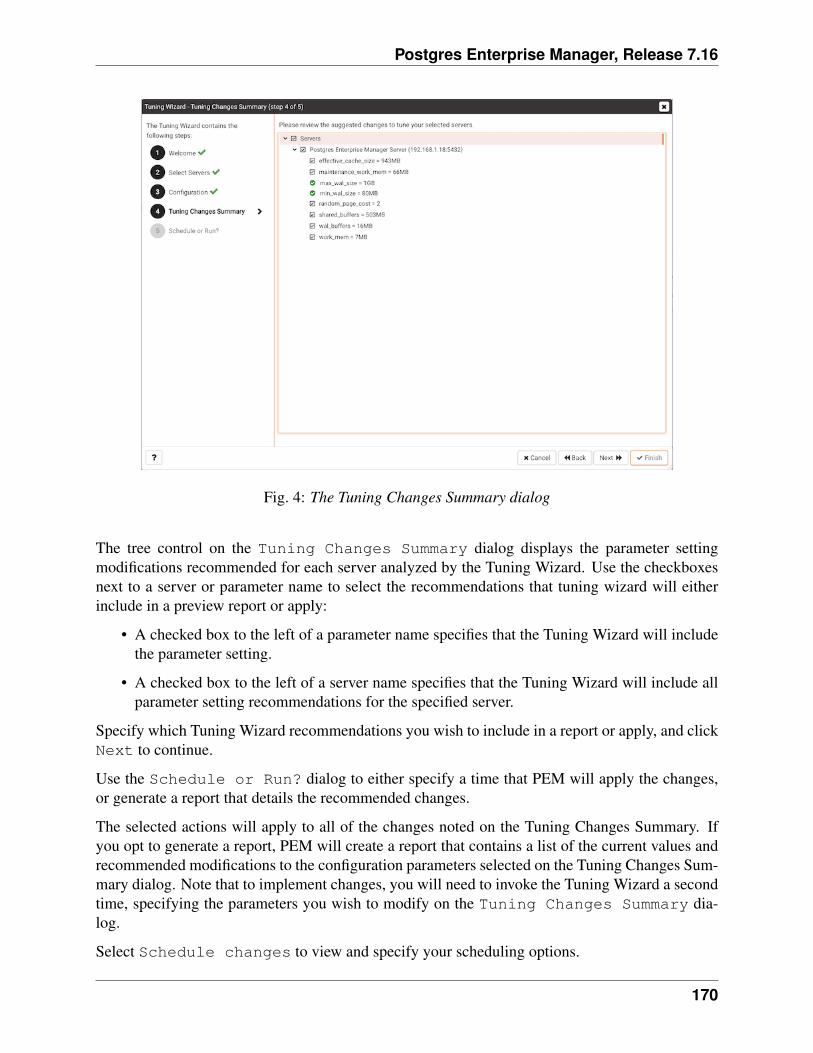
Postgres Enterprise Manager, Release 7.16
Fig. 4: The Tuning Changes Summary dialog
The tree control on the Tuning Changes Summary dialog displays the parameter settingmodifications recommended for each server analyzed by the Tuning Wizard. Use the checkboxesnext to a server or parameter name to select the recommendations that tuning wizard will eitherinclude in a preview report or apply:
• A checked box to the left of a parameter name specifies that the Tuning Wizard will includethe parameter setting.
• A checked box to the left of a server name specifies that the Tuning Wizard will include allparameter setting recommendations for the specified server.
Specify which Tuning Wizard recommendations you wish to include in a report or apply, and clickNext to continue.
Use the Schedule or Run? dialog to either specify a time that PEM will apply the changes,or generate a report that details the recommended changes.
The selected actions will apply to all of the changes noted on the Tuning Changes Summary. Ifyou opt to generate a report, PEM will create a report that contains a list of the current values andrecommended modifications to the configuration parameters selected on the Tuning Changes Sum-mary dialog. Note that to implement changes, you will need to invoke the Tuning Wizard a secondtime, specifying the parameters you wish to modify on the Tuning Changes Summary dia-log.
Select Schedule changes to view and specify your scheduling options.
170
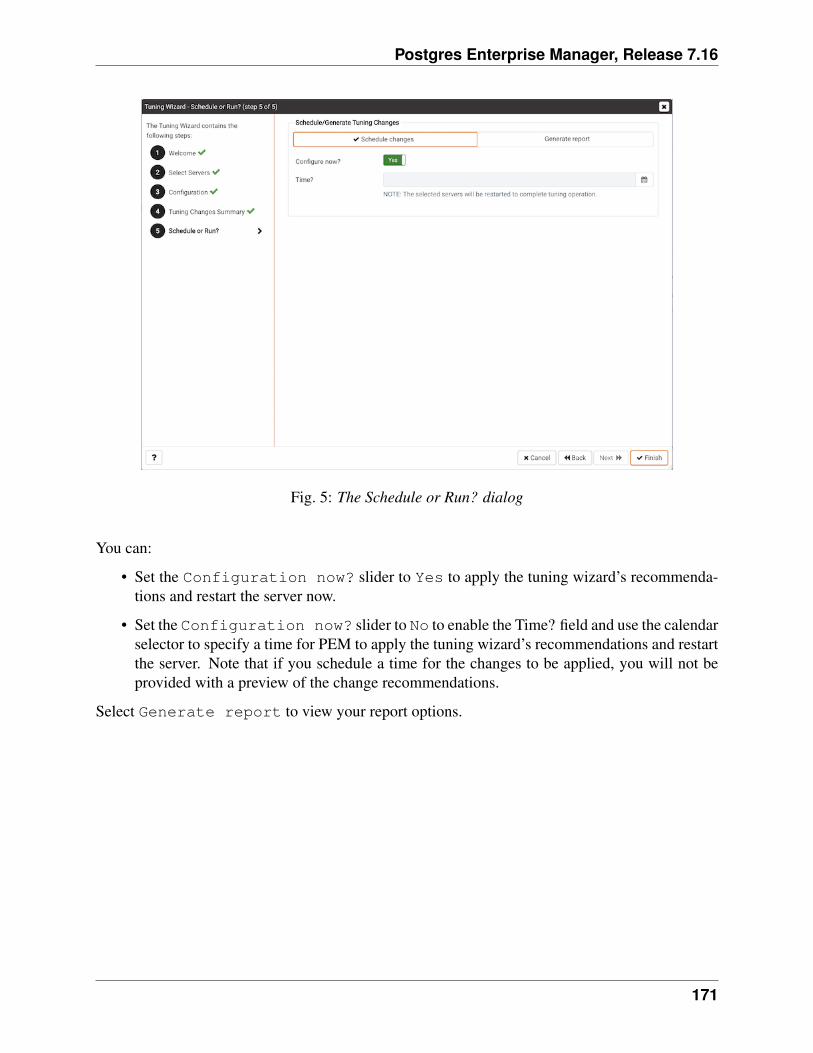
Postgres Enterprise Manager, Release 7.16
Fig. 5: The Schedule or Run? dialog
You can:
• Set the Configuration now? slider to Yes to apply the tuning wizard’s recommenda-tions and restart the server now.
• Set the Configuration now? slider to No to enable the Time? field and use the calendarselector to specify a time for PEM to apply the tuning wizard’s recommendations and restartthe server. Note that if you schedule a time for the changes to be applied, you will not beprovided with a preview of the change recommendations.
Select Generate report to view your report options.
171
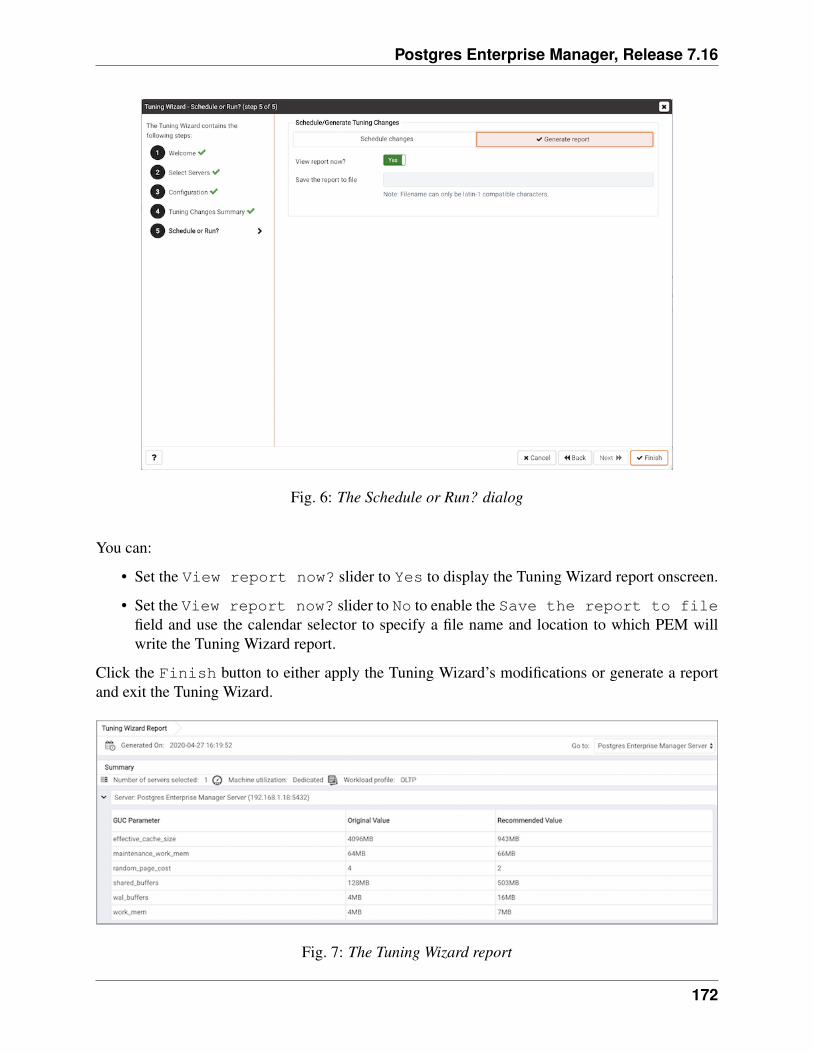
Postgres Enterprise Manager, Release 7.16
Fig. 6: The Schedule or Run? dialog
You can:
• Set the View report now? slider to Yes to display the Tuning Wizard report onscreen.
• Set the View report now? slider to No to enable the Save the report to filefield and use the calendar selector to specify a file name and location to which PEM willwrite the Tuning Wizard report.
Click the Finish button to either apply the Tuning Wizard’s modifications or generate a reportand exit the Tuning Wizard.
Fig. 7: The Tuning Wizard report
172
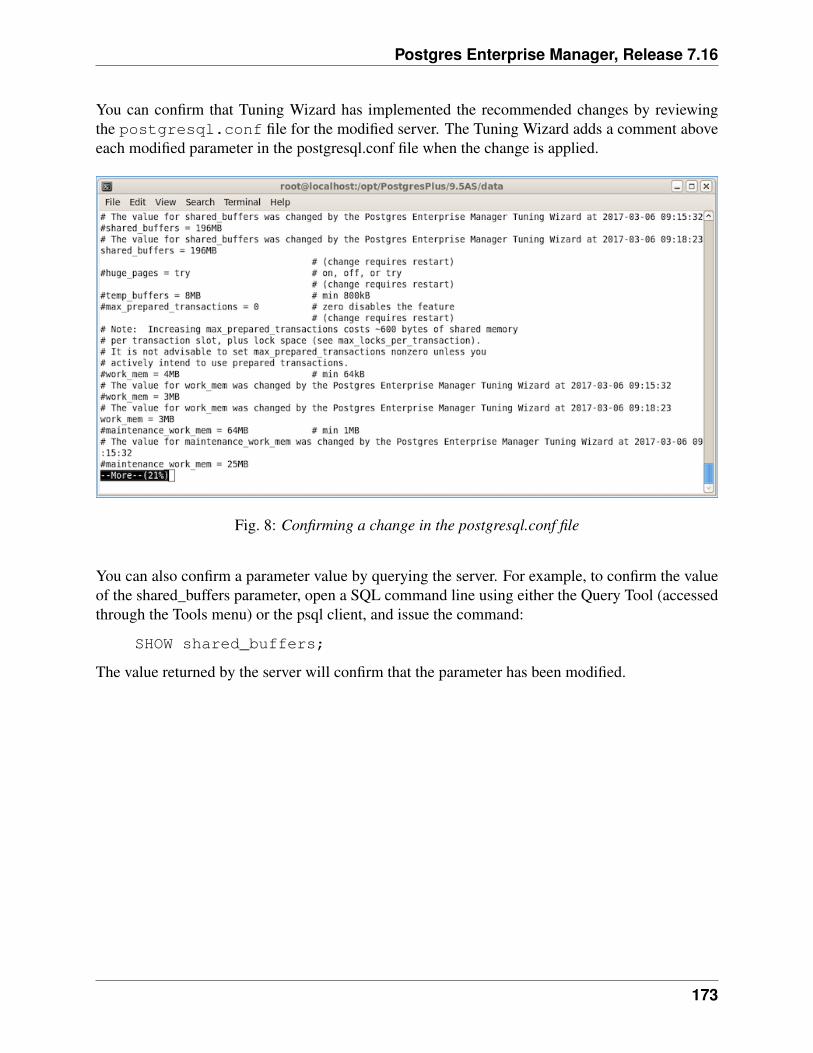
Postgres Enterprise Manager, Release 7.16
You can confirm that Tuning Wizard has implemented the recommended changes by reviewingthe postgresql.conf file for the modified server. The Tuning Wizard adds a comment aboveeach modified parameter in the postgresql.conf file when the change is applied.
Fig. 8: Confirming a change in the postgresql.conf file
You can also confirm a parameter value by querying the server. For example, to confirm the valueof the shared_buffers parameter, open a SQL command line using either the Query Tool (accessedthrough the Tools menu) or the psql client, and issue the command:
SHOW shared_buffers;
The value returned by the server will confirm that the parameter has been modified.
173
CHAPTER 11
Postgres Expert - Best Practice Enforcement
The Postgres Expert utility provides expert advice on how to best configure your Postgres serversfor optimal performance, security, and more. Postgres Expert serves as a PostgreSQL ‘DBA ina box’ by analyzing your servers for deviations in best practices. Postgres Expert contains threespecialized Experts:
• The Configuration Expert.
• The Schema Expert.
• The Security Expert.
You can select specific rules for each Expert to analyze, or accept all rules, and then review PostgresExpert reports detailing any best practice issues that require your attention.
174
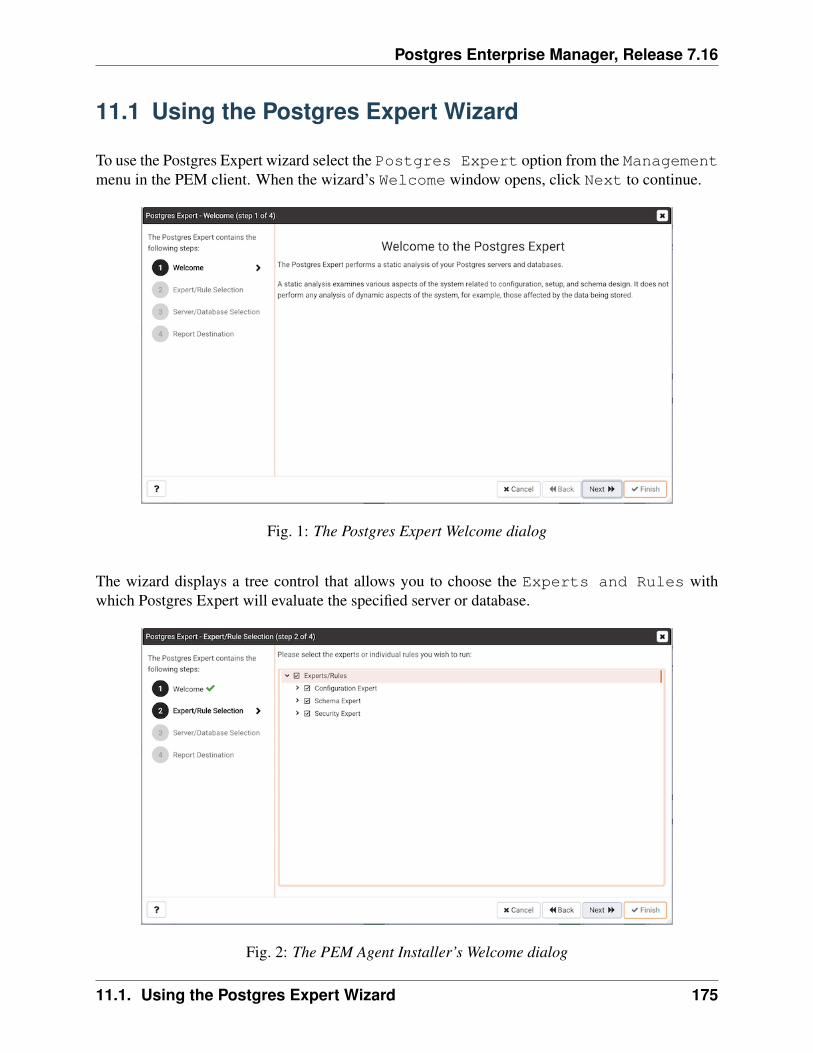
Postgres Enterprise Manager, Release 7.16
11.1 Using the Postgres Expert Wizard
To use the Postgres Expert wizard select the Postgres Expert option from the Managementmenu in the PEM client. When the wizard’s Welcome window opens, click Next to continue.
Fig. 1: The Postgres Expert Welcome dialog
The wizard displays a tree control that allows you to choose the Experts and Rules withwhich Postgres Expert will evaluate the specified server or database.
Fig. 2: The PEM Agent Installer’s Welcome dialog
11.1. Using the Postgres Expert Wizard 175
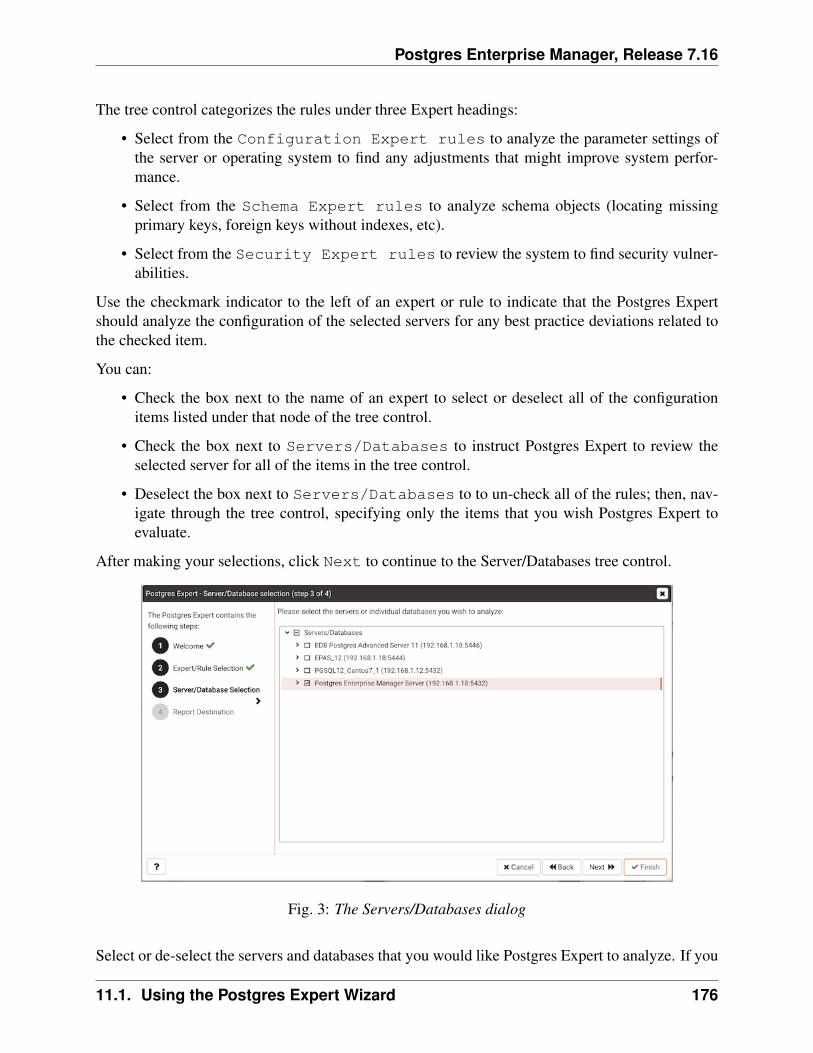
Postgres Enterprise Manager, Release 7.16
The tree control categorizes the rules under three Expert headings:
• Select from the Configuration Expert rules to analyze the parameter settings ofthe server or operating system to find any adjustments that might improve system perfor-mance.
• Select from the Schema Expert rules to analyze schema objects (locating missingprimary keys, foreign keys without indexes, etc).
• Select from the Security Expert rules to review the system to find security vulner-abilities.
Use the checkmark indicator to the left of an expert or rule to indicate that the Postgres Expertshould analyze the configuration of the selected servers for any best practice deviations related tothe checked item.
You can:
• Check the box next to the name of an expert to select or deselect all of the configurationitems listed under that node of the tree control.
• Check the box next to Servers/Databases to instruct Postgres Expert to review theselected server for all of the items in the tree control.
• Deselect the box next to Servers/Databases to to un-check all of the rules; then, nav-igate through the tree control, specifying only the items that you wish Postgres Expert toevaluate.
After making your selections, click Next to continue to the Server/Databases tree control.
Fig. 3: The Servers/Databases dialog
Select or de-select the servers and databases that you would like Postgres Expert to analyze. If you
11.1. Using the Postgres Expert Wizard 176
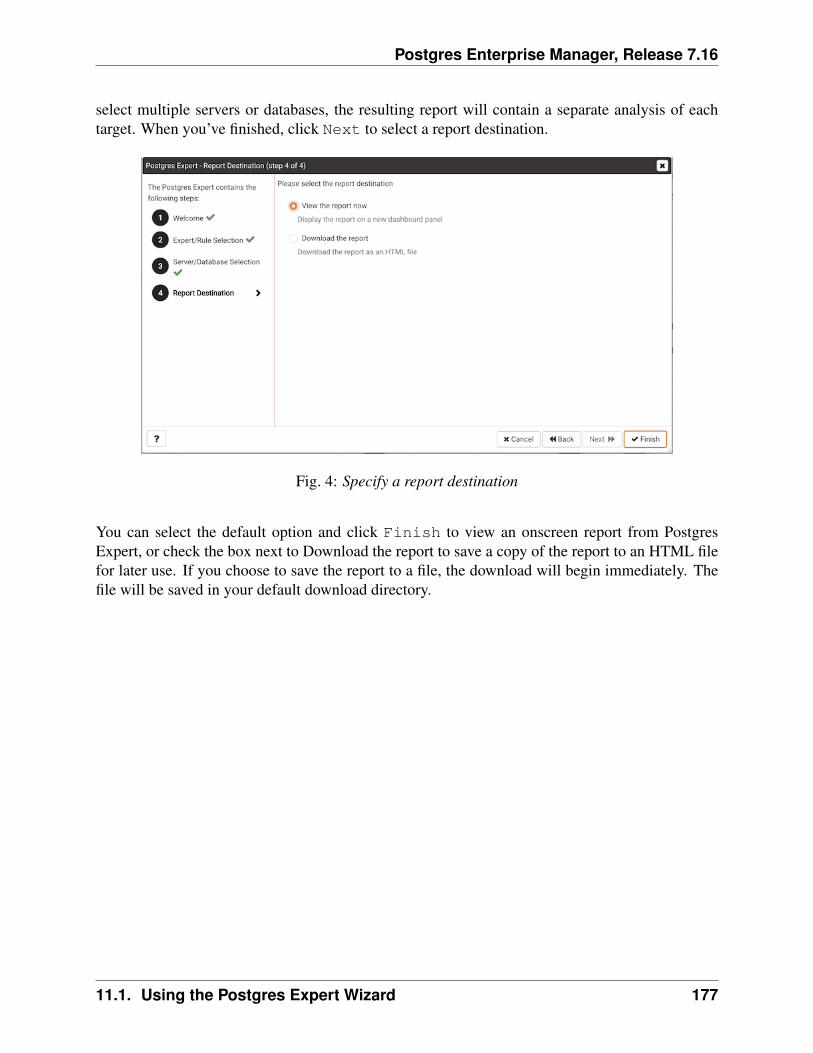
Postgres Enterprise Manager, Release 7.16
select multiple servers or databases, the resulting report will contain a separate analysis of eachtarget. When you’ve finished, click Next to select a report destination.
Fig. 4: Specify a report destination
You can select the default option and click Finish to view an onscreen report from PostgresExpert, or check the box next to Download the report to save a copy of the report to an HTML filefor later use. If you choose to save the report to a file, the download will begin immediately. Thefile will be saved in your default download directory.
11.1. Using the Postgres Expert Wizard 177
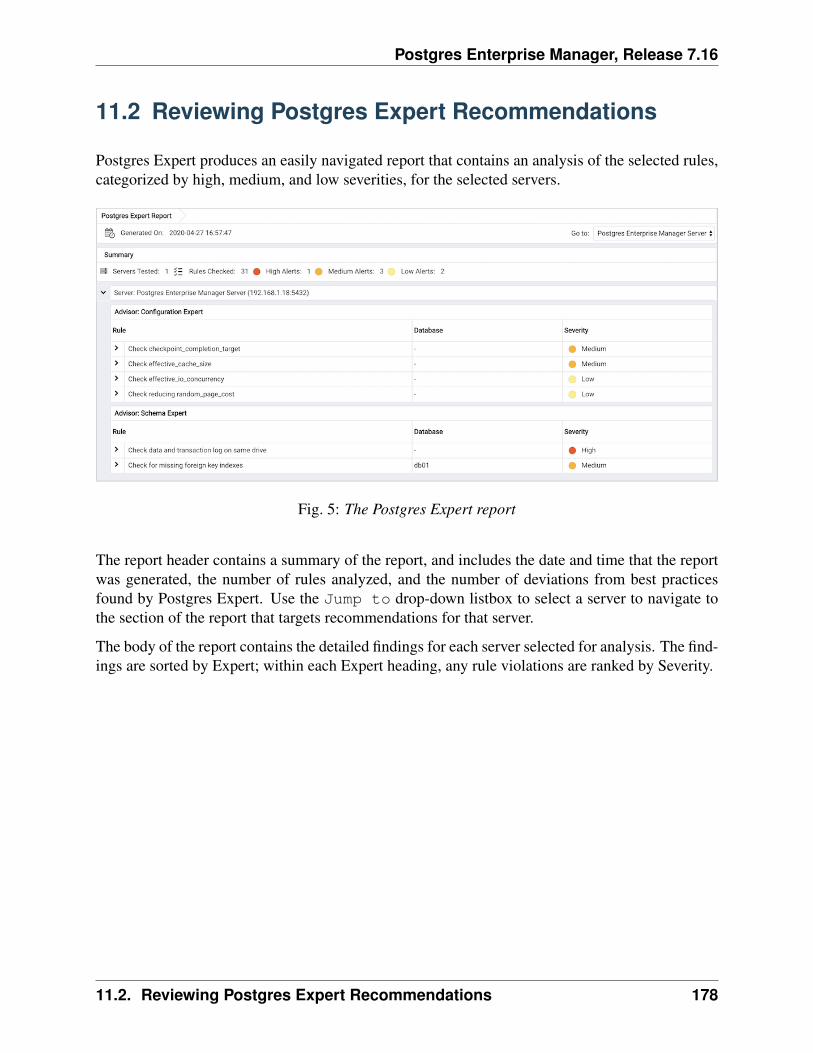
Postgres Enterprise Manager, Release 7.16
11.2 Reviewing Postgres Expert Recommendations
Postgres Expert produces an easily navigated report that contains an analysis of the selected rules,categorized by high, medium, and low severities, for the selected servers.
Fig. 5: The Postgres Expert report
The report header contains a summary of the report, and includes the date and time that the reportwas generated, the number of rules analyzed, and the number of deviations from best practicesfound by Postgres Expert. Use the Jump to drop-down listbox to select a server to navigate tothe section of the report that targets recommendations for that server.
The body of the report contains the detailed findings for each server selected for analysis. The find-ings are sorted by Expert; within each Expert heading, any rule violations are ranked by Severity.
11.2. Reviewing Postgres Expert Recommendations 178
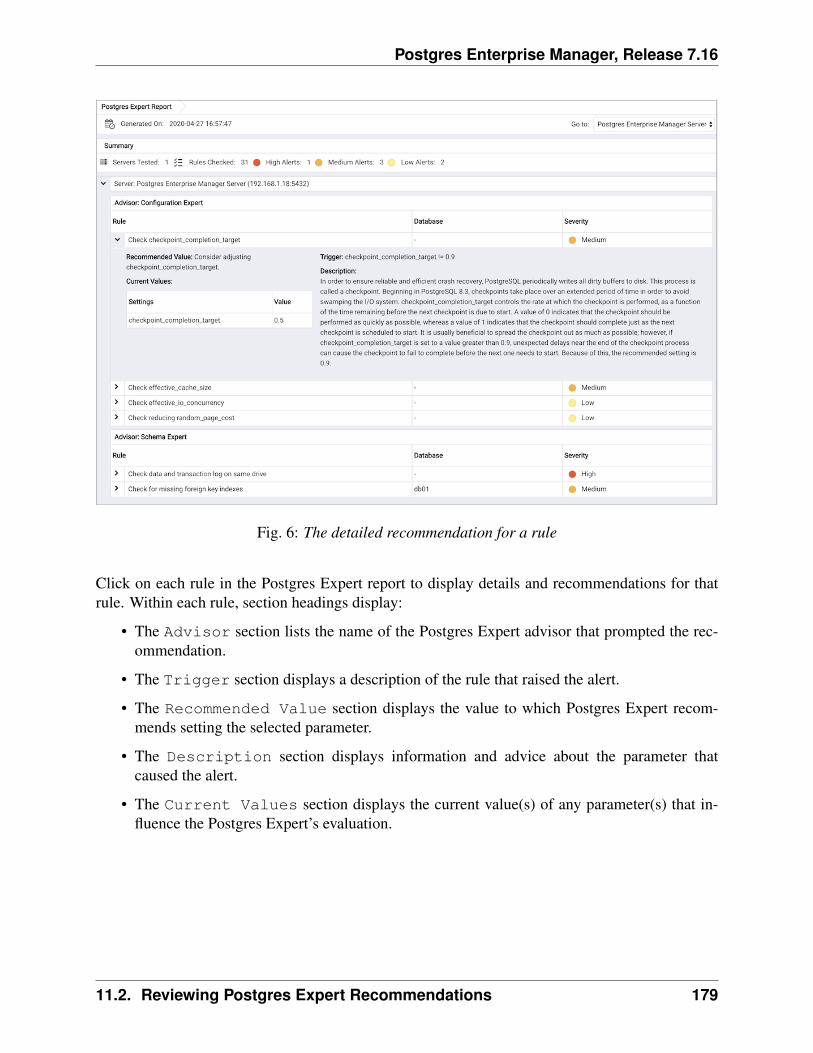
Postgres Enterprise Manager, Release 7.16
Fig. 6: The detailed recommendation for a rule
Click on each rule in the Postgres Expert report to display details and recommendations for thatrule. Within each rule, section headings display:
• The Advisor section lists the name of the Postgres Expert advisor that prompted the rec-ommendation.
• The Trigger section displays a description of the rule that raised the alert.
• The Recommended Value section displays the value to which Postgres Expert recom-mends setting the selected parameter.
• The Description section displays information and advice about the parameter thatcaused the alert.
• The Current Values section displays the current value(s) of any parameter(s) that in-fluence the Postgres Expert’s evaluation.
11.2. Reviewing Postgres Expert Recommendations 179
CHAPTER 12
Reports
You can generate the System Configuration report and Core Usage report for all locally and re-motely managed servers. To generate this report, select Reports from the Management Menu.
Reports has following options:
• System Configuration Report (JSON)
• System Configuration Report (HTML)
• Core Usage Report (JSON)
• Core Usage Report (HTML)
Please note that only superusers or the users with the pem_admin role permission can downloadthe System Configuration or Core Usage reports.
Also note that information in these reports will reflect the latest probe run time.
180
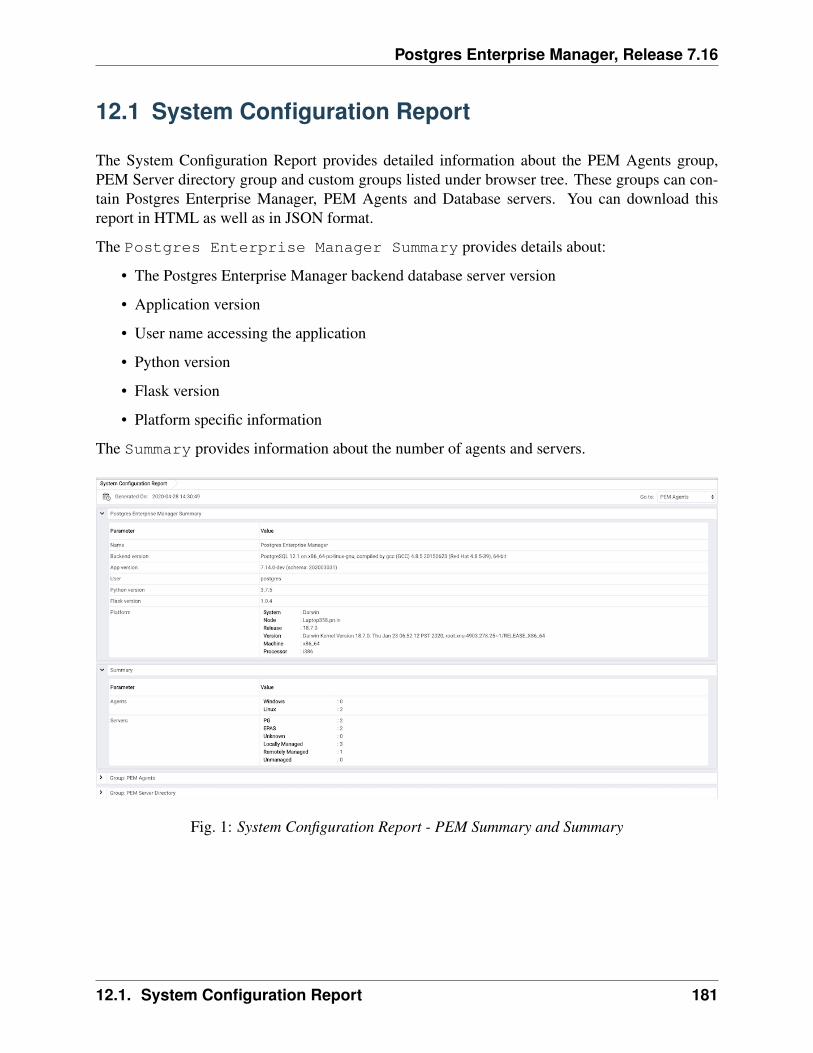
Postgres Enterprise Manager, Release 7.16
12.1 System Configuration Report
The System Configuration Report provides detailed information about the PEM Agents group,PEM Server directory group and custom groups listed under browser tree. These groups can con-tain Postgres Enterprise Manager, PEM Agents and Database servers. You can download thisreport in HTML as well as in JSON format.
The Postgres Enterprise Manager Summary provides details about:
• The Postgres Enterprise Manager backend database server version
• Application version
• User name accessing the application
• Python version
• Flask version
• Platform specific information
The Summary provides information about the number of agents and servers.
Fig. 1: System Configuration Report - PEM Summary and Summary
12.1. System Configuration Report 181
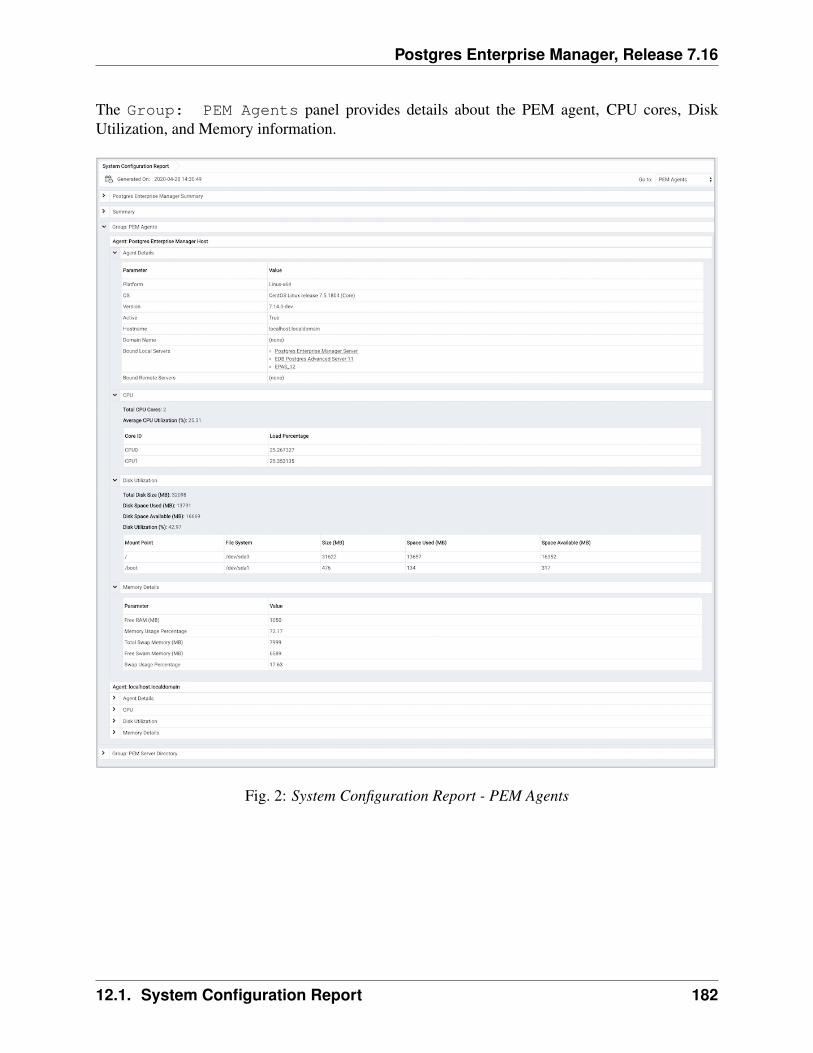
Postgres Enterprise Manager, Release 7.16
The Group: PEM Agents panel provides details about the PEM agent, CPU cores, DiskUtilization, and Memory information.
Fig. 2: System Configuration Report - PEM Agents
12.1. System Configuration Report 182
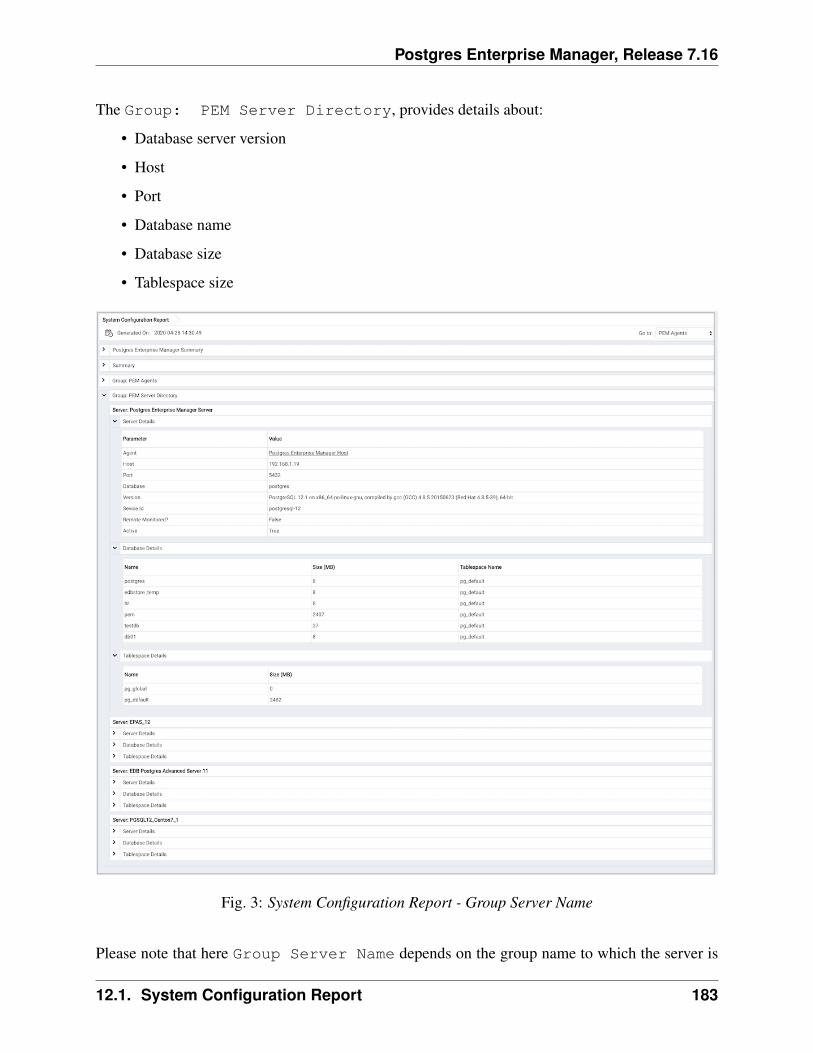
Postgres Enterprise Manager, Release 7.16
The Group: PEM Server Directory, provides details about:
• Database server version
• Host
• Port
• Database name
• Database size
• Tablespace size
Fig. 3: System Configuration Report - Group Server Name
Please note that here Group Server Name depends on the group name to which the server is
12.1. System Configuration Report 183
Postgres Enterprise Manager, Release 7.16
added.
12.1. System Configuration Report 184
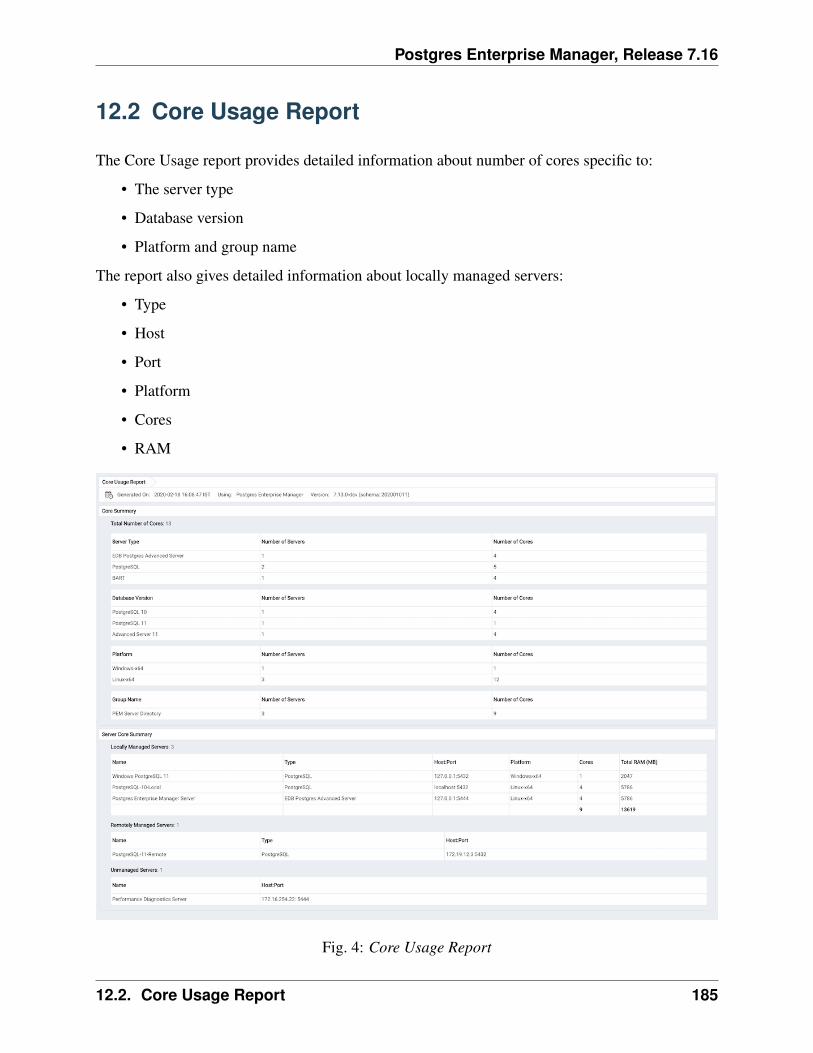
Postgres Enterprise Manager, Release 7.16
12.2 Core Usage Report
The Core Usage report provides detailed information about number of cores specific to:
• The server type
• Database version
• Platform and group name
The report also gives detailed information about locally managed servers:
• Type
• Host
• Port
• Platform
• Cores
• RAM
Fig. 4: Core Usage Report
12.2. Core Usage Report 185
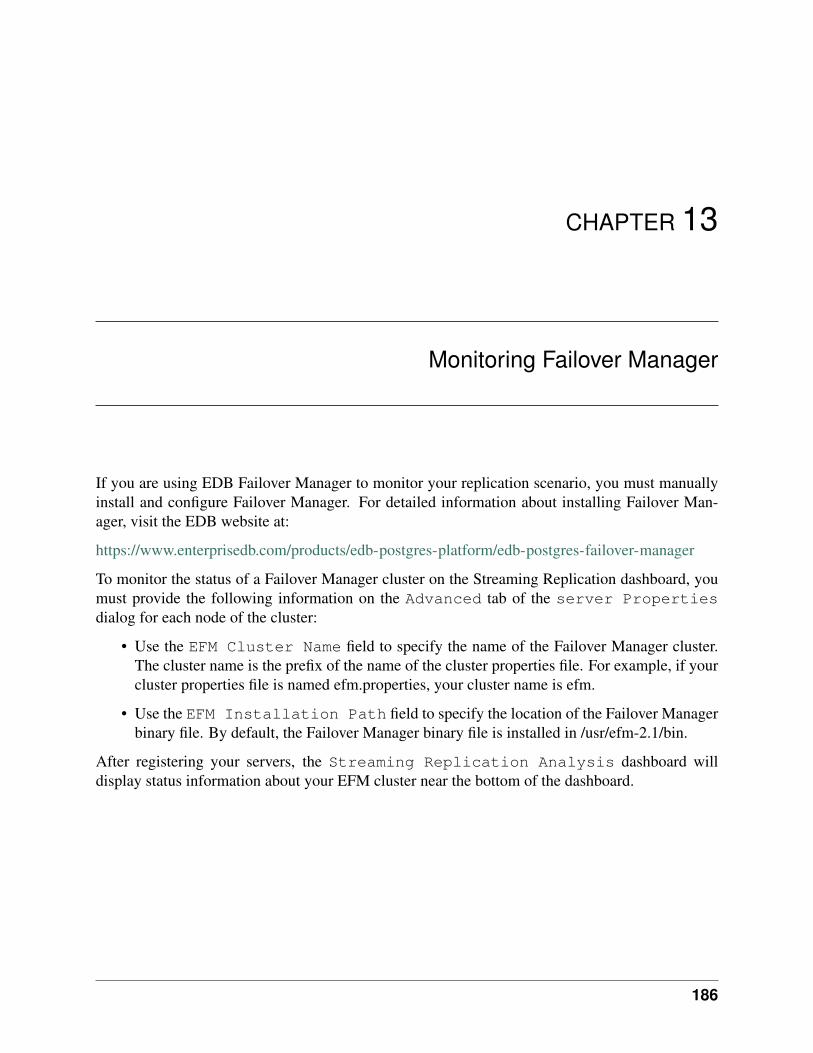
CHAPTER 13
Monitoring Failover Manager
If you are using EDB Failover Manager to monitor your replication scenario, you must manuallyinstall and configure Failover Manager. For detailed information about installing Failover Man-ager, visit the EDB website at:
https://www.enterprisedb.com/products/edb-postgres-platform/edb-postgres-failover-manager
To monitor the status of a Failover Manager cluster on the Streaming Replication dashboard, youmust provide the following information on the Advanced tab of the server Propertiesdialog for each node of the cluster:
• Use the EFM Cluster Name field to specify the name of the Failover Manager cluster.The cluster name is the prefix of the name of the cluster properties file. For example, if yourcluster properties file is named efm.properties, your cluster name is efm.
• Use the EFM Installation Path field to specify the location of the Failover Managerbinary file. By default, the Failover Manager binary file is installed in /usr/efm-2.1/bin.
After registering your servers, the Streaming Replication Analysis dashboard willdisplay status information about your EFM cluster near the bottom of the dashboard.
186
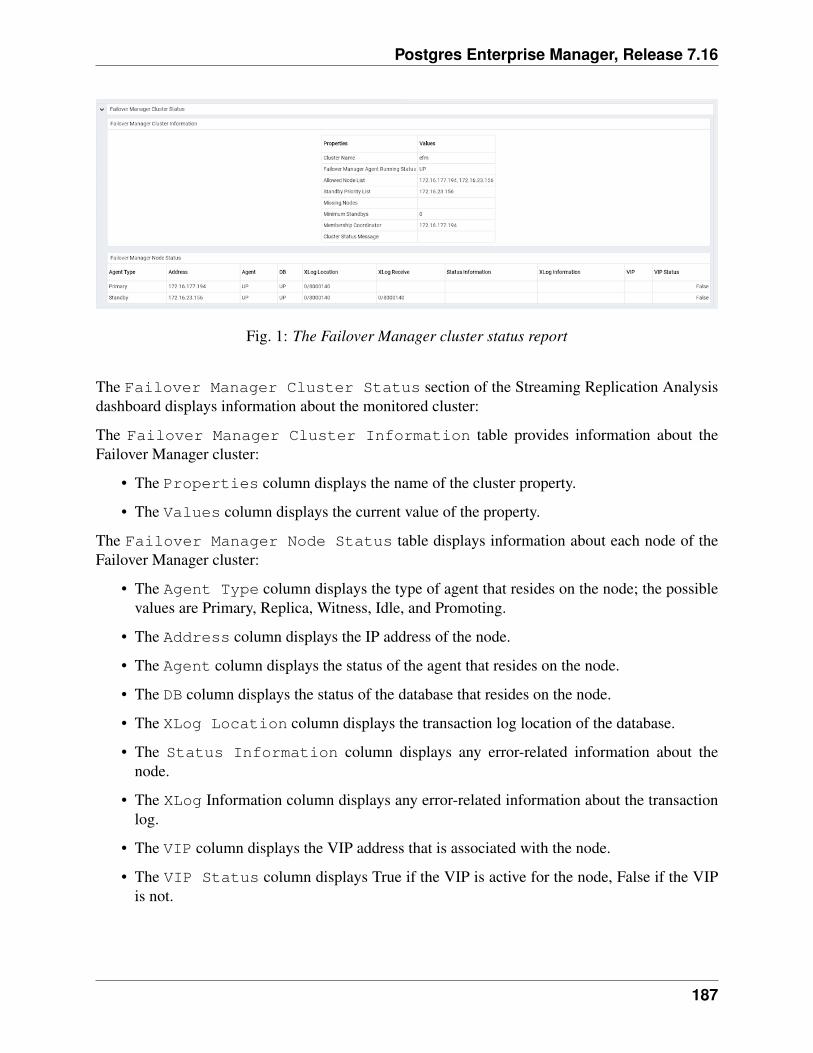
Postgres Enterprise Manager, Release 7.16
Fig. 1: The Failover Manager cluster status report
The Failover Manager Cluster Status section of the Streaming Replication Analysisdashboard displays information about the monitored cluster:
The Failover Manager Cluster Information table provides information about theFailover Manager cluster:
• The Properties column displays the name of the cluster property.
• The Values column displays the current value of the property.
The Failover Manager Node Status table displays information about each node of theFailover Manager cluster:
• The Agent Type column displays the type of agent that resides on the node; the possiblevalues are Primary, Replica, Witness, Idle, and Promoting.
• The Address column displays the IP address of the node.
• The Agent column displays the status of the agent that resides on the node.
• The DB column displays the status of the database that resides on the node.
• The XLog Location column displays the transaction log location of the database.
• The Status Information column displays any error-related information about thenode.
• The XLog Information column displays any error-related information about the transactionlog.
• The VIP column displays the VIP address that is associated with the node.
• The VIP Status column displays True if the VIP is active for the node, False if the VIPis not.
187
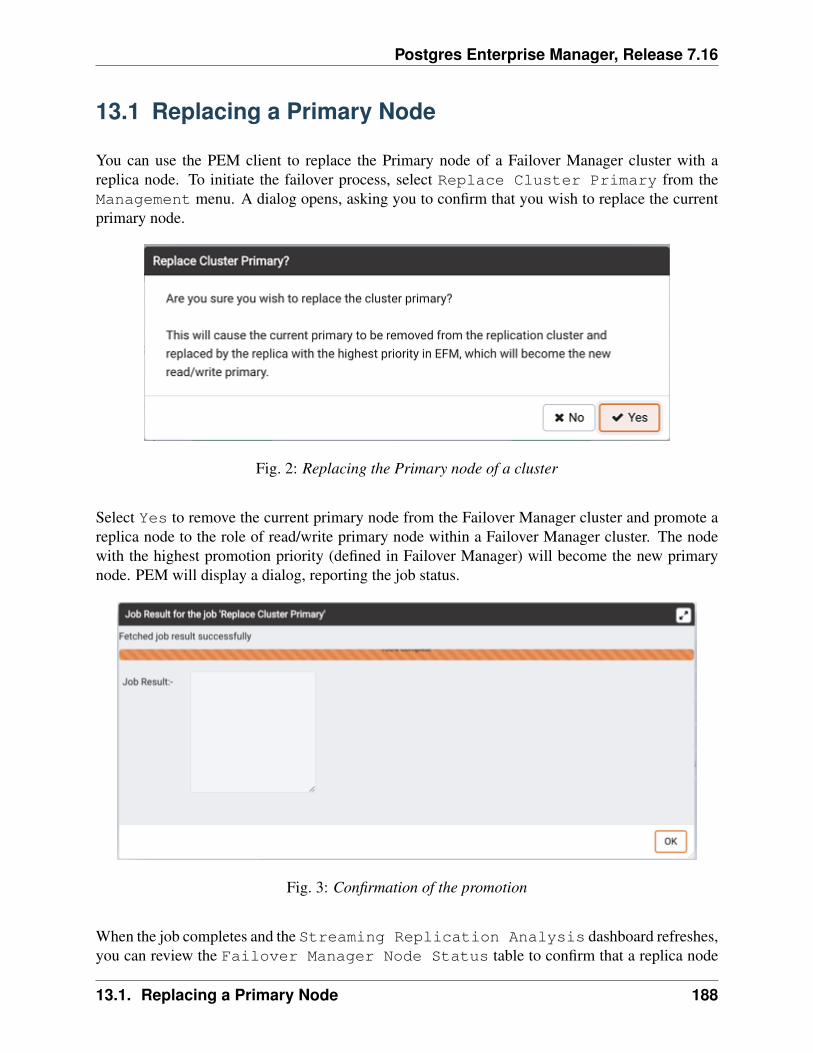
Postgres Enterprise Manager, Release 7.16
13.1 Replacing a Primary Node
You can use the PEM client to replace the Primary node of a Failover Manager cluster with areplica node. To initiate the failover process, select Replace Cluster Primary from theManagement menu. A dialog opens, asking you to confirm that you wish to replace the currentprimary node.
Fig. 2: Replacing the Primary node of a cluster
Select Yes to remove the current primary node from the Failover Manager cluster and promote areplica node to the role of read/write primary node within a Failover Manager cluster. The nodewith the highest promotion priority (defined in Failover Manager) will become the new primarynode. PEM will display a dialog, reporting the job status.
Fig. 3: Confirmation of the promotion
When the job completes and the Streaming Replication Analysis dashboard refreshes,you can review the Failover Manager Node Status table to confirm that a replica node
13.1. Replacing a Primary Node 188
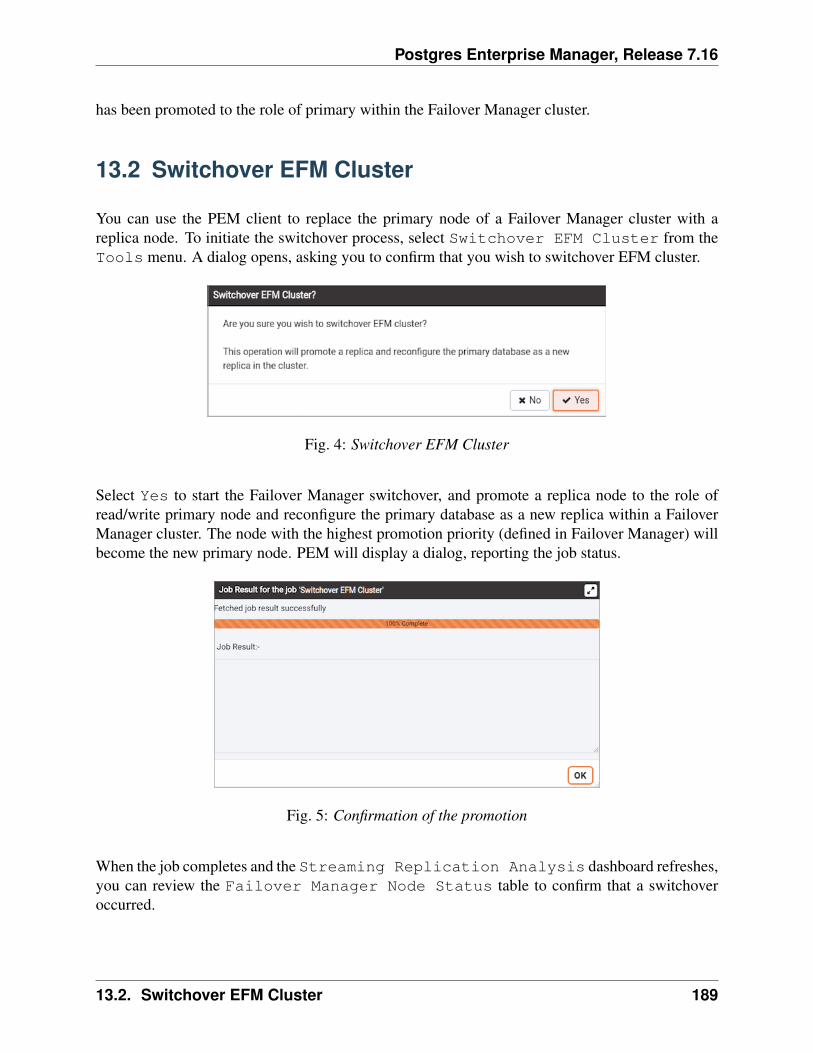
Postgres Enterprise Manager, Release 7.16
has been promoted to the role of primary within the Failover Manager cluster.
13.2 Switchover EFM Cluster
You can use the PEM client to replace the primary node of a Failover Manager cluster with areplica node. To initiate the switchover process, select Switchover EFM Cluster from theTools menu. A dialog opens, asking you to confirm that you wish to switchover EFM cluster.
Fig. 4: Switchover EFM Cluster
Select Yes to start the Failover Manager switchover, and promote a replica node to the role ofread/write primary node and reconfigure the primary database as a new replica within a FailoverManager cluster. The node with the highest promotion priority (defined in Failover Manager) willbecome the new primary node. PEM will display a dialog, reporting the job status.
Fig. 5: Confirmation of the promotion
When the job completes and the Streaming Replication Analysis dashboard refreshes,you can review the Failover Manager Node Status table to confirm that a switchoveroccurred.
13.2. Switchover EFM Cluster 189
CHAPTER 14
Monitoring an xDB Replication Cluster
Before configuring PEM to retrieve statistics from an Advanced Server or PostgreSQL databasethat is part of an xDB replication scenario, you must manually install and configure xDB Repli-cation. For more information about xDB replication solutions and documentation, please visit theEDB website at:
http://www.enterprisedb.com/products-services-training/products-overview/xdb- replication-server-multi-master
The PEM xDB Replication probe monitors lag data for clusters that use xDB multi-primary orsingle-primary replication that have a publication database that is an EDB Postgres AdvancedServer or PostgreSQL database. Please note that if you have configured replication between otherproprietary database hosts (i.e. Oracle or SQL Server) and Advanced Server or PostgreSQL, theprobe cannot return lag information.
190
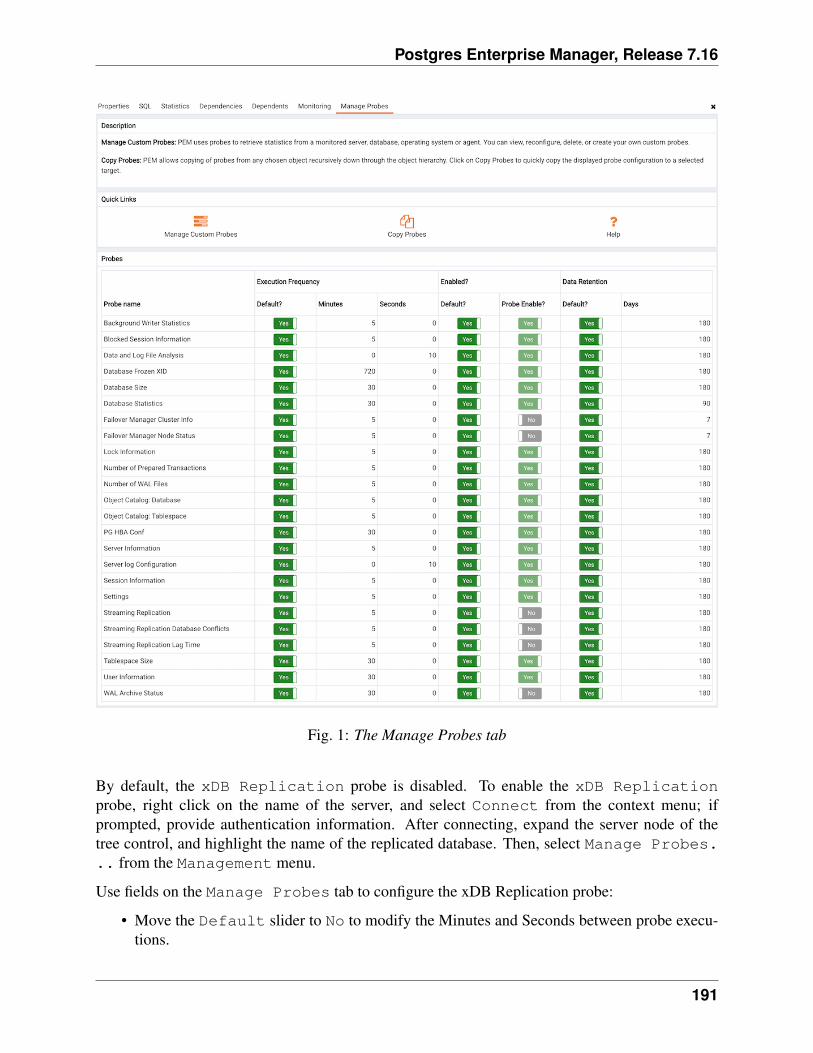
Postgres Enterprise Manager, Release 7.16
Fig. 1: The Manage Probes tab
By default, the xDB Replication probe is disabled. To enable the xDB Replicationprobe, right click on the name of the server, and select Connect from the context menu; ifprompted, provide authentication information. After connecting, expand the server node of thetree control, and highlight the name of the replicated database. Then, select Manage Probes... from the Management menu.
Use fields on the Manage Probes tab to configure the xDB Replication probe:
• Move the Default slider to No to modify the Minutes and Seconds between probe execu-tions.
191
Postgres Enterprise Manager, Release 7.16
• Use the Enabled? slider to instruct PEM to execute the xDB Replication probe.
• Set the Default slider in the Data Retention field to No to modify the number ofdays that PEM will store the information retrieved by the probe.
After enabling the probe, you can use the metrics returned to create custom charts and dashboardsin the PEM client.
192
CHAPTER 15
Performance Diagnostic
You can use the Performance Diagnostic dashboard to analyze the database performancefor Advanced Server instances by monitoring the wait events. To display the diagnostic charts,PEM uses the data collected by Advanced Server’s EDB Wait States module.
For more information on EDB Wait States, see the EDB Postgres Advanced ServerGuide, available at: https://www.enterprisedb.com/edb-docs/d/edb-postgres-advanced-server/user-guides/user-guide/12/EDB_Postgres_Advanced_Server_Guide.1.78.html
You can analyze the Wait States data on multiple levels by narrowing down your selection of data.Each level of the chart is populated on the basis of your selection of data at the higher level.
Prerequisites:
• You must have super user privileges to access the Performance Diagnostic dash-board.
• You must ensure that EDB Wait States module of EDB Postgres Advanced Serveris installed. Modify the postgresql.conf file, adding the edb_wait_stateslibrary to the list of libraries in the shared_preload_libraries parameter:shared_preload_libraries = '$libdir/edb_wait_states'.
Restart the database server, and then create the following extension for the maintenance database:CREATE EXTENSION edb_wait_states;
You will receive the following error message if the above prerequisites are not met:
193
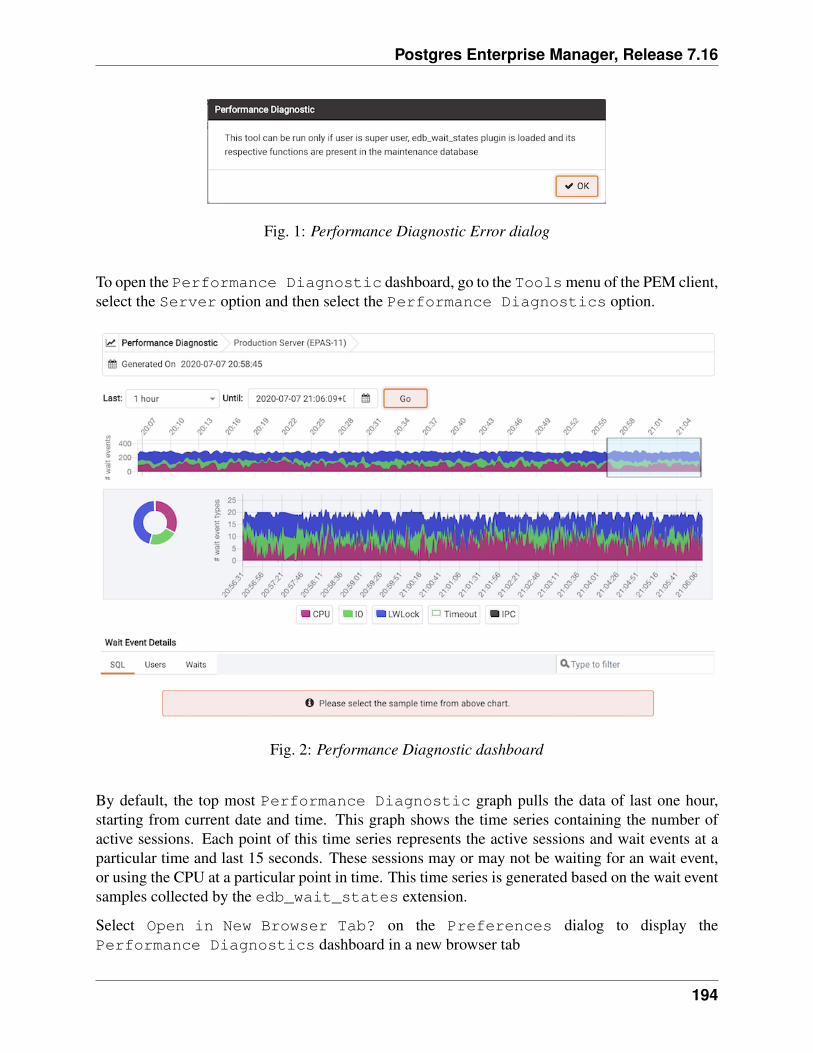
Postgres Enterprise Manager, Release 7.16
Fig. 1: Performance Diagnostic Error dialog
To open the Performance Diagnostic dashboard, go to the Toolsmenu of the PEM client,select the Server option and then select the Performance Diagnostics option.
Fig. 2: Performance Diagnostic dashboard
By default, the top most Performance Diagnostic graph pulls the data of last one hour,starting from current date and time. This graph shows the time series containing the number ofactive sessions. Each point of this time series represents the active sessions and wait events at aparticular time and last 15 seconds. These sessions may or may not be waiting for an wait event,or using the CPU at a particular point in time. This time series is generated based on the wait eventsamples collected by the edb_wait_states extension.
Select Open in New Browser Tab? on the Preferences dialog to display thePerformance Diagnostics dashboard in a new browser tab
194
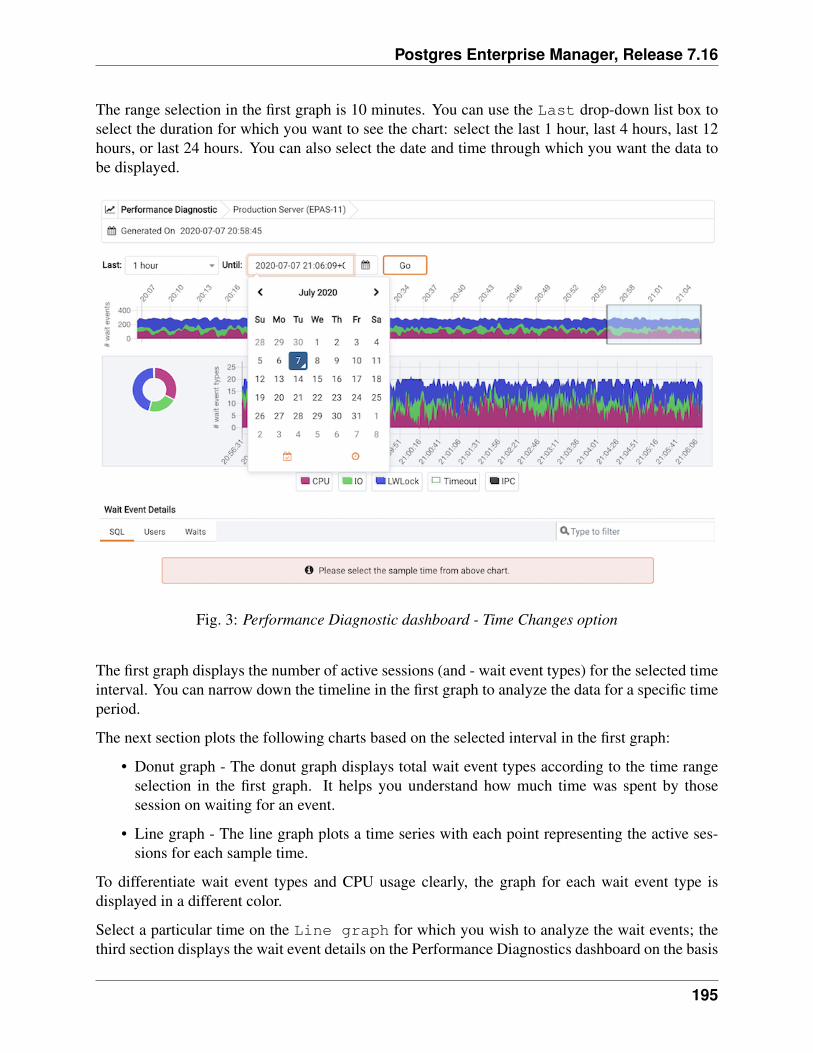
Postgres Enterprise Manager, Release 7.16
The range selection in the first graph is 10 minutes. You can use the Last drop-down list box toselect the duration for which you want to see the chart: select the last 1 hour, last 4 hours, last 12hours, or last 24 hours. You can also select the date and time through which you want the data tobe displayed.
Fig. 3: Performance Diagnostic dashboard - Time Changes option
The first graph displays the number of active sessions (and - wait event types) for the selected timeinterval. You can narrow down the timeline in the first graph to analyze the data for a specific timeperiod.
The next section plots the following charts based on the selected interval in the first graph:
• Donut graph - The donut graph displays total wait event types according to the time rangeselection in the first graph. It helps you understand how much time was spent by thosesession on waiting for an event.
• Line graph - The line graph plots a time series with each point representing the active ses-sions for each sample time.
To differentiate wait event types and CPU usage clearly, the graph for each wait event type isdisplayed in a different color.
Select a particular time on the Line graph for which you wish to analyze the wait events; thethird section displays the wait event details on the Performance Diagnostics dashboard on the basis
195
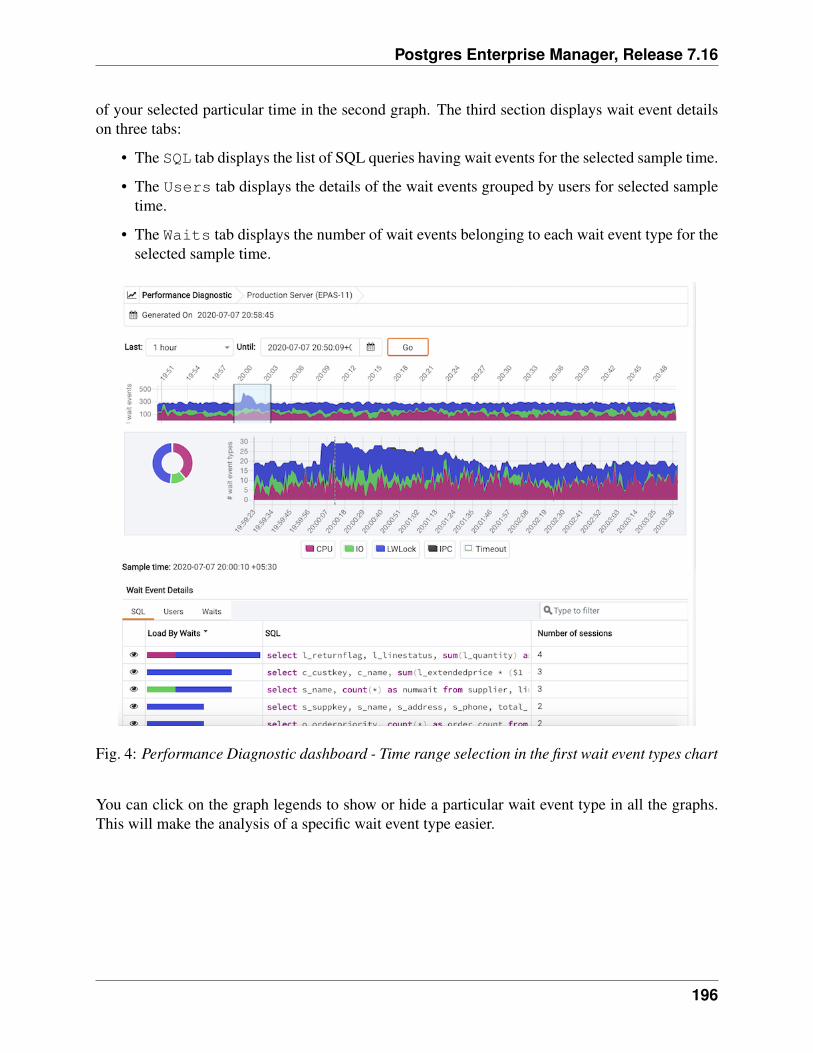
Postgres Enterprise Manager, Release 7.16
of your selected particular time in the second graph. The third section displays wait event detailson three tabs:
• The SQL tab displays the list of SQL queries having wait events for the selected sample time.
• The Users tab displays the details of the wait events grouped by users for selected sampletime.
• The Waits tab displays the number of wait events belonging to each wait event type for theselected sample time.
Fig. 4: Performance Diagnostic dashboard - Time range selection in the first wait event types chart
You can click on the graph legends to show or hide a particular wait event type in all the graphs.This will make the analysis of a specific wait event type easier.
196
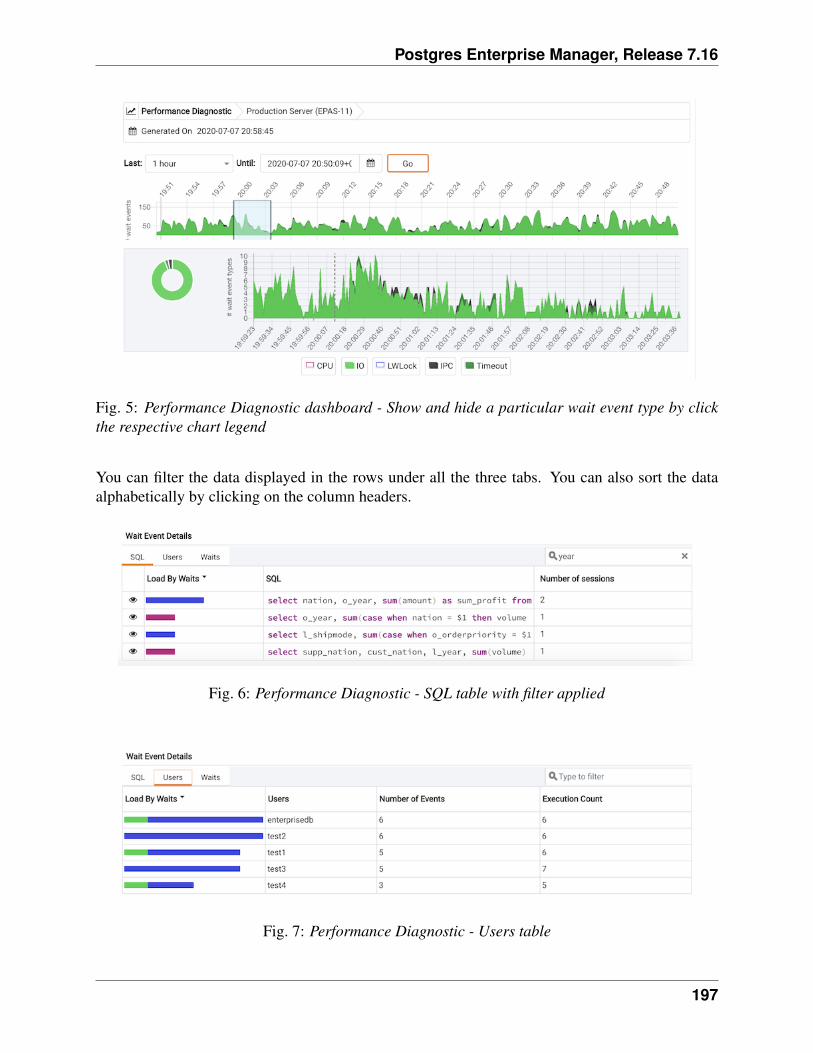
Postgres Enterprise Manager, Release 7.16
Fig. 5: Performance Diagnostic dashboard - Show and hide a particular wait event type by clickthe respective chart legend
You can filter the data displayed in the rows under all the three tabs. You can also sort the dataalphabetically by clicking on the column headers.
Fig. 6: Performance Diagnostic - SQL table with filter applied
Fig. 7: Performance Diagnostic - Users table
197
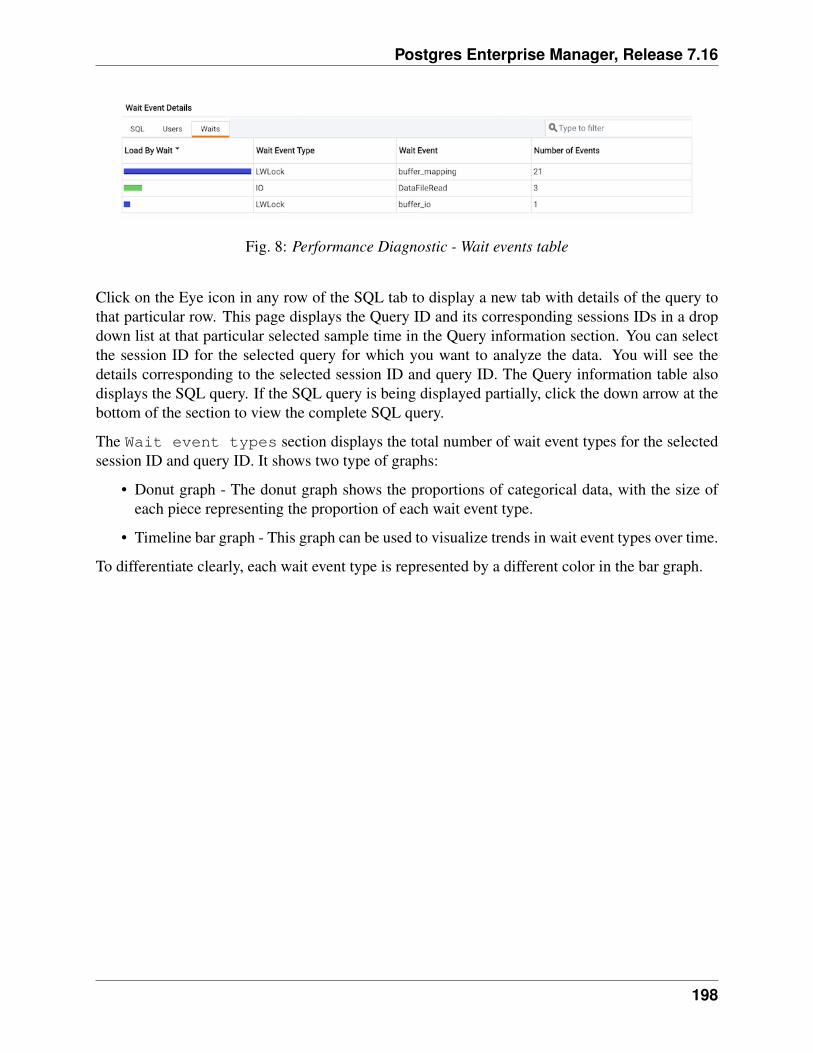
Postgres Enterprise Manager, Release 7.16
Fig. 8: Performance Diagnostic - Wait events table
Click on the Eye icon in any row of the SQL tab to display a new tab with details of the query tothat particular row. This page displays the Query ID and its corresponding sessions IDs in a dropdown list at that particular selected sample time in the Query information section. You can selectthe session ID for the selected query for which you want to analyze the data. You will see thedetails corresponding to the selected session ID and query ID. The Query information table alsodisplays the SQL query. If the SQL query is being displayed partially, click the down arrow at thebottom of the section to view the complete SQL query.
The Wait event types section displays the total number of wait event types for the selectedsession ID and query ID. It shows two type of graphs:
• Donut graph - The donut graph shows the proportions of categorical data, with the size ofeach piece representing the proportion of each wait event type.
• Timeline bar graph - This graph can be used to visualize trends in wait event types over time.
To differentiate clearly, each wait event type is represented by a different color in the bar graph.
198
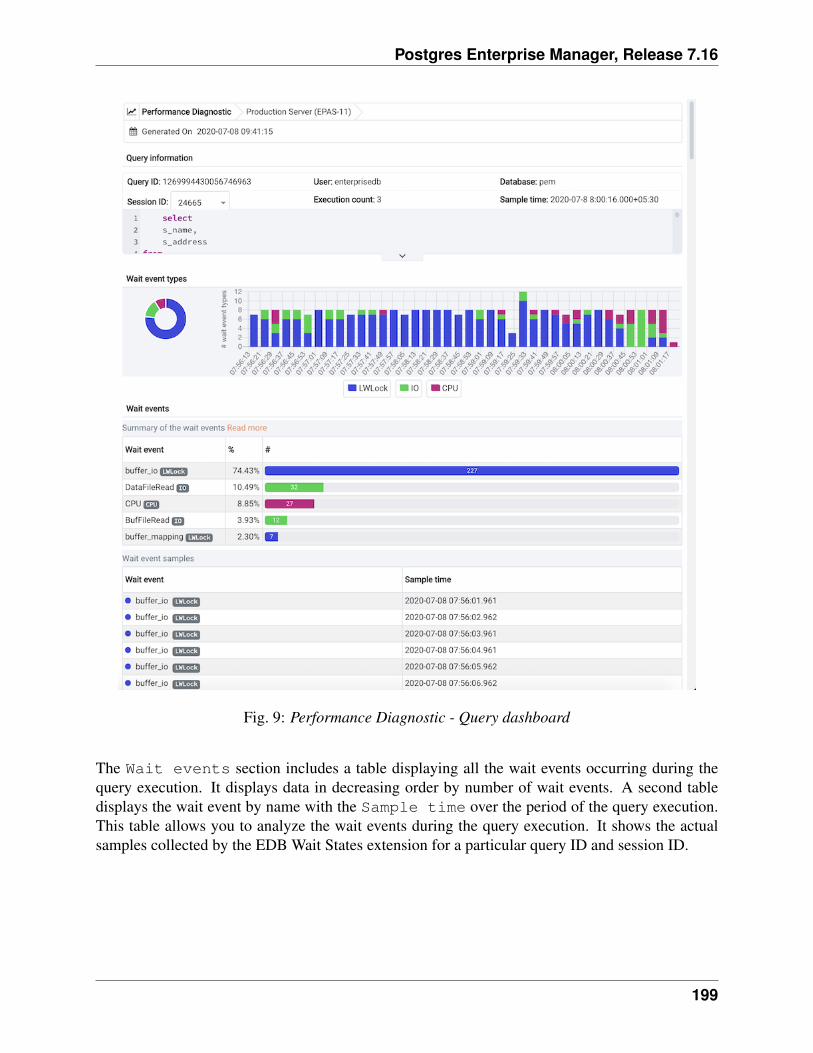
Postgres Enterprise Manager, Release 7.16
Fig. 9: Performance Diagnostic - Query dashboard
The Wait events section includes a table displaying all the wait events occurring during thequery execution. It displays data in decreasing order by number of wait events. A second tabledisplays the wait event by name with the Sample time over the period of the query execution.This table allows you to analyze the wait events during the query execution. It shows the actualsamples collected by the EDB Wait States extension for a particular query ID and session ID.
199
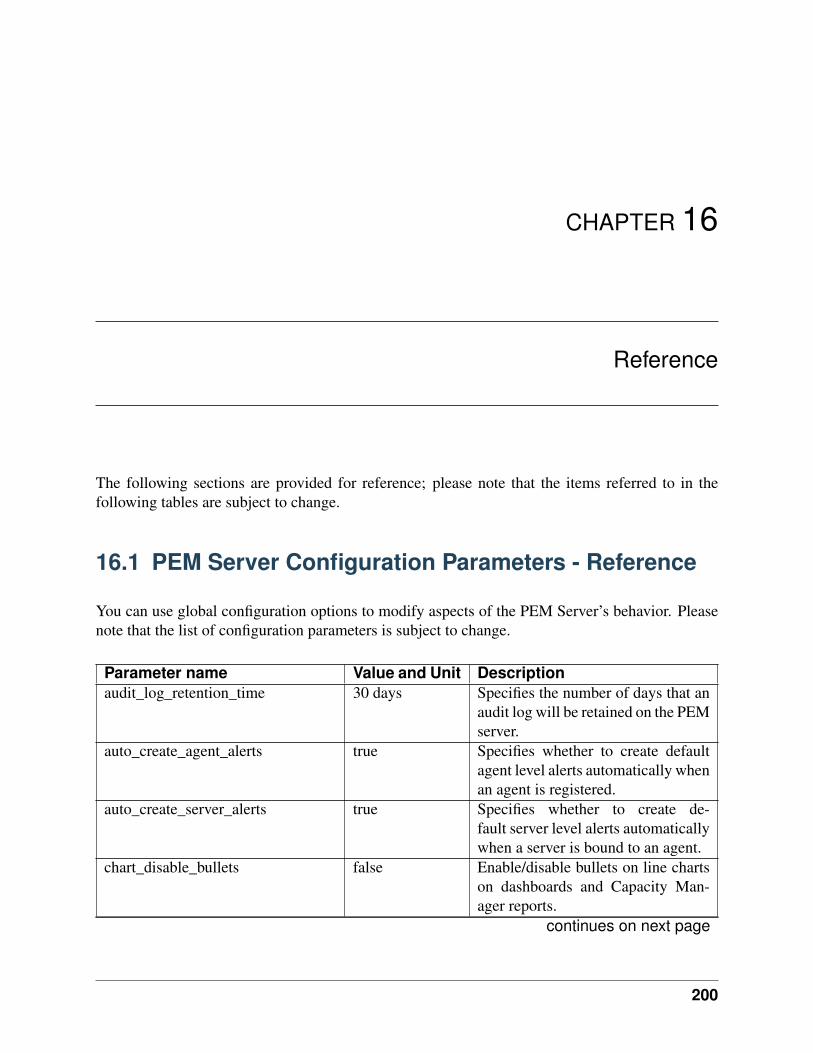
CHAPTER 16
Reference
The following sections are provided for reference; please note that the items referred to in thefollowing tables are subject to change.
16.1 PEM Server Configuration Parameters - Reference
You can use global configuration options to modify aspects of the PEM Server’s behavior. Pleasenote that the list of configuration parameters is subject to change.
Parameter name Value and Unit Descriptionaudit_log_retention_time 30 days Specifies the number of days that an
audit log will be retained on the PEMserver.
auto_create_agent_alerts true Specifies whether to create defaultagent level alerts automatically whenan agent is registered.
auto_create_server_alerts true Specifies whether to create de-fault server level alerts automaticallywhen a server is bound to an agent.
chart_disable_bullets false Enable/disable bullets on line chartson dashboards and Capacity Man-ager reports.
continues on next page
200
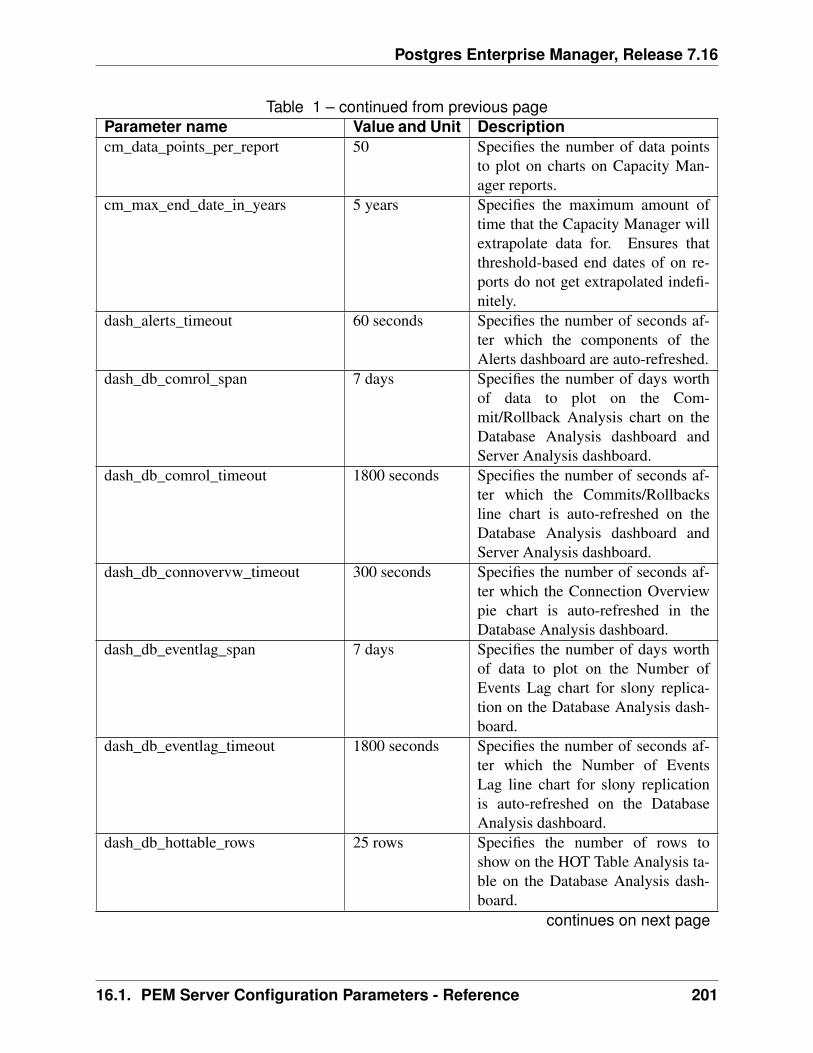
Postgres Enterprise Manager, Release 7.16
Table 1 – continued from previous pageParameter name Value and Unit Descriptioncm_data_points_per_report 50 Specifies the number of data points
to plot on charts on Capacity Man-ager reports.
cm_max_end_date_in_years 5 years Specifies the maximum amount oftime that the Capacity Manager willextrapolate data for. Ensures thatthreshold-based end dates of on re-ports do not get extrapolated indefi-nitely.
dash_alerts_timeout 60 seconds Specifies the number of seconds af-ter which the components of theAlerts dashboard are auto-refreshed.
dash_db_comrol_span 7 days Specifies the number of days worthof data to plot on the Com-mit/Rollback Analysis chart on theDatabase Analysis dashboard andServer Analysis dashboard.
dash_db_comrol_timeout 1800 seconds Specifies the number of seconds af-ter which the Commits/Rollbacksline chart is auto-refreshed on theDatabase Analysis dashboard andServer Analysis dashboard.
dash_db_connovervw_timeout 300 seconds Specifies the number of seconds af-ter which the Connection Overviewpie chart is auto-refreshed in theDatabase Analysis dashboard.
dash_db_eventlag_span 7 days Specifies the number of days worthof data to plot on the Number ofEvents Lag chart for slony replica-tion on the Database Analysis dash-board.
dash_db_eventlag_timeout 1800 seconds Specifies the number of seconds af-ter which the Number of EventsLag line chart for slony replicationis auto-refreshed on the DatabaseAnalysis dashboard.
dash_db_hottable_rows 25 rows Specifies the number of rows toshow on the HOT Table Analysis ta-ble on the Database Analysis dash-board.
continues on next page
16.1. PEM Server Configuration Parameters - Reference 201
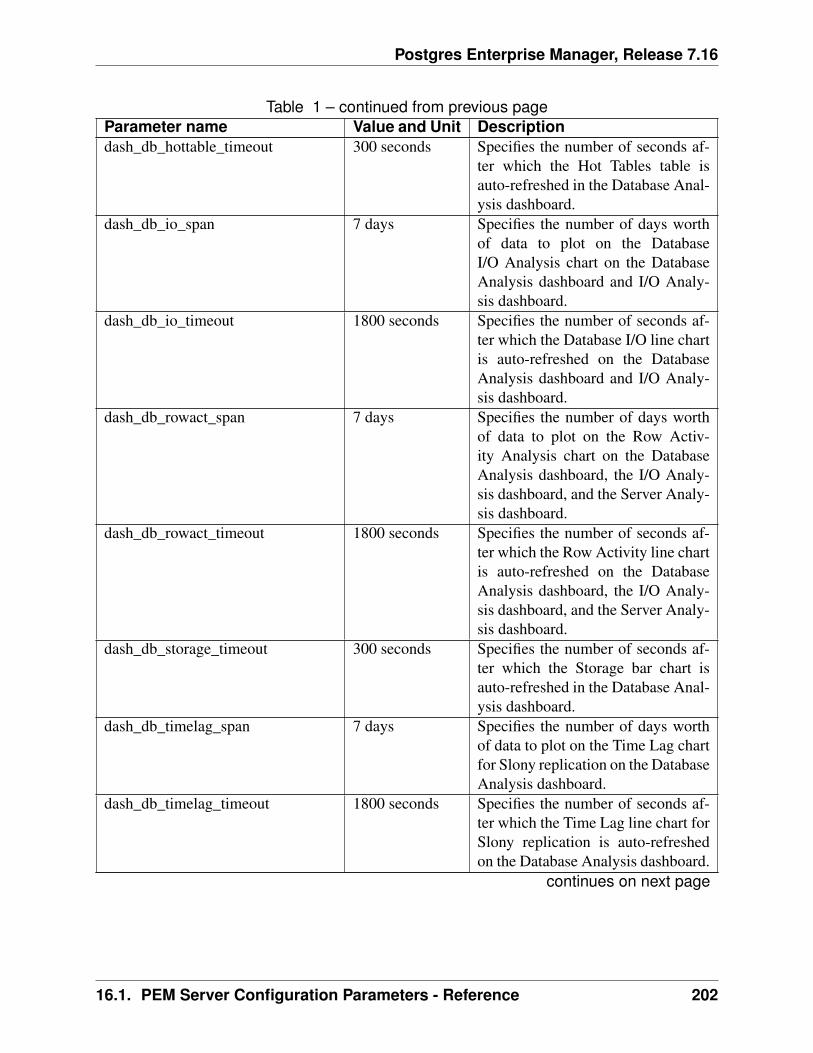
Postgres Enterprise Manager, Release 7.16
Table 1 – continued from previous pageParameter name Value and Unit Descriptiondash_db_hottable_timeout 300 seconds Specifies the number of seconds af-
ter which the Hot Tables table isauto-refreshed in the Database Anal-ysis dashboard.
dash_db_io_span 7 days Specifies the number of days worthof data to plot on the DatabaseI/O Analysis chart on the DatabaseAnalysis dashboard and I/O Analy-sis dashboard.
dash_db_io_timeout 1800 seconds Specifies the number of seconds af-ter which the Database I/O line chartis auto-refreshed on the DatabaseAnalysis dashboard and I/O Analy-sis dashboard.
dash_db_rowact_span 7 days Specifies the number of days worthof data to plot on the Row Activ-ity Analysis chart on the DatabaseAnalysis dashboard, the I/O Analy-sis dashboard, and the Server Analy-sis dashboard.
dash_db_rowact_timeout 1800 seconds Specifies the number of seconds af-ter which the Row Activity line chartis auto-refreshed on the DatabaseAnalysis dashboard, the I/O Analy-sis dashboard, and the Server Analy-sis dashboard.
dash_db_storage_timeout 300 seconds Specifies the number of seconds af-ter which the Storage bar chart isauto-refreshed in the Database Anal-ysis dashboard.
dash_db_timelag_span 7 days Specifies the number of days worthof data to plot on the Time Lag chartfor Slony replication on the DatabaseAnalysis dashboard.
dash_db_timelag_timeout 1800 seconds Specifies the number of seconds af-ter which the Time Lag line chart forSlony replication is auto-refreshedon the Database Analysis dashboard.
continues on next page
16.1. PEM Server Configuration Parameters - Reference 202
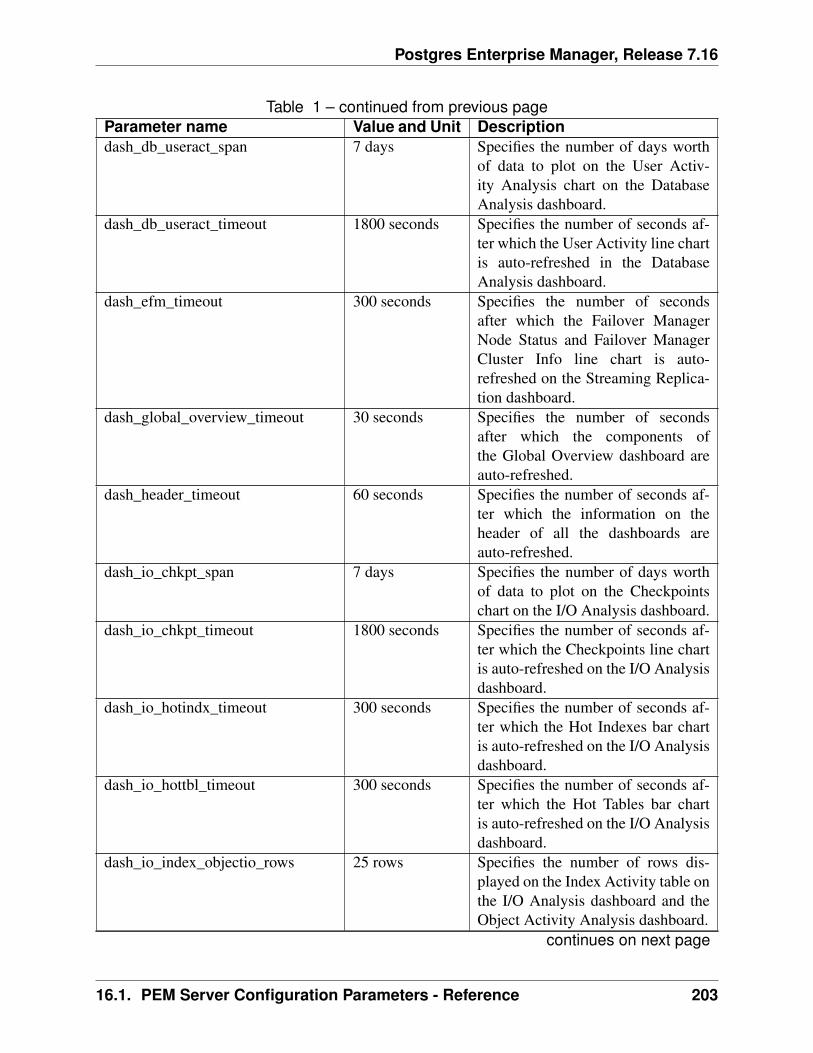
Postgres Enterprise Manager, Release 7.16
Table 1 – continued from previous pageParameter name Value and Unit Descriptiondash_db_useract_span 7 days Specifies the number of days worth
of data to plot on the User Activ-ity Analysis chart on the DatabaseAnalysis dashboard.
dash_db_useract_timeout 1800 seconds Specifies the number of seconds af-ter which the User Activity line chartis auto-refreshed in the DatabaseAnalysis dashboard.
dash_efm_timeout 300 seconds Specifies the number of secondsafter which the Failover ManagerNode Status and Failover ManagerCluster Info line chart is auto-refreshed on the Streaming Replica-tion dashboard.
dash_global_overview_timeout 30 seconds Specifies the number of secondsafter which the components ofthe Global Overview dashboard areauto-refreshed.
dash_header_timeout 60 seconds Specifies the number of seconds af-ter which the information on theheader of all the dashboards areauto-refreshed.
dash_io_chkpt_span 7 days Specifies the number of days worthof data to plot on the Checkpointschart on the I/O Analysis dashboard.
dash_io_chkpt_timeout 1800 seconds Specifies the number of seconds af-ter which the Checkpoints line chartis auto-refreshed on the I/O Analysisdashboard.
dash_io_hotindx_timeout 300 seconds Specifies the number of seconds af-ter which the Hot Indexes bar chartis auto-refreshed on the I/O Analysisdashboard.
dash_io_hottbl_timeout 300 seconds Specifies the number of seconds af-ter which the Hot Tables bar chartis auto-refreshed on the I/O Analysisdashboard.
dash_io_index_objectio_rows 25 rows Specifies the number of rows dis-played on the Index Activity table onthe I/O Analysis dashboard and theObject Activity Analysis dashboard.
continues on next page
16.1. PEM Server Configuration Parameters - Reference 203
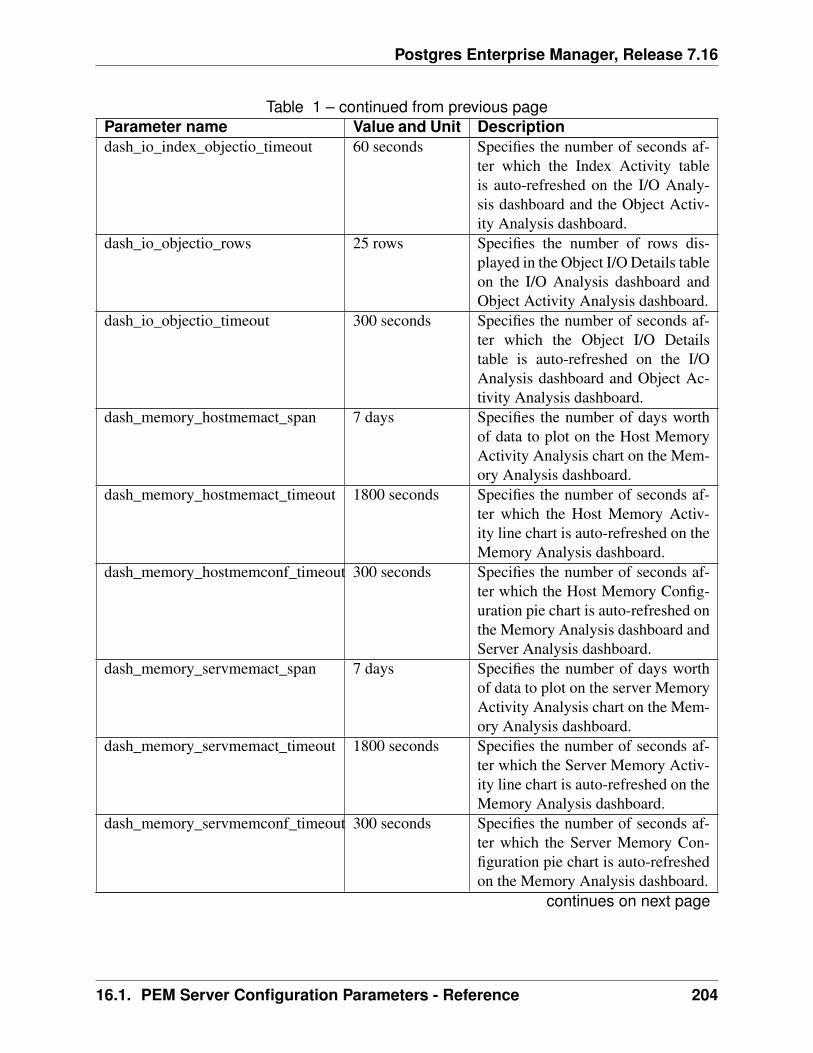
Postgres Enterprise Manager, Release 7.16
Table 1 – continued from previous pageParameter name Value and Unit Descriptiondash_io_index_objectio_timeout 60 seconds Specifies the number of seconds af-
ter which the Index Activity tableis auto-refreshed on the I/O Analy-sis dashboard and the Object Activ-ity Analysis dashboard.
dash_io_objectio_rows 25 rows Specifies the number of rows dis-played in the Object I/O Details tableon the I/O Analysis dashboard andObject Activity Analysis dashboard.
dash_io_objectio_timeout 300 seconds Specifies the number of seconds af-ter which the Object I/O Detailstable is auto-refreshed on the I/OAnalysis dashboard and Object Ac-tivity Analysis dashboard.
dash_memory_hostmemact_span 7 days Specifies the number of days worthof data to plot on the Host MemoryActivity Analysis chart on the Mem-ory Analysis dashboard.
dash_memory_hostmemact_timeout 1800 seconds Specifies the number of seconds af-ter which the Host Memory Activ-ity line chart is auto-refreshed on theMemory Analysis dashboard.
dash_memory_hostmemconf_timeout 300 seconds Specifies the number of seconds af-ter which the Host Memory Config-uration pie chart is auto-refreshed onthe Memory Analysis dashboard andServer Analysis dashboard.
dash_memory_servmemact_span 7 days Specifies the number of days worthof data to plot on the server MemoryActivity Analysis chart on the Mem-ory Analysis dashboard.
dash_memory_servmemact_timeout 1800 seconds Specifies the number of seconds af-ter which the Server Memory Activ-ity line chart is auto-refreshed on theMemory Analysis dashboard.
dash_memory_servmemconf_timeout 300 seconds Specifies the number of seconds af-ter which the Server Memory Con-figuration pie chart is auto-refreshedon the Memory Analysis dashboard.
continues on next page
16.1. PEM Server Configuration Parameters - Reference 204
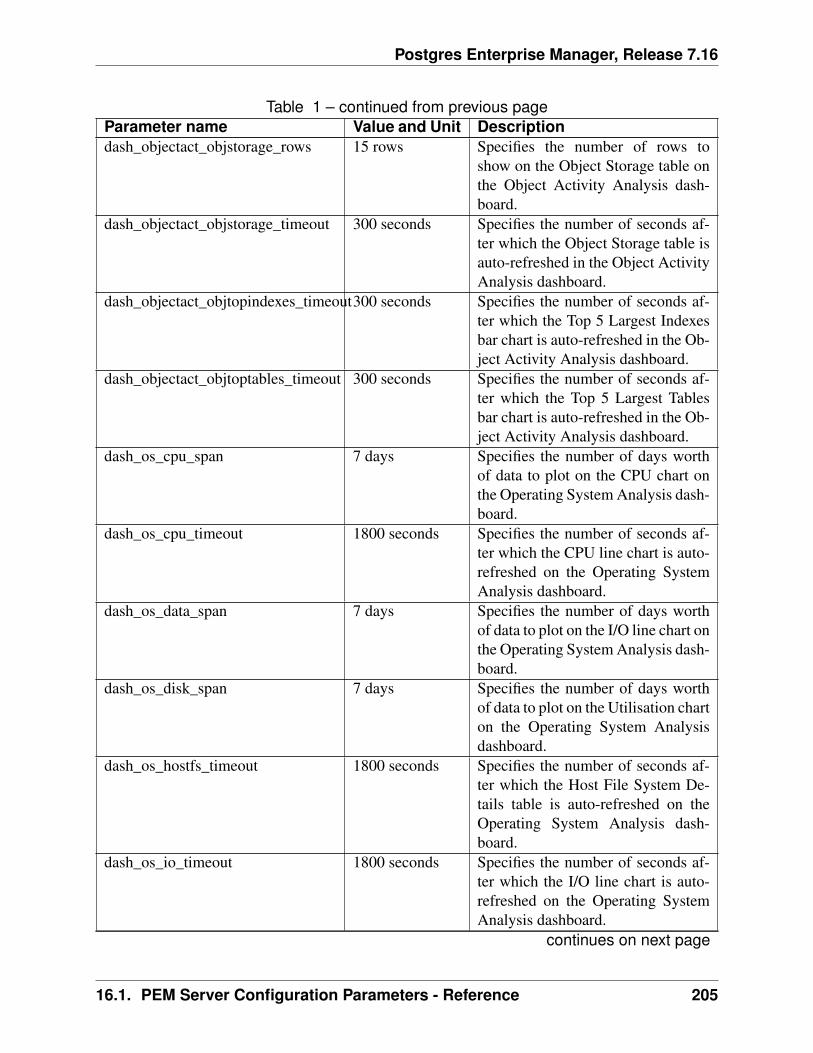
Postgres Enterprise Manager, Release 7.16
Table 1 – continued from previous pageParameter name Value and Unit Descriptiondash_objectact_objstorage_rows 15 rows Specifies the number of rows to
show on the Object Storage table onthe Object Activity Analysis dash-board.
dash_objectact_objstorage_timeout 300 seconds Specifies the number of seconds af-ter which the Object Storage table isauto-refreshed in the Object ActivityAnalysis dashboard.
dash_objectact_objtopindexes_timeout300 seconds Specifies the number of seconds af-ter which the Top 5 Largest Indexesbar chart is auto-refreshed in the Ob-ject Activity Analysis dashboard.
dash_objectact_objtoptables_timeout 300 seconds Specifies the number of seconds af-ter which the Top 5 Largest Tablesbar chart is auto-refreshed in the Ob-ject Activity Analysis dashboard.
dash_os_cpu_span 7 days Specifies the number of days worthof data to plot on the CPU chart onthe Operating System Analysis dash-board.
dash_os_cpu_timeout 1800 seconds Specifies the number of seconds af-ter which the CPU line chart is auto-refreshed on the Operating SystemAnalysis dashboard.
dash_os_data_span 7 days Specifies the number of days worthof data to plot on the I/O line chart onthe Operating System Analysis dash-board.
dash_os_disk_span 7 days Specifies the number of days worthof data to plot on the Utilisation charton the Operating System Analysisdashboard.
dash_os_hostfs_timeout 1800 seconds Specifies the number of seconds af-ter which the Host File System De-tails table is auto-refreshed on theOperating System Analysis dash-board.
dash_os_io_timeout 1800 seconds Specifies the number of seconds af-ter which the I/O line chart is auto-refreshed on the Operating SystemAnalysis dashboard.
continues on next page
16.1. PEM Server Configuration Parameters - Reference 205
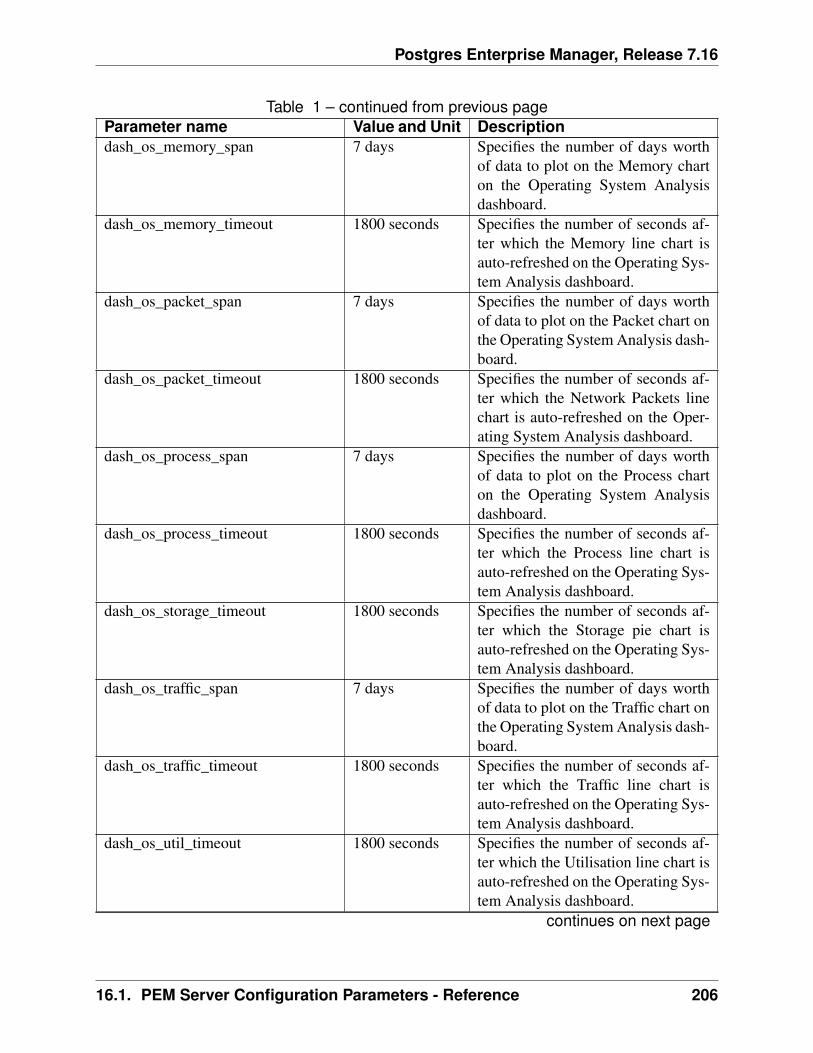
Postgres Enterprise Manager, Release 7.16
Table 1 – continued from previous pageParameter name Value and Unit Descriptiondash_os_memory_span 7 days Specifies the number of days worth
of data to plot on the Memory charton the Operating System Analysisdashboard.
dash_os_memory_timeout 1800 seconds Specifies the number of seconds af-ter which the Memory line chart isauto-refreshed on the Operating Sys-tem Analysis dashboard.
dash_os_packet_span 7 days Specifies the number of days worthof data to plot on the Packet chart onthe Operating System Analysis dash-board.
dash_os_packet_timeout 1800 seconds Specifies the number of seconds af-ter which the Network Packets linechart is auto-refreshed on the Oper-ating System Analysis dashboard.
dash_os_process_span 7 days Specifies the number of days worthof data to plot on the Process charton the Operating System Analysisdashboard.
dash_os_process_timeout 1800 seconds Specifies the number of seconds af-ter which the Process line chart isauto-refreshed on the Operating Sys-tem Analysis dashboard.
dash_os_storage_timeout 1800 seconds Specifies the number of seconds af-ter which the Storage pie chart isauto-refreshed on the Operating Sys-tem Analysis dashboard.
dash_os_traffic_span 7 days Specifies the number of days worthof data to plot on the Traffic chart onthe Operating System Analysis dash-board.
dash_os_traffic_timeout 1800 seconds Specifies the number of seconds af-ter which the Traffic line chart isauto-refreshed on the Operating Sys-tem Analysis dashboard.
dash_os_util_timeout 1800 seconds Specifies the number of seconds af-ter which the Utilisation line chart isauto-refreshed on the Operating Sys-tem Analysis dashboard.
continues on next page
16.1. PEM Server Configuration Parameters - Reference 206
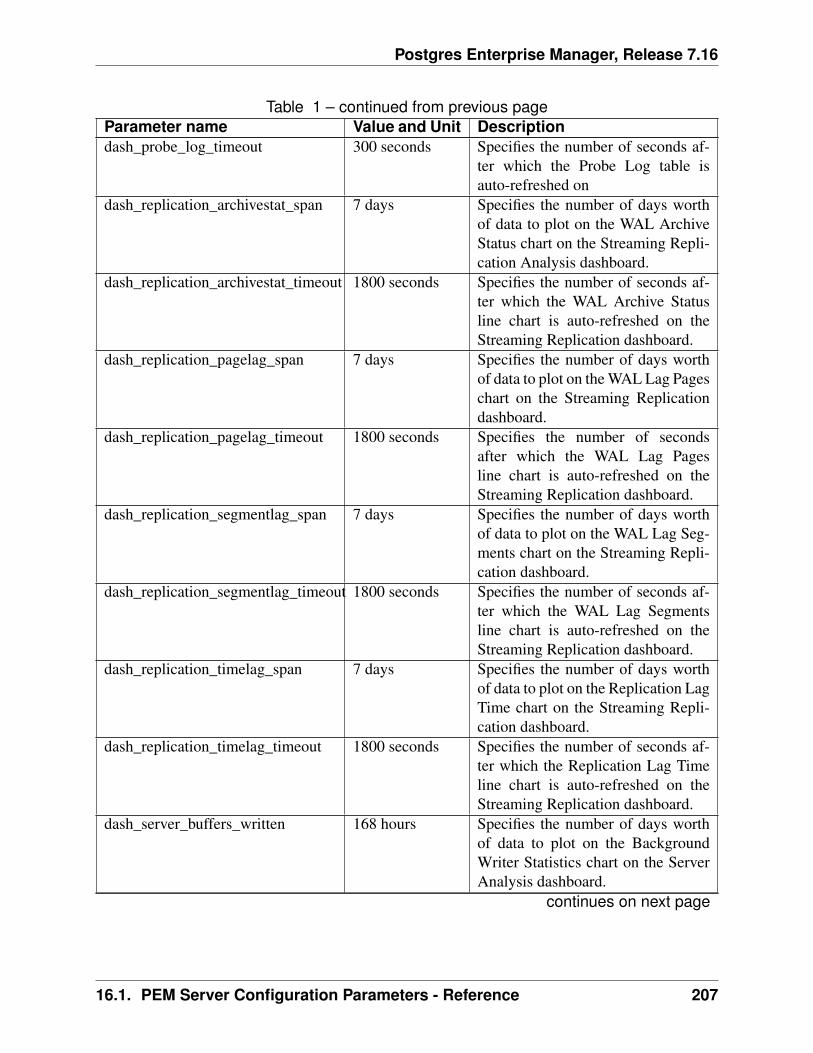
Postgres Enterprise Manager, Release 7.16
Table 1 – continued from previous pageParameter name Value and Unit Descriptiondash_probe_log_timeout 300 seconds Specifies the number of seconds af-
ter which the Probe Log table isauto-refreshed on
dash_replication_archivestat_span 7 days Specifies the number of days worthof data to plot on the WAL ArchiveStatus chart on the Streaming Repli-cation Analysis dashboard.
dash_replication_archivestat_timeout 1800 seconds Specifies the number of seconds af-ter which the WAL Archive Statusline chart is auto-refreshed on theStreaming Replication dashboard.
dash_replication_pagelag_span 7 days Specifies the number of days worthof data to plot on the WAL Lag Pageschart on the Streaming Replicationdashboard.
dash_replication_pagelag_timeout 1800 seconds Specifies the number of secondsafter which the WAL Lag Pagesline chart is auto-refreshed on theStreaming Replication dashboard.
dash_replication_segmentlag_span 7 days Specifies the number of days worthof data to plot on the WAL Lag Seg-ments chart on the Streaming Repli-cation dashboard.
dash_replication_segmentlag_timeout 1800 seconds Specifies the number of seconds af-ter which the WAL Lag Segmentsline chart is auto-refreshed on theStreaming Replication dashboard.
dash_replication_timelag_span 7 days Specifies the number of days worthof data to plot on the Replication LagTime chart on the Streaming Repli-cation dashboard.
dash_replication_timelag_timeout 1800 seconds Specifies the number of seconds af-ter which the Replication Lag Timeline chart is auto-refreshed on theStreaming Replication dashboard.
dash_server_buffers_written 168 hours Specifies the number of days worthof data to plot on the BackgroundWriter Statistics chart on the ServerAnalysis dashboard.
continues on next page
16.1. PEM Server Configuration Parameters - Reference 207
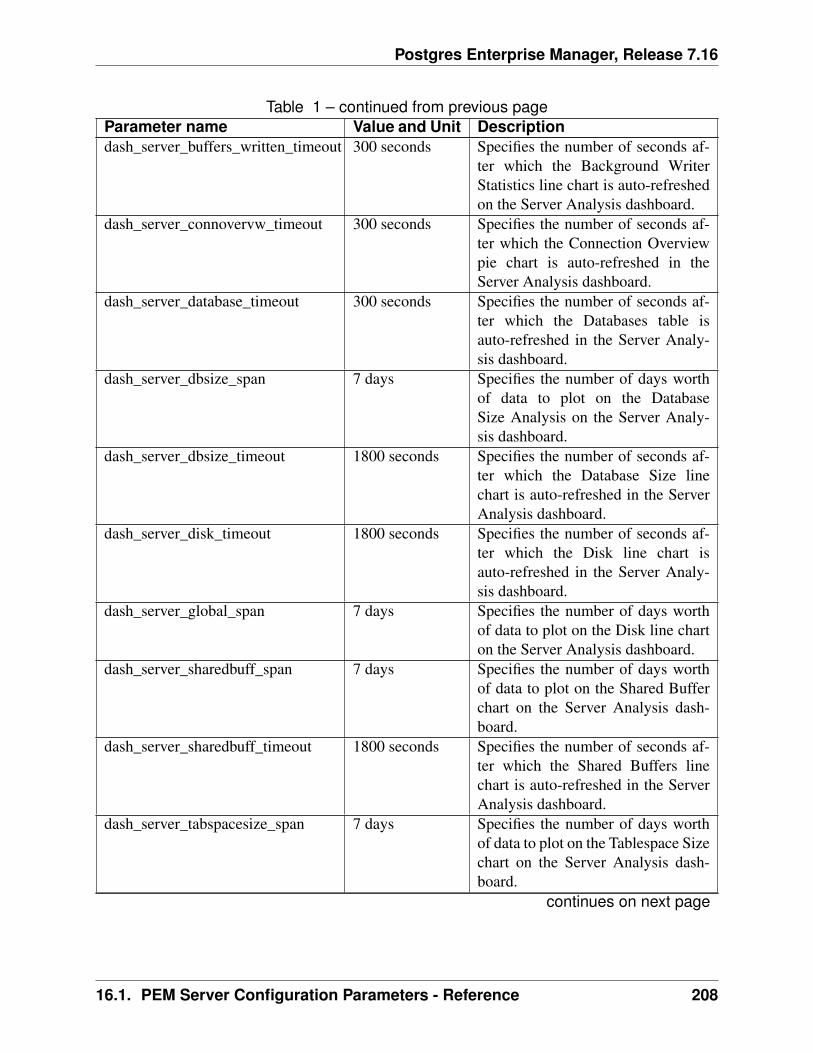
Postgres Enterprise Manager, Release 7.16
Table 1 – continued from previous pageParameter name Value and Unit Descriptiondash_server_buffers_written_timeout 300 seconds Specifies the number of seconds af-
ter which the Background WriterStatistics line chart is auto-refreshedon the Server Analysis dashboard.
dash_server_connovervw_timeout 300 seconds Specifies the number of seconds af-ter which the Connection Overviewpie chart is auto-refreshed in theServer Analysis dashboard.
dash_server_database_timeout 300 seconds Specifies the number of seconds af-ter which the Databases table isauto-refreshed in the Server Analy-sis dashboard.
dash_server_dbsize_span 7 days Specifies the number of days worthof data to plot on the DatabaseSize Analysis on the Server Analy-sis dashboard.
dash_server_dbsize_timeout 1800 seconds Specifies the number of seconds af-ter which the Database Size linechart is auto-refreshed in the ServerAnalysis dashboard.
dash_server_disk_timeout 1800 seconds Specifies the number of seconds af-ter which the Disk line chart isauto-refreshed in the Server Analy-sis dashboard.
dash_server_global_span 7 days Specifies the number of days worthof data to plot on the Disk line charton the Server Analysis dashboard.
dash_server_sharedbuff_span 7 days Specifies the number of days worthof data to plot on the Shared Bufferchart on the Server Analysis dash-board.
dash_server_sharedbuff_timeout 1800 seconds Specifies the number of seconds af-ter which the Shared Buffers linechart is auto-refreshed in the ServerAnalysis dashboard.
dash_server_tabspacesize_span 7 days Specifies the number of days worthof data to plot on the Tablespace Sizechart on the Server Analysis dash-board.
continues on next page
16.1. PEM Server Configuration Parameters - Reference 208
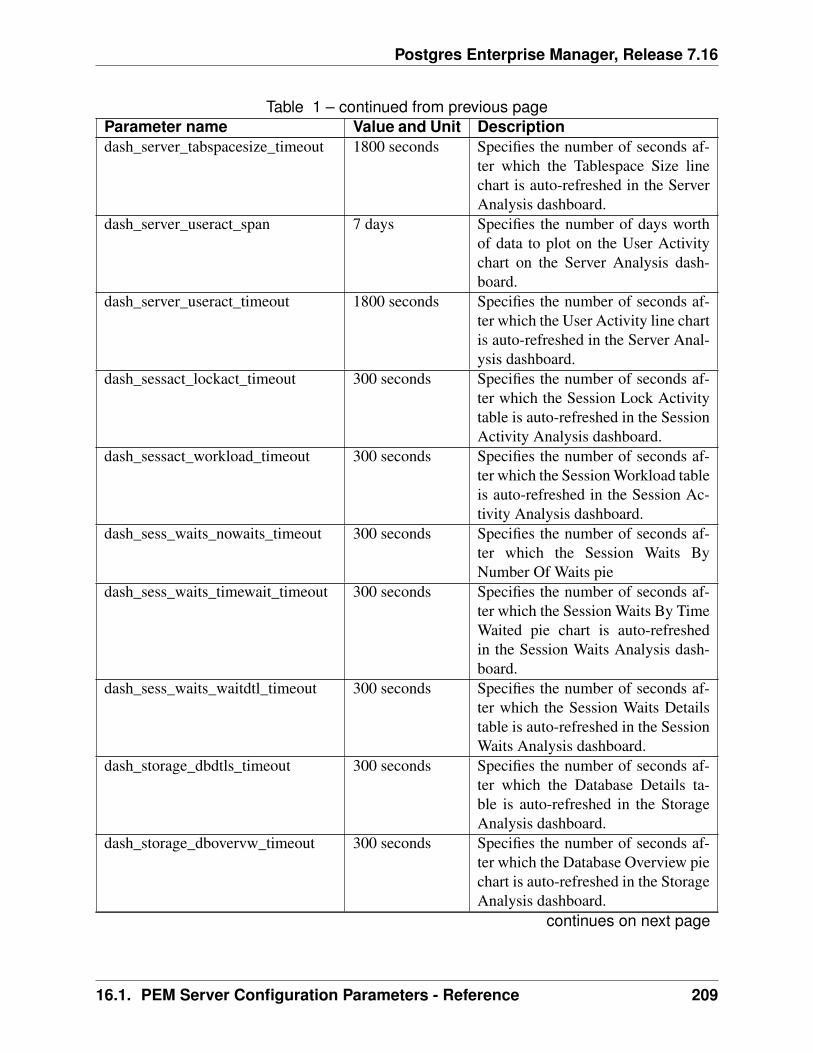
Postgres Enterprise Manager, Release 7.16
Table 1 – continued from previous pageParameter name Value and Unit Descriptiondash_server_tabspacesize_timeout 1800 seconds Specifies the number of seconds af-
ter which the Tablespace Size linechart is auto-refreshed in the ServerAnalysis dashboard.
dash_server_useract_span 7 days Specifies the number of days worthof data to plot on the User Activitychart on the Server Analysis dash-board.
dash_server_useract_timeout 1800 seconds Specifies the number of seconds af-ter which the User Activity line chartis auto-refreshed in the Server Anal-ysis dashboard.
dash_sessact_lockact_timeout 300 seconds Specifies the number of seconds af-ter which the Session Lock Activitytable is auto-refreshed in the SessionActivity Analysis dashboard.
dash_sessact_workload_timeout 300 seconds Specifies the number of seconds af-ter which the Session Workload tableis auto-refreshed in the Session Ac-tivity Analysis dashboard.
dash_sess_waits_nowaits_timeout 300 seconds Specifies the number of seconds af-ter which the Session Waits ByNumber Of Waits pie
dash_sess_waits_timewait_timeout 300 seconds Specifies the number of seconds af-ter which the Session Waits By TimeWaited pie chart is auto-refreshedin the Session Waits Analysis dash-board.
dash_sess_waits_waitdtl_timeout 300 seconds Specifies the number of seconds af-ter which the Session Waits Detailstable is auto-refreshed in the SessionWaits Analysis dashboard.
dash_storage_dbdtls_timeout 300 seconds Specifies the number of seconds af-ter which the Database Details ta-ble is auto-refreshed in the StorageAnalysis dashboard.
dash_storage_dbovervw_timeout 300 seconds Specifies the number of seconds af-ter which the Database Overview piechart is auto-refreshed in the StorageAnalysis dashboard.
continues on next page
16.1. PEM Server Configuration Parameters - Reference 209
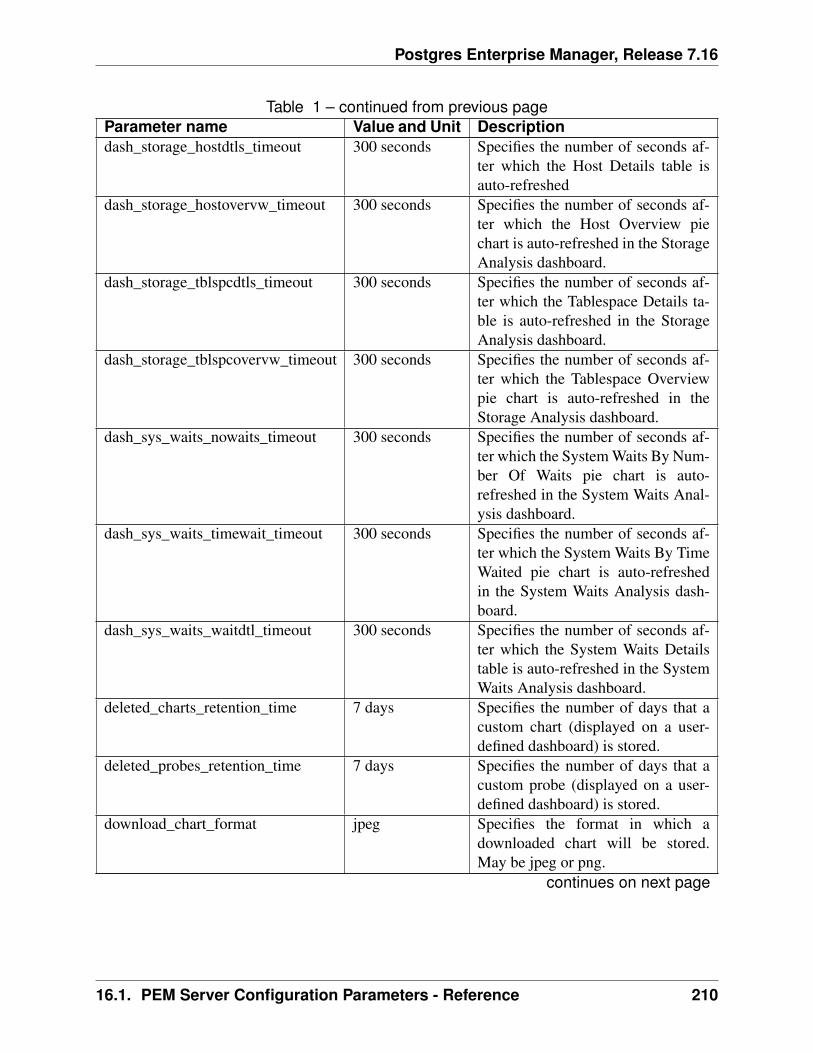
Postgres Enterprise Manager, Release 7.16
Table 1 – continued from previous pageParameter name Value and Unit Descriptiondash_storage_hostdtls_timeout 300 seconds Specifies the number of seconds af-
ter which the Host Details table isauto-refreshed
dash_storage_hostovervw_timeout 300 seconds Specifies the number of seconds af-ter which the Host Overview piechart is auto-refreshed in the StorageAnalysis dashboard.
dash_storage_tblspcdtls_timeout 300 seconds Specifies the number of seconds af-ter which the Tablespace Details ta-ble is auto-refreshed in the StorageAnalysis dashboard.
dash_storage_tblspcovervw_timeout 300 seconds Specifies the number of seconds af-ter which the Tablespace Overviewpie chart is auto-refreshed in theStorage Analysis dashboard.
dash_sys_waits_nowaits_timeout 300 seconds Specifies the number of seconds af-ter which the System Waits By Num-ber Of Waits pie chart is auto-refreshed in the System Waits Anal-ysis dashboard.
dash_sys_waits_timewait_timeout 300 seconds Specifies the number of seconds af-ter which the System Waits By TimeWaited pie chart is auto-refreshedin the System Waits Analysis dash-board.
dash_sys_waits_waitdtl_timeout 300 seconds Specifies the number of seconds af-ter which the System Waits Detailstable is auto-refreshed in the SystemWaits Analysis dashboard.
deleted_charts_retention_time 7 days Specifies the number of days that acustom chart (displayed on a user-defined dashboard) is stored.
deleted_probes_retention_time 7 days Specifies the number of days that acustom probe (displayed on a user-defined dashboard) is stored.
download_chart_format jpeg Specifies the format in which adownloaded chart will be stored.May be jpeg or png.
continues on next page
16.1. PEM Server Configuration Parameters - Reference 210
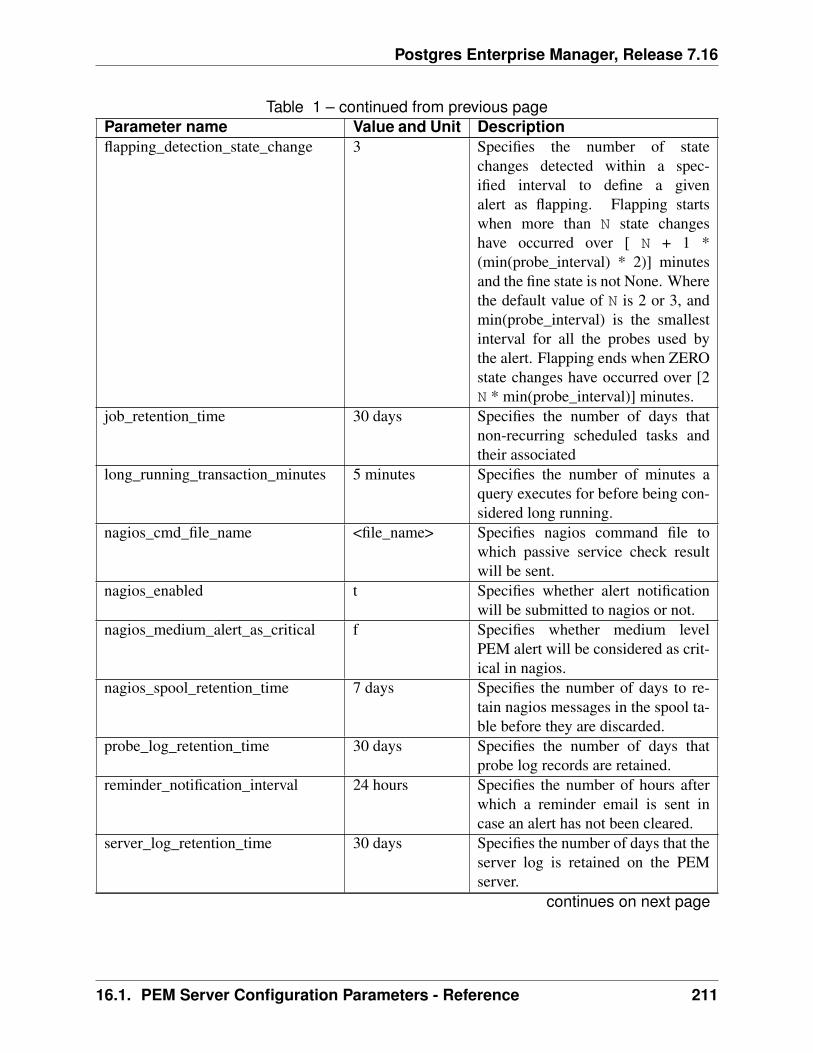
Postgres Enterprise Manager, Release 7.16
Table 1 – continued from previous pageParameter name Value and Unit Descriptionflapping_detection_state_change 3 Specifies the number of state
changes detected within a spec-ified interval to define a givenalert as flapping. Flapping startswhen more than N state changeshave occurred over [ N + 1 *(min(probe_interval) * 2)] minutesand the fine state is not None. Wherethe default value of N is 2 or 3, andmin(probe_interval) is the smallestinterval for all the probes used bythe alert. Flapping ends when ZEROstate changes have occurred over [2N * min(probe_interval)] minutes.
job_retention_time 30 days Specifies the number of days thatnon-recurring scheduled tasks andtheir associated
long_running_transaction_minutes 5 minutes Specifies the number of minutes aquery executes for before being con-sidered long running.
nagios_cmd_file_name <file_name> Specifies nagios command file towhich passive service check resultwill be sent.
nagios_enabled t Specifies whether alert notificationwill be submitted to nagios or not.
nagios_medium_alert_as_critical f Specifies whether medium levelPEM alert will be considered as crit-ical in nagios.
nagios_spool_retention_time 7 days Specifies the number of days to re-tain nagios messages in the spool ta-ble before they are discarded.
probe_log_retention_time 30 days Specifies the number of days thatprobe log records are retained.
reminder_notification_interval 24 hours Specifies the number of hours afterwhich a reminder email is sent incase an alert has not been cleared.
server_log_retention_time 30 days Specifies the number of days that theserver log is retained on the PEMserver.
continues on next page
16.1. PEM Server Configuration Parameters - Reference 211
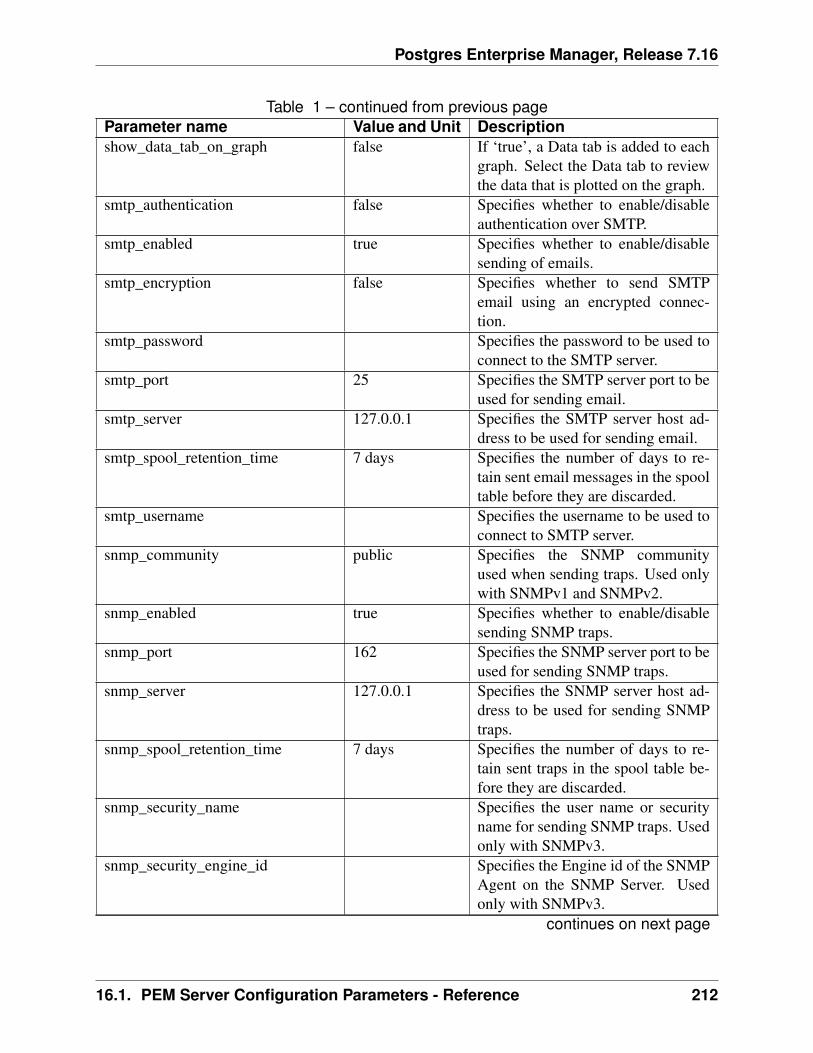
Postgres Enterprise Manager, Release 7.16
Table 1 – continued from previous pageParameter name Value and Unit Descriptionshow_data_tab_on_graph false If ‘true’, a Data tab is added to each
graph. Select the Data tab to reviewthe data that is plotted on the graph.
smtp_authentication false Specifies whether to enable/disableauthentication over SMTP.
smtp_enabled true Specifies whether to enable/disablesending of emails.
smtp_encryption false Specifies whether to send SMTPemail using an encrypted connec-tion.
smtp_password Specifies the password to be used toconnect to the SMTP server.
smtp_port 25 Specifies the SMTP server port to beused for sending email.
smtp_server 127.0.0.1 Specifies the SMTP server host ad-dress to be used for sending email.
smtp_spool_retention_time 7 days Specifies the number of days to re-tain sent email messages in the spooltable before they are discarded.
smtp_username Specifies the username to be used toconnect to SMTP server.
snmp_community public Specifies the SNMP communityused when sending traps. Used onlywith SNMPv1 and SNMPv2.
snmp_enabled true Specifies whether to enable/disablesending SNMP traps.
snmp_port 162 Specifies the SNMP server port to beused for sending SNMP traps.
snmp_server 127.0.0.1 Specifies the SNMP server host ad-dress to be used for sending SNMPtraps.
snmp_spool_retention_time 7 days Specifies the number of days to re-tain sent traps in the spool table be-fore they are discarded.
snmp_security_name Specifies the user name or securityname for sending SNMP traps. Usedonly with SNMPv3.
snmp_security_engine_id Specifies the Engine id of the SNMPAgent on the SNMP Server. Usedonly with SNMPv3.
continues on next page
16.1. PEM Server Configuration Parameters - Reference 212
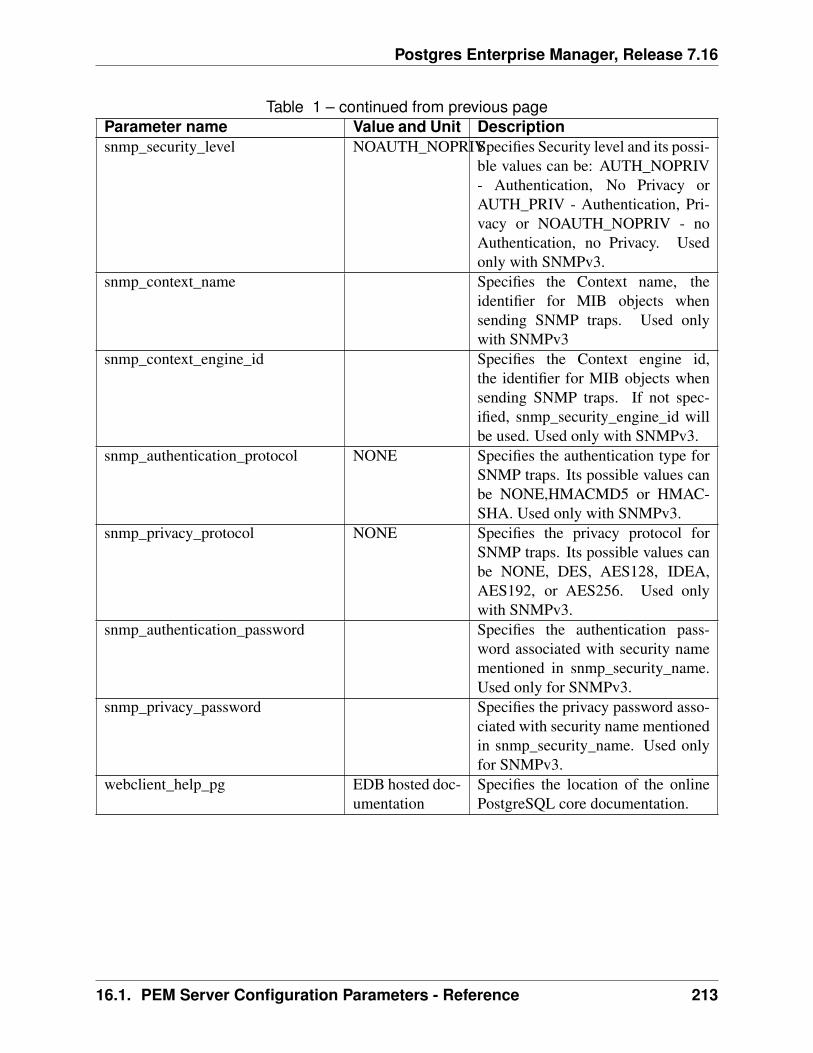
Postgres Enterprise Manager, Release 7.16
Table 1 – continued from previous pageParameter name Value and Unit Descriptionsnmp_security_level NOAUTH_NOPRIVSpecifies Security level and its possi-
ble values can be: AUTH_NOPRIV- Authentication, No Privacy orAUTH_PRIV - Authentication, Pri-vacy or NOAUTH_NOPRIV - noAuthentication, no Privacy. Usedonly with SNMPv3.
snmp_context_name Specifies the Context name, theidentifier for MIB objects whensending SNMP traps. Used onlywith SNMPv3
snmp_context_engine_id Specifies the Context engine id,the identifier for MIB objects whensending SNMP traps. If not spec-ified, snmp_security_engine_id willbe used. Used only with SNMPv3.
snmp_authentication_protocol NONE Specifies the authentication type forSNMP traps. Its possible values canbe NONE,HMACMD5 or HMAC-SHA. Used only with SNMPv3.
snmp_privacy_protocol NONE Specifies the privacy protocol forSNMP traps. Its possible values canbe NONE, DES, AES128, IDEA,AES192, or AES256. Used onlywith SNMPv3.
snmp_authentication_password Specifies the authentication pass-word associated with security namementioned in snmp_security_name.Used only for SNMPv3.
snmp_privacy_password Specifies the privacy password asso-ciated with security name mentionedin snmp_security_name. Used onlyfor SNMPv3.
webclient_help_pg EDB hosted doc-umentation
Specifies the location of the onlinePostgreSQL core documentation.
16.1. PEM Server Configuration Parameters - Reference 213
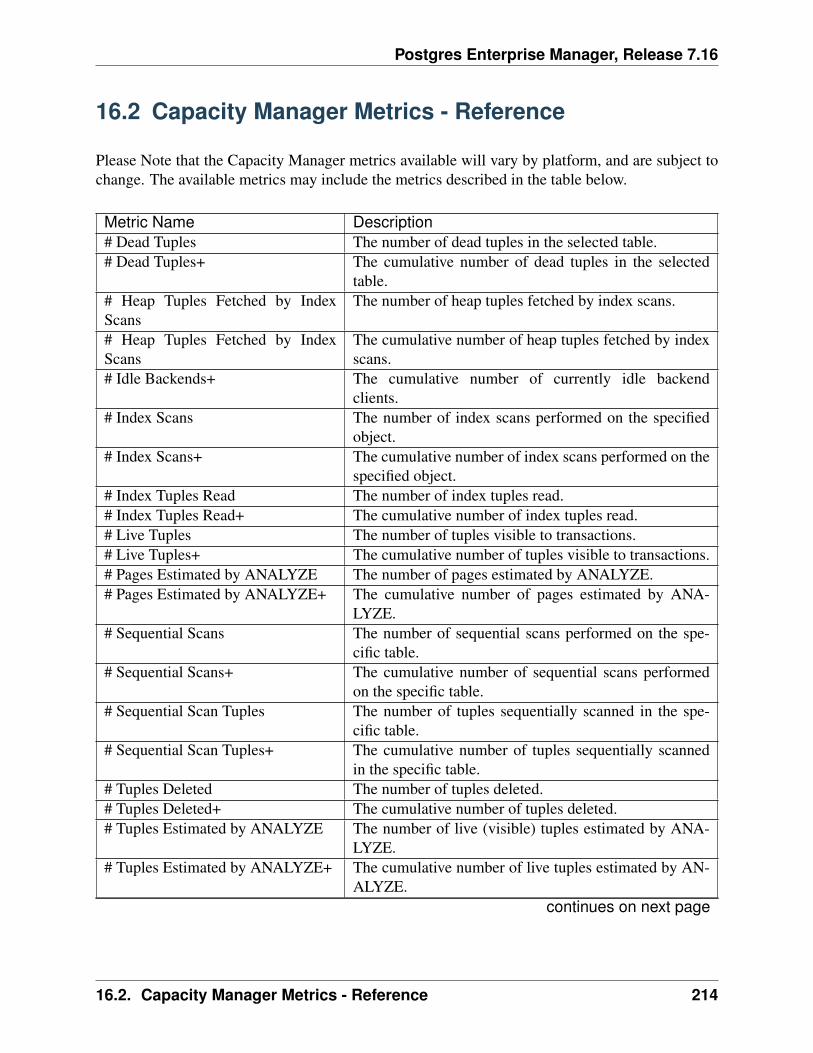
Postgres Enterprise Manager, Release 7.16
16.2 Capacity Manager Metrics - Reference
Please Note that the Capacity Manager metrics available will vary by platform, and are subject tochange. The available metrics may include the metrics described in the table below.
Metric Name Description# Dead Tuples The number of dead tuples in the selected table.# Dead Tuples+ The cumulative number of dead tuples in the selected
table.# Heap Tuples Fetched by IndexScans
The number of heap tuples fetched by index scans.
# Heap Tuples Fetched by IndexScans
The cumulative number of heap tuples fetched by indexscans.
# Idle Backends+ The cumulative number of currently idle backendclients.
# Index Scans The number of index scans performed on the specifiedobject.
# Index Scans+ The cumulative number of index scans performed on thespecified object.
# Index Tuples Read The number of index tuples read.# Index Tuples Read+ The cumulative number of index tuples read.# Live Tuples The number of tuples visible to transactions.# Live Tuples+ The cumulative number of tuples visible to transactions.# Pages Estimated by ANALYZE The number of pages estimated by ANALYZE.# Pages Estimated by ANALYZE+ The cumulative number of pages estimated by ANA-
LYZE.# Sequential Scans The number of sequential scans performed on the spe-
cific table.# Sequential Scans+ The cumulative number of sequential scans performed
on the specific table.# Sequential Scan Tuples The number of tuples sequentially scanned in the spe-
cific table.# Sequential Scan Tuples+ The cumulative number of tuples sequentially scanned
in the specific table.# Tuples Deleted The number of tuples deleted.# Tuples Deleted+ The cumulative number of tuples deleted.# Tuples Estimated by ANALYZE The number of live (visible) tuples estimated by ANA-
LYZE.# Tuples Estimated by ANALYZE+ The cumulative number of live tuples estimated by AN-
ALYZE.continues on next page
16.2. Capacity Manager Metrics - Reference 214
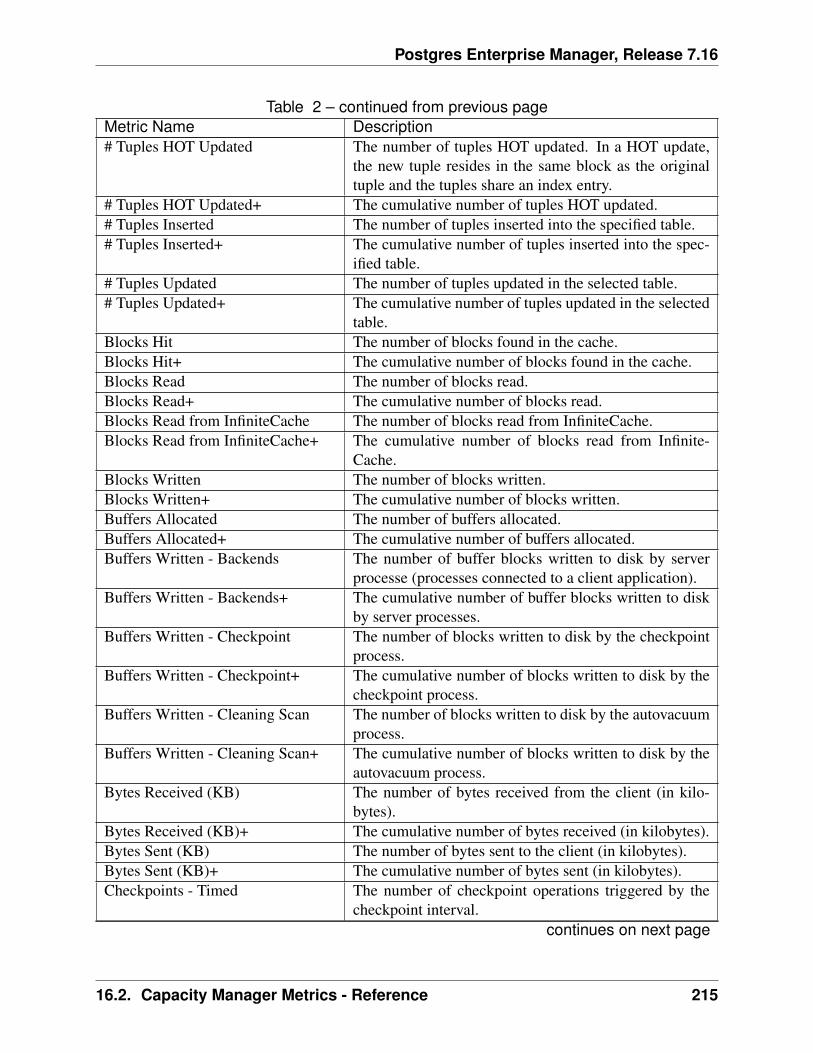
Postgres Enterprise Manager, Release 7.16
Table 2 – continued from previous pageMetric Name Description# Tuples HOT Updated The number of tuples HOT updated. In a HOT update,
the new tuple resides in the same block as the originaltuple and the tuples share an index entry.
# Tuples HOT Updated+ The cumulative number of tuples HOT updated.# Tuples Inserted The number of tuples inserted into the specified table.# Tuples Inserted+ The cumulative number of tuples inserted into the spec-
ified table.# Tuples Updated The number of tuples updated in the selected table.# Tuples Updated+ The cumulative number of tuples updated in the selected
table.Blocks Hit The number of blocks found in the cache.Blocks Hit+ The cumulative number of blocks found in the cache.Blocks Read The number of blocks read.Blocks Read+ The cumulative number of blocks read.Blocks Read from InfiniteCache The number of blocks read from InfiniteCache.Blocks Read from InfiniteCache+ The cumulative number of blocks read from Infinite-
Cache.Blocks Written The number of blocks written.Blocks Written+ The cumulative number of blocks written.Buffers Allocated The number of buffers allocated.Buffers Allocated+ The cumulative number of buffers allocated.Buffers Written - Backends The number of buffer blocks written to disk by server
processe (processes connected to a client application).Buffers Written - Backends+ The cumulative number of buffer blocks written to disk
by server processes.Buffers Written - Checkpoint The number of blocks written to disk by the checkpoint
process.Buffers Written - Checkpoint+ The cumulative number of blocks written to disk by the
checkpoint process.Buffers Written - Cleaning Scan The number of blocks written to disk by the autovacuum
process.Buffers Written - Cleaning Scan+ The cumulative number of blocks written to disk by the
autovacuum process.Bytes Received (KB) The number of bytes received from the client (in kilo-
bytes).Bytes Received (KB)+ The cumulative number of bytes received (in kilobytes).Bytes Sent (KB) The number of bytes sent to the client (in kilobytes).Bytes Sent (KB)+ The cumulative number of bytes sent (in kilobytes).Checkpoints - Timed The number of checkpoint operations triggered by the
checkpoint interval.continues on next page
16.2. Capacity Manager Metrics - Reference 215
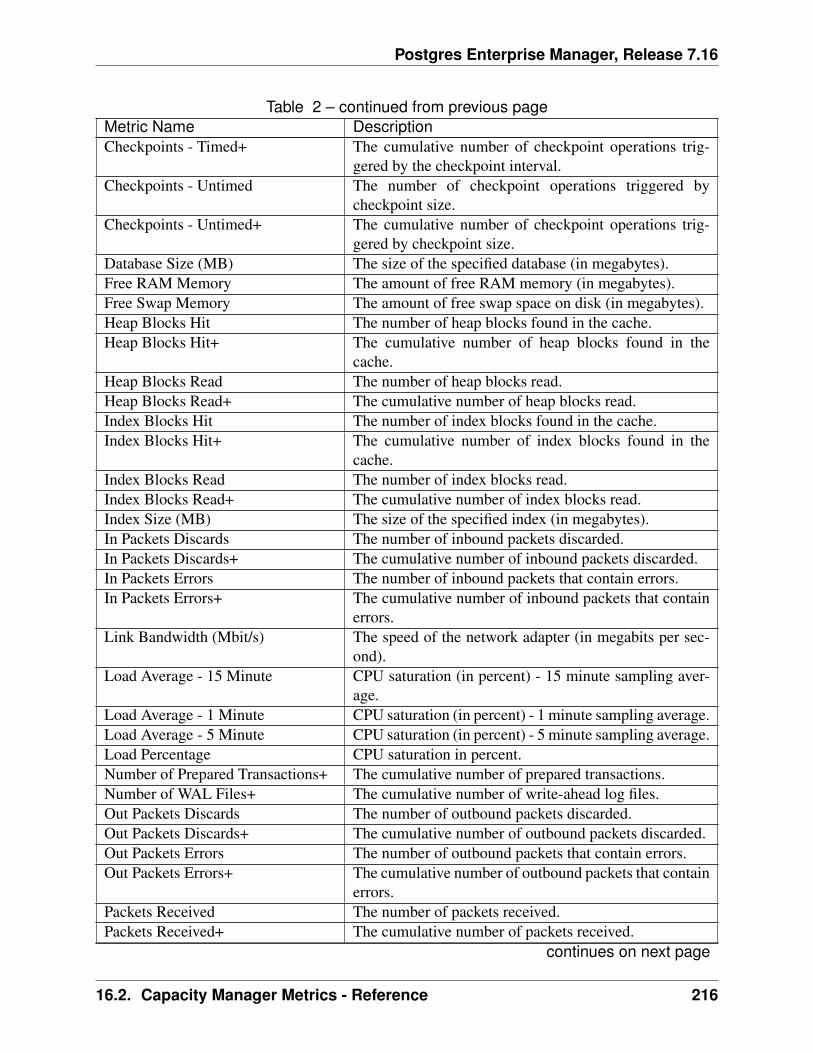
Postgres Enterprise Manager, Release 7.16
Table 2 – continued from previous pageMetric Name DescriptionCheckpoints - Timed+ The cumulative number of checkpoint operations trig-
gered by the checkpoint interval.Checkpoints - Untimed The number of checkpoint operations triggered by
checkpoint size.Checkpoints - Untimed+ The cumulative number of checkpoint operations trig-
gered by checkpoint size.Database Size (MB) The size of the specified database (in megabytes).Free RAM Memory The amount of free RAM memory (in megabytes).Free Swap Memory The amount of free swap space on disk (in megabytes).Heap Blocks Hit The number of heap blocks found in the cache.Heap Blocks Hit+ The cumulative number of heap blocks found in the
cache.Heap Blocks Read The number of heap blocks read.Heap Blocks Read+ The cumulative number of heap blocks read.Index Blocks Hit The number of index blocks found in the cache.Index Blocks Hit+ The cumulative number of index blocks found in the
cache.Index Blocks Read The number of index blocks read.Index Blocks Read+ The cumulative number of index blocks read.Index Size (MB) The size of the specified index (in megabytes).In Packets Discards The number of inbound packets discarded.In Packets Discards+ The cumulative number of inbound packets discarded.In Packets Errors The number of inbound packets that contain errors.In Packets Errors+ The cumulative number of inbound packets that contain
errors.Link Bandwidth (Mbit/s) The speed of the network adapter (in megabits per sec-
ond).Load Average - 15 Minute CPU saturation (in percent) - 15 minute sampling aver-
age.Load Average - 1 Minute CPU saturation (in percent) - 1 minute sampling average.Load Average - 5 Minute CPU saturation (in percent) - 5 minute sampling average.Load Percentage CPU saturation in percent.Number of Prepared Transactions+ The cumulative number of prepared transactions.Number of WAL Files+ The cumulative number of write-ahead log files.Out Packets Discards The number of outbound packets discarded.Out Packets Discards+ The cumulative number of outbound packets discarded.Out Packets Errors The number of outbound packets that contain errors.Out Packets Errors+ The cumulative number of outbound packets that contain
errors.Packets Received The number of packets received.Packets Received+ The cumulative number of packets received.
continues on next page
16.2. Capacity Manager Metrics - Reference 216
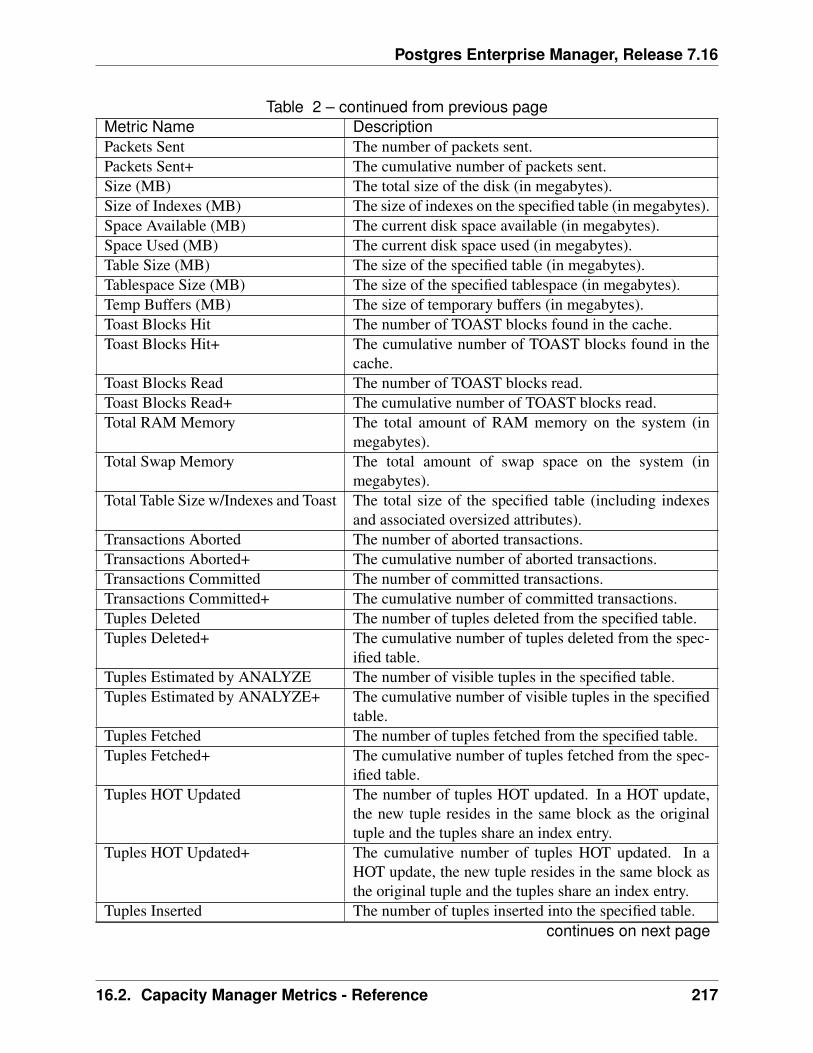
Postgres Enterprise Manager, Release 7.16
Table 2 – continued from previous pageMetric Name DescriptionPackets Sent The number of packets sent.Packets Sent+ The cumulative number of packets sent.Size (MB) The total size of the disk (in megabytes).Size of Indexes (MB) The size of indexes on the specified table (in megabytes).Space Available (MB) The current disk space available (in megabytes).Space Used (MB) The current disk space used (in megabytes).Table Size (MB) The size of the specified table (in megabytes).Tablespace Size (MB) The size of the specified tablespace (in megabytes).Temp Buffers (MB) The size of temporary buffers (in megabytes).Toast Blocks Hit The number of TOAST blocks found in the cache.Toast Blocks Hit+ The cumulative number of TOAST blocks found in the
cache.Toast Blocks Read The number of TOAST blocks read.Toast Blocks Read+ The cumulative number of TOAST blocks read.Total RAM Memory The total amount of RAM memory on the system (in
megabytes).Total Swap Memory The total amount of swap space on the system (in
megabytes).Total Table Size w/Indexes and Toast The total size of the specified table (including indexes
and associated oversized attributes).Transactions Aborted The number of aborted transactions.Transactions Aborted+ The cumulative number of aborted transactions.Transactions Committed The number of committed transactions.Transactions Committed+ The cumulative number of committed transactions.Tuples Deleted The number of tuples deleted from the specified table.Tuples Deleted+ The cumulative number of tuples deleted from the spec-
ified table.Tuples Estimated by ANALYZE The number of visible tuples in the specified table.Tuples Estimated by ANALYZE+ The cumulative number of visible tuples in the specified
table.Tuples Fetched The number of tuples fetched from the specified table.Tuples Fetched+ The cumulative number of tuples fetched from the spec-
ified table.Tuples HOT Updated The number of tuples HOT updated. In a HOT update,
the new tuple resides in the same block as the originaltuple and the tuples share an index entry.
Tuples HOT Updated+ The cumulative number of tuples HOT updated. In aHOT update, the new tuple resides in the same block asthe original tuple and the tuples share an index entry.
Tuples Inserted The number of tuples inserted into the specified table.continues on next page
16.2. Capacity Manager Metrics - Reference 217
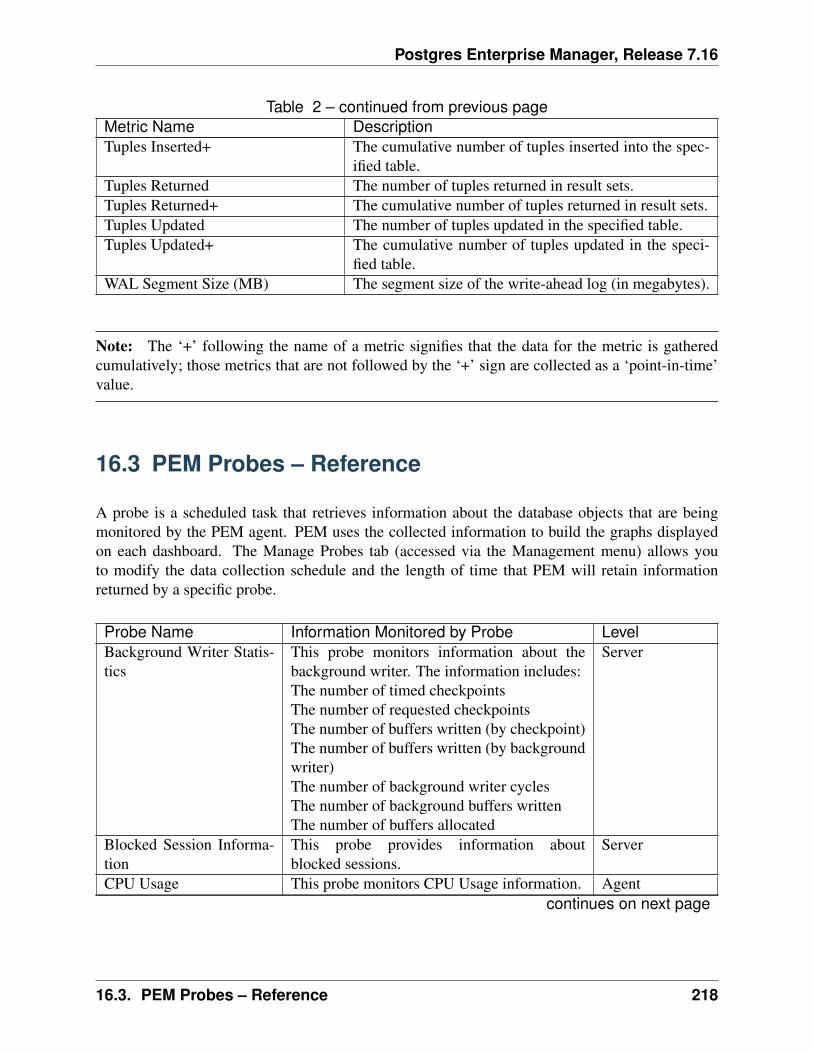
Postgres Enterprise Manager, Release 7.16
Table 2 – continued from previous pageMetric Name DescriptionTuples Inserted+ The cumulative number of tuples inserted into the spec-
ified table.Tuples Returned The number of tuples returned in result sets.Tuples Returned+ The cumulative number of tuples returned in result sets.Tuples Updated The number of tuples updated in the specified table.Tuples Updated+ The cumulative number of tuples updated in the speci-
fied table.WAL Segment Size (MB) The segment size of the write-ahead log (in megabytes).
Note: The ‘+’ following the name of a metric signifies that the data for the metric is gatheredcumulatively; those metrics that are not followed by the ‘+’ sign are collected as a ‘point-in-time’value.
16.3 PEM Probes – Reference
A probe is a scheduled task that retrieves information about the database objects that are beingmonitored by the PEM agent. PEM uses the collected information to build the graphs displayedon each dashboard. The Manage Probes tab (accessed via the Management menu) allows youto modify the data collection schedule and the length of time that PEM will retain informationreturned by a specific probe.
Probe Name Information Monitored by Probe LevelBackground Writer Statis-tics
This probe monitors information about thebackground writer. The information includes:The number of timed checkpointsThe number of requested checkpointsThe number of buffers written (by checkpoint)The number of buffers written (by backgroundwriter)The number of background writer cyclesThe number of background buffers writtenThe number of buffers allocated
Server
Blocked Session Informa-tion
This probe provides information aboutblocked sessions.
Server
CPU Usage This probe monitors CPU Usage information. Agentcontinues on next page
16.3. PEM Probes – Reference 218
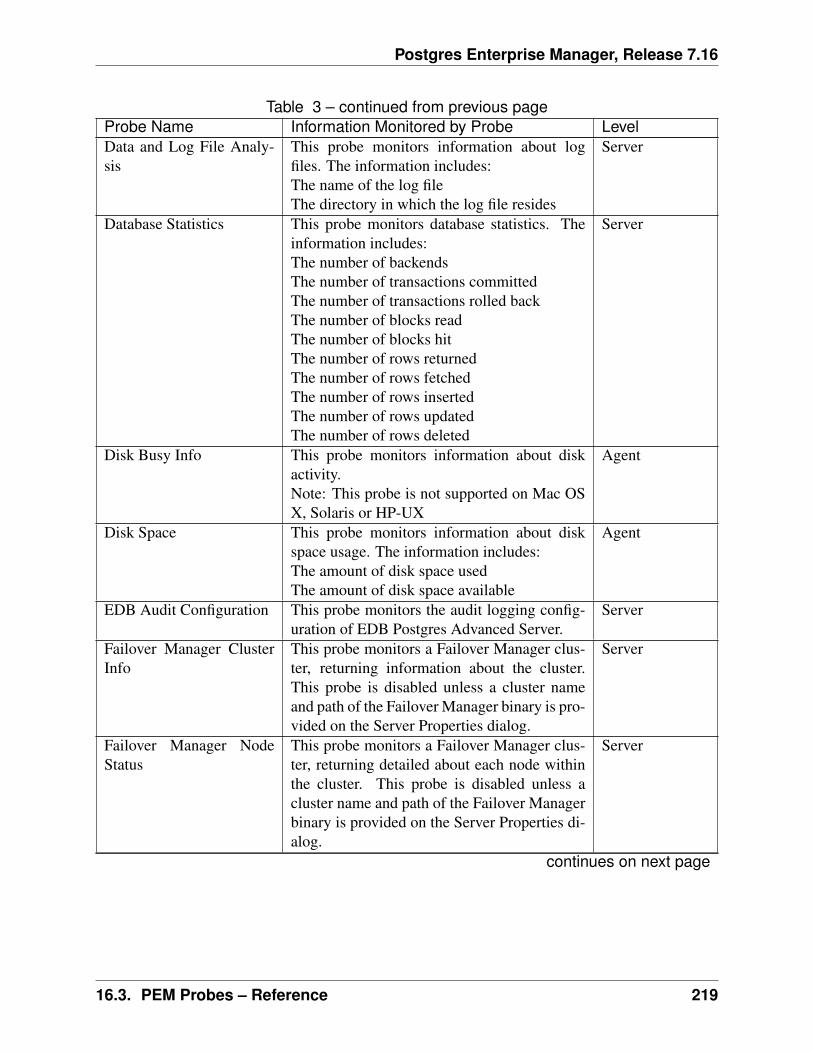
Postgres Enterprise Manager, Release 7.16
Table 3 – continued from previous pageProbe Name Information Monitored by Probe LevelData and Log File Analy-sis
This probe monitors information about logfiles. The information includes:The name of the log fileThe directory in which the log file resides
Server
Database Statistics This probe monitors database statistics. Theinformation includes:The number of backendsThe number of transactions committedThe number of transactions rolled backThe number of blocks readThe number of blocks hitThe number of rows returnedThe number of rows fetchedThe number of rows insertedThe number of rows updatedThe number of rows deleted
Server
Disk Busy Info This probe monitors information about diskactivity.Note: This probe is not supported on Mac OSX, Solaris or HP-UX
Agent
Disk Space This probe monitors information about diskspace usage. The information includes:The amount of disk space usedThe amount of disk space available
Agent
EDB Audit Configuration This probe monitors the audit logging config-uration of EDB Postgres Advanced Server.
Server
Failover Manager ClusterInfo
This probe monitors a Failover Manager clus-ter, returning information about the cluster.This probe is disabled unless a cluster nameand path of the Failover Manager binary is pro-vided on the Server Properties dialog.
Server
Failover Manager NodeStatus
This probe monitors a Failover Manager clus-ter, returning detailed about each node withinthe cluster. This probe is disabled unless acluster name and path of the Failover Managerbinary is provided on the Server Properties di-alog.
Server
continues on next page
16.3. PEM Probes – Reference 219
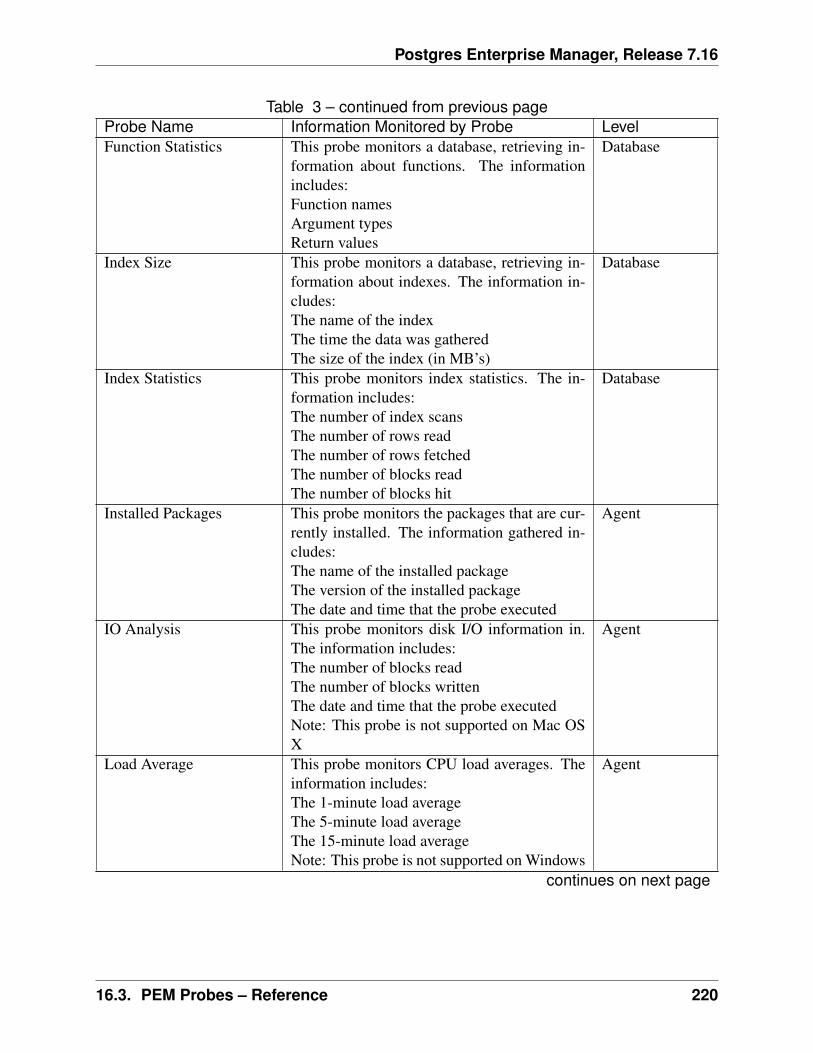
Postgres Enterprise Manager, Release 7.16
Table 3 – continued from previous pageProbe Name Information Monitored by Probe LevelFunction Statistics This probe monitors a database, retrieving in-
formation about functions. The informationincludes:Function namesArgument typesReturn values
Database
Index Size This probe monitors a database, retrieving in-formation about indexes. The information in-cludes:The name of the indexThe time the data was gatheredThe size of the index (in MB’s)
Database
Index Statistics This probe monitors index statistics. The in-formation includes:The number of index scansThe number of rows readThe number of rows fetchedThe number of blocks readThe number of blocks hit
Database
Installed Packages This probe monitors the packages that are cur-rently installed. The information gathered in-cludes:The name of the installed packageThe version of the installed packageThe date and time that the probe executed
Agent
IO Analysis This probe monitors disk I/O information in.The information includes:The number of blocks readThe number of blocks writtenThe date and time that the probe executedNote: This probe is not supported on Mac OSX
Agent
Load Average This probe monitors CPU load averages. Theinformation includes:The 1-minute load averageThe 5-minute load averageThe 15-minute load averageNote: This probe is not supported on Windows
Agent
continues on next page
16.3. PEM Probes – Reference 220
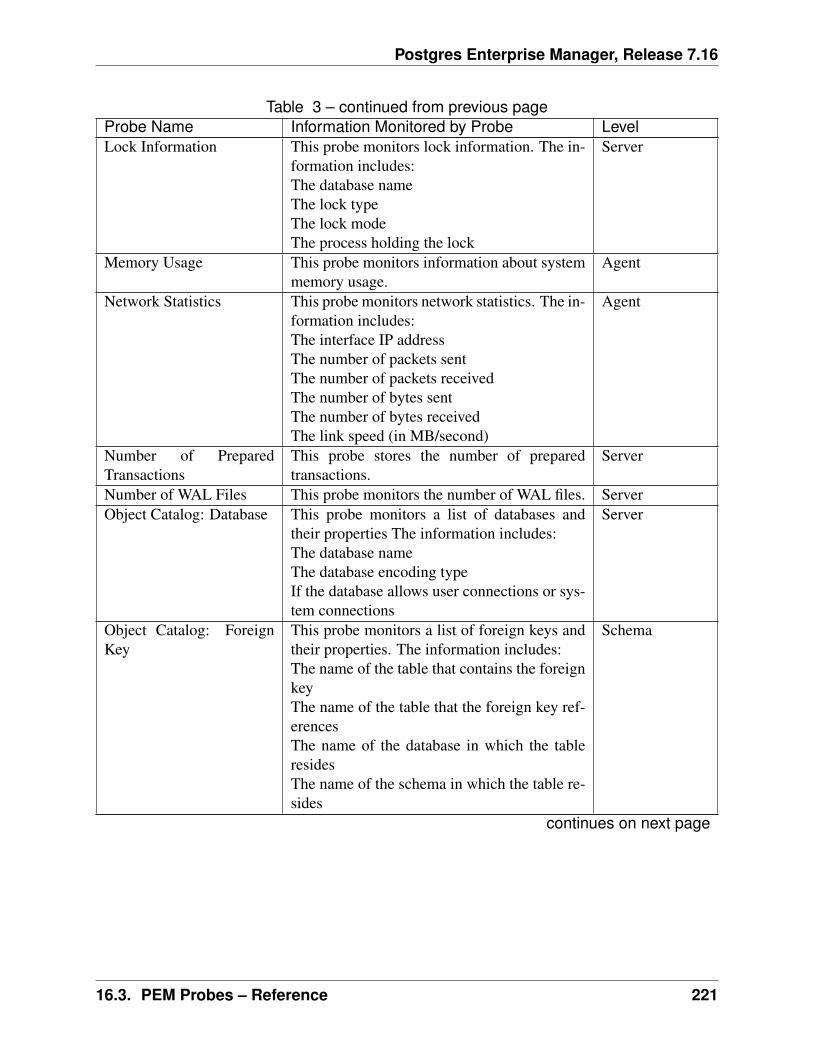
Postgres Enterprise Manager, Release 7.16
Table 3 – continued from previous pageProbe Name Information Monitored by Probe LevelLock Information This probe monitors lock information. The in-
formation includes:The database nameThe lock typeThe lock modeThe process holding the lock
Server
Memory Usage This probe monitors information about systemmemory usage.
Agent
Network Statistics This probe monitors network statistics. The in-formation includes:The interface IP addressThe number of packets sentThe number of packets receivedThe number of bytes sentThe number of bytes receivedThe link speed (in MB/second)
Agent
Number of PreparedTransactions
This probe stores the number of preparedtransactions.
Server
Number of WAL Files This probe monitors the number of WAL files. ServerObject Catalog: Database This probe monitors a list of databases and
their properties The information includes:The database nameThe database encoding typeIf the database allows user connections or sys-tem connections
Server
Object Catalog: ForeignKey
This probe monitors a list of foreign keys andtheir properties. The information includes:The name of the table that contains the foreignkeyThe name of the table that the foreign key ref-erencesThe name of the database in which the tableresidesThe name of the schema in which the table re-sides
Schema
continues on next page
16.3. PEM Probes – Reference 221
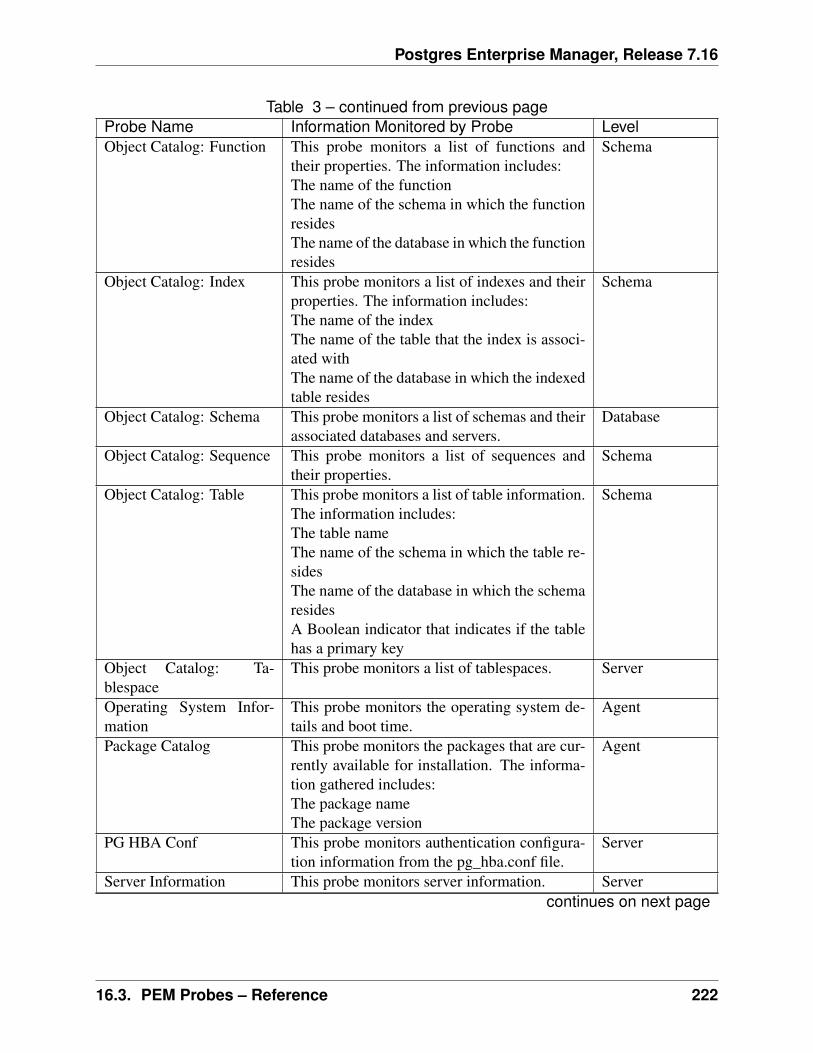
Postgres Enterprise Manager, Release 7.16
Table 3 – continued from previous pageProbe Name Information Monitored by Probe LevelObject Catalog: Function This probe monitors a list of functions and
their properties. The information includes:The name of the functionThe name of the schema in which the functionresidesThe name of the database in which the functionresides
Schema
Object Catalog: Index This probe monitors a list of indexes and theirproperties. The information includes:The name of the indexThe name of the table that the index is associ-ated withThe name of the database in which the indexedtable resides
Schema
Object Catalog: Schema This probe monitors a list of schemas and theirassociated databases and servers.
Database
Object Catalog: Sequence This probe monitors a list of sequences andtheir properties.
Schema
Object Catalog: Table This probe monitors a list of table information.The information includes:The table nameThe name of the schema in which the table re-sidesThe name of the database in which the schemaresidesA Boolean indicator that indicates if the tablehas a primary key
Schema
Object Catalog: Ta-blespace
This probe monitors a list of tablespaces. Server
Operating System Infor-mation
This probe monitors the operating system de-tails and boot time.
Agent
Package Catalog This probe monitors the packages that are cur-rently available for installation. The informa-tion gathered includes:The package nameThe package version
Agent
PG HBA Conf This probe monitors authentication configura-tion information from the pg_hba.conf file.
Server
Server Information This probe monitors server information. Servercontinues on next page
16.3. PEM Probes – Reference 222
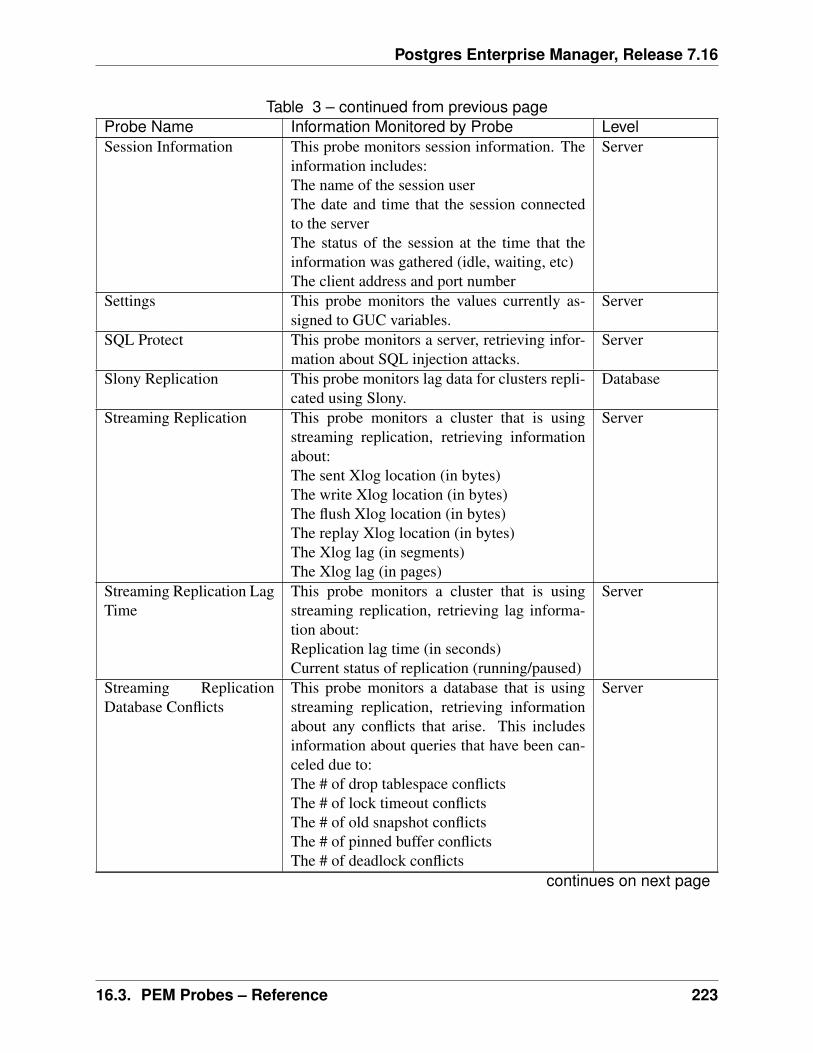
Postgres Enterprise Manager, Release 7.16
Table 3 – continued from previous pageProbe Name Information Monitored by Probe LevelSession Information This probe monitors session information. The
information includes:The name of the session userThe date and time that the session connectedto the serverThe status of the session at the time that theinformation was gathered (idle, waiting, etc)The client address and port number
Server
Settings This probe monitors the values currently as-signed to GUC variables.
Server
SQL Protect This probe monitors a server, retrieving infor-mation about SQL injection attacks.
Server
Slony Replication This probe monitors lag data for clusters repli-cated using Slony.
Database
Streaming Replication This probe monitors a cluster that is usingstreaming replication, retrieving informationabout:The sent Xlog location (in bytes)The write Xlog location (in bytes)The flush Xlog location (in bytes)The replay Xlog location (in bytes)The Xlog lag (in segments)The Xlog lag (in pages)
Server
Streaming Replication LagTime
This probe monitors a cluster that is usingstreaming replication, retrieving lag informa-tion about:Replication lag time (in seconds)Current status of replication (running/paused)
Server
Streaming ReplicationDatabase Conflicts
This probe monitors a database that is usingstreaming replication, retrieving informationabout any conflicts that arise. This includesinformation about queries that have been can-celed due to:The # of drop tablespace conflictsThe # of lock timeout conflictsThe # of old snapshot conflictsThe # of pinned buffer conflictsThe # of deadlock conflicts
Server
continues on next page
16.3. PEM Probes – Reference 223
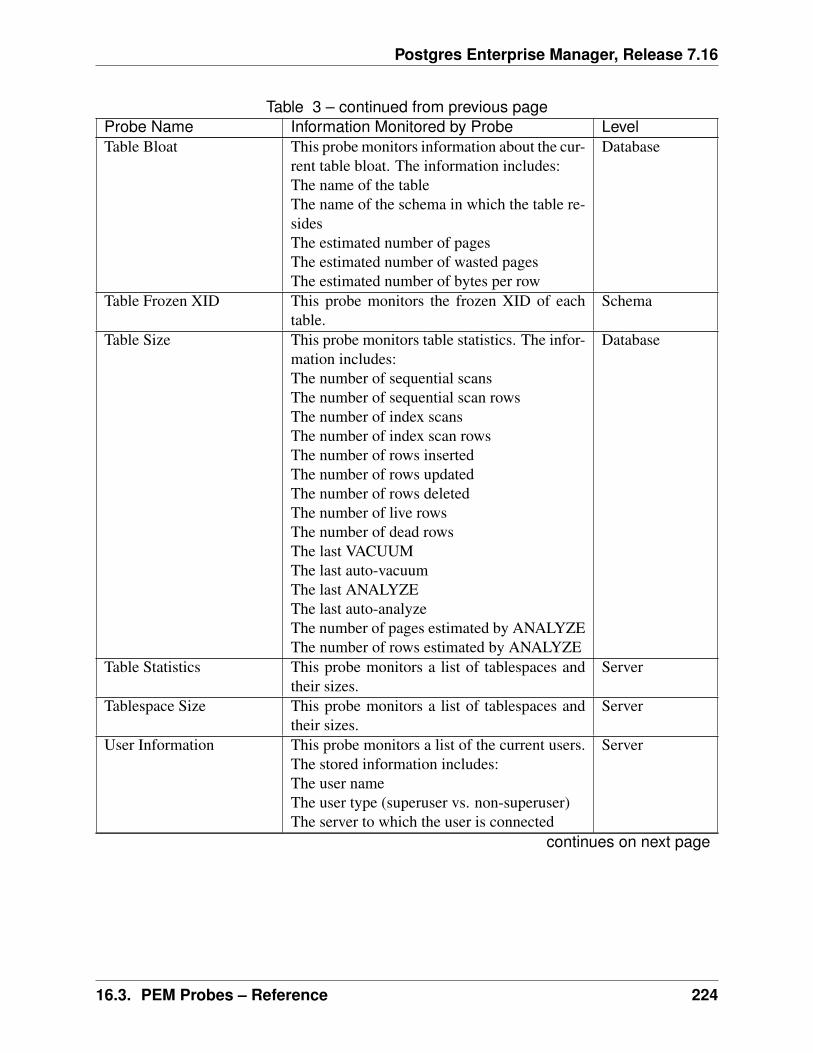
Postgres Enterprise Manager, Release 7.16
Table 3 – continued from previous pageProbe Name Information Monitored by Probe LevelTable Bloat This probe monitors information about the cur-
rent table bloat. The information includes:The name of the tableThe name of the schema in which the table re-sidesThe estimated number of pagesThe estimated number of wasted pagesThe estimated number of bytes per row
Database
Table Frozen XID This probe monitors the frozen XID of eachtable.
Schema
Table Size This probe monitors table statistics. The infor-mation includes:The number of sequential scansThe number of sequential scan rowsThe number of index scansThe number of index scan rowsThe number of rows insertedThe number of rows updatedThe number of rows deletedThe number of live rowsThe number of dead rowsThe last VACUUMThe last auto-vacuumThe last ANALYZEThe last auto-analyzeThe number of pages estimated by ANALYZEThe number of rows estimated by ANALYZE
Database
Table Statistics This probe monitors a list of tablespaces andtheir sizes.
Server
Tablespace Size This probe monitors a list of tablespaces andtheir sizes.
Server
User Information This probe monitors a list of the current users.The stored information includes:The user nameThe user type (superuser vs. non-superuser)The server to which the user is connected
Server
continues on next page
16.3. PEM Probes – Reference 224
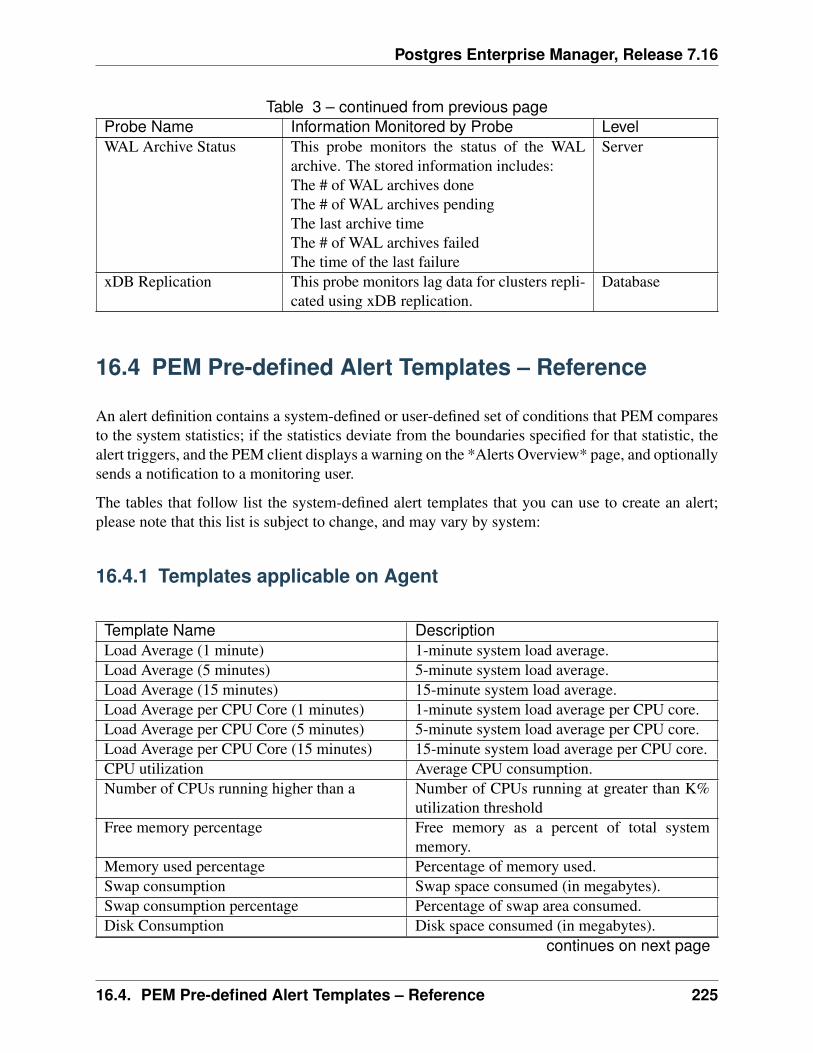
Postgres Enterprise Manager, Release 7.16
Table 3 – continued from previous pageProbe Name Information Monitored by Probe LevelWAL Archive Status This probe monitors the status of the WAL
archive. The stored information includes:The # of WAL archives doneThe # of WAL archives pendingThe last archive timeThe # of WAL archives failedThe time of the last failure
Server
xDB Replication This probe monitors lag data for clusters repli-cated using xDB replication.
Database
16.4 PEM Pre-defined Alert Templates – Reference
An alert definition contains a system-defined or user-defined set of conditions that PEM comparesto the system statistics; if the statistics deviate from the boundaries specified for that statistic, thealert triggers, and the PEM client displays a warning on the *Alerts Overview* page, and optionallysends a notification to a monitoring user.
The tables that follow list the system-defined alert templates that you can use to create an alert;please note that this list is subject to change, and may vary by system:
16.4.1 Templates applicable on Agent
Template Name DescriptionLoad Average (1 minute) 1-minute system load average.Load Average (5 minutes) 5-minute system load average.Load Average (15 minutes) 15-minute system load average.Load Average per CPU Core (1 minutes) 1-minute system load average per CPU core.Load Average per CPU Core (5 minutes) 5-minute system load average per CPU core.Load Average per CPU Core (15 minutes) 15-minute system load average per CPU core.CPU utilization Average CPU consumption.Number of CPUs running higher than a Number of CPUs running at greater than K%
utilization thresholdFree memory percentage Free memory as a percent of total system
memory.Memory used percentage Percentage of memory used.Swap consumption Swap space consumed (in megabytes).Swap consumption percentage Percentage of swap area consumed.Disk Consumption Disk space consumed (in megabytes).
continues on next page
16.4. PEM Pre-defined Alert Templates – Reference 225
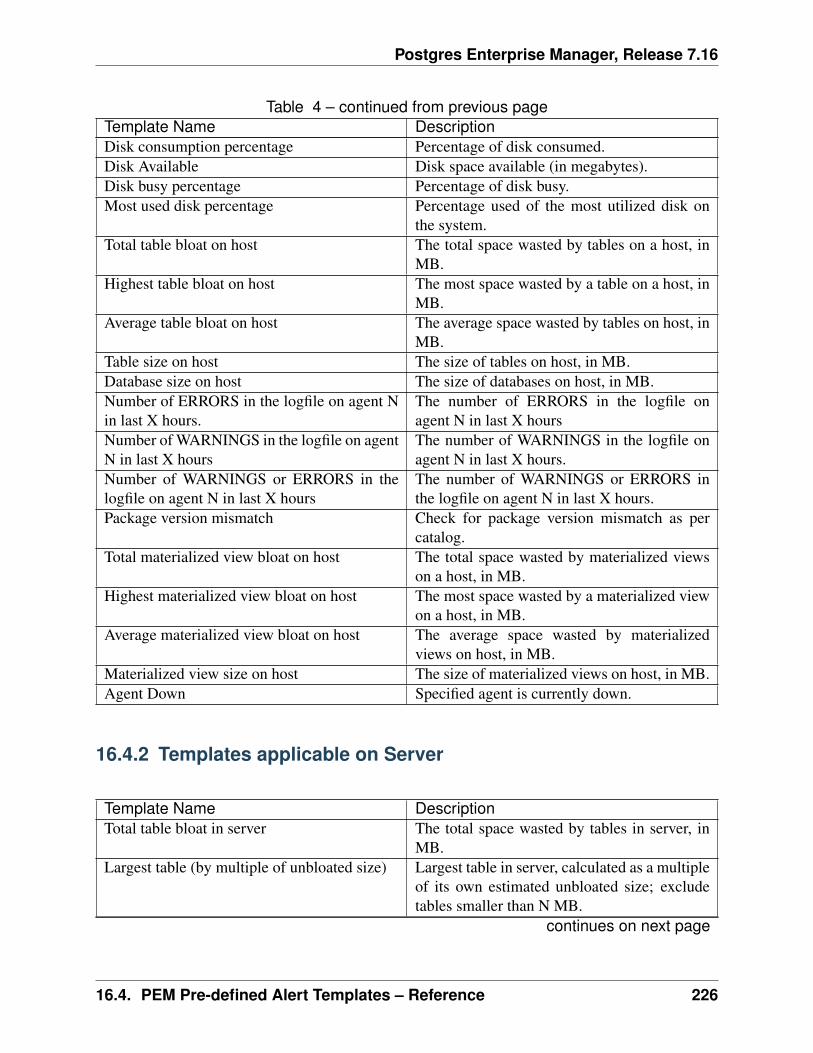
Postgres Enterprise Manager, Release 7.16
Table 4 – continued from previous pageTemplate Name DescriptionDisk consumption percentage Percentage of disk consumed.Disk Available Disk space available (in megabytes).Disk busy percentage Percentage of disk busy.Most used disk percentage Percentage used of the most utilized disk on
the system.Total table bloat on host The total space wasted by tables on a host, in
MB.Highest table bloat on host The most space wasted by a table on a host, in
MB.Average table bloat on host The average space wasted by tables on host, in
MB.Table size on host The size of tables on host, in MB.Database size on host The size of databases on host, in MB.Number of ERRORS in the logfile on agent Nin last X hours.
The number of ERRORS in the logfile onagent N in last X hours
Number of WARNINGS in the logfile on agentN in last X hours
The number of WARNINGS in the logfile onagent N in last X hours.
Number of WARNINGS or ERRORS in thelogfile on agent N in last X hours
The number of WARNINGS or ERRORS inthe logfile on agent N in last X hours.
Package version mismatch Check for package version mismatch as percatalog.
Total materialized view bloat on host The total space wasted by materialized viewson a host, in MB.
Highest materialized view bloat on host The most space wasted by a materialized viewon a host, in MB.
Average materialized view bloat on host The average space wasted by materializedviews on host, in MB.
Materialized view size on host The size of materialized views on host, in MB.Agent Down Specified agent is currently down.
16.4.2 Templates applicable on Server
Template Name DescriptionTotal table bloat in server The total space wasted by tables in server, in
MB.Largest table (by multiple of unbloated size) Largest table in server, calculated as a multiple
of its own estimated unbloated size; excludetables smaller than N MB.
continues on next page
16.4. PEM Pre-defined Alert Templates – Reference 226
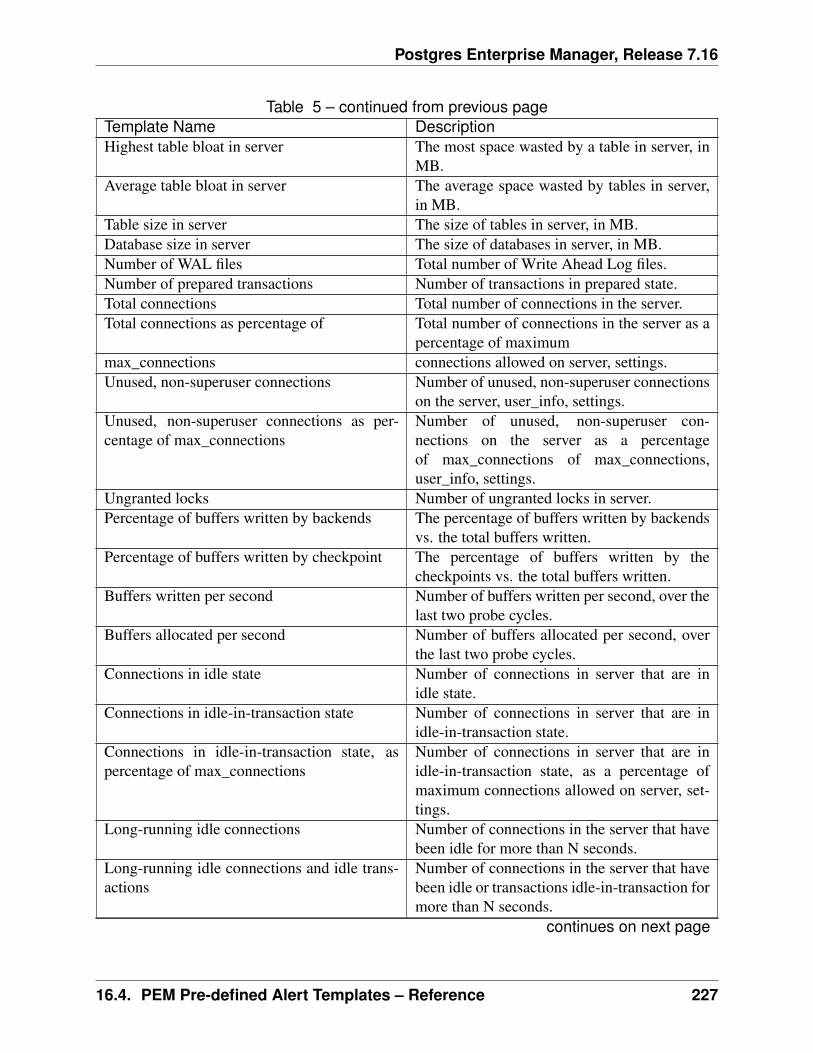
Postgres Enterprise Manager, Release 7.16
Table 5 – continued from previous pageTemplate Name DescriptionHighest table bloat in server The most space wasted by a table in server, in
MB.Average table bloat in server The average space wasted by tables in server,
in MB.Table size in server The size of tables in server, in MB.Database size in server The size of databases in server, in MB.Number of WAL files Total number of Write Ahead Log files.Number of prepared transactions Number of transactions in prepared state.Total connections Total number of connections in the server.Total connections as percentage of Total number of connections in the server as a
percentage of maximummax_connections connections allowed on server, settings.Unused, non-superuser connections Number of unused, non-superuser connections
on the server, user_info, settings.Unused, non-superuser connections as per-centage of max_connections
Number of unused, non-superuser con-nections on the server as a percentageof max_connections of max_connections,user_info, settings.
Ungranted locks Number of ungranted locks in server.Percentage of buffers written by backends The percentage of buffers written by backends
vs. the total buffers written.Percentage of buffers written by checkpoint The percentage of buffers written by the
checkpoints vs. the total buffers written.Buffers written per second Number of buffers written per second, over the
last two probe cycles.Buffers allocated per second Number of buffers allocated per second, over
the last two probe cycles.Connections in idle state Number of connections in server that are in
idle state.Connections in idle-in-transaction state Number of connections in server that are in
idle-in-transaction state.Connections in idle-in-transaction state, aspercentage of max_connections
Number of connections in server that are inidle-in-transaction state, as a percentage ofmaximum connections allowed on server, set-tings.
Long-running idle connections Number of connections in the server that havebeen idle for more than N seconds.
Long-running idle connections and idle trans-actions
Number of connections in the server that havebeen idle or transactions idle-in-transaction formore than N seconds.
continues on next page
16.4. PEM Pre-defined Alert Templates – Reference 227
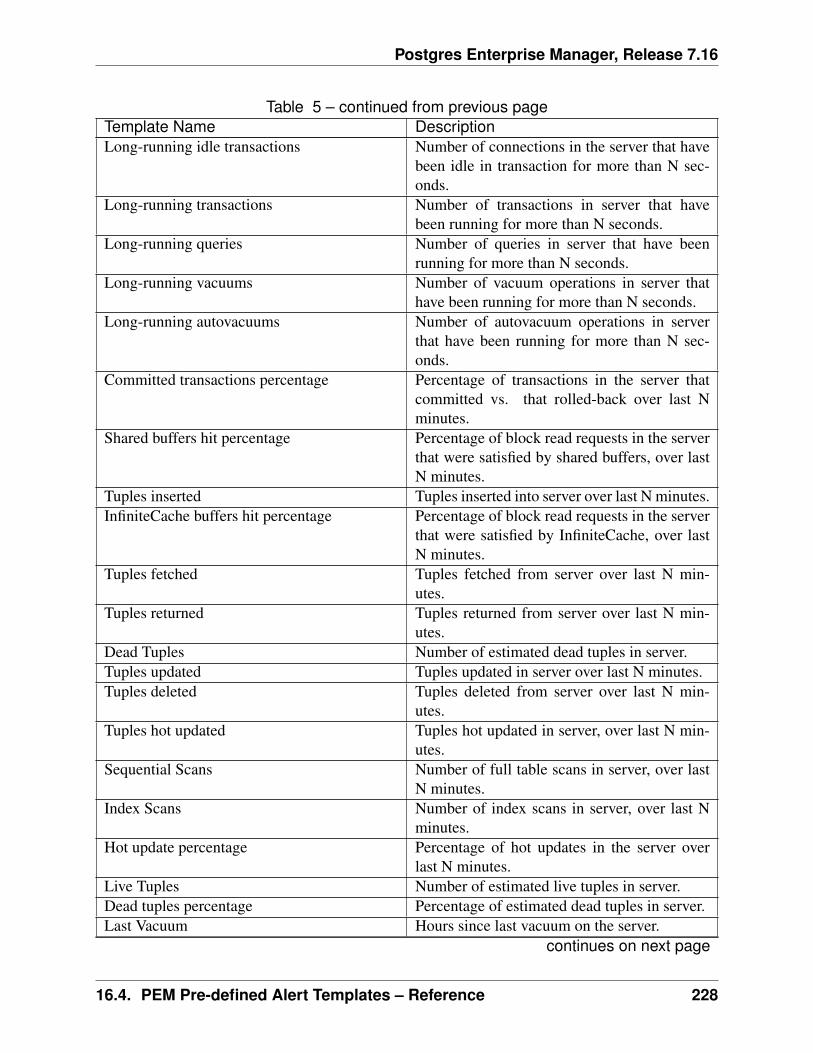
Postgres Enterprise Manager, Release 7.16
Table 5 – continued from previous pageTemplate Name DescriptionLong-running idle transactions Number of connections in the server that have
been idle in transaction for more than N sec-onds.
Long-running transactions Number of transactions in server that havebeen running for more than N seconds.
Long-running queries Number of queries in server that have beenrunning for more than N seconds.
Long-running vacuums Number of vacuum operations in server thathave been running for more than N seconds.
Long-running autovacuums Number of autovacuum operations in serverthat have been running for more than N sec-onds.
Committed transactions percentage Percentage of transactions in the server thatcommitted vs. that rolled-back over last Nminutes.
Shared buffers hit percentage Percentage of block read requests in the serverthat were satisfied by shared buffers, over lastN minutes.
Tuples inserted Tuples inserted into server over last N minutes.InfiniteCache buffers hit percentage Percentage of block read requests in the server
that were satisfied by InfiniteCache, over lastN minutes.
Tuples fetched Tuples fetched from server over last N min-utes.
Tuples returned Tuples returned from server over last N min-utes.
Dead Tuples Number of estimated dead tuples in server.Tuples updated Tuples updated in server over last N minutes.Tuples deleted Tuples deleted from server over last N min-
utes.Tuples hot updated Tuples hot updated in server, over last N min-
utes.Sequential Scans Number of full table scans in server, over last
N minutes.Index Scans Number of index scans in server, over last N
minutes.Hot update percentage Percentage of hot updates in the server over
last N minutes.Live Tuples Number of estimated live tuples in server.Dead tuples percentage Percentage of estimated dead tuples in server.Last Vacuum Hours since last vacuum on the server.
continues on next page
16.4. PEM Pre-defined Alert Templates – Reference 228
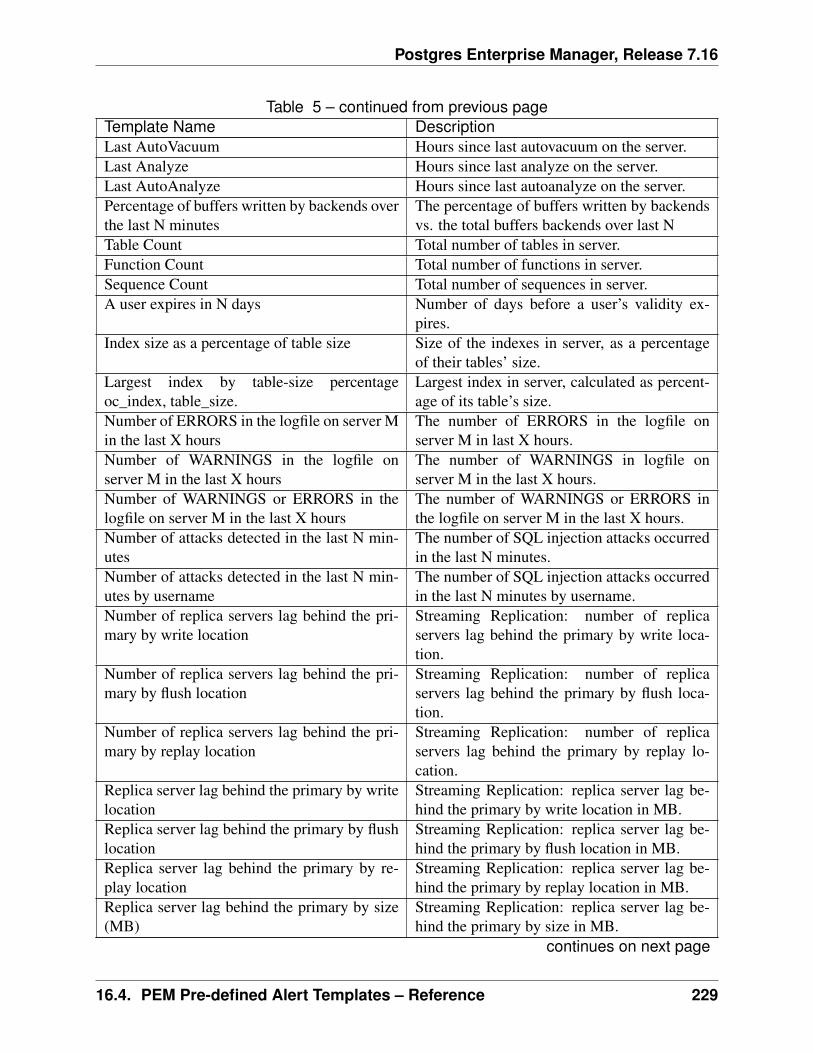
Postgres Enterprise Manager, Release 7.16
Table 5 – continued from previous pageTemplate Name DescriptionLast AutoVacuum Hours since last autovacuum on the server.Last Analyze Hours since last analyze on the server.Last AutoAnalyze Hours since last autoanalyze on the server.Percentage of buffers written by backends overthe last N minutes
The percentage of buffers written by backendsvs. the total buffers backends over last N
Table Count Total number of tables in server.Function Count Total number of functions in server.Sequence Count Total number of sequences in server.A user expires in N days Number of days before a user’s validity ex-
pires.Index size as a percentage of table size Size of the indexes in server, as a percentage
of their tables’ size.Largest index by table-size percentageoc_index, table_size.
Largest index in server, calculated as percent-age of its table’s size.
Number of ERRORS in the logfile on server Min the last X hours
The number of ERRORS in the logfile onserver M in last X hours.
Number of WARNINGS in the logfile onserver M in the last X hours
The number of WARNINGS in logfile onserver M in the last X hours.
Number of WARNINGS or ERRORS in thelogfile on server M in the last X hours
The number of WARNINGS or ERRORS inthe logfile on server M in the last X hours.
Number of attacks detected in the last N min-utes
The number of SQL injection attacks occurredin the last N minutes.
Number of attacks detected in the last N min-utes by username
The number of SQL injection attacks occurredin the last N minutes by username.
Number of replica servers lag behind the pri-mary by write location
Streaming Replication: number of replicaservers lag behind the primary by write loca-tion.
Number of replica servers lag behind the pri-mary by flush location
Streaming Replication: number of replicaservers lag behind the primary by flush loca-tion.
Number of replica servers lag behind the pri-mary by replay location
Streaming Replication: number of replicaservers lag behind the primary by replay lo-cation.
Replica server lag behind the primary by writelocation
Streaming Replication: replica server lag be-hind the primary by write location in MB.
Replica server lag behind the primary by flushlocation
Streaming Replication: replica server lag be-hind the primary by flush location in MB.
Replica server lag behind the primary by re-play location
Streaming Replication: replica server lag be-hind the primary by replay location in MB.
Replica server lag behind the primary by size(MB)
Streaming Replication: replica server lag be-hind the primary by size in MB.
continues on next page
16.4. PEM Pre-defined Alert Templates – Reference 229
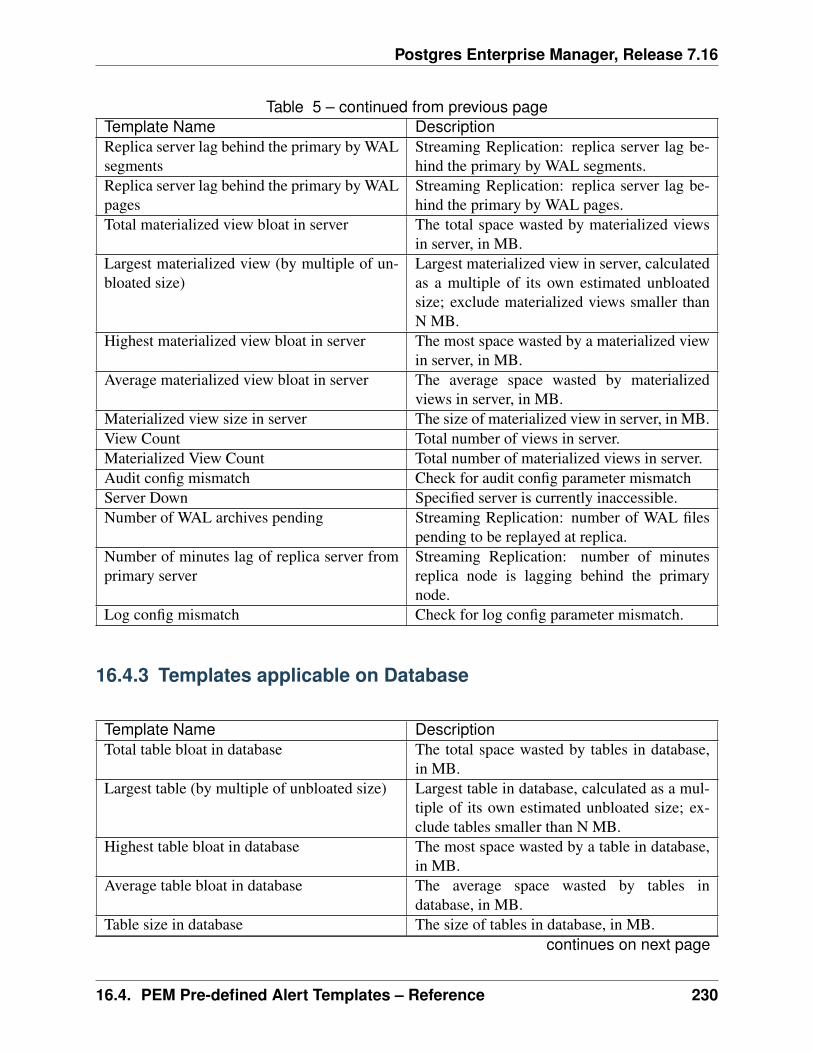
Postgres Enterprise Manager, Release 7.16
Table 5 – continued from previous pageTemplate Name DescriptionReplica server lag behind the primary by WALsegments
Streaming Replication: replica server lag be-hind the primary by WAL segments.
Replica server lag behind the primary by WALpages
Streaming Replication: replica server lag be-hind the primary by WAL pages.
Total materialized view bloat in server The total space wasted by materialized viewsin server, in MB.
Largest materialized view (by multiple of un-bloated size)
Largest materialized view in server, calculatedas a multiple of its own estimated unbloatedsize; exclude materialized views smaller thanN MB.
Highest materialized view bloat in server The most space wasted by a materialized viewin server, in MB.
Average materialized view bloat in server The average space wasted by materializedviews in server, in MB.
Materialized view size in server The size of materialized view in server, in MB.View Count Total number of views in server.Materialized View Count Total number of materialized views in server.Audit config mismatch Check for audit config parameter mismatchServer Down Specified server is currently inaccessible.Number of WAL archives pending Streaming Replication: number of WAL files
pending to be replayed at replica.Number of minutes lag of replica server fromprimary server
Streaming Replication: number of minutesreplica node is lagging behind the primarynode.
Log config mismatch Check for log config parameter mismatch.
16.4.3 Templates applicable on Database
Template Name DescriptionTotal table bloat in database The total space wasted by tables in database,
in MB.Largest table (by multiple of unbloated size) Largest table in database, calculated as a mul-
tiple of its own estimated unbloated size; ex-clude tables smaller than N MB.
Highest table bloat in database The most space wasted by a table in database,in MB.
Average table bloat in database The average space wasted by tables indatabase, in MB.
Table size in database The size of tables in database, in MB.continues on next page
16.4. PEM Pre-defined Alert Templates – Reference 230
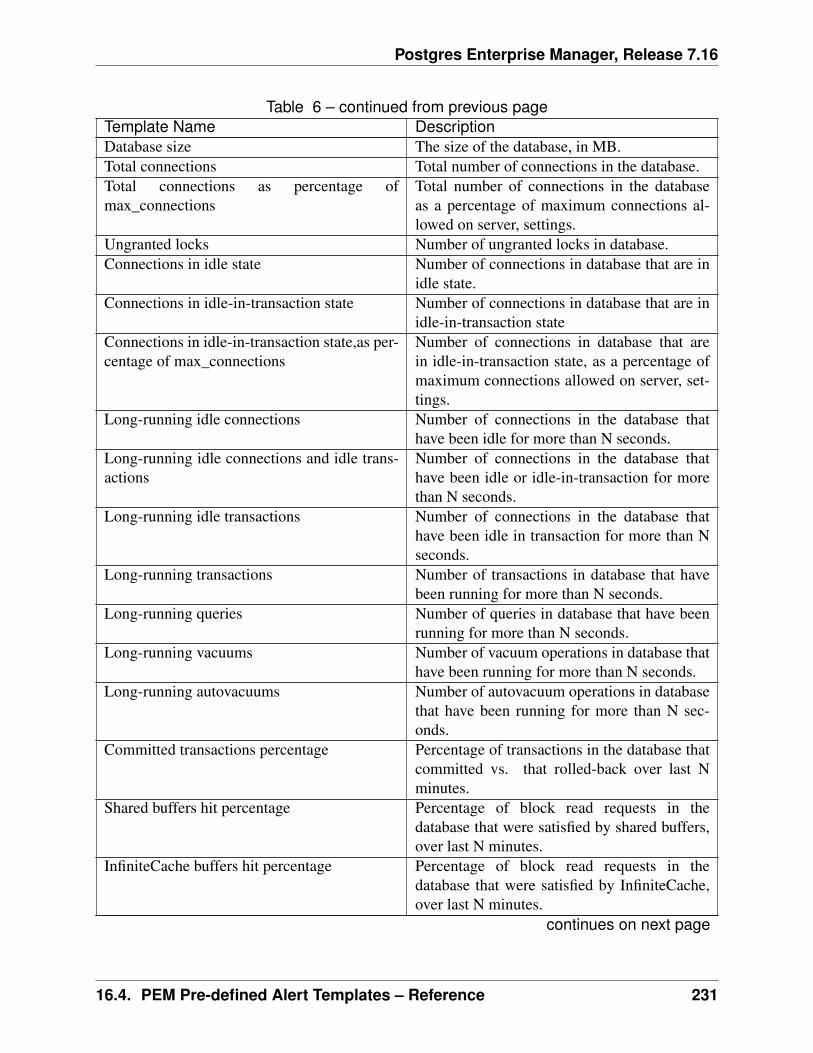
Postgres Enterprise Manager, Release 7.16
Table 6 – continued from previous pageTemplate Name DescriptionDatabase size The size of the database, in MB.Total connections Total number of connections in the database.Total connections as percentage ofmax_connections
Total number of connections in the databaseas a percentage of maximum connections al-lowed on server, settings.
Ungranted locks Number of ungranted locks in database.Connections in idle state Number of connections in database that are in
idle state.Connections in idle-in-transaction state Number of connections in database that are in
idle-in-transaction stateConnections in idle-in-transaction state,as per-centage of max_connections
Number of connections in database that arein idle-in-transaction state, as a percentage ofmaximum connections allowed on server, set-tings.
Long-running idle connections Number of connections in the database thathave been idle for more than N seconds.
Long-running idle connections and idle trans-actions
Number of connections in the database thathave been idle or idle-in-transaction for morethan N seconds.
Long-running idle transactions Number of connections in the database thathave been idle in transaction for more than Nseconds.
Long-running transactions Number of transactions in database that havebeen running for more than N seconds.
Long-running queries Number of queries in database that have beenrunning for more than N seconds.
Long-running vacuums Number of vacuum operations in database thathave been running for more than N seconds.
Long-running autovacuums Number of autovacuum operations in databasethat have been running for more than N sec-onds.
Committed transactions percentage Percentage of transactions in the database thatcommitted vs. that rolled-back over last Nminutes.
Shared buffers hit percentage Percentage of block read requests in thedatabase that were satisfied by shared buffers,over last N minutes.
InfiniteCache buffers hit percentage Percentage of block read requests in thedatabase that were satisfied by InfiniteCache,over last N minutes.
continues on next page
16.4. PEM Pre-defined Alert Templates – Reference 231
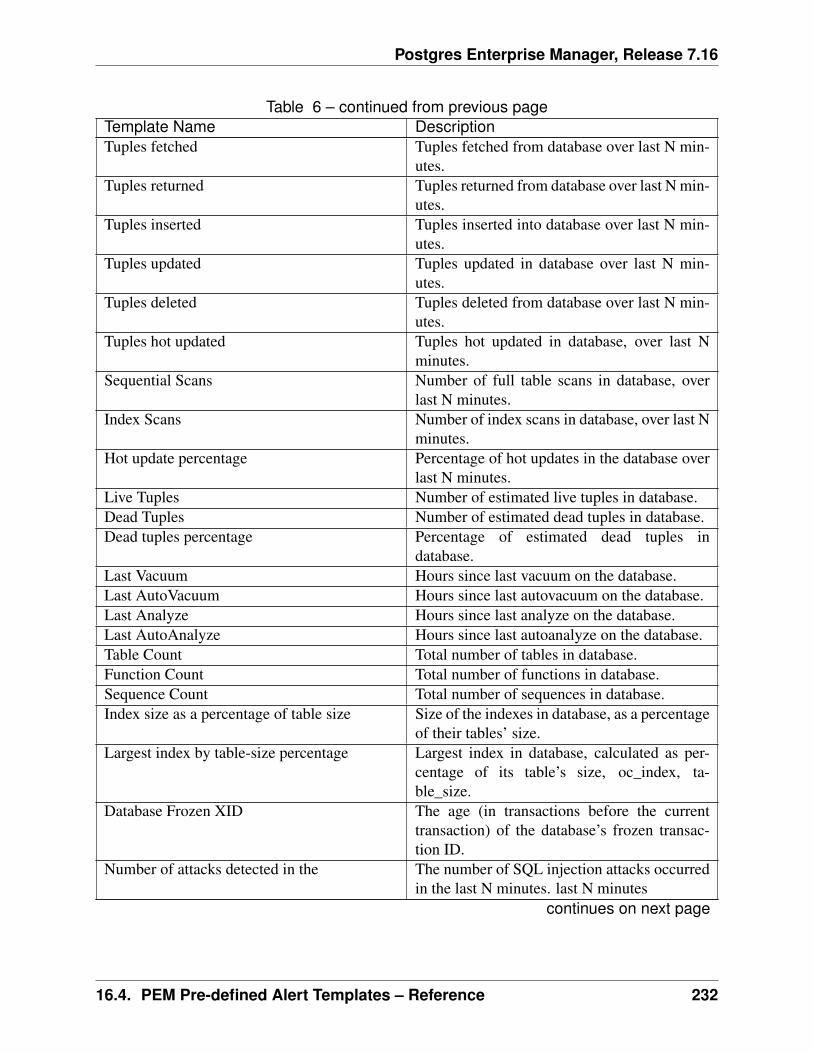
Postgres Enterprise Manager, Release 7.16
Table 6 – continued from previous pageTemplate Name DescriptionTuples fetched Tuples fetched from database over last N min-
utes.Tuples returned Tuples returned from database over last N min-
utes.Tuples inserted Tuples inserted into database over last N min-
utes.Tuples updated Tuples updated in database over last N min-
utes.Tuples deleted Tuples deleted from database over last N min-
utes.Tuples hot updated Tuples hot updated in database, over last N
minutes.Sequential Scans Number of full table scans in database, over
last N minutes.Index Scans Number of index scans in database, over last N
minutes.Hot update percentage Percentage of hot updates in the database over
last N minutes.Live Tuples Number of estimated live tuples in database.Dead Tuples Number of estimated dead tuples in database.Dead tuples percentage Percentage of estimated dead tuples in
database.Last Vacuum Hours since last vacuum on the database.Last AutoVacuum Hours since last autovacuum on the database.Last Analyze Hours since last analyze on the database.Last AutoAnalyze Hours since last autoanalyze on the database.Table Count Total number of tables in database.Function Count Total number of functions in database.Sequence Count Total number of sequences in database.Index size as a percentage of table size Size of the indexes in database, as a percentage
of their tables’ size.Largest index by table-size percentage Largest index in database, calculated as per-
centage of its table’s size, oc_index, ta-ble_size.
Database Frozen XID The age (in transactions before the currenttransaction) of the database’s frozen transac-tion ID.
Number of attacks detected in the The number of SQL injection attacks occurredin the last N minutes. last N minutes
continues on next page
16.4. PEM Pre-defined Alert Templates – Reference 232
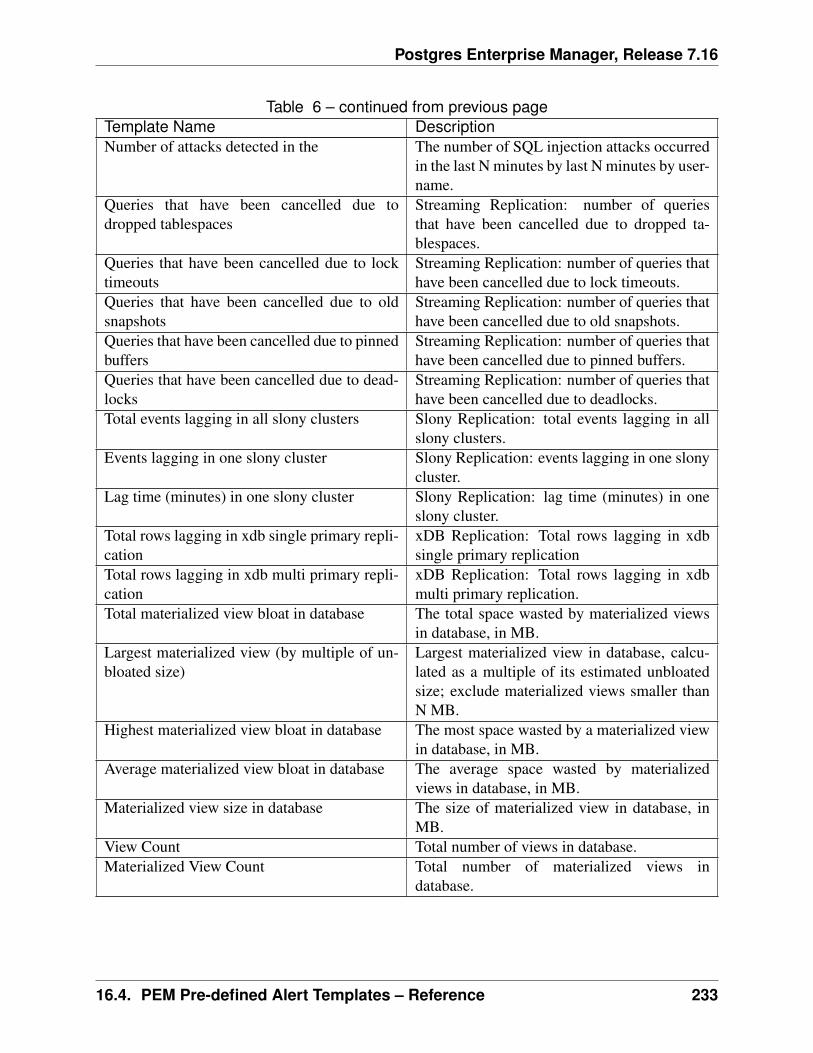
Postgres Enterprise Manager, Release 7.16
Table 6 – continued from previous pageTemplate Name DescriptionNumber of attacks detected in the The number of SQL injection attacks occurred
in the last N minutes by last N minutes by user-name.
Queries that have been cancelled due todropped tablespaces
Streaming Replication: number of queriesthat have been cancelled due to dropped ta-blespaces.
Queries that have been cancelled due to locktimeouts
Streaming Replication: number of queries thathave been cancelled due to lock timeouts.
Queries that have been cancelled due to oldsnapshots
Streaming Replication: number of queries thathave been cancelled due to old snapshots.
Queries that have been cancelled due to pinnedbuffers
Streaming Replication: number of queries thathave been cancelled due to pinned buffers.
Queries that have been cancelled due to dead-locks
Streaming Replication: number of queries thathave been cancelled due to deadlocks.
Total events lagging in all slony clusters Slony Replication: total events lagging in allslony clusters.
Events lagging in one slony cluster Slony Replication: events lagging in one slonycluster.
Lag time (minutes) in one slony cluster Slony Replication: lag time (minutes) in oneslony cluster.
Total rows lagging in xdb single primary repli-cation
xDB Replication: Total rows lagging in xdbsingle primary replication
Total rows lagging in xdb multi primary repli-cation
xDB Replication: Total rows lagging in xdbmulti primary replication.
Total materialized view bloat in database The total space wasted by materialized viewsin database, in MB.
Largest materialized view (by multiple of un-bloated size)
Largest materialized view in database, calcu-lated as a multiple of its estimated unbloatedsize; exclude materialized views smaller thanN MB.
Highest materialized view bloat in database The most space wasted by a materialized viewin database, in MB.
Average materialized view bloat in database The average space wasted by materializedviews in database, in MB.
Materialized view size in database The size of materialized view in database, inMB.
View Count Total number of views in database.Materialized View Count Total number of materialized views in
database.
16.4. PEM Pre-defined Alert Templates – Reference 233
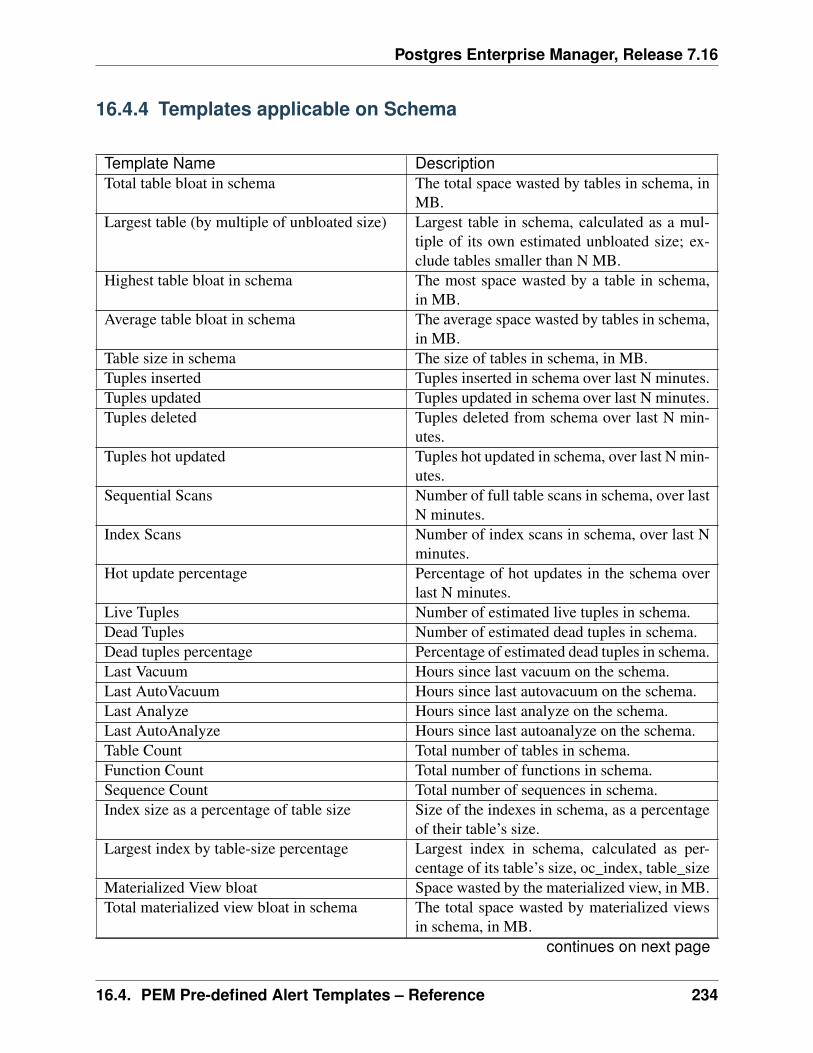
Postgres Enterprise Manager, Release 7.16
16.4.4 Templates applicable on Schema
Template Name DescriptionTotal table bloat in schema The total space wasted by tables in schema, in
MB.Largest table (by multiple of unbloated size) Largest table in schema, calculated as a mul-
tiple of its own estimated unbloated size; ex-clude tables smaller than N MB.
Highest table bloat in schema The most space wasted by a table in schema,in MB.
Average table bloat in schema The average space wasted by tables in schema,in MB.
Table size in schema The size of tables in schema, in MB.Tuples inserted Tuples inserted in schema over last N minutes.Tuples updated Tuples updated in schema over last N minutes.Tuples deleted Tuples deleted from schema over last N min-
utes.Tuples hot updated Tuples hot updated in schema, over last N min-
utes.Sequential Scans Number of full table scans in schema, over last
N minutes.Index Scans Number of index scans in schema, over last N
minutes.Hot update percentage Percentage of hot updates in the schema over
last N minutes.Live Tuples Number of estimated live tuples in schema.Dead Tuples Number of estimated dead tuples in schema.Dead tuples percentage Percentage of estimated dead tuples in schema.Last Vacuum Hours since last vacuum on the schema.Last AutoVacuum Hours since last autovacuum on the schema.Last Analyze Hours since last analyze on the schema.Last AutoAnalyze Hours since last autoanalyze on the schema.Table Count Total number of tables in schema.Function Count Total number of functions in schema.Sequence Count Total number of sequences in schema.Index size as a percentage of table size Size of the indexes in schema, as a percentage
of their table’s size.Largest index by table-size percentage Largest index in schema, calculated as per-
centage of its table’s size, oc_index, table_sizeMaterialized View bloat Space wasted by the materialized view, in MB.Total materialized view bloat in schema The total space wasted by materialized views
in schema, in MB.continues on next page
16.4. PEM Pre-defined Alert Templates – Reference 234
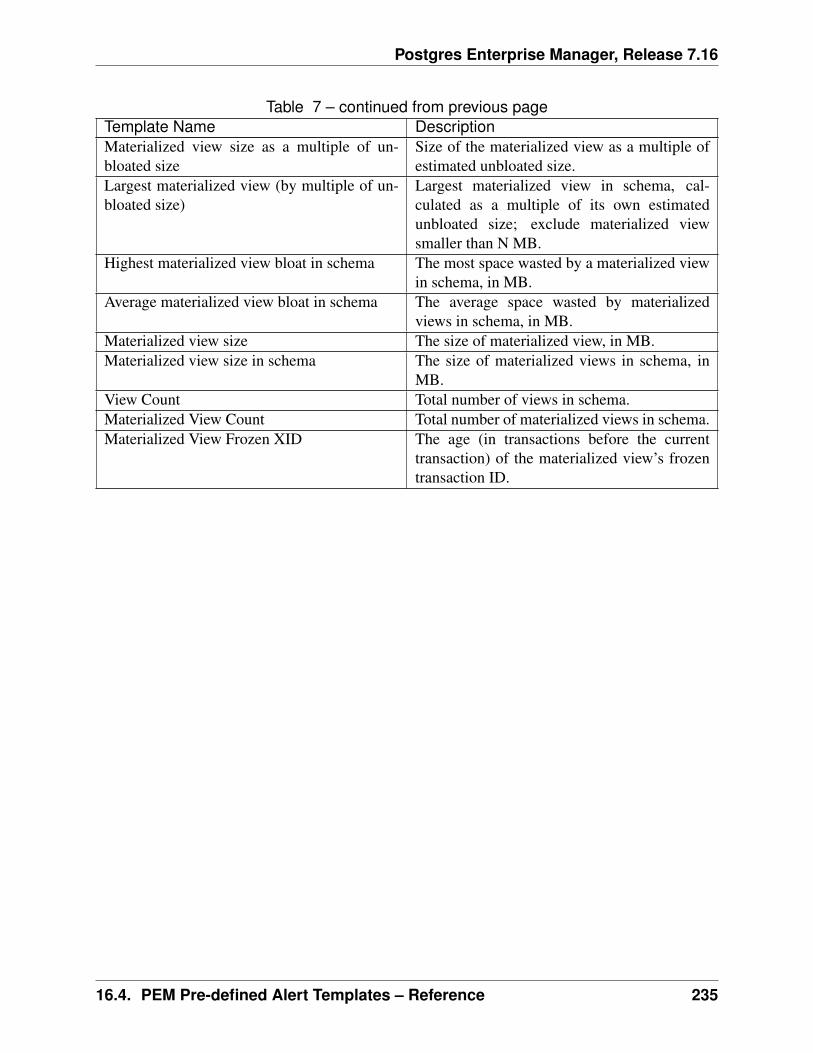
Postgres Enterprise Manager, Release 7.16
Table 7 – continued from previous pageTemplate Name DescriptionMaterialized view size as a multiple of un-bloated size
Size of the materialized view as a multiple ofestimated unbloated size.
Largest materialized view (by multiple of un-bloated size)
Largest materialized view in schema, cal-culated as a multiple of its own estimatedunbloated size; exclude materialized viewsmaller than N MB.
Highest materialized view bloat in schema The most space wasted by a materialized viewin schema, in MB.
Average materialized view bloat in schema The average space wasted by materializedviews in schema, in MB.
Materialized view size The size of materialized view, in MB.Materialized view size in schema The size of materialized views in schema, in
MB.View Count Total number of views in schema.Materialized View Count Total number of materialized views in schema.Materialized View Frozen XID The age (in transactions before the current
transaction) of the materialized view’s frozentransaction ID.
16.4. PEM Pre-defined Alert Templates – Reference 235
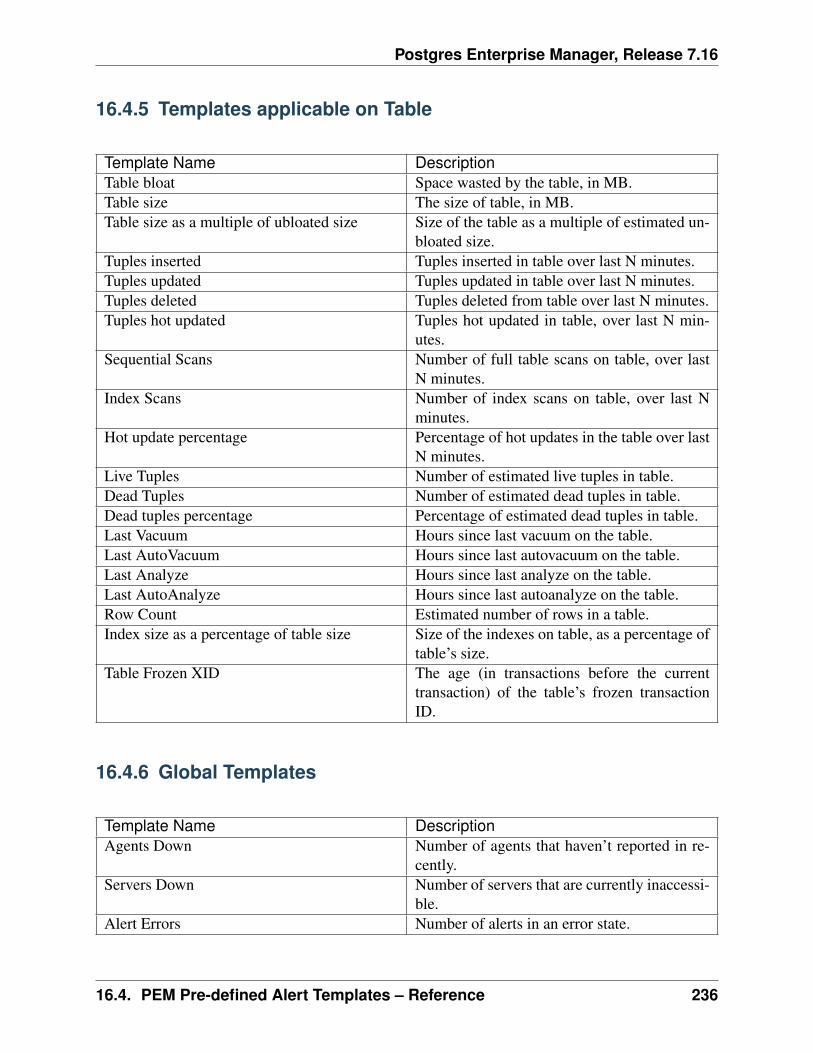
Postgres Enterprise Manager, Release 7.16
16.4.5 Templates applicable on Table
Template Name DescriptionTable bloat Space wasted by the table, in MB.Table size The size of table, in MB.Table size as a multiple of ubloated size Size of the table as a multiple of estimated un-
bloated size.Tuples inserted Tuples inserted in table over last N minutes.Tuples updated Tuples updated in table over last N minutes.Tuples deleted Tuples deleted from table over last N minutes.Tuples hot updated Tuples hot updated in table, over last N min-
utes.Sequential Scans Number of full table scans on table, over last
N minutes.Index Scans Number of index scans on table, over last N
minutes.Hot update percentage Percentage of hot updates in the table over last
N minutes.Live Tuples Number of estimated live tuples in table.Dead Tuples Number of estimated dead tuples in table.Dead tuples percentage Percentage of estimated dead tuples in table.Last Vacuum Hours since last vacuum on the table.Last AutoVacuum Hours since last autovacuum on the table.Last Analyze Hours since last analyze on the table.Last AutoAnalyze Hours since last autoanalyze on the table.Row Count Estimated number of rows in a table.Index size as a percentage of table size Size of the indexes on table, as a percentage of
table’s size.Table Frozen XID The age (in transactions before the current
transaction) of the table’s frozen transactionID.
16.4.6 Global Templates
Template Name DescriptionAgents Down Number of agents that haven’t reported in re-
cently.Servers Down Number of servers that are currently inaccessi-
ble.Alert Errors Number of alerts in an error state.
16.4. PEM Pre-defined Alert Templates – Reference 236
CHAPTER 17
Conclusion
The goal of Postgres Enterprise Manager is provide you with a solution that allows you to intel-ligently manage all your database servers across your enterprise with a single console. To meetthis objective, PEM supplies you with all the core features and functionality needed for visualdatabase administration, as well as a number of advanced components that assist you in managingthe performance and design of your database servers.
For more information about Postgres Enterprise Manager, please visit the EDB Web site (http://www.enterprisedb.com) where you will find PEM’s online documentation, as well as other tutorialsand educational aids.
EDB is the enterprise PostgreSQL company, providing products and services worldwide that arebased on and support PostgreSQL, the world’s most advanced open source database. EDB’s prod-ucts are ideally suited for transaction-intensive applications requiring superior performance, mas-sive scalability, and compatibility with proprietary database products. EDB’s products providean economical open source alternative or complement to proprietary databases without sacrificingfeatures or quality.
If you would like to discuss training, consulting, or enterprise support options, please contactEDB. EDB has offices in North America, Europe, and Asia. EDB was founded in 2004 and isheadquartered in Bedford, MA. For more information, please visit http://www.enterprisedb.com.
Sales Inquiries:
[email protected] (US)[email protected] (Intl)+1-781-357-3390 or 1-877-377-4352 (US Only)
General Inquiries:
237
Postgres Enterprise Manager, Release 7.16
[email protected]@enterprisedb.com (APAC)[email protected] (EMEA)
238
Postgres Enterprise Manager, Release 7.16
EDB Postgres Enterprise Manager Enterprise Features Guide
Copyright © 2007 - 2020 EnterpriseDB Corporation. All rights reserved.
EnterpriseDB® Corporation 34 Crosby Drive, Suite 201, Bedford, MA 01730, USA
T +1 781 357 3390 F +1 978 467 1307 E [email protected] www.enterprisedb.com
• EDB and Postgres Enterprise Manager are registered trademarks of EnterpriseDB Corpo-ration. EDB and EDB Postgres are trademarks of EnterpriseDB Corporation. Oracle is aregistered trademark of Oracle, Inc. Other trademarks may be trademarks of their respectiveowners.
• EDB designs, establishes coding best practices, reviews, and verifies input validation forthe logon UI for EDB Postgres Enterprise Manager where present. EDB follows the sameapproach for additional input components, however the nature of the product may requirethat it accepts freeform SQL, WMI or other strings to be entered and submitted by trustedusers for which limited validation is possible. In such cases it is not possible to prevent usersfrom entering incorrect or otherwise dangerous inputs.
• EDB reserves the right to add features to products that accept freeform SQL, WMI or otherpotentially dangerous inputs from authenticated, trusted users in the future, but will ensureall such features are designed and tested to ensure they provide the minimum possible risk,and where possible, require superuser or equivalent privileges.
• EDB does not that warrant that we can or will anticipate all potential threats and thereforeour process cannot fully guarantee that all potential vulnerabilities have been addressed orconsidered.
EnterpriseDB, EDB Postgres, EDB Postgres Advanced Server, Postgres Enterprise Manager, andDynaTune are trademarks of EnterpriseDB Corporation. Other names may be trademarks of theirrespective owners. © 2020.
239
Index
AAlerting, 79Audit Log Alerting, 99Audit Manager, 123
CCapacity Manager, 115Conclusion, 237Configuring Nagios-related
behavior of the PEMServer, 111
Copying a Probe, 78Copying an Alert, 98Creating a Custom Alert
Template, 84Creating a Custom Chart, 44Creating a Custom Dashboard, 37Creating a Custom Probe, 70Creating a New Alert, 89Creating an Email Group, 100Creating an Ops Dashboard, 41Customizing Probes, 68
DDeleting a Probe, 77
EEnabling Nagios Notification
for an Alert, 109
IImporting a Capacity Manager
Template, 49
LLog Manager, 135
MManaging Custom Dashboards, 36Modifying or Deleting an Alert,
95Modifying the Nagios
Configuration File, 114Monitoring an xDB Replication
Cluster, 190Monitoring Failover Manager, 186
PPEM Query Tool, 4Performance Diagnostic, 193Performance Monitoring and
Management, 31Postgres Expert, 174Probes, 53
RReference, 200Reports, 180
SSchedule Alert Blackout, 103SQL profiler, 155
TThe PEM Schema Diff Tool, 24Tuning Wizard, 166
240
Postgres Enterprise Manager, Release 7.16
UUsing Dashboards to View
Performance Information,33
Using PEM with Nagios, 108Using the Alerts Dashboard, 81Using the Manage Alerts Tab, 83Using the Manage Charts tab, 42
WWhat's New, 2
Index 241
Related Documents