Postglacial colonization of Europe by the barbastelle bat: agreement between molecular data and past predictive modelling HUGO REBELO*†, ELSA FROUFE‡, JOSE ´ C. BRITO†, DANILO RUSSO*,§, LUCA CISTRONE – , NUNO FERRAND† and GARETH JONES* *School of Biological Sciences, University of Bristol, Woodland Road, Bristol BS8 1UG, UK, †CIBIO, Centro de Investigac ¸a ˜o em Biodiversidade e Recursos Gene ´ticos da Universidade do Porto, Instituto de Cie ˆncias Agra ´rias de Vaira ˜o, R. Padre Armando Quintas, 4485-661 Vaira ˜o, Portugal, ‡CIIMAR, Centro Interdisciplinar de Investigac ¸a ˜o Marinha e Ambiental, R. dos Bragas, 289, 4050-123 Porto, Portugal, §Laboratorio di Ecologia Applicata, Dipartimento Ar.Bo.Pa.Ve., Facolta ` di Agraria, Universita ` degli Studi di Napoli Federico II, via Universita ` 100, I-80055 Portici (Napoli), Italy, –Forestry and Conservation, Via Botticelli, 14, I-03043 Cassino (Frosinone), Italy Abstract The barbastelle (Barbastella barbastellus) is a rare forest bat with a wide distribution in Europe. Here, we combine results from the analysis of two mtDNA fragments with species distribution modelling to determine glacial refugia and postglacial colonization routes. We also investigated whether niche conservatism occurs in this species. Glacial refugia were identified in the three southern European peninsulas: Iberia, Italy and the Balkans. These latter two refugia played a major role in the postglacial colonization process, with their populations expanding to England and central Europe, respectively. Palaeo-distribution models predicted that suitable climatic conditions existed in the inferred refugia during the last glacial maximum (LGM). Nevertheless, the overlap between the current and the LGM distributions was almost inexistent in Italy and in the Balkans, meaning that B. barbastellus populations were forced to shift range between glacial and interglacial periods, a process that probably caused some local extinctions. In contrast, Iberian populations showed a ‘refugia within refugium’ pattern, with two unconnected areas containing stable populations (populations that subsisted during both glacial and interglacial phases). Moreover, the match between LGM models and the refugial areas determined by molecular analysis supported the hypothesis of niche conservatism in B. barbastellus. We argue that geographic patterns of genetic structuring, altogether with the modelling results, indicate the existence of four management units for conservation: Morocco, Iberia, Italy and UK, and Balkans and central Europe. In addition, all countries sampled possessed unique gene pools, thus stressing the need for the conservation of local populations. Keywords: bats, glacial refugia, mtDNA, niche conservatism, past predictive modelling Received 7 October 2010; revision received 3 February 2012; accepted 14 February2012 Introduction Around 2.6 Ma, the Earth’s climate cooled considerably, thus starting the Quaternary period. Gradually, glacia- tions began to dominate the climate, especially in the temperate zones, interrupted by shorter and warmer interglacial periods (Bintanja & van de Wal 2008). This cycle of expansion and retraction of the ice sheets repeatedly forced massive range shifts in many animal and plant species. With the advance of the ice sheet in the temperate zone, several species became confined to regions where ecological conditions permitted their sur- vival—glacial refugia (Taberlet et al. 1998; Hewitt 1999). Correspondence: Hugo Rebelo, Fax: + 35 125 266 1780; E-mail: [email protected] ȑ 2012 Blackwell Publishing Ltd Molecular Ecology (2012) 21, 2761–2774 doi: 10.1111/j.1365-294X.2012.05566.x

Welcome message from author
This document is posted to help you gain knowledge. Please leave a comment to let me know what you think about it! Share it to your friends and learn new things together.
Transcript

Molecular Ecology (2012) 21, 2761–2774 doi: 10.1111/j.1365-294X.2012.05566.x
Postglacial colonization of Europe by the barbastelle bat:agreement between molecular data and past predictivemodelling
HUGO REBELO*†, ELSA FROUFE‡, JOSE C. BRITO†, DANILO RUSSO* ,§, LUCA CISTRONE– ,
NUNO FERRAND† and GARETH JONES*
*School of Biological Sciences, University of Bristol, Woodland Road, Bristol BS8 1UG, UK, †CIBIO, Centro de Investigacao em
Biodiversidade e Recursos Geneticos da Universidade do Porto, Instituto de Ciencias Agrarias de Vairao, R. Padre Armando
Quintas, 4485-661 Vairao, Portugal, ‡CIIMAR, Centro Interdisciplinar de Investigacao Marinha e Ambiental, R. dos Bragas,
289, 4050-123 Porto, Portugal, §Laboratorio di Ecologia Applicata, Dipartimento Ar.Bo.Pa.Ve., Facolta di Agraria, Universita
degli Studi di Napoli Federico II, via Universita 100, I-80055 Portici (Napoli), Italy, –Forestry and Conservation, Via Botticelli,
14, I-03043 Cassino (Frosinone), Italy
Corresponde
E-mail: hugo
� 2012 Black
Abstract
The barbastelle (Barbastella barbastellus) is a rare forest bat with a wide distribution in
Europe. Here, we combine results from the analysis of two mtDNA fragments with
species distribution modelling to determine glacial refugia and postglacial colonization
routes. We also investigated whether niche conservatism occurs in this species. Glacial
refugia were identified in the three southern European peninsulas: Iberia, Italy and the
Balkans. These latter two refugia played a major role in the postglacial colonization
process, with their populations expanding to England and central Europe, respectively.
Palaeo-distribution models predicted that suitable climatic conditions existed in the
inferred refugia during the last glacial maximum (LGM). Nevertheless, the overlap
between the current and the LGM distributions was almost inexistent in Italy and in the
Balkans, meaning that B. barbastellus populations were forced to shift range between
glacial and interglacial periods, a process that probably caused some local extinctions. In
contrast, Iberian populations showed a ‘refugia within refugium’ pattern, with two
unconnected areas containing stable populations (populations that subsisted during both
glacial and interglacial phases). Moreover, the match between LGM models and the
refugial areas determined by molecular analysis supported the hypothesis of niche
conservatism in B. barbastellus. We argue that geographic patterns of genetic structuring,
altogether with the modelling results, indicate the existence of four management units
for conservation: Morocco, Iberia, Italy and UK, and Balkans and central Europe. In
addition, all countries sampled possessed unique gene pools, thus stressing the need for
the conservation of local populations.
Keywords: bats, glacial refugia, mtDNA, niche conservatism, past predictive modelling
Received 7 October 2010; revision received 3 February 2012; accepted 14 February2012
Introduction
Around 2.6 Ma, the Earth’s climate cooled considerably,
thus starting the Quaternary period. Gradually, glacia-
tions began to dominate the climate, especially in the
nce: Hugo Rebelo, Fax: + 35 125 266 1780;
well Publishing Ltd
temperate zones, interrupted by shorter and warmer
interglacial periods (Bintanja & van de Wal 2008). This
cycle of expansion and retraction of the ice sheets
repeatedly forced massive range shifts in many animal
and plant species. With the advance of the ice sheet in
the temperate zone, several species became confined to
regions where ecological conditions permitted their sur-
vival—glacial refugia (Taberlet et al. 1998; Hewitt 1999).
2762 H. REBELO ET AL.
The formation of isolated populations in refugia led to
the evolution of unique gene pools resulting from
phenomena such as genetic drift and local adaptation
(Hewitt 2000). Periods of isolation associated with gla-
cial periods may lead to genetic differentiation among
populations, while dispersal during interglacial periods
may result in population connectivity, thus promoting
gene flow (Hewitt 1999). The ‘genetic signatures’ of
these population movements are still present in current
patterns of phylogeographic structure and levels of
genetic variation (Avise 2000).
In Europe, glacial periods had profound effects on
genetic and population structure in a number of species
(see Weiss & Ferrand 2007). Three major glacial refugia
in southern Europe have been proposed for the majority
of terrestrial animals (Hewitt 2000)—the Iberian and Ital-
ian peninsulas and the Balkans. However, it should not
be assumed that each of these regions was uniformly
covered by areas suitable for the species. The existence of
fragmented distributions within refugia, together with
the existence of gene flow occuring during range expan-
sions in the interglacial periods, has resulted in complex
patterns of population genetic structure that still persist
(Gomez & Lunt 2007; Grill et al. 2009).
By investigating the macro-geographical genetic struc-
ture of populations, it is possible to reconstruct popula-
tion histories and identify genetically distinct
populations that could constitute relevant units for con-
servation (Kerth et al. 2008). The analysis of mitochon-
drial DNA (mtDNA) has been the primary tool in
phylogeographic studies, owing to the fast mutation
rate of mitochondrial genes and because maternal
inheritance makes it possible to determine where a spe-
cies was able to establish populations (Avise 2000).
Although very powerful, this technique does not allow
determination of the spatial boundaries of the popula-
tions during these past events.
Predicting past, present or future species distributions
is a major challenge in ecology. With more information
currently available on past climatic conditions (e.g. Wal-
tari et al. 2007) together with the development of pow-
erful distribution modelling techniques, it is now
possible to predict the location of the glacial refugia
and respective population boundaries (e.g. Hugall et al.
2002; Moussalli et al. 2009). Unfortunately, to the best
of our knowledge, no wide-scale land cover data are so
far available with a relevant resolution (usually higher
than 2.8�) that can be used to reconstruct habitat condi-
tions in the distant past. Therefore, most past predictive
modelling is based on climatic data only, and hence
models only produce bioclimatic envelopes for a spe-
cies. Besides, by projecting climatic envelopes generated
from current climatic conditions to the past, we assume
that the species’ climatic niche is constant over time
(Peterson et al. 1999). Although it has been proposed
that a number of animal and plant species have
retained niche characteristics over time (Peterson
et al. 1999), there has been a considerable debate on
(see Losos 2008; Peterson 2011). Under the theory of
niche conservatism, when local ecological conditions
change dramatically, either the species moves to new
suitable locations or extinction is probable (Wiens &
Graham 2005). Testing the niche conservatism hypothe-
sis is possible by comparing results from palaeo-
distribution models with genetic analysis (Knowles
et al. 2007; Waltari et al. 2007; Cordellier & Pfenninger
2009; Moussalli et al. 2009). If both of these methods
identify similar glacial refugia, then the existence of
niche conservatism is supported (Peterson et al. 1999).
In this work, the phylogeography of the barbastelle,
Barbastella barbastellus (Schreber, 1774) was studied over
most of its geographical range. The barbastelle is a rare
European bat with a declining population (IUCN 2010)
and has a highly fragmented distribution over a wide-
spread range that covers most of continental Europe
and extends to northern Morocco, (Urbanczyk 1999). It
seems to be dependent upon native mature woodland
for roosting and foraging, and hence deforestation and
habitat fragmentation are probably associated with its
suspected population decline (Russo et al. 2004). Owing
to this strong association with mature deciduous forest,
it is expected that the range expansion and contraction
of this species should broadly mirror the spatial loca-
tion of this habitat and of other species highly depen-
dent on these forests (e.g. Bihari et al. 2011). For
European bats, the Balkans and Iberia seemed to be the
main sources of postglacial colonization, while Italy had
a smaller contribution (Petit et al. 1999; Ruedi & Cas-
tella 2003; Rossiter et al. 2007; Kerth et al. 2008; Flan-
ders et al. 2009). The majority of the phylogeographic
studies showed that bats had a less evident population
structure than similarly sized non-volant mammals
(Kerth et al. 2008), and the lack of structure is more
pronounced in migratory species (Petit et al. 1999; Wor-
thington Wilmer et al. 1999; Russell et al. 2007). The
ability of bats to fly gives them a higher potential to
overcome geographical obstacles, such as rivers or
mountains, hence promoting gene flow. There is little
information on migratory behaviour in B. barbastellus,
although several authors suggest that seasonal migra-
tions may occur, covering distances up to 290 km
(Rydell & Bogdanowicz 1997; Riede 2001).
Juste et al. (2003) made the first assessment on the
phylogeography of B. barbastellus in Europe and con-
cluded that a shallow population structure existed with
low divergence among European populations (between
0.7 and 2.1% in mtDNA cytochrome b). Nevertheless,
the limited number of samples analysed and the
� 2012 Blackwell Publishing Ltd
PHYLOGEOGRAPHY OF B. BA RB ASTELLUS 2763
restricted geographical range covered (i.e. excluding
samples from the typical European glacial refugia) in
that study did not allow any conclusions to be reached
on postglacial colonization routes or even on the deter-
mination of population structure and demographic his-
tory of the species in northern and central Europe.
We used mtDNA analysis combined with ecological
niche modelling to assess the population history of
B. barbastellus in Europe and to locate glacial refugia
and postglacial colonization routes. Given the amount
of research into glacial refugia and postglacial colonisa-
tion routes in Europe, we compared our species’ results
with other species also dependent on forests (e.g. Ferris
et al. 1998; Kerth et al. 2008; Bihari et al. 2011). Addi-
tionally, by comparing the predictions of distribution
models with patterns of phylogeographic structure, we
evaluated whether niche conservatism occurs in this
bat. Our first goal was to determine population struc-
ture and glacial refugia over the entire geographical
range of the species by employing analyses of two
mtDNA genes: the complete cytochrome b and a
fragment of the D-loop. Moreover, from this analysis,
we determined whether populations contracted or
expanded from the glacial refugia to the current
interglacial areas of occurrence, or remained stable in
the former. In a second step, we employed ecological
niche modelling to determine current and past distribu-
tions, as well as to determine in which areas popula-
tions might persist through both glacial and interglacial
periods. This latter analysis also allowed investigation
of which climatic variables had the greatest influence in
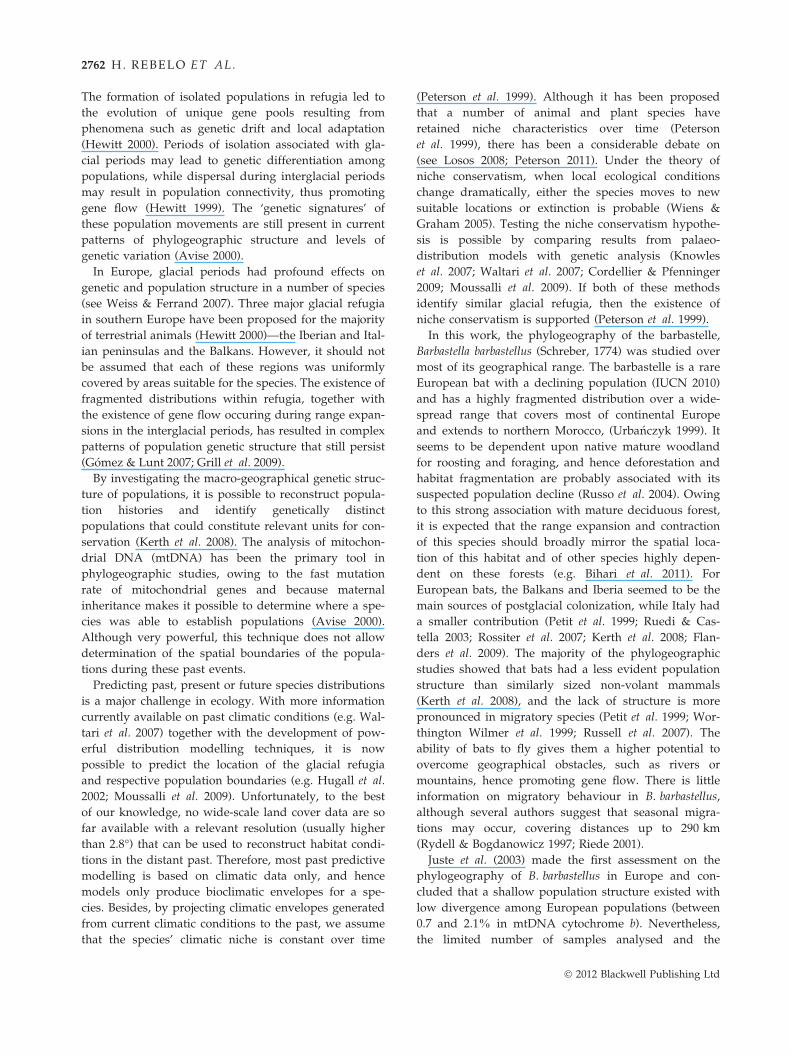
Fig. 1 Map of the approximate distribution of Barbastella barbastell
adapted from Urbanczyk (1999). Circles indicate the localities of the
sample size. Some circles may contain more than one sampled locality
� 2012 Blackwell Publishing Ltd
delimiting the distribution of B. barbastellus. Finally, by
combining genetic and modelling results, we identified
management units which may have important implica-
tions for the conservation of this rare bat.
Materials and methods
Study area and sampling
The study area encompassed all mainland Europe (west
of Caucasus), the UK, Ireland, all major Mediterranean
islands and part of north Africa, extending between
coordinates 71�31¢N–33�30¢N and 10�45¢W–45�33¢E.
Thus, the study area included almost the entire geo-
graphical range known for this species (Fig. 1), exclud-
ing the Canary Islands. The eastern limits of the species
range are still poorly known but are probably located in
the Caucasus region, where Barbastella barbastellus is
likely to occur in sympatry with its sister species B. leu-
comelas (Horacek et al. 2000). Material suitable for DNA
analysis (wing membranes tissue and hairs) was
obtained from several international researchers in order
to cover as much as possible of the species’ range.
Sequence data
Genomic DNA was extracted from hair or wing
punches using an E.Z.N.A. Tissue DNA kit (Omega
Bio-Tek, GA, USA), eluted and stored in 50 lL of the
provided elution buffer. Two mitochondrial genes were
amplified: the cytochrome b (cyt b) and the hypervari-
us in the western Palaearctic (excluding the Canary Islands)
samples used in this study, while numbers within specify the
.
2764 H. REBELO ET AL.
able domain (HVII) of the D-loop. In order to amplify
those genes, we used the following sets of primers:
Bat_cytb_1 (Li et al. 2006) and Bat_cytb_2 (Zhang et al.
2007) for cyt b and L16517 (Fumagalli et al. 1996) and
sH651 (Castella et al. 2001) for D-loop. The polymerase
chain reaction (PCR) for cyt b was performed in 25 lL
reaction volumes containing 5 mM MgCl2, 0.24 lM of
each primer, 0.6 lM of each dNTP, 1 unit of Taq DNA
polymerase (Qiagen, CA, USA) and 5–10 ng of genomic
DNA. The amplification consisted of an initial denatur-
ation at 95 �C for 5 min, followed by 39 cycles of 95 �C
for 40 s, 52 �C for 45 s and 72 �C for 80 s, with a final
elongation step at 72 �C for 10 min. The amplified frag-
ments of cyt b were sequenced on an automated
sequencer (ABI 310; Applied Biosystems) in both direc-
tions using the same primers. In some samples (espe-
cially from museum specimens), the DNA was too
degraded, and hence it was not possible to obtain com-
plete sequences using only the aforementioned primers.
For these samples, we successfully developed the fol-
lowing internal primers to produce shorter fragments:
5¢-ATCACCGCCCTATTAACCCTA-3¢ (CytbatF2B) and
5¢-GGTTGTTTGACCCTGTTTCG-3¢ (Cytbat R1), 5¢-TTT
AAAGAAACATGAAACGTAGGG-3¢ (CytbatF1). The
overlapping fragments of cyt b were then assembled to
produce sequences of 1140 bp. Regarding D-loop PCR
conditions, we followed the procedure described by
Castella et al. (2001). The amplified fragments were
sequenced in one direction using primer L16517 pro-
ducing a sequence of 297 bp. Sequences from both
genes were examined, edited and aligned using the
software Bioedit v.7.0.1 (Hall 1999).
Genetic diversity and phylogenetic analyses
The two analysed mtDNA fragments are located on the
same locus, and hence we concatenated them into a sin-
gle sequence for all subsequent analyses (Grill et al.
2009). However, only cyt b phylogenetic trees are pre-
sented. To describe the diversity of DNA sequences,
basic descriptive statistics and genetic diversity parame-
ters, namely haplotype diversity (h), nucleotide diver-
sity (p), genetic difference (d) and characterization of
polymorphic sites were calculated using the software
DnaSP v5.00.04 (Librado & Rozas 2009). Genetic diver-
gence between regions was computed by pairwise UST
and by performing a global test of differentiation
among samples of different populations (see below for
the delimitation of populations).
For the phylogenetic analysis, sequences were
imported into PAUP* 4.0b10 (Swofford 2002). Only
unique haplotypes within B. barbastellus were included,
while sequences from the only other two species within
the genus, B. leucomelas and B. beijingensis, were used as
outgroups (downloaded from GenBank; Accession nos
EF534762 and EF534765 ⁄ 6). To estimate evolutionary
relationships, we used neighbour-joining (NJ), maxi-
mum parsimony (MP) and maximum likelihood (ML)
analysis with random sequence addition (10 replicate
heuristic searches). The sequence evolution model was
inferred using jModelTest (Posada 2008). Support for
nodes was estimated using the bootstrap technique with
1000 replicates.
Population structure and phylogeographic analyses
To evaluate relationships among closely related haplo-
types, sequences were joined in unrooted networks,
constructed with a 95% parsimony criterion using TCS
2.1 (Clement et al. 2000). With this method, we
intended to detect potential spatial patterns existing
according to the distribution of haplotypes. Moreover,
this technique is particularly suited to the analysis of
single-species gene genealogies, where ancestral and
descendant haplotypes may coexist.
From the analyses of the phylogenetic trees, all haplo-
types were clustered into three groups for most of the
subsequent analyses, namely Iberia, Italy + England
and Balkans + central Europe. For the computation of
pairwise UST, sequence data were partitioned according
to the population structure visualized in the network of
haplotypes and phylogenetic trees, to assure that only
genetically homogeneous populations were being com-
pared. As such, for this analysis, defined populations
were Balkans, central Europe, Italy, UK, Iberia 1 and
Iberia 2.
To test for the geographical genetic structure, we
used an analysis of molecular variance (AMOVA) with
10 000 permutations in Arlequin 3.1 (Excoffier et al.
2006). Moroccan samples were not considered in the AM-
OVA owing to the low sample size. Past population
demography of B. barbastellus was inferred using a
Bayesian skyline plot (BSP; Drummond et al. 2005) as
implemented in Beast 1.4.8 (Drummond & Rambaut
2007). This method permits the estimation of the effec-
tive population size (Ne) through time and makes no a
priori assumptions about the demographic scenario of a
population. We used the GTR + I model of substitution
comprising all sequence data. These analyses estimated
genealogies and model parameters and were sampled
every 1000th iteration for 50 million generations with
10% of the initial samples discarded as burn-in. No a
priori information was available for the mean substitu-
tion rate for the employed molecular markers in B. bar-
bastellus. As such, initial analyses were done with the
concatenated sequences and a varying prior ranging
between 0.1% and 10% per Myr (Depraz et al. 2008),
with results converging to the same mean estimate, 2%
� 2012 Blackwell Publishing Ltd
PHYLOGEOGRAPHY OF B. BA RB ASTELLUS 2765
per Myr (lower bound 0.5%, upper bound 5%). These
values were then used for the final analyses. We reran
the analysis until each scale factor was optimized to the
criteria of acceptance as stated in the programme’s doc-
umentation.
Additionally, we also tested the hypothesis of demo-
graphic expansion by calculating Fu’s neutrality statistic
Fs, which tests the probability of observing a random
neutral sample with no more alleles than the observed
value of pairwise differences in the sample (Fu 1997),
and Tajima’s D which tests whether the parameter
derived from the average number of pairwise nucleo-
tide differences is equal to the parameter derived from
the number of segregating sites in the sample (Tajima
1989). The significance of these tests was calculated
using 10 000 coalescent simulations in the software
DnaSP v5.00.04 (Librado & Rozas 2009).
Predictive modelling for the present and last glacialmaximum
For model training, we used all available locations of
B. barbastellus in Europe (N = 538) as the dependent vari-
able. Presence data were obtained from Urbanczyk (1999)
available from the European Environment Agency web-
site (http://eunis.eea.europa.eu), which covered the
majority of the known distribution located between 9�W,
33�N, 28�E and 53�N. Data set did not present evidence
of spatial autocorrelation (nearest neighbour ratio = 1.01,
z = 0.13, P = 0.89). Furthermore, a set of independent
ecogeographical variables (EGV) was also considered:
annual average temperature (�C), annual average precipi-
tation (mm), average temperature range (�C), average
temperature of the warmest quarter (�C), average tem-
perature of the coldest quarter (�C), average precipitation
of the wettest quarter (mm) and average precipitation of
the driest quarter (mm) (Hijmans et al. 2005; WorldClim
data set available at http://www.worldclim.org). Chosen
climatic variables are acknowledged to exert a strong
influence on bat distribution patterns (Ulrich et al. 2007),
as they are associated with crucial aspects for their sur-
vival such as metabolic rate, gestation times and evapora-
tive water loss (Racey et al. 1987; Webb et al. 1995;
Adams & Hayes 2008).
We chose a presence-only modelling technique because
reliable absence data were not available and the elusive
and nocturnal behaviour of bats adds even more uncer-
tainty to absences. Species distribution modelling tech-
niques have been extensively tested for different sample
sizes, geographical ranges and resolutions. We used a
maximum entropy modelling technique (Maxent species
distribution modelling, v.3.3.0; http://www.cs.prince-
ton.edu/~schapire/maxent), that estimates the range of a
species by finding the maximum entropy distribution
� 2012 Blackwell Publishing Ltd
given the constraint that the expected value for each EGV
closely matches the empirical average of the presence
data (see Phillips et al. 2006). When compared with other
modelling techniques, Maxent has achieved a very good
performance on the statistical indices measuring accu-
racy of predicting a species’ distribution, (Brotons et al.
2004; Elith et al. 2006; Hernandez et al. 2006; Rebelo &
Jones 2010). Models were run with 80% of the presence
data while the remaining 20% were used to test them.
Because Maxent randomly chooses which presence data
to include in the training or test models, this would
imply that models produced would be different accord-
ing to the chosen presence data. Consequently, we ran
100 model replications and averaged them into a single
model (with standard deviation shown when suited).
Calculations were carried out in the autofeatures mode
with a maximum of 1000 interactions and regularization
set to 0.5. Generated models had a continuous output
ranging from 0 to 1, where 1 indicates that species pres-
ence is highly probable.
To verify which variables were the most important
for model building, a Jackknife analysis of the gain
(a measure of likelihood between the presence data and
ecological variables) was made with the training data
being the results that are presented in graphics. The
relationship between the species’ presence and the most
relevant EGVs was assessed by the analysis of response
curve plots obtained with univariate models. The
obtained model was then tested with receiver-operated
characteristics (ROC) plots to evaluate their predictive
ability. The area under the curve (AUC) of the ROC
analysis provides a single measure of the model perfor-
mance (Liu et al. 2005) and ranges from 0.5 (random-
ness) to 1 (perfect discrimination). An AUC score
higher than 0.7 is considered to represent good model
accuracy (Fielding & Bell 1997).
Regarding model production, we calculated biocli-
matic models for the present and projected them to the
last glacial maximum (LGM; 23 000–18 000 years BP)
using the above selected climatic variables. We used
two different general circulation models (GCM) for this
latter period, the Community Climate System Model
(CCSM) and the Model for Interdisciplinary Research
on Climate (MIROC, version 3.2). For more information
on the LGM climatic model development and down-
scaling, see Hijmans et al. (2005) and Waltari et al.
(2007). All digital information had a resolution of 0.5�(�55 km), thus the study area included a total of 6283
cells for the present conditions and 8050 cells for the
LGM projections (cell numbers increased owing to the
advance of the coastline during the glacial period).
To determine in which areas populations were located
during glacial and interglacial periods, it was also
necessary to produce binary presence ⁄ absence maps for

Table 1 Diversity statistics based on
1437 bp of Barbastella barbastellus
grouped in four regions, as determined
by the analysis of the phylogenetic trees
Group
Sample
size
Number
of haplotypes
Polymorphic
sites
Nucleotide
diversity
Haplotype
diversity
Iberia 36 22 32 0.004 0.96
Italy +
England
56 15 33 0.003 0.836
Balkans +
central Europe
21 11 24 0.002 0.805
Morocco 2 2 4 — —
Total 115 49 69 0.007 0.947
2766 H. REBELO ET AL.
all models. We used the 10% of training presence as the
threshold value, a value above which the species is
assumed to be present (Suarez-Seoane et al. 2008; Raes
et al. 2009; Rebelo & Jones 2010). This threshold takes
into account that for large data sets collected by differ-
ent researchers over great time spans, some errors may
occur regarding species identification or in the geo-
graphic referencing. After model reclassification, it was
then possible to determine which regions had suitable
climatic conditions for B. barbastellus populations during
both glacial and interglacial periods, thus areas with sta-
ble populations over the studied period (Moussalli et al.
2009). This was achieved by multiplying all reclassified
binary models: present and both LGM.
Fig. 2 Phylogenetic relationships as shown by the neighbour-
joining (NJ) analysis between haplotypes of cytochrome b. Boot-
strap values are indicated for NJ, maximum parsimony and
maximum likelihood. Information on each haplotype origin
and polymorphisms is found at Table S1 (Supporting informa-
tion).
Results
Sequence data and genetic diversity
A total of 115 samples were successfully amplified and
sequenced for the complete cyt b (1140 bp) and a frag-
ment of the D-loop (297 bp). Sequences belonging to the
same individual were aligned and concatenated into a
single one with a total length of 1437 bp. Forty-nine
haplotypes were found (see Table S1, Supporting infor-
mation) resulting from 69 variable sites of which 56
were transitions and 11 were transversions, and 44 sites
were parsimony informative (Table 1). The majority of
the mutational sites were located in the cyt b gene
(n = 56) with only 13 variable sites found in the D-loop
fragment. In addition, two indels were also found in
the latter fragment. Haplotype diversity was high
(h = 0.947 ± 0.01), while nucleotide diversity was mod-
erately low (p = 0.007 ± 0.0002). Overall, mean genetic
difference (p-distance) was low (d = 0.007 ± 0.002),
which was in agreement with mean diversity within the
four populations (d = 0.003 ± 0.001).
Phylogenetic subdivision and population structure
The analyses of the phylogenetic trees obtained from
cyt b sequences (NJ, MP and ML) clearly showed the
existence of three supported clades in Europe: Iberia,
Italy and England, and the Balkans and central Europe
(Fig. 2). Morocco was also classified as an independent
clade, although with lower bootstrap support. This
clade classification was identical for all three methods
employed, that is, NJ, MP and ML.
Interestingly, no haplotype had a widespread distri-
bution with each geographic region (determined by
the phylogenetic trees and network of haplotypes)
� 2012 Blackwell Publishing Ltd

Table 2 Genetic differentiation of Barbastella barbastellus (UST)
among the populations within the defined three regions (see
Methods)
Iberia 1 Iberia 2 Italy UK Balkans
Iberia 1
Iberia 2 0.060*
Italy 0.263 0.270
UK 0.147 0.133 0.129*
Balkans 0.111 0.188 0.350 0.181
Central Europe 0.152 0.140 0.347 0.190 0.095*
*Indicates ST values not significantly different from zero. Only
populations with sample size ‡4 individuals were considered
for analysis.
PHYLOGEOGRAPHY OF B. BA RB ASTELLUS 2767
characterized by the existence of almost only unique
haplotypes, in addition to the high haplotype diversity
found in every region (Table 1). Despite the low values
(UST <0.35; P < 0.05), we detected a significant popula-
tion structure among the European regions but not
within the regions themselves (Table 2). These results
give two indications: there is no population divergence
within phylogenetic clades (namely within Balkans and
central Europe, Italy and UK, and the two populations
in Iberia), while the low UST values between regions
suggest that historical gene flow occurred between
areas as far apart as Iberia and the Balkans, in spite of
the almost absence of shared haplotypes between
regions. Morocco was the only region showing no sig-
nificant structuring with any of the European regions,
but the limited number of samples analysed from there
does not allow a conclusive interpretation.
Additionally, AMOVA only revealed significant genetic
variance within populations and among popula-
tions ⁄ within regions (Table 3), with most of the diver-
sity located within populations (78.1%).
Phylogeography and population demographics
Regarding the geographic distribution of haplotypes,
network analysis showed that each region was sepa-
rated from all others and comprised almost unique
haplotypes (Fig. 3). Four groups can be considered, one
including the Moroccan samples alone, whose closest
affinity seemed to be with the Iberian populations. In
Table 3 Analysis of molecular variance (AMOVA) measured among po
regions correspond to Iberia, Italy + England and Balkans + Central E
Structure Source of variation
Three regions Among regions
Among populations ⁄ within regions
Within populations
� 2012 Blackwell Publishing Ltd
Iberia, two populations seem to exist, one of which
included haplotypes only present in northern Spain and
Portugal. Those two populations seem to have
expanded only within Iberia and apparently none suc-
ceeded in passing the Pyrenees towards central Europe,
apart from the presence of a Spanish haplotype (47) clo-
sely related to the British ones (which could result from
current gene flow). Britain seems to have been colo-
nized mainly by bats that originated from Italy. There
were possibly a few events that led to bats colonizing
the British mainland, although the majority of the hapl-
otypes present resulted from a population expansion of
haplotypes currently represented by those from the Isle
of Wight in the English Channel (haplotype 31). The
fourth group mainly comprised Balkan haplotypes and
showed a clear star structure, indicating an expansion
from this region to other parts of the Balkans and cen-
tral Europe (in our study represented by Germany and
Hungary). The dominant haplotype (22) was present in
the Balkans and central Europe, but also in England,
suggesting the existence of secondary colonization
events into Britain.
A Bayesian skyline plot (BSP) showed that the popu-
lation expansion started at the end of the glacial period
(c. 13 000 years before present) achieving a population
maximum by the mid-Holocene (Fig. 4). We were not
able to construct BSPs for each of the four groups
owing to the low number of samples available.
Additionally, the sensitive Fu’s Fs test and Tajima’s D
showed that in Iberia (Fs = )8.11, P < 0.005; D = )2.56,
P < 0.0003) and the Balkans + central Europe (Fs =
)4.85, P < 0.04; D = )2.44, P < 0.0001), a scenario of pop-
ulation expansion is supported, while in Italy + England
(Fs = )1.13, P < 0.36; D = )1.30, P < 0.11), the non-sig-
nificant results indicated no expansion. Moreover, the
negative values obtained in the Fu’s Fs (ranging from
)8.11 to )1.13) statistic suggest that there was an excess
of recent mutations or rare alleles all over Europe.
Current and last glacial maximum predicteddistribution
Model predictions differed significantly among all
model comparisons (P < 0.001, two-tailed Wilcoxon
signed rank test, paired by model), showing that the
pulations of Barbastella barbastellus for its entire range. The three
urope as determined by the analysis of the phylogenetic trees
Variation (%) Fixation indices P value
1.69 CT 0.016 0.38
20.26 SC 0.206 0.000
78.05 ST 0.219 0.000

Fig. 3 Concatenated (cytochrome b and D-loop) minimum
spanning network based on 1437 bp for 115 barbastelle speci-
mens. Clades are delimited by the dashed boxes. The dots con-
necting the network represent missing or unsampled
haplotypes. Circles represent haplotypes, and their size is pro-
portional to the number of specimens; haplotypes are desig-
nated by numbers that correspond to Table S1 (Supporting
information). Sample origin: Bl, Bulgaria; En, England; Gm,
Germany; Gr, Greece; Hr, Hungary; Italy, It; Pt, Portugal; Sl,
Slovenia; Sp, Spain.
Fig. 4. Demographic evolution of the European populations of
barbastelles based on a Bayesian skyline plot from 1437 bp
(cytochrome b and D-loop). Upper and lower lines of the plot
represent the 95% highest posterior density.
2768 H. REBELO ET AL.
potential distribution of Barbastella barbastellus differed
between the present and the LGM, as well as between
the two GCMs for the LGM. Even so, climatic condi-
tions presented in both GCM were much colder and
drier than present. However, this divergence seemed to
have negligible impact on model quality as predictions
had very high accuracy for both training
(AUC = 0.92 ± 0.01) and test data (AUC = 0.87 ± 0.01).
The model for present conditions predicted that
B. barbastellus distribution was mainly concentrated in
central Europe, although the species was also predicted
to occur in the southern European peninsulas, in the
south of England and in the south of Scandinavia, as
well as in a considerable area in the Caucasus (Fig. 5).
The species’ presence was underestimated in south
Iberia and Morocco. This is probably a consequence of
the suboptimal conditions existing in there. Regarding
the LGM distribution, both models almost restricted the
species’ occurrence to the southern European peninsu-
las, although each GCM differed in the extent of the
predictions. Moreover, the locations where the species
could potentially occur during both glacial and intergla-
cial stages were severely delimited by the smaller extent
of the LGM distributions. Nevertheless, it was surpris-
ing to predict only small areas of occupancy during the
present and during the LGM in both Italy and the Bal-
kans, suggesting that bats were forced to move to dif-
ferent areas within refugia between interglacial and
glacial periods. On the other hand, a considerable area
of predicted overlap between current and LGM distri-
butions was found in Iberia, with two unconnected
areas of potential occurrence, one extending from the
north (Pyrenees) to the west (north of Portugal) and
another in the south-east (mainly around the Ebro
basin). Also, of note, the eastern limit of the species’
distribution was predicted to occur in the Caucasus
during both glacial and postglacial periods.
Relevant ecogeographical variables
Average temperature of the coldest quarter was clearly
the most important variable, the one with greatest con-
tribution and most uncorrelated information for the
model (Fig. 6). Precipitation in the driest quarter and
average temperature of the warmest quarter also
showed some relevance. The range of variable values
where B. barbastellus occurs suggests a preference for
milder climates, and avoidance of areas with extreme
temperatures and extreme precipitation values (see
Fig. S1, Supporting information).
Discussion
Refugia localization and postglacial colonizationin B. barbastellus
Results from both past predictive modelling and analy-
sis of molecular data were in agreement, indicating that
the southern European peninsulas, Iberia, Italy and the
Balkans acted as the main glacial refugia for Barbastella
� 2012 Blackwell Publishing Ltd
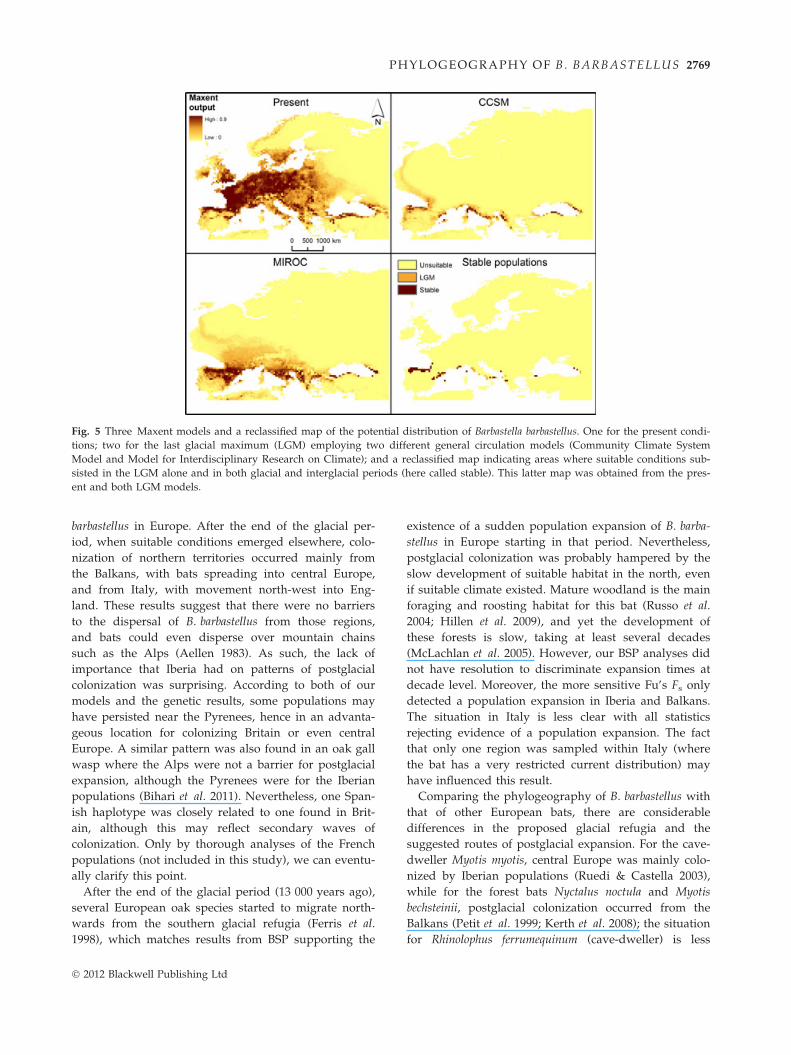
Fig. 5 Three Maxent models and a reclassified map of the potential distribution of Barbastella barbastellus. One for the present condi-
tions; two for the last glacial maximum (LGM) employing two different general circulation models (Community Climate System
Model and Model for Interdisciplinary Research on Climate); and a reclassified map indicating areas where suitable conditions sub-
sisted in the LGM alone and in both glacial and interglacial periods (here called stable). This latter map was obtained from the pres-
ent and both LGM models.
PHYLOGEOGRAPHY OF B. BA RB ASTELLUS 2769
barbastellus in Europe. After the end of the glacial per-
iod, when suitable conditions emerged elsewhere, colo-
nization of northern territories occurred mainly from
the Balkans, with bats spreading into central Europe,
and from Italy, with movement north-west into Eng-
land. These results suggest that there were no barriers
to the dispersal of B. barbastellus from those regions,
and bats could even disperse over mountain chains
such as the Alps (Aellen 1983). As such, the lack of
importance that Iberia had on patterns of postglacial
colonization was surprising. According to both of our
models and the genetic results, some populations may
have persisted near the Pyrenees, hence in an advanta-
geous location for colonizing Britain or even central
Europe. A similar pattern was also found in an oak gall
wasp where the Alps were not a barrier for postglacial
expansion, although the Pyrenees were for the Iberian
populations (Bihari et al. 2011). Nevertheless, one Span-
ish haplotype was closely related to one found in Brit-
ain, although this may reflect secondary waves of
colonization. Only by thorough analyses of the French
populations (not included in this study), we can eventu-
ally clarify this point.
After the end of the glacial period (13 000 years ago),
several European oak species started to migrate north-
wards from the southern glacial refugia (Ferris et al.
1998), which matches results from BSP supporting the
� 2012 Blackwell Publishing Ltd
existence of a sudden population expansion of B. barba-
stellus in Europe starting in that period. Nevertheless,
postglacial colonization was probably hampered by the
slow development of suitable habitat in the north, even
if suitable climate existed. Mature woodland is the main
foraging and roosting habitat for this bat (Russo et al.
2004; Hillen et al. 2009), and yet the development of
these forests is slow, taking at least several decades
(McLachlan et al. 2005). However, our BSP analyses did
not have resolution to discriminate expansion times at
decade level. Moreover, the more sensitive Fu’s Fs only
detected a population expansion in Iberia and Balkans.
The situation in Italy is less clear with all statistics
rejecting evidence of a population expansion. The fact
that only one region was sampled within Italy (where
the bat has a very restricted current distribution) may
have influenced this result.
Comparing the phylogeography of B. barbastellus with
that of other European bats, there are considerable
differences in the proposed glacial refugia and the
suggested routes of postglacial expansion. For the cave-
dweller Myotis myotis, central Europe was mainly colo-
nized by Iberian populations (Ruedi & Castella 2003),
while for the forest bats Nyctalus noctula and Myotis
bechsteinii, postglacial colonization occurred from the
Balkans (Petit et al. 1999; Kerth et al. 2008); the situation
for Rhinolophus ferrumequinum (cave-dweller) is less

Fig. 6 Representation of each variable’s importance in the
Maxent model. The percentage of contribution of each variable
to the model is represented by the black bar, and correspond-
ing values may be found on the left axis. The other two bars
represent the jackknife results for the model with only one var-
iable (‘with’) or with all variables but the analysed one (‘with-
out’). Values for these results are represented in the right axis.
Cold q., average temperature of the coldest quarter (�C); Prec.
d., average precipitation of the driest quarter (mm); Warm q.,
average temperature of the warmest quarter (�C); Temp. r.,
average temperature range (�C); Prec., annual average precipi-
tation (mm); Temp., annual average temperature (�C); Prec. w.,
average precipitation of the wettest quarter (mm).
2770 H. REBELO ET AL.
clear with results pointing to the existence of at least
two major glacial refugia (Rossiter et al. 2007; Flanders
et al. 2009), the Balkans and another undefined western
refugium (Italy and ⁄ or Iberia). Instead, phylogeographic
patterns for B. barbastellus resemble the hedgehog coloni-
zation paradigm proposed by Hewitt (1999, 2000),
where the three southern European peninsulas contrib-
uted to postglacial range expansion, though in this
study Iberia had little or no contribution for northern
and central Europe. The hedgehog pattern is also
matched by phylogeographic inferences about European
oaks, where the three southern European glacial refugia
are recognized to be the source of northern European
populations (Ferris et al. 1998). This may give a possible
explanation of why B. barbastellus exhibited this pattern
because broadleaf woodland is recognized to be the
main foraging and roosting habitat for this bat (Russo
et al. 2004; Hillen et al. 2009).
A number of missing haplotypes were inferred for
the Central European group and especially for Italy
where we found a difference of up to 13 mutations
among haplotypes. These situations may result from
incomplete geographical sampling (Cassens et al. 2003),
and that all the Italian samples originated from a single
region supports this hypothesis. Alternatively, missing
haplotypes may now be extinct. According to LGM dis-
tribution models, Italian and Balkan populations were
forced to shift their ranges between the glacial and
interglacial periods. These were probably stressful
periods for the populations owing to the rapid climatic
changes, especially in the transition between the glacial
to the interglacial period (Bintanja & van de Wal 2008).
Bat populations in these regions could have been
under pressure by occupying forested areas with
unsuitable climatic conditions. Additionally, foraging
habitats and suitable roosts could have been rare in
areas of suitable climate, thus increasing the probability
of extinction for some populations. The cycle of extinc-
tions and founder effects may explain the absence of
certain haplotypes in our network analyses, although
only with more sampling in those areas could this
question be fully addressed. In contrast, Iberian popu-
lations seem to have remained rather stable over time.
The haplotype network shows a complex system with
several homoplasies existing. However, in agreement
with the palaeo-predictive modelling, two groups can
be considered in Iberia, one extending west from the
Pyrenees to the north of Portugal and the other mainly
located in the Ebro basin. The existence of gene flow
during interglacial periods altogether with the isolation
and extinction of some Iberian populations (and haplo-
types) in the glacial phases could explain this intricate
pattern.
Another interesting result points to the species’
occurrence in the Caucasus during both glacial and
postglacial periods. These B. barbastellus populations
probably persisted isolated from the other European
populations, while overlapping with the westernmost
range of its sister species B. leucomelas (Horacek et al.
2000). It would be interesting to analyse samples from
the Caucasus, to clarify whether those populations
belong to a unique evolutionary lineage within B. barba-
stellus, or even if hybridisation with B. leucomelas
occurs.
Niche conservatism and climatic tolerance inB. barbastellus
The congruence in the location of glacial refugia in both
genetic analyses and past predictive modelling suggests
the existence of niche conservatism in B. barbastellus, at
least through the late Pleistocene (Waltari et al. 2007).
Furthermore, fossil records for the late Pleistocene are
largely in agreement with our models (Rydell & Bog-
danowicz 1997), with a match between the location of
model’s high suitability values and the areas where
B. barbastellus fossils occur. Examples of that agreement
are the existence of late Pleistocene fossils in southern
Spain where the species is currently absent (Sevilla
1989) and in Sicily (Kotsakis & Petronio 1980). Hence,
the species was distributed in the past in areas where
� 2012 Blackwell Publishing Ltd
PHYLOGEOGRAPHY OF B. BA RB ASTELLUS 2771
the range of climatic conditions overlapped (at least
partially) with current ones (Peterson et al. 1999), add-
ing this species to a number of animal and plant species
where the absence of niche evolution has been demon-
strated (Peterson et al. 1999; Martınez-Meyer et al. 2004;
Depraz et al. 2008; Cordellier & Pfenninger 2009; Peter-
son 2011). This has clear implications for conservation
because our results show that the species limits its dis-
persal to a particular climatic regime (Wiens & Graham
2005). Therefore, when ecological conditions change to
those outside the species’ ecological tolerance, its popu-
lations will have to shift locations or extinction will
become probable (Parmesan & Yohe 2003). Moreover,
the congruence between model predictions and phylog-
eographic analyses strengthens the reliability of future
climate change predictions (Wiens & Graham 2005). In
fact, it has been proposed that B. barbastellus may face a
severe threat irrespective of the climate change scenario
considered (Rebelo et al. 2010).
It can be argued whether using climatic variables
alone in predictive modelling accurately predicts a spe-
cies’ distribution, because biotic interactions so relevant
for species survival such as competition, predation or
availability of suitable habitat were not considered.
Nevertheless, at a continental scale such as the one
employed in this study, abiotic variables seem to deli-
mit large-scale distributions with better accuracy than
biotic variables (Pearson & Dawson 2003).
The predicted current distribution showed a large
extent of high suitability area for B. barbastellus without
many discontinuities. However, fragmentation within
its range may not be detected by the models because
the employed resolution of c. 55 km does not permit to
draw conclusions at a local scale. As such, within a
pixel of predicted occurrence, the bat may not exist all
over its extent (Pearson & Dawson 2003).
The extreme temperature values (minimum and
maximum), together with water availability in the
summer, were the most relevant factors in delimiting
the geographic range of B. barbastellus. These variables
are acknowledged to have great relevance for explain-
ing the geographical ranges of European bat species
(Ulrich et al. 2007; Rebelo et al. 2010) and also have a
great influence on bat physiology (Webb et al. 1995).
Climatic characteristics can affect the survival of bats
because their physiology is adversely affected when
temperatures lay outside optimum conditions (Racey
et al. 1987; Webb et al. 1995; Adams & Hayes 2008).
Furthermore, insects, or more specifically moths, are
the main prey of B. barbastellus (Sierro 1999) and are
also affected by climatic conditions. Areas with
extreme temperatures and ⁄ or dry climate will probably
have a lower abundance and diversity of insects (Pere-
ira et al. 2002).
� 2012 Blackwell Publishing Ltd
Implications for conservation
Our results have several direct consequences for the
conservation of the rare B. barbastellus. First, we propose
the existence of four major conservation units, Morocco
(although this conclusion is limited by the analysis of
two samples), Iberia, Italy through to England, and the
Balkans through to central and eastern Europe. Second,
because we found high haplotype diversities in all of
the sampled regions, where all populations carry unique
gene pools, hence with need of protection. This pattern
suggests that genetic drift, rather than gene flow, is the
most relevant factor in shaping the spatial distribution
of genetic variability (Knowles et al. 2007). An excep-
tionally high number of unique haplotypes were found
in Iberia, thus these populations should be protected
with particular care. Also of note, we found high genetic
diversity on the Isle of Wight (off southern England),
although the majority of the analysed English samples
came from that area, thus limiting interpretations about
the extent of genetic diversity in England. Nevertheless,
its populations are linked to the major colonization
event that resulted in bats colonizing mainland England.
To lose those populations could compromise an impor-
tant source of genetic diversity in that region. Finally,
despite B. barbastellus being dependent upon mature
deciduous forests, their foraging behaviour varies con-
siderably over different landscapes and hence countries.
For example, the average home range of individual
B. barbastellus in one area of Germany is reported to be
403 ha (Hillen et al. 2009), while in one region of south-
ern England, it reaches 982 ha (Ian Davidson-Watts, per-
sonal communication). This means that although
deciduous forests are the primary habitat to preserve,
the area needed for the effective conservation of B. bar-
bastellus would require prior knowledge of the local
population needs and foraging behaviour over the dif-
ferent seasons of the year, thus stressing the develop-
ment of local studies for an effective conservation
policy.
Acknowledgements
We thank Susana Lopes and Raquel Vasconcelos for the help
in the laboratory work. Jose Ferreira provided support in the
molecular analyses. We are also grateful to our colleagues who
sent samples for genetic analysis: Christian Dietz, Boyan Pet-
rov, Alenkja Petrinjak, Primoz Presetnik, Gabor Csorba, Gerald
Kerth, Ian Davidson-Watts, Matt Zeale, Stephen Rossiter, Javier
Juste, Sofia Lourenco, Patrıcia Salgueiro, Tiago Marques, Anto-
nio Mira and Jorge Palmeirim. Eric Waltari also provided help
on accessing the LGM climatic layers. Lastly, we thank three
anonymous reviewers for their constructive and useful com-
ments. HR, EF and JCB were funded by Fundacao para a Cien-
cia e Tecnologia (grant SFRH ⁄ BPD ⁄ 65418 ⁄ 2009 and contracts
Programme Ciencia 2008 and 2007, respectively).

2772 H. REBELO ET AL.
References
Adams RA, Hayes MA (2008) Water availability and successful
lactation by bats as related to climate change in arid regions
of western North America. Journal of Animal Ecology, 77,
1115–1121.
Aellen V (1983) Migration des chauves-souris en Suisse. Bonner
zoologische Beitrage, 34, 3–27.
Avise JC (2000) Phylogeography: The History and Formation of
Species. Harvard University Press, Cambridge and London.
Bihari P, Sipos B, Melika G et al. (2011) Western Palaearctic
phylogeography of an inquiline oak gall wasp, Synergus
umbraculus. Biological Journal of the Linnean Society, 102, 750–
764.
Bintanja R, van de Wal RSW (2008) North American ice-sheet
dynamics and the onset of 100,000-year glacial cycles. Nature,
454, 869–872.
Brotons L, Thuiller W, Araujo MB, Hirzel AH (2004) Presence-
absence versus presence-only modelling methods for
predicting bird habitat suitability. Ecography, 27, 437–448.
Cassens I, van Waerebeek K, Best B et al. (2003) The
phylogeography of dusky dolphins (Lagenorhynchus
obscurus): a critical examination of network methods and
rooting procedures. Molecular Ecology, 12, 1781–1792.
Castella V, Ruedi M, Excoffier L (2001) Contrasted patterns of
mitochondrial and nuclear structure among nursery colonies
of the bat Myotis myotis. Journal of Evolutionary Biology, 14,
708–720.
Clement M, Posada D, Crandall KA (2000) TCS: a computer
program to estimate gene genealogies. Molecular Ecology, 9,
1657–1659.
Cordellier M, Pfenninger M (2009) Inferring the past to predict
the future: climate modelling predictions and phylogeography
for the freshwater gastropod Radix balthica (Pulmonata,
Basommatophora). Molecular Ecology, 18, 534–544.
Depraz A, Cordellier M, Hausser J, Pfenninger M (2008)
Postglacial recolonization at a snail’s pace (Trochulus
villosus): confronting competing refugia hypotheses using
model selection. Molecular Ecology, 17, 2449–2462.
Drummond AJ, Rambaut A (2007) BEAST: Bayesian
evolutionary analysis by sampling trees. BMC Evolutionary
Biology, 7, 214.
Drummond AJ, Rambaut A, Shapiro B, Pybus OG (2005)
Bayesian coalescent inference of past population dynamics
from molecular sequences. Molecular Biology and Evolution,
22, 1185–1192.
Elith J, Graham CH, Anderson RP et al. (2006) Novel methods
improve prediction of species’ distributions from occurrence
data. Ecography, 29, 129–151.
Excoffier L, Laval G, Schneider S (2006) Arlequin Ver 3.1: An
Integrated Software Package for Population Genetics Data
Analysis. Computational and Molecular Population Genetics
Laboratory, Institute of Zoology, University of Berne, Berne.
Ferris C, King RA, Vainola R, Hewitt GM (1998) Chloroplast
DNA recognises three refugial sources of European oaks and
suggests independent eastern and western immigrations to
Finland. Heredity, 80, 584–593.
Fielding AH, Bell JF (1997) A review of methods for
the assessment of prediction errors in conservation
presence ⁄ absence models. Environmental Conservation, 24, 38–
49.
Flanders J, Jones G, Benda P et al. (2009) Phylogeography of
the greater horseshoe bat, Rhinolophus ferrumequinum:
contrasting results from mitochondrial and microsatellite
data. Molecular Ecology, 18, 306–318.
Fu Y-X (1997) Statistical tests of neutrality of mutations against
population growth, hitchhiking and background selection.
Genetics, 147, 915–925.
Fumagalli M, Taberlet P, Favre L, Hausser J (1996) Origin and
evolution of homologous repeated sequences in the
mitochondrial DNA control region of shrews. Molecular
Biology and Evolution, 13, 31–46.
Gomez A, Lunt D (2007) Refugia within a refugia: patterns of
phylogeographic concordance in the Iberian Peninsula. In:
Phylogeography of Southern European Refugia (eds Weiss S and
Ferrand N), pp. 155–188. Springer, Dordrecht.
Grill A, Amori G, Aloise G et al. (2009) Molecular
phylogeography of European Sciurus vulgaris: refuge within
refugia? Molecular Ecology, 18, 2687–2699.
Hall TA (1999) BioEdit: a user-friendly biological sequence
alignment editor and analysis program for Windows
95 ⁄ 98 ⁄ NT. Nucleic Acids Symposium Series, 41, 95–99.
Hernandez PA, Graham CH, Master LL, Albert DL (2006) The
effect of sample size and species characteristics on
performance of different species distribution modelling
methods. Ecography, 29, 773–785.
Hewitt GM (1999) Post-glacial re-colonization of European
biota. Biological Journal of the Linnean Society, 68, 87–112.
Hewitt GM (2000) The genetic legacy of the Quaternary ice
ages. Nature, 405, 907–913.
Hijmans RJ, Cameron SE, Parra JL et al. (2005) Very high
resolution interpolated climate surfaces for global land areas.
International Journal of Climatology, 25, 1965–1978.
Hillen J, Kiefer A, Veith M (2009) Foraging site fidelity shapes
the spatial organisation of a population of female western
barbastelle bats. Biological Conservation, 142, 817–823.
Horacek I, Hanak V, Gaisler J (2000) Bats of the Palaeartic
region: a taxonomic and biogeographic review. Proceedings of
theVIIIth EBRS, 1, 11–157.
Hugall A, Moritz C, Moussalli A, Stanisic J (2002) Reconciling
paleodistribution models and comparative phylogeography
in the Wet Tropics rainforest land snail Gnarosophia
bellendenkerensis (Brazier 1875). Proceedings of the National
Academy of Sciences of the USA, 99, 6112–6117.
IUCN (2010) IUCN Red List of Threatened Species, Version 2010.3.
Available from http://www.iucnredlist.org. accessed on 6
October 2010.
Juste J, Ibanez C, Trujillo D, Munoz J, Ruedi M (2003)
Phylogeography of barbastelle bats (Barbastella barbastellus) in
the western Mediterranean and the Canary islands. Acta
Chiropterologica, 5, 165–175.
Kerth G, Petrov B, Conti A et al. (2008) Communally breeding
Bechstein’s bats have a stable social system that is
independent from the postglacial history and location of the
populations. Molecular Ecology, 17, 2368–2381.
Knowles LL, Carstens BC, Keat ML (2007) Coupling genetic
and ecological-niche models to examine how past population
distributions contribute to divergence. Current Biology, 17,
940–946.
Kotsakis T, Petronio C (1980) I chirotteri del Pleistocene
superiore della grotta di Spinagallo (Siracusa, Sicilia).
Boletino del Servizio Geologico d’Italia, 101, 49–76.
� 2012 Blackwell Publishing Ltd

PHYLOGEOGRAPHY OF B. BA RB ASTELLUS 2773
Li G, Jones G, Rossiter S et al. (2006) Phylogenetics of small
horseshoe bats from East Asia based on mitochondrial DNA
sequence variation. Journal of Mammalogy, 87, 1234–1240.
Librado P, Rozas J (2009) DnaSP v5: a software for
comprehensive analysis of DNA polymorphism data.
Bioinformatics Applications Note, 25, 1451–1452.
Liu C, Berry PM, Dawson TP, Pearson RG (2005) Selecting
thresholds of occurrence in the prediction of species
distributions. Ecography, 28, 385–393.
Losos JB (2008) Phylogenetic niche conservatism, phylogenetic
signal and the relationship between phylogenetic relatedness
and ecological similarity among species. Ecology Letters, 11,
995–1007.
Martınez-Meyer E, Peterson AT, Hargroves WW (2004)
Ecological niches as stable distributional constraints on
mammal species, with implications for Pleistocene
extinctions and climate change projections for biodiversity.
Global Ecology & Biogeography, 13, 305–314.
McLachlan JS, Clark JS, Manis PS (2005) Molecular indicators
of tree migration capacity under rapid climate change.
Ecology, 86, 2088–2098.
Moussalli A, Moritz C, Williams SE, Carnaval AC (2009)
Variable responses of skinks to a common history of
rainforest fluctuation: concordance between phylogeography
and palaeo-distribution models. Molecular Ecology, 18, 483–
499.
Parmesan C, Yohe G (2003) A globally coherent fingerprint of
climate change impacts across natural systems. Nature, 421,
37–42.
Pearson RG, Dawson TP (2003) Predicting the impacts of
climate change on the distribution of species: are bioclimate
envelope models useful? Global Ecology & Biogeography, 12,
361–371.
Pereira MJ, Rebelo H, Rainho A, Palmeirim JM (2002) Prey
selection by Myotis myotis. Acta Chiropterologica, 2, 183–193.
Peterson At (2011) Ecological niche conservatism: a time-
structured review of evidence. Journal of Biogeography, 38,
817–827.
Peterson AT, Soberon J, Sanchez-Cordero V (1999)
Conservatism of ecological niches in evolutionary time.
Science, 285, 1265–1267.
Petit E, Excoffier L, Mayer F (1999) No evidence of bottleneck
in the postglacial recolonization of Europe by the noctule bat
(Nyctalus noctula). Evolution, 53, 1247–1258.
Phillips SJ, Anderson RP, Schapire RE (2006) Maximum
entropy modeling of species geographic distributions.
Ecological Modelling, 190, 231–259.
Posada D (2008) jModelTest: phylogenetic model averaging.
Molecular Biology and Evolution, 25, 1253–1256.
Racey PA, Speakman JR, Swift SM (1987) Reproductive
adaptations of heterothermic bats at the northern borders of
their distribution. Suid-Afrikaanse Tydskrif vir Wetenskap, 83,
635–638.
Raes N, Roos MC, Slik JWF, van Loon EE, ter Steege H (2009)
Botanical richness and endemicity patterns of Borneo
derived from species distribution models. Ecography, 32, 180–
192.
Rebelo H, Jones G (2010) Ground validation of presence-only
modelling with rare species: a case study on barbastelles
Barbastella barbastellus (Chiroptera: Vespertilionidae). Journal
of Applied Ecology, 47, 410–420.
� 2012 Blackwell Publishing Ltd
Rebelo H, Tarroso P, Jones G (2010) Predicted impact of
climate change on European bats in relation to their
biogeographic patterns. Global Change Biology, 16, 561–576.
Riede K (2001) The Global Register of Migratory Species Database,
GIS Maps and Threat Analysis. Landwirtschaftsverlag,
Munster.
Rossiter S, Benda P, Dietz C, Zhang S, Jones G (2007)
Rangewide phylogeography in the greater horseshoe bat
inferred from microsatellites: implications for population
history, taxonomy and conservation. Molecular Ecology, 16,
4699–4714.
Ruedi M, Castella V (2003) Genetic consequences of the ice
ages on nurseries of the bat Myotis myotis: a mitochondrial
and nuclear survey. Molecular Ecology, 12, 1527–1540.
Russell AL, Ranivo J, Palkovaks EP, Goodman SM, Yoder AD
(2007) Working at the interface of phylogenetics and
population genetics: a biogeographical analysis of Triaenops
spp. (Chiroptera: Hipposideridae). Molecular Ecology, 16, 839–
851.
Russo D, Cistrone L, Jones G, Mazzoleni S (2004) Roost
selection by barbastelle bats (Barbastella barbastellus,
Chiroptera: Vespertilionidae) in beech woodlands of central
Italy: consequences for conservation. Biological Conservation,
117, 73–81.
Rydell J, Bogdanowicz W (1997) Barbastella barbastellus.
Mammalian Species, 557, 1–8.
Sevilla P (1989) Quaternary fauna of bats in Spain:
Paleoecologic and biogeographic interest. In: European Bat
Research 1987 (eds Hanak V, Horacek I and Gaisler J), pp.
349–355. Charles University Press, Praha.
Sierro A (1999) Habitat selection by barbastelle bats (Barbastella
barbastellus) in the Swiss Alps (Valais). Journal of Zoology
(London), 248, 429–432.
Suarez-Seoane S, Morena ELG, Prieto MBM, Osborne PE,
Juana E (2008) Maximum entropy niche-based modelling of
seasonal changes in little bustard (Tetrax tetrax) distribution.
Ecological Modelling, 219, 17–29.
Swofford DL (2002) PAUP*: Phylogenetic Analysis Using
Parsimony (* and Other Methods). Sinauer Associates,
Sunderland, Massachusetts.
Taberlet P, Fumagalli M, Wust-Saucy A, Coisson J-F (1998)
Comparative phylogeography and postglacial colonization
routes in Europe. Molecular Ecology, 7, 453–464.
Tajima F (1989) Statistical method for testing the neutral
mutation hypothesis by DNA polymorphism. Genetics, 123,
585–595.
Ulrich W, Sachanowicz K, Michalak M (2007) Environmental
correlates of species richness of European bats (Mammalia:
Chiroptera). Acta Chiropterologica, 9, 347–360.
Urbanczyk Z (1999) Barbastella barbastellus. In: The Atlas of
European Mammals (eds Mitchell-Jones AJ, Amori G,
Bogdanowicz W et al.), pp. 146–147. Academic press,
London.
Waltari E, Hijmans RJ, Peterson AT et al. (2007) Locating
Pleistocene refugia: comparing phylogeographic and
ecological niche model predictions. PLoS One, 2, e563.
Webb PI, Speakman JR, Racey PA (1995) Evaporative water
loss in two sympatric species of vespertilionid bat, Plecotus
auritus and Myotis daubentonii: relation to foraging mode and
implications for roost site selection. Journal of Zoology, 235,
269–278.
2774 H. REBELO ET AL.
Weiss S, Ferrand N (2007) Phylogeography of Southern European
Refugia. Springer, Dordrecht.
Wiens JJ, Graham CH (2005) Niche conservatism: integrating
evolution, ecology, and conservation biology. Annual Review
of Ecology, Evolution and Systematics, 36, 519–539.
Worthington Wilmer J, Hall L, Barrat E, Moritz C (1999)
Genetic structure and male-mediated gene flow in the Ghost
bat (Macroderma gigas). Evolution, 53, 1582–1591.
Zhang J-S, Han N-J, Jones G et al. (2007) A new species of
Barbastella (Chiroptera: Vespertilionidae) from north China.
Journal of Mammalogy, 88, 1393–1403.
This research forms part of H.R.’s PhD focusing on the integra-
tion of molecular data with distribution modelling. E.F. studies
focus on conservation genetics and evolution. J.C.B. has been
researching the spatial patterns of biodiversity and biogeogra-
phy of several taxa in the Sahara. G.J., D.R. and L.C. study bat
ecology, conservation and evolution. N.F. is interested in a
variety of questions in evolutionary and conservation genetics,
with an emphasis on the genetic architecture of hybrid zones
and the processes of speciation.
Data accessibility
DNA sequences: GenBank Accessions JQ683163-JQ683212.
Sampling location and respective haplotype sequences
uploaded as online supplementary material.
Supporting information
Additional supporting information may be found in the online
version of this article.
Fig. S1 Response curves obtained in Maxent for the environ-
mental factors related to Barbastella barbastellus presence.
Table S1 Polymorphisms for the concatenated sequences.
Table S2 Indication of samples location and respective Gen-
Bank Accession no. for the haplotype sequence.
Please note: Wiley-Blackwell are not responsible for the content
or functionality of any supporting information supplied by the
authors. Any queries (other than missing material) should be
directed to the corresponding author for the article.
� 2012 Blackwell Publishing Ltd
Related Documents