Welcome message from author
This document is posted to help you gain knowledge. Please leave a comment to let me know what you think about it! Share it to your friends and learn new things together.
Transcript


PostmodernInvestment

Founded in 1807, John Wiley & Sons is the oldest independent publishingcompany in the United States. With offices in North America, Europe,Australia and Asia, Wiley is globally committed to developing and marketingprint and electronic products and services for our customers’ professionaland personal knowledge and understanding.
The Wiley Finance series contains books written specifically for financeand investment professionals as well as sophisticated individual investorsand their financial advisors. Book topics range from portfolio manage-ment to e-commerce, risk management, financial engineering, valuation andfinancial instrument analysis, as well as much more.
For a list of available titles, visit our Web site at www.WileyFinance.com.
PostmodernInvestment
Facts and Fallacies of GrowingWealth in a Multi-Asset World
GARRY B. CROWDERTHOMAS SCHNEEWEIS
HOSSEIN KAZEMI
John Wiley & Sons, Inc.

Cover Design: Leiva-SposatoCover Photograph: c© Entienou / iStockphoto
Copyright c© 2013 by Garry B. Crowder, Thomas Schneeweis, and Hossein Kazemi.All rights reserved.
Published by John Wiley & Sons, Inc., Hoboken, New Jersey.Published simultaneously in Canada.
No part of this publication may be reproduced, stored in a retrieval system, or transmitted inany form or by any means, electronic, mechanical, photocopying, recording, scanning, orotherwise, except as permitted under Section 107 or 108 of the 1976 United States CopyrightAct, without either the prior written permission of the Publisher, or authorization throughpayment of the appropriate per-copy fee to the Copyright Clearance Center, Inc., 222Rosewood Drive, Danvers, MA 01923, (978) 750-8400, fax (978) 646-8600, or on the Webat www.copyright.com. Requests to the Publisher for permission should be addressed to thePermissions Department, John Wiley & Sons, Inc., 111 River Street, Hoboken, NJ 07030,(201) 748-6011, fax (201) 748-6008, or online at http://www.wiley.com/go/permissions.
Limit of Liability/Disclaimer of Warranty: While the publisher and author have used theirbest efforts in preparing this book, they make no representations or warranties with respect tothe accuracy or completeness of the contents of this book and specifically disclaim any impliedwarranties of merchantability or fitness for a particular purpose. No warranty may be createdor extended by sales representatives or written sales materials. The advice and strategiescontained herein may not be suitable for your situation. You should consult with aprofessional where appropriate. Neither the publisher nor author shall be liable for any loss ofprofit or any other commercial damages, including but not limited to special, incidental,consequential, or other damages.
For general information on our other products and services or for technical support, pleasecontact our Customer Care Department within the United States at (800) 762-2974, outsidethe United States at (317) 572-3993 or fax (317) 572-4002.
Wiley publishes in a variety of print and electronic formats and by print-on-demand. Somematerial included with standard print versions of this book may not be included in e-books orin print-on-demand. If this book refers to media such as a CD or DVD that is not included inthe version you purchased, you may download this material at http://booksupport.wiley.com.For more information about Wiley products, visit www.wiley.com.
Library of Congress Cataloging-in-Publication Data:
Crowder, Garry B., 1954—Postmodern investment : facts and fallacies of growing wealth in a multi-asset world /
Garry B. Crowder, Thomas Schneeweis, Hossein Kazemi.p. cm.
Includes bibliographical references and index.ISBN 978-1-118-43223-5 (cloth); ISBN 978-1-118-48383-1 (ebk);ISBN 978-1-118-48384-8 (cloth); ISBN 978-1-118-48385-5 (ebk)
1. Investments. 2. Portfolio management. I. Schneeweis, Thomas. II. Kazemi, Hossein,1954- III. Title.
HG4521.C869 2013332.6—dc23
2012030608
Printed in the United States of America
10 9 8 7 6 5 4 3 2 1

To Jill—Garry B. Crowder
To Alison—Thomas Schneeweis
To Mahnaz and Maziar—Hossein Kazemi

Contents
Preface xiiiThe Core Concepts in Managing Wealth xivPostmodern Investment xviHow the Chapters Are Structured xviiiAs You Begin xix
Acknowledgments xxi
CHAPTER 1Investment Ideas: Evolution or Revolution? 1
In the Beginning 4The Beginning of Information Transparency 11New Markets, New Products, and the Evolution
of Modern Investment 17New Opportunities Create New Risks 18The Market Is Not Efficient for Everyone 19A Personal View of Modern Investment 21What Every Investor Should Know 23Myths and Misconceptions of Modern Investment 24
CHAPTER 2Equity and Fixed Income: The Traditional Pair 31
A Brief Review 35Equity and Fixed-Income Styles and Benchmarks 36Basic Sources of Risk and Return 36Performance: Fact and Fiction 38Return and Risk Characteristics 39The Myth of Average: Equity and Fixed-Income Return
in Extreme Markets 43Annual Performance 46Performance in 2008 46Special Issues: Making Sense Out of Traditional Stock
and Bond Indices 46
vii
viii CONTENTS
A Personal View of Equity and Fixed-Income Analysis 52What Every Investor Should Know 55Myths and Misconceptions of Equity and Fixed Income 56
CHAPTER 3Hedge Funds: An Absolute Return Answer? 63
What Are Hedge Funds? 68Investing in Hedge Funds 69Hedge Fund Styles and Benchmarks 69Basic Sources of Return and Risk 71Performance: Fact and Fiction 73Return and Risk Characteristics 74The Myth of Average: Hedge Fund Index Return in Extreme
Markets 78Hedge Fund Annual Performance 80Performance in 2008 85Making Sense Out of Hedge Fund Indices 85Making Sense Out of Alternative Approaches to Investing
in Hedge Funds 87A Personal View: Issues in Hedge Fund Investment 91What Every Investor Should Know 95Myths and Misconceptions of Hedge Funds 96
CHAPTER 4Managed Futures: A Zero-Sum Game? 101
What Are Managed Futures? 104Investing in Managed Futures 105Managed Futures Styles and Benchmarks 106Basic Sources of Return and Risk 107Performance: Fact and Fiction 108Return and Risk Characteristics 109The Myth of Average: Commodity Trading Advisor Index
Return in Extreme Markets 113Commodity Trading Advisor Annual Performance 115Performance in 2008 120Making Sense of Commodity Trading Advisor Performance 120Making Sense Out of Alternative Approaches to Investing
in Commodity Trading Advisors 124Commodity Trading Advisor Investable Indices 125A Personal View: Issues in Managed Futures Investment 126
Contents ix
What Every Investor Should Know 127Myths and Misconceptions of Managed Futures 128
CHAPTER 5Commodities: An Ever-Changing Balance 133
Investing in Commodities 137Commodity Styles and Benchmarks 139Basic Sources of Return and Risk 140Performance: Fact and Fiction 142Return and Risk Characteristics 142The Myth of Average: Commodity Index Return in Extreme
Markets 146Commodity Annual Performance 148Commodity Subsector Index: Annual Commodity
Performance 154Performance in 2008 154Special Issues in Commodity Investment 155Commodities as an Inflation Hedge 156Comparison between Direct and Equity-Based Commodity
Investment 158Comparison between Equity-Based Mutual Fund and
Exchange-Traded Fund Commodity Investment 159A Personal View: Issues in Commodity Investment 160What Every Investor Should Know 162Myths and Misconceptions of Commodity Investment 163
CHAPTER 6Private Equity: Its True Value? 167
Investing in Private Equity 171Private Equity Styles and Benchmarks 174Basic Sources of Risk and Return 176Performance: Fact and Fiction 176Return and Risk Characteristics 177The Myth of Average: Private Equity Index Return
in Extreme Markets 180Private Equity Annual Performance 181Performance in 2008 187Issues in Private Equity Investment 187Private Equity Indices 188Alternatives to Investment in Private Equity 190A Personal View: Issues in Private Equity Investment 193
x CONTENTS
What Every Investor Should Know 194Myths and Misconceptions of Private Equity 196
CHAPTER 7Real Estate: The New World 199
Investing in Real Estate 203Housing or Residential Real Estate Properties 203Private and Public Commercial Real Estate Debt 205Real Estate Styles and Benchmarks 205Basic Sources of Risk and Return 207Performance: Fact and Fiction 208Return and Risk Characteristics 209The Myth of Average: Real Estate Investment Trust Index
Return in Extreme Markets 212Real Estate Annual Performance 216Performance in 2008 221The U.S. Real Estate ‘‘Bubble’’ and the Subprime Mortgage
Crisis of 2007 to 2010 222Special Issues in Real Estate 223A Personal View: Issues in Real Estate Investment 226What Every Investor Should Know 227Myths and Misconceptions of Real Estate 228
CHAPTER 8Asset Allocation: The Simple Way and the Hard Way 231
The Why and Wherefore of Multiple Asset AllocationApproaches 235
Overview and Limitations of the Existing Asset AllocationProcess 236
Asset Allocation in Traditional and Alternative Investments:A Road Map 237
Return and Risk Attributes and Strategy Allocation 238The Myth of Average: Asset Allocation in Extreme Markets 243Alternative Asset Allocation Approaches 245A Personal View: Issues in Asset Allocation 249What Every Investor Should Know 253Myths and Misconceptions in Asset Allocation 254

Contents xi
CHAPTER 9Risk Management: An Oxymoron 257
Risk Management versus Risk Measurement 259Measures of Risk 264Risk-Adjusted Models 270What a Difference a Day, Week, or Month Makes 274Qualitative Risk Management 276A Personal View: Issues in Risk Management 277What Every Investor Should Know 279Myths and Misconceptions of Risk Management 281
CHAPTER 10In Conclusion 285
Notes 289
Bibliography 295
About the Authors 299
Index 301


Preface
For the most part, significant individual wealth is built on the foundationof the single unadulterated bet with little regard given to risk. Examples
abound in life and literature. This is the domain of the entrepreneur whofocuses on the single product or idea, the oil wildcatter who sinks his or herlast penny into the next well, or the investor who bets it all on the singlestock or market trend. There is no risk-to-reward calculation in this modelonly the pure belief that there can be only one outcome and that loss andrisk lie in not fully engaging with a given path. In contrast, institutionalwealth is built by the steady analysis and implementation of risk and returnmodels. This approach entails an understanding that preservation of thecorpus against inflation is foremost in the accumulation of wealth. Theinstitutional wealth model incorporates concepts such as time horizons,diversification, and asset allocation.
The two models converge when speaking to preservation of wealth withthe single bet approach giving way to reasoned and sustained accumulation.Here, the goal of any large portfolio of assets held by individuals, pensionplans, banks, insurance companies, or any other similar scheme is simplyto earn a rate of return. Earning a rate of return is a relative enterprise.Its success depends on the financial obligations associated with the schemeas well as market variables such as inflation, regulatory policy, investmentcosts, and time horizons. Intrinsic to the concept of earning a rate of returnis an understanding of the risks associated with the scheme’s portfolio.
Recently, we authored a book on asset allocation and the use ofalternative asset classes and made the argument that the inclusion of newfinancial assets such as hedge funds, private equity, structured products, andventure capital vehicles would significantly enhance risk management withinlarge multi-asset portfolios. The starting point of The New Science of AssetAllocation (John Wiley & Sons, 2010) was that asset allocation is a risk-management tool and not, as popularly understood, a return-enhancementstructure. Further, we argued that substantive risk management only existsin a world of transparency where both assets and managers are subjectto an objective pricing mechanism. Within this argument we explored andconcluded that with the exception of a rare few, active managers add littleto the equation of making money.
xiii
xiv PREFACE
Candidly, there is nothing monumental in this assessment. Investorsin traditional assets came to this conclusion long ago. With the creationof meaningful benchmarks such as the Standard & Poor’s (S&P) 500 andthe Russell 2000, investors began to have sufficient market visibility tomeaningfully evaluate the performance and contribution of their activeequity managers. This evaluation exposed a number of key points. First,traditional equity asset managers are primarily index followers and often donot outperform their given benchmarks. Second, there are transformationalmanagers—unicorns—managers who through their judgment and guile areable to add genuine value by understanding the absolute and relative valu-ations of markets, and thus profit on fundamental changes at the margin.Third, there are not enough transformational managers to offset the explicitand hidden costs of investing in those managers who are primary index fol-lowers. Thus, our argument continued, just as traditional asset managementhas moved in part from ‘‘active only’’ to replication or tracking investmentproducts, in the alternative investment area, investors will increasingly cometo realize that indexation or replication is an appropriate substitute for thebroader universe of alternative managers.
The market disturbance of 2007 and 2008 and its immediate aftermathcan only be characterized as a systemic structural failure of acceptedfinancial models as well as their underlying assumptions and beliefs. Thecurrent European sovereign debt crisis is something completely different, yetakin. When coupled, these twin failures of market norms provide a tellingopportunity to reexamine the purpose of the asset allocation decision infinance and the changing nature of risk as we strive to create, manage, andpreserve wealth in an uncertain environment.
What was forgotten or overlooked by sovereigns, investment banks,and their regulatory oversight companions is that the changed and changingnature of risk is at the core of the asset allocation decision. Risk-based assetallocation presupposes the introduction of proven due diligence practiceswhere equal type assets with less-than-perfect common sensitivity to infor-mational changes lead to higher long-term returns than if those assets wereheld individually. Repeatedly, history has shown that many of the benefitsof asset allocation have been lost because of oversimplified approaches anda less-than-rigorous understanding of the risks and sources of return ofdiffering asset classes. While this is particularly true of ‘‘new’’ asset classessuch as hedge funds, private equity, real estate, commodities, and structuredproducts, it remains a constant within traditional asset classes as well.
THE CORE CONCEPTS IN MANAGING WEALTH
At its core, risk management and asset allocation require asset managers andtheir investors to jointly appreciate the fundamental concept that an asset’s,

Preface xv
or a portfolio of assets’, expected return is based on expected risk; andthat investors must actually confront and contemplate the concept of risk.That said, the concept of risk itself is an amorphous and intimidating beastthat most investors, and unfortunately most asset managers, steadfastlyrefuse to embrace as an ordinary extension of a portfolio’s returns—so theconcept is never fully developed or defined. We know that an investor’sdefinition of risk depends a great deal on the perceived stability of his orher environment. We also know that most academics describe risk in termsof standard deviation and beta; and practitioners who typically have littlegenuine insight into their individual investor’s view of the world, and havevirtually no understanding of academic principles, rely on past experience,mathematical models, and company practice in defining risk.
These differing approaches to embracing and understanding risk makea definitive approach to risk measurement and risk-based asset allocationelusive. In addition, since we monitor only what we can measure, mostapproaches to risk measurement within asset allocation continue to relyon simplified measures of security and market risk (alpha and beta) as theprincipal tools governing the determination of fundamental asset risk, aswell as the ability of managers to create value. However, we have learnedthat both the simple world of single-factor risk models (e.g., standarddeviation, skewness, market beta) as well as more complex models ofrisk and return determination, may impede or limit the understanding offundamental risks (e.g., counterparty risk, liquidity). In short, there is risk inassuming that we can define risk and there is risk in the actual models usedfor risk estimation. Numerous examples exist of investors using historicaldata to approximate expected return and risk relationships between assets.This approach ignores the fact that the fundamental trading aspects of theseassets have long changed and that the historical indices used to captureasset return distributions have little to do with the construction of currentindices. The use of such data also dismisses the reality that historicaldata has little, if any, relationship to current expected returns (e.g., usinghistorical fixed-income returns as a basis for future expected return ratherthan correctly using the expected return imbedded in current yield curves isbut one example of faulty use of historical data).
Other examples include the use of historical asset returns reflectedin various asset indices when the underlying investable portfolio that aninvestor holds does not fundamentally reflect the data used in portfolio riskor return estimation. Investors must come to appreciate that the expectedrisk and return of an asset simply reflects the informational sensitivity ofthe fundamental risk factors contained in a portfolio. Research has shownthat hedge funds are not absolute investment vehicles in that they are notable to provide a positive expected return in all market environments.Results show that correlations of the various hedge fund strategies with
xvi PREFACE
traditional stock and bond investments often depend on the security marketsin which hedge fund managers trade. The expected correlation relationshipsof various hedge fund strategies with a range of market factors simplyreflect the expected relationships between equity and bond market factorsand hedge fund returns. Investors now realize that hedge fund returns, or theperformance of any asset, change over time, and as such, the benefits of theasset as a stand-alone investment or as an addition to traditional portfoliosdepend on the unique investment environment of that period. Thus, we canthink of active asset management returns as a combination of manager skilland an underlying return to the strategy of the investment style itself.
The cascading financial crisis over the past five years has raised doubtsas to the fundamental benefits of asset diversification. These doubts aremisplaced. Most financial assets have actually performed as expected duringthis crisis. Given lending and regulatory pressures, equity hedge fundsperformed like low beta equity funds. Similarly, distressed debt fundsperformed like high duration-low liquidity bond funds and managed futures(e.g., commodity trading advisors [CTAs]) offered positive returns in 2008,as liquid futures contracts offered a means to benefit from the negativeprice momentum of many financial assets. Also, the negative returns tocommodities reflected a fundamental reduction in global demand.
In summary, the performance of the assets themselves has not been sur-prising. The genuine surprise has been the lack of fundamental due diligenceand care inherent in many portfolios and investment schemes. Investors havediscovered that their hedge fund managers can only trade within the guide-lines and terms offered by their lenders and that those lenders actually holdfirst priority to the ownership of all monies within the fund. Similarly, theseinvestors discovered that the returns associated with their real estate, privateequity, and venture capital investments had more to do with accountingassumptions and the sponsor fund’s business model than with the actualvalue of the underlying financial assets. Finally, investors discovered thateffective financial engineering presupposes that managers understand thelogical stopping point of models, as well as the need for a transparentmeasurement of the risks associated with the underlying assets within suchmodels. These are all things known, but learned again in retrospect. So onceagain, investors learned that there is no substitute for fundamental researchand due diligence, and that the price of benign negligence is horrific.
POSTMODERN INVESTMENT
A key issue in the art of asset management is the degree to which weshould rely on past data and relationships while making investment deci-sions. Beginning with the work of Markowitz, investment management has
Preface xvii
increasingly become more quantitative. To use these quantitative models,we need accurate estimates of economic relationships, which are typicallyestimated using historical data. How much weight we should assign to thepast is most critical. In understanding our past, we move to the future. Inso doing, we understand that it was the manner in which the assets weredeployed, and not their intrinsic characteristics, that failed. If we acceptthis proposition, then the future course in understanding diversification asa risk-management tool is to fully comprehend the sources of return, corre-lations, and limitations of individual assets as well as how they function intandem. Equally as important is to understand that the world has changedsignificantly since the introduction of the simple stock and bond portfolioas the primary example of adequate portfolio diversification. In an inter-dependent global market we cannot assume that historical relationships orsources of return remain static. In addition, the answer to the benefits ofasset allocation in a multi-asset universe may simply be that ‘‘more is betterthan less.’’ As sources of return evolve, so must nomenclature. Hedge fundsare simply extensions of the proprietary trading desks of investment banks.Structured products are extensions of prepackaged convertible bonds andthe initial public offerings (IPOs) of new enterprises. Many of the limitationsof the current asset allocation approaches and models are that they concen-trate primarily on investment in a limited number of assets and adhere totheir historical definitions. Today, investment in a larger range of investableassets is being addressed through more active asset construction and morefocus on the actual source of return and risk. The increase in potentialinvestment opportunities increases the potential benefit of strategic assetallocation opportunities as well as tactical and dynamic approaches to assetallocation.
There are, of course, numerous approaches to asset allocation and riskmanagement. At the core of asset allocation remain the fundamental set ofdecisions centered on what and how much to buy, given risk preferences.However, as in most questions of asset management, the details are key. Formany portfolios, it is necessary to back into the asset allocation decisionby first determining a reasonable set of investment vehicles with the desiredliquidity and return characteristics. While fundamentally flawed, for most,traditional asset allocation remains the simple choice of mixing variousasset classes to provide a mix of assets that offer increased expected returnfor a particular level of risk tolerance. However, as discussed previously,there is no one definition of risk. Before risk can be managed, the intrinsicrisks impacting a particular investor must be understood as well as somecommon methods of managing them. In many books on asset allocation,the systematic model-driven approach is emphasized. The importance ofmanager discretion is emphasized. Most investors simply fail to take to
xviii PREFACE
heart the axiom that unusual returns can only be obtained from holdingunusual risks or paying for means of managing that risk.
Asset allocation exists in an evolving marketplace. There will certainlybe a series of choices, and each of those choices will have ripple conse-quences. Throughout the recent crisis, extreme events have occurred. Ifhistory is to instruct, we know that the future will provide additional crises,and despite the best efforts of regulatory bodies, investors will lose money.In the recent crisis many mutual fund investors lost 40 to 50 percent oftheir investment because many fund managers were forced by governmentregulation, market order, or contractual dictates to follow a prescribedmarket index. For example, many continued to track the Russell 2000 indexfor which returns fell as volatility increased from 20 to 40 percent. Man-agers could have, and perhaps should have, focused on keeping a constantrisk profile (e.g., 20 percent) in line with original expectations rather thansimply following a prospectus-bound representative index. Alternatively,they could have simply liquidated the portfolios and returned the cash totheir investors, because no meaningful investments existed within the pro-scribed risk parameters. Interestingly, none of the managers we spoke withcontemplated this latter scenario.
As we emerge from this drama, what have we learned? Hopefully,investors have been cautioned to be wary of historical data, historicalthoughts, and historical performance. In other words, we must show littlefear in puncturing myths and their companions. History rarely repeats itselfin the same manner, and one of the failings of modern portfolio and risk-management design, as well as some of the recent academic and quantitativeresearch, is the presumption that it will.
HOW THE CHAPTERS ARE STRUCTURED
As we begin this book’s journey, we want to tell a simple story. Our goalis to provide both a fundamental understanding of the sources of risk andreturn for the primary investment classes and to raise concerns on many ofthe closely held assumptions that lead even the most sophisticated investorsto erroneous asset allocation decisions. In so doing, in Chapter 1, we startwith a brief historical overview of the financial markets. In Chapters 2through 9, we turn our attention to the business models and risk and returncharacteristics of some of the more prevalent traditional and alternativeasset classes and ask and answer questions regarding their true sources ofreturn. We have devoted individual chapters to traditional equity and fixedincome, hedge funds, private equity, managed futures, commodities, andreal estate. Within these chapters, we also explore some of the myths and

Preface xix
misconceptions that have developed over the years regarding the underlyingeconomic behavior of these asset classes and their place in a multi-assetportfolio.
We elected not to comment on the derivatives market or to analyzestructured products and replication scenarios. Replication scenarios was theunderlying thesis of our previous book, The New Science of Asset Allocation,and the two remaining topics—structured products and derivatives—arevast enough to warrant their own book treatment. In any event, we did notbelieve we could do justice to both our analysis of the basic asset classes andthese highly fluid structures in this setting. Finally, this book is designed tooffer suggestions on how investors can protect themselves in this very fluidglobal market environment. As a precursor, we share some generalities.
AS YOU BEGIN
In our explorations, we have learned that financial myths contain enoughplausibility to encourage intellectual laziness; enough truth to support the lie;enough pathos to snare the human condition; and, enough visceral appeal tobe widely embraced. But, more importantly, myths and misconceptions areusually based on rigorously tested past truths. Behavioral science informsus that there is perhaps nothing more difficult to abandon than a testedpast truth. We find this true in all aspects of life. At poker tournaments,the new players, those who have not been tested against the pressure ofwagers made in a public setting, are called ‘‘dead money.’’ They are calledthis because the probability of their winning in a world of professionals isnot remote—it is nonexistent. Our goal is to provide the reader tools to becompetitive.


Acknowledgments
Any individual who has gone through the process of writing a book realizesthat its final success depends on those individuals who read and reread
every chapter, who make sure that deadlines are met, and who constantlykeep everyone on the same path. We would like to offer special thanks tojust those individuals: our editor at John Wiley & Sons, Emilie Herman, andour internal editors, Edward Szado and Patricia Bonnett. Without them,this book would have remained an idea rather than a reality.
xxi


PostmodernInvestment

CHAPTER 1Investment Ideas
Evolution or Revolution?
The universe of investment opportunities can seem infinite. For mostinvestors, modern investment is a complex minefield of multiple assets,
multiple products, and multiple means of investment. Added to this mix arethe vast numbers of firms competing for an investor’s money and the myriad‘‘stories’’ developed to provide credence to their particular approach.
On the surface, it would appear that modern investment should be arelatively straightforward exercise. At its essence, the process should entail(1) selecting securities that are expected to outperform other securities in anasset class, (2) selecting a group of asset classes that will outperform otherasset classes, and (3) deciding on the allocations among asset classes andsecurities that meet an investor’s risk tolerance. Beneath the surface calmof this investment process, however, lie riptides of incomplete information,changing expectations and circumstances, and evolving interrelationships.This state of flux exists both with the investor and the market (the compositeinvestor). An investor’s tolerance for or understanding of risks changes overtime, as does his or her investment horizon and view of the future. Themarket’s tolerance for an estimate of risks also changes over time, if for noother reason than the sources of returns and risk profiles of differing assetsare not static. They change with new information, new interrelationshipswith the economy and other asset classes, and new modes of productdelivery. Thus, it is not surprising that a vast asset management industryhas grown to meet these changing expectations and processes.
The asset management industry is not monolithic. It consists of invest-ment managers, marketers, consultants, accountants, lawyers, television orInternet personalities, journalists, and, of course, the pundit of the day.With so many sources of information and versions of the truth, the questionis and remains, who is an investor to trust? In Lewis Carroll’s Alice inWonderland, Alice asks the Cheshire Cat which path she should take, and
1

2 POSTMODERN INVESTMENT
the cat answers by saying, ‘‘That depends a good deal on where you wantto get to.’’ Alice answers that she does not know, at which the cat answers,‘‘Then it doesn’t matter which way you go.’’ Most investors share thishidden angst, wanting to reach an end that seems so reasonable yet defiesspecific definition. In short, all investors really want is a simple answer tothe basic question, What do I invest in to make as much money as possiblewith as little risk as possible?
This chapter provides a brief history of how major advances in financialtheory and investment practice have attempted to reduce the infinite oppor-tunities of the marketplace into a manageable subset of investable choicesand, in so doing, answer the question of how an investor can make as muchmoney as possible with as little risk as possible. The chapter shows howinvestment processes and attitudes toward those processes have evolved tomeet ever-increasing changes in the economy, regulations, and technologicaladvancements. It offers a review of the range of current and past efforts tounderstand and rationalize the process of security selection, risk manage-ment, and asset allocation. We mentioned earlier that investment managershave a story. We, too, have a story. Throughout this chapter and the courseof the book, we explore the premise that investing always entails knownand unknown risks, and that, irrespective of its source, investors mustalways aggressively question information and the due diligence of others.For example, the first questions an investor should ask about a productare when will it make money and when will it lose money. Surprisingly,far too often the individual selling or advising on the product either doesnot know or refuses to discuss the potential risks of investing alongside thepotential benefits.
In this vein, perhaps one of the greatest myths and misconceptions ofthe investment management industry is that an investor can fully rely on theadvice and recommendations of professionals. In truth, not all professionalsare professional, and even those who are, sometimes lack the resourcesor understanding to fully educate their audience. For the most part, theseindustry professionals are charged with selling a number of different ideas orproducts and may have limited knowledge, limited experiences, and conflictsof interest—all of which require intense examination prior to any reliance ontheir recommendations. The true professionals in this area have a strikingwillingness to investigate. When the right questions are asked, it is notunusual for these professionals to learn the particulars of an investment orinvestment process along with their clients. Investors should take advantageof the absolute, or comparative, advantage of these skilled professionalsand try to avoid the others. How to distinguish between the two is difficult.Investors should understand the world in which these professionals exist

Investment Ideas 3
and try to determine if an advisor has adequate knowledge and limitedconflicts of interest.
As mentioned in the introduction, the authors have had a long historyin the field, as both academics and practitioners. On average, we beganour careers about 30 years ago. When we started, options and futures weremore myth than substance, and private equity, hedge funds, and real estateinvestment products were still the domain of the privileged. What we didhave were a few guiding principles of how to invest. Among those principles,we were taught that unless absolutely necessary, never give up completecontrol of the investment decision to others, and always know when an assetshould either make money or lose money. These two principles have held upwell over the years, especially in markets where the failure of bond ratingsand the failure of multi-asset diversification have greatly tested investorreliance on investment professionals. A third principle, despite or perhapsbecause of the recent failure of investment advice, has singularly withstooda changing and complex world. That third principle is this: In the end,investors are and must be responsible for their own investment decisions.This is not to say that an investor should not look to the advice of others,only that it is imperative to seek transparent and objective validation ofall advice.
The synopsis of our experiences is that in this modern world of invest-ment, change is a constant, adaptation a necessity, and due diligence a given.This view has led the authors to seek transparency in, and an understandingof, the sources of returns of various asset classes and investment productsand to objectively test both the implementation and the boundaries ofprofessional investors’ recommendations.
Given the changing dynamics of modern capital markets, much of mod-ern investment is centered on the methods employed to estimate what mayhappen and alternative approaches to managing the risks surrounding theseevents. Our central thesis is that expected return is a function of the riskstaken within any endeavor and that those risks may not be able to be mea-sured or managed solely through complex systematic quantitative models.Thus, modern investment must focus on a broader context, including thebenefit of an individual’s discretionary oversight, and each investor is respon-sible for accepting the upside potential of an asset as well as its downside.
The story of the evolution of our understanding of that return-to-risktrade-off is one of the underlying themes of this book. The ‘‘evolution’’ partmust be emphasized, as the expected return-to-risk relationship changeswith new information. Exhibit 1.1 offers a summary of some of the majoradvancements in investment management over the past 60 years. Most ofthese advancements are in the areas of how we value investments and how

4 POSTMODERN INVESTMENT
Tracker Products
Behavioral Finance Liability Driven Mgmt.
Options Passive ETFs Active ETFs
Financial Futures
Modern Portfolio Theory Securitization
Index Funds
Multifactor Return Swaps and Structured Products
Portfolio Insurance
CAPM and EMH
1950s 1960s 1970s 1980s 1990s 2000s 2010s
EXHIBIT 1.1 Evolution of Asset Management
new investment alternatives were created. We can only hypothesize whatchanges will happen in the future: but happen, they will.
Much of what we do in investment management is based on understand-ing the trade-offs between the risks and returns of various investable assets,as well as understanding various aspects of the asset allocation process,including alternative approaches to return estimation and risk management.These trade-offs are often conditioned by a belief system built within a his-torical context. Behavioral science has shown that most people have a greatdeal of difficulty moving beyond what has once been tested and learned.However, the world does change. Over time and as additional informationis received, we learn that risk and its measurement are current snapshotsrather than the never-changing map we once thought. Collectively, thosesnapshots describe a road that is bumpy at times but nevertheless revealschanging ideas and processes and enables an investor to find a workablesolution. In this regard, there are no optimal solutions and no easy paths.Within our view, there are only those decisions taken with understandingand care and those that are not. This is the heart of modern investment.
IN THE BEGINNING
Maximizing return and reducing the role of chance in the investment andasset allocation decision have dominated the evolution of investment man-agement. Knowing that it is difficult to forecast return and that all chancecannot be eliminated, investors, industry professionals, and academics havesought ways of understanding the independent elements of the investment
Investment Ideas 5
decision process so as to measure their respective contributions and topredict outcomes. These elements include factors such as asset risk, sourcesof investment return, and the business models integral to determining anddelivering an investment decision. As we begin this analysis, the first orderis to examine the beginning of the market’s attempt to structure and under-stand risk and value, and to trace those efforts to today’s investment toolsand practices. Along the way we will discuss the linkages between andamong theories and models, such as modern portfolio theory, the efficientmarket hypothesis, and the capital asset pricing model. Although importanttools, each has limitations, and in some instances, each has been distortedto reach fairly unsupportable ends. Finally, we conclude this chapter withan overview of the financial markets and the many ways they have imple-mented these models in creating new investment products and supportingdue diligence efforts.
Modern Portfolio Theory and the EfficientMarket Hypothesis
Our starting point is that there are two fundamental directives of securityselection and asset allocation: (1) estimate what may happen, and (2) choosea course of action based on those estimates. These directives have beenat the core of practitioner and academic debate since the early 1950s.What we describe today as the field of modern financial economics andinvestment management was created throughout the 1930s, 1940s, and1950s with the publication of a handful of articles and books. Arguably,the most important were written by Irving Fisher, Benjamin Graham, andDavid Dodd; Franco Modigliani and Merton Miller, and, finally, HarryMarkowitz. Each made important contributions to our understanding offinancial markets, security selection, corporate financial decision making,and portfolio construction. The latter is known as modern portfolio theory(MPT), which for many is synonymous with Markowitz. Today MPT is nowalmost 60 years old, and there have been significant advances in thoughtand practice based on this work. The fundamental concept expressed inMarkowitz’s article is the ability to measure investment risk based onthe comovement of investment returns (i.e., correlations). In other words,Markowitz attempted to provide a scientific foundation for the allocation ofinvestment capital.
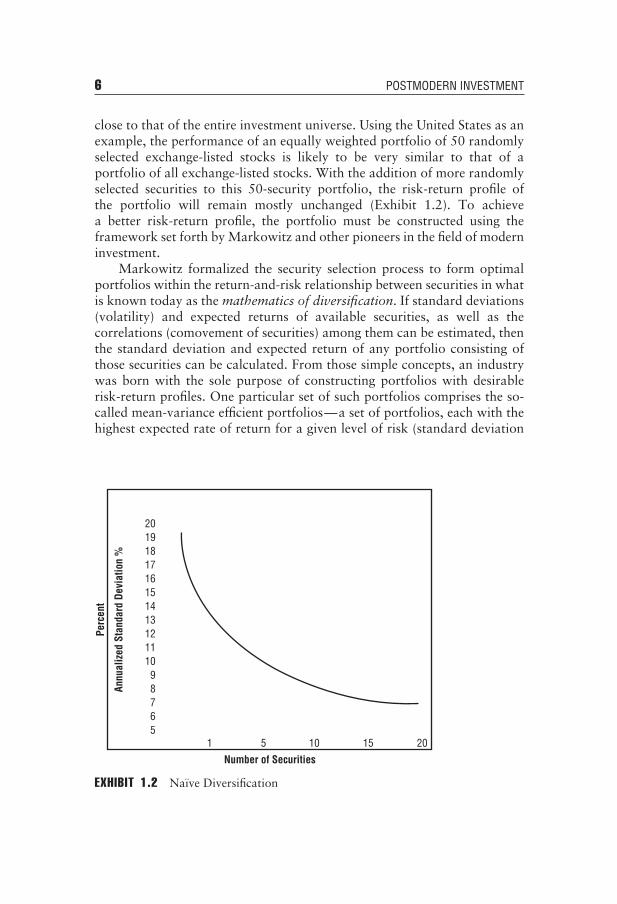
In the absence of such a foundation, an investor will have to followa naıve strategy, in which available capital is allocated among availableassets using a rather ad hoc rule (e.g., equally weighted or equal number ofshares). The goal of naıve diversification is to create a portfolio that does notinclude the entire investment universe but could offer a risk-return profile
6 POSTMODERN INVESTMENT
close to that of the entire investment universe. Using the United States as anexample, the performance of an equally weighted portfolio of 50 randomlyselected exchange-listed stocks is likely to be very similar to that of aportfolio of all exchange-listed stocks. With the addition of more randomlyselected securities to this 50-security portfolio, the risk-return profile ofthe portfolio will remain mostly unchanged (Exhibit 1.2). To achievea better risk-return profile, the portfolio must be constructed using theframework set forth by Markowitz and other pioneers in the field of moderninvestment.
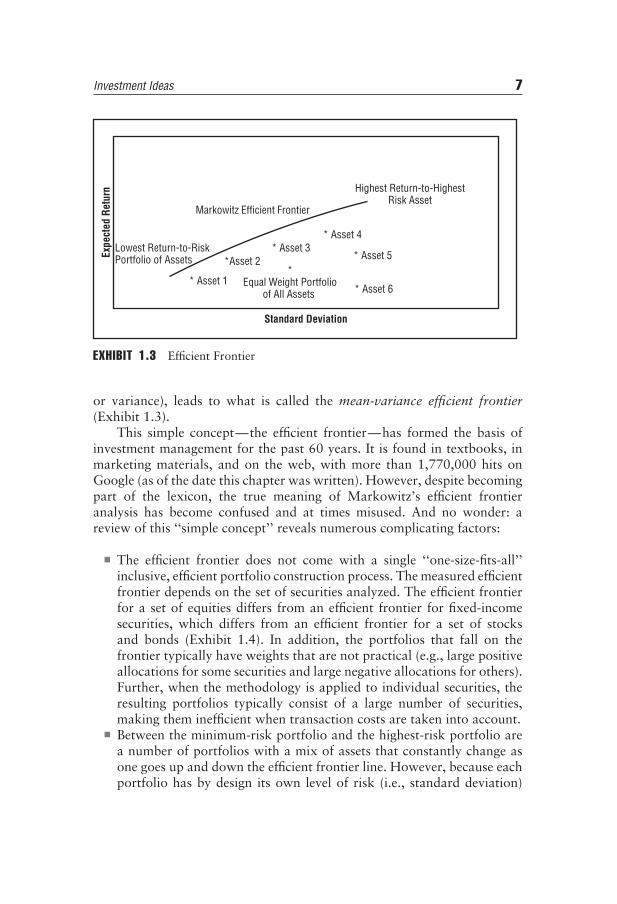
Markowitz formalized the security selection process to form optimalportfolios within the return-and-risk relationship between securities in whatis known today as the mathematics of diversification. If standard deviations(volatility) and expected returns of available securities, as well as thecorrelations (comovement of securities) among them can be estimated, thenthe standard deviation and expected return of any portfolio consisting ofthose securities can be calculated. From those simple concepts, an industrywas born with the sole purpose of constructing portfolios with desirablerisk-return profiles. One particular set of such portfolios comprises the so-called mean-variance efficient portfolios—a set of portfolios, each with thehighest expected rate of return for a given level of risk (standard deviation
201918171615141312111098765
1 5 10 15 20
Annu
aliz
ed S
tand
ard
Devi
atio
n %
Perc
ent
Number of Securities
EXHIBIT 1.2 Naıve Diversification
Investment Ideas 7
Highest Return-to-HighestRisk Asset
Markowitz Efficient Frontier
Expe
cted
Ret
urn
Lowest Return-to-RiskPortfolio of Assets *Asset 2
* Asset 4* Asset 3
* Asset 5
* Asset 1*
Equal Weight Portfolioof All Assets * Asset 6
Standard Deviation
EXHIBIT 1.3 Efficient Frontier
or variance), leads to what is called the mean-variance efficient frontier(Exhibit 1.3).
This simple concept—the efficient frontier—has formed the basis ofinvestment management for the past 60 years. It is found in textbooks, inmarketing materials, and on the web, with more than 1,770,000 hits onGoogle (as of the date this chapter was written). However, despite becomingpart of the lexicon, the true meaning of Markowitz’s efficient frontieranalysis has become confused and at times misused. And no wonder: areview of this ‘‘simple concept’’ reveals numerous complicating factors:
■ The efficient frontier does not come with a single ‘‘one-size-fits-all’’inclusive, efficient portfolio construction process. The measured efficientfrontier depends on the set of securities analyzed. The efficient frontierfor a set of equities differs from an efficient frontier for fixed-incomesecurities, which differs from an efficient frontier for a set of stocksand bonds (Exhibit 1.4). In addition, the portfolios that fall on thefrontier typically have weights that are not practical (e.g., large positiveallocations for some securities and large negative allocations for others).Further, when the methodology is applied to individual securities, theresulting portfolios typically consist of a large number of securities,making them inefficient when transaction costs are taken into account.
■ Between the minimum-risk portfolio and the highest-risk portfolio area number of portfolios with a mix of assets that constantly change asone goes up and down the efficient frontier line. However, because eachportfolio has by design its own level of risk (i.e., standard deviation)

8 POSTMODERN INVESTMENT
for a particular level of expected return, an investor cannot be certainthat the level of expected return will be obtained (if the investor wascertain, there would be no risk). In fact, if an investor wanted tomeasure the expected probability of obtaining a return for a level ofmeasured risk, the result would be more of the efficient cone than theefficient frontier (the higher the risk, the more uncertain the expectedreturn; the lower the risk, the smaller the expected deviation around theexpected return).
To construct these efficient frontier portfolios, a researcher needs anenormous amount of inputs. Risk and returns of all securities must beestimated, as well as their comovements. To obtain reasonable estimates ofthese inputs, there needs to be a fairly long return history associated withthese investments; and even with a substantial history, the estimations areuncertain. Over time, firms simply change. Their capital structure, productmix, governance, and interrelationships with other firms and asset classesare in flux. As such, the estimates of needed inputs contain significantuncertainty. No one really knows what the true standard deviation ofExxon stock is now or will be in the future. And of course no one knows thetrue mean return distribution from which monthly returns on Exxon stockare drawn. Thus, depending on when or how those inputs are estimated, aninvestor would obtain a different set of efficient portfolios. This means theefficient frontier is really a band, or range, within which the true efficientfrontier is likely to lie.
Efficient Frontier (Stocks)
Markowitz Efficient Frontier(All Asset Classes)
Expe
cted
Ret
urn
Efficient Frontier (Stocksand Bonds)
Efficient Frontier (HedgeFunds)Efficient Frontier (Bonds)
Standard Deviation
EXHIBIT 1.4 Efficient Frontiers for Multiple Asset Classes
Investment Ideas 9
Capital Asset Pricing Model
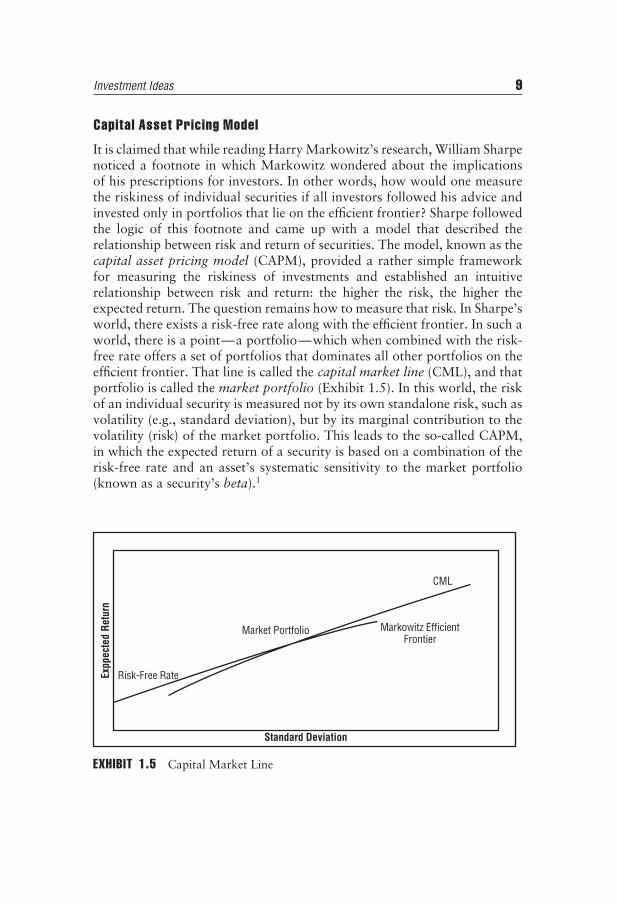
It is claimed that while reading Harry Markowitz’s research, William Sharpenoticed a footnote in which Markowitz wondered about the implicationsof his prescriptions for investors. In other words, how would one measurethe riskiness of individual securities if all investors followed his advice andinvested only in portfolios that lie on the efficient frontier? Sharpe followedthe logic of this footnote and came up with a model that described therelationship between risk and return of securities. The model, known as thecapital asset pricing model (CAPM), provided a rather simple frameworkfor measuring the riskiness of investments and established an intuitiverelationship between risk and return: the higher the risk, the higher theexpected return. The question remains how to measure that risk. In Sharpe’sworld, there exists a risk-free rate along with the efficient frontier. In such aworld, there is a point—a portfolio—which when combined with the risk-free rate offers a set of portfolios that dominates all other portfolios on theefficient frontier. That line is called the capital market line (CML), and thatportfolio is called the market portfolio (Exhibit 1.5). In this world, the riskof an individual security is measured not by its own standalone risk, such asvolatility (e.g., standard deviation), but by its marginal contribution to thevolatility (risk) of the market portfolio. This leads to the so-called CAPM,in which the expected return of a security is based on a combination of therisk-free rate and an asset’s systematic sensitivity to the market portfolio(known as a security’s beta).1
CML
Market Portfolio Markowitz EfficientFrontier
Expp
ecte
d Re
turn
Risk-Free Rate
Standard Deviation
EXHIBIT 1.5 Capital Market Line
10 POSTMODERN INVESTMENT
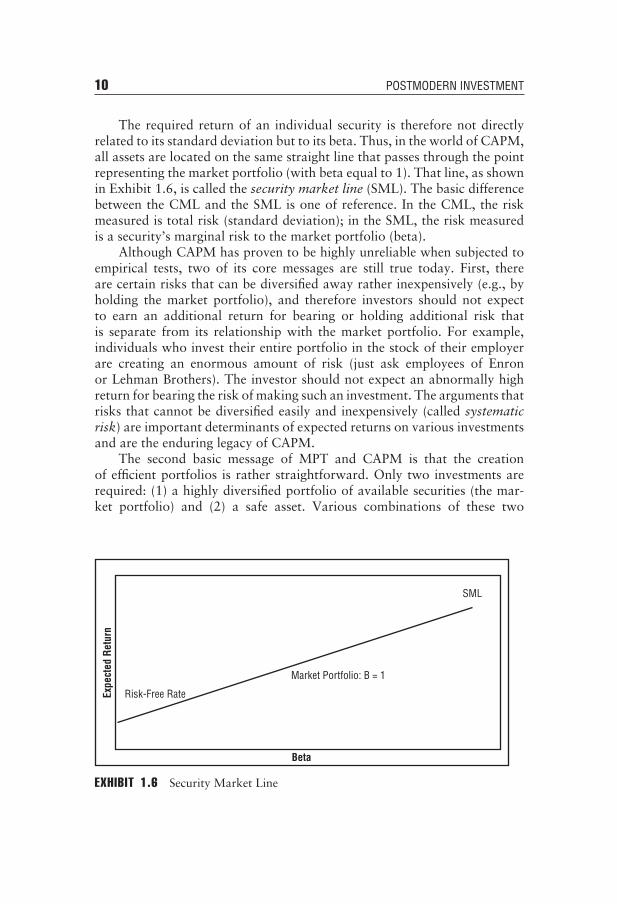
The required return of an individual security is therefore not directlyrelated to its standard deviation but to its beta. Thus, in the world of CAPM,all assets are located on the same straight line that passes through the pointrepresenting the market portfolio (with beta equal to 1). That line, as shownin Exhibit 1.6, is called the security market line (SML). The basic differencebetween the CML and the SML is one of reference. In the CML, the riskmeasured is total risk (standard deviation); in the SML, the risk measuredis a security’s marginal risk to the market portfolio (beta).
Although CAPM has proven to be highly unreliable when subjected toempirical tests, two of its core messages are still true today. First, thereare certain risks that can be diversified away rather inexpensively (e.g., byholding the market portfolio), and therefore investors should not expectto earn an additional return for bearing or holding additional risk thatis separate from its relationship with the market portfolio. For example,individuals who invest their entire portfolio in the stock of their employerare creating an enormous amount of risk (just ask employees of Enronor Lehman Brothers). The investor should not expect an abnormally highreturn for bearing the risk of making such an investment. The arguments thatrisks that cannot be diversified easily and inexpensively (called systematicrisk) are important determinants of expected returns on various investmentsand are the enduring legacy of CAPM.
The second basic message of MPT and CAPM is that the creationof efficient portfolios is rather straightforward. Only two investments arerequired: (1) a highly diversified portfolio of available securities (the mar-ket portfolio) and (2) a safe asset. Various combinations of these two
SML
Expe
cted
Ret
urn
Risk-Free Rate
Market Portfolio: B = 1
Beta
EXHIBIT 1.6 Security Market Line
Investment Ideas 11
investments can be used to create all efficient portfolios. If this essentialmessage were accepted and practiced by the entire investment community,there would be no need for this and hundreds of other books written onthe subject of alternative approaches to asset allocation and investmentmanagement. More important, the asset-management industry would needto shrink substantially and employ far fewer people at far smaller salaries.
Of course, there are many reasons to believe that the simple investmentstrategy just described would not be suitable for all investors. Most investorshave liabilities that need to be funded through their investment portfolio.This means that the portfolio has to be managed in the context of thoseliabilities. A university endowment has no finite time horizon, and its implicitliability is to help fund the operations of a university. A pension fund hasmultiple objectives and varied beneficiaries with various time horizons.A family office has one client, but multiple objectives. Clearly, a strategyconsisting of various combinations of a well-diversified portfolio and cashcannot possibly be optimal for all of these investors. The message we wantto leave investors with is that modern asset allocation requires an investorto see the world the way an institution does: with knowledge of futureliabilities; a known time horizon of investment; and a well-defined plan forholding assets, which will hopefully meet those future liabilities in the timeframe stated. An additional message is that this asset allocation processis always evolving, and it rarely fits nicely into the one-size-fits-all assetallocation process currently recommended by many financial institutionsand investment personnel.
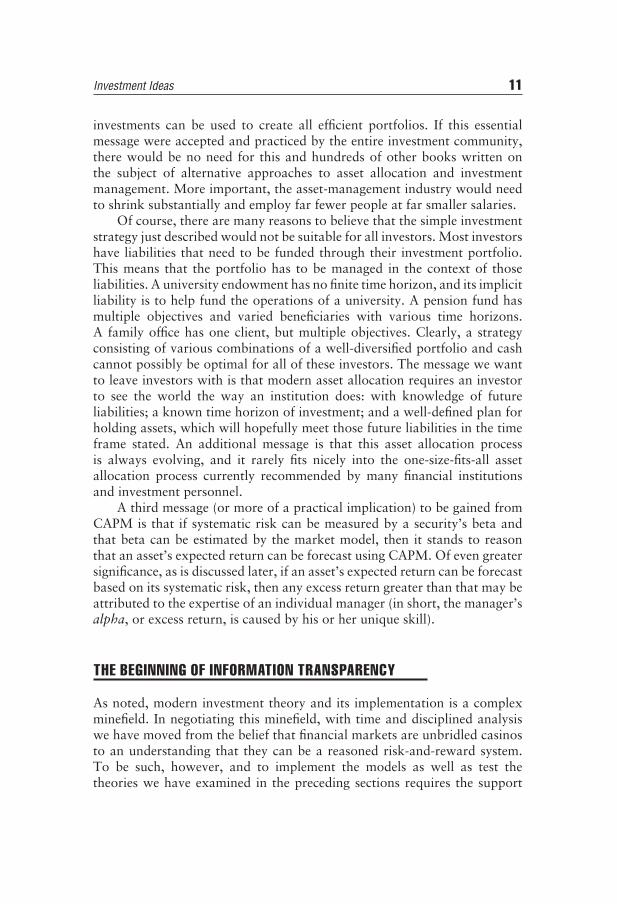
A third message (or more of a practical implication) to be gained fromCAPM is that if systematic risk can be measured by a security’s beta andthat beta can be estimated by the market model, then it stands to reasonthat an asset’s expected return can be forecast using CAPM. Of even greatersignificance, as is discussed later, if an asset’s expected return can be forecastbased on its systematic risk, then any excess return greater than that may beattributed to the expertise of an individual manager (in short, the manager’salpha, or excess return, is caused by his or her unique skill).
THE BEGINNING OF INFORMATION TRANSPARENCY
As noted, modern investment theory and its implementation is a complexminefield. In negotiating this minefield, with time and disciplined analysiswe have moved from the belief that financial markets are unbridled casinosto an understanding that they can be a reasoned risk-and-reward system.To be such, however, and to implement the models as well as test thetheories we have examined in the preceding sections requires the support
12 POSTMODERN INVESTMENT
of a multifaceted industry willing to provide transparent and objectiveinformation at a price.
One of the basic results of the MPT and CAPM was that portfolios withefficient risk-return profiles could be constructed rather easily, that is, bycombining a well-diversified portfolio of all available investments with-safeassets. An important by-product of this result was that we now had an alter-native against which other investment products—and, in particular, activelymanaged investments—could be evaluated. Benchmarking and return attri-bution form the cornerstone of the institutional asset-management industry,and investors have benefited greatly from having objective, if perhaps attimes flawed, benchmarks to evaluate actively managed investment products.
The development of objective benchmarks led to the concept of alpha,or a measure of individual manager outperformance. According to CAPM,a portfolio’s expected return is directly related to the level of systematicrisk that the portfolio contains. Once the risk of the portfolio is estimated,that estimate can be used as a basis for determining whether the individualwho manages the portfolio could consistently choose assets that werefundamentally underpriced and offer an ex post return greater than thatconsistent with its underlying risk. In sum, could the manager obtain analpha (excess return above that consistent with the expected return ofa similar risk-passive investable asset)? The search for managers who cangenerate alpha has become a major part of the investment process, especiallyfor institutional investors. However, even in the context of the extremelysimplified world of CAPM, a number of parameters have to be estimated(such as a security’s beta) in order to implement the model. The net resultis that depending on when or how the risk of a portfolio is estimated,the portfolio may display a positive, a negative, or no alpha. And justas important, even when a positive alpha is estimated, there is a highprobability that the estimated alpha could be entirely caused by chance (themanager may just get lucky), and therefore the manager may not possessthe skills needed to provide alpha in the future.
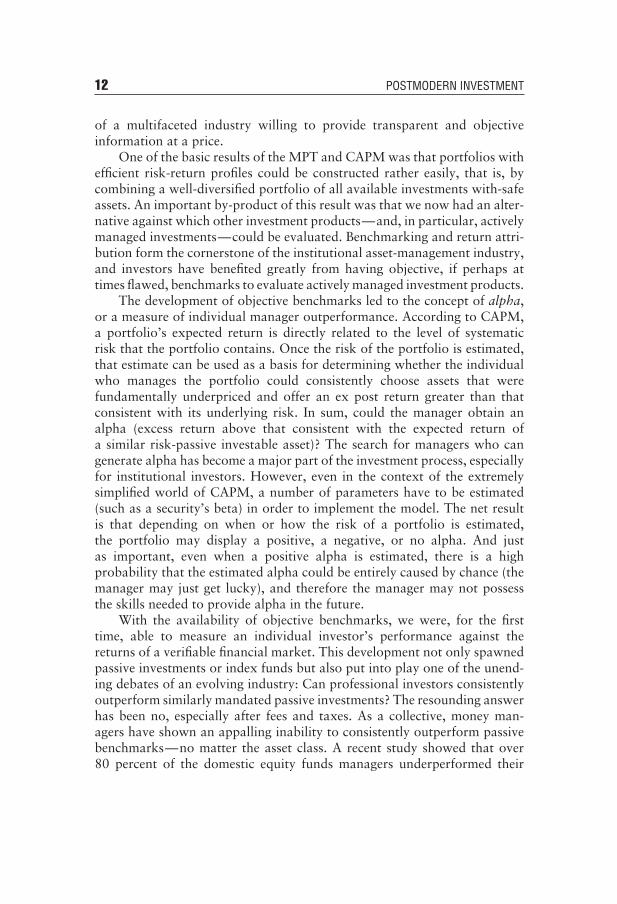
With the availability of objective benchmarks, we were, for the firsttime, able to measure an individual investor’s performance against thereturns of a verifiable financial market. This development not only spawnedpassive investments or index funds but also put into play one of the unend-ing debates of an evolving industry: Can professional investors consistentlyoutperform similarly mandated passive investments? The resounding answerhas been no, especially after fees and taxes. As a collective, money man-agers have shown an appalling inability to consistently outperform passivebenchmarks—no matter the asset class. A recent study showed that over80 percent of the domestic equity funds managers underperformed their
Investment Ideas 13
benchmark in 2011. Over longer historical time periods over 60 percent ofactive equity managers generally underperformed their benchmarks.2 Theseempirical results (the underperformance of active equity managers relativeto their passive benchmarks) helped give rise to the creation of a seriesof investable products and exchange-traded funds (ETFs) that capture thereturn-and-risk characteristics of these passive benchmarks. This is not tosay, however, that money managers do not offer benefits outside of theirstated ability to outperform a cited benchmark. In fact, it is the ability ofmanagers to make investment decisions that move a portfolio away from thebenchmark in unique market conditions (go to cash when the benchmarkis falling) that forms one of the basic benefits of active money managers incontrast to a passive nonactively managed benchmark. Unfortunately, aninvestor may never know if his money manager has that ability, if for noother reason than that the time period of investment did not include anysuch events. The investor may wish to continue to use (and pay) the moneymanager in the hope that the manager will act correctly in some futuremarket, and in the belief that the fees are worth the everyday accounting,managerial oversight, and compliance required for any investment process.(Just choose the manager with the best back office rather than the one withthe biggest marketing budget).
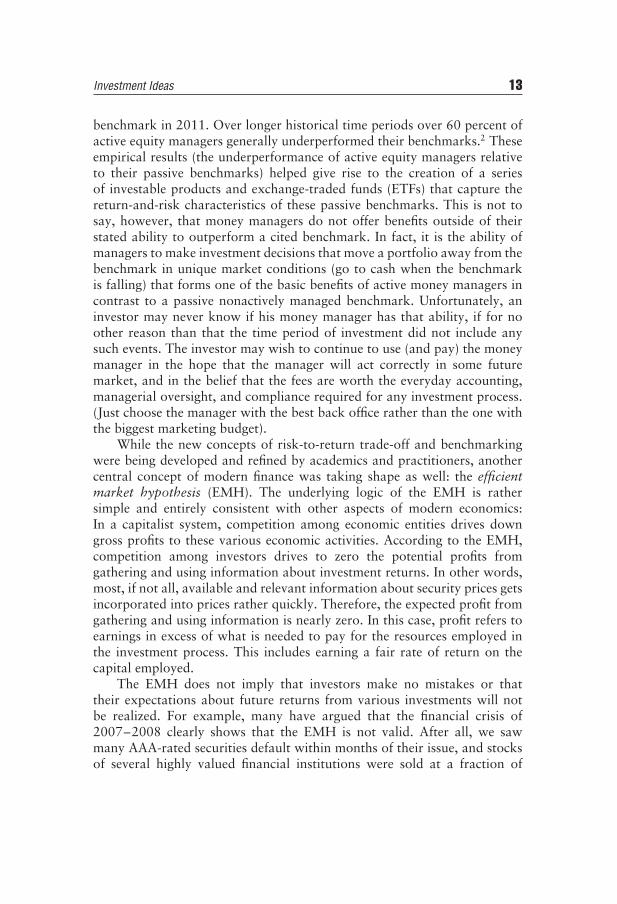
While the new concepts of risk-to-return trade-off and benchmarkingwere being developed and refined by academics and practitioners, anothercentral concept of modern finance was taking shape as well: the efficientmarket hypothesis (EMH). The underlying logic of the EMH is rathersimple and entirely consistent with other aspects of modern economics:In a capitalist system, competition among economic entities drives downgross profits to these various economic activities. According to the EMH,competition among investors drives to zero the potential profits fromgathering and using information about investment returns. In other words,most, if not all, available and relevant information about security prices getsincorporated into prices rather quickly. Therefore, the expected profit fromgathering and using information is nearly zero. In this case, profit refers toearnings in excess of what is needed to pay for the resources employed inthe investment process. This includes earning a fair rate of return on thecapital employed.
The EMH does not imply that investors make no mistakes or thattheir expectations about future returns from various investments will notbe realized. For example, many have argued that the financial crisis of2007–2008 clearly shows that the EMH is not valid. After all, we sawmany AAA-rated securities default within months of their issue, and stocksof several highly valued financial institutions were sold at a fraction of

14 POSTMODERN INVESTMENT
their pre-crisis prices. In addition, others have gone further and blamed theEMH for bringing about the financial crisis. Jeremy Grantham argued thatthe EMH was responsible for the financial crisis because of its role in the‘‘chronic underestimation of the dangers of asset bubbles’’ by the financialcommunity.3 Of course, there were bubbles and financial crises long beforethe concept of the EMH came along. One of the most famous bubblestook place in 1637, when prices for Dutch tulips increased to unimaginablelevels, and one of the worst financial crises started in 1929.
The events leading to the 2007–2008 financial crisis and what happenedduring the crisis are not necessarily inconsistent with the EMH. In fact, itcan be argued that some of the losses experienced by homeowners and banksresulted from a lack of faith in the EMH.4 Homeowners used significantleverage to purchase ever more expensive properties in the hope of earningsignificant returns from their investments; that is, they believed that theproperties were undervalued. Trading desks of banks and other financialinstitutions poured significant amounts of capital into mortgage-backedsecurities, believing that they were mispriced. The EMH is a hypothesisthat needs to be tested and, like other hypotheses (especially in the socialsciences), has many limitations. However, the lack of faith that currentprices reflect the best estimate of the true value of an asset is more oftenthan not at the root of financial debacles and crisis. Against all reasonedadvice, investors rush to invest in funds that recently outperformed theirpeers and believe promises made by money managers that there is no needto bear higher risk in order to earn higher returns (e.g., in the case of BernieMadoff, in which he generated steady above-normal returns for many years).Pre-crisis prices reflect the information available at the time and the waythat information was understood by a large majority of market participants.Only a few skilled (perhaps lucky) investors were able to gather and userelevant information about the potential mispricing of some of the assetsthat crashed in the aftermath of the crisis.
The EMH implies that investors can earn returns that will exceed whattheir level of risk predicts only if there is some violation of informationefficiency (similar to a Monopoly game in which one individual has insideinformation on what number you will roll). However, if the EMH is true,most investors should not waste their time trying to pick stocks usingwell-known sources of public information but should concentrate on riskdetermination and the proper set of assets to capture that expected risk andcorresponding return level (you win the game of Monopoly by diversifyingacross spaces and paying the right price for those spaces—that and a LOTof LUCK). More important, investors need to keep a level head in thegame and remember to pick, from a bucket of overall risk choices, one thatmatches their genuine risk preferences and constraints.
Investment Ideas 15
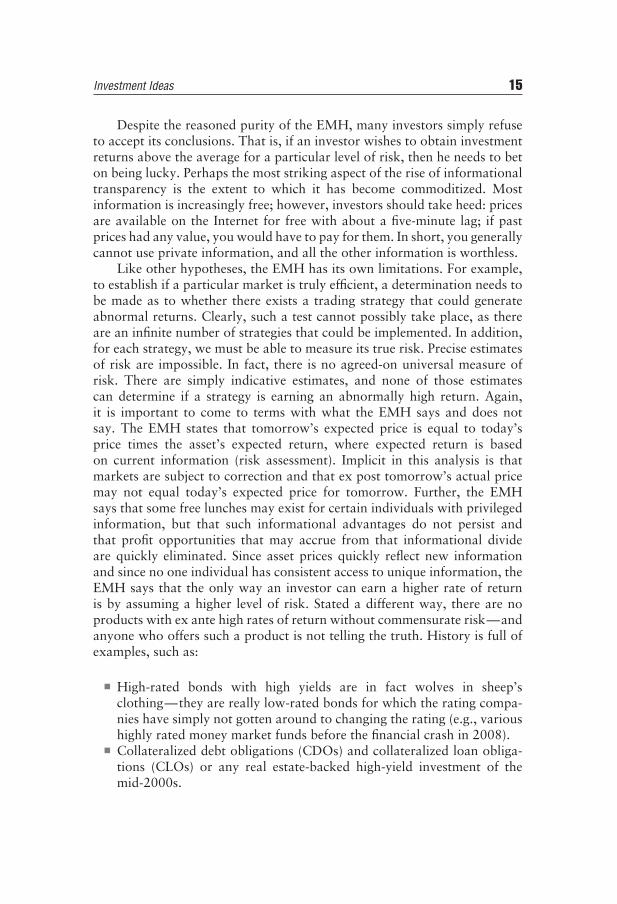
Despite the reasoned purity of the EMH, many investors simply refuseto accept its conclusions. That is, if an investor wishes to obtain investmentreturns above the average for a particular level of risk, then he needs to beton being lucky. Perhaps the most striking aspect of the rise of informationaltransparency is the extent to which it has become commoditized. Mostinformation is increasingly free; however, investors should take heed: pricesare available on the Internet for free with about a five-minute lag; if pastprices had any value, you would have to pay for them. In short, you generallycannot use private information, and all the other information is worthless.
Like other hypotheses, the EMH has its own limitations. For example,to establish if a particular market is truly efficient, a determination needs tobe made as to whether there exists a trading strategy that could generateabnormal returns. Clearly, such a test cannot possibly take place, as thereare an infinite number of strategies that could be implemented. In addition,for each strategy, we must be able to measure its true risk. Precise estimatesof risk are impossible. In fact, there is no agreed-on universal measure ofrisk. There are simply indicative estimates, and none of those estimatescan determine if a strategy is earning an abnormally high return. Again,it is important to come to terms with what the EMH says and does notsay. The EMH states that tomorrow’s expected price is equal to today’sprice times the asset’s expected return, where expected return is basedon current information (risk assessment). Implicit in this analysis is thatmarkets are subject to correction and that ex post tomorrow’s actual pricemay not equal today’s expected price for tomorrow. Further, the EMHsays that some free lunches may exist for certain individuals with privilegedinformation, but that such informational advantages do not persist andthat profit opportunities that may accrue from that informational divideare quickly eliminated. Since asset prices quickly reflect new informationand since no one individual has consistent access to unique information, theEMH says that the only way an investor can earn a higher rate of returnis by assuming a higher level of risk. Stated a different way, there are noproducts with ex ante high rates of return without commensurate risk—andanyone who offers such a product is not telling the truth. History is full ofexamples, such as:
■ High-rated bonds with high yields are in fact wolves in sheep’sclothing—they are really low-rated bonds for which the rating compa-nies have simply not gotten around to changing the rating (e.g., varioushighly rated money market funds before the financial crash in 2008).
■ Collateralized debt obligations (CDOs) and collateralized loan obliga-tions (CLOs) or any real estate-backed high-yield investment of themid-2000s.
16 POSTMODERN INVESTMENT
Unfortunately, despite warnings or historical facts, many investors donot have the time or discipline to understand the basic tenets of investing. Ifbehavioral finance has anything to say, it is that individuals want to believe.Here, investors believe that somehow, somewhere, there must be someonewho can provide the one thing they want: return without risk. We call thisthe hope over history (HOH) model of investment. At bottom, all we cansay is that the EMH suggests that if a manager makes an excess return (e.g.,because of access to better technology or information), the investor will becharged a fee equal to the excess return such that the investor’s return willbe similar to that of the passive index (i.e., manager returns − managerfee = return similar to passive index). The fee covers the cost of acquiringthe technology or information, plus the investment made in time and effortto use that technology and information for the investor’s benefit.
The emerging tools and theories of asset pricing—efficient marketinvesting, mean-variance efficient frontiers, and CAPM—required knowl-edge and experience in financial markets. Who better than an investmentprofessional to help the average investor navigate this new world? It shouldcome as no surprise that the birth of today’s popular Chartered Finan-cial Analyst certification occurred in the same decade as that of CAPMand the efficient frontier. The place of the financial advisor was no longerbased solely on his or her ability to find superior stocks or bonds butin helping investors find their true return-to-risk trade-off. How financialadvisors do this—and whether they actually do this or not—is a questionto be explored in later chapters, but the evolution of these models dependson the industry’s ability to support the basic business model. The single-factor model worked. Once the industry evolved to find ways of sellingproducts that met the requirements of a mean-variance efficient, CAPM,and efficient-market world, advisors did not find it in their interest tochange their approach when these models simply reached their end pointof applicability.
In short, the two cornerstones of modern finance, MPT/CAPM andEMH, do an excellent job of describing most market conditions for manyasset classes. For the most part, markets work efficiently. Financial marketsfor which there is low-cost information and substantial visibility, and forwhich asset prices reflect current information—such as the U.S. Treasurybond market—are remarkably efficient. Other markets and assets (e.g., realestate, private equity) require extended risk-based factor models, whichcapture an enlarged set of underlying risks; therefore, sources of expectedreturns cannot be explained by these simple models. Small firms that havefew analysts following them, less ability to raise capital, a less diversifiedclient base, and less legal support may or may not be priced to reflect those
Investment Ideas 17
risks. Many assets are simply not tradable or have high transaction costs(e.g., housing, employment contracts, and distressed debt).
NEW MARKETS, NEW PRODUCTS, AND THE EVOLUTIONOF MODERN INVESTMENT
People spend a great deal of time focused on the equity markets for thesimple reason that for most investors, this is the primary area of concern;it is also the one area in which most investors feel some level of comfort.The average investor understands the basic message of equity investment: Itis something that brings in more money in the future. The average investoralso has a rudimentary understanding of the bond market: High-rated bondsare good, and low-rated bonds are bad. However, since the beginning, togo beyond stocks and bonds was to go into a no-man’s-land similar tothose shown on maps of old—to venture into foreign lands meant passingthrough seas where monsters lived. Most people had friends and neighborswho owned stocks and bonds; no one owned futures, options, privateequity, or commodities.
In the early 1970s, political and economic forces significantly changedthe financial landscape of the investment-management industry and, in sodoing, changed the way risk could be managed. Just as the simple dividenddiscount models for stocks, developed and expanded in the 1930s, were allthat was needed to determine stock prices prior to the 1960s and 1970s,bond ratings and yields to maturity, also developed and expanded duringthe 1930s, were seemingly all that was needed to understand how to holdbonds. During the second half of the 1960s, spurred by regulatory change(ability to trade options, removal of fixed exchange rates) and marketconditions, considerable research centered on direct arbitrage relationshipsbetween assets (pricing models for options and futures) as well as moreefficient ways (e.g., duration) of pricing fixed-income securities.
In the early 1970s, Fischer Black and Myron Scholes (1972) and RobertMerton (1973) developed the option pricing model. Similar models hadexisted before, and in fact, Louis Bachelier, a French mathematician, haddeveloped a rather similar model in 1900. The seminal contributions ofBlack, Scholes, and Merton was the concept of delta hedging, which meantthat at least in theory, an investor could create a synthetic option througha trading strategy involving stocks and cash. This was of enormous value,because it showed market makers how to hedge their option books, mak-ing them more willing to take large positions in these derivative markets.Exchange-based trading floors soon came into existence, which helped toeventually develop a market for a wide range of option-based financial
18 POSTMODERN INVESTMENT
derivatives. Although a range of dynamic futures-based approaches shouldprovide similar risk-management opportunities, options provided a directand easily measured approach to fundamentally change the risk composi-tion of an asset or a portfolio. Equally important, the model allowed aninvestor to estimate the insurance cost for modifying the risk of a portfolio.In the decades that followed, new forms of risk management would beadvanced that would eventually offer investors a range of risk-managementapproaches, each with its own unique costs and benefits.
NEW OPPORTUNITIES CREATE NEW RISKS
By the early 1980s, a range of financial products and databases hadcome into existence that provided the ability to empirically test investmentmanagement decision rules. Options trading had grown, and financialfutures markets had evolved (Standard & Poor’s [S&P] 500 equity indexfutures contracts came into existence in the mid-1980s). Other changeshad taken place regarding technology, regulation, and market structure toprovide a set of conditions that supported further development of assetmanagement within a risk-controlled environment. During this period,systemized approaches to tactical asset allocation were being developedand marketed. By the mid-1980s, concepts such as alpha transfer (e.g.,taking an equity portfolio, removing its beta with the stock market, andselling the difference to someone who wants alpha with no market risk)and dynamic portfolio insurance were well understood. In addition, duringthe 1980s, advances in computer technology and software made availablefor the first time a series of self-serve portfolio management tools thatenabled investors to directly manage and adjust their risk exposure. Notonly did advances in technology and product development permit investorsto manage and adjust risk exposure, but it also allowed investors to takeexisting assets, dissect their payment streams, and rearrange those paymentstreams into new assets. The process through which an issuer creates afinancial instrument by repackaging financial instruments into a new assetor series of assets came to be known as securitization. The classic casein the 1980s was the growth of new mortgage-based products, in whicha large pool of mortgages was divided into smaller pieces, which werethen sold to investors. Investment firms were able to create entire seriesof new securities, each with its own unique return-and-risk characteristicsthat could better meet the risk and return goals of investors. Over the nextdecades, the securitization industry grew to manage and market an ever-increasing array of financial instruments based on a wide range of underlyingsecurities and cash flows, including credit cards, accounts receivables, and
Investment Ideas 19
credit spreads. Unfortunately, as many of these new ‘‘structured’’ formsof securities were created, the underlying risks and rewards became moredifficult to determine. In short, the further one moved from the originalsingle-security form (the tree) and concentrated on each new financial asset(the limbs), the more difficult it became to trace the stream of cash flowsgoing to the security.
THE MARKET IS NOT EFFICIENT FOR EVERYONE
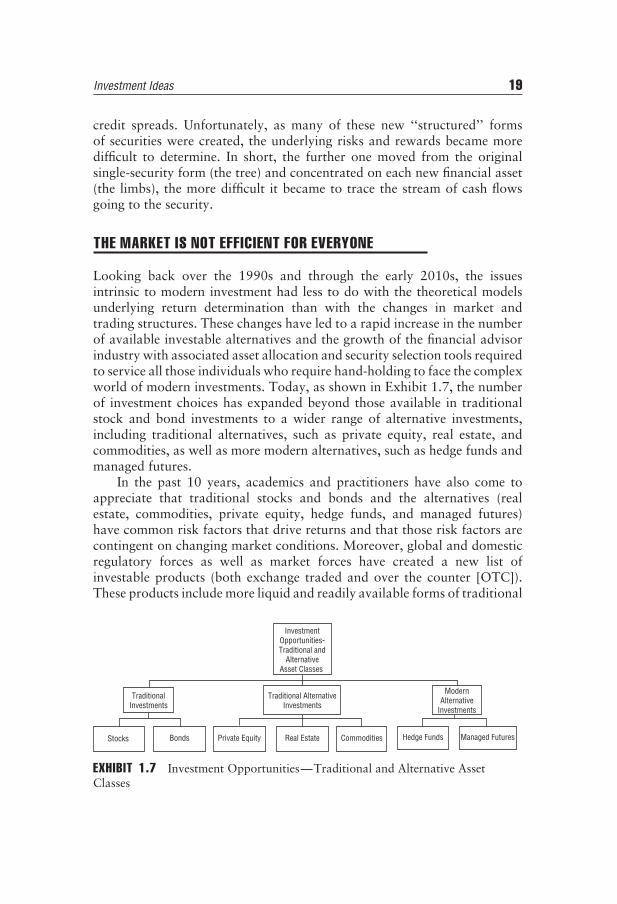
Looking back over the 1990s and through the early 2010s, the issuesintrinsic to modern investment had less to do with the theoretical modelsunderlying return determination than with the changes in market andtrading structures. These changes have led to a rapid increase in the numberof available investable alternatives and the growth of the financial advisorindustry with associated asset allocation and security selection tools requiredto service all those individuals who require hand-holding to face the complexworld of modern investments. Today, as shown in Exhibit 1.7, the numberof investment choices has expanded beyond those available in traditionalstock and bond investments to a wider range of alternative investments,including traditional alternatives, such as private equity, real estate, andcommodities, as well as more modern alternatives, such as hedge funds andmanaged futures.
In the past 10 years, academics and practitioners have also come toappreciate that traditional stocks and bonds and the alternatives (realestate, commodities, private equity, hedge funds, and managed futures)have common risk factors that drive returns and that those risk factors arecontingent on changing market conditions. Moreover, global and domesticregulatory forces as well as market forces have created a new list ofinvestable products (both exchange traded and over the counter [OTC]).These products include more liquid and readily available forms of traditional
InvestmentOpportunities-Traditional and
AlternativeAsset Classes
TraditionalInvestments
Traditional AlternativeInvestments
ModernAlternative
Investments
Stocks Bonds Private Equity Real Estate Commodities Hedge Funds Managed Futures
EXHIBIT 1.7 Investment Opportunities—Traditional and Alternative AssetClasses
20 POSTMODERN INVESTMENT
stock and bond investments (e.g., ETFs and OTC forward and optionscontracts) as well as investable forms of alternative asset vehicles, such ashedge funds, real estate, and private equity.
The addition of new investment forms has permitted individuals tomore readily access previously illiquid or less transparent asset classes andhas increased the number of assets that provide the potential for riskdiversification in various states of the world. In fact, risk itself has becomea more tradable asset. Although options had always provided a means todirectly manage risk, previous attempts to directly trade risk had not metwith success. In the mid-2000s, various forms of VIX (the ticker symbol forthe Chicago Board Options Exchange [CBOE] Volatility Index) began to betraded directly on central exchanges. In addition, advances in various formsof structuring along with algorithmic-based trading products have offeredinvestors a broader set of domestic and international vehicles by whichto manage asset portfolios. Finally, the growth of the Internet, along withthe expansion of data and product availability and computer technology,has permitted the development of a wide set of new approaches to assetallocation and risk management.
At certain levels of the industry we know what we can reasonably expectfrom these new products as well as from the various risk-management andasset-allocation systems; however, there is evidence that many investmentfirms have not changed their current business model to reflect these knownchanges in market return-and-risk opportunities. The market is never effi-cient for everyone in that transaction costs differ, borrowing costs differ,and taxation differs such that the actual after-tax return across individualsand institutions varies greatly. In sum, the ability to process and understandinformation and its consequences differs. The unpredictable nature of riskyasset pricing raises the issue of how best to manage that risk. CertainlyMarkowitz’s model, based on estimates obtained from historical figures,continues as a primary means by which individuals attempt to estimateportfolio risk; however, the 2008 market collapse illustrated the fundamen-tal flaw of the Markowitz diversification approach; that is, Murphy’s Lawof Diversification—assets and markets only offer diversification benefitswhen such benefits are not needed.
Investment management in its most basic form is the ability to managethe return-to-risk trade-off. For many investment firms, simple models ofrisk management are best met with simple approaches to asset allocation.For many of these firms, the investment decision still comes down to howmuch equity and how much debt is required to provide an investor with aconservative, a moderate, or an aggressive risk-return portfolio. What risklevels these three portfolios really provide is not detailed, nor is the factthat the risk of these portfolios is not split equally between the stock and

Investment Ideas 21
bond investments but is often impacted primarily by the high-risk stockor bond included in the investment. The potential addition of a range ofother investment classes should at least offer one answer to the stock–bondconundrum: Are more investment opportunities better than less? Additionalassets may provide investors with greater access to return opportunities thatmay not exist in most states of the traditional stock and bond world.
A PERSONAL VIEW OF MODERN INVESTMENT
In previous sections, we cautioned against an overreliance on empiricallybased solutions and simple one-size-fits-all security selection and assetallocation approaches. Each month, financial firms offer a new array offinancial products for the investment community. Cost containment andother business concerns generally result in a one-product-fits-all-investorsapproach. Equally important, the product that is offered is, not surprisingly,the one with the most recent higher return to risk performance. Resultsbased on historical data are just that: results based on historical data.However, despite the often-given admission that past performance is nota forecast of future performance, most investors do not know where elseto look. We also stressed the importance of estimation error in the returnsas well as model error and estimation error in the parameters used in anyindividual model. Finally, we pointed out that there exists not only anefficient market in asset pricing but the potential for an efficient market inideas, such that any ‘‘new’’ approach to investment management or assetallocation offering new advances often reflects marketing advances morethan an asset-management advance. After all of those caveats, the followingchapters present the analysis of various asset classes as if there exists asimple set of rules for determining the underlying risks and returns ofeach investment area. In short, for purposes of presentation, the followingchapters emphasize well-known and often-used measures of risk and return.We use them not because they are the best, but because they are the mostpopular and the ones most individuals feel comfortable using. At somelevel we are all guilty of the same sin; we sell what we can, not whatwe should.
In the upcoming chapters we explore the risk, return, and operationalapproaches embedded in the major stock, bond, and alternative investmentasset classes (e.g., hedge funds, managed futures, commodities, real estate,and private equity). Each chapter may be read as a self-contained unit inthat it concentrates on a single asset class without overemphasizing its rela-tionships with other asset classes. After the chapters on each individual assetclass, we concentrate on presenting alternative methods of asset allocation
22 POSTMODERN INVESTMENT
and risk management. We point out that there are no universal solutionsfor how these asset classes should be combined to form investor portfoliosor how the risk embedded in those portfolios should be managed. Whatis important is that the investor knows the return-and-risk characteristicsof each asset class as well as the risks embedded in asset allocation andrisk-management models used to create and evaluate the potential benefitsof various asset groupings.
The touchstone of evolution is that an entity will adapt in order tosurvive. Understand that the operative word is survive, and survival does notcarry an optimization requirement. Thus, we will not find the perfect theoryor grouping of products as change comes to the corporate or investmentworld—or, for that matter, to academic research. Rather, we will find thatwe have a better understanding of risk and return relationships. Today’sgrowth in off-exchange and screen-traded markets, in contrast to floor-traded markets, is only one example of such understanding and change.There can be, however, a gulf between reality and perception. A delay inan investor’s (and here the term is used broadly to incorporate regulatorsand corporate boards) understanding or market awareness of new researchor market relationships often results in a delay in an appreciation of thesechanges and leads to significant disadvantages in the marketplace.
Change comes from many sources. Modern investment products grewout of economic necessity, regulation, and technological innovations. Cur-rency derivatives came into existence out of the failure of the United Statesto manage its own currency, and thus the market had to devise an approachto facilitate international trade in a world of uncertain currency values.Individual options grew in the early 1970s as risk-management tools, partlyin response to the collapse of the stock markets of the late 1960s and thedemand for new means of equity risk management. In the 1980s, the expan-sion of interest rate futures and the development of equity futures followed,in part, from the Employee Retirement Income Security Act (ERISA) of1974, which required vesting of pension fund benefits and eventually led topension fund asset increases to a size that required new means of managingrisk. During the 1990s and into the current era, new product creations (e.g.,swaps) were part of the changing world of technology and the resultingability to manage and monitor an increasingly complex series of financialand nonfinancial products.
Although we know very few fundamental truths, one on which wecan collectively agree is that the evolution of asset allocation draws on theaforementioned changes flowing from a dynamic world, in which new formsof assets and risk-management tools are constantly being created. Relativerisks and returns, and the ability to monitor and manage the process bywhich these evolving assets fit into portfolios, will change and will be based

Investment Ideas 23
on currently unknown relationships and information. Certainly today thechallenge is greater, not only because we are working in a more dynamicmarket but also because the number of investment vehicles available toinvestors has increased. Hopefully, the following chapters will provide someguidance to meet this challenge.
WHAT EVERY INVESTOR SHOULD KNOW
For many, investments are viewed as an individual snapshot; that is, eachinvestment approach stands on its own regardless of changes in investmentmodels or investment theory. For others, investments can be more easilyseen as a road map offering new ideas and approaches while rejecting sometraditional investment approaches as old snapshots in an investor’s photoalbum. Chapter 1 provided a brief summary of how some of the most basicapproaches to investment came into existence and how some of them haveevolved over time. Whatever your view, that is, investments as a snapshotor a road map, there are a number of simple concepts that every investorshould know:
■ Know Your Risk Tolerance: Most security and portfolio recommenda-tions are based on models that remain focused on offering an investora selection of asset choices based on a series of portfolios, each witha different expected return and risk. Unfortunately, many models usean asset’s standard deviation as the proper measure for risk, and formost investors, standard deviation is a poor standalone measure of risk.Risk may be better viewed as a probability of large losses that onecannot recover from or the inability for the investments to match futurecash flow needs. Investors should choose investments based on theirview of risk tolerance and not the one embedded in a model for firmrecommendation.
■ Know the Fatal Flaw in Every Investment Model and Idea: Every modelor investment theory has a logical and finite end point. Rigorously chal-lenge the basic ideas behind investment models and recommendations.Is your advisor using historical returns and risks in creating a portfoliowhen those returns and risks have no relevance in today’s world? Isyour advisor recommending a product that does not permit you to easilychange as your investment objectives change? Ask your advisor to giveyou the best case and the worst case scenarios based on the model ormodels he or she is using to recommend a particular portfolio. Invest-ment advisors have varying degrees of skill and competence. Investorsshould openly challenge their level of knowledge, credentials, conflicts,and motivations.
24 POSTMODERN INVESTMENT
■ Limit Your Investment Portfolio to What You Understand: Everyinvestor has investment limits based on their risk tolerance, knowledge,age, and investment horizon. Some investments are just not suitedfor some, while well suited for others. Risk-and-return relationshipsbetween and among both singular assets and asset classes can anddo dramatically change over time. New forms of assets and risk-management tools are constantly being created. If you do not understandor if you feel uncomfortable with certain ideas, just say ‘‘no.’’
MYTHS AND MISCONCEPTIONS OF MODERNINVESTMENT
Change is a common part of the corporate or investment world as well asacademic research. Research on the use of various investment processes andtheir effect on asset management as well as on corporate and financial riskmanagement is an evolving area, not only because new theories come intoexistence that better explain risk-and-return relationships but also becausechanges in regulations and trading technology may result in changes inthe underlying markets in which assets trade and in which corporateand financial firms operate. Today’s growth in off-exchange and screen-traded markets, in contrast to floor-traded markets, is only one example ofsuch change.
A delay in investors’ understanding, or even market awareness, of newresearch or market relationships often results in a delay in investors’, corpo-rate officials’, and government regulators’ appreciation of these changes andthe creation of a series of myths and misconceptions about how financialproducts perform, as well as their effects on financial markets, domesticallyand globally. That is, as markets change, misconceptions grow and myths(embedded in our experiences) become ways of coping with that change.In short, myths and misconceptions are a fixed part of the investmentlandscape.
Myth 1.1: Beta Is Dead
For years, academics and some practitioners have attempted to put betain its grave. In theory, ‘‘true’’ beta is a number that supposedly measuresthe sensitivity of a security to the market portfolio (all assets) and that,in combination with CAPM, offers the investor a forecast of an asset’sexpected return relative to other assets. This last statement is importantbecause CAPM does not forecast returns; it only makes a statement aboutrelative returns. In truth, we never measure true beta; we measure ‘‘little’’
Investment Ideas 25
beta, a number that measures the sensitivity of a security to a preselectedindex (e.g., the S&P 500). As such, little beta is only an approximation fortrue beta. How close the approximation is depends on the time period usedto estimate little beta, the investment interval used (daily, weekly), and thedegree to which a firm changes character (holds more debt, hedges currentrisks). With all of these issues, one might think little beta should be dead.There have even been academics and others who have advocated for models(arbitrage pricing theory [APT], four-factor model) that have been shownto provide somewhat better estimates of relative returns. So why isn’t littlebeta dead? First, it is a simple model that can be easily calculated (a simpleExcel function does it for you). Second, it has been enshrined in educationalmaterial, marketing documents, and regulatory actions such that any changewould require drastic and in some cases illegal actions. Finally, it actuallydoes a fairly good job, especially when you know its limitations. Remember,before you kill something, you ought to have something significantly betterto take its place; how else would you explain the change to others whowould be resistant for all the aforementioned reasons? Little beta still exists;learn to live with it, but be careful in its use.
Myth 1.2: Mean-Variance Optimization ModelsCorrectly Balance Risk and Return
Although MPT is almost 60 years old, it still forms the basis for much ofinvestment analysis. Financial advisors invariably emphasize the importanceof maximizing return while minimizing risk. The primary role of manyfinancial advisors is to find a set of securities that provide excess return(greater than the benchmark) for a level of risk equal to the benchmark.Why hire an advisor if he cannot do better than the benchmark? In short,these advisors emphasize maximizing the mean return for a particular levelof risk. This is all well and good, but it is the outcome that you have toworry about. Almost every model of mean-variance portfolio optimization(choosing those assets with the highest expected return for a given level ofrisk) is expected to be return sensitive. For example, the advisor can use anoptimization model to find the optimal portfolio for a level of risk. In thatportfolio, if there is one stock that outperforms all the other stocks of similarrisk, even if that one stock is only, say, 5 basis points better, it is in and theothers are out. Unfortunately, these models end up pointing to stocks thathave done better in the past mostly because of pure luck. In the future, twostocks of the same risk should have the same return. In the next period, thestocks that did best in the past (the stocks that you picked) return to thesame mean return as the other similar risk stocks, such that the expected
26 POSTMODERN INVESTMENT
return of your optimized portfolio overestimates its ‘‘true’’ expected returnand you end up disappointed—you fail to outperform the benchmark asthe model or your advisor forecast. So we know the optimization model hasinherent flaws: Its perfection is a myth.
Myth 1.3: Yield to Maturity Is Dead
Some individuals believe the concept of yield to maturity (YTM) shouldbe left for dead, except for zero-coupon bonds for which the YTM equalsthe yield to duration (YTD). It is well known—well, obviously not wellknown, or we would be using it—that two bonds of the same maturitybut different coupons could be priced dramatically different. Why do westill concentrate on a bond’s YTM? First, it is a simple model. Investorsknow what ‘‘maturity’’ means (old and wise). They also know what ‘‘yield’’means (something you get back). Second, to go beyond that puts anyfinancial advisor at risk for sounding too academic, especially when allthe other firms continue to emphasize YTM. In truth, in board meetingsand investment committee meetings, YTD—a kind of coupon-adjustedYTM—has started to replace YTM, just as some sort of multifactor returnmodel has started to replace beta for stocks. It appears that until economicconditions change such that the difference in YTM and YTD is dramatic(widely different coupons on new and old bonds), YTM will dominatethe discussions.
Myth 1.4: Investment Managers Matter
It has been pointed out that one of the investment evolutions over the past60 years has been from ‘‘managers matter’’ to ‘‘benchmarks matter.’’ Infact, both do, just not for the reasons most investors think. First, thereare some great managers, although not enough to make a difference in awell-diversified portfolio (no one should risk all his or her money on a greatmanager—bad things happen to good people). Second, we do not knowwho the great managers are (as will be discussed later). As an example, let’ssay for period 1 you take 200 managers and split the sample in two (go longand go short). For period 2, you take the 100 managers who outperformand split the sample in two (go long and go short). For period 3, you takethe 50 managers who outperformed and split the sample in two, and soon. After a number of periods, you are down to managers who were inthe top group in every year by pure chance. Managers matter, if for noother reason than that someone has to turn the lights on in the morning.Managers matter but not for the reasons normally emphasized.
Investment Ideas 27
Myth 1.5: Structured Products Are Dead
In recent years, one of the worst things that could be said about aninvestment vehicle was that it was a structured product (a product designedfrom other products to have a unique return-to-risk trade-off). Structuredproducts have existed for a long time and will continue to exist. Structuredproducts allow investment firms to unbundle the risks of various products.For example, an investor in corporate securities may not want to bearthe interest rate risk associated with U.S. Treasury securities. In this case,credit default swaps will allow the investor to participate in the credit riskof a corporate bond without participating in the interest rate risk of thesame security.
What an investor really wants going forward is not fewer structuredproducts, but more products designed to provide returns in unique riskenvironments. There are, of course, good structured products and bad ones.There is risk in choosing risky investments; if you cannot live with this, putyour money in a bank and have them choose the risky structured productsfor you (although history proves this doesn’t always work out so well,either). Ultimately, we embrace structured products when they work, andwe blame others when they do not, but the belief that they are inherently evildoes not reflect reality. Within this analysis, if there is a constant, be wary ofstructured products that are based on a bank’s or investment bank’s balancesheet. Here, there are a large number of unsystemic risks that are difficultto factor.
Myth 1.6: Behavioral Finance Is the New Normal
Over the past 20 years there has been a body of new work relating tofinancial theories on why individuals hold certain assets and portfolios ofassets. The set of research in this area has fallen under the term behavioralfinance. It is partially founded in the research of Daniel Kahneman andAmos Tversky, which illustrates that people act differently after wins thanafter losses. Behavioral finance attempts to explain that behavior and itspotential effect on financial markets. While interesting on its own, this workdoes not have all the requisite market insights to replace other asset-pricingmodels. This behavioral research tends to work at the micro (individual)but not the macro (market) level and provides only a stopgap to a morecomplete model of asset pricing. Here, some researchers seem to ignorethe fact that CAPM is at its essence a behavioral model of asset pricing(variance counts). More to the point, individuals have very little effect on theday-to-day operations or behavior of financial markets. Large institutionalinvestors and traders dominate the terrain through high-frequency trades
28 POSTMODERN INVESTMENT
and other models used to immediately respond to changing risk-and-returnscenarios. The individual as a dominant force in market behavior is a quaintanachronism.
Myth 1.7: Derivative Markets Promote IncreasedMarket Volatility
We have all heard that it is better to be lucky than to be good. Many newfinancial ideas, which may have real long-term benefit to the markets, aresimply launched at the wrong time and have no immediate market (e.g.,volatility-based products in periods of low volatility) or come into existenceat a time when their benefits are misunderstood. Most of present-dayfinancial futures and option markets came into existence in the 1980s. Whenacademics looked at the return volatility of the futures-based contracts, inmany cases the volatility was greater than the associated cash instrument,or the volatility after the period the futures contracts were introduced washigher than it had been in prior periods. Many individuals cited these asexamples of the negative impact of futures and options on market volatility.In fact, it was just the opposite. Futures contracts have lower transactioncosts, so people trade a futures contract if prices go up or down just a little.The same price change exists in the cash, but the costs of trading are sohigh that no one trades there (the cash price remains the same and looksstable, but if you really tried to trade it, there’d be a big price change).More important, futures and option contracts are generally most successfulif they are launched in a period of high volatility, as individuals use themto manage risk. In this way, successful futures and option contracts can beconsidered a type of backfill bias. There is currently a spirited debate overregulation in this area. However that debate turns, this market requiresknown transparency if it is to reach its full potential value.
Myth 1.8: Global Equity Markets and Bond Markets ActDifferently Than U.S. Markets
In the 1970s, one of the most notable academic articles showed the benefits ofglobal diversification. An associated article showed that when two countriesstart to trade financial assets, the historical pricing relationship and thehistorical correlation were meaningless until new pricing relationships wereestablished. One of the reasons for the benefits of global diversificationwas simply that certain companies and industries were primarily tradedon local exchanges within their national markets. With advancements intechnology and uniform regulation, it is possible for investors to havedirect access to geographically dispersed markets. For the most part, while
Investment Ideas 29
acting separately, these markets have similar regulatory schemes that fostertransparent pricing and the movement of monies on a cross-border basis.Today markets are more similar than different, and certain stocks and bondstrade on exchanges around the globe such that sometime in the future theremay well be only one trading market on one big ‘‘cloud’’ in the sky.
Myth 1.9: An Asset’s Price Never Changes
Each day, there is a mad scramble at 4:00 p.m. eastern standard time. Itis at this time that many U.S. mutual funds and other financial holdingsare priced for the day. For most individuals, that price is sacred; it is theprice of their holdings until the end of the next day. Of course, by thetime they receive that valuation on their smartphone, the actual value ofthat asset or portfolio of assets has changed (we see it referred to on TVas the ‘‘after-market market’’). What’s more, the price at 4:00 p.m. is notnecessarily a traded price, as these prices are sometimes dealer estimates,benchmark-based algorithmic prices, or traded prices from markets longclosed. Yet even some academic research is based on those prices actuallybeing true. Investors need to realize that the valuation of their portfoliois only an estimate, and that if they traded that portfolio, its actual valuecould be dramatically different.

CHAPTER 2Equity and Fixed Income
The Traditional Pair
For most investment firms, financial products reflect the opportunities ofa given time and place. For example, in the 1970s and early 1980s,
changes were taking place in how individuals viewed bond ratings and thepricing of fixed-income securities. During this period, Salomon Brotherstook a 20-year government bond and split it into 41 individual bonds (i.e.,40 semiannual coupon payments and one principal payment). Salespeoplethen took each of the individual bonds (zero coupons) with a fixed maturityand sold it at a discount equal to the bonds’ then-required return. Suddenlythere existed a complete series of zero-coupon yield-to-maturity (YTM) oryield-to-duration (YTD) bonds (note that for zero-coupon bonds, YTM andYTD are the same thing), such that investors had access to a complete termstructure for bonds (i.e., spot rates and forward rates). The creation andfurther development of a series of zero-coupon bonds forced a sea change inhow fixed-income securities could be managed. For the first time, investorscould easily single out, mix, or match bonds to meet a particular investmentneed, with little or no default or reinvestment risk.
Correspondingly, other changes were taking place in the fixed-incomearea. In the 1970s, research increasingly began to address the use of abond’s duration rather than a bond’s maturity as the primary means tocompare yields on bonds.1 In addition, with the New York City creditcrisis in the mid-1970s questions were raised as to the quality of traditionalbond ratings. In addition, academics were addressing why high-rated (AAA)bonds reported less price volatility than supposedly more risky lower-rated(BAA) bonds.2 In fact, the answer was relatively simple and related to theaforementioned concept of duration. Without getting into the mathematicsof duration estimation, and all else being equal, a bond with the highercoupon (e.g., a lower-rated BAA bond) will have a lower duration thana similar maturity lower coupon bond (e.g., a higher-rated AAA bond).
31
32 POSTMODERN INVESTMENT
Investors can view duration as a kind of coupon-adjusted maturity (all elsebeing equal, a lower-rated, higher-coupon bond may pay back its purchaseprice quicker than the higher-rated, lower-coupon AAA bond). Moreover,as beta can be used to help measure the systematic risk of a stock, durationcan be used similarly to measure the systematic risk of a bond to changes ininterest rates. Again, without going into too much detail and all else beingequal, the lower the duration of a bond, the lower its measured volatility.Bonds with lower ratings may in certain market conditions report a lowerstandard deviation. For many investors at that time, duration replaced bothmaturity and bond ratings as the basis for measuring a bond’s risk. Thefinancial market had created new financial products based on the knowledgeof (1) understanding how bond prices moved, (2) the availability of bonds tomeet structured product requirements, and (3) the ability to find customerswho understood how these new products could enhance their portfolios.3
Despite all of the information on the relative benefits of YTD overYTM as well as concerns over the use of bond ratings, why did investmentfirms still emphasis the latter over the former? The answer is simple—easeand market acceptance. For most individuals who hold short-term bonds,the difference between duration and maturity is minor, and bond ratingsprovide a simple answer as to what is an acceptable investment. For mostfixed-income practitioners, life is too short to try to educate the world.
The average individual bond risk-and-return measurement rarely wentbeyond reliance on a bond’s YTM and rating. This fact provided a numberof opportunities for some investors to arbitrage basic misunderstandingsabout how bonds were priced and risks were assessed. Opportunities forprofit existed when one group of individuals priced bonds using modelA and the trading firm knew that the proper pricing model was actuallymodel B. The growth of futures markets in fixed-income securities duringthe 1980s also offered special pricing rules on what could be delivered.This soon produced a simple one-size-fits-all solution to how all deliverablegovernment bonds would be priced (based on the most deliverable bonds).As noted, mathematical models could be derived to indicate when arbitrageprofits were possible. This knowledge eventually led to the growth of arange of fixed-income arbitrage firms. These firms made money when theirmodels worked and model A prices moved to model B prices (e.g., Long-Term Capital Management L.P. pre-1998) and of course lost a lot whenthey either did not move or moved too slowly (e.g., Long-Term CapitalManagement L.P. in 1998).
For purposes of this book, the primary point is that over the past30 years of fixed-income research, much has changed and much has stayedthe same. For many investors, at least retail investors, in the fixed-incomeworld, bond ratings and YTM remain the rule. For others, fixed-income
Equity and Fixed Income 33
investment is founded in elaborate mathematical models that supposedlymatch the present value of expected cash flows of X with the price of Y andarbitrage the two. For still others, bond markets are just one of many assetclasses, each with its own set of return expectations over a set of unknownfuture events.
Eventually, the knowledge derived from the advancements in howto price fixed-income securities and how to divide them and put themback together in new forms would provide the basis for the creation ofmarketable securitized structured products using assets such as credit cardreceivables, mortgages, and automobile loan receivables as their base. Whilethese new products were based on the assumptions of expected cash flows,their values were based on the continuing assumption of transparency andverifiable information within the structures. So long as the market couldproperly value and ascertain changing risk patterns, both bankers and theirclients could be comfortable with risk-and-reward decisions. October 2008changed all that.
In October 2008, we rediscovered that risky fixed-income bonds(regardless of rating or maturity) could not be protected from all nega-tive events despite all the duration matching, hedging, and advancementsover the past 30 years. We also discovered the downside to global diversi-fication. By enlarging the market to include more bonds, more traders, andmore investors; by creating a world in which individuals traded daily; andby taking bonds and breaking them up into smaller pieces that were then putback together into new securities that traded daily, we were now dependenton the daily liquidity fix. When liquidity disappeared the market froze. Inlarge part, the subprime mortgage market was the catalyst for the overallcontagion. With subprime mortgages embedded into differing tranches ofmortgage-related securities and without a clear picture as to the continuedeconomic viability of those mortgages or which securities contained thesetoxic mortgages or which institution owned toxic mortgages, banks refusedto lend to each other. And what started out as a crisis of confidence withina market segment spread to the entire global financial market. Moreover,counter to what its proponents espoused, global diversification was shownto lack its assumed risk-reduction benefits in periods of extraordinary mar-ket stress. The ability of government regulations and legal precedent toprotect investors during periods of market stress also showed its weak-ness. Legally required rating completely vitiated the ability of fiduciariesto substitute independent analysis and judgment for letter ratings in meet-ing the time-tested reasonable person standard. And once again, marketslearned that algorithmic-based models, as well as discretionary assessmentsof bond risk, when unsupported by transparent information, cannot oftenbe relied on in periods of crisis. The current European sovereign debt crisis

34 POSTMODERN INVESTMENT
is illustrative of this latter point. For all practical purposes this is an eco-nomic crisis imbedded in the political uncertainty of whether there will be aunited Europe.
The changing world of equities mirrored, in part, the changing worldof fixed income. Many of the advancements in asset pricing and riskmanagement have been centered on the valuation of equities. During the1970s, when the revolution in bond valuation and fixed-income managementwas starting, similar changes were being experienced in equity investmentmanagement. Regulatory changes in the mid-1970s created the EmployeeRetirement and Income Security Act (ERISA) of 1974. By requiring thatpension plans must provide for vesting of employees’ pension benefits, theAct helped foster a new industry focused on building investment productsfor the pension fund industry. By the mid-1980s, public and private pensionfunds were holding large pools of capital, and new tools were created (e.g.,equity futures contracts and options on equity futures) to help managethe equity risk of those pools of capital. The growth of pension fundsand institutional money shifted the way investors viewed financial assetsand their place in asset allocation. The hot product of the mid-1980s wasknown as portfolio insurance, a product that used futures contracts as ameans to replicate an option position that would supposedly protect thedownside valuation of equity-based portfolios. It did not, as the 1987 marketcrash proved.
The failure of futures-based portfolio insurance in 1987 did not stopthe investment community from trying to find alternative solutions toportfolio risk management. In the mid-1980s changes in technology alsodrove changes in how investors viewed and managed equity portfolios.For the first time, portable computers were available as well as softwarethat offered research and trading teams the ability to look inside port-folios as a way to determine underlying risks and market sensitivities.Also, in the 1980s additional forms of data became increasingly available,including daily prices for a range of exchange-traded assets and equities,futures, option contracts, and services that offered analyst estimates of afirm’s expected earnings. All of this information created a new culture ofequity research that no longer centered solely on measuring a firm’s betabut also attempted to capture the wide range of market factors drivinginvestor returns.
By the late 1980s, both practitioners and academics were concentratingon reviewing the principal tools (e.g., alpha and beta) by which we attempt todetermine fundamental asset risk as well as the ability of managers to createvalue. The growth of these large pools of capital not only encouraged newways of managing performance and risk, it also gave impetus to the activemanagement business and its corollary segments. In addition to professional

Equity and Fixed Income 35
money managers, we also had the growth of investment consulting firms thatdeclared their ability to manage the individual managers who manage thismoney. This new paradigm declared beta dead, and new multifactor modelsof return estimation came into existence. These equity-return estimationmodels look to firm size (large cap and small cap), investment strategy(value and growth), and price patterns (momentum) as additional factorsto describe return movement.4 The ability to determine the unique marketor firm factors driving equity return as well as the ability of individualmanagers to offer special benefits remains at the center of equity valuation,risk management, and portfolio creation.
Throughout all of the changes there remains a constant—expectedreturn is a function of risk (i.e., there are no solutions without returnand/or risk impact), and an investor can fundamentally adjust the normalreturn and risk profile through a number of financial instruments, includingfutures, options or their synthetic alternatives.
A BRIEF REVIEW
Historically, equity and fixed-income investments have been the major partof an investor’s asset-allocation decision. In recent years, the number ofinvestable equity and fixed-income indices and structure investments (e.g.,exchange-traded funds [ETFs]) has increased dramatically. Today, we havethe ability to create almost any portfolio of equity or fixed-income securities,each based on a unique vision of the required return and risk characteristics(e.g., country based, industry based, fundamental-factor based, and so on).The question that remains is the degree to which each of these new equityand fixed-income products provides unique return and risk opportunitiesat the macro, asset-sector, or manager levels. For example, there exists arange of macroeconomic-based investment models that purport to showthat equity valuation is related to gross domestic product (GDP) growth,and fixed-income valuation to the real rate of production plus inflationplus some risk premium. More micro firm-based investment models, whichconcentrate on elements such as earnings per share and dividends, alsoprovide a basis for relative valuation; however, each investment product hasdiffering strengths (increasing earnings per share and dividends are oftensignals of firm strength) and weaknesses (factor-specific portfolios are oftenvery concentrated, and the historical track record may not reflect currentrisk-and-return opportunities).
Despite the common problem of uncertainty as to the quality of thevaluation and selection models in both fixed-income and equity investment,there is common agreement that both stocks and bonds in an investment
36 POSTMODERN INVESTMENT
portfolio increase the investor’s ability to manage expected return andexpected risk. The question often raised by academics and practitioners hasless to do with the potential benefits of stock and bond investments and moreto do with whether passive investment in contrast to active managementmay provide similar benefits with less cost.
EQUITY AND FIXED-INCOME STYLES AND BENCHMARKS
Most traditional investment strategies are divided into the markets in whichmanagers trade and the type of trading that takes place in those markets.For equities and fixed income, for example, investing has been dividedinto the markets (e.g., U.S. and non-U.S.), industrial sectors (e.g., energy,technology), and some of the unique approaches to trading (e.g., large cap,small cap, value, and growth). For each of these forms of trading andmarkets traded, investment benchmarks have been created.
In many investment reviews, the Standard & Poor’s (S&P) 500 andthe Russell 2000 indices are used as the primary representative U.S. equityindices. MSCI Europe, Australasia, Far East (EAFE) and Emerging Mar-kets (EM) are used as the primary non-U.S. equity indices. BarCap U.S.Government, BarCap U.S. Aggregate, and BarCap U.S. Corporate HighYield Bond indices are used as the primary representative U.S. fixed-incomeindices. BarCap Global Government Bond Index, BarCap Global AggregateBond Index, and the J.P. Morgan Emerging Market Bond Index (EMBI)are the three primary non-U.S. fixed-income indices. Each index has itsown unique return and risk characteristics. For example, the S&P 500 isan asset-weighted index, such that those firms with the highest stock priceand the greatest number of shares outstanding have a greater effect on thevaluation of the index. In fact, the S&P 500 has often been called a growthindex of 50 stocks that matter and 450 stocks that do not. The methodol-ogy of a growth index is that as prices increase, the impact of individualstocks as measured by asset weight on the index increases. Investors shouldcontinuingly update their understanding of the current composition of eachindex and how it is expected to perform in the current market environment,not how it performed in a past market environment dissimilar to today’s.
BASIC SOURCES OF RISK AND RETURN
The benefits of traditional stock and bond investments are almost a truismamong most investors. As discussed in the previous section, there are anumber of quantitative models that provide a basis for determining anexpected individual stock (e.g., capital asset pricing model [CAPM]) or
Equity and Fixed Income 37
bond return (i.e., duration for U.S. Treasury bonds) or for determining theimpact of changes in firm or macroeconomic events on actual stock marketor bond returns. At its most basic, the value of either investment is a functionprimarily of its ability to generate cash flow and the risk associated withthose cash flows in comparison to risk-returns provided by other investableassets or benchmarks.
Indicative of the difficulty for an average investor to determine whichcountry or which sector or which security to invest in, major investment firmsspend large amounts of money in an attempt to determine the importanceof the various firm and macro factors that drive the valuation of equitysecurities. Over time, however, the importance of firm and macro factorschange. Equally important, the relative domestic and global impact of thesefactors has also changed over time. One of the problems in focusing on thebasic sources of return and risk is not that we are unfamiliar with the basicdynamics of what affects the valuation of a firm (e.g., cash flow and requiredreturn), but that once a firm invests millions of dollars on a particularapproach, it is difficult for the firm to change directions in its asset-selectionprocess unless the model completely falls apart. As a sidebar, academics arejust as much at fault as practitioners. Despite considerable research5 thathas called into question CAPM and multifactor models, academics continueto reference and use these models as the basis for risk and performanceanalysis (all well and good) and in estimating expected returns (which isquestionable, in that over the past 20 years there have been periods whenthe model has worked well and others when its value has been marginal).
Simple models of asset valuation may also work, as may more com-plicated versions. The day the first draft of this chapter was written, themarkets were working as they should; the U.S. employment number was115,000 compared to the expected 150,000, and all sectors in the U.S. stockmarket fell. If there is an unexpected decrease in new hiring, there may bean assumption that firms see a decline in economic activity and thereby anunexpected decrease in the level of future cash flows to firms; as a result,stock prices unexpectedly fall. Similarly, risky bonds that are paid from theexcess earnings of firms may fall as the expected future earnings of firmsfall, and the potential for bonds’ future coupon payments is reduced. Bondswith little or no risk may increase in value as individuals think that in thefuture the government may reduce interest rates thereby increasing the valueof low-risk government bonds.
If an investor cannot predict where the market is going, is there anyevidence that U.S. equity mutual fund managers outperform simple passivebenchmarks? In short, mutual funds may provide the risk-and-return benefitsto individual investors, but questions still arise if certain managers of activelymanaged portfolios outperform a passive benchmark and their peers. To

38 POSTMODERN INVESTMENT
demonstrate their ability in generating excess returns (i.e., positive alphas),money managers have to rely on their past performance. Those who investwith managers and those who evaluate money managers also have to relyon past performance. The important question is, therefore, whether activemutual fund managers provide unique investment skills either in terms oftheir ability to time the market or in their ability to select undervaluedsecurities. In addition, an investor may wish to determine whether pastperformance has any predictive power about future performance. If pastperformance can predict future performance, then a portfolio consisting ofbest-performing managers should outperform a randomly selected portfolioof money managers. Investors should be warned, however, that there islittle if any evidence that past performance can predict future performanceor that best-performing managers outperform a randomly selected portfolioof similar strategy-based money managers. If information enters the marketin a random fashion, the strategy that benefits from unexpected goodinformation is also hurt by unexpected bad information. For a period,any manager can get a series of good unexpected information, but that isluck, not skill, although from the numbers it is hard to tell the difference.In addition, as pointed out previously, although a manager may showhistorical outperformance, it is difficult to determine if that outperformanceis skill or luck. This is not to say that skill does not exist—only that ifthere is a manager with extreme skill, that manager will probably chargehigher fees than another manager, such that the after-fee returns of thetwo managers may well be similar. In sum, all of the available researchshows that collectively, managers do not outperform passive indices, andthe probability of choosing the unique manager who does is remote.
PERFORMANCE: FACT AND FICTION
As markets evolve there is a constant struggle to remain current as to whatis fact and what is fiction within any one or number of asset classes. Aswe discussed in previous sections, over the past decades, our understandingof how equity and fixed-income securities are priced and how to evaluatetheir risks has changed. In the following sections, we provide evidence notonly on the stand-alone risks of stock and bond investments, but on theinterrelationships within and between equity and fixed-income markets. Weexamine these markets over a broad time period, as well as on shortertime intervals (e.g., annual) as well as their relative performance in extrememarket conditions. Results show that as expected equity markets generallyoffer both high return as well as higher risk than comparison fixed-incomeinvestments, and equity markets generally have a relatively low correlationwith certain fixed-income markets; combining equity and fixed income oftenresults in a superior return-to-risk trade-off.
Equity and Fixed Income 39
Results also show that some of what we espouse to investors may beregarded more toward fiction than fact. For example, results also show that
■ There is a high correlation (e.g., low diversification benefits) betweendomestic and international equity as well as between domestic andinternational fixed income.
■ Certain fixed-income investments (e.g., fixed-income high yield) may beregarded as equity return enhancers rather than equity risk reducers.
■ Especially in periods of extreme equity market movements, both domes-tic and international equity have similar return patterns and providelittle evidence of diversification benefit.
Results also show that in periods of extreme equity market movements,equity sectors within the S&P 500 also have similar return patterns andprovide little evidence of diversification benefit, and investors should nottake the return and risk performance from extended time frames as a basisfor how equity and fixed income may perform over relative shorter timeperiods (e.g., annual). Also, evidence derived over long investment periodsas to the benefits of certain investment strategies (e.g., value versus growthor small cap versus large cap) may not reflect the variability in relativeperformance when analyzed over shorter time intervals (e.g., annual).
RETURN AND RISK CHARACTERISTICS
Although we have argued against the use of historical data as the sole basisfor describing the return and risk characteristics of either equity or fixedincome, there are certain benefits in examining the historical risk and returncharacteristics of various asset classes. Exhibits 2.1 and 2.2 display thisinformation for a wide range of equity and fixed-income indices coveringthe period 1994–2011. As shown in Exhibit 2.1, for this period the S&P500 exhibited a lower annualized standard deviation (15.7 percent) thanthe comparison equity indices (i.e., Russell 2000 [20.3 percent], MSCIEAFE [17.0 percent], and MSCI EM [24.5 percent]). This is consistent withthe expectations of most investors, who believe that U.S. large-cap indices(e.g., S&P 500) have lower volatility than small-cap U.S. equity indices(e.g., Russell 2000), developed non-U.S. indices (e.g., MSCI EAFE), andemerging markets indices (e.g., MSCI EM). Over the period of analysis, theS&P 500 also reported similar annualized total return (7.7 percent) to theRussell 2000 (7.5 percent) and higher annualized total return than the MSCIEAFE (4.2 percent) and the MSCI EM (3.0 percent). Moreover, stand-alonehistorical return and risk comparison may not reflect the potential forthe benefits of the S&P 500 or other equity indices when combined with
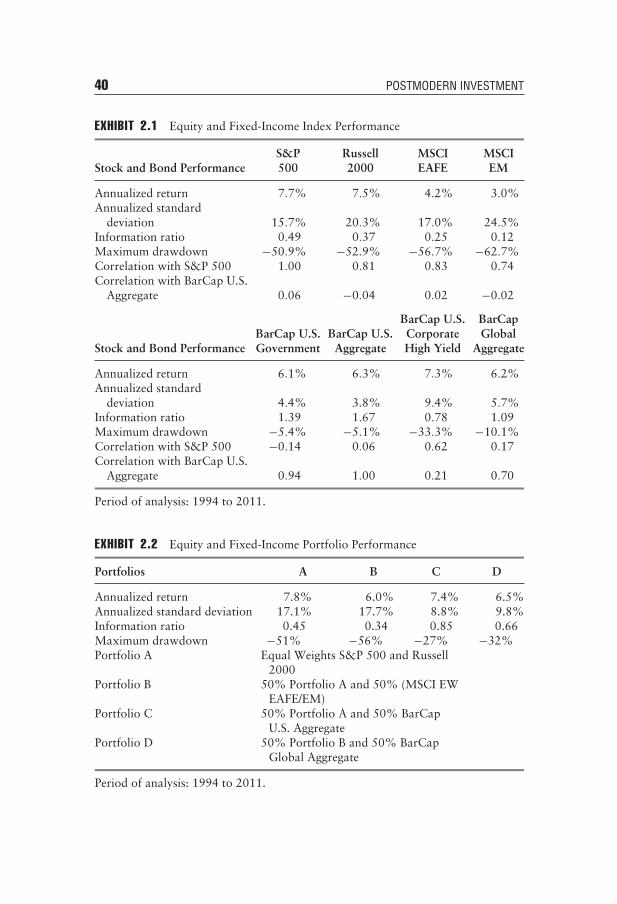
40 POSTMODERN INVESTMENT
EXHIBIT 2.1 Equity and Fixed-Income Index Performance
S&P Russell MSCI MSCIStock and Bond Performance 500 2000 EAFE EM
Annualized return 7.7% 7.5% 4.2% 3.0%Annualized standard
deviation 15.7% 20.3% 17.0% 24.5%Information ratio 0.49 0.37 0.25 0.12Maximum drawdown −50.9% −52.9% −56.7% −62.7%Correlation with S&P 500 1.00 0.81 0.83 0.74Correlation with BarCap U.S.
Aggregate 0.06 −0.04 0.02 −0.02
BarCap U.S. BarCapBarCap U.S. BarCap U.S. Corporate Global
Stock and Bond Performance Government Aggregate High Yield Aggregate
Annualized return 6.1% 6.3% 7.3% 6.2%Annualized standard
deviation 4.4% 3.8% 9.4% 5.7%Information ratio 1.39 1.67 0.78 1.09Maximum drawdown −5.4% −5.1% −33.3% −10.1%Correlation with S&P 500 −0.14 0.06 0.62 0.17Correlation with BarCap U.S.
Aggregate 0.94 1.00 0.21 0.70
Period of analysis: 1994 to 2011.
EXHIBIT 2.2 Equity and Fixed-Income Portfolio Performance
Portfolios A B C D
Annualized return 7.8% 6.0% 7.4% 6.5%Annualized standard deviation 17.1% 17.7% 8.8% 9.8%Information ratio 0.45 0.34 0.85 0.66Maximum drawdown −51% −56% −27% −32%Portfolio A Equal Weights S&P 500 and Russell
2000Portfolio B 50% Portfolio A and 50% (MSCI EW
EAFE/EM)Portfolio C 50% Portfolio A and 50% BarCap
U.S. AggregatePortfolio D 50% Portfolio B and 50% BarCap
Global Aggregate
Period of analysis: 1994 to 2011.
Equity and Fixed Income 41
other traditional assets, such as fixed-income indices. For example, for theperiod of analysis the S&P 500 had a relatively high correlation (0.74 andabove) with the other U.S. and non-U.S. equity indices; however, it had lowcorrelations with the BarCap U.S. Government (−0.14) and U.S. Aggregate(0.06) fixed-income indices. The relatively high correlation of the S&P 500with the BarCap U.S. Corporate High Yield fixed-income index (0.62) maylead investors to question high-yield fixed income as a primary means ofdiversification for equity-dominated portfolios.
Modern portfolio theory (MPT), however, emphasizes that the benefitsof individual assets should be evaluated on their performance alongsideother assets in investors’ portfolios. The diversification benefits of addingany individual investment to other assets or other asset portfolios dependon the comparison stand-alone investment. The relatively high correlationbetween the S&P 500 combined and a range of equity financial assets(e.g., MSCI EAFE, MSCI EM) may indicate that a portfolio of non-U.S.equities may provide only minimal reduction in the risk (i.e., standarddeviation) to a U.S.-dominated equity portfolio. For the period of analysis(see Exhibit 2.2), adding an equal portion (50 percent) of non-U.S. equityto an equal-weighted (EW) U.S.-equity portfolio resulted in a somewhatlower annualized total return (6.0 percent) and a similar standard deviation(17.7 percent) as the pure U.S. stock, which had a return of 7.8 percent anda standard deviation of 17.1 percent.
In contrast, adding U.S. fixed income (i.e., BarCap U.S. Aggregate) tothe portfolio of U.S. and international stocks resulted in a portfolio (seePortfolio C) that exhibits a somewhat higher return (7.4 percent) to PortfolioB (6.0 percent) but with a considerably lower standard deviation (8.8 percentversus 17.7 percent for Portfolio B). The addition of an international fixed-income portfolio (i.e., BarCap Global Aggregate) to Portfolio B likewiseresulted in a portfolio (see Portfolio D) that did not have dramaticallydifferent return and risk characteristics in comparison to Portfolio C but didresult in a portfolio with considerable lower risk than a stock-only portfolio.
The ability of fixed-income investments to provide risk reduction oppor-tunities as additions to a sample equity portfolio is indicative of the potentialability of fixed income (when combined with equity) to provide a posi-tive return-to-risk trade-off over a lengthy time period. Investors must bewarned, however. First, as mentioned previously and expanded on later,performance in a single period is not indicative of relative performance inother periods. Second, the S&P 500 is only one of several equity indices;other equity indices may provide different performance results. Third, thereis no requirement that investors invest in a single composite equity index.Exhibit 2.3 shows return and risk performance for S&P 500 equity sectorindices over the 1994–2011 period as well as the relative performance
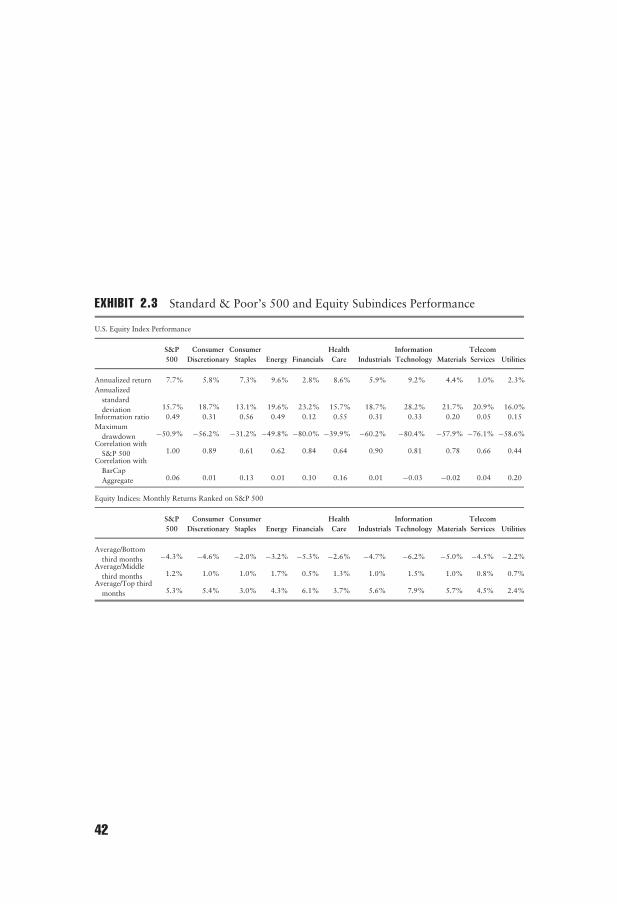
EXHIBIT 2.3 Standard & Poor’s 500 and Equity Subindices Performance
U.S. Equity Index Performance
S&P Consumer Consumer Health Information Telecom500 Discretionary Staples Energy Financials Care Industrials Technology Materials Services Utilities
Annualized return 7.7% 5.8% 7.3% 9.6% 2.8% 8.6% 5.9% 9.2% 4.4% 1.0% 2.3%Annualized
standarddeviation 15.7% 18.7% 13.1% 19.6% 23.2% 15.7% 18.7% 28.2% 21.7% 20.9% 16.0%
Information ratio 0.49 0.31 0.56 0.49 0.12 0.55 0.31 0.33 0.20 0.05 0.15Maximum
drawdown −50.9% −56.2% −31.2% −49.8% −80.0% −39.9% −60.2% −80.4% −57.9% −76.1% −58.6%Correlation with
S&P 500 1.00 0.89 0.61 0.62 0.84 0.64 0.90 0.81 0.78 0.66 0.44Correlation with
BarCapAggregate 0.06 0.01 0.13 0.01 0.10 0.16 0.01 −0.03 −0.02 0.04 0.20
Equity Indices: Monthly Returns Ranked on S&P 500
S&P Consumer Consumer Health Information Telecom500 Discretionary Staples Energy Financials Care Industrials Technology Materials Services Utilities
Average/Bottomthird months −4.3% −4.6% −2.0% −3.2% −5.3% −2.6% −4.7% −6.2% −5.0% −4.5% −2.2%
Average/Middlethird months 1.2% 1.0% 1.0% 1.7% 0.5% 1.3% 1.0% 1.5% 1.0% 0.8% 0.7%
Average/Top thirdmonths 5.3% 5.4% 3.0% 4.3% 6.1% 3.7% 5.6% 7.9% 5.7% 4.5% 2.4%
42
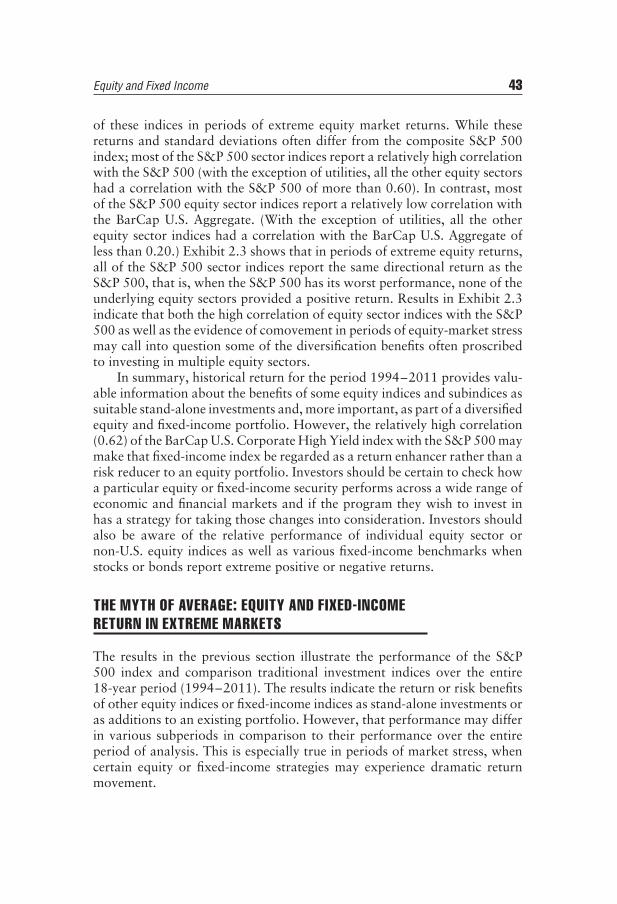
Equity and Fixed Income 43
of these indices in periods of extreme equity market returns. While thesereturns and standard deviations often differ from the composite S&P 500index; most of the S&P 500 sector indices report a relatively high correlationwith the S&P 500 (with the exception of utilities, all the other equity sectorshad a correlation with the S&P 500 of more than 0.60). In contrast, mostof the S&P 500 equity sector indices report a relatively low correlation withthe BarCap U.S. Aggregate. (With the exception of utilities, all the otherequity sector indices had a correlation with the BarCap U.S. Aggregate ofless than 0.20.) Exhibit 2.3 shows that in periods of extreme equity returns,all of the S&P 500 sector indices report the same directional return as theS&P 500, that is, when the S&P 500 has its worst performance, none of theunderlying equity sectors provided a positive return. Results in Exhibit 2.3indicate that both the high correlation of equity sector indices with the S&P500 as well as the evidence of comovement in periods of equity-market stressmay call into question some of the diversification benefits often proscribedto investing in multiple equity sectors.
In summary, historical return for the period 1994–2011 provides valu-able information about the benefits of some equity indices and subindices assuitable stand-alone investments and, more important, as part of a diversifiedequity and fixed-income portfolio. However, the relatively high correlation(0.62) of the BarCap U.S. Corporate High Yield index with the S&P 500 maymake that fixed-income index be regarded as a return enhancer rather than arisk reducer to an equity portfolio. Investors should be certain to check howa particular equity or fixed-income security performs across a wide range ofeconomic and financial markets and if the program they wish to invest inhas a strategy for taking those changes into consideration. Investors shouldalso be aware of the relative performance of individual equity sector ornon-U.S. equity indices as well as various fixed-income benchmarks whenstocks or bonds report extreme positive or negative returns.
THE MYTH OF AVERAGE: EQUITY AND FIXED-INCOMERETURN IN EXTREME MARKETS
The results in the previous section illustrate the performance of the S&P500 index and comparison traditional investment indices over the entire18-year period (1994–2011). The results indicate the return or risk benefitsof other equity indices or fixed-income indices as stand-alone investments oras additions to an existing portfolio. However, that performance may differin various subperiods in comparison to their performance over the entireperiod of analysis. This is especially true in periods of market stress, whencertain equity or fixed-income strategies may experience dramatic returnmovement.
44 POSTMODERN INVESTMENT
In Exhibit 2.3, we reported the performance of various S&P 500 sectorindices when ranked on the S&P 500. Similarly, Exhibit 2.4 shows monthlyU.S. and non-U.S. stock and bond indices returns ranked on the S&P 500and grouped into three segments (bottom, middle, and top) of 72 monthseach, with average returns for each index presented. Results show that inthe periods of the worst and best S&P 500 months both the comparisondomestic and international equity indices had similar negative and positivereturns to the S&P 500. In contrast, the comparison fixed-income indiceshad positive returns on average (with the exception of the BarCap U.S.Corporate High Yield Index) in the worst S&P 500 return months andalso provided positive returns (although less than the S&P 500) in the bestS&P 500 return months. The positive performance in up markets may bepartially caused by the positive economic conditions (e.g., reduced creditrisk) driving both stock and fixed-income prices higher.
The superior performance of the fixed-income index when the S&P500 performs poorly may be driven by various factors. First, bonds have
Average/Middle Third Months (%)Average/Bottom Third Months (%) Average/Top Third Months (%)
S&P 500 –4.3 1.2 5.3Russell 2000 –4.8 2.0 5.1MSCI EAFE –3.9 1.0 4.3MSCI EM –5.2 1.4 5.4BarCap U.S. Government 0.7 0.3 0.5BarCap U.S. Aggregate 0.5 0.4 0.7BarCap U.S.Corporate High Yield –1.1 0.9 2.1BarCap Global Aggregate 0.3 0.3 0.9
–6.0%
–4.0%
–2.0%
0.0%
2.0%
4.0%
6.0%
Aver
age
Mon
thly
Ret
urns
EXHIBIT 2.4 Equity and Fixed-Income Indices: Monthly Return Ranked on theS&P 500Period of analysis: 1994 to 2011.

Equity and Fixed Income 45
a prior claim on corporate earnings and assets. Second, if the economyis slowing down, then equities would perform poorly because of lowerexpected corporate earnings, but bonds may perform well to the degreethat real rates and nominal rates decline in a declining economy (e.g., aweaker economy may mean lower expected inflation). Third, high-qualityfixed-income securities are more liquid than equities, and in periods offinancial distress, some institutional investors would move into high-qualityfixed-income instruments because of their liquidity—the so-called flightto quality. Results in Exhibit 2.5 show that when the returns are rankedon the BarCap U.S. Aggregate, the equity indices had a positive return inthe worst BarCap U.S. Aggregate return months and generally providedpositive returns (although less than the BarCap U.S. Aggregate) in thebest BarCap U.S. Aggregate return months. The superior performance indown BarCap U.S. Aggregate months and the participation in up mar-kets may be partially caused by the ability of equities to participate inpositive return opportunities in periods of low fixed-income returns, aswell as to obtain positive returns even in periods of positive fixed-incomereturn conditions.
Average/Middle Third Months (%) Average/Top Third Months (%)
BarCap U.S. Aggregate –0.7 0.6 1.6S&P 500 0.3 1.3 0.6Russell 2000 1.1 1.1 0.1MSCI EAFE 0.2 1.0 0.2MSCI EM 0.7 1.3 –0.5BarCap U.S. Government –0.8 0.5 1.8BarCap U.S.Corporate High Yield 0.0 0.9 1.0BarCap Global Aggregate –0.7 0.5 1.7
–1.0%
–0.5%
0.0%
0.5%
1.0%
1.5%
2.0%
Aver
age
Mon
thly
Ret
urn
Average/Bottom Third Months (%)
EXHIBIT 2.5 Equity and Fixed-Income Indices: Monthly Return Ranked on theBarCap U.S. AggregatePeriod of analysis: 1994 to 2011.
46 POSTMODERN INVESTMENT
ANNUAL PERFORMANCE
In this section, we provide a review of the relative performances by year,of the primary equity and fixed-income indices. Results in Exhibit 2.6 showthat over the entire period, the annual returns of the S&P 500, BarCap U.S.Aggregate, and the other equity and fixed-income indices varied in manyyears. However, in 6 of the 18 years, the BarCap U.S. Aggregate and theS&P 500 moved in opposite directions.
Similarly, Exhibits 2.7 through 2.9 show the relative volatility of theindices as well as the intra-year correlation of the various equity and fixed-income indices with the S&P 500 and the BarCap U.S. Aggregate. Results inExhibit 2.7 also show that the relative volatility of the fixed-income indiceshas consistently remained below that of the S&P 500. However, Exhibits 2.8through 2.9 show that the intra-year correlation of the various equity andfixed-income indices with the S&P 500 and the BarCap U.S. Aggregatevaries over the years of analysis. In short, investors should be aware thatresults from longer time frames may not reflect results for individual years.
PERFORMANCE IN 2008
The relative performance of various asset classes in 2008 requires specialemphasis. In 2008, global investment markets underwent a severe correctionacross most traditional and alternative investment markets. In that year, theS&P 500 and high-risk fixed income were impacted by the subprime crisis.For the first six months of the year, the S&P 500 had a negative returnof −11.9 percent, while in the second six months, the S&P 500 Index hada negative return of −28.5 percent, as markets responded to the decliningdrop in expected corporate profitability associated with declining globaldemand. In contrast, for the first six months of the year, the BarCap U.S.Government Index had a positive return of 2.1 percent, while in the secondsix months, the BarCap U.S. Government Index had a positive return of10.1 percent, as investors had a flight to safety. That is, there was not one2008 but several 2008s in that some asset classes performed well whileothers reported extreme negative returns.
SPECIAL ISSUES: MAKING SENSE OUT OF TRADITIONALSTOCK AND BOND INDICES
Stock and bond indices have formed the basis for much of asset-allocationresearch. For example, in the 1960s, the introduction of the international
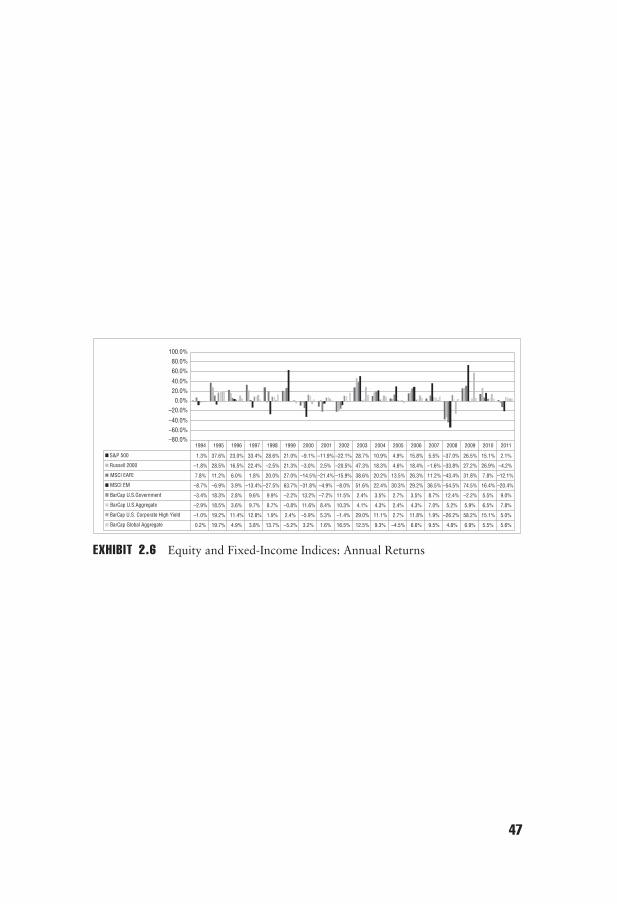
1994 1995 1996 1997 1998 1999 2000 2001 2002 2003 2004 2005 2006 2007 2008 2009 2010 2011
S&P 500 1.3% 37.6% 23.0% 33.4% 28.6% 21.0% –9.1% –11.9% –22.1% 28.7% 10.9% 4.9% 15.8% 5.5% –37.0% 26.5% 15.1% 2.1%
Russell 2000 –1.8% 28.5% 16.5% 22.4% –2.5% 21.3% –3.0% 2.5% –20.5% 47.3% 18.3% 4.6% 18.4% –1.6% –33.8% 27.2% 26.9% –4.2%
MSCI EAFE 7.8% 11.2% 6.0% 1.8% 20.0% 27.0% –14.5% –21.4% –15.9% 38.6% 20.2% 13.5% 26.3% 11.2% –43.4% 31.8% 7.8% –12.1%
MSCI EM –8.7% –6.9% 3.9% –13.4% –27.5% 63.7% –31.8% –4.9% –8.0% 51.6% 22.4% 30.3% 29.2% 36.5% –54.5% 74.5% 16.4% –20.4%
BarCap U.S.Government –3.4% 18.3% 2.8% 9.6% 9.9% –2.2% 13.2% –7.2% 11.5% 2.4% 3.5% 2.7% 3.5% 8.7% 12.4% –2.2% 5.5% 9.0%
BarCap U.S.Aggregate –2.9% 18.5% 3.6% 9.7% 8.7% –0.8% 11.6% 8.4% 10.3% 4.1% 4.3% 2.4% 4.3% 7.0% 5.2% 5.9% 6.5% 7.8%
BarCap U.S. Corporate High Yield –1.0% 19.2% 11.4% 12.8% 1.9% 2.4% –5.9% 5.3% –1.4% 29.0% 11.1% 2.7% 11.8% 1.9% –26.2% 58.2% 15.1% 5.0%
BarCap Global Aggregate 0.2% 19.7% 4.9% 3.8% 13.7% –5.2% 3.2% 1.6% 16.5% 12.5% 9.3% –4.5% 6.6% 9.5% 4.8% 6.9% 5.5% 5.6%
–80.0%–60.0%–40.0%
–20.0%0.0%
20.0%40.0%
60.0%80.0%
100.0%
EXHIBIT 2.6 Equity and Fixed-Income Indices: Annual Returns
47
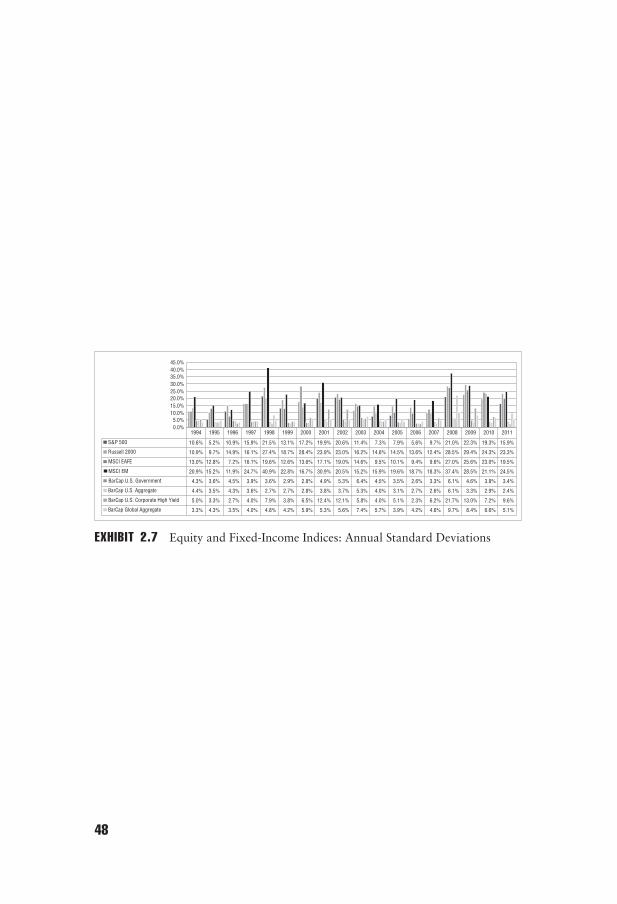
1994 1995 1996 1997 1998 1999 2000 2001 2002 2003 2004 2005 2006 2007 2008 2009 2010 2011
S&P 500 10.6% 5.2% 10.9% 15.9% 21.5% 13.1% 17.2% 19.9% 20.6% 11.4% 7.3% 7.9% 5.6% 9.7% 21.0% 22.3% 19.3% 15.9%
Russell 2000 10.9% 9.7% 14.9% 16.1% 27.4% 18.7% 28.4% 23.9% 23.0% 16.2% 14.6% 14.5% 13.6% 12.4% 28.5% 29.4% 24.3% 23.3%
MSCI EAFE 13.0% 12.8% 7.2% 16.1% 19.6% 12.6% 13.6% 17.1% 19.0% 14.6% 9.5% 10.1% 9.4% 9.6% 27.0% 25.6% 23.0% 19.5%
MSCI EM 20.9% 15.2% 11.9% 24.7% 40.9% 22.8% 16.7% 30.9% 20.5% 15.2% 15.9% 19.6% 18.7% 18.3% 37.4% 28.5% 21.1% 24.5%
BarCap U.S. Government 4.3% 3.6% 4.5% 3.9% 3.6% 2.9% 2.8% 4.9% 5.3% 6.4% 4.5% 3.5% 2.6% 3.3% 6.1% 4.6% 3.8% 3.4%
BarCap U.S. Aggregate 4.4% 3.5% 4.3% 3.6% 2.7% 2.7% 2.8% 3.8% 3.7% 5.3% 4.0% 3.1% 2.7% 2.6% 6.1% 3.3% 2.9% 2.4%
BarCap U.S. Corporate High Yield 5.0% 3.3% 2.7% 4.0% 7.9% 3.8% 6.5% 12.4% 12.1% 5.8% 4.0% 5.1% 2.3% 6.2% 21.7% 13.0% 7.2% 9.6%
BarCap Global Aggregate 3.3% 4.3% 3.5% 4.0% 4.8% 4.2% 5.9% 5.3% 5.6% 7.4% 5.7% 3.9% 4.2% 4.6% 9.7% 8.4% 6.6% 5.1%
0.0%5.0%
10.0%15.0%20.0%25.0%30.0%35.0%40.0%45.0%
EXHIBIT 2.7 Equity and Fixed-Income Indices: Annual Standard Deviations
48
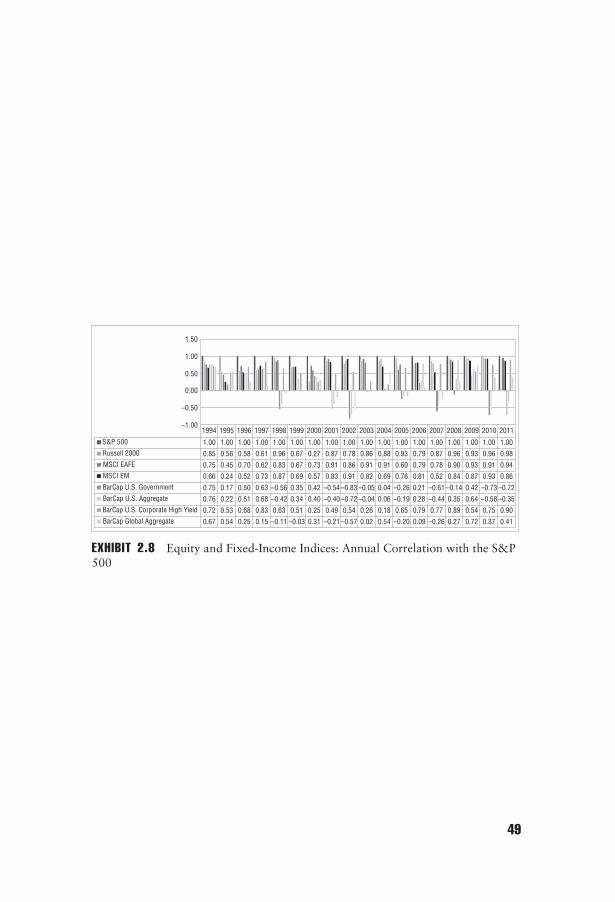
1994 1995 1996 1997 1998 1999 2000 2001 2002 2003 2004 2005 2006 2007 2008 2009 2010 2011
S&P 500 1.00 1.00 1.00 1.00 1.00 1.00 1.00 1.00 1.00 1.00 1.00 1.00 1.00 1.00 1.00 1.00 1.00 1.00Russell 2000 0.85 0.56 0.58 0.61 0.96 0.67 0.27 0.87 0.78 0.86 0.88 0.93 0.79 0.87 0.96 0.93 0.96 0.98MSCI EAFE 0.75 0.45 0.70 0.62 0.83 0.67 0.73 0.91 0.86 0.91 0.91 0.60 0.79 0.78 0.90 0.93 0.91 0.94MSCI EM 0.66 0.24 0.52 0.73 0.87 0.69 0.57 0.83 0.91 0.82 0.69 0.76 0.81 0.52 0.84 0.87 0.93 0.86BarCap U.S. Government 0.75 0.17 0.50 0.63 –0.56 0.35 0.42 –0.54 –0.83 –0.05 0.04 –0.26 0.21 –0.61 –0.14 0.42 –0.73 –0.72BarCap U.S. Aggregate 0.76 0.22 0.51 0.68 –0.42 0.34 0.40 –0.40 –0.72 –0.04 0.06 –0.19 0.28 –0.44 0.35 0.64 –0.58 –0.35BarCap U.S. Corporate High Yield 0.72 0.53 0.68 0.83 0.63 0.51 0.25 0.49 0.54 0.26 0.18 0.65 0.79 0.77 0.89 0.54 0.75 0.90BarCap Global Aggregate 0.67 0.54 0.25 0.15 –0.11 –0.03 0.31 –0.21 –0.57 0.02 0.54 –0.20 0.09 –0.26 0.27 0.72 0.37 0.41
–1.00
–0.50
0.00
0.50
1.00
1.50
EXHIBIT 2.8 Equity and Fixed-Income Indices: Annual Correlation with the S&P500
49

1994 1995 1996 1997 1998 1999 2000 2001 2002 2003 2004 2005 2006 2007 2008 2009 2010 2011
BarCap U.S. Aggregate 1.00 1.00 1.00 1.00 1.00 1.00 1.00 1.00 1.00 1.00 1.00 1.00 1.00 1.00 1.00 1.00 1.00 1.00
S&P 500 0.76 0.22 0.51 0.68 –0.42 0.34 0.40 –0.40 –0.72 –0.04 0.06 –0.19 0.28 –0.44 0.35 0.64 –0.58 –0.35
Russell 2000 0.57 –0.24 –0.28 0.39 –0.28 0.29 0.46 –0.45 –0.63 –0.24 0.09 –0.15 –0.09 –0.48 0.29 0.40 –0.65 –0.40
MSCI EAFE 0.55 –0.47 0.19 0.34 –0.73 0.30 0.76 –0.34 –0.62 0.11 0.11 –0.13 –0.10 –0.26 0.49 0.57 –0.39 –0.24
MSCI EM 0.44 0.02 0.00 0.22 –0.50 0.01 0.47 –0.30 –0.60 –0.21 0.49 –0.12 0.08 –0.35 0.44 0.49 –0.44 –0.23
BarCap U.S. Government 0.99 0.99 1.00 0.99 0.96 0.96 0.95 0.97 0.97 0.99 1.00 0.99 0.99 0.95 0.86 0.86 0.95 0.84
BarCap U.S. Corporate High Yield 0.77 0.62 0.68 0.77 –0.12 0.30 0.20 0.14 –0.18 0.41 0.58 0.20 0.48 –0.06 0.46 0.11 –0.05 –0.12
BarCap Global Aggregate 0.80 0.46 0.89 0.58 0.64 0.70 0.79 0.70 0.67 0.90 0.65 0.63 0.51 0.87 0.88 0.93 0.33 0.45
–1.00
–0.80–0.60
–0.40–0.200.00
0.20
0.400.60
0.801.00
1.20
EXHIBIT 2.9 Equity and Fixed-Income Indices: Annual Correlation with theBarCap U.S. Aggregate
50
Equity and Fixed Income 51
stock indices provided a much-needed basis for testing the potential benefitsof international equity investment. In the 1960s, Salomon Brothers bondindices were commonly used to offer historical performance informationon a range of fixed-income benchmarks. Unfortunately, most of that datahad a limited historical record. However, in the late 1970s, a historicalseries of U.S. stock and bond indices were created, with data going backto the 1920s. This data provided the ability to test the performance of theprimary stock and bond markets over a wide range of economic periods.Although the availability of this data provided the groundwork for testingthe potential benefits of various asset-allocation processes, asset allocatorsfailed to emphasize some of the problems in the use of generic stockor bond benchmarks. Investors should note that both equity and fixed-income benchmarks have their own unique portfolio characteristics. Forexample, if certain equity subsectors have risen and fallen in value overtime, their influence on the performance of the S&P 500 may also haverisen and fallen, such that the risk characteristics of today’s S&P 500may have little in common with the risk characteristics of the index 10 to15 years prior.
Analogous problems exist in the use of various bond indices. First, formany years, bond indices were created not from actual market prices butfrom what is commonly referred to as benchmark prices (i.e., computer-generated prices based on an assumed relative price movement to abenchmark bond). Second, many bond indices are based on maturity ratherthan duration. As a result, as coupon level moves, the underlying durationof some of the maturity-based bond indices may change, such that thesensitivity of the benchmark to changes in yield may change over time.Finally, as indicated for stocks, as the underlying bonds used to calculatethe bond index change (e.g., industry component), the sensitivity of theportfolio to various developments in market subsectors may also change.For example, in recent years, the increase in government debt has adjustedthe risk composition of the fixed-income BarCap U.S. Aggregate Bond Indexto better reflect that of a less risky government bond index.
Other problems exist in the use of international indices. First, mostasset-allocation programs use U.S.-dollar-based international stock indices.Over time, the returns to international stock indices may be dominatedby currency returns and not the underlying returns (i.e., local returns)in each country. Even international equity indices that are represented asfully hedged against changes in the U.S. dollar assume a perfect hedge.Today, problems in benchmark creation have partially led to an entireindustry of new investment products based on fundamental indices (e.g.,GDP weighted), which attempt to capture more basic changes in marketfactors affecting stock prices.
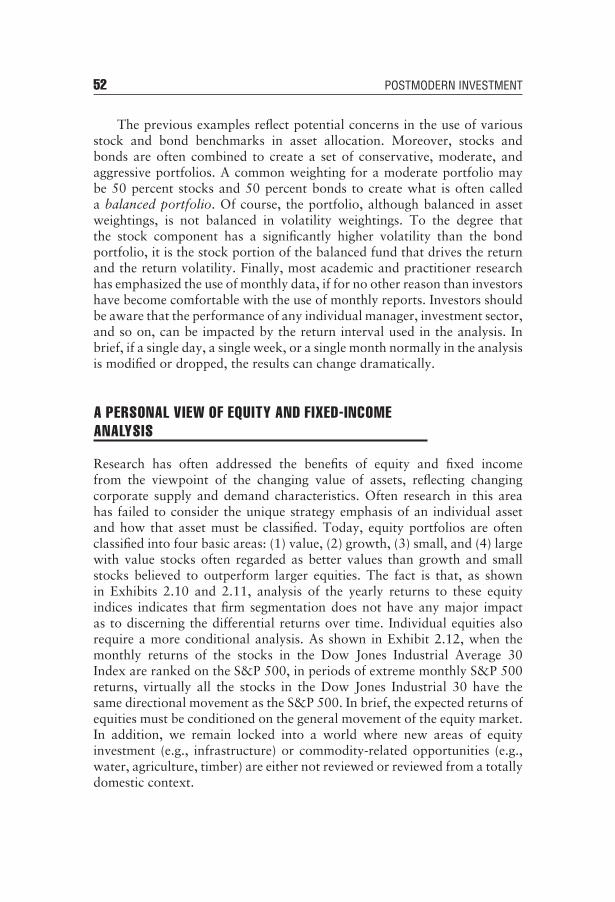
52 POSTMODERN INVESTMENT
The previous examples reflect potential concerns in the use of variousstock and bond benchmarks in asset allocation. Moreover, stocks andbonds are often combined to create a set of conservative, moderate, andaggressive portfolios. A common weighting for a moderate portfolio maybe 50 percent stocks and 50 percent bonds to create what is often calleda balanced portfolio. Of course, the portfolio, although balanced in assetweightings, is not balanced in volatility weightings. To the degree thatthe stock component has a significantly higher volatility than the bondportfolio, it is the stock portion of the balanced fund that drives the returnand the return volatility. Finally, most academic and practitioner researchhas emphasized the use of monthly data, if for no other reason than investorshave become comfortable with the use of monthly reports. Investors shouldbe aware that the performance of any individual manager, investment sector,and so on, can be impacted by the return interval used in the analysis. Inbrief, if a single day, a single week, or a single month normally in the analysisis modified or dropped, the results can change dramatically.
A PERSONAL VIEW OF EQUITY AND FIXED-INCOMEANALYSIS
Research has often addressed the benefits of equity and fixed incomefrom the viewpoint of the changing value of assets, reflecting changingcorporate supply and demand characteristics. Often research in this areahas failed to consider the unique strategy emphasis of an individual assetand how that asset must be classified. Today, equity portfolios are oftenclassified into four basic areas: (1) value, (2) growth, (3) small, and (4) largewith value stocks often regarded as better values than growth and smallstocks believed to outperform larger equities. The fact is that, as shownin Exhibits 2.10 and 2.11, analysis of the yearly returns to these equityindices indicates that firm segmentation does not have any major impactas to discerning the differential returns over time. Individual equities alsorequire a more conditional analysis. As shown in Exhibit 2.12, when themonthly returns of the stocks in the Dow Jones Industrial Average 30Index are ranked on the S&P 500, in periods of extreme monthly S&P 500returns, virtually all the stocks in the Dow Jones Industrial 30 have thesame directional movement as the S&P 500. In brief, the expected returns ofequities must be conditioned on the general movement of the equity market.In addition, we remain locked into a world where new areas of equityinvestment (e.g., infrastructure) or commodity-related opportunities (e.g.,water, agriculture, timber) are either not reviewed or reviewed from a totallydomestic context.
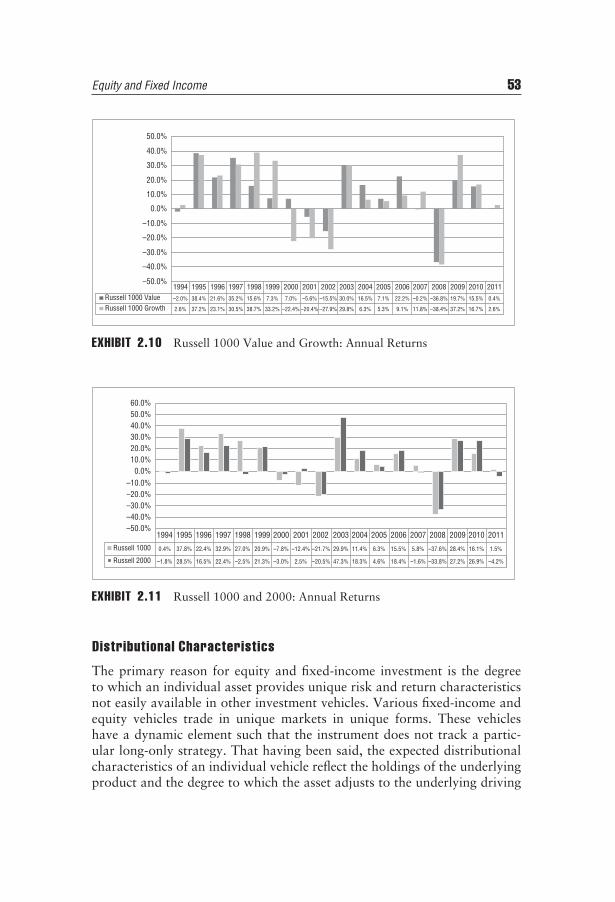
Equity and Fixed Income 53
1994 1995 1996 1997 1998 1999 2000 2001 2002 2003 2004 2005 2006 2007 2008 2009 2010 2011Russell 1000 Value –2.0% 38.4% 21.6% 35.2% 15.6% 7.3% 7.0% –5.6% –15.5% 30.0% 16.5% 7.1% 22.2% –0.2% –36.8% 19.7% 15.5% 0.4%
Russell 1000 Growth 2.6% 37.2% 23.1% 30.5% 38.7% 33.2% –22.4% –20.4% –27.9% 29.8% 6.3% 5.3% 9.1% 11.8% –38.4% 37.2% 16.7% 2.6%
–50.0%
–40.0%
–30.0%
–20.0%
–10.0%
0.0%
10.0%
20.0%
30.0%
40.0%
50.0%
EXHIBIT 2.10 Russell 1000 Value and Growth: Annual Returns
1994 1995 1996 1997 1998 1999 2000 2001 2002 2003 2004 2005 2006 2007 2008 2009 2010 2011
Russell 1000 0.4% 37.8% 22.4% 32.9% 27.0% 20.9% –7.8% –12.4% –21.7% 29.9% 11.4% 6.3% 15.5% 5.8% –37.6% 28.4% 16.1% 1.5%
Russell 2000 –1.8% 28.5% 16.5% 22.4% –2.5% 21.3% –3.0% 2.5% –20.5% 47.3% 18.3% 4.6% 18.4% –1.6% –33.8% 27.2% 26.9% –4.2%
–50.0%–40.0%–30.0%–20.0%–10.0%
0.0%10.0%20.0%30.0%40.0%50.0%60.0%
EXHIBIT 2.11 Russell 1000 and 2000: Annual Returns
Distributional Characteristics
The primary reason for equity and fixed-income investment is the degreeto which an individual asset provides unique risk and return characteristicsnot easily available in other investment vehicles. Various fixed-income andequity vehicles trade in unique markets in unique forms. These vehicleshave a dynamic element such that the instrument does not track a partic-ular long-only strategy. That having been said, the expected distributionalcharacteristics of an individual vehicle reflect the holdings of the underlyingproduct and the degree to which the asset adjusts to the underlying driving
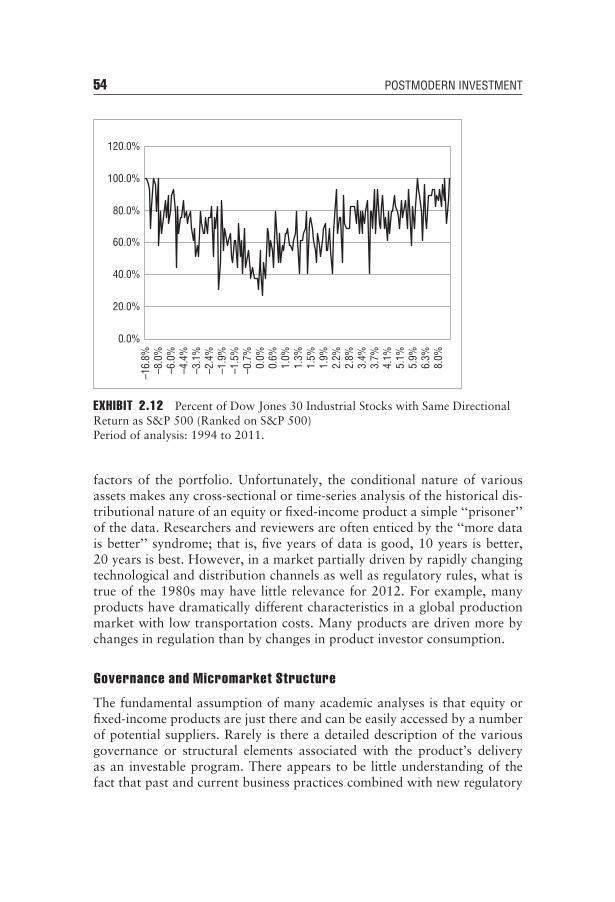
54 POSTMODERN INVESTMENT
0.0%
20.0%
40.0%
60.0%
80.0%
100.0%
120.0%–1
6.8%
–8.0
%–6
.0%
–4.4
%–3
.1%
–2.4
%–1
.9%
–1.5
%–0
.7%
0.0%
0.6%
1.0%
1.3%
1.5%
1.9%
2.2%
2.8%
3.4%
3.7%
4.1%
5.1%
5.9%
6.3%
8.0%
EXHIBIT 2.12 Percent of Dow Jones 30 Industrial Stocks with Same DirectionalReturn as S&P 500 (Ranked on S&P 500)Period of analysis: 1994 to 2011.
factors of the portfolio. Unfortunately, the conditional nature of variousassets makes any cross-sectional or time-series analysis of the historical dis-tributional nature of an equity or fixed-income product a simple ‘‘prisoner’’of the data. Researchers and reviewers are often enticed by the ‘‘more datais better’’ syndrome; that is, five years of data is good, 10 years is better,20 years is best. However, in a market partially driven by rapidly changingtechnological and distribution channels as well as regulatory rules, what istrue of the 1980s may have little relevance for 2012. For example, manyproducts have dramatically different characteristics in a global productionmarket with low transportation costs. Many products are driven more bychanges in regulation than by changes in product investor consumption.
Governance and Micromarket Structure
The fundamental assumption of many academic analyses is that equity orfixed-income products are just there and can be easily accessed by a numberof potential suppliers. Rarely is there a detailed description of the variousgovernance or structural elements associated with the product’s deliveryas an investable program. There appears to be little understanding of thefact that past and current business practices combined with new regulatory
Equity and Fixed Income 55
concerns drive the manager selection and management process. There arefew, if any, studies that truly understand the management or trading processof fund complexes.
WHAT EVERY INVESTOR SHOULD KNOW
Most investors’ asset portfolios are made up exclusively of stocks andbonds. The reasons for this are varied but, of the major classes of investableassets, they are the most liquid, transparent, and most importantly, the mostwell-known and supposedly understood by both advisors and investorsalike. As it often cited, no one has ever been sent to jail for investing in IBMor government bonds. The common rules of investing (e.g., diversificationwithin and across asset classes, knowledge of inherent risks) seem todraw investors to the traditional pair of investments. However, commondoes not make it correct (or incorrect). What was once true may nolonger represent current market understandings of the traditional pair.Despite their common use, there are a number of common misconceptionsthat every investor should know as well as a number of common rules ofinvestment.
■ Know What You Own: In all but the rare instance, investors are betteroff holding a large diversified portfolio of stocks or an index ratherthan attempting to hold a concentrated set of individual securities.However, investors should be aware of the unique risk characteristicsof the portfolio or index they hold. For example, the S&P 500 diversifiesacross 500 stocks, but since it is asset weighted, it is really diversifiedacross 50 stocks that count and 450 stocks that do not. Even EWportfolios are not truly diversified in that any one portfolio may havesome stocks with high standard deviation and others with low standarddeviations. In an EW portfolio, the stocks with the highest standarddeviations may drive the return of the portfolio.
■ Diversification Does Not Eliminate Risk: A number of investors seemto believe that diversifying across a number of stocks (domestically orinternationally) reduces or eliminates risk. In fact it may increase risk.Diversification across equities (equal weights across multiple stocks)may reduce the impact of the business risk of individual firms, but byincreasing exposure across multiple securities you are increasing yourgeneral exposure to conditions that affect all equities. You still haverisk; you just know what that risk is.
■ A Stock’s Beta or a Bond’s Rating Is Not Sufficient: Most equityfinancial reports contain a measure of an equity’s beta (i.e., sensitivity
56 POSTMODERN INVESTMENT
to a market index) or a bond’s rating (i.e., potential for default). Inthe case of beta, if it is high, it is assumed risky. In the case of a bondrating, if it is high (AAA), it is assumed to not be risky. In both cases,the problem is that firms change quickly, such that most measures ofhistorical beta may not reflect the current price risk, and it tells youlittle about all the other risks (i.e., liquidity). Similarly a bond’s ratingchanges infrequently and tells little as to current risks (and it tells evenless about current price sensitivity). If they are so limiting in terms oftheir risk assessment, why use them? The answer is that they are easyto get and regulation supports their use. However, remember the basiclaw of finance: If they are cheap and easy to get, the benefit may belimited. Use them, but be very careful—do not depend on them.
■ Returns Are Where the Risks Are: Investments in small capitalizationequity and emerging market equities have the capacity to providemeaningful returns, because in their markets, information asymmetriescan exist that can lead to their superior performance. It is in these areasthat managers that have significant research teams or insights can addvalue.
■ Do Not Trust Just Stocks or Just Bonds for the Long Run: It canbe expected that, on average, over a long enough time period, somestocks will have a higher return than some bonds. But some bondsare riskier than some stocks. In some (and in fact most) economicconditions, stocks are riskier than bonds, and in others, bonds areriskier than stocks. Economic conditions (and information uncertainty)may be viewed as a risk factor underlying the expected return processof a particular investment class sensitive to that information.
MYTHS AND MISCONCEPTIONS OF EQUITYAND FIXED INCOME
During the past decade, the investment-management industry has undergonenumerous changes. New forms of traditional investment products, as wellas alternative investment products (e.g., hedge funds, managed futures),have come into existence to meet the needs of changing financial regulation,information technology, and investor demands. Today, despite the existenceof an increasing array of investment products, most investors concentrateon traditional investment vehicles such as stocks, bonds, and mutual funds.Although stock and bond investments may arguably be recommended asthe primary investment vehicle for individual investors, many myths existas to the actual basis for stock, bond, and mutual fund performance. In thisshort review, a series of myths and misconceptions on traditional stock andbond investments are presented.
Equity and Fixed Income 57
Myth 2.1: Dividends Are Certain While CapitalGains Are Uncertain
One piece of advice heard loud and clear is to buy stocks with highdividend yield. This is a good advice, but not for the reason most peoplewould believe. Dividends are not free. When a firm pays dividends, itsstock price will decline by the amount of the dividend. That is, one cannotseparate dividend income from capital gain income (ignoring taxes for now).However, it is often good advice to buy stocks with high dividend yields.First, most firms tend to do stupid things with their excess cash. Once upona time, Kodak purchased a chain of drugstores with its excess cash. It is alsooften believed that firms that are committed to paying dividends tend to runmore efficiently in terms of not using cash for any and all internal projectssince you cannot pay dividends with accounting numbers.
Myth 2.2: Investor Attitudes, Not EconomicInformation, Drive Stock and Bond Values
Academic theory suggests, and empirical results support, that stocks andbonds should offer an expected return that is consistent with their underlyingrisk (i.e., variance in return in the assets not held in a market portfolio andbeta [correlation] for assets held in an overall market portfolio). Whatinvestors must realize, however, is that an asset’s own volatility or itscorrelation with a market portfolio is not the source of return. Asset volatilityor market correlation merely reflects its sensitivity (i.e., movement) to newinformation entering the market or changes in how individuals interpretexisting data. Thus, a security’s expected return is conditional on theexpected informational market. The sharpest gains and losses on stock andbond investments generally happen on a day on which there is a releaseof information that changes attitudes toward expected risk and requiredreturns or expected cash flows. As informational uncertainty increases, sodoes expected volatility, and stock and bond prices fall in order to offer newinvestors an expected return consistent with the expected greater risk ofholding the asset. In short, asset returns simply reflect changes in investors’reaction to information. By definition, it is impossible to forecast content ofnew information or investors’ attitudes toward that new information.
While a large number of investors acting on faulty beliefs may in theshort term affect market prices, assets will move to valuations that reflectthe market consensus on information. Although behavioral implications onstock and bond movement remain a principal focus of recent research, stockmarket value remains linked to growth in earnings (e.g., productivity) andreduction in the required rate of return (e.g., interest rates [inflation] andrisk premia).
58 POSTMODERN INVESTMENT
Myth 2.3: Despite the Volatility of Stocks and Bonds inthe Short Run, Time Diversification Reduces TheirVolatilities in the Long Run
Although many investors would agree that both stocks and bonds must bepriced such that assets that face greater price sensitivity (i.e., sensitivity tochanges in information) offer greater expected returns, some believe thatin the long run, traditional stock and bond investments can be viewedas almost riskless because U.S. stock and bond investments have alwaysoffered positive returns over long investment horizons (e.g., 20 years).Nothing could be further from the truth. Simply put, the two-year expectedrate of return should be twice the one-year expected rate of return and, allelse equal, the three-year expected rate of return is three times the one-yearreturn. The same linear relationship exists for risk. The two-year expectedvariance is twice the one-year rate, and the three-year expected varianceis three times the one-year variance. Summarizing, in the long run boththe expected return and the expected risk increase—there is no free lunch.It is the linear relationship between expected return, risk, and investmenthorizon that makes reducing risk a prime goal for investors (e.g., the long-term rate of return is related to the annual return and volatility such thatthe lower the annual volatility, the greater the long-term rate of return).Managing risk remains a primary investor goal.
Myth 2.4: Diversification across Equity Issues orCountries Is Sufficient to Reduce Risk
MPT, advanced by Markowitz in the 1950s, centers on the correlationrelationships and risk reduction opportunities of adding together securitiesthat respond differently to changing economic conditions. In short, bycombining securities, an investor can reduce a portfolio’s variance. Equallyimportant, the effect on expected return may be such that through judicioususe of borrowing or lending, an investor can achieve higher returns withsimilar risk at the portfolio level than at the individual security level.However, Markowitz’s theory is now 60 years old, and although it stillforms the basis for many asset allocation models, it may be regarded as‘‘ancient portfolio theory.’’ The present primary concern is how to obtainthe estimates of expected returns and correlations between assets. The pastmay not be a good reference for the future as firms change their risk and ascountries become linked globally. Empirical market movements have shownthat especially during periods of major market stress, the market effect onstocks domestically and globally dominates returns such that simple stockor international diversification may not reduce volatility in such risk-adversemarket environments.
Equity and Fixed Income 59
Myth 2.5: Historical Returns from Security IndicesProvide the Most Important Information as to ExpectedFuture Performance
When considering investment in equities or fixed income, most investorsimmediately look to a series of commonly used benchmarks (S&P 500,BarCap U.S. Aggregate) or even longer benchmark series to determine theirhistorical performance. This is all well and good, the problem becomes thatinvestors often tend to use the historical returns of those security indices as abasis for extrapolating expected returns. However, as discussed previously,because firms change financial structure, indices change composition, andpast risk environments may differ from those of today, simple use ofpast data may not provide the best forecast of current economic factors.Historical equity returns in the United States may have come from periodswhen the average growth in GDP was more than 5 percent; going forward itmay be closer to 3 percent. Government bond yields are closer to 2 percent,so how can any investor use a historical expected bond return near 6percent? In the mid-2000s, the S&P 500 was heavily weighted toward thefinancial sector; today that sector’s influence is marginal. Investors shouldbe aware that historical data is just that—historical—it does not necessarilyindicate current or future long-term expected returns for any asset class.They only provide a window into what factors drive stock returns and yieldssuch that one can use those factors (e.g., GDP growth, inflation) as a basisfor estimating future expected returns.
Myth 2.6: Recent Manager Fund PerformanceForecasts Future Return
Managers’ recent past performance is not necessarily the best forecastof how managers will perform in the near future. Many investors mayrespond that if one cannot use recent performance, what should be used?Each manager holds a unique portfolio. That portfolio will outperformin some market environments and underperform in others. In fact, mostrisk-management software provides an analyst with the exact market factorsensitivities of various portfolio managers, such that one knows when theywill make money and lose money. Only if economic conditions favorableto a manager’s existing portfolio continue over time, will any seemingpast outperformance of individual managers continue. There is however,one case when past performance may indicate future performance. Poorpast performance may be consistent with increased volatility of managerfuture performance, as poor managers ‘‘go for the gold’’ to obtain highperformance.
60 POSTMODERN INVESTMENT
The fact that past manager performance alone does not provide a meansto obtain a forecast of those managers who may be expected to outperformin the near future, does not mean that superior performance does not exist.Unfortunately, evaluation of superior performance requires more data andmore analysis to provide better decisions. There is never enough data todetermine superior performance, so we are left with the analysis of otherfactors (e.g., depth of investment team, back office and front office support,etc.). The classic retort to the question, ‘‘If you are so smart, why are younot rich’’ is ‘‘If you are rich, why are you not smart,’’ which reflects thetimeworn evidence that success may be more in the hands of the gods thanin people.
Myth 2.7: Given the Efficiency of the Stock and BondMarkets, Managers Provide No Useful Service
The inability of managers to consistently outperform passive indices is onereason for concerns over the benefits of manager-based security selection.The failure to find a method that determines only the best managers,however, does not mean that managers do not matter. First, managers doprovide many investor services (e.g., accounting and tax reporting) thatwould be costly, if not impossible, for individual investors to perform.In addition, managers may provide one service that most simple passivebenchmark-based investments cannot, that is, an option to be discretionary.When one purchases an index, one simply rides the index up and down.Managers provide a security or asset allocation function, in that theycan rebalance in markets or securities as needed. Managers who providesuch skills result in a type of downside risk protection similar to putprotection. In short, the fees paid to a manager should be considered asan alternative to a simple put or option protection. The real question tobe considered is, are the manager’s fees worth the cost of that option? Inconsidering this question, there is a serious argument that a substantialnumber of the large mutual fund complexes are ‘‘closet indexers.’’ Here,senior management understands that it is marketing its performance againstthat of passive indices and that underperformance hinders the ability to raiseadditional capital and thus grow investment income or management fees. Asa consequence, money managers are required to manage client monies withinvery specific asset allocation bands that mirror those of the correspondingpassive index. Typically this scenario is cast as a risk management tool–however, the net effect is to ensure that money managers do not stray toofar from the norm and to further ensure that the firm continues to have amarketable product. Here, from a business perspective, it is more importantto show consistent performance against a given passive index than to riskunderperformance by deviating from that index’s parameters.
Equity and Fixed Income 61
Myth 2.8: Superior Managers or Investment IdeasDo Not Exist
As stated earlier, superior managers may exist. The problem is that thereis often not enough data to determine who those managers are, or theeconomic condition that allows us to see their unique contributions are sofew that we only recognize them ex post. For example, there is the rareoccasion in which a manager has an insight that is not currently shared bythe market, and the execution of that insight results in outsized returns (e.g.,those managers that shorted the ABX Index in 2007 and 2008). There is alsothe rare circumstance in which a manager creates a legitimate informationaladvantage and acts on it prior to the market knowing its value (e.g., findinginformation within Securities and Exchange Commission [SEC] filings thathas been overlooked or not digested by the market). The fact that pastmanager performance alone does not provide a means to obtain superiorfuture performance does not mean that superior performance does not exist,only that if a manager has consistent superior gross performance, he willmost likely charge a fee for his or her services such that the net return acrosscompetitive funds would be similar to that of a ‘‘regular’’ manager.
Remember, individuals often need heroes even if they do not exist. If aPeter Lynch or the Sage of Omaha did not exist, we would have to inventone. Do we regard them as great because they were, or were they just lucky?As we have noted, the language of investment management often mirrorsthat of a casino. History and experience has taught us that it would be amistake to discount luck as a factor in a manager’s returns.
Myth 2.9: Stock and Bond Investment Means InvestorsHave No Derivatives Exposure
This is simply not true in today’s market. In fact, almost every investmentinto an equity or bond is also an investment into a derivative eitherdirectly or indirectly. A financial derivative may be regarded as a secondaryasset whose underlying value is based on the value of the portfolio ofunderlying primary financial assets. However, that primary financial assetmay also be based on holdings that contain derivatives. It is most certainlya sure bet that every firm uses derivatives in the management of its dailyoperations (e.g., currency futures, treasury operations, and pension fundinvestment decisions). Many firms (e.g., oil exploration and refinery, goldand other precious metal mining companies, airlines, bottling companies,and food processing or manufacturing companies) use derivatives to offsetfundamental risks in their business. In short, most investors are exposed toderivatives; they just do not know it.
62 POSTMODERN INVESTMENT
Myth 2.10: Mutual Fund Investment Removes InvestorConcerns as to Leverage
Regulation, as well as investor concerns, generally limit the amount ofleverage used in a range of investment products (at least those targeted toretail mutual fund clients). As stated in the previous myth, however, mostfirms use derivatives in a wide range of activities both to increase and reducea range of business risk exposures. In addition, since corporations borrow,the sensitivity of a firm’s equity and debt valuations to certain changes ininformation is a function of the firm’s leverage. Banks, for example, areoften levered five to eight times equity, and from a historical perspective,investment banks were levered as much as 30 times equity. As a result,highly levered firms may try to reduce total risk by investing in less volatileproducts or ideas. The raw conclusion is that leverage is used in almostevery investment in some way. As important, there may or may not beany relationship between a firm’s or fund’s leverage and its risk since firmsor funds with high leverage may simply invest in less risky assets, andthose firms with no or little leverage may invest in highly risky investments.The solution is to make sure you know the degree to which managers useleverage, the assets they invest in, and the degree to which they have theright and the ability to change leverage or asset-selection policy quicklywithout your knowledge. There is the real risk.
CHAPTER 3Hedge Funds
An Absolute Return Answer?
In 1947, A.W. Jones began trading what is known today as a long/shortequity fund. In the decades that followed, hedge funds continued to grow
but were not a major part of the financial system. However, in the late1980s, the interaction of advances in technology, the growth of derivativemarkets, and regulatory changes encouraged many financial trading firmsand banks to sell all or part of their proprietary trading operations tooutside legal entities. Banks and many trading houses simply found it moreprofitable to charge certain services (e.g., brokerage, lending, and back-office support) than to have to cover the new capital charges required bychanging regulations.
Although many investors see hedge funds as unique animals, hedgefunds are actually just one example of the privatization of the trading floor.Over the course of the 1990s, the growth of financial markets, both inthe United States and globally, increased the availability of new securityforms (e.g., mortgages), new markets (Europe and emerging), and newstrategies (convertible arbitrage and fixed-income arbitrage). Hedge fundshad matured, but unfortunately, the public perception of the industry hadnot. Even within the hedge fund industry, many managers continued toportray themselves, inaccurately, as absolute return managers—managerswho could make money in every market. Academics and others, of course,were well aware that most hedge fund strategies provided investor oppor-tunities not available in other long-only stock and bond strategies, coveringa wide array of investment strategies, and that, just as with other invest-ment strategies, each strategy had its own unique set of return factors. Formany in the hedge fund industry at that time, considerable debate existedbetween those who wished to sell primarily to high-net-worth individualsor other retail type clients, and those who regarded the institutional marketas the future for hedge funds. All a hedge fund had to do was transform
63
64 POSTMODERN INVESTMENT
itself from a small three- to five-person trading operation to an actualfirm with the back-office, trading, and compliance personnel required toprovide style- and strategy-consistent returns in a form suitable to mainlineinstitutional clients.
In 2000, we were retained by Zurich Capital Markets (ZCM) torestructure and manage its hedge fund platform. Randall Kau, ZCM’s CEO,had a vision of hedge funds becoming an integral part of his institutionalbusiness, but after a number of misfires with joint venture partners andinternal personnel, he had become frustrated with the platform’s progressand its inability to attract meaningful institutional investments.
The ZCM platform had approximately USD 80 million in total assetsunder management (AUM) as seed money and a few small outside investors.The platform had invested in 30 hedge fund managers across eight to ninedifferent investment styles to create diversification of risks and returns. Thesize, investment sophistication, and institutional integrity of this groupingwere at best uneven. Our initial review showed that the platform had nocoherent economic structure, nor did it have a comprehensive operationaland investment management due diligence program. This was pretty muchconsistent with the vast majority of the platforms of that era. For themost part, these earlier hedge fund businesses were built on referrals fromfriends and family, with the assumption that operational capabilities werein place. To a limited extent, this was a correct assumption. Typically,the funds had a prime brokerage relationship with a large institutionalbank or investment bank, and this ‘‘prime broker’’ provided most if notall back-office functions and administration as well as trading and support.Although the ZCM platform was touted as a means of freeing the hedgefund manager to focus exclusively on money management, it’s not unfairto say, with limited exception, that once you moved beyond the capabilitiesof the prime brokers, the common denominator among ZCM hedge fundinvestment managers was that they were people with dogs and computersoperating out of their garages.
Once ZCM verified and recovered from the shock of our report, webegan the process of creating a hedge fund platform in which institutionalinvestors would be comfortable investing their funds. The first step was toclose the platform to all non-ZCM investors and to liquidate all invest-ments in an orderly fashion. Next, we scheduled interviews with largeinstitutional investors to gauge their view of hedge funds and whether theywould invest in this upcoming asset class. More than half of the respon-dents of our initial survey stated that they would never invest in hedgefunds. This sampling cited issues such as volatility, lack of transparency,fraud, and career risk. Those institutional investors who would consider aninvestment in hedge funds were remarkably consistent in their responses.
Hedge Funds 65
Collectively, they viewed an investment as an investment. In their world-view, the same criteria used to evaluate an investment in equities, bonds,real estate, or any other asset class should be used to determine whether toinvest in hedge funds.
The potential investors went on to describe the characteristics of a hedgefund platform that would be consistent with an institutional framework. Thefirst question to be asked and answered involves identifying the economiccharacteristics of the investment that permit an understanding of its behaviorin different markets and within a diversified portfolio. Next, there must besufficient transparency to conduct independent and meaningful investmentdue diligence, monitoring, and valuations. Third, given that investmentperformance and its execution cannot be separated from the businessplatform, the operational infrastructure must be sufficient to support aparticular investment approach. The operational needs will of course changedepending on the complexity of the investment program. Here they notedthat most failures of asset management firms are not caused by direct fraudbut by operational failures. Related to this concept is the belief that agreat deal of consideration has to be given to the length of time a firmhas been in business. In regard to hedge funds, typically star managersleave major firms to set up their own shops. Within that major firm theywere in cocoons, surrounded by a collection of support staff, managedand paid by the firm, responsible for the day-to-day tasks of running thebusiness. Now as both owners and money managers, they are responsiblefor all of the functions relating to both business management and investing.Quite simply, these are very different skill sets, and it takes time to determinewhether these parts will come together and be successful. The core ofthe institutional model is that there must be sufficient transparency toindependently and rigorously conduct both operational and investmentdue diligence, and the knowledge that these are separate lines of inquiry.Equally important, the institutional model suggests that if an investorcannot intuitively understand and verify all of the parts, it is probably a badinvestment idea.
Using the institutional model as our map, we designed and imple-mented an investment approach based on a variation of factor analysis thatexplained the differing risk and reward characteristics of each of the sub-classes of hedge fund investments, as well as their sources of return. We thencreated a managed account platform in which ZCM owned, managed, andcontrolled all aspects of the day-to-day operations and directly employedall prime brokers, auditors, and lawyers associated with the platform. Withthis approach, we attained full and complete transparency, which permit-ted us to monitor and value both risk and performance on a daily basis.Next, we entered into sub-advisory agreements with managers who met our
66 POSTMODERN INVESTMENT
selection criteria, allowing them to trade or manage monies within exactinginvestment guidelines that ensured that they could not exceed agreed-onlevels of risk. Along the way, we had to shatter some myths and miscon-ceptions relating to hedge fund investing. In so doing, we learned that thereare very few true wizards in the world. Most hedge fund managers areinextricably tied to the common economic characteristics of the underlyingassets in their portfolios. We also learned that although sources of returnand associated risks are different within each sub-strategy of hedge funds,the constant in determining the success or failure of a manager lies in thebusiness model. Performance is simply an expression of that model andincorporates not only management and incentive fees but the invisible costsof items such as legal structure, research, borrowing, trading, audit, andother things tied to infrastructure. Each has the ability to negatively orpositively impact performance, and each has the implicit ability to disguisemalfeasance and fraud.
During our relationship with ZCM, we bought and managed theMAR Hedge Fund Database. Greg Newton, the CEO of Metal BulletinResearch in the United States at the time, had concluded that the costof an information platform could not be justified within a noninvestmentmanagement firm. MAR was the oldest continuing collection of informationon the performance of individual managers within the hedge fund industrygoing back some 17 years, and we believed that its purchase would providean enhanced level of transparency that would better serve our clients.In addition, we decided that it would make an excellent marketing tool,because the monthly performance results were published in Barron’s andalso picked up by the wire services. Ernst & Young was retained to analyzethe platform and concluded that at best, the database provided indicativeinsights yet certainly not the type of foundation that a firm could use tobuild investment products. The MAR Database, like all other databasessince, relied on self-reporting information from managers and had nolevel of oversight verification. The self-reporting business model for hedgefund indices and databases is prevalent because investors have shown anunwillingness to pay for the increased costs of verification; and frankly, evenif investors were willing to pay, it is highly doubtful that any firm would beable to gather the type of information required to conduct reliable analysis.Thus, for the most part, hedge fund indices are relegated to providingindicative guidance while serving as marketing tools for their owners.
As we began to implement our new strategy and platform, the catastro-phe of September 11, 2001, occurred. One of the aftermaths of that tragedywas that a great deal of pressure was put on property and casualty insurancecompanies to justify their reserves and explain their liabilities. The major
Hedge Funds 67
rating agencies (e.g., Standard & Poor’s and Moody’s) reluctantly admittedthat they did not have the staff or resources to understand and rate ZCM’sexposure to hedge funds in its differing business lines, and Rolf Huppi, theCEO and chairman of Zurich Financial Services, made the decision to closeZCM despite the fact that the firm had been the single best division of profitfor the year after September 11. This factual pattern seems to be a constantand persistent theme with the rating agencies based in the United States. Aswitnessed in the Senate hearings relating to the 2007–2008 financial crises,the major U.S. rating agencies failed to properly understand and rate therisks associated with alternative pooled investments. From recent conversa-tions with senior officials of the Securities Investor Protection Corporationand the Securities and Exchange Commission, it is clear that investors tendto wholly rely on the due diligence of others and thus fully rely on ratingsin purchasing pooled alternative investments, even when historical evidenceleads to a different approach.
We ultimately purchased ZCM’s hedge fund platform and built thebusiness from a seed investment of just under USD 80 million to approx-imately USD 3.5 billion when we sold it to a European bank. In makingour way through this industry, we have rebranded the MAR Hedge FundDatabase as the Center for International Securities and Derivatives Markets(CISDM) Hedge Fund Database; created the Dow Jones Hedge Fund Bench-mark Series; and built hedge fund products for distribution in Undertakingsfor Collective Investment in Transferable Securities (UCITS) wrappers.
In brief, over the past 10 years, the hedge fund industry has evolved fromtwo people in a garage to a global industry that increasingly incorporates allthe operational and risk-management principles required by large financialinstitutions for their traditional stock and fixed-income asset managers.Today, the market factors driving individual hedge funds strategies arewell known, and most institutional investors require and can obtain dailyvaluations of their hedge fund holdings such that dynamic daily risk man-agement and risk evaluation can be conducted. There even exist a number ofhedge fund tracker products that provide passive index-based products thatattempt to capture the general factor exposures of hedge fund strategies in away similar to that of passive index-based products in the traditional equityand fixed-income areas. Against this background, hedge funds can now beanalyzed using the same approaches investors use to understand the returnand risk characteristics of traditional equity and fixed-income investment.With the good, however, comes the bad. Although some of the analyticaltools and investment analyzers that work well for traditional assets alsowork in the hedge fund area, many do not transfer easily. The trick, ofcourse, is to know which are which.
68 POSTMODERN INVESTMENT
WHAT ARE HEDGE FUNDS?
Although some academics and practitioners would argue that hedge fundsare merely variants of traditional stock and bond investments, we acceptthe argument that hedge funds reflect a unique and separate asset classthat provides distinct risk and return opportunities not easily obtained inother investment vehicles. Moreover, given the knowledge of the returnand risk characteristics of each strategy as well as which managers fit intoeach strategy, meaningful hedge fund indices and benchmarks have beendeveloped to help in the application of traditional asset allocation decisions.We are also mindful that each hedge fund manager or platform is infact a business product for which the individual business model ultimatelydetermines performance and risk.
As previously discussed, hedge funds are generally regarded as invest-ments that offer risk and return opportunities not easily obtained throughtraditional long-only stock and bond investment vehicles. Such uniqueinvestment opportunities are made possible primarily through the ability toparticipate in a wide variety of financial instruments and global marketsnot typically available to the traditional investor. The ability to take bothlong and short positions in a wide variety of securities markets furtherdefines this investment approach. Next, hedge funds are often portrayed asabsolute return vehicles. Contrary to popular belief, this nomenclature doesnot mean that hedge funds are designed to have positive returns irrespectiveof market conditions; it simply means that they are designed not to trackdirectly any individual long-only investment benchmark (e.g., S&P 500 orMSCI World). The descriptive relief provides managers with greater flexi-bility in both internal asset allocation and investment strategy. At bottom,hedge funds are designed to benefit from a broad universe of profit oppor-tunities within various economic environments. The hedge fund deliveryplatforms are often structured as privately pooled investment vehicles thatemploy varying degrees of leverage, and often charge a performance orincentive fee.
Our analysis concludes that a well-selected hedge fund or portfolioof hedge funds can provide return enhancement as well as risk reductionopportunities relative to stock and bond investments. In this chapter, weexplore the potential benefits of hedge funds as stand-alone investments oras additions to portfolios of either traditional assets or a mix of variousinvestments. First, we discuss approaches in which investors can gainexposure to hedge funds. Second, we explore sources of hedge fund returns.Third, we evaluate the performance of hedge funds on a stand-alone basis,as part of traditional stock and bond portfolios, and as part of portfoliosincluding traditional and alternative investments. In each area, the facts
Hedge Funds 69
surrounding the development of the hedge fund industry are well known;however, for many, a number of misconceptions about hedge funds, theirperformance, and their management still exist.
INVESTING IN HEDGE FUNDS
Under the current U.S. securities regulations, a ‘‘qualified’’ or ‘‘accredited’’investor may directly invest with a hedge fund manager through fund-basedinvestment pools, managed accounts, or managed segregated accounts. Thekey distinction among the three is that fund-based accounts and somemanaged accounts require a pooling of investor funds (in which case theexposure of one investor is identical to that of any other investor), whereasmanaged segregated accounts keep investor funds in separate accounts,which may offer unique risk-and-return objectives. The fees associatedwith these vehicles are typically a 1 to 2 percent management fee and acorresponding 10 to 20 percent incentive fee. The incentive fee is usuallytaken only when performance exceeds a predetermined benchmark. Inaddition, there are a number of silent fees associated with these vehicles.Fees such as audit, research, and trading are variable and can have a majoreffect on overall performance. There may also be unanticipated fees becauseof increased accounting costs, fees related to the vehicle’s jurisdictionof incorporation, or fees tied to the costs of repatriating monies fromoffshore accounts.
HEDGE FUND STYLES AND BENCHMARKS
As in most investment strategies, hedge funds have been divided intothe markets they trade (global macro) and some of their unique strategyapproaches to trading (e.g., market neutral, equity long/short). For eachof these forms of trading and markets traded, various firms have createdmanager based hedge fund indices similar to those that exist in equity andother investment asset classes (e.g., Morningstar and Lipper). Historically,the primary benchmarks are as follows.
Relative Value
Relative value strategies emphasize the purchase of undervalued securitiesand the sale of overvalued securities within the context of minimizing themarket exposure inherent in the underlying security market traded (e.g.,equity markets for equity market neutral and fixed-income markets forfixed-income arbitrage). It is important to note, however, that each relative
70 POSTMODERN INVESTMENT
value strategy leaves open exposure to certain market factors (e.g., industryand sector exposure) that provide, in part, the basis for expected return.
■ Market Neutral: Represents strategies that take long equity positionsand an approximately equal dollar amount of offsetting short positionsin order to achieve a net exposure as close to zero as possible.
■ Fixed-Income Arbitrage: Represents strategies that attempt to takeadvantage of mispricing opportunities between different types of fixed-income securities while neutralizing exposure to interest rate risk.
■ Convertible Arbitrage: Represents strategies that take long positions inconvertible securities (usually convertible bonds) and try to hedge thosepositions by selling short the underlying common stock.
Event Driven
Event-driven strategies emphasize the purchase of undervalued securitieswith appropriate risk-management techniques (e.g., shorting individualsecurities or sectors to reduce market or firm exposure) in the contextof event-driven return opportunities (e.g., firm mergers and bankruptcies),which may be independent of general market movements.
■ Distressed: Represents strategies that take positions in the securitiesof companies in which the securities’ price has been, or is expectedto be, affected by a distressed situation, such as an announcement ofreorganization because of financial or business difficulties.
■ Event Driven: Represents strategies that attempt to predict the outcomeof corporate events and take the necessary position to make a profit.These trading managers invest in such events as liquidations, spin-offs,share buybacks, and other corporate transactions.
■ Merger Arbitrage: Represents strategies that concentrate on companiesthat are the subject of a merger, tender offer, or exchange offer.Although there are a number of different trading-based approaches,merger arbitrage strategies often take a long position in the acquiredcompany and a short position in the acquiring company.
Opportunistic
Opportunistic trading strategies emphasize the purchase of undervaluedsecurities or markets (European versus U.S. fixed income, alternative energysectors) and the sale of overvalued securities or markets without the con-straint that the underlying market exposure will be systematically eliminatedor minimized. Certain opportunistic strategies such as global macro are
Hedge Funds 71
primarily trading strategies that do not emphasize long-term net-long ornet-short investment positions. For these opportunistic strategies, the cor-relation between and among them as well as to other hedge fund strategiesmay be relatively low.
■ Equity Long/Short: Represents strategies that take long and short equitypositions varying from net-long to net-short, depending on whether themarket is bullish or bearish. The short exposure can also be a put optionon a stock index, which is used as a hedging technique for bear marketconditions.
■ Global Macro: Represents strategies that employ opportunistically longand short multiple financial or nonfinancial assets. Trading managersfollowing global macro strategies might use systematic trend-followingmodels or discretionary approaches. For systematic trend-followingglobal macro managers who trade primarily in futures and optionmarkets, returns are similar to those of commodity trading advisors.
In this chapter, the CISDM Equal Weighted Hedge Fund Index is usedas the primary representative hedge fund index. As noted earlier, a numberof larger investment firms, as well as other players in the hedge fund arena,offer a wide range of manager-based hedge fund indices. Each of theseindices is unique in its own way. For example, Barclay and Hedge FundResearch (HFR) also provides active-manager-based hedge fund indicesthat are equal weighted and constructed using unverified information of‘‘reporting managers’’ associated with each of the respective databases.These indices are not directly investable. In recent years, a number ofmanager-based hedge fund indices have been created that are designed tocapture the returns of an investable set of active hedge fund managers (HFR,Lyxor, Dow Jones, and so on). Each of these indices differs slightly in itsconstruction. Our past research has shown that the reported returns ofthe investable hedge fund indices are highly correlated with noninvestablemanager-based hedge fund indices.
BASIC SOURCES OF RETURN AND RISK
Each of the foregoing hedge fund strategies reflect intrinsic economic andmarket risks, and an understanding of these risks is essential to asset alloca-tion decisions. As discussed previously, hedge funds have been described asskill-based investment strategies, which obtain returns primarily as a resultof a firm’s unique trading abilities and infrastructure. Because these returnsare a reflection of individual manager skill, they may not be correlated with
72 POSTMODERN INVESTMENT
the long-term return of the underlying traditional stock and bond markets.As a result, hedge funds have also been described as absolute return strate-gies, since their performance is not linked to any existing stock and bondindex, and their trading strategies may offer positive returns across a widevariety of market conditions.
Over the years we have learned that industry shorthand can be mislead-ing. Hedge funds are often presented as actively managed absolute returnvehicles. Because they are actively managed, trader skill is important. How-ever, trader skill cannot obviate the underlying economic realities of theassets traded. Traders work in a market in which the underlying assets theyare trading have certain and finite properties. And no matter how skilleda trader may be, the essential nature of those underlying assets cannotbe changed. Thus, the lack of direct index tracking does not mean thatmanagers within a particular strategy do not have similar sensitivities tocommon market factors. In fact, research shows that various hedge fundstrategy returns are driven largely by traditional market factors (i.e., S&P500; Russell 2000; BarCap U.S. Government, U.S. Aggregate, and U.S. Cor-porate High Yield Bond indices). Previous research has shown that hedgefund strategies such as equity long/short are impacted primarily by equityfactors and have the highest correlation with such indices as the S&P 500and Russell 2000. In contrast, strategies such as convertible arbitrage anddistressed securities have the highest exposure to changes in credit spreadsand have a high positive correlation with corporate high-yield bond returns,as evidenced by such indices as the BarCap Corporate High Yield BondIndex. Merger arbitrages with the greatest ability to arbitrage out marketfactor exposures tend to have the lowest correlation with stock and bondfactors.
On the risk side of the equation, strategies with the highest exposure(e.g., correlation) to market factors and with the highest volatility (e.g.,equity or high-yield bond returns) are expected to have a relatively higherlevel of risk. The introduction of leverage to this risk analysis providessome interesting results. For the most part, leverage is associated withmagnifying risk. Thus, the amount of leverage an individual strategy maytake has a potential effect on its expected volatility and relative marketsensitivity (e.g., beta). Some strategies, however, respond counter intuitivelyto leverage. By example, market neutral strategies tend to have the highestamount of leverage yet also tend to have the lowest level of volatility.Other strategies, such as distressed securities and emerging markets, usuallyemploy no leverage and tend to have very high volatility. In sum, highvolatility is not directly associated with high leverage; rather, it is associatedwith the inherent volatility of the underlying assets (e.g., sensitivity toinformational change) and the degree to which additional leverage is taken.
Hedge Funds 73
In our experience, we have never encountered a distressed securities managerwho uses leverage.
On the whole, hedge fund returns are a combination of manager skilland the underlying natural return to the strategy itself—no more, no less.As a result, similar to the equity and bond markets, indices can be createdthat capture the underlying return to the strategy. Within such a rules-based approach it is possible to measure a manager’s alpha. A manager’sperformance is measured relative to a systematic passive hedge fund index,and as a consequence, the differential return may be viewed as that manager’salpha. In the absence of a rules-based approach, if a manager’s performanceis measured relative to an index of other active managers, then the relativeperformance simply measures the over- or underperformance to that indexof manager returns. A rules-based approach also provides an opportunityto measure strategy performance and provides some insight into relativecorrelations among and between hedge fund strategies and traditional assetclasses.
PERFORMANCE: FACT AND FICTION
Over the past decades, our understanding of how various hedge fundstrategies perform across a wide range of market conditions has becomemore evident. Some of this new understanding (e.g., that hedge funds arenot absolute return vehicles with the ability to make money in all markets)is now well-known fact; however there still remains a degree of fiction inhow investors view hedge fund performance. In the following sections, weprovide evidence not only on the standalone risks of various hedge fundinvestment, but also on the interrelationships of various hedge fund strategieswithin hedge funds and between hedge funds and various traditional (e.g.,equity and fixed income market) and alternative asset classes. We haveexamined these markets over a broad time period, as well as on shortertime intervals (e.g., annual) as well as analyzed their relative performance inextreme market conditions. Results show that, as expected, (1) hedge fundsoften provide lower returns but at lower levels of risk than comparabletraditional and alternative investments, and as such, they often providesuperior standalone return to risk tradeoffs, and (2) hedge funds with lowequity or credit spread exposure generally have a relatively low correlationwith traditional and other alternative asset classes such that combiningthose hedge fund strategies (e.g., equity market neutral, merger arbitrage,event driven) with traditional and alternative asset-based portfolios mayresult in a superior return-to-risk tradeoff. Results also reflect that some ofwhat was emphasized in the past (e.g., the ability of hedge funds to perform
74 POSTMODERN INVESTMENT
well in periods of extreme market stress and, the consistency of hedge fundreturns over time) may be regarded as more fiction than fact. For example,(1) for certain hedge fund strategies, such as equity long/short, there is littleevidence of diversification benefits when considered as additions to equityportfolios or portfolios of traditional and alternative assets with significantequity exposure; (2) in periods of extreme equity market movements, mosthedge fund strategies (with the exception of relative-value-based strategies)have similar return patterns, that is, falling in down equity markets andproviding positive returns in up equity markets; and (3) investors shouldnot take risk-and-return performance from extended time frames as a basisfor how various hedge fund strategies or hedge fund composite indices mayperform over relatively shorter time periods (e.g., annual). Also, evidencederived over long investment periods as to the benefits of certain hedgefund strategies (e.g., equity long/short, distressed securities) may not reflectthe relative performance when analyzed over shorter time intervals (e.g.,annual). Finally, despite the potential differences among investment strategyapproaches within a particular hedge fund strategy (e.g., equity long/short),most hedge funds within a particular hedge fund strategy (e.g., equitylong/short) rise together in up strategy months and fall together in downstrategy months such that diversification within a hedge fund strategy areamay not provide the diversification benefits that most investors expect.
RETURN AND RISK CHARACTERISTICS
In this section, we review the relative performance of the CISDM EqualWeighted Hedge Fund Index (CISDM EW HF) with a range of traditionalstock and bond indices as well as a number of alternative investment indices(real estate, private equity, commodities, and managed futures) over theperiod 1994–2011. In later sections, we focus on hedge fund composite andhedge fund strategy and market-based index trading performance in varioussubperiods. Again we wish to remind investors that the performance of anyindividual investment or investment strategy may not reflect current expectedperformance or the expected performance in periods that have economicconditions different from those of the period of analysis. For this period,as shown in Exhibit 3.1, the CISDM EW HF exhibited lower annualizedstandard deviation (7.7 percent) than that of the S&P 500 (15.7 percent).This may be surprising to most investors, who often regard hedge funds asbeing more risky than stocks.1 Over the period of analysis, the CISDM EWHF also reported higher annualized total return (10.4 percent) than thatof the S&P 500 (7.7 percent). However, stand-alone historical return andrisk comparison may not reflect the potential for the benefits of a hedge
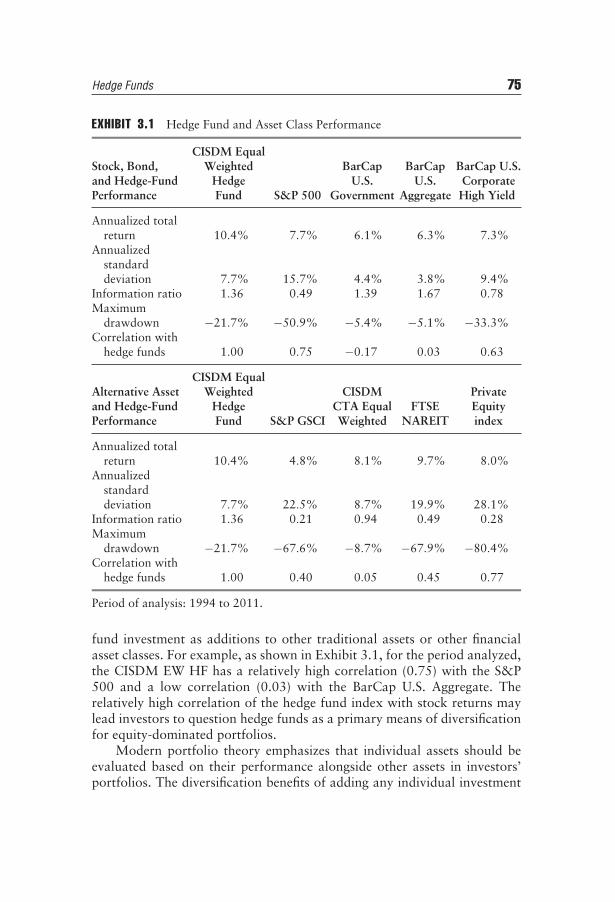
Hedge Funds 75
EXHIBIT 3.1 Hedge Fund and Asset Class Performance
CISDM EqualStock, Bond, Weighted BarCap BarCap BarCap U.S.and Hedge-Fund Hedge U.S. U.S. CorporatePerformance Fund S&P 500 Government Aggregate High Yield
Annualized totalreturn 10.4% 7.7% 6.1% 6.3% 7.3%
Annualizedstandarddeviation 7.7% 15.7% 4.4% 3.8% 9.4%
Information ratio 1.36 0.49 1.39 1.67 0.78Maximum
drawdown −21.7% −50.9% −5.4% −5.1% −33.3%Correlation with
hedge funds 1.00 0.75 −0.17 0.03 0.63
CISDM EqualAlternative Asset Weighted CISDM Privateand Hedge-Fund Hedge CTA Equal FTSE EquityPerformance Fund S&P GSCI Weighted NAREIT index
Annualized totalreturn 10.4% 4.8% 8.1% 9.7% 8.0%
Annualizedstandarddeviation 7.7% 22.5% 8.7% 19.9% 28.1%
Information ratio 1.36 0.21 0.94 0.49 0.28Maximum
drawdown −21.7% −67.6% −8.7% −67.9% −80.4%Correlation with
hedge funds 1.00 0.40 0.05 0.45 0.77
Period of analysis: 1994 to 2011.
fund investment as additions to other traditional assets or other financialasset classes. For example, as shown in Exhibit 3.1, for the period analyzed,the CISDM EW HF has a relatively high correlation (0.75) with the S&P500 and a low correlation (0.03) with the BarCap U.S. Aggregate. Therelatively high correlation of the hedge fund index with stock returns maylead investors to question hedge funds as a primary means of diversificationfor equity-dominated portfolios.
Modern portfolio theory emphasizes that individual assets should beevaluated based on their performance alongside other assets in investors’portfolios. The diversification benefits of adding any individual investment
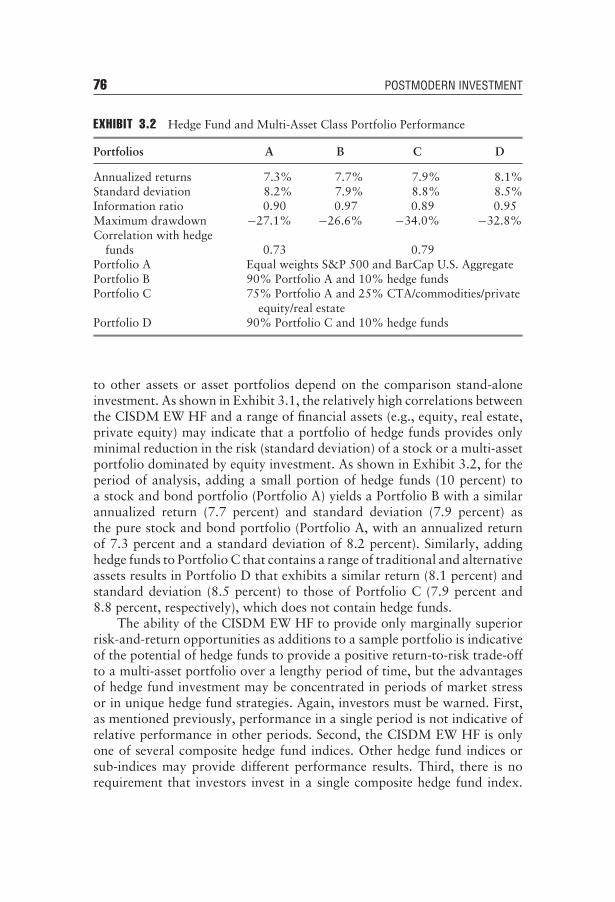
76 POSTMODERN INVESTMENT
EXHIBIT 3.2 Hedge Fund and Multi-Asset Class Portfolio Performance
Portfolios A B C D
Annualized returns 7.3% 7.7% 7.9% 8.1%Standard deviation 8.2% 7.9% 8.8% 8.5%Information ratio 0.90 0.97 0.89 0.95Maximum drawdown −27.1% −26.6% −34.0% −32.8%Correlation with hedge
funds 0.73 0.79Portfolio A Equal weights S&P 500 and BarCap U.S. AggregatePortfolio B 90% Portfolio A and 10% hedge fundsPortfolio C 75% Portfolio A and 25% CTA/commodities/private
equity/real estatePortfolio D 90% Portfolio C and 10% hedge funds
to other assets or asset portfolios depend on the comparison stand-aloneinvestment. As shown in Exhibit 3.1, the relatively high correlations betweenthe CISDM EW HF and a range of financial assets (e.g., equity, real estate,private equity) may indicate that a portfolio of hedge funds provides onlyminimal reduction in the risk (standard deviation) of a stock or a multi-assetportfolio dominated by equity investment. As shown in Exhibit 3.2, for theperiod of analysis, adding a small portion of hedge funds (10 percent) toa stock and bond portfolio (Portfolio A) yields a Portfolio B with a similarannualized return (7.7 percent) and standard deviation (7.9 percent) asthe pure stock and bond portfolio (Portfolio A, with an annualized returnof 7.3 percent and a standard deviation of 8.2 percent). Similarly, addinghedge funds to Portfolio C that contains a range of traditional and alternativeassets results in Portfolio D that exhibits a similar return (8.1 percent) andstandard deviation (8.5 percent) to those of Portfolio C (7.9 percent and8.8 percent, respectively), which does not contain hedge funds.
The ability of the CISDM EW HF to provide only marginally superiorrisk-and-return opportunities as additions to a sample portfolio is indicativeof the potential of hedge funds to provide a positive return-to-risk trade-offto a multi-asset portfolio over a lengthy period of time, but the advantagesof hedge fund investment may be concentrated in periods of market stressor in unique hedge fund strategies. Again, investors must be warned. First,as mentioned previously, performance in a single period is not indicative ofrelative performance in other periods. Second, the CISDM EW HF is onlyone of several composite hedge fund indices. Other hedge fund indices orsub-indices may provide different performance results. Third, there is norequirement that investors invest in a single composite hedge fund index.
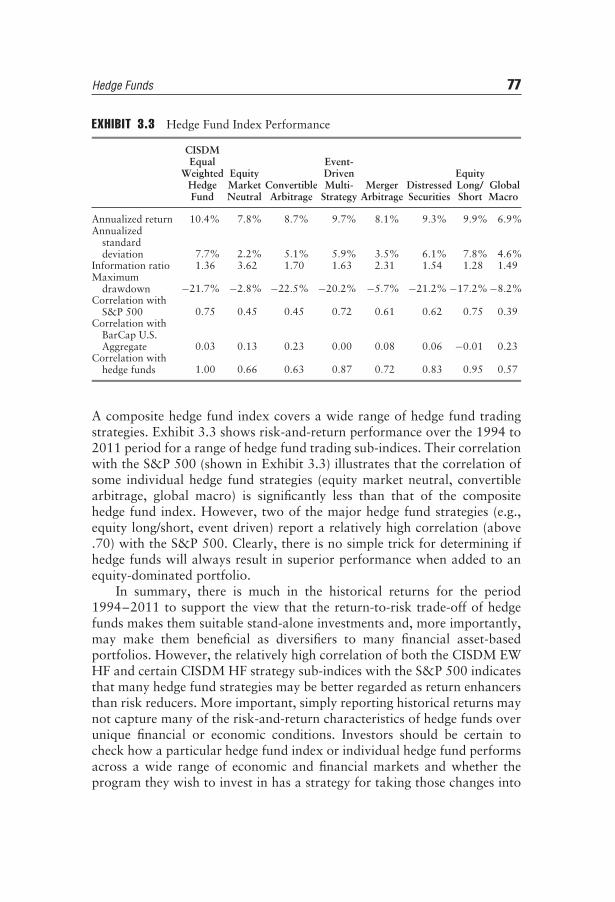
Hedge Funds 77
EXHIBIT 3.3 Hedge Fund Index Performance
CISDMEqual Event-
Weighted Equity Driven EquityHedge Market Convertible Multi- Merger Distressed Long/ GlobalFund Neutral Arbitrage Strategy Arbitrage Securities Short Macro
Annualized return 10.4% 7.8% 8.7% 9.7% 8.1% 9.3% 9.9% 6.9%Annualized
standarddeviation 7.7% 2.2% 5.1% 5.9% 3.5% 6.1% 7.8% 4.6%
Information ratio 1.36 3.62 1.70 1.63 2.31 1.54 1.28 1.49Maximum
drawdown −21.7% −2.8% −22.5% −20.2% −5.7% −21.2% −17.2% −8.2%Correlation with
S&P 500 0.75 0.45 0.45 0.72 0.61 0.62 0.75 0.39Correlation with
BarCap U.S.Aggregate 0.03 0.13 0.23 0.00 0.08 0.06 −0.01 0.23
Correlation withhedge funds 1.00 0.66 0.63 0.87 0.72 0.83 0.95 0.57
A composite hedge fund index covers a wide range of hedge fund tradingstrategies. Exhibit 3.3 shows risk-and-return performance over the 1994 to2011 period for a range of hedge fund trading sub-indices. Their correlationwith the S&P 500 (shown in Exhibit 3.3) illustrates that the correlation ofsome individual hedge fund strategies (equity market neutral, convertiblearbitrage, global macro) is significantly less than that of the compositehedge fund index. However, two of the major hedge fund strategies (e.g.,equity long/short, event driven) report a relatively high correlation (above.70) with the S&P 500. Clearly, there is no simple trick for determining ifhedge funds will always result in superior performance when added to anequity-dominated portfolio.
In summary, there is much in the historical returns for the period1994–2011 to support the view that the return-to-risk trade-off of hedgefunds makes them suitable stand-alone investments and, more importantly,may make them beneficial as diversifiers to many financial asset-basedportfolios. However, the relatively high correlation of both the CISDM EWHF and certain CISDM HF strategy sub-indices with the S&P 500 indicatesthat many hedge fund strategies may be better regarded as return enhancersthan risk reducers. More important, simply reporting historical returns maynot capture many of the risk-and-return characteristics of hedge funds overunique financial or economic conditions. Investors should be certain tocheck how a particular hedge fund index or individual hedge fund performsacross a wide range of economic and financial markets and whether theprogram they wish to invest in has a strategy for taking those changes into
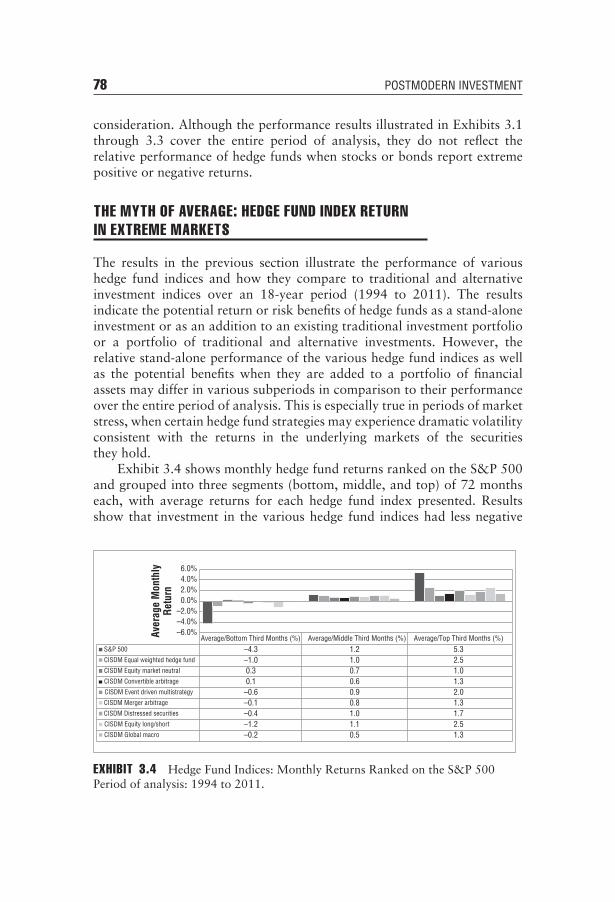
78 POSTMODERN INVESTMENT
consideration. Although the performance results illustrated in Exhibits 3.1through 3.3 cover the entire period of analysis, they do not reflect therelative performance of hedge funds when stocks or bonds report extremepositive or negative returns.
THE MYTH OF AVERAGE: HEDGE FUND INDEX RETURNIN EXTREME MARKETS
The results in the previous section illustrate the performance of varioushedge fund indices and how they compare to traditional and alternativeinvestment indices over an 18-year period (1994 to 2011). The resultsindicate the potential return or risk benefits of hedge funds as a stand-aloneinvestment or as an addition to an existing traditional investment portfolioor a portfolio of traditional and alternative investments. However, therelative stand-alone performance of the various hedge fund indices as wellas the potential benefits when they are added to a portfolio of financialassets may differ in various subperiods in comparison to their performanceover the entire period of analysis. This is especially true in periods of marketstress, when certain hedge fund strategies may experience dramatic volatilityconsistent with the returns in the underlying markets of the securitiesthey hold.
Exhibit 3.4 shows monthly hedge fund returns ranked on the S&P 500and grouped into three segments (bottom, middle, and top) of 72 monthseach, with average returns for each hedge fund index presented. Resultsshow that investment in the various hedge fund indices had less negative
Average/Bottom Third Months (%) Average/Middle Third Months (%) Average/Top Third Months (%)S&P 500 –4.3 1.2 5.3CISDM Equal weighted hedge fund –1.0 1.0 2.5CISDM Equity market neutral 0.3 0.7 1.0CISDM Convertible arbitrage 0.1 0.6 1.3CISDM Event driven multistrategy –0.6 0.9 2.0CISDM Merger arbitrage –0.1 0.8 1.3CISDM Distressed securities –0.4 1.0 1.7CISDM Equity long/short –1.2 1.1 2.5CISDM Global macro –0.2 0.5 1.3
–6.0%–4.0%–2.0%
0.0%2.0%4.0%6.0%
Aver
age
Mon
thly
Retu
rn
EXHIBIT 3.4 Hedge Fund Indices: Monthly Returns Ranked on the S&P 500Period of analysis: 1994 to 2011.
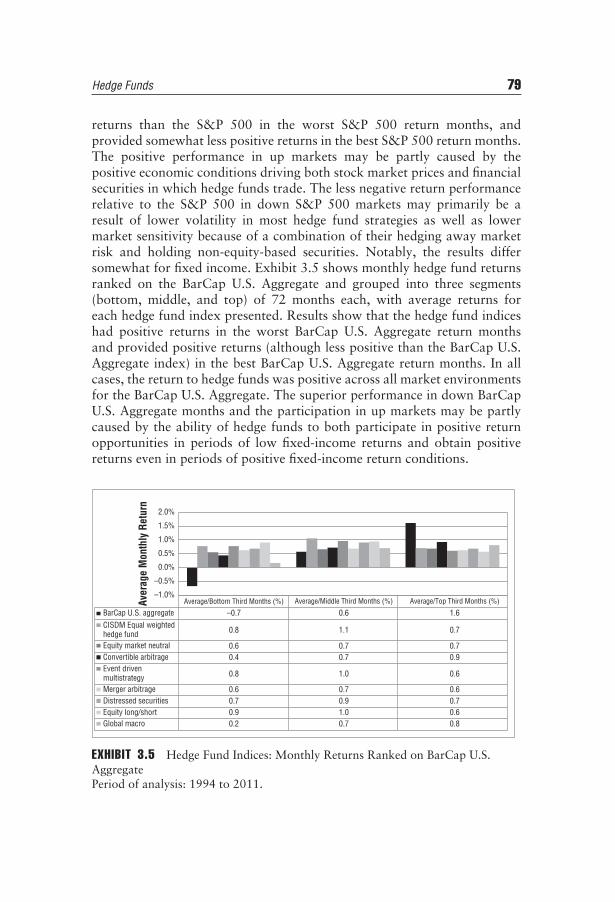
Hedge Funds 79
returns than the S&P 500 in the worst S&P 500 return months, andprovided somewhat less positive returns in the best S&P 500 return months.The positive performance in up markets may be partly caused by thepositive economic conditions driving both stock market prices and financialsecurities in which hedge funds trade. The less negative return performancerelative to the S&P 500 in down S&P 500 markets may primarily be aresult of lower volatility in most hedge fund strategies as well as lowermarket sensitivity because of a combination of their hedging away marketrisk and holding non-equity-based securities. Notably, the results differsomewhat for fixed income. Exhibit 3.5 shows monthly hedge fund returnsranked on the BarCap U.S. Aggregate and grouped into three segments(bottom, middle, and top) of 72 months each, with average returns foreach hedge fund index presented. Results show that the hedge fund indiceshad positive returns in the worst BarCap U.S. Aggregate return monthsand provided positive returns (although less positive than the BarCap U.S.Aggregate index) in the best BarCap U.S. Aggregate return months. In allcases, the return to hedge funds was positive across all market environmentsfor the BarCap U.S. Aggregate. The superior performance in down BarCapU.S. Aggregate months and the participation in up markets may be partlycaused by the ability of hedge funds to both participate in positive returnopportunities in periods of low fixed-income returns and obtain positivereturns even in periods of positive fixed-income return conditions.
Average/Middle Third Months (%)Average/Bottom Third Months (%) Average/Top Third Months (%)
BarCap U.S. aggregate –0.7 0.6 1.6CISDM Equal weightedhedge fund 0.8 1.1 0.7
Equity market neutral 0.6 0.7 0.70.4 0.7 0.9
0.8 1.0 0.6
Merger arbitrage 0.6 0.7 0.60.7 0.9 0.7
Equity long/short 0.9 1.0 0.6Global macro 0.2 0.7 0.8
–1.0%
–0.5%
0.0%
0.5%
1.0%
1.5%
2.0%
Aver
age
Mon
thly
Ret
urn
Event drivenmultistrategy
Distressed securities
Convertible arbitrage
EXHIBIT 3.5 Hedge Fund Indices: Monthly Returns Ranked on BarCap U.S.AggregatePeriod of analysis: 1994 to 2011.
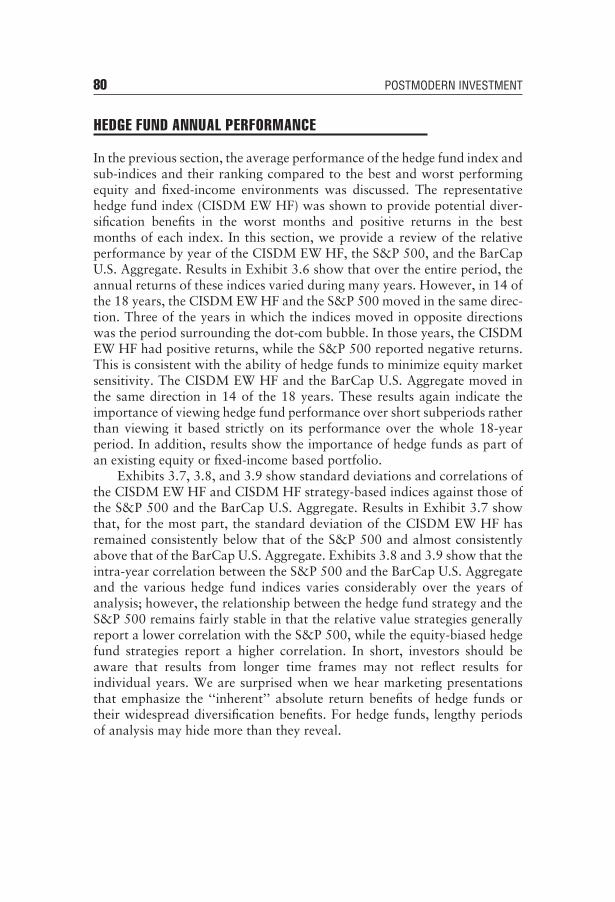
80 POSTMODERN INVESTMENT
HEDGE FUND ANNUAL PERFORMANCE
In the previous section, the average performance of the hedge fund index andsub-indices and their ranking compared to the best and worst performingequity and fixed-income environments was discussed. The representativehedge fund index (CISDM EW HF) was shown to provide potential diver-sification benefits in the worst months and positive returns in the bestmonths of each index. In this section, we provide a review of the relativeperformance by year of the CISDM EW HF, the S&P 500, and the BarCapU.S. Aggregate. Results in Exhibit 3.6 show that over the entire period, theannual returns of these indices varied during many years. However, in 14 ofthe 18 years, the CISDM EW HF and the S&P 500 moved in the same direc-tion. Three of the years in which the indices moved in opposite directionswas the period surrounding the dot-com bubble. In those years, the CISDMEW HF had positive returns, while the S&P 500 reported negative returns.This is consistent with the ability of hedge funds to minimize equity marketsensitivity. The CISDM EW HF and the BarCap U.S. Aggregate moved inthe same direction in 14 of the 18 years. These results again indicate theimportance of viewing hedge fund performance over short subperiods ratherthan viewing it based strictly on its performance over the whole 18-yearperiod. In addition, results show the importance of hedge funds as part ofan existing equity or fixed-income based portfolio.
Exhibits 3.7, 3.8, and 3.9 show standard deviations and correlations ofthe CISDM EW HF and CISDM HF strategy-based indices against those ofthe S&P 500 and the BarCap U.S. Aggregate. Results in Exhibit 3.7 showthat, for the most part, the standard deviation of the CISDM EW HF hasremained consistently below that of the S&P 500 and almost consistentlyabove that of the BarCap U.S. Aggregate. Exhibits 3.8 and 3.9 show that theintra-year correlation between the S&P 500 and the BarCap U.S. Aggregateand the various hedge fund indices varies considerably over the years ofanalysis; however, the relationship between the hedge fund strategy and theS&P 500 remains fairly stable in that the relative value strategies generallyreport a lower correlation with the S&P 500, while the equity-biased hedgefund strategies report a higher correlation. In short, investors should beaware that results from longer time frames may not reflect results forindividual years. We are surprised when we hear marketing presentationsthat emphasize the ‘‘inherent’’ absolute return benefits of hedge funds ortheir widespread diversification benefits. For hedge funds, lengthy periodsof analysis may hide more than they reveal.

1994 1995 1996 1997 1998 1999 2000 2001 2002 2003 2004 2005 2006 2007 2008 2009 2010 2011
S&P 500 1.3% 37.6% 23.0% 33.4% 28.6% 21.0% –9.1% –11.9% –22.1% 28.7% 10.9% 4.9% 15.8% 5.5% –37.0% 26.5% 15.1% 2.1%
BarCap U.S. aggregate 18.5% 3.6% 9.7% 8.7% –0.8% 11.6% 8.4% 10.3% 4.1% 4.3% 2.4% 4.3% 7.0% 5.2% 5.9% 6.5% 7.8%
CISDM Equal weightedhedge fund 21.2% 23.2% 21.8% 4.0% 36.8% 8.8% 5.7% 0.4% 20.6% 10.0% 9.8% 11.8% 10.5% –19.2 26.1% 11.8% –5.8%
Equity market neutral
Convertible arbitrage
Event driven multistrategy
5.1% 12.2% 13.7% 14.9% 11.2% 9.9% 13.9% 7.3% 2.0% 8.8% 5.0% 7.1% 7.6% 6.5% 0.6% 7.1% 5.3% 4.2%
2.2% 17.5% 14.7% 14.2% 7.5% 13.9% 15.2% 13.3% 8.9% 9.6% 2.5% –1.1% 12.3% 4.0% –19.1% 36.6% 12.3% 1.8%
3.6% 19.8% 22.3% 23.6% 3.9% 21.4% 12.1% 7.1% 1.2% 21.9% 12.1% 6.6% 14.0% 6.6% –19.0% 20.0% 8.7% –1.4%
Merger arbitrage
Distressed securities
5.2% 16.6% 16.0% 18.2% 5.5% 15.8% 14.4% 4.3% 0.3% 7.4% 7.0% 5.8% 10.7% 3.7% 0.1% 7.9% 4.9% 4.2%
–4.3% 22.0% 21.1% 18.7% –4.8% 17.9% 5.9% 9.2% 6.9% 25.3% 16.6% 7.4% 15.9% 5.3% –19.5% 24.0% 11.8% 0.2%
Equity long/short 3.4% 26.4% 22.3% 23.7% 9.6% 34.4% 7.8% 2.3% –4.7% 18.9% 9.9% 8.9% 10.0% 8.5% –14.4% 16.9% 9.2% –3.0%
Global macro –5.0% 11.2% 9.9% 16.0% 8.1% 8.5% 10.0% 5.6% 2.8% 11.8% 4.5% 6.7% 4.9% 12.0% 3.7% 5.5% 6.1% 3.3%
–50.0%–40.0%–30.0%–20.0%–10.0%
0.0%10.0%20.0%30.0%40.0%50.0%
–2.9%
3.5%
EXHIBIT 3.6 Hedge Fund Indices: Annual Returns
81
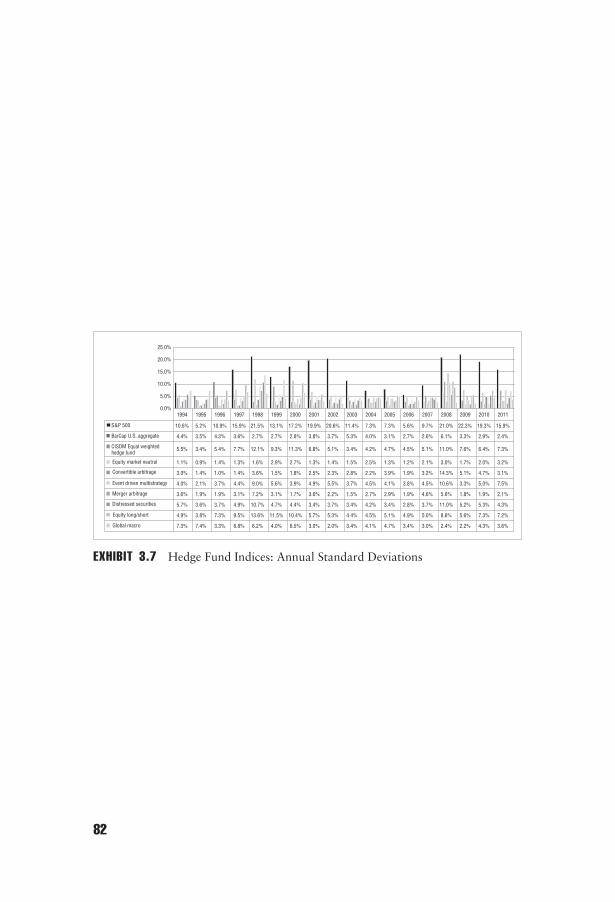
1994 1995 1996 1997 1998 1999 2000 2001 2002 2003 2004 2005 2006 2007 2008 2009 2010 2011
S&P 500 10.6% 5.2% 10.9% 15.9% 21.5% 13.1% 17.2% 19.9% 20.6% 11.4% 7.3% 7.3% 5.6% 9.7% 21.0% 22.3% 19.3% 15.9%
BarCap U.S. aggregate 3.5% 4.3% 3.6% 2.7% 2.7% 2.8% 3.8% 3.7% 5.3% 4.0% 3.1% 2.7% 2.6% 6.1% 3.3% 2.9% 2.4%
CISDM Equal weightedhedge fund
3.4% 5.4% 7.7% 12.1% 9.3% 11.3% 6.8% 5.1% 3.4% 4.2% 4.7% 4.5% 5.1% 11.0% 7.6% 6.4% 7.3%
Equity market neutral
Convertible arbitrage
Event driven multistrategy
1.1% 0.9% 1.4% 1.3% 1.6% 2.9% 2.7% 1.3% 1.4% 1.5% 2.5% 1.3% 1.2% 2.1% 3.0% 1.7% 2.0% 3.2%
3.0% 1.4% 1.0% 1.4% 3.6% 1.5% 1.8% 2.5% 2.3% 2.8% 2.2% 3.9% 1.9% 3.2% 14.3% 5.1% 4.7% 3.1%
4.0% 2.1% 3.7% 4.4% 9.0% 5.6% 3.9% 4.9% 5.5% 3.7% 4.5% 4.1% 3.8% 4.5% 10.6% 3.3% 5.0% 7.5%
Merger arbitrage
Distressed securities
3.6% 1.9% 1.9% 3.1% 7.2% 3.1% 1.7% 3.6% 2.2% 1.5% 2.7% 2.9% 1.9% 4.6% 5.6% 1.8% 1.9% 2.1%
5.7% 3.6% 3.7% 4.9% 10.7% 4.7% 4.4% 3.4% 3.7% 3.4% 4.2% 3.4% 2.8% 3.7% 11.0% 5.2% 5.3% 4.3%
Equity long/short 4.9% 3.8% 7.3% 9.5% 13.6% 11.5% 10.4% 5.7% 5.3% 4.4% 4.5% 5.1% 4.9% 5.0% 8.6% 5.6% 7.3% 7.2%
Global macro 7.3% 7.4% 3.3% 6.8% 6.2% 4.0% 6.5% 3.0% 2.0% 3.4% 4.1% 4.7% 3.4% 3.0% 2.4% 2.2% 4.3% 3.6%
4.4%
5.5%
0.0%
5.0%
10.0%
15.0%
20.0%
25.0%
EXHIBIT 3.7 Hedge Fund Indices: Annual Standard Deviations
82

1994 1995 1996 1997 1998 1999 2000 2001 2002 2003 2004 2005 2006 2007 2008 2009 2010 2011
BarCap U.S. aggregate 0.76 0.22 0.51 0.68 –0.42 0.34 0.40 –0.40 –0.72 –0.04 0.06 –0.19 0.28 –0.44 0.35 0.64 –0.58 –0.35
CISDM Equal weighted hedgefund index
0.80 0.37 0.70 0.71 0.93 0.73 0.44 0.88 0.80 0.81 0.79 0.72 0.74 0.59 0.82 0.79 0.91 0.85
Equity market neutral 0.27 0.16 0.22 0.50 0.38 0.23 0.33 0.09 0.53 0.51 0.64 0.54 0.41 0.48 0.36 0.54 0.64 0.88
0.46 0.21 0.53 0.47 0.67 0.36 0.34 0.15 0.31 –0.04 0.02 0.45 0.05 0.40 0.74 0.29 0.60 0.76
0.61 0.49 0.61 0.66 0.90 0.55 0.40 0.66 0.66 0.73 0.89 0.74 0.70 0.79 0.86 0.63 0.89 0.86
Merger arbitrage 0.67 0.71 0.61 0.57 0.90 0.19 0.10 0.54 0.54 0.68 0.88 0.79 0.40 0.81 0.83 0.61 0.64 0.88
0.79 0.70 0.64 0.51 0.80 0.47 0.40 0.39 0.43 0.58 0.77 0.58 0.42 0.65 0.83 0.48 0.78 0.80
Equity long/short
Distressed securities
Event driven multistraregy
Convertible arbitrage
0.89 0.59 0.63 0.70 0.95 0.69 0.54 0.88 0.72 0.81 0.88 0.77 0.82 0.70 0.69 0.74 0.94 0.93
Global macro 0.72 0.35 0.49 0.80 0.55 0.58 0.34 0.45 –0.07 0.32 0.63 0.63 0.59 0.46 –0.01 0.41 0.51 0.23
–1.00–0.80–0.60–0.40–0.200.000.200.400.600.801.001.20
EXHIBIT 3.8 Hedge Fund Indices: Annual Correlations with S&P 500
83
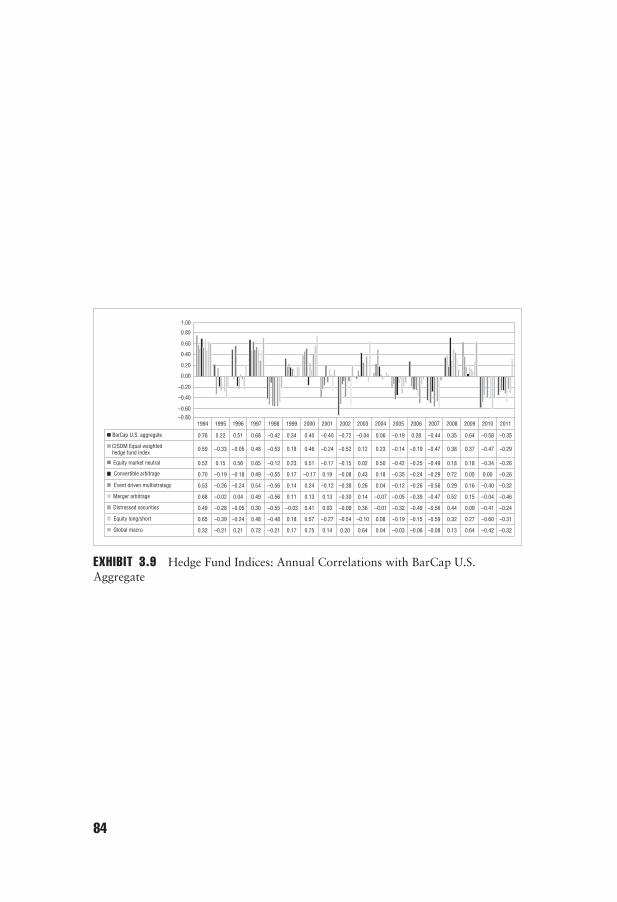
–0.80
–0.60
–0.40
–0.20
0.00
0.20
0.40
0.60
0.80
1.00
1994 1995 1996 1997 1998 1999 2000 2001 2002 2003 2004 2005 2006 2007 2008 2009 2010 2011
BarCap U.S. aggregate 0.76 0.22 0.51 0.68 –0.42 0.34 0.40 –0.40 –0.72 –0.04 0.06 –0.19 0.28 –0.44 0.35 0.64 –0.58 –0.35
CISDM Equal weightedhedge fund index
0.59 –0.33 –0.05 0.48 –0.53 0.18 0.46 –0.24 –0.52 0.12 0.23 –0.14 –0.19 –0.47 0.38 0.37 –0.47 –0.29
Equity market neutral 0.52 0.15 0.56 0.65 –0.12 0.23 0.51 –0.17 –0.15 0.02 0.50 –0.42 –0.25 –0.49 0.18 0.18 –0.34 –0.26
0.70 –0.19 –0.18 0.49 –0.55 0.17 –0.17 0.19 –0.08 0.43 0.18 –0.35 –0.24 –0.29 0.72 0.05 0.00 –0.26
0.53 –0.26 –0.24 0.54 –0.56 0.14 0.24 –0.12 –0.38 0.26 0.04 –0.12 –0.26 –0.56 0.29 0.16 –0.40 –0.32
Merger arbitrage 0.68 –0.02 0.04 0.49 –0.56 0.11 0.13 0.13 –0.30 0.14 –0.07 –0.05 –0.39 –0.47 0.52 0.15 –0.04 –0.46
0.49 –0.28 –0.05 0.30 –0.55 –0.03 0.41 0.03 –0.09 0.36 –0.01 –0.32 –0.49 –0.56 0.44 0.09 –0.41 –0.24
Equity long/short
Distressed securities
Event driven multistrategy
Convertible arbitrage
0.65 –0.39 –0.24 0.48 –0.48 0.18 0.57 –0.27 –0.54 –0.10 0.08 –0.19 –0.15 –0.59 0.32 0.27 –0.60 –0.31
Global macro 0.32 –0.21 0.21 0.72 –0.21 0.17 0.75 0.14 0.20 0.64 0.04 –0.03 –0.06 –0.08 0.13 0.64 –0.42 –0.32
EXHIBIT 3.9 Hedge Fund Indices: Annual Correlations with BarCap U.S.Aggregate
84
Hedge Funds 85
PERFORMANCE IN 2008
In 2008, hedge funds experienced their lowest returns since major databasesstarted tracking hedge fund data in 1994. When compared to the S&P500, hedge funds reported higher returns and lower volatility. However,hedge funds reported a lower annualized return and higher volatility thanthe BarCap U.S. Aggregate Index. In 2008, the correlation between theCISDM EW HF and the S&P 500 was approximately 0.82, partially causedby the common decline in valuation in the fall of 2008. In short, in 2008,most hedge fund strategies, like traditional asset classes, were negativelyimpacted by the subprime crisis, by negative equity market performance,and by the rise in credit spreads (e.g., decline in high-yield bond returns).As shown in Exhibit 3.6, this was especially true for hedge fund strategieswith exposure to equity markets (e.g., equity long/short) and credit markets(e.g., distressed securities, convertible arbitrage, and event-driven multi-strategies). In contrast, certain hedge fund strategies that were designedto have little market exposure (e.g., equity market neutral) or that werediscretionary in nature (e.g., global macro) provided positive returns.
Summarizing the results of 2008, investors should be reminded thathedge funds encompass a number of strategies and that the performanceof these strategies is based, in part, on their underlying exposure to thevery markets in which they trade. In addition, there always exists a marketcondition in which a particular strategy or even, in fact, all strategiesmay perform poorly. An investor should always be aware of the uniqueconditions (e.g., lack of available credit, lack of secondary markets, or limitson exchange trading) to which even a strategy that has been profitable foryears may be exposed. Over the years, there have been other ‘‘2008s,’’ duringwhich most investment strategies experienced similar common drawdowns.The actual participating event may have differed, but in each case, the resultwas a lack of liquidity and investor withdrawals.
MAKING SENSE OUT OF HEDGE FUND INDICES
There are currently a number of hedge fund manager-based indices that canbe used as benchmarks for hedge fund performance. Investors should notethat each hedge fund return index has its own approach to performancepresentation, manager selection, and investment style classification. Hedgefund indices are products dependent on the business models and financingof their owners. As such, each has unique characteristics and should not berelied on at face value. This is similarly true for indices measuring traditionalasset classes. Although an investor may disagree with the methodology,
86 POSTMODERN INVESTMENT
this transparency offers the ability to understand relative strengths andweaknesses and to make appropriate adjustments.
Again, it is important to remind investors that composite hedge fundindices may offer little as to the actual or expected performance of anyindividual investor. The hedge fund industry has evolved dramatically overthe past 20 years. As discussed previously, focusing on the returns of acomposite index for which the underlying strategies and investment in thosestrategies have changed dramatically offers little evidence as to the benefitsof the universe of hedge funds over time, except under the most restrictiveof assumptions as to investor behavior and investment. In short, most hedgefund indices reflect the performance of a noninvestable portfolio of hedgefund strategies. An equal-weighted index assumes that the investor holds ahedge fund portfolio that reflects the number of reporting funds and thatthe investor can rebalance consistent with the measurement period of theindex (e.g., monthly). An asset-weighted index assumes that the investorholds a hedge fund portfolio weighted to reflect the AUM of the underlyingmanagers and can adjust his or her portfolio to match incoming cash flowsto each strategy. There is no single investor who can meet all of the above.What composite hedge fund indices do provide is an estimate of a compositereturn to a wide range of strategies within the hedge fund industry at aparticular point in time. Individual funds of funds or individual funds willreflect the returns of the composite index only to the extent that the fundof funds or the manager’s strategy reflect the composition of the historicallyderived hedge fund composite index.
Emphasis on individual strategy-based indices that more closely reflectthe actual performance of a particular fund of funds or hedge fund managermay provide a more realistic portrayal of expected rates of return andrisks across an array of market environments. However, even in this case,strategies do change over time. What is necessary is to understand theconditional factors driving individual hedge fund strategies and to ensurethat particular hedge fund strategy returns are consistent with the historicalfactors (e.g., equity long/short managers generally make money in up equitymarkets, and distressed security hedge fund managers perform well indeclining credit spread conditions).
An investor should not view the returns of a particular manager asreflecting the pros and cons of the entire industry or that of an averageinvestor. A wide range of individuals/institutions hold a wide range of hedgefund strategies for a wide range of reasons (e.g., to lower risk or to enhancereturn). Investors should also not base the benefits of hedge funds solelyon historical returns and risk. For example, looking over a past period ofsuperior bond or stock returns (falling bond yields or low equity volatility)tells us nothing about how a portfolio of hedge funds may benefit bond or
Hedge Funds 87
stock investors in a forecasted period of increasing interest rates or stockmarket volatility. Finally, given the varying risk exposures of any individualinvestor, determining the benefits of hedge funds in general, or of a strategyin particular, is investor specific.
The form of the return estimation should be consistent with the analysisconducted. If an investor is using monthly data to create a portfolio designedto reflect the actual historical conditions or to test the conditional impact ofmarket factors on hedge fund return, then the use of monthly rates of returnis generally recommended. If an investor attempts to estimate the return bywhich a $1 investment grows to its final value over a period of time, thena geometric rate of return is often used. To reflect an individual investor’schanging investment level over time, an internal rate of return (with a hostof assumptions as to the reinvestment rate) is recommended (although theweighted risk assessment requires a different form of return measurement).
MAKING SENSE OUT OF ALTERNATIVE APPROACHESTO INVESTING IN HEDGE FUNDS
Investors can use five different methods for investing in hedge funds andrelated investment products: (1) direct investment, (2) fund of hedge funds,(3) structured products, (4) hedge fund replication products, and (5) hybridmutual funds. This list of investment products requires a decreasing amountof resources and expertise on the part of an investor. For example, directinvestment will be a suitable approach only for those investors who areallocating a significant amount to hedge funds and have the resources toevaluate individual managers. Conversely, hybrid mutual funds are rathertransparent investment products that are accessible to retail investors. Ofcourse, these products are unlikely to have the same risk-return profiles asfees, and restrictions on investment strategies will affect their performanceprofiles.
Individual Fund Investment
Individual funds across and within hedge fund strategies may differ on a widerange of qualitative factors and quantitative factors. Funds may differ inasset size, leverage, years since inception, level of incentive fees, managementfees, lockups, redemption periods, high watermarks, investment structure(e.g., partnership or corporate entity), currency, and a number of otherfactors. Research2 has indicated that some of these characteristics havelittle effect on fund performance (e.g., size), but other factors do seem toimpact expected return and risk (e.g., lockups and years since inception).
88 POSTMODERN INVESTMENT
Investors should be aware that the performance of a hedge fund index isin fact the performance of a portfolio of funds. Individual hedge fundswithin any individual strategy may have return and risk characteristics thatdiffer from that reported for the hedge fund index.3 Investors should also beaware that a single database does not represent all funds across the industryand that multiple databases are often required to adequately represent theinvestment strategy universe. Equally, investors should be made aware thatthe performances of funds currently reporting to major databases often donot reflect the average returns of funds that existed in the past but no longerreport in the current database. The often higher historical returns to hedgefunds listed in the current database in comparison to those in older databasesis caused by several biases in database construction, including survivor andbackfill bias: The historical returns of new funds reporting to the databaseare included in the new database but not in historical databases. Since, inmost cases, only funds with superior historical returns report to databases,the returns prior to the database entry date may be biased upward relativeto all those funds that do not report, or to funds that had been reportingfor several years. In addition, funds that once existed in the database areremoved from the database when they stop reporting. Often these fundsstop reporting because of poor returns. The often-lower returns of thesefunds are not contained in the live portion of most databases. Therefore,investors must ask for the dead fund databases in order to measure theactual returns to investment in funds that may have existed in the past (e.g.,survivorship bias).
Other biases may also exist in any single database, such as selectionbias (databases differ on their requirements for reporting) and reportingbias (managers may be in one strategy but report as if they were in another).The extent of these biases may differ by strategy, time period, and database.A potential investor, therefore, must use proper due diligence in under-standing the actual performance characteristics of a fund before consideringinvestment in it. For example, research has shown that if the first year or soof performance is removed from a fund reporting to a database, the impactof backfill bias is reduced dramatically. An investor should also rememberthat most hedge fund indices do not contain survivorship bias or backfillbias, as all managers reporting to the database at any one time are used.Historical index returns are not changed when these managers are removedfrom the database and, therefore, do not reflect survivorship bias. Similarly,as new managers are added to the database, historical index returns arenot changed to reflect those new managers and corresponding historicalindex returns. Hence, no backfill bias or survivor bias is contained in theseindices. Various hedge fund indices may still differ because of differences in
Hedge Funds 89
reporting managers or construction (e.g., median return or asset weighted),but these differences are similar to those existing in traditional assetindices.
Fund-of-Funds Investments
Most major hedge fund indices reflect the performance of a portfolio ofhedge funds. However, the actual performance of a fund of funds differssomewhat from a portfolio of hedge funds. First, funds of funds often addon an extra layer of fees to reflect their additional asset management andoversight role. Additionally, fund-of-funds managers often engage in moreactive management of funds within their strategy and do not employ thecurrent composition of the composite hedge fund index or the style purityof the individual strategy indices. Finally, it is important to point out thata composite hedge fund index is, in essence, a portfolio of hedge funds,whereas a composite hedge fund-of-funds index is, in essence, a portfolio ofhedge fund portfolios (a fund of fund of funds).
Although the correlation between the two indices—composite hedgefund index and composite hedge fund fund-of-funds index—is high (for theCISDM EW HF and the CISDM Fund of Funds, the correlation was 0.89for the period 1994 to 2011), the return and the standard deviation of theCISDM Fund of Funds are lower than those of the CISDM EW HF. Thisis expected, given the additional layer of fees existing on most hedge fundfund-of-funds products, and the tendency for hedge fund funds-of-fundsproducts to create profiles that have lower risk and lower expected returnsthan the composite hedge fund index.
In addition to the issues involved in comparing traditional hedge fundperformance indices with hedge fund fund-of-fund indices as well as theuse of fund-of-funds indices to reflect the performance of individual fundof funds, another potential issue with funds of funds is the common useof indices based on risk classifications (e.g., HFR conservative, diversified,and strategic) rather than their primary strategy classifications (e.g., debt,equity long/short, and global macro). Rather than focusing on the risk levelof a fund of funds, an investor should concentrate on the characteristicsof the fund of funds that emphasize a particular strategy that may havereturn and risk characteristics that are more specific to the fund of funds’individual strategy. In short, use of generic hedge fund indices grouped byrisk class may not be representative of individual fund of funds. As a result, afund of funds’ relative performance should be compared to a representativeportfolio or another fund of funds that more accurately reflects the portfolioholdings of the individual fund of funds.
90 POSTMODERN INVESTMENT
Investable Hedge Fund Indices
The growth in hedge fund investment has encouraged a number of firms tooffer investable hedge fund index products. This group includes well-knownindex providers, such as Credit Suisse First Boston (CSFB) and firms thatspecialize in hedge fund investment, such as HFR. These manager-basedinvestable index products reflect portfolios of hedge fund managers oftencreated using systematic rules (e.g., size, time since inception, style purity).Since each active manager-based investable hedge fund index is based ona different set of investment rules, these hedge fund indices differ in manyways. As a result, seemingly similar hedge fund indices may have differentreturn and risk performance over similar periods. However, previous studiesshow that despite differences in risk and return, the various hedge fundindices generally report similar correlations to one another as well as tomajor market factors, such as stock and bond indices.4
Hedge Fund Trackers
The growth in hedge fund investment has encouraged a number of firms tooffer products called tracker/replication index/benchmark products. Theseproducts have the goal of providing returns that capture the underlyingreturn of basic hedge fund strategies. The performance results for variousreplication indices have illustrated similar returns, risks, and correlationsbetween the hedge fund tracker and corresponding non-investable hedgefund indices. For example, the correlations of the replication indices withthe CISDM EW HF are fairly high. In addition, the Goldman Sachs AbsoluteReturn Tracker Index showed correlations of 0.82 with the CISDM EW HF.To the degree that these hedge fund trackers are constructed with securitiesthat can be shorted, investable products based on these trackers can beused both to provide liquid substitutes for relatively illiquid manager-basedhedge funds and as a means to manage the risk (e.g., hedge) of hedge fundsthat cannot be sold in the short run.
Publicly Traded Exchange-Traded Funds or Mutual Funds
Publicly traded funds (mutual funds and UCITS) or investment securities(exchange-traded funds [ETFs] and exchange-traded notes [ETNs]) haverecently come into existence, offering hedge fund-like products at both themutual fund and the ETF or ETN level. Although there can be structural dif-ferences between private manager-based hedge fund products and publiclytraded products, both offer access to the underlying returns embedded inan individual hedge fund strategy. These public investment vehicles includeboth manager-based hedge fund products (e.g., mutual funds) and more

Hedge Funds 91
algorithmic-based public hedge fund-like vehicles. Algorithmic-based pub-lic hedge fund vehicles include both dynamic investment vehicles, whichattempt to capture the returns of an active-manager trading approach (e.g.,momentum trading processes), and hedge fund trackers, which generallyfollow a more prescribed set of investment rules (i.e., investment track-ers use a variety of approaches, such as factor-based, security-based, anddistribution-based replication, to track return streams of hedge funds). Bothmutual fund- and ETF/ETN-based products offer relatively liquid access toboth composite hedge fund returns and strategy-based hedge fund returns.Similar to private fund-of-funds investment vehicles, public investment vehi-cles exist, which invest in a number of hedge fund investment strategies andoffer a diversified portfolio of hedge fund investment strategies to the typicalnonqualified or non-accredited investor.
A PERSONAL VIEW: ISSUES IN HEDGE FUNDINVESTMENT
Two areas of hedge fund investment have recently attracted the attentionof the investment community: the risk-and-return profiles of fund-of-fundsinvestments and the unique distributional characteristics of hedge fundmanagers. A primary reason that an investor chooses to invest in a fundof funds rather than directly in hedge fund managers is the ability of fund-of-funds managers to perform due diligence and select top tier managers.The Madoff fraud case showed that at least some fund-of-funds managersdid not perform the most basic type of due diligence and made substantialallocations to Madoff. An analysis of the risk-return properties of hedgefund managers should examine whether there are common sources ofrisk and return among them and whether these properties are persistentthrough time.
Fund-of-Funds Investment
A qualified or accredited investor may also invest in a fund of hedge funds,which provides exposure to a basket of select hedge funds. Funds of fundsmay invest in a wide variety of underlying strategies or in a single strategy.If properly structured, such funds are deemed to be widely diversified andhence not exposed to serious losses of any individual fund. Funds of fundstypically have lower minimum investment requirements, with their investorsgenerally benefiting from the expertise of the fund manager and not havingto conduct due diligence on the underlying funds, a process that requiresa great deal of resources. The failure to conduct proper due diligence on
92 POSTMODERN INVESTMENT
Madoff-based investments by several major fund-of-funds managers hasraised questions about the processes they employ and the integrity of theirdue diligence and business models.
Fund-of-funds managers typically charge a fee in addition to the feescharged by the managers on their platform. In this regard, there may bea management fee as well as an incentive fee. The larger fund-of-fundsplatforms have negotiating power and can provide access to significantlylower management and incentive fees for the underlying managers, andcan also negotiate lower silent fees. There is a small but growing trend ofthese firms charging a single flat fee for their services. Those fund-of-fundsmanagers who do not have substantial due diligence teams and sufficientAUM to garner pricing power have been criticized for offering far too littlefor the fees charged. Also, there is a growing trend toward the larger fund-of-funds managers offering separately managed accounts and enhancedunderlying liquidity for their clients.
Industry and academic research have often addressed the benefits ofhedge-fund fund of funds and the effect of an additional layer of fees onproduct performance. Often research in the area has failed to considerthe actual business model of a fund of funds. There are unique strategyemphases within individual funds of funds that are directly influenced bytheir underlying investors. In short, many of these investors have objectivesthat are not wholly performance oriented. Another factor has to do withwhen a fund of funds is created. Given lockups, due diligence, and otheradministrative costs, as well as the market sales environment, a fund offunds is often created with an emphasis on those hedge fund strategies thatsell in the current market environment.
It is difficult to group differing funds of funds in a comparative perfor-mance analysis. As a consequence, due diligence must focus on such issuesas the operational infrastructure, the length of time it has been in existence,and the abilities of the respective management teams. Many investors andacademics seemingly believe that fund-of-funds managers have no or littlecosts and can easily reallocate across fund managers. They fail to realizethe large costs involved in due diligence as well as the necessary bankingrelationships that enable these managers to obtain underlying lines of credit.In fact, one of the primary jobs of the internal risk-management processis to manage the lines of credit that permit the fund portfolio managersto make investor redemptions without fundamentally changing the riskcharacteristics of the fund.
Also, the distribution process of a fund of funds is often impacted bythe ability of the fund to reach the proper investor audience. Many fund-of-funds vehicles have a relative value orientation, given the greater demandfor low-risk hedge funds in periods of academic distress. Next, the entire
Hedge Funds 93
area of fund-of-funds fees relative to a randomly selected portfolio of hedgefunds must be considered in light of the costs of an investor to replicatethe due diligence, accounting oversight functions. An additional factor inthis market is that many hedge fund managers will only make a smallportion of their overall investment available to these public pool vehicles(with the rest used primarily as managed-account investments, which mayrequire less direct marketing efforts). Another element is that in this businessmodel, money is often deployed to an underlying manager to lock up futurecapacity. Fund-of-funds managers also have the resources and technologyto understand the underlying risk exposure of the overall portfolio and havethe greater ability to micromanage factor exposure, providing an additional‘‘implied option’’ benefit to their work.
Distributional Characteristics
The primary reason for hedge fund investment is the degree to which an indi-vidual hedge fund strategy provides unique risk and return characteristicsnot easily available in other investment vehicles. Various hedge fund strate-gies trade unique markets in proprietary forms. Moreover, these strategieshave a dynamic element in that they are not restricted by law or custom totrack a particular long-only strategy. That said, the expected distributionalcharacteristics of an individual strategy simply reflect the security holdingsof the hedge fund strategy and the degree to which individual managers caneasily adjust the underlying risk of the portfolio (e.g., increase or decreaseleverage). Unfortunately, the conditional nature of hedge fund strategiesmakes any cross-sectional or time series analysis of the historical distribu-tional nature of a hedge fund strategy a simple ‘‘prisoner’’ of the data. Forexample, as shown in Exhibit 3.10, when the monthly returns of equitylong/short hedge funds are ranked on the CISDM Equity Long/Short (ELS)Index, in periods of extreme monthly CISDM ELS Index returns, almost allthe equity long/short managers have the same directional movement as theCISDM ELS Index. In brief, the expected returns of individual managersmust be conditioned on the general movement of the underlying strat-egy. Removing a single day or a single month can dramatically change thereported distributional moments of a particular strategy. Simple descriptionsof the risk characteristics of various hedge fund strategies based on monthlydata should not be accepted by any academic or investor as the final state-ment on the risk characteristics of what is, by nature, a dynamic strategy.
Governance
The fundamental assumption of many analysts that a hedge fund is managedby the listed manager is fraught with error. No successful fund can rely
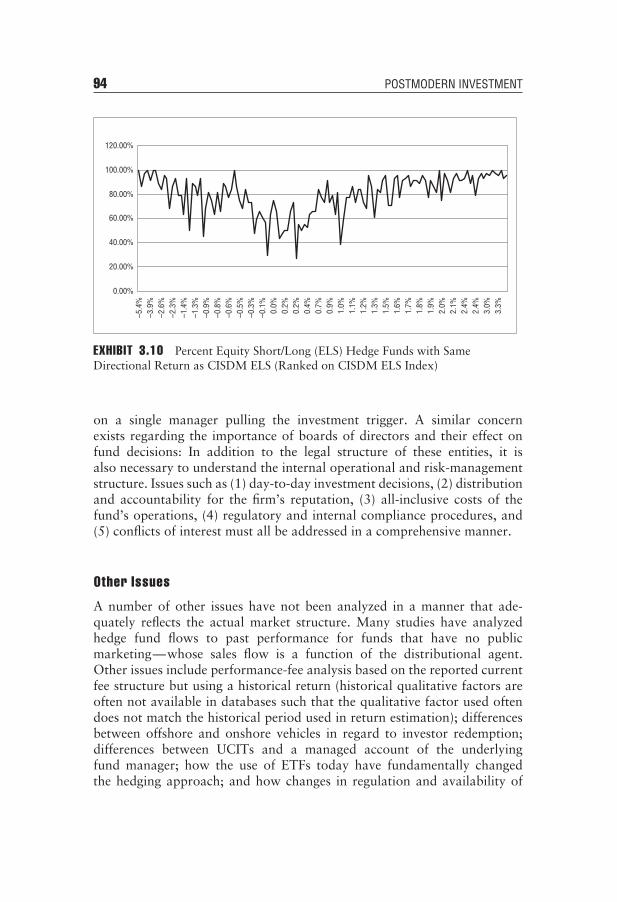
94 POSTMODERN INVESTMENT
0.00%
20.00%
40.00%
60.00%
80.00%
100.00%
120.00%–5
.4%
–3.9
%–2
.6%
–2.3
%–1
.4%
–1.3
%–0
.9%
–0.8
%–0
.6%
–0.5
%–0
.3%
–0.1
%0.
0%0.
2%0.
2%0.
4%0.
7%0.
9%1.
0%1.
1%1.
2%1.
3%1.
5%1.
6%1.
7%1.
8%1.
9%2.
0%2.
1%2.
4%2.
4%3.
0%3.
3%
EXHIBIT 3.10 Percent Equity Short/Long (ELS) Hedge Funds with SameDirectional Return as CISDM ELS (Ranked on CISDM ELS Index)
on a single manager pulling the investment trigger. A similar concernexists regarding the importance of boards of directors and their effect onfund decisions: In addition to the legal structure of these entities, it isalso necessary to understand the internal operational and risk-managementstructure. Issues such as (1) day-to-day investment decisions, (2) distributionand accountability for the firm’s reputation, (3) all-inclusive costs of thefund’s operations, (4) regulatory and internal compliance procedures, and(5) conflicts of interest must all be addressed in a comprehensive manner.
Other Issues
A number of other issues have not been analyzed in a manner that ade-quately reflects the actual market structure. Many studies have analyzedhedge fund flows to past performance for funds that have no publicmarketing—whose sales flow is a function of the distributional agent.Other issues include performance-fee analysis based on the reported currentfee structure but using a historical return (historical qualitative factors areoften not available in databases such that the qualitative factor used oftendoes not match the historical period used in return estimation); differencesbetween offshore and onshore vehicles in regard to investor redemption;differences between UCITs and a managed account of the underlyingfund manager; how the use of ETFs today have fundamentally changedthe hedging approach; and how changes in regulation and availability of
Hedge Funds 95
credit have fundamentally changed the level of leverage available in manystrategies.
WHAT EVERY INVESTOR SHOULD KNOW
In Chapter 3, the development of hedge funds, their strategies, their use asstandalone investments, and their addition to stock and bond portfolios wasexplored. In brief, the evidence presented in this chapter shows that hedgefunds, what they are, and how they perform, can be as easily understoodand explained as most traditional stock and bond investments. At the sametime, there are a few differences of which investors should be aware.
■ Hedge Funds Are Merely ‘‘Advanced’’ Traditional Assets. Hedge fundsare not black boxes where the average intelligent investor cannotunderstand the investment process and risks if properly detailed. Hedgefunds as a class of investment strategies were unique in that they werehistorically available primarily to high net worth individuals becauseof certain regulatory restrictions. However, we know that they are notunique and that the sources of returns, their pricing, and their risks areoften well understood at the strategy level. Investors should insist on fulland complete disclosure and should not invest in funds or processes thatdo not provide the type of transparency required for an independentand objective analysis of risks and returns. Investors should not fall intothe trap of proprietary information that cannot be disclosed, becauseit is vital to successful returns. As for any other investment, if a fundcannot or will not explain the sources of returns and risk when it makesor loses money, take your money and go somewhere else.
■ Hedge Funds, Like Other Assets, Have Benchmarks: Some hedge fundmanagers may attempt to present themselves as so unique that it isimpossible to compare their returns with others. Wrong. An active hedgefund manager’s performance alpha is generally defined as the excessreturn to active management adjusted for risk; that is, the return adjustedfor the return of a comparable investable ‘‘non-actively managed’’ riskyasset position or portfolio. The only way of correctly analyzing an activemanager’s alpha is by measuring that manager’s performance against asimilar collection of risks. Therefore, deciding which tools and indices touse is paramount in performance measurement. Investors should ensurethat their measurement proxies actually reflect the risk and rewards ofa particular manager. In short, ask your potential manager for a set ofcomparable firms and a passive index benchmark that reflect the returnsof its strategy.

96 POSTMODERN INVESTMENT
■ Hedge Funds Offer Unique Opportunities but Not Absolute Returns.Most regulatory agencies will tell you that investors always go wrongby believing in unrealistic returns or returns that are not consistentwith a manager’s stated strategy. This is a red flag that no investorshould ignore. Do not let hope and greed trump what you know aboutthe basic efficiencies of the market. With the exception of a very few,hedge fund managers are prisoners of the asset classes they trade, andabnormal returns do not occur. By example, John Paulson’s returns wereextraordinary during the subprime housing debacle, yet those returnswere based on known facts and conditions that others participated inas well. Some lost money anticipating the burst of the housing bubble,and some, like Paulson, made a great deal of money. In sum, it wasa known and verifiable ‘‘bet.’’ When you invest, just know what the‘‘bet’’ is.
MYTHS AND MISCONCEPTIONS OF HEDGE FUNDS
As discussed in previous chapters, a delay in investors’ understanding, oreven market awareness, of new research or market relationships often resultsin a delay in investors’, corporate officials’, and government regulators’appreciation of these changes and the creation of a series of myths abouthow financial products operate, as well as their effect on financial markets,domestically as well as globally. If a brief review of newspaper articles,books, and other public media is a basis for evaluation, hedge funds areone investment where both myths and misconception as to the costs andbenefits are not in short supply. This may be caused both by hedge fundmanagers’ desire to continue to exploit the allure of their uniqueness orthe public press’s desire to find a good story that draws readers’ interest.Unfortunately, to paraphrase Mark Twain, ‘‘truth dies a quick death, but alie well told lasts forever.’’ Hopefully, the following may not bring the truthback to life but it may stop the life span of the lie.
Myth 3.1: Hedge Funds Are Absolute Return Vehicles
Hedge funds have often been described as absolute return vehicles both byhedge fund managers and by the financial press. So, in part, both are atfault. As discussed in this book, one of the reasons for the presentationof hedge funds as absolute return vehicles is that managers may maintainthat since they do not try to track any specific benchmark, they have theopportunity to make positive returns in any market environment and that
Hedge Funds 97
they attempt to search for ‘‘absolute’’ return rather than benchmark plusreturn. Some hedge fund managers may also use the risk-free rate as a‘‘performance benchmark’’ since their strategy is designed to reduce oreliminate market risk. However, in truth, despite the fact that some hedgefund strategies have low equity betas or fixed income duration, as well asthe lack of a regulatory requirement to track a particular passive index, itdoes not mean that hedge funds have the expectation of positive returnsin all market environments. Unfortunately, many investors interpret thewords ‘‘absolute return’’ as investment strategies that are not correlatedwith underlying traditional stock and bond markets. In fact, most hedgefund managers have correlations with stock and bond markets consistentwith their underlying portfolio holdings such as equity for equity long/shortmanagers and credit risk for distressed security managers. As a result, hedgefund returns, although partly caused by manager skill, are also based ona set of common market factors; thus, most hedge fund strategies havea common market factor benchmark component and so should not beregarded as absolute return vehicles but as investment strategies with theirown unique expected return and risk exposures.
Myth 3.2: Hedge Funds Are Highly LeveredRisky Investments
The risk and return attributes of hedge funds are determined solely bytheir investment strategy. Some hedge funds invest primarily in long-onlycash instruments that employ little leverage, since the underlying asset itselfhas a high return-to-risk trade-off. Other hedge funds invest in low-riskstrategies, such as security arbitrage. These funds use leverage positionsin order to offer a reasonable expectation of return. The fact is that thetypical portfolio of hedge fund returns has had low volatility (generally inthe range of 6 to 12 percent annually, depending on the strategy), far lessthan the typical stock (approximately 25 to 40 percent) or stock mutualfund (approximately 10 to 20 percent). As discussed earlier, investors mustalso remember that leverage itself is not something to be avoided. Accordingto recent data from the International Monetary Fund, European banks, forexample, are levered about 20 to 1 (about 5 percent of assets are equitycapital, 95 percent are loans and deposits). Residential real estate is typicallylevered 5 to 1 (a 20 percent down payment is common, with 80 percentborrowed). Corporations in risky businesses, such as technology stocks andautomobile manufacturers, tend to be financed mostly with equity becauseof the unpredictability of the returns. In short, the more highly leveragedan investment or firm is, the more care one must take to ensure that thepayment flows are more predictable or else large losses are possible.
98 POSTMODERN INVESTMENT
Myth 3.3: Hedge Funds Are Black Box Trading SystemsUnintelligible to Investors
For the most part, hedge funds protect their internal trading techniques frompublic scrutiny, but the same is true for mutual funds. For the most part,pre-trade transparency may have negative impacts on investor returns andmarket efficiency. Post-trade transparency, however, may provide investorswith an understanding of the source of returns to various hedge fundstrategies. In fact, today hedge fund trading approaches and sources ofreturns are well known. High-level risk-management tools are availableto track the risk of individual hedge funds. Many investors have accessto daily positions through managed accounts. Daily investable hedge fundindices are also available. In short, for the most part, hedge funds are notblack boxes any more than traditional mutual funds or corporate firms are.Investors may not know the particulars of each trade or product creationpre-trade, but how and why they perform post-trade is well known withinthe industry. Investors should remember that for most hedge fund strategies,it is basically about buying and selling stocks, bonds, commodities, futures,and options, as well as other well-known exchange or over-the-counter(OTC)-based financial products. It is all basic blocking and tackling; it isnot rocket scientist stuff despite how it is often pictured.
Myth 3.4: Hedge Fund Managers Fees Are Too High
One of the concerns placed on the back of the hedge fund industry is thatpoor average investor performance is caused partly by the high fees of hedgefund managers. Investors should be reminded that a hedge fund manager’sgross profits and an investor’s net profits are not comparable. Simply put,managers’ gross profits do not reflect managers’ net profits. One should nothave to be reminded that the gross fees paid to managers does not equalnet profits to them. In brief, a more extensive analysis, and not one basedon hedge fund gross profit, is required to determine if hedge fund net profitcan be regarded as exorbitant relative to the net return to the investor. Aninvestor must ask and answer the question of what he is genuinely gettingfor the fees paid; and, whether those fees are in alignment with expectedreturns and other investment opportunities that provide similar results. Ifon an after-fee basis, the returns of an active manager are less than those ofa passive benchmark, then the fees paid should be openly questioned.
Myth 3.5: Hedge Funds and Hedge Fund Strategies AreSo Unique That They Cannot Be Replicated
Investable passive-index strategies have long been acknowledged as thecornerstone of an investor’s core asset allocation methodology as well as anactive manager’s attribution analysis. In many ways this struggle between
Hedge Funds 99
pure passive security-based benchmark replication and active manager-based investment has been resolved. While a tension still exists betweenthe active and passive forms of direct security investment, they currentlycoexist within the stock and bond investment world. The new challenge isthat today this tension also exists in the hedge fund world. As discussedpreviously, we now know the underlying sources of returns or processes bywhich most hedge fund strategies are conducted. If the underlying sourcesor processes of returns are known, it is not a large step to developinginvestable products that capture the underlying returns of the associatedhedge fund strategy. Today, there exist a number of ‘‘tracker’’ funds thatcapture the market and alternative betas underlying the expected returnand risk of a comparison investment. It should be noted that while trackerproducts may provide access to a major portion of fund manager returns(both alpha and beta), their primary advantage is to provide competitiveafter-fee returns along with superior liquidity, transparency, and a reductionin an investor’s exposure to manager-specific risk (idiosyncratic or fraud).In short, a tracker-based fund may not provide the same level of ‘‘tradingalpha’’ as a comparison actively managed fund but it does provide returnsconsistent with the underlying risk of that fund.
Myth 3.6: Database Biases Make Hedge Fund IndexReturns of Little Use
As discussed previously, the use of any hedge fund index in any analysismust be done with care. There is plenty of academic research on problems inthe use of hedge fund databases to reflect historical performance (e.g., manydatabases fill in the old returns of managers when they start reporting todatabases and drop from their databases managers who no longer report).To the degree that the newly reporting managers’ historic returns are betterthan the managers’ historic returns who are leaving, the historical returns ofthe new database will be above that of the prior database. Please note: theprimary hedge fund indices (HFR, CISDM [not HFRX], etc.) simply reportthe returns of reporting managers (some with restrictions). There may bebackfill or survivor bias in the current database but not in the historicallyreported hedge fund index returns. Similar to the S&P 500, new firms comeand go to the database from which the S&P 500 firms are selected, however,once a firm’s return is included in the S&P 500, its return never leaves thatindex; if a firm is dropped from the S&P 500 because of poor performance,its old returns are not dropped from the historic S&P 500 and the S&P 500index is not revised. Only for a new database for which a historical index isnewly created from that database does an index have backfill bias. For theother indices (HFR, CISDM, Barclay, CSFB) used in this analysis, there isno basis for a backfill adjustment.

CHAPTER 4Managed Futures
A Zero-Sum Game?
For many, managed futures remain somewhat on the border of assetmanagement. In the past 20 years, managed futures have grown from
less than 25 billion to approximately 300 billion assets under management(AUM). Although the growth has been substantial, managed futures havelow AUM relative to other alternative asset classes such as hedge funds.There are various reasons for this. First, the name itself is somewhatconfusing. Although the term managed futures brings to mind someone whomanages futures contracts for profit, most managed futures traders have,for years, been referred to as commodity trading advisors (CTAs). This issomewhat unfortunate, because even though some managed futures tradersdo not even trade commodity-based futures contracts, many investorsare reluctant to invest in a strategy that implies heavy concentration incommodity-based futures contracts, which they regard as inherently risky.
The nomenclature, commodity trading advisors, is partially caused bythe fact that until the 1970s, active futures traders had to trade commodities,because financial futures contracts such as currency futures, financial futures,and equity futures did not exist. Currency futures began trading in the early1970s, after the U.S. dollar went from fixed to floating. In the mid-1970s,interest rate futures began trading (primarily short-term instruments such asU.S. Treasury bills); and by the late 1970s, long-term U.S. government bondand note contracts began to trade. By the mid-1980s, various U.S.-basedequity futures contracts began trading; and over the next decades, similarfinancial futures contracts started trading around the globe.
Other possible reasons for the slow growth of managed futures includethe fact that for many in the investment community, futures markets wereseen as a zero-sum game. That is, on any given day, gains to long positionsin futures markets were, by design, offset by losses to those taking theopposite short positions, and vice versa. Investors questioned how active
101
102 POSTMODERN INVESTMENT
futures traders could make money in a market that had a zero balance atthe end of the day. Of course, academics and practitioners had been lookingat this same issue for decades. For some, the answer was relatively simple.Many firms want—or need—to hedge their exposures to various financialvariables, including currencies, commodities, interest rates, and even equityprices. These firms use the futures markets to take long positions in futurescontracts to offset the risk of future price increases, or take short positionsin futures contracts to offset the risk of future price declines. When thereis no natural buyer or seller on the other side of the transaction, theyoften have to price the contract to bring in a trader (e.g., CTA) who is nota natural hedger. This price benefit to the CTA may be one part of thepotential return to the CTA. Other areas of potential profit include the factthat sometimes cash market participants just want to get out of a contractarea, even if the commercial or financial firm believes prices will continue torise or fall. CTAs can profit in just that market by taking the opposite sideof the hedger’s new short or long position, especially since they have theability to take relatively large futures positions with relatively little cash. Inbrief, CTAs can profit from the needs of others to use futures markets as aprimary risk-management tool.
As in any investment, ‘‘can make money’’ is not the same as ‘‘doesmake money.’’ However, in 1983, John V. Lintner of Harvard Universitypresented a paper, ‘‘The Potential Role of Managed Commodity-FinancialFutures Accounts (and/or Funds) in Portfolios of Stocks and Bonds,’’ to theFinancial Analysts Federation.1 The paper stated that ‘‘the improvementsfrom holding an efficiently selected portfolio of managed accounts orfunds are so large—and the correlation between returns on the futuresportfolios and those on the stock and bond portfolio are so surprisinglylow (sometimes even negative)—that the return/risk tradeoffs provided byaugmented portfolios . . . clearly dominate the tradeoffs available from aportfolio of stocks alone or from portfolios of stocks and bonds.’’ Noteveryone, of course, agreed with Professor Lintner. During the 1980s,considerable research was published that attempted to address the issue ofthe benefits of managed futures.2 It is somewhat sad, yet not surprising,that current views of many investors on the pros and cons of managedfutures as an investment are still tied to that earlier research, which focusedon a period when there were relatively few managed futures managersand when management and marketing expenses were greater than whatexist today. By the mid-1990s, the managed futures industry had maturedgreatly. New futures markets had come into existence; CTA and marketingexpenses (although high in current terms) were declining; and althoughmany investors (institutional and private) were still leery of the image ofactive futures traders, professional organizations (e.g., Managed Futures
Managed Futures 103
Association) and academic research centers (e.g., Center for InternationalSecurities and Derivatives Markets) had come into existence to promote andanalyze the managed futures industry.
By the early 2000s, advances in technology and market structure, alongwith changes in regulation, had led to an increase in both the number ofmanaged futures trading strategies and the AUM. On March 19, 2001, anarticle in BusinessWeek brought the earlier research of Lintner and otherson the benefits of futures funds up to date, concluding that
[Futures funds] have made money 17 of the past 20 years. Indeed,as long as you can stand the gyrations, putting a small part of yourportfolio in these funds can’t hurt.3
Likewise for the period since 2001, managed futures havecontinued to provide positive returns over a number of marketcycles. In 9 out of the past 10 years (2002–2011) the Center forInternational Securities and Derivatives Markets (CISDM) CTAEqual Weighted (EW) index has reported positive returns.
For the past 15 years, we were fortunate to be part of the develop-ment of the managed futures industry both academically and professionally.Academically, we worked with various managed futures professional orga-nizations on research focusing on the benefits of managed futures andsources of CTA returns. In the mid-to-late 1990s, we published a seriesof passive CTA trend-following indices and created one of the first aca-demic research centers (i.e., CISDM) dedicated to derivative markets. Wecame to see that the process by which most managed futures traders con-ducted their operations provided the potential for gain as well as loss, asmarkets went into periods of non-trending range-bound prices. Althoughmanaged futures had continued to grow and by the early 2000s hadbecome a major retail product, their potential gains were offset some-what by fees charged by the firms marketing these funds. The high fees ofsome CTAs also encouraged the firms marketing CTAs to fund primarilythose managers who had the highest volatility and greatest potential forgain—so much so that in 2003, we were asked by a major fund of fundsfirm to create a ‘‘tracker CTA,’’ which could reflect the returns of a majorCTA of the day. The idea was for the sponsor to keep offering the productat the high asset and performance fees charged by the previous managerbut to keep the fees internal. That CTA trading program began tradingin 2004 and runs to the current day. The program is based primarilyon the theory that there exists a set of algorithmic trading processes thatcapture some of the fundamental return to CTA traders. During the pastdecade, the low equity returns of the post-dot-com bubble led to increased
104 POSTMODERN INVESTMENT
interest in the potential benefits of managed futures programs. In addition,the growth of financial firms capable of offering direct managed accountsreduced the cost of many managed futures programs to accredited investors.Note that regulatory rules permitted most financial firms to continue mar-keting various CTA programs directly through their marketing and saleseffort, since sales personnel for CTA programs, for the most part, werenot required to meet some of the licensing requirements of equity-basedproducts.
If things had remained the same, managed futures would have continuedas a small but profitable niche product for financial firms, marketed primar-ily to high-net-worth individuals and small institutions. But things did notremain the same. As new markets and forms of asset management in deriva-tive products changed, so did managed futures. In addition to traditionalsystematic momentum-based CTA products, CTA products expanded intoa larger set of investment forms, including trading products that emphasizedvolatility trading, short-term trading, and trading in specialty areas (e.g.,energy). By the end of the first decade of the twenty-first century, managedfutures products existed not only in their traditional form but also in mutualfund and exchange-traded fund (ETF) form. Despite these market productchanges, managed futures growth has been limited relative to that of otheralternative investments, such as hedge funds. This may be partially causedby competition from more traditional products and continued uncertaintyas to the source of return to CTA programs. Given this headwind, man-aged futures (active trading of futures and option markets) have foundtheir way into traditional investment products (e.g., global macro funds)through what we may say is the back door. Increasingly, investment firmsare finding ways to use traditional managed futures trading processes withintheir business model and to explore other avenues to market this uniqueinvestment strategy.
WHAT ARE MANAGED FUTURES?
The term managed futures represents an industry composed of professionalmoney managers known as CTAs or commodity pool operators (CPOs).CTAs and CPOs manage client assets on a discretionary basis, using for-wards, futures, and options markets as the primary investment arena.Futures and options have long been used for both risk management andreturn enhancement. In fact, as discussed previously, producers and con-sumers of commodities have been using futures as hedging tools for manycenturies. Managed futures funds have been available as an investment
Managed Futures 105
alternative since the 1970s and have experienced significant growth over thepast several decades. As an active trading strategy, managed futures havethe ability to take both long and short investment positions in internationalfinancial and nonfinancial asset sectors and to offer risk-and-return patternsnot easily accessible through traditional (such as long-only stock and bondportfolios) or other financial assets (such as hedge funds, real estate, privateequity, or commodities). Their additive potential value to a portfolio washighlighted in 2008, when most traditional and alternative assets performedpoorly, but managed futures performed relatively well.
In the following sections, we first discuss various ways in which investorscan gain exposure to managed futures. Second, we explore sources ofmanaged futures returns. Third, we review managed futures as a stand-alone investment and as a means to provide additional return enhancementas well as risk reduction opportunities relative to those of stock and bondinvestments and other financial assets. Finally, we examine unique issuesand myths in the area of managed futures.
INVESTING IN MANAGED FUTURES
There are four basic ways to invest in managed futures. Public futures fundsoffer investors the managed futures equivalent of a mutual fund. These publicmanaged futures funds may have a fairly low minimum investor criterion,although some public funds may require investors to be of accreditedinvestor status. The second way to invest in managed futures is throughprivate funds (usually a $500,000 or higher minimum investment), whichtypically carry less expense than public funds. A drawback to this is that theyoften possess the characteristics of hedge funds and other private investmentvehicles with regard to limited transparency and investor liquidity. Thethird method is that extremely high-net-worth investors can hire a futuresmanager directly. Although there are advantages to hiring a futures managerdirectly as part of a customized investment program, the cost of doing sousually requires a relatively high minimum investment. A fourth methodincludes a range of mutual fund or security-based investment vehicles (e.g.,closed-end funds and ETFs) that offer a more direct means of capturingmanaged futures return opportunities in a public investment vehicle. Theforegoing investment criteria relate to U.S. investors; institutional andindividual investors under the regulatory oversight of global entities mayhave different investment opportunities than those just described. Investorsshould consider the unique investment opportunities and regulations relatedto their supervisory authority.

106 POSTMODERN INVESTMENT
MANAGED FUTURES STYLES AND BENCHMARKS
As with most investment strategies, the managed futures arena can often bedefined by the markets they trade and their unique approaches to trading(e.g., trend following and discretionary). For each of these markets andforms of trading, various firms have created CTA indices, similar to thosethat exist in equity and other investment asset classes. Historically, theprimary benchmarks are as follows:
■ EW CTA Indices: EW manager returns for all reporting managers inthe particular database.
■ Systematic: These trade primarily in the context of a predeterminedsystematic trading model. Most systematic CTAs follow a trend-following program, although some trade countertrend. In addition,trend-following CTAs may concentrate on short-term trends, midtermtrends, long-term trends, or a combination thereof.● Financial: Trade financial futures/options, currency futures/options,
and forward contracts.● Currency: Trade currency futures/options and forward contracts.● Diversified: Trade financial futures/options, currency futures/options,
forward contracts, and commodity futures/options.● Discretionary: Trade financial, currency, and commodity futures/
options based on a wide variety of trading models, including thosefounded on fundamental economic data or individual trader’s beliefs.Traders often have the right to use a systematic model based onpersonal criteria in making trading decisions.
As in other investment areas, there exists in managed futures a variety offirms that provide a number of manager-based CTA indices. In this chapter,the CISDM EW CTA Index is used as the primary representative commodityindex; however, when comparing certain CTA market or trading-basedindices, Barclay CTA indices are also used. As noted earlier, a number oflarger investment firms, as well as other players in the managed futures arena,offer a wide range of manager-based CTA indices. Each of these indicesis unique in its own way. For example, the CISDM and Barclay activemanager-based CTA indices are EW indices based on reporting managers toeach of the respective databases. These indices are not directly investable. Inrecent years, a number of manager-based CTA indices have been designed tocapture the returns of an investable set of active CTA managers (e.g., Barclayand Newedge). Each of these indices differs slightly in its construction;however, past research has indicated that the reported returns are highlycorrelated with noninvestable manager-based CTA indices.

Managed Futures 107
BASIC SOURCES OF RETURN AND RISK
Each of the aforementioned managed futures strategies reflects certain mar-ket opportunities as well as economic and market risks, and understandingthese risks is essential to comprehending managed futures returns and risks.In contrast to certain investment strategies for which the underlying returnis systematically related to traditional market factors, the sources of man-aged futures returns are more often described as being based on the uniqueskill or strategy of the CTA trader. Because managed futures are activelymanaged, manager skill is important; however, academic research4 demon-strates that many managed futures strategies are also driven systematicallyby algorithmic trading models or quantitative-based trading models. There-fore, an investor can think of managed futures returns as a combination ofmanager skill and an underlying return to the managed futures fund strategyor investment style itself. Similar to the equity and bond markets, passivesecurity-based indices have been created to capture the underlying returnto the managed futures fund. The performance of an individual managercan then be measured relative to that ‘‘strategy’’ return. If a manager’s per-formance is measured relative to the passive security-based managed fundindex or benchmark, then the differential return may be viewed as the man-ager’s alpha (return in excess of a similar non-manager-based investablereplicate portfolio). If a manager’s performance is measured relative toan index of other active managers, then the manager’s relative perfor-mance simply measures the over- or underperformance to that index ofmanager returns.
The sources of return to managed futures are uniquely different fromthose of traditional stocks, bonds, or even hedge funds. For example,although futures, swaps, and forward contracts can provide direct exposureto underlying financial and commodity markets (but often with greaterliquidity and less market impact), as discussed earlier, futures and optiontraders may also easily take short positions or actively allocate assetsbetween long and short positions within the futures and/or options markettrading complex. In addition, options traders may also directly trade marketand/or security characteristics that underlie the contract, such as pricevolatility. The unique return opportunities to managed futures may alsostem from the global nature of futures and contracts available for tradingand from the broader range of trading strategies. As a result, most CTAprograms (e.g., discretionary, systematic, and so on) report a low correlationwith most traditional market factors. At the same time, questions still existas to the inherent long-term return for CTAs. Many managed futuresstrategies trade primarily in futures and/or options markets, which, as hasbeen pointed out, are zero-sum games. If CTAs were only trading against
108 POSTMODERN INVESTMENT
other CTAs, then one might conclude that the returns to certain managedfutures traders would be based primarily on the skill of their managers.However, some spot market players are willing to sell or hedge positionseven if they expect spot positions to rise or fall in their favor (e.g., currencyand interest rate futures may be traded over time due to government policyto smooth price movements). CTAs offer liquidity to such hedgers andobtain a positive convenience yield (i.e., return-to-risk trade-off) in return.In short, long-term positive expected returns may be consistent with theunderlying instruments that CTAs trade.
Both academics and practitioners have often suggested that the returnand risk opportunities of managed futures are available because the skill-based investment strategies employed by managers do not explicitly attemptto track a traditional stock or bond benchmark and/or index and have theopportunity to offer liquidity or informational trades, which offer managedfutures traders the opportunity to maximize long-term returns independentof traditional asset benchmarks. However, as discussed previously, passivealgorithm-based managed futures indices also exist, which represent thereturn process of active managed futures managers (at least systematicmanaged futures managers). Investors should understand that just becausemanaged futures do not emphasize traditional stock and bond benchmarktracking does not mean that CTA return is based solely on manager skill.The performance of an individual manager can be measured relative toan active manager-based CTA benchmark or a passive algorithmic-basedinvestable benchmark.
PERFORMANCE: FACT AND FICTION
For most investors, performance characteristics of equity and fixed-incomemarkets and hedge fund strategies, which are based on their investments inequity and fixed-income markets, are easy to understand. As discussed inprevious sections, managed futures or CTAs are a different animal. Managedfutures are designed to have no consistent long or short bias equity or fixed-income exposure. As a result, for many investors it is expected that managedfutures strategies will provide diversification benefits to long-only equity orfixed-income based investment portfolios in any market environment. In thefollowing sections, we provide evidence not only on the stand-alone risksof various CTA investments, but on the interrelationships of various CTAstrategies within the managed future area and between managed future andvarious traditional (e.g., equity and fixed-income market) and alternativeasset classes. We examine these markets over a broad time period, and onshorter time intervals (e.g., annual), as well as their relative performance
Managed Futures 109
in extreme market conditions. The results support the fundamental basisfor CTA investment, that is, as expected, CTAs are shown to have a lowcorrelation with the comparison traditional and alternative investments andprovide potential diversification benefits. Results also show, however, thatcertain investor beliefs about CTAs may be misplaced. Results show thatindividual CTAs may not be unusually risky and often have levels of risksimilar to individual equities and that portfolios of CTAs often have levelsof risk similar to portfolios of equities (Standard & Poor’s [S&P] 500).5
Results also show that (1) in periods of extreme equity market returns, mostCTA strategies have similar return patterns, that is, marginal positive returnsin down equity markets and positive returns in up equity markets; and (2)investors should not take return and risk performance from extended timeframes as a basis for how various CTA strategies or a CTA composite mayperform over relative shorter time periods (e.g., annual). Finally, despite thepotential differences among investment strategy approaches within CTAs,most CTAs within a particular strategy rise together in up strategy monthsand fall together in down strategy months such that there is a commonalityamong CTA managers that is often overlooked by investors.
RETURN AND RISK CHARACTERISTICS
In this section, we review the relative performance of the CISDM EWCTA Index with a range of traditional stock and bond indices as wellas a number of alternative investment indices (e.g., real estate, privateequity, commodities, and hedge funds) over the period 1994–2011. Inlater sections, we focus on CTA trading performance using composite,strategy- and markets-based indices in various subperiods. Again we wishto remind investors that the performance of any individual investment orinvestment strategy may not reflect current expected performance or theexpected performance in periods that have economic conditions differentfrom those of the period of analysis. For this period, as shown in Exhibit 4.1,the CISDM EW CTA exhibited lower annualized standard deviation, orvolatility (8.7 percent), than that of the S&P 500 (15.7 percent). Thismay be surprising to most investors, who often regard managed futuresas considerably more risky than stocks. Over the period of analysis, theCISDM CTA EW reported higher annualized total return (8.1 percent) thanthat of the S&P 500 (7.7 percent). Moreover, stand-alone historical returnand risk comparison reflect the potential for the benefits of managed futuresas additions to other traditional assets or other alternative asset classes. Forexample, as shown in Exhibit 4.1, for the period analyzed, the CISDM EWCTA has a low correlation (−0.08) with the S&P 500 and a low correlation
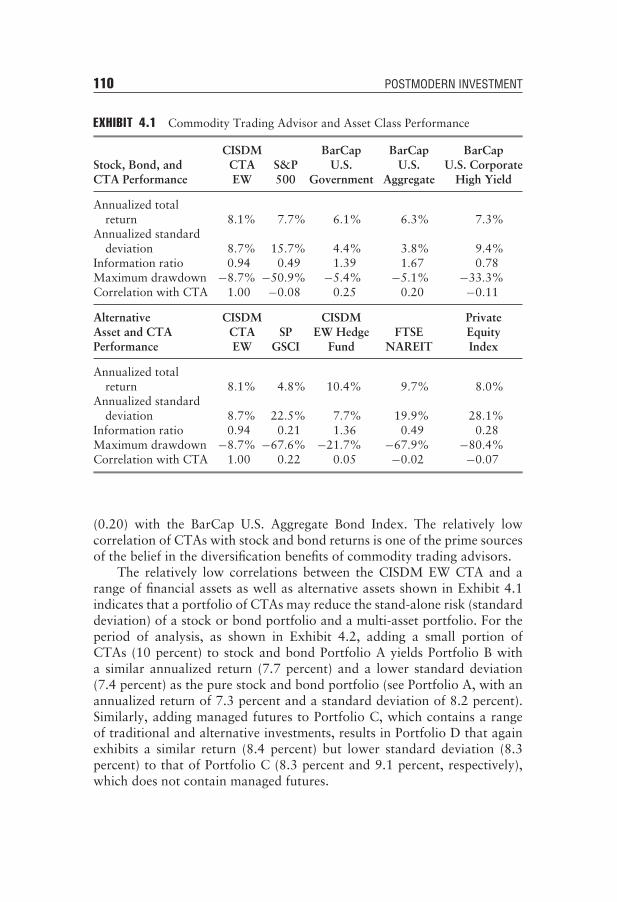
110 POSTMODERN INVESTMENT
EXHIBIT 4.1 Commodity Trading Advisor and Asset Class Performance
Stock, Bond, andCTA Performance
CISDMCTAEW
S&P500
BarCapU.S.
Government
BarCapU.S.
Aggregate
BarCapU.S. Corporate
High Yield
Annualized totalreturn 8.1% 7.7% 6.1% 6.3% 7.3%
Annualized standarddeviation 8.7% 15.7% 4.4% 3.8% 9.4%
Information ratio 0.94 0.49 1.39 1.67 0.78Maximum drawdown −8.7% −50.9% −5.4% −5.1% −33.3%Correlation with CTA 1.00 −0.08 0.25 0.20 −0.11
AlternativeAsset and CTAPerformance
CISDMCTAEW
SPGSCI
CISDMEW Hedge
FundFTSE
NAREIT
PrivateEquityIndex
Annualized totalreturn 8.1% 4.8% 10.4% 9.7% 8.0%
Annualized standarddeviation 8.7% 22.5% 7.7% 19.9% 28.1%
Information ratio 0.94 0.21 1.36 0.49 0.28Maximum drawdown −8.7% −67.6% −21.7% −67.9% −80.4%Correlation with CTA 1.00 0.22 0.05 −0.02 −0.07
(0.20) with the BarCap U.S. Aggregate Bond Index. The relatively lowcorrelation of CTAs with stock and bond returns is one of the prime sourcesof the belief in the diversification benefits of commodity trading advisors.
The relatively low correlations between the CISDM EW CTA and arange of financial assets as well as alternative assets shown in Exhibit 4.1indicates that a portfolio of CTAs may reduce the stand-alone risk (standarddeviation) of a stock or bond portfolio and a multi-asset portfolio. For theperiod of analysis, as shown in Exhibit 4.2, adding a small portion ofCTAs (10 percent) to stock and bond Portfolio A yields Portfolio B witha similar annualized return (7.7 percent) and a lower standard deviation(7.4 percent) as the pure stock and bond portfolio (see Portfolio A, with anannualized return of 7.3 percent and a standard deviation of 8.2 percent).Similarly, adding managed futures to Portfolio C, which contains a rangeof traditional and alternative investments, results in Portfolio D that againexhibits a similar return (8.4 percent) but lower standard deviation (8.3percent) to that of Portfolio C (8.3 percent and 9.1 percent, respectively),which does not contain managed futures.
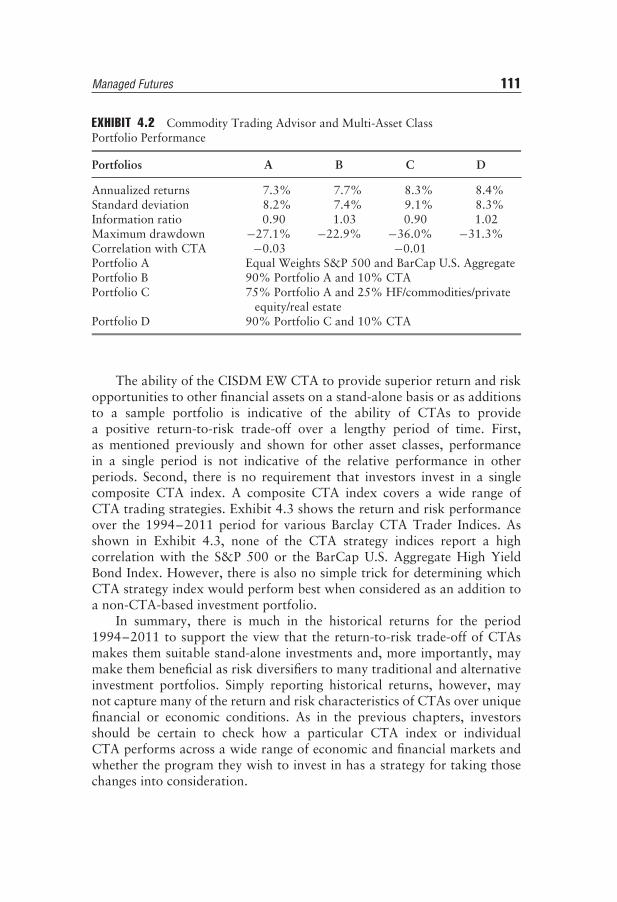
Managed Futures 111
EXHIBIT 4.2 Commodity Trading Advisor and Multi-Asset ClassPortfolio Performance
Portfolios A B C D
Annualized returns 7.3% 7.7% 8.3% 8.4%Standard deviation 8.2% 7.4% 9.1% 8.3%Information ratio 0.90 1.03 0.90 1.02Maximum drawdown −27.1% −22.9% −36.0% −31.3%Correlation with CTA −0.03 −0.01Portfolio A Equal Weights S&P 500 and BarCap U.S. AggregatePortfolio B 90% Portfolio A and 10% CTAPortfolio C 75% Portfolio A and 25% HF/commodities/private
equity/real estatePortfolio D 90% Portfolio C and 10% CTA
The ability of the CISDM EW CTA to provide superior return and riskopportunities to other financial assets on a stand-alone basis or as additionsto a sample portfolio is indicative of the ability of CTAs to providea positive return-to-risk trade-off over a lengthy period of time. First,as mentioned previously and shown for other asset classes, performancein a single period is not indicative of the relative performance in otherperiods. Second, there is no requirement that investors invest in a singlecomposite CTA index. A composite CTA index covers a wide range ofCTA trading strategies. Exhibit 4.3 shows the return and risk performanceover the 1994–2011 period for various Barclay CTA Trader Indices. Asshown in Exhibit 4.3, none of the CTA strategy indices report a highcorrelation with the S&P 500 or the BarCap U.S. Aggregate High YieldBond Index. However, there is also no simple trick for determining whichCTA strategy index would perform best when considered as an addition toa non-CTA-based investment portfolio.
In summary, there is much in the historical returns for the period1994–2011 to support the view that the return-to-risk trade-off of CTAsmakes them suitable stand-alone investments and, more importantly, maymake them beneficial as risk diversifiers to many traditional and alternativeinvestment portfolios. Simply reporting historical returns, however, maynot capture many of the return and risk characteristics of CTAs over uniquefinancial or economic conditions. As in the previous chapters, investorsshould be certain to check how a particular CTA index or individualCTA performs across a wide range of economic and financial markets andwhether the program they wish to invest in has a strategy for taking thosechanges into consideration.
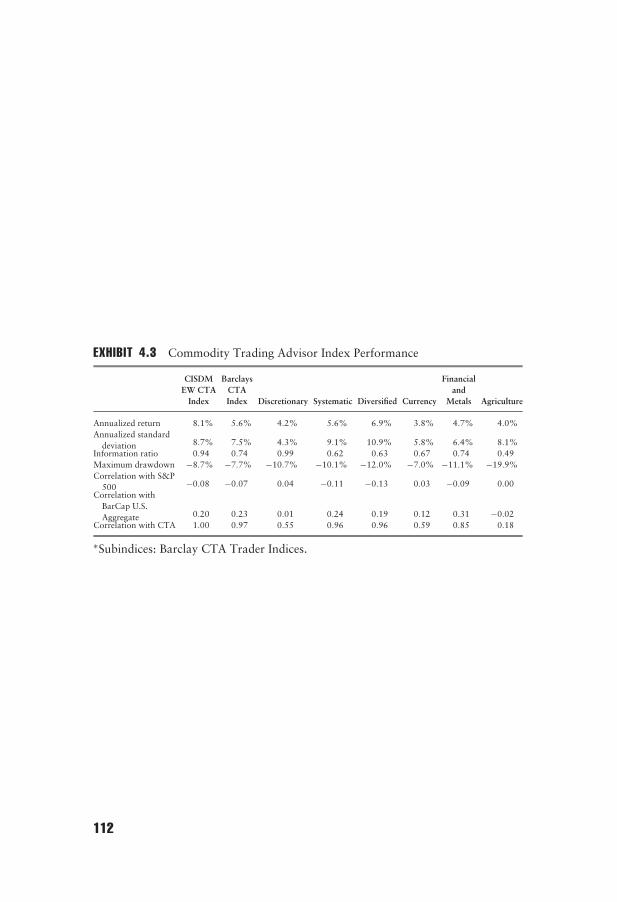
EXHIBIT 4.3 Commodity Trading Advisor Index Performance
CISDMEW CTA
Index
BarclaysCTAIndex Discretionary Systematic Diversified Currency
Financialand
Metals Agriculture
Annualized return 8.1% 5.6% 4.2% 5.6% 6.9% 3.8% 4.7% 4.0%Annualized standard
deviation 8.7% 7.5% 4.3% 9.1% 10.9% 5.8% 6.4% 8.1%Information ratio 0.94 0.74 0.99 0.62 0.63 0.67 0.74 0.49Maximum drawdown −8.7% −7.7% −10.7% −10.1% −12.0% −7.0% −11.1% −19.9%Correlation with S&P
500 −0.08 −0.07 0.04 −0.11 −0.13 0.03 −0.09 0.00Correlation with
BarCap U.S.Aggregate 0.20 0.23 0.01 0.24 0.19 0.12 0.31 −0.02
Correlation with CTA 1.00 0.97 0.55 0.96 0.96 0.59 0.85 0.18
∗Subindices: Barclay CTA Trader Indices.
112
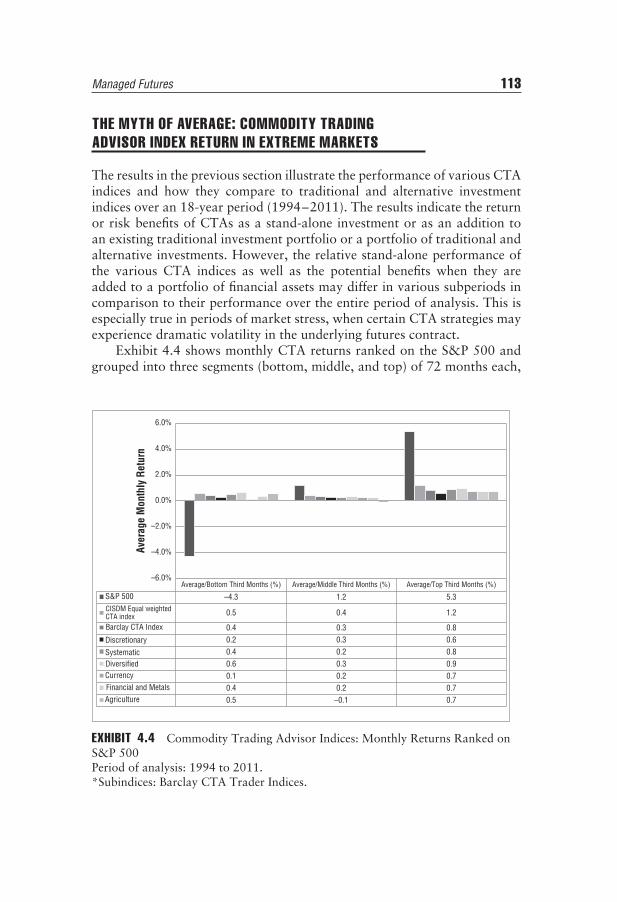
Managed Futures 113
THE MYTH OF AVERAGE: COMMODITY TRADINGADVISOR INDEX RETURN IN EXTREME MARKETS
The results in the previous section illustrate the performance of various CTAindices and how they compare to traditional and alternative investmentindices over an 18-year period (1994–2011). The results indicate the returnor risk benefits of CTAs as a stand-alone investment or as an addition toan existing traditional investment portfolio or a portfolio of traditional andalternative investments. However, the relative stand-alone performance ofthe various CTA indices as well as the potential benefits when they areadded to a portfolio of financial assets may differ in various subperiods incomparison to their performance over the entire period of analysis. This isespecially true in periods of market stress, when certain CTA strategies mayexperience dramatic volatility in the underlying futures contract.
Exhibit 4.4 shows monthly CTA returns ranked on the S&P 500 andgrouped into three segments (bottom, middle, and top) of 72 months each,
Average/Middle Third Months (%)Average/Bottom Third Months (%) Average/Top Third Months (%)
S&P 500 –4.3 1.2 5.3CISDM Equal weighted CTA index 0.5 0.4 1.2
Barclay CTA Index
Discretionary
SystematicDiversified
0.4 0.3 0.80.2 0.3 0.60.4 0.2 0.80.6 0.3 0.9
Currency 0.1 0.2 0.7Financial and Metals 0.4 0.2 0.7Agriculture 0.5 –0.1 0.7
–6.0%
–4.0%
–2.0%
0.0%
2.0%
4.0%
6.0%
Aver
age
Mon
thly
Ret
urn
EXHIBIT 4.4 Commodity Trading Advisor Indices: Monthly Returns Ranked onS&P 500Period of analysis: 1994 to 2011.*Subindices: Barclay CTA Trader Indices.

114 POSTMODERN INVESTMENT
with average returns for each CTA index presented. Results show that theCTA indices had positive returns on average in the worst S&P 500 marketsand positive returns (although less than the S&P 500) in the best S&P500 return months. The positive performance in up equity markets maybe partially caused by the positive economic conditions driving both stockmarket prices and financial securities in which CTAs trade. The positiveperformance in down S&P 500 markets may be caused by a flight to safetyfor some financial assets (e.g., currency and interest rates), which mightbe beneficial to trend-following or discretionary CTAs. Notably, the resultsdiffer somewhat for fixed income. Exhibit 4.5 shows monthly CTA returnsranked on the BarCap U.S. Aggregate and grouped into three segments(bottom, middle, and top) of 72 months each, with average returns foreach CTA index presented. Results show that the CTA indices had bothpositive (e.g., discretionary) as well as negative (systematic) returns in theworst BarCap U.S. Aggregate return months and provided positive returns(although less than the BarCap U.S. Aggregate bond index) in the bestBarCap U.S. Aggregate return months. The positive performance in upmarkets may be somewhat due to the positive economic conditions drivingboth interest rate futures and other financial securities in which CTAs trade.Some academic research6 has suggested that CTAs often trade in long-term
Average/Middle Third Months (%)Average/Bottom Third Months (%) Average/Top Third Months (%)
BarCap U.S. aggregate –0.7 0.6 1.6CISDM Equal weighted CTA index 0.1 0.6 1.3
Barclay CTA index –0.1 0.4 1.10.4 0.3 0.4
–0.2 0.4 1.3–0.1 0.5 1.4
Currency 0.0 0.6 0.3Financial and metals –0.2 0.4 1.1Agriculture
DiversifiedSystematicDiscretionary
0.4 0.2 0.5
–1.0%
–0.5%
0.0%
0.5%
1.0%
1.5%
2.0%
Aver
age
Mon
thly
Ret
urn
EXHIBIT 4.5 Commodity Trading Advisor Indices: Monthly Returns Ranked onBarCap U.S. Aggregate*Subindices: Barclay CTA Trader Indices.Period of analysis: 1994 to 2011.
Managed Futures 115
U.S. Treasury bond futures contracts and that a large part of their perfor-mance often occurs in periods of high government bond yields or in periodsin which yields drop from those high yields. These are the same periods(declining bond yields) that fixed income securities outperform. Its mixedperformance in down BarCap U.S. Aggregate markets may be due simplyto its ability to take short positions in markets with increases in interestrates (note the positive return to CTA discretionary traders in contrast toCTA trend followers in the worst return BarCap U.S. Aggregate month).
COMMODITY TRADING ADVISOR ANNUALPERFORMANCE
In the previous section, the average performance of the CTA commodityindex and subindices and their ranking compared to the best and worstperforming equity and fixed-income environments was discussed. The rep-resentative CTA index (i.e., CISDM EW CTA), as well as many of therelated CTA subindices, were shown to provide potential diversificationbenefits in the worst months and positive returns in the best months of eachindex. In this section, we provide a review of the relative performance byyear of the CISDM EW CTA, Barclay CTA EW CTA and CTA strategyindices, the S&P 500, and the BarCap U.S. Aggregate. Results in Exhibit 4.6show that over the entire period, the annual returns of these indices var-ied during many years. However, in 13 of the 18 years, the CISDM EWCTA and the S&P 500 moved in the same direction, and in 15 of the 18years, the CTA EW CTA and the BarCap U.S. Aggregate moved in thesame direction.
Exhibits 4.7, 4.8, and 4.9 show the standard deviations and correlationsof the CISDM EW CTA and Barclay CTA EW CTA and Barclay CTAstrategy indices against those of the S&P 500 and the BarCap U.S. Aggregate.Results in Exhibit 4.7 show that, for the most part, the standard deviationof the various CTA indices has remained consistently below that of the S&P500 and consistently above that of the BarCap U.S. Aggregate. Exhibits 4.8and 4.9 show that the intra-year correlation between CISDM EW CTA,Barclay CTA EW CTA and Barclay CTA strategy indices, the S&P 500, andthe BarCap U.S. Aggregate varies considerably over the years of analysis.In short, investors should be aware that results from longer time framesmay not reflect results for individual years. We are surprised when wehear marketing presentations that emphasize the inherent high risk ofCTAs. For most periods of analysis, a portfolio of CTAs generally hadlower stand-alone risk as well as low correlation to traditional stock andbond markets.
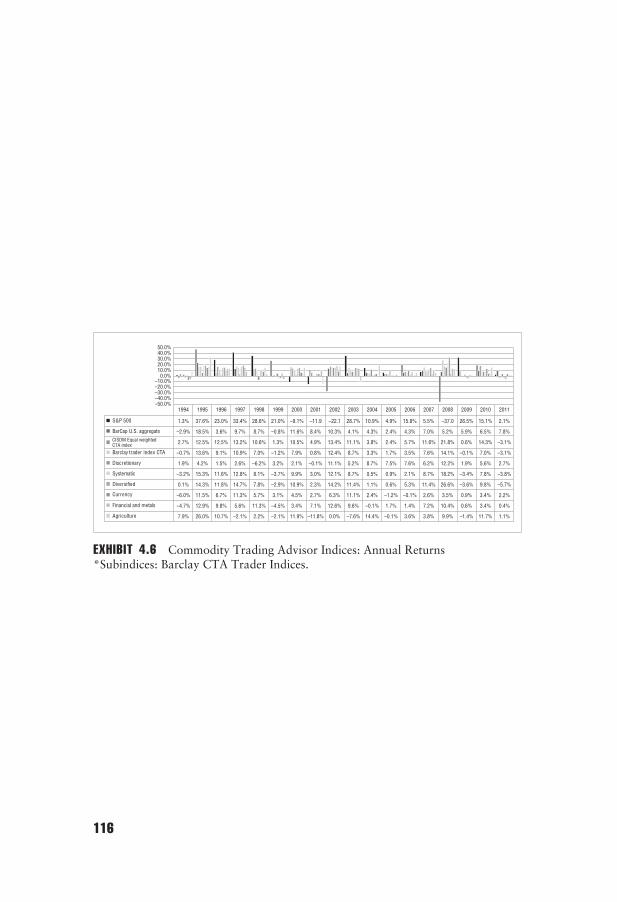
1994 1995 1996 1997 1998 1999 2000 2001 2002 2003 2004 2005 2006 2007 2008 2009 2010 2011
S&P 500 1.3% 37.6% 23.0% 33.4% 28.6% 21.0% –9.1% –11.9 –22.1 28.7% 10.9% 4.9% 15.8% 5.5% –37.0 26.5% 15.1% 2.1%
BarCap U.S. aggregate 18.5% 3.6% 9.7% 8.7% –0.8% 11.6% 8.4% 10.3% 4.1% 4.3% 2.4% 4.3% 7.0% 5.2% 5.9% 6.5% 7.8%CISDM Equal weighted CTA index 12.5% 12.5% 13.2% 10.6% 1.3% 10.5% 4.9% 13.4% 11.1% 3.8% 2.4% 5.7% 11.6% 21.8% 0.6% 14.3% –3.1%
Barclay trader index CTA
Discretionary
Systematic
–0.7% 13.6% 9.1% 10.9% 7.0% –1.2% 7.9% 0.8% 12.4% 8.7% 3.3% 1.7% 3.5% 7.6% 14.1% –0.1% 7.0% –3.1%
1.9% 4.2% 1.5% 2.6% –6.2% 3.2% 2.1% –0.1% 11.1% 5.2% 8.7% 7.5% 7.6% 6.2% 12.2% 1.9% 5.6% 2.7%
–3.2% 15.3% 11.6% 12.8% 8.1% –3.7% 9.9% 3.0% 12.1% 8.7% 0.5% 0.9% 2.1% 8.7% 18.2% –3.4% 7.8% –3.8%
Diversified
Currency
0.1% 14.3% 11.8% 14.7% 7.8% –2.9% 10.9% 2.3% 14.2% 11.4% 1.1% 0.6% 5.3% 11.4% 26.6% –3.6% 9.8% –5.7%
–6.0% 11.5% 6.7% 11.3% 5.7% 3.1% 4.5% 2.7% 6.3% 11.1% 2.4% –1.2% –0.1% 2.6% 3.5% 0.9% 3.4% 2.2%
Financial and metals –4.7% 12.9% 9.8% 5.6% 11.3% –4.5% 3.4% 7.1% 12.6% 9.6% –0.1% 1.7% 1.4% 7.2% 10.4% 0.6% 3.4% 0.4%
Agriculture 7.9% 26.0% 10.7% –2.1% 2.2% –2.1% 11.9% –11.8% 0.0% –7.6% 14.4% –0.1% 3.6% 3.8% 9.9% –1.4% 11.7% 1.1%
–50.0%–40.0%–30.0%–20.0%–10.0%
0.0%10.0%20.0%30.0%40.0%50.0%
–2.9%
2.7%
EXHIBIT 4.6 Commodity Trading Advisor Indices: Annual Returns*Subindices: Barclay CTA Trader Indices.
116
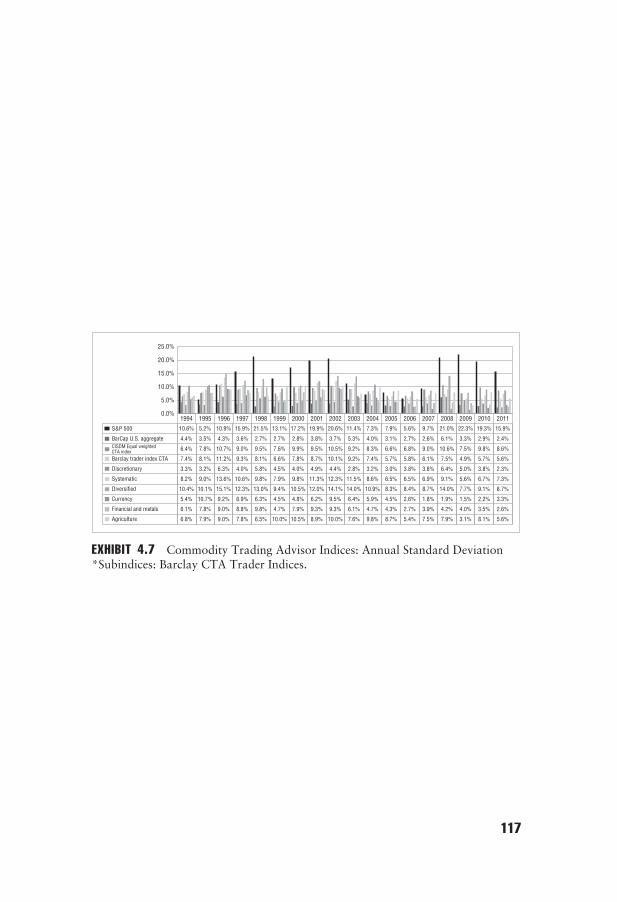
1994 1995 1996 1997 1998 1999 2000 2001 2002 2003 2004 2005 2006 2007 2008 2009 2010 2011
S&P 500 10.6% 5.2% 10.9% 15.9% 21.5% 13.1% 17.2% 19.9% 20.6% 11.4% 7.3% 7.9% 5.6% 9.7% 21.0% 22.3% 19.3% 15.9%
BarCap U.S. aggregate 4.4% 3.5% 4.3% 3.6% 2.7% 2.7% 2.8% 3.8% 3.7% 5.3% 4.0% 3.1% 2.7% 2.6% 6.1% 3.3% 2.9% 2.4%CISDM Equal weighted CTA index 6.4% 7.8% 10.7% 9.0% 9.5% 7.6% 9.9% 9.5% 10.5% 9.2% 8.3% 6.6% 6.8% 9.0% 10.6% 7.5% 9.8% 8.6%
Barclay trader index CTA 7.4% 8.1% 11.2% 9.3% 8.1% 6.6% 7.8% 8.7% 10.1% 9.2% 7.4% 5.7% 5.8% 6.1% 7.5% 4.9% 5.7% 5.6%
Discretionary 3.3% 3.2% 6.3% 4.0% 5.8% 4.5% 4.0% 4.9% 4.4% 2.8% 3.2% 3.0% 3.8% 3.8% 6.4% 5.0% 3.8% 2.3%
Systematic 8.2% 9.0% 13.6% 10.6% 9.8% 7.9% 9.8% 11.3% 12.3% 11.5% 8.6% 6.5% 6.5% 6.9% 9.1% 5.6% 6.7% 7.3%
Diversified 10.4% 10.1% 15.1% 12.3% 13.0% 9.4% 10.5% 12.0% 14.1% 14.0% 10.9% 8.3% 8.4% 8.7% 14.0% 7.7% 9.1% 8.7%
Currency 5.4% 10.7% 9.2% 6.9% 6.3% 4.5% 4.8% 6.2% 9.5% 6.4% 5.9% 4.5% 2.6% 1.8% 1.9% 1.5% 2.2% 3.3%
Financial and metals 6.1% 7.8% 9.0% 8.8% 9.8% 4.7% 7.9% 9.3% 9.3% 6.1% 4.7% 4.3% 2.7% 3.9% 4.2% 4.0% 3.5% 2.6%
Agriculture 6.8% 7.9% 9.0% 7.8% 6.5% 10.0% 10.5% 8.9% 10.0% 7.6% 9.8% 8.7% 5.4% 7.5% 7.9% 3.1% 8.1% 5.6%
0.0%
5.0%
10.0%
15.0%
20.0%
25.0%
EXHIBIT 4.7 Commodity Trading Advisor Indices: Annual Standard Deviation*Subindices: Barclay CTA Trader Indices.
117
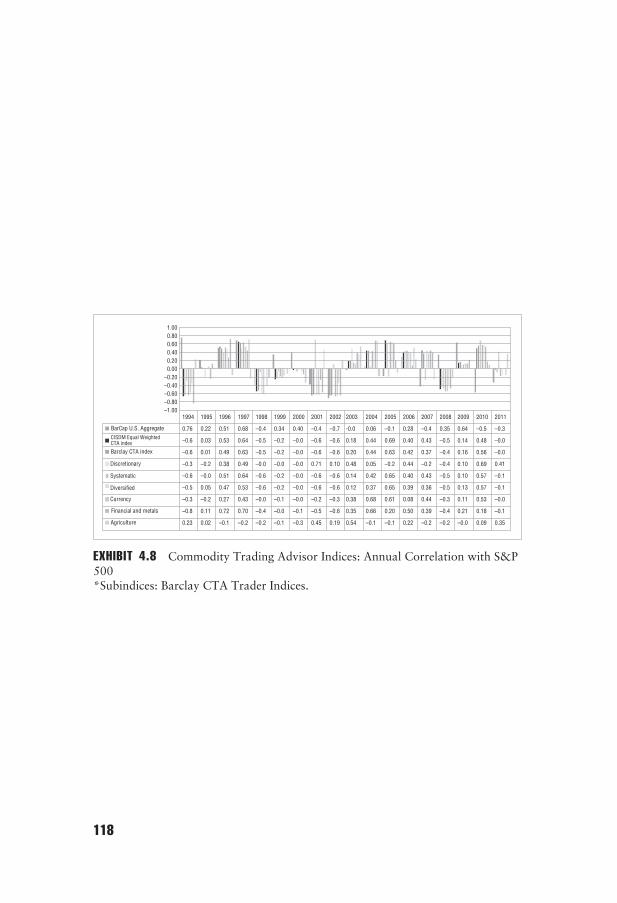
1994
0.76
–0.6
–0.6
–0.3
–0.6
–0.5
–0.3
–0.8
0.23
1995
0.22
0.03
0.01
–0.2
–0.0
0.05
–0.2
0.11
0.02
1996
0.51
0.53
0.49
0.38
0.51
0.47
0.27
0.72
–0.1
1997
0.68
0.64
0.63
0.49
0.64
0.53
0.43
0.70
–0.2
1998
–0.4
–0.5
–0.5
–0.0
–0.6
–0.6
–0.0
–0.4
–0.2
1999
0.34
–0.2
–0.2
–0.0
–0.2
–0.2
–0.1
–0.0
–0.1
2000
0.40
–0.0
–0.0
–0.0
–0.0
–0.0
–0.0
–0.1
–0.3
2001
–0.4
–0.6
–0.6
0.71
–0.6
–0.6
–0.2
–0.5
0.45
2002
–0.7
–0.6
–0.6
0.10
–0.6
–0.6
–0.3
–0.6
0.19
2003
-0.0
0.18
0.20
0.48
0.14
0.12
0.38
0.35
0.54
2004
0.06
0.44
0.44
0.05
0.42
0.37
0.68
0.66
–0.1
2005
–0.1
0.69
0.63
–0.2
0.65
0.65
0.61
0.20
–0.1
2006
0.28
0.40
0.42
0.44
0.40
0.39
0.08
0.50
0.22
2007
–0.4
0.43
0.37
–0.2
0.43
0.36
0.44
0.39
–0.2
2008
0.35
–0.5
–0.4
–0.4
–0.5
–0.5
–0.3
–0.4
–0.2
2009
0.64
0.14
0.16
0.10
0.10
0.13
0.11
0.21
–0.0
2010
–0.5
0.48
0.56
0.69
0.57
0.57
0.53
0.18
0.09
2011
–0.3
–0.0
–0.0
0.41
–0.1
–0.1
–0.0
–0.1
0.35
BarCap U.S. AggregateCISDM Equal Weighted CTA index
Barclay CTA index
Currency
Diversified
Systematic
Discretionary
Financial and metals
Agriculture
–1.00–0.80–0.60–0.40–0.200.000.200.400.600.801.00
EXHIBIT 4.8 Commodity Trading Advisor Indices: Annual Correlation with S&P500*Subindices: Barclay CTA Trader Indices.
118
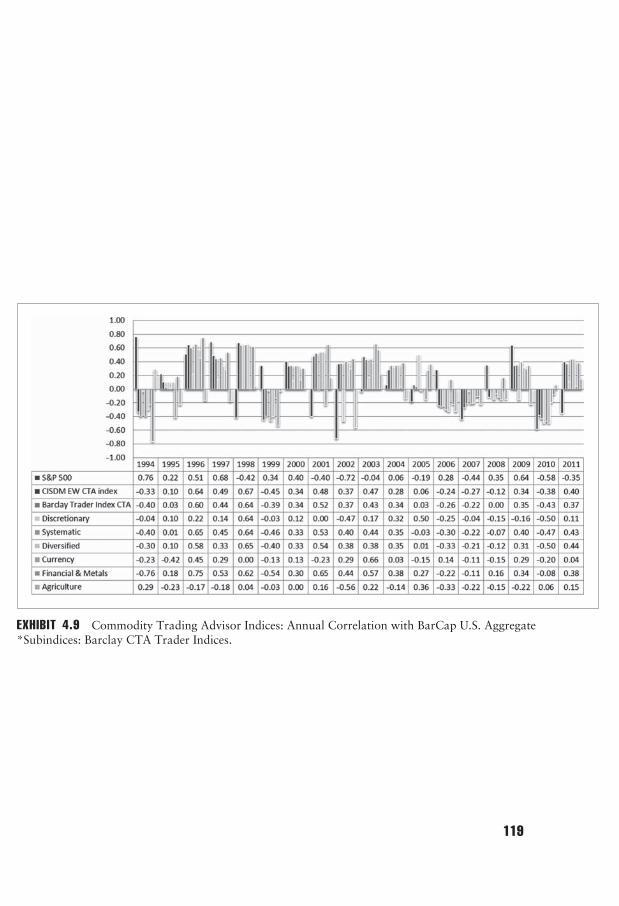
EXHIBIT 4.9 Commodity Trading Advisor Indices: Annual Correlation with BarCap U.S. Aggregate*Subindices: Barclay CTA Trader Indices.
119
120 POSTMODERN INVESTMENT
PERFORMANCE IN 2008
Results in Exhibits 4.6 through 4.9 show the risk and return performanceof CTAs, traditional U.S. stocks and bonds, and asset classes for 2008. In2008, CISDM EW CTA index (21.8 percent) outperformed both the S&P500 (−37.0 percent) and the BarCap U.S. Aggregate (5.2 percent). MostCTA strategies, unlike traditional asset classes, were little affected by thesubprime crisis in 2008, despite the negative equity market performanceand the rise in credit spreads (e.g., decline in high-yield bond returns).
MAKING SENSE OF COMMODITY TRADING ADVISORPERFORMANCE
In this section we provide commentary both on the performance character-istics of individual CTAs and issues surrounding the use of CTA indices orCTA databases in estimating expected CTA fund performance. Academicand practitioner research has shown that trend-following strategy is thedominant strategy among CTAs and CTA indices. While most systematictrend-following CTAs follow momentum strategies that are longer termin nature, it is important to realize that some CTAs may be regarded asshort-term trend followers. This section also discusses CTA performance inmarkets with high volatility and CTA performance in periods of extremeequity performance (positive or negative). CTAs are often described as longvolatility traders (e.g., make money in periods of high market volatility),and they provide a hedge to equity holdings especially in periods of highequity market volatility. While the debate continues, the following sectionsoffer a contrasting view as to CTA performance in periods of extreme equitymarket performance or in periods of extreme market volatility.
Individual Fund Performance
CTA indices reflect the performance of the portfolio of CTAs reportingas that strategy. Results at the individual CTA level may not reflect theresults of the relevant index to the degree that the CTA does not representthe underlying performance of the index (e.g., portfolio) strategy.7 Previousresearch has shown that a portfolio of four to five CTAs is required forthe portfolio to reflect that of the strategy index. Research has also shownthat the relationship between individual funds and the underlying CTAstrategy is impacted by the level of strategy returns. Further, as shownin Exhibit 4.10, results indicate that when CTA systematic returns are attheir historical high or low, the percentage of individual CTAs with similar
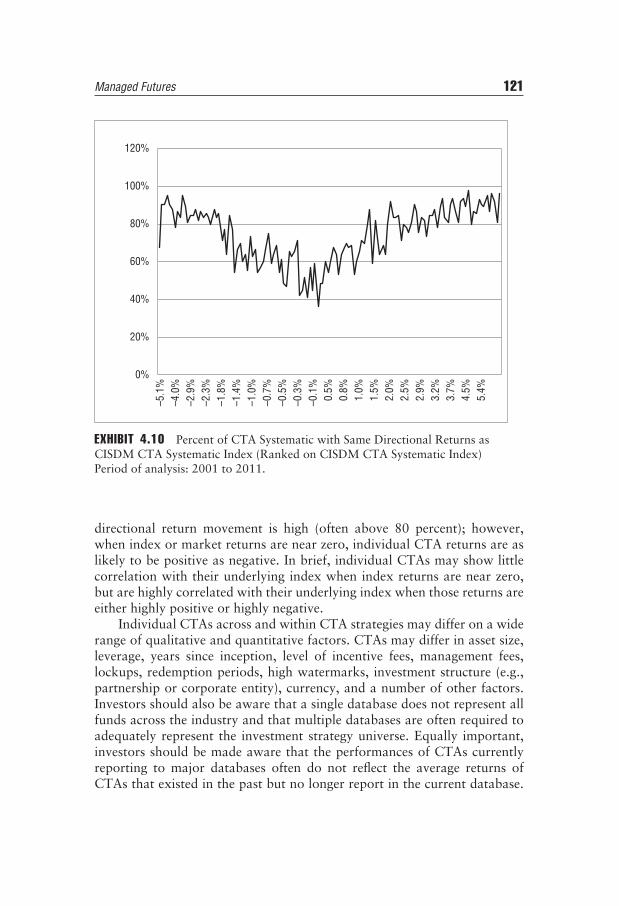
Managed Futures 121
0%
20%
40%
60%
80%
100%
120%–5
.1%
–4.0
%–2
.9%
–2.3
%–1
.8%
–1.4
%–1
.0%
–0.7
%–0
.5%
–0.3
%–0
.1%
0.5%
0.8%
1.0%
1.5%
2.0%
2.5%
2.9%
3.2%
3.7%
4.5%
5.4%
EXHIBIT 4.10 Percent of CTA Systematic with Same Directional Returns asCISDM CTA Systematic Index (Ranked on CISDM CTA Systematic Index)Period of analysis: 2001 to 2011.
directional return movement is high (often above 80 percent); however,when index or market returns are near zero, individual CTA returns are aslikely to be positive as negative. In brief, individual CTAs may show littlecorrelation with their underlying index when index returns are near zero,but are highly correlated with their underlying index when those returns areeither highly positive or highly negative.
Individual CTAs across and within CTA strategies may differ on a widerange of qualitative and quantitative factors. CTAs may differ in asset size,leverage, years since inception, level of incentive fees, management fees,lockups, redemption periods, high watermarks, investment structure (e.g.,partnership or corporate entity), currency, and a number of other factors.Investors should also be aware that a single database does not represent allfunds across the industry and that multiple databases are often required toadequately represent the investment strategy universe. Equally important,investors should be made aware that the performances of CTAs currentlyreporting to major databases often do not reflect the average returns ofCTAs that existed in the past but no longer report in the current database.
122 POSTMODERN INVESTMENT
The often higher historical returns to CTAs listed in the current databaseare often a result of one or more biases in database construction. One ofthese is backfill bias, also called incubation bias, which occurs when thehistorical returns of new CTAs reporting to the database are included in thedatabase. Since, in most cases, only CTAs with superior historical returnsreport to databases, the returns prior to the database entry date may bebiased upward relative to the returns of those CTAs who do not report, orwho have been reporting for several years. Survivorship bias occurs whenCTAs who once existed in the database are removed from the databasewhen they stop reporting. Often these CTAs stop reporting because of poorreturns. The often lower returns of these CTAs are not contained in the liveportion of most databases. Therefore, investors must ask for the dead CTAdatabases in order to measure the actual returns to investment in CTAs thatmay have existed in the past.
Other biases may also exist in any single database, such as selectionbias (i.e., databases differ on their requirements for reporting) and reportingbias (i.e., managers may be in one strategy but report as if they were inanother). The extent of these biases may differ by strategy, time period,and database. Investors must use proper due diligence in understanding theactual performance characteristics of a CTA before considering investmentin it. For example, research has shown that if the first year of perfor-mance is removed from a CTA reporting to a database, the impact ofbackfill bias is mitigated dramatically. An investor should also rememberthat most CTA indices do not contain survivorship bias or backfill bias, asall managers reporting to the database at the time of the original returncalculation are used. Historical index returns are not changed when thesemanagers are removed from the database and, therefore, do not reflectsurvivorship bias. Similarly, as new managers are added to the database,historical index returns are not changed to reflect those new managers andcorresponding historical index returns. Hence, no backfill bias is containedin the indices.8 Various CTA indices may still differ because of differ-ences in reporting managers or construction (e.g., median return or assetweight), but these differences are similar to those existing in traditionalasset indices.
Trading Time Frame
In previous sections, we discussed CTA performance in terms of the mar-kets (i.e., currency, financial, diversified) they trade on and the strategies(i.e., systematic and discretionary) they employ. In addition, CTAs oftenconcentrate on different time frames regarding their trading process, thatis, choosing short-term, midterm, or long-term historical data. Note there
Managed Futures 123
are no definitive definitions of these trading time frames. In general, forsystematic trend followers, short term often emphasizes historical periodsof less than a week; whereas for long-term trend followers, the period isoften longer than 30 days. In this section, we review the relative perfor-mance of short-term and long-term discretionary and systematic CTAs. Forboth discretionary and systematic CTAs, those that emphasize shorter-termmodels report a lower standard deviation and a lower correlation with theunderlying CTA index. This is not surprising. Given the higher volatilityof longer-term time-frame traders, their volatility would be expected todominate any EW index.
Market Volatility and Commodity TradingAdvisor Performance
A common belief among traders and many CTA managers is that CTAsare long volatility—that is, they have the opportunity of making profits inmarkets in which return volatility is high. The basis for this belief is thatin stock and bond markets, increases in standard deviation (volatility) areoften consistent with decreases in return. At the same time, to the degreethat CTAs are not strictly long or short markets, CTAs have shown theability to have positive returns in down stock and bond markets—marketsin which volatility is often high.
Although CTAs can profit in volatile markets, it is incorrect to saythat they are long volatility.9 In fact, increases in volatility often result inCTAs losing money, as the markets may find themselves in a tight tradingrange (prices rise and then fall, fall and then rise). Except for a few CTAswho might follow a contrarian methodology, most CTAs are systematicmidterm to long-term trend followers—that is, they make money whenprices trend slowly up or slowly down. That happens not in high volatilitymarkets but in markets that (at least over the measured investment period)are relatively smooth.
Commodity Trading Advisors as a Hedgefor Equity Investors
Academics and practitioners often refer to CTAs as a natural hedge for equityinvestors. One must be careful in using the term hedge when referring to theuse of CTA investment as a means to diversify an equity biased portfolio.Many CTAs do not trade equity futures. One reason for this is that mostresearch has shown that equities follow what is known as a random walk;that is, they do not follow a discernible trend. Certainly, CTAs can makemoney in periods in which the S&P 500 or other equity indices perform

124 POSTMODERN INVESTMENT
poorly, but that is not a hedge (a short or long position whose profits orlosses are directly linked to the performance of the comparable asset). Atbest, CTAs who trade particular futures markets may be seen as investmentprograms that benefit from market conditions (e.g., falling interest rates),which may be consistent with a government program attempting to provideliquidity to a market following an equity market drop; that is, a particularCTA may trade a program in a fashion that is more likely to make moneyin economic markets that are consistent with equity declines, but that is along way from calling a CTA a hedge against stock market declines.
MAKING SENSE OUT OF ALTERNATIVE APPROACHESTO INVESTING IN COMMODITY TRADING ADVISORS
Similar to hedge fund investment, investors have a range of choices forinvesting in CTAs, including direct investment in active manager-basedindividual CTA funds, individual CTA pool vehicles (e.g., fund of funds)or investable active CTA manager-based indices as well as hybrid mutualfund. In recent years, various algorithmic-based CTA trackers have beendeveloped that attempt to provide return performance similar to that of anassociated CTA benchmark. These CTA tracker approaches to capturingthe fundamental returns of various CTA strategies are available both in ETFand mutual fund forms.
Commodity Trading Advisor Individual Fundand Pool Investment
CTA individual funds and CTA pools (similar to multi-CTA funds of funds)provide a direct means to access CTA performance. One of the investmentconcerns in CTA multi-CTA pools (e.g., funds of funds) is the extra layer offees that the fund-of-fund manager requires for overseeing the constructionof the fund of funds. Research shows that a portfolios of a CTA fund offunds (e.g., Eurekahedge Fund of Funds Index) underperforms a comparisonEW CTA index (e.g., Eurekahedge Managed Futures Index) by almost 4percent over the period 2001–2011 while showing similar correlationto a range of market factors (S&P 500, BarCap U.S. Government, U.S.Aggregate, and U.S. Corporate High Yield indices).10 Investors should note,however, that results based on fund-of-funds indices include a wide rangeof CTA strategies such that the performance may not strictly reflect thestrategy weights assumed in the EW composite CTA indices. Research alsoindicated that the standard deviation around a sample of trend-followingCTA funds indicates that an investor in an individual CTA fund may not
Managed Futures 125
reflect the performance of a diversified fund of similar strategy CTAs. Inshort, investors should be aware that investing in a single CTA does notnecessarily reflect the performance of a portfolio of similar CTAs.11
COMMODITY TRADING ADVISOR INVESTABLE INDICES
The growth in CTA investment has encouraged a number of firms to offeractive manager-based investable CTA index products. This group includesglobal investment banks such as Credit Suisse First Boston (CSFB). Eachof these CTA indices differs in unique ways. As a result, seemingly similaractive manager-based investable CTA indices may have different returnand risk performance over common time frames. However, studies showthat despite differences in risk and return, the various investable and non-investible CTA indices generally report similar correlations to one another,as well as to major market factors, such as stock and bond indices.12
Passive Trackers
In addition, various futures-based passive CTA indices have been suggestedas possible surrogates for active CTA investment. We recently examinedthe performance of various active manager-based CTA indices and pas-sive futures-based CTA indices over the period 2004–2011. The resultsreflect that a managed futures securities-based passive index outperformedboth the CSFB (which is an investable index of active managers) andthe Mt. Lucas Management (MLM) Index (which is a passive index).In addition, high correlations (often above 0.50) were reported betweenthe active manager-based CISDM CTA and the corresponding passivesecurity-based index.13
Mutual Fund and Exchange-Traded Fund Products
In addition, CTA-based mutual fund products have been suggested aspossible surrogates for active CTA investment. These mutual fund CTA-based products exist primarily in fund-of-fund form. Results of a recentanalysis indicate that these mutual fund-based products have similar returnand risk characteristics to the CISDM EW CTA index; however, for thesefunds, differences also exist such that investors should review the form andstrategy emphasis of each mutual fund product. It is important to notethat in recent months, an ETF-based CTA product has been created andis available. The CTA ETF is structured to follow a relatively simplistictrend-following approach. At this time, the historical time period does not
126 POSTMODERN INVESTMENT
permit a full analysis of the product. However, the existence of the ETFproduct is indicative of the continued interest in managed futures-basedtrading strategies.14
A PERSONAL VIEW: ISSUES IN MANAGEDFUTURES INVESTMENT
The purpose of this section is to provide some insight into two areas of CTAinvestment that have recently been of interest to the investment community.They are the costs and benefits of CTA pool or fund-of-funds investmentand the unique distributional characteristics of CTAs, such that CTAs maybe viewed less as a long volatility investment than an investment whoseperformance is based on short-term or long-term momentum patterns invarious U.S. and global financial and commodity markets. There are otherissues in CTA analysis, including the degree to which other asset classes’passive investable index-based tracker products can be created.
■ CTA Pool (Fund-of-Funds) Analysis: Academic research has oftenaddressed the benefits of CTAs and the effect of an additional layer offees on product performance, but little direct research has focused onpools of CTAs and the impact of an additional layer of performance. Asfor hedge funds, CTA pool research has failed to consider the uniquestrategy emphasis of individual funds of funds (i.e., funds of funds mustbe classified according to their underlying investor objective). What’smore, when a fund of funds is created, given the lockup, due diligence,and other costs, as well as the market sales environment, a fund of funds(pool) is often created with an emphasis on those CTAs that have thehighest potential for relatively high returns. Thus, the performance ofCTA pools may represent investment in a unique set of CTAs, that is,CTAs who trade in financial and commodity futures contracts with thegreatest potential volatility and expected return as well as those CTAswho are willing to take a higher degree of investment risk. Investorsshould not necessarily reject CTA pools as an investment form, butthe underlying characteristics of the CTA pool (the managers and theirhistorical return and risk patterns) should be thoroughly analyzed.
■ Distributional Characteristics: The primary reason for managed futuresand CTA investment is the degree to which an individual strategyprovides unique risk and return characteristics not easily available inother investment vehicles. The very fact that CTAs trade in a dynamicfashion makes the historical distribution characteristics a prisoner of theanalysis period. Several academic studies have analyzed the sensitivity of
Managed Futures 127
various CTA strategies to both traditional market factors and systematicmomentum or lookback straddles that are expected to capture the returnpatterns of active systematic CTAs.15 This research has shown that incontrast to the view that the underlying return and risk characteristicsof CTAs are not capable of replication, for systematic trend followers,simple algorithmic trend-following models may capture a significantportion of the return process.
WHAT EVERY INVESTOR SHOULD KNOW
As discussed in this chapter, managed futures are also known as CTAs. Sincefew investors feel comfortable trading in cash or spot markets, imagine howfew are willing to invest in something called a futures or forward market,or even worse, something called a derivative market. If hedge funds areregarded as the bad boy on the block, managed futures are not even onthe block but over near the railroad tracks. In this chapter we attempted tomake it permissible to invite them over to dinner. As for most alternativeinvestments, we showed that managed futures have a misunderstood pastas well as a misunderstood present. This too is surprising, since forwardmarkets have existed since the dawn of modern humanity (about 2500BC), and futures markets have been around for more than 150 years. Still,despite their long history, there are still a few things that every investorshould know.
■ Managed Futures Are Derivatives, but: Futures markets (and prices) arewell understood. Most futures market prices are merely derivatives ofcash market prices. But for many futures contracts (e.g., stocks, bonds),the price of a futures contract is not the expected price of the cash. Forequity and fixed income, if the cash market price moves, the futuresprice moves. So you can think of managed futures traders as simplycash market traders who can use futures as an easier way to go longand short the cash deliverable. Though it may seem sexy to try to makethem sound like exotic gamblers (and since futures can trade with lessadvance money, they can have greater risk), investors should rememberthat managed futures traders are like other equity and fixed-incometraders, but they often live in Chicago.
■ Zero-sum Games Do Not Mean Zero Profits: There are many markets(poker, for one) that, in the short run, are zero-sum games in whichsome players leave with more money and some leave with less. Thereare other markets that are zero-sum games for the most part, in whichsome leave with a little more money (e.g., insurance companies) and
128 POSTMODERN INVESTMENT
others (e.g., home owners who pay insurance) leave with a little less.Investors should know which game their CTAs are playing. If it ispoker, they had better be very good. If they are insurance players, littlemoney may be made in the long run. Note: There are many CTAstrading different strategies just as there are different types of poker andinsurance programs. Know which game and in which market your CTAis trading. If your CTA cannot tell you which one he or she is in andwhy he or she makes money—go elsewhere.
■ CTAs Are Not Necessarily High Risk: Many investors view CTAs ashigh-risk gamblers. Although CTAs have historically been regarded ashigh-risk investment products, data shows that at the individual CTAlevel, standard deviation is similar to that of individual stocks in the S&P500, and that the standard deviation of a portfolio of CTAs is similar tothat of various fixed-income corporate bond indices. However, ‘most’CTAs does not mean ‘all.’ Investors should assure themselves that ifthey invest in a CTA, the CTA has a well-defined risk target (e.g., similarto the current S&P 500). Have your CTA give you a current updateon his or her current historic volatility and how he or she monitors hisor her positions to ensure that risk is monitored. If he or she says heor she cannot—he or she is either lazy or deceitful. In any event, gosomewhere else.
MYTHS AND MISCONCEPTIONS OF MANAGED FUTURES
Even more so than hedge funds, managed futures investment is an areacomplete with myths and misconceptions. First, the trades are conductedin the mysterious area of derivatives outside of the normal investor’s zoneof comfort. Much of the trading is conducted by what many individualssee as gamblers or speculators for which no consistent form of tradingis evident. Second, while managed futures or CTAs have existed as awell-known trading strategy for decades, it was primarily marketed to high-net-worth individuals and only recently has it become available to the moregeneral retail public. Unfortunately, the myth and misconceptions on its usedeveloped over the years are still with us.
Myth 4.1: Managed Futures Provide a Hedge for EquityReturns Especially in Down Markets
A common graph or chart seen in many CTA marketing documents showsthat many CTA programs have offered positive returns in just those monthswhen equity markets have had their poorest performance. While this may
Managed Futures 129
be empirically true, it is hard to say that managed futures can be viewedas a natural hedge. Many CTAs are momentum traders, and research hasshown that equity markets often follow a random walk, such that manyCTAs do not even trade equity futures. If CTAs have positive returns indown equity markets, it is more due to the fact that in periods of marketstress the government may try to lower rates, and CTAs who may be longinterest rate futures will profit in just that market environment.
Myth 4.2: Managed Futures Are Long Volatility
Historically, managed futures have often been described as being longvolatility in that, as discussed above, they often seem to make moneywhen equity market volatility is high (equity markets often fall when equityvolatility rises). Calling managed futures ‘‘long volatility’’ is a poor choiceof words. In fact, since most CTAs are trend followers, they profit primarilyin market conditions in which prices move slowly up and slowly down, andthey lose money in markets where futures contract prices are trendless andmove up and down within a relatively small range.
Myth 4.3: Managed Futures Are AbsoluteReturn Vehicles
Even more than hedge funds, managed futures have often been described asabsolute return vehicles because of their low equity betas as well as the lackof a regulatory requirement to track a particular passive index. However,again even more so than hedge funds, many managed futures programsfollow similar algorithmic-based systematic trading strategies, such thatmost managed-futures managers within a particular strategy often havesimilar exposure to fundamental market pricing patterns (e.g., momentumand short-term price reversal) and trading opportunities (e.g., liquidity risks).Thus most managed futures programs generally make money in similarmarket environments and lose money in similar market environments (e.g.,markets within a trading range, low interest rate markets for which certainmanaged futures strategies have little positive carry interest on margin). Asa result, managed futures returns, while caused partly by manager skill,are also based on a set of common trading approaches that make and losemoney in common market environments and should not be regarded asabsolute return vehicles.
Myth 4.4: Managed Futures Are Riskier Than StockInvestments
Many investors view CTAs as inherently more risky than more traditionalequity investments, if for no other reason than that CTAs trade in exchange
130 POSTMODERN INVESTMENT
and off exchange derivatives markets and can easily increase risk. Asdiscussed previously, while few investors would question if stocks areriskier than bonds (although in certain market environments such as highinterest rate volatility, some bonds are expected to be riskier than somestocks), the question remains if investment in CTAs is by nature riskier thaninvestment in stocks. While CTAs have often been regarded as a high-riskinvestment, research results show that the standard deviation of a singleCTA is, on average, similar to that of a single S&P 500-listed security. Inaddition, as shown in this book, many portfolios of CTAs have volatilityeven lower than that reported for the S&P 500. As discussed for hedge funds,CTAs have the ability to increase their market exposure quickly becauseof the low required level of margin; however, most CTAs monitor marketssuch that they lower their exposure in risky market environments andincrease it in low-risk environments. Thus many CTAs target their funds toa particular level of volatility. CTAs may have high levels of risk, but it is notinherent to the strategy. Similarly, while the recent MF Global and PeregrineFinancial Group Best bankruptcies have highlighted operational risks, suchrisks are business model risks inherent in delivering any investment productto the market.
Myth 4.5: Managed Futures Require Their Own UniqueMeasures of Performance
Managed futures are often cited as requiring a unique set of performancemeasures that capture their ability to go long or short, as well as other specificmanaged futures attributes (e.g., low market factor sensitivity). Whilecertain managed futures strategies (e.g., option based) that directly act tomodify the return distribution or that focus on a set of additional measuresof risk concerns (e.g., liquidity) may require forms of option-adjustedperformance measures, most CTA specific recommended risk measures(e.g., semideviation, drawdown) provide little in additional informationand rank funds similar to other traditional measures of risk (e.g., standarddeviation). If an investment strategy is structured to have unique returnand risk characteristics, those characteristics must be considered, but forCTAs, the expected probability distribution remains similar to that oftraditional assets, and the traditional forms of performance measurementremain adequate.
Myth 4.6: Managed Futures Strategies Cannot BeReplicated?
Each managed futures manager is unique in its own way; however, asdiscussed above, many managed futures traders follow algorithmic-based

Managed Futures 131
systematic trading models often based on similar market patterns (e.g.,momentum). As a result, there exists a number of style pure, investablemanaged futures strategy benchmarks, which track individual managedfutures strategies or non-investable CTA-based benchmarks. Note thatthese replication products are often not designed to capture the risk factor ormarket sector exposures of their associated benchmark, but attempt to repli-cate the underlying exposure to certain pricing patterns (e.g., momentum,breakout patterns).

CHAPTER 5Commodities
An Ever-Changing Balance
In the mid-1990s, we were asked by American International Group (AIG) tobe part of a new advisory board that was to be involved in the creation of a
new commodity index product, the AIG Commodity Index. Although com-modities have been a central part of the economic landscape since the dawnof civilization (i.e., early examples exist in 3000 BC of forward contractsfor the exchange of commodities for other basic goods), commodities cameinto existence as tradable assets with the introduction and development ofcommodity futures markets in the mid- to late 1800s. The growth of bothfinancial markets and commodity markets in the twentieth century led tonew ways of investing in commodities (options), including direct investmentin the equity of commodity firms. Direct investments in firms that produceor consume commodities, however, do not offer the same return and riskopportunities of direct investment in commodities. Similarly, investment ina single commodity does not offer the same risk and return opportuni-ties of investment in a basket of commodities. Fortunately, the continuedgrowth of interest in commodities in the last century led to the creation ofa number of commodity indices designed to reflect the performance of anindex of commodity investments.
Commodity indices, which have been in existence since the 1860s (e.g.,The Economist Commodity-Price Index), were popularized in the UnitedStates in the 1930s, when the Commodity Research Bureau (CRB) Indexbegan publication. However it was not until the early 1990s that the firsttruly investor-friendly investable commodity index was introduced: theGoldman Sachs Commodity Index (GSCI). The index was later sold toStandard & Poor’s (S&P) in 2007 and is known today as the S&P GSCI.What separates this index from earlier, relatively illiquid commodity indicesis that it is an index of the performance of liquid futures contracts, with a setof rules for rolling from one commodity futures contract (when it expires)
133
134 POSTMODERN INVESTMENT
to the next. In addition, the weights on each commodity change over time,based on a formula that emphasizes the commodity’s importance in globalproduction (e.g., the volume of the commodity times its price).
The success of the GSCI was due not only to its connection to one of thepremier trading firms in the United States but also to the uniqueness of theeconomic conditions surrounding its introduction. In the early 1990s, thefirst Iraq war had led to a short-term rise in oil prices. The GSCI offered asystematic means of investing in the energy complex. In addition, it offeredhistorical evidence of its risk and return benefit relative to investmentin traditional stock and bond investments. The information in the originalmarketing material showed the benefit of investment in the GSCI for approx-imately the past 20 years (since the mid-1970s). In fact, crude oil begantrading in 1983 and was not part of the return composition of the GSCI inthe 1970s. Absent crude oil futures, the historical returns of the GSCI inthe 1970s were heavily dependent on agricultural prices. Fortunately, in the1970s, agricultural prices had periods of rapid increase (e.g., Russia grainshortages), and in the late 1980s, when agricultural prices were stagnant, theindex contained a healthy portion of oil futures. To the average investor,unaware of the unique construction of the index, the past performanceprovided a feeling of security that what had often seemed a risky, volatileasset had the assurance of a long-term positive rate of return. Although notnecessarily a reason for its creation, the GSCI also permitted the firm to sellany excess commodity inventory.
In truth, the GSCI was not an immediate success with investors. First,stock and bond markets rebounded in the early and mid-1990s followingthe successful outcome of the first Iraq war. By the mid-1990s, the GSCI hadstarted to become a recommended part of an investor’s diversified portfolio.Second, individuals and firms had become familiar enough with the GSCI toknow both how to trade against it and how to make money from such activetrading. Third, competing firms had started to devise a new set of commodityindices that could benefit from some of the construction issues of the GSCI.Note that the GSCI was sold in part as a product that reflected globalproduction and thus represented to the investor a proportional investmentin global commodities. However, since it was production and price weighted,it also had a fatal flaw: It increased investment in a particular commodity asthat commodity’s price or trading volume (i.e., production) rose. It did nottake long before traders realized that they could make considerable moneytrading against the index rather than with it; for commodities, the price ofsomething often falls if it is priced too high or too much of it is produced,and likewise, the price of a commodity often rises if it is priced too low andthere is little of it produced.
Commodities 135
The simple idea behind the AIG Commodity Index was to create anew commodity index that minimized, in part, the natural mean rever-sion in commodity prices embedded in the GSCI (e.g., overinvestment incommodities with high prices and high production, and underinvestmentin commodities with low prices and low production). Instead of using themost recent price and production to determine commodity weights, whynot simply take an average of several past years’ prices and production? Byusing the average of past years relative to the most recent year, an investorwould have an increased weight to a commodity even as its price andproduction fell, and a reduced weight to a commodity even as its price andproduction increased. In terms of development, the AIG Commodity Indexcan be regarded as phase 2. The AIG Commodity Index was introduced in1998. Soon after, a number of commodity indices came into existence. Eachindex was created to meet a unique concern or potential that did not existin either of the existing indices. The Rogers International Commodity Indexwas introduced in 1997 and included a number of commodities traded inJapan but not elsewhere. (It is not surprising that the Rogers InternationalCommodity Index is a favorite among certain Japanese trading firms, sinceif investors use it, they are the natural source for trading the contractsinvolved in its construction.) In 2003, the Deutsche Bank Commodity Indexwas created, which emphasized investment in only six commodities. Again,given the dominance of the GSCI and other passive commodity indices in themarket, another simple production-and-price-based index was not likely tomake a major effect on investors. Moreover, individuals were increasinglylooking for phase 3 commodity products, which included some aspects ofactive trading.
This rush to create new investment products based on new commodityindices had many causes, one being the dramatic increase in commodityindex assets in the late 1990s. During that time, we were also asked to be partof the development of the London Metal Exchange Metals Index. The hopewas that metals, in contrast to other more generic commodities, had both abasis in global production and a limited supply pattern. As a result, it had agreater potential for price increases than did more generic commodities (e.g.,agricultural) for which production could be easily increased. Commodityindices have grown from generic composites to specific commodity sub-indices. In the mid-2000s, Deutsche Bank and UBS introduced a commodityindex that took advantage of roll yield (i.e., essentially the differentialprice between a near term and more distant commodity futures pricesduring the period of rolling from the contract maturity to a later contract).The hope was, of course, that the demand for commodities creating the rollopportunity would continue. Further attempts have been made to capture thechanging economic and business cycle patterns implied in commodity prices.
136 POSTMODERN INVESTMENT
In 2007, the Bache Commodity Index was introduced, which offered amore active element to commodity index creation. The Bache CommodityIndex (now the Alternative Benchmark Commodity Index) was created totake advantage of the price momentum often seen in commodity prices.This index also introduced the ability to manage commodity price risk byadding cash to the portfolio in periods of historic commodity price decline.
It is not surprising that after 20 years of commodity index investing,the S&P GSCI remains the most popular investable commodity index,despite its known shortcomings. First, commodity products, as many otherinvestment products, have what is called a first-mover advantage. The S&PGSCI became one of the first commodity indices to be part of larger multi-asset allocation portfolios. Because the index was in the set of benchmarksused to determine asset allocation as well as relative performance, the useof other non-S&P GSCI commodity indices could increase tracking errorrelative to the listed S&P GSCI. Second, the S&P GSCI, being first out of thegate, became the commodity index often used as the benchmark in programsused to promote the benefits of commodity investment. Equally important,the S&P GSCI, backed by the resources of Goldman Sachs, had the officeand research support necessary for the successful promotion of the index.Moreover, although the S&P GSCI was composed of less than 50 percentenergy investments at its creation, in the early 1990s, as energy prices andtrading volume increased, the S&P GSCI became an increasingly energy-dependent index, with energy investments becoming well over 60 percent ofthe weighting.
Fortunately for the S&P GSCI, and commodity indices in general,economic and market conditions following the Internet bubble of the early2000s led to increased demand for energy and other commodity-basedproducts. Between 2000 and 2006, the rise of China and other emergingmarkets led to increased demand for commodities, while global tensionsin the Middle East led to concerns over energy supplies and increaseddemand for gold as a safe haven investment. This increased demand forvarious commodities was also coincident with the development of new directforms of commodity investment, such as exchange-traded funds (ETFs) andexchange-traded notes (ETNs). Although it took almost 20 years in themaking, commodity investment became an overnight success, based bothon new models of investment and on a new belief in commodities as along-term source of return.
In the following sections, we review commodity investment as a stand-alone investment and as a means to provide additional return enhancementas well as risk-reduction opportunities relative to those of stock and bondinvestments and other financial assets. The potential benefits of commoditiesas stand-alone investments or as additions to existing asset portfolios are
Commodities 137
explored in different ways. First, we briefly discuss various ways in whichinvestors can gain direct exposure to commodities. Second, we review thetheoretical basis for commodity investment. Academic research suggeststhat commodity indices have sources of risk and return that are distinctfrom traditional assets such as stocks and bonds. We also report on theperformance of direct commodity investment, at both the overall indexlevel and the subsector level (e.g., energy, industrial metals, precious metals,agriculture, and livestock), and provide evidence on different aspects ofdirect commodity investment, including the impact of roll return, inflationprotection, and relative performance of equity-based commodity investment.Finally, we explore unique issues involved in commodity investment, anddiscuss various myths in the area of commodity investment.
INVESTING IN COMMODITIES
Historically, direct commodity investment has been a minor part of aninvestor’s asset allocation decision. In contrast, indirect investments (e.g.,equity or debt ownership of firms specializing in direct commodity produc-tion) remain the principal means by which many investors obtain exposureto this asset class. However, as previously pointed out, in recent years, thenumber of investable commodity indices and commodity-linked investmentshas increased dramatically. Today, commodity investment, whether at theindividual commodity level or through commodity-based portfolios, hasbecome an increasingly important part of investors’ diversified portfolios.
Private Investment in Commodities
Private direct investment includes investment in commodities either throughdirect spot markets or though futures markets. Investment in futuresmarkets often requires an investor to select a futures commission merchant(FCM) and a broker or a brokerage house (or both) with which they willmaintain their account. Individual firms may have different restrictions onthe level of financial wealth required to invest through their operation.However, investors are cautioned that the choice of brokerage firm is avery important one. For starters, the firm must have the capacity to handlecomplex trades. The FCM generally has custody of the investors’ funds andis responsible for furnishing investors with confirmations of all transactions,monthly statements showing information about trading activities in theiraccount, and other account statements customarily furnished by the FCMto its customers. Private investment in commodities may also include directinvestment through various private pools of investment in a wide range ofcommodity enterprises, including timber and other agricultural investmentopportunities.
138 POSTMODERN INVESTMENT
Investors may directly invest in commodities through spot markets orrelated futures markets. Although spot investment and futures investmentare related through basic cost-of-carry arbitrage, investors must be warnedthat the underlying returns to each investment may differ because of a rangeof market factors (e.g., differential storage costs, carry costs, convenienceyields). However, investors may be restricted to investment in spot markets(e.g., gold bullion) versus futures contracts (e.g., gold futures), dependingon the regulatory rules governing the means of investment in the investor’scountry.
Public Investment in Commodities
Commodity exposure may also be gained through investment in publiccommodity funds. These funds offer commodity exposure to individualcommodities or a basket of select commodity funds. These products capturethe performance of active manager-based investments. A diversified com-modity fund may invest in a wide variety of underlying commodities and,therefore, is not exposed to serious losses of any one commodity. As withany public fund, however, investors are advised to review the underlyingobjectives of the fund. Some public commodity funds stress a more activeabsolute return approach, while others are more benchmark focused.
Publicly traded equity firms, for whom commodity production and saleare a primary part of their business enterprise, and public equity basedcommodity funds, which attempt to provide commodity return opportu-nities based on investment in the equity of commodity-based firms, offeran additional means for retail and high-net-worth investors to obtaincommodity-based returns. Investors are thus cautioned to determine if thefunds they are investing in focus on direct commodity investing or indirectinvestment through investment in the equity of commodity-based firms. Theperformance of commodity funds that invest in the equity of firms spe-cializing in commodities and those that invest directly in commodity-basedproducts often provide different return-to-risk trade-offs.
Investable commodity products can also be accessed directly throughETF products. These products provide both long-only investment andthe means to take short positions in select commodities. Most currentlyavailable commodity ETFs attempt to track the performance of existingcommodity indices. However, as will be discussed, commodity indices maydiffer dramatically in terms of composition and return-to-risk trade-off. Inaddition, there are an increasing number of commodity ETF providers thatare creating more active trading-based commodity ETFs. These commodityETFs offer a systematic approach to commodity investing, which oftenincludes a more active approach (e.g., dramatic changes in commodityweights) based on a well-defined trading methodology.

Commodities 139
COMMODITY STYLES AND BENCHMARKS
As with most investment strategies, the commodity arena can often bedefined by the markets the manager trades and the form of the trading thattakes place. The primary commodity benchmark groupings follow. Each ofthese benchmarks can generally provide returns in total return form, excessreturn form (i.e., less the risk-free rate), and spot return form (i.e., returnfrom investment solely in the futures contract with constant investment).
Sample Commodity Indices
Total Composite Sub-Sector
Agriculture Livestock CommodityAgriculture and Livestock Non-EnergyEnergy and Metals Non-LivestockEnergy Commodity Non-Natural GasEnhanced Commodity Strategy Non-Precious MetalEx-Gasoil Petroleum PetroleumGrains Precious Metal CommodityIndustrial Metal Commodity Reduced EnergyLight Energy Ultra Light Energy
Indices also exist at the individual commodity level. As with moregeneral composite commodity indices, individual commodity indices maydiffer based on the exact construction methodology.
Sample Individual Commodity-Based Indices
Aluminum Crude Heating oil SilverBrent Feeder cattle Lead SoybeanCocoa Gas oil Lean hog Soybean oilCoffee Gasoline Live cattle SugarCopper Gold Natural gas WheatCorn Hard wheat Nickel Zinc
Similar to other investment areas (e.g., S&P 500, Russell 1000, andDow Jones), there exist in the commodity area several firms that provide anumber of futures-based commodity indices. In this chapter, the S&P GSCIis used as the primary representative commodity index; however, when
140 POSTMODERN INVESTMENT
comparing commodity index products, a number of large investment firms(e.g., Deutsche Bank, UBS, Merrill Lynch) as well as other players in thecommodity area offer a wide range of commodity indices. Each of theseindices is unique in its own way. For example, the S&P GSCI, the DowJones–UBS Commodity Index (DJ-UBSCI), and the Alternative BenchmarkCommodity Index (ABCI) all differ slightly in their construction, with theS&P GSCI primarily following a production-weighted methodology. TheDJ-UBSCI uses a combination of production, liquidity, and limits on sectorand commodity weights. The ABCI is a bit more complex. It employs bothupper and lower bounds on investment in each sector and each commodity,and includes a commodity momentum model, which results in a rebalanceof individual commodities each day to maintain the desired exposure toeach commodity market. Finally, investable commodity indices can also becreated to meet a set of preselected filters (i.e., green commodity indices,metals indices) or to reflect a more active trading format (e.g., MorningstarLong/Short Commodity Index). As with many investment strategies, theform that investments can take is limited only by regulation, investordemand, and the trading firm’s desire to create such a product.
BASIC SOURCES OF RETURN AND RISK
Commodity returns reflect price changes in the underlying commodity.These price changes are caused by changes in commodity supply anddemand as well as changes in the unique factors directly impacting thecommodity investment vehicle. For example, commodity futures contractsare impacted not only by the current spot price but also by a range ofstorage and cost-of-carry factors (such as interest rates, storage cost, andconvenience yield). The equity of commodity firms is affected not only bythe price of their underlying holdings but also by the extent to which theymanage those resources (e.g., hedge current or expected output) and theefficiencies in their operational processes.
In this chapter, we concentrate on the performance of commodityinvestment through an analysis of public commodity indices. As discussedpreviously, commodity indices attempt to replicate the returns available toholding long positions in agricultural, metal, energy, or livestock invest-ment. Since returns on a fully invested futures contract reflect those of aninvestment in the underlying deliverable, commodity indices based on thereturns of futures contracts offer an efficient means to obtain commodityexposure. However, as discussed previously, these indices may differ in anumber of ways, such as the commodities included in the index, the weightsof the individual commodities, and a number of operational trading issues
Commodities 141
(e.g., roll period and rebalancing). The source of returns to commodityinvestment depends both on the underlying use of the commodity and onthe investment vehicle used to capture a particular part of the commod-ity earnings stream. For many, commodities are seen as products to beconsumed and that do not naturally provide investment returns, while forothers, commodities are products that are a physical part of the productionprocess with returns that are determined by their marginal value in theproduction process. For others, the debate as to the source and dynamics ofcommodity returns, as well as their place in an investor’s strategic portfolio,lies primarily in a commodity’s ability to offer return-to-risk trade-offs thatcannot be easily replicated through other investment alternatives.
Research has examined the economic determinants of returns to com-modity investment. As with any investment, returns are determined bythe expected return on the deliverable and, for futures-related contracts,the expected cost-of-carry returns, as well as other storage and deliverableoptions. For example, there is a strong business-cycle component in indus-trial metals-based futures contracts, a finding that is consistent with thebusiness-cycle variation of spot and futures prices of industrial metals. Thetheory of storage splits the difference between the futures price and the spotprice into the forgone interest from purchasing and storing the commodity,storage costs, and the convenience yield on the inventory. Convenienceyield reflects an embedded consumption timing option in holding a storablecommodity. Further, the theory of storage predicts an inverse relationshipbetween the level of inventories and convenience yield—namely, at lowinventory levels, convenience yields are high, and vice versa. A related impli-cation is that the term structure of forward price volatility generally declinesover time until expiration of the futures contract—the so-called Samuelsoneffect. This is caused by the expectation that, although at shorter hori-zons, mismatched supply-and-demand forces for the underlying commodityincrease the volatility of spot prices; these forces will fall into equilibriumat longer horizons.
Of course, there exist different approaches and research results on theability to forecast various commodity prices. Forecasting the underlying riskprocess of various commodities is likewise a major aspect in managing theunderlying risk embedded in commodities. Work is also being conductedon the price of volatility risk in various commodity products as well asthe underlying pricing process of commodities. These studies focus on theunderlying risk premiums for energy and the degree to which the underlyingreturn-and-risk profile is time varying. Finally, research has explored thedegree to which commodity prices follow various momentum patterns andfor which more active systematic algorithmic-based trading approaches maybe of value.
142 POSTMODERN INVESTMENT
PERFORMANCE: FACT AND FICTION
Commodities differ from most investment vehicles since they are not directlyrelated to corporate or global earnings growth captured by equity orfixed-income-based investment vehicles, or to investment strategies basedon investment in derivative products (e.g., commodity trading advisors[CTAs]). Commodities may be regarded more as inputs to certain manu-facturing processes and are related to certain measures of inflation. As aresult, commodities returns, by their very nature, may respond to differentinformational factors than equity or fixed-income markets. While the levelof long-term return is uncertain, it is generally expected that commodityinvestment will provide diversification benefits to long-only equity or fixed-income biased investment portfolios. In the following sections, we attemptto provide evidence not only on the stand-alone risks of various commodityinvestments, but on the interrelationships between various commodities andbetween commodities and various traditional (e.g. equity and fixed-incomemarket) and alternative asset classes. As in previous chapters, we examinethese markets over a broad time period, as well as over shorter time inter-vals (e.g., annual) including their relative performance in extreme marketconditions. As expected, commodities are shown to have a low correlationwith the comparison traditional and alternative investments and providepotential diversification benefits. The level of benefits partially depends onthe level of commodity risk and expected returns. Results show that in peri-ods of extreme equity or fixed-income market, most commodities strategieshave similar return patterns, that is, falling in down equity markets andproviding positive returns in up equity markets. To some, this is unexpectedbecause commodities have been regarded primarily as sources of diversifi-cation, but for many commodities, underlying price movement is based onunderlying demand that may fall in poor equity market conditions and risein better equity market conditions. Given the changing nature of commod-ity demand, investors should not take return and risk performance fromextended time frames as a basis for how various commodities or a compositecommodity indices may perform over relatively shorter time periods (e.g.,annual). Finally, while certain commodities have the potential for returnpatterns similar to comparison publicly traded commodity firms, the abilityof many publicly traded commodity-based firms to directly manage the riskof commodity inputs and outputs often results in low correlation betweenlong-bias commodity indices and publicly traded commodity returns.
RETURN AND RISK CHARACTERISTICS
In this section, we review the performance of the S&P GSCI with a rangeof traditional stock and bond indices as well as a number of alternative
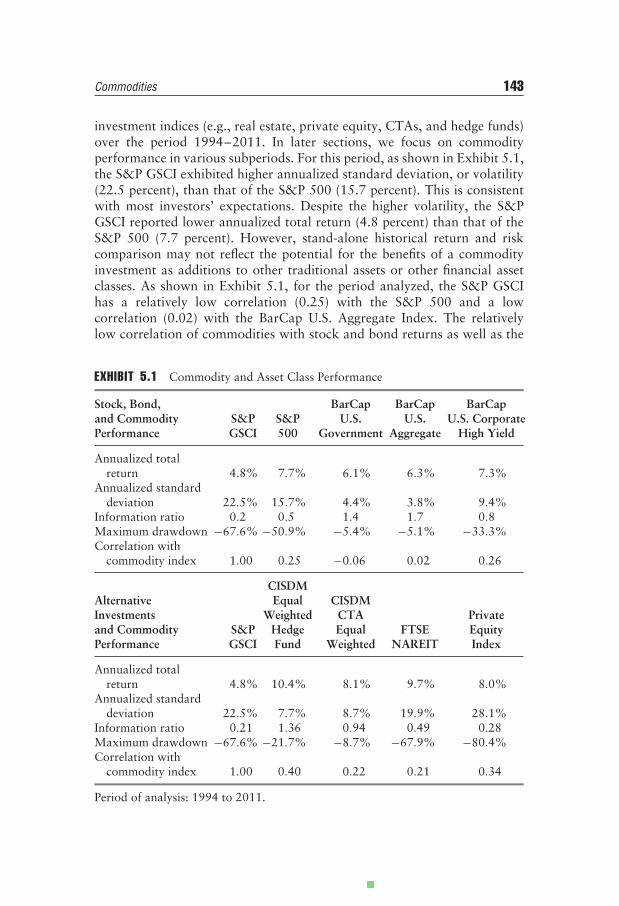
Commodities 143
investment indices (e.g., real estate, private equity, CTAs, and hedge funds)over the period 1994–2011. In later sections, we focus on commodityperformance in various subperiods. For this period, as shown in Exhibit 5.1,the S&P GSCI exhibited higher annualized standard deviation, or volatility(22.5 percent), than that of the S&P 500 (15.7 percent). This is consistentwith most investors’ expectations. Despite the higher volatility, the S&PGSCI reported lower annualized total return (4.8 percent) than that of theS&P 500 (7.7 percent). However, stand-alone historical return and riskcomparison may not reflect the potential for the benefits of a commodityinvestment as additions to other traditional assets or other financial assetclasses. As shown in Exhibit 5.1, for the period analyzed, the S&P GSCIhas a relatively low correlation (0.25) with the S&P 500 and a lowcorrelation (0.02) with the BarCap U.S. Aggregate Index. The relativelylow correlation of commodities with stock and bond returns as well as the
EXHIBIT 5.1 Commodity and Asset Class Performance
Stock, Bond,and CommodityPerformance
S&PGSCI
S&P500
BarCapU.S.
Government
BarCapU.S.
Aggregate
BarCapU.S. Corporate
High Yield
Annualized totalreturn 4.8% 7.7% 6.1% 6.3% 7.3%
Annualized standarddeviation 22.5% 15.7% 4.4% 3.8% 9.4%
Information ratio 0.2 0.5 1.4 1.7 0.8Maximum drawdown −67.6% −50.9% −5.4% −5.1% −33.3%Correlation with
commodity index 1.00 0.25 −0.06 0.02 0.26
AlternativeInvestmentsand CommodityPerformance
S&PGSCI
CISDMEqual
WeightedHedgeFund
CISDMCTAEqual
WeightedFTSE
NAREIT
PrivateEquityIndex
Annualized totalreturn 4.8% 10.4% 8.1% 9.7% 8.0%
Annualized standarddeviation 22.5% 7.7% 8.7% 19.9% 28.1%
Information ratio 0.21 1.36 0.94 0.49 0.28Maximum drawdown −67.6% −21.7% −8.7% −67.9% −80.4%Correlation with
commodity index 1.00 0.40 0.22 0.21 0.34
Period of analysis: 1994 to 2011.
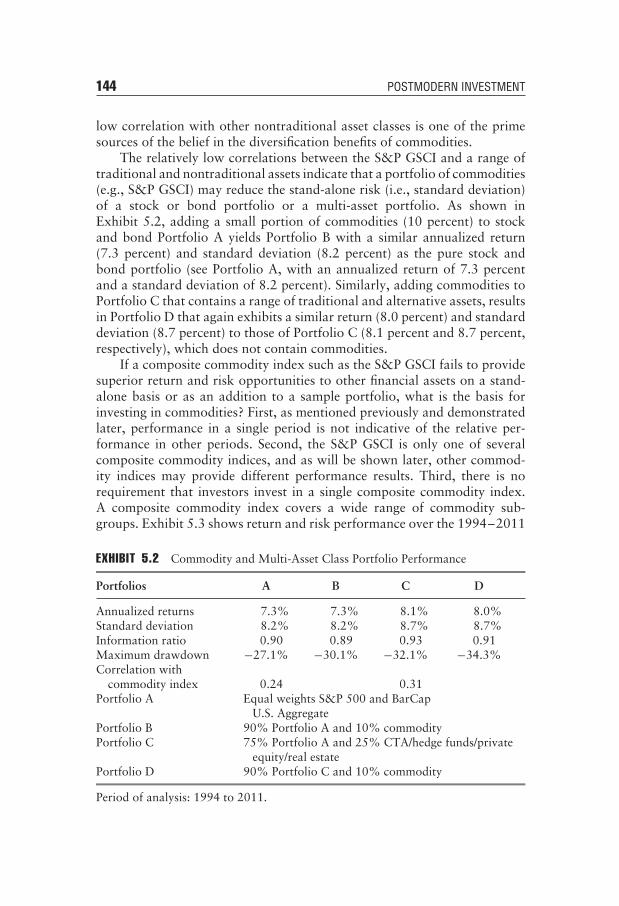
144 POSTMODERN INVESTMENT
low correlation with other nontraditional asset classes is one of the primesources of the belief in the diversification benefits of commodities.
The relatively low correlations between the S&P GSCI and a range oftraditional and nontraditional assets indicate that a portfolio of commodities(e.g., S&P GSCI) may reduce the stand-alone risk (i.e., standard deviation)of a stock or bond portfolio or a multi-asset portfolio. As shown inExhibit 5.2, adding a small portion of commodities (10 percent) to stockand bond Portfolio A yields Portfolio B with a similar annualized return(7.3 percent) and standard deviation (8.2 percent) as the pure stock andbond portfolio (see Portfolio A, with an annualized return of 7.3 percentand a standard deviation of 8.2 percent). Similarly, adding commodities toPortfolio C that contains a range of traditional and alternative assets, resultsin Portfolio D that again exhibits a similar return (8.0 percent) and standarddeviation (8.7 percent) to those of Portfolio C (8.1 percent and 8.7 percent,respectively), which does not contain commodities.
If a composite commodity index such as the S&P GSCI fails to providesuperior return and risk opportunities to other financial assets on a stand-alone basis or as an addition to a sample portfolio, what is the basis forinvesting in commodities? First, as mentioned previously and demonstratedlater, performance in a single period is not indicative of the relative per-formance in other periods. Second, the S&P GSCI is only one of severalcomposite commodity indices, and as will be shown later, other commod-ity indices may provide different performance results. Third, there is norequirement that investors invest in a single composite commodity index.A composite commodity index covers a wide range of commodity sub-groups. Exhibit 5.3 shows return and risk performance over the 1994–2011
EXHIBIT 5.2 Commodity and Multi-Asset Class Portfolio Performance
Portfolios A B C D
Annualized returns 7.3% 7.3% 8.1% 8.0%Standard deviation 8.2% 8.2% 8.7% 8.7%Information ratio 0.90 0.89 0.93 0.91Maximum drawdown −27.1% −30.1% −32.1% −34.3%Correlation with
commodity index 0.24 0.31Portfolio A Equal weights S&P 500 and BarCap
U.S. AggregatePortfolio B 90% Portfolio A and 10% commodityPortfolio C 75% Portfolio A and 25% CTA/hedge funds/private
equity/real estatePortfolio D 90% Portfolio C and 10% commodity
Period of analysis: 1994 to 2011.
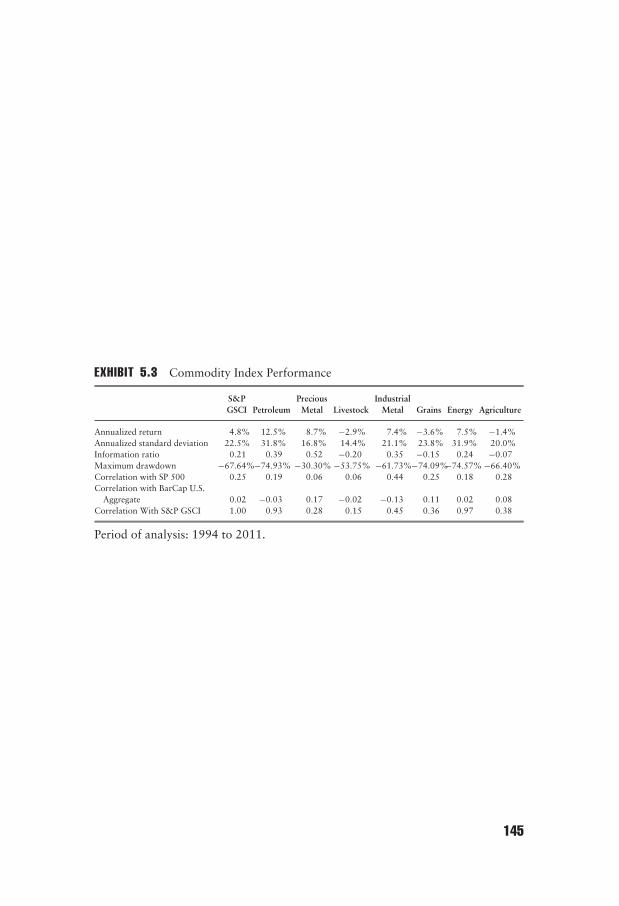
EXHIBIT 5.3 Commodity Index Performance
S&PGSCI Petroleum
PreciousMetal Livestock
IndustrialMetal Grains Energy Agriculture
Annualized return 4.8% 12.5% 8.7% −2.9% 7.4% −3.6% 7.5% −1.4%Annualized standard deviation 22.5% 31.8% 16.8% 14.4% 21.1% 23.8% 31.9% 20.0%Information ratio 0.21 0.39 0.52 −0.20 0.35 −0.15 0.24 −0.07Maximum drawdown −67.64%−74.93% −30.30% −53.75% −61.73%−74.09%−74.57% −66.40%Correlation with SP 500 0.25 0.19 0.06 0.06 0.44 0.25 0.18 0.28Correlation with BarCap U.S.
Aggregate 0.02 −0.03 0.17 −0.02 −0.13 0.11 0.02 0.08Correlation With S&P GSCI 1.00 0.93 0.28 0.15 0.45 0.36 0.97 0.38
Period of analysis: 1994 to 2011.
145
146 POSTMODERN INVESTMENT
period for commodity subgroups, which differ from the composite S&PGSCI. Equally important, the relative standard deviations and correlationof the S&P GSCI sub-indices with the S&P 500 and BarCap U.S. AggregateBond Index (shown in Exhibit 5.3) illustrate that the correlation of theindividual commodity subgroups with the exception of petroleum or energyare somewhat independent of the composite commodity index.
In summary, there is much in the historical returns for the period1994–2011 to support traditional investors’ view that the return-to-risktrade-off of commodities makes them poor stand-alone investments butmay make them beneficial as diversifiers to many financial asset-basedportfolios. Simply reporting historical returns, however, may not capturemany of the return and risk characteristics of commodities over uniquefinancial or economic conditions. Investors should be certain to check howa particular commodity index or individual commodity performs across awide range of economic and financial markets and whether the program theywish to invest in has a strategy for taking those changes into consideration.
THE MYTH OF AVERAGE: COMMODITY INDEX RETURNIN EXTREME MARKETS
The results in the previous section illustrate the performance of the S&PGSCI and how it compares to traditional and alternative investment indicesover an 18-year period (1994 to 2011). The results indicate little return orrisk benefits of commodities as a stand-alone investment or as an additionto an existing traditional investment portfolio or a portfolio of traditionaland alternative investments. However, the relative stand-alone performanceof the S&P GSCI, as well as its potential benefits when added to a portfolioof financial assets may differ in various subperiods, in comparison to itsperformance over the entire period of analysis. This is especially true inperiods of market stress, when certain commodity investments (e.g., gold)may be seen as flight to safety and when the period of market stress is causedby the price movement of underlying commodities.
Exhibit 5.4 shows monthly commodity returns ranked on the S&P 500and grouped into three segments (bottom, middle, and top) of 72 monthseach, with average returns for each commodity segment presented. Resultsshow that the S&P GSCI and the related sub-indices generally reported lessnegative returns than the S&P 500 in the worst S&P 500 return monthsand reported less positive returns than the S&P 500 in the best S&P 500return months. The positive performance in up markets may be partiallycaused by the positive economic conditions driving both stock market pricesand commodity demand. The relative superior performance in down S&P
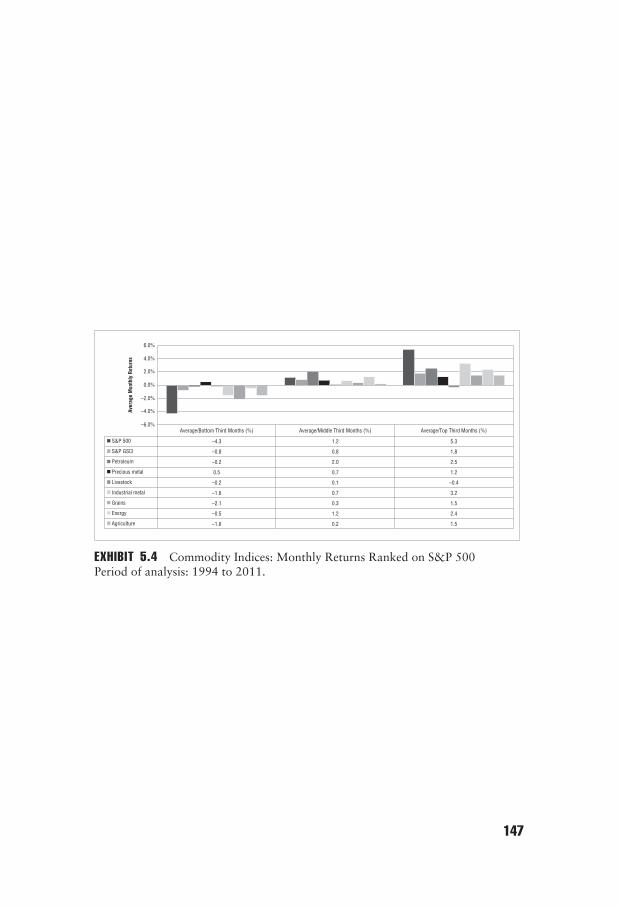
Average/Middle Third Months (%)Average/Bottom Third Months (%) Average/Top Third Months (%)
S&P 500
S&P GSCI
Petroleum
Precious metal
Livestock
Industrial metal
Grains
Energy
Agriculture
–4.3
–0.8
–0.2
0.5
–0.2
–1.6
–2.1
–0.5
–1.6
1.2
0.8
2.0
0.7
0.1
0.7
0.3
1.2
0.2
5.3
1.8
2.5
1.2
–0.4
3.2
1.5
2.4
1.5
–6.0%
–4.0%
–2.0%
0.0%
2.0%
4.0%
6.0%
Aver
age
Mon
thly
Ret
urns
EXHIBIT 5.4 Commodity Indices: Monthly Returns Ranked on S&P 500Period of analysis: 1994 to 2011.
147
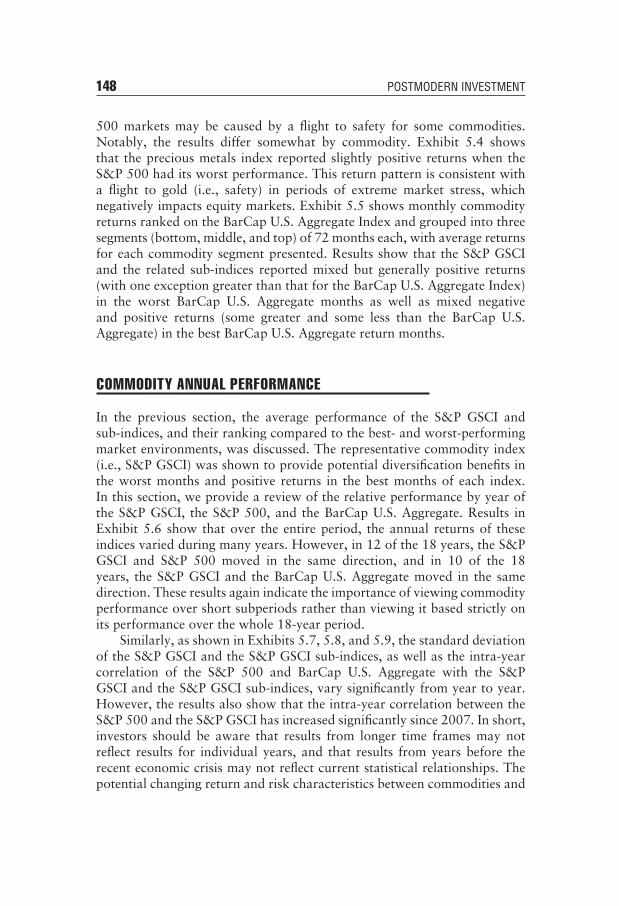
148 POSTMODERN INVESTMENT
500 markets may be caused by a flight to safety for some commodities.Notably, the results differ somewhat by commodity. Exhibit 5.4 showsthat the precious metals index reported slightly positive returns when theS&P 500 had its worst performance. This return pattern is consistent witha flight to gold (i.e., safety) in periods of extreme market stress, whichnegatively impacts equity markets. Exhibit 5.5 shows monthly commodityreturns ranked on the BarCap U.S. Aggregate Index and grouped into threesegments (bottom, middle, and top) of 72 months each, with average returnsfor each commodity segment presented. Results show that the S&P GSCIand the related sub-indices reported mixed but generally positive returns(with one exception greater than that for the BarCap U.S. Aggregate Index)in the worst BarCap U.S. Aggregate months as well as mixed negativeand positive returns (some greater and some less than the BarCap U.S.Aggregate) in the best BarCap U.S. Aggregate return months.
COMMODITY ANNUAL PERFORMANCE
In the previous section, the average performance of the S&P GSCI andsub-indices, and their ranking compared to the best- and worst-performingmarket environments, was discussed. The representative commodity index(i.e., S&P GSCI) was shown to provide potential diversification benefits inthe worst months and positive returns in the best months of each index.In this section, we provide a review of the relative performance by year ofthe S&P GSCI, the S&P 500, and the BarCap U.S. Aggregate. Results inExhibit 5.6 show that over the entire period, the annual returns of theseindices varied during many years. However, in 12 of the 18 years, the S&PGSCI and S&P 500 moved in the same direction, and in 10 of the 18years, the S&P GSCI and the BarCap U.S. Aggregate moved in the samedirection. These results again indicate the importance of viewing commodityperformance over short subperiods rather than viewing it based strictly onits performance over the whole 18-year period.
Similarly, as shown in Exhibits 5.7, 5.8, and 5.9, the standard deviationof the S&P GSCI and the S&P GSCI sub-indices, as well as the intra-yearcorrelation of the S&P 500 and BarCap U.S. Aggregate with the S&PGSCI and the S&P GSCI sub-indices, vary significantly from year to year.However, the results also show that the intra-year correlation between theS&P 500 and the S&P GSCI has increased significantly since 2007. In short,investors should be aware that results from longer time frames may notreflect results for individual years, and that results from years before therecent economic crisis may not reflect current statistical relationships. Thepotential changing return and risk characteristics between commodities and
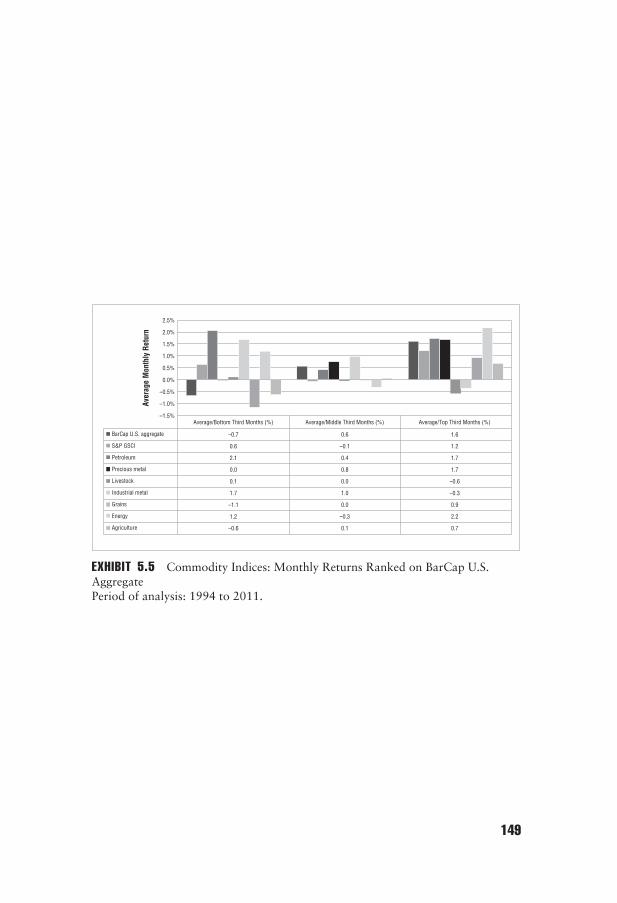
Average/Middle Third Months (%)Average/Bottom Third Months (%) Average/Top Third Months (%)
BarCap U.S. aggregate
S&P GSCI
Petroleum
Precious metal
Livestock
Industrial metal
Grains
Energy
Agriculture
–0.7
0.6
2.1
0.0
0.1
1.7
–1.1
1.2
–0.6
0.6
–0.1
0.4
0.8
0.0
1.0
0.0
–0.3
0.1
1.6
1.2
1.7
1.7
–0.6
–0.3
0.9
2.2
0.7
–1.5%
–1.0%
–0.5%
0.0%
0.5%
1.0%
1.5%
2.0%
2.5%
Aver
age
Mon
thly
Ret
urn
EXHIBIT 5.5 Commodity Indices: Monthly Returns Ranked on BarCap U.S.AggregatePeriod of analysis: 1994 to 2011.
149
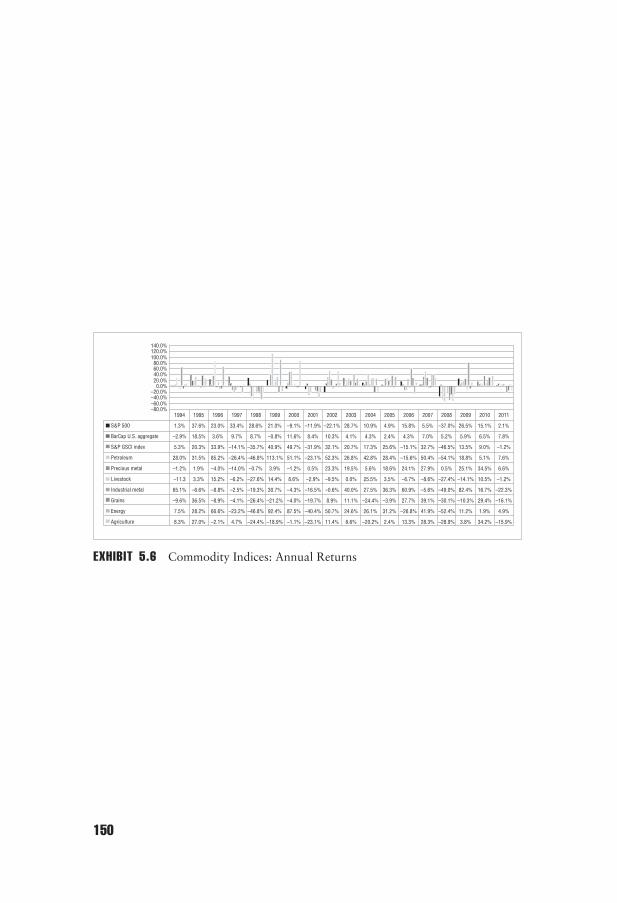
1994
1.3%
–2.9%
5.3%
28.0%
–1.2%
–11.3
65.1%
–9.6%
7.5%
8.3%
1995
37.6%
18.5%
20.3%
31.5%
1.9%
3.3%
–6.6%
36.5%
28.2%
27.0%
1996
23.0%
3.6%
33.9%
85.2%
–4.0%
15.2%
–8.8%
–8.9%
66.6%
–2.1%
1997
33.4%
9.7%
–14.1%
–26.4%
–14.0%
–6.2%
–2.5%
–4.1%
–23.2%
4.7%
1998
28.6%
8.7%
–35.7%
–46.8%
–0.7%
–27.6%
–19.3%
–26.4%
–46.8%
–24.4%
1999
21.0%
–0.8%
40.9%
113.1%
3.9%
14.4%
30.7%
–21.2%
92.4%
–18.9%
2000
–9.1%
11.6%
49.7%
51.1%
–1.2%
8.6%
–4.3%
–4.0%
87.5%
–1.1%
2001
–11.9%
8.4%
–31.9%
–23.1%
0.5%
–2.9%
–16.5%
–19.7%
–40.4%
–23.1%
2002
–22.1%
10.3%
32.1%
52.3%
23.3%
–9.5%
–0.6%
8.9%
50.7%
11.4%
2003
28.7%
4.1%
20.7%
26.8%
19.5%
0.0%
40.0%
11.1%
24.6%
6.6%
2004
10.9%
4.3%
17.3%
42.8%
5.6%
25.5%
27.5%
–24.4%
26.1%
–20.2%
2005
4.9%
2.4%
25.6%
28.4%
18.6%
3.5%
36.3%
–3.9%
31.2%
2.4%
2006
15.8%
4.3%
–15.1%
–15.6%
24.1%
–6.7%
60.9%
27.7%
–26.8%
13.3%
2007
5.5%
7.0%
32.7%
50.4%
27.9%
–8.6%
–5.6%
39.1%
41.9%
28.3%
2008
–37.0%
5.2%
–46.5%
–54.1%
0.5%
–27.4%
–49.0%
–30.1%
–52.4%
–28.9%
2009
26.5%
5.9%
13.5%
18.8%
25.1%
–14.1%
82.4%
–10.3%
11.2%
3.8%
2010
15.1%
6.5%
9.0%
5.1%
34.5%
10.5%
16.7%
29.4%
1.9%
34.2%
2011
2.1%
7.8%
–1.2%
7.6%
6.6%
–1.2%
–22.3%
–16.1%
4.9%
–15.9%
S&P 500
BarCap U.S. aggregate
S&P GSCI index
Petroleum
Precious metal
Livestock
Industrial metal
Grains
Energy
Agriculture
–80.0%–60.0%–40.0%–20.0%
0.0%20.0%40.0%60.0%80.0%
100.0%120.0%140.0%
EXHIBIT 5.6 Commodity Indices: Annual Returns
150

1994
10.6%
4.4%
13.1%
20.4%
8.4%
18.0%
12.1%
12.3%
24.8%
8.6%
1995
5.2%
3.5%
11.2%
16.2%
6.5%
12.0%
16.1%
13.6%
22.3%
8.5%
1996
10.9%
4.3%
12.6%
22.7%
8.1%
12.4%
15.6%
25.4%
20.4%
19.4%
1997
15.9%
3.6%
16.6%
20.8%
13.7%
8.2%
12.6%
24.4%
27.3%
18.9%
1998
21.5%
2.7%
18.6%
33.9%
13.3%
16.5%
8.9%
20.2%
33.5%
13.6%
1999
13.1%
2.7%
21.7%
43.0%
18.2%
14.3%
19.5%
16.8%
39.7%
13.9%
2000
17.2%
2.8%
23.3%
41.4%
9.3%
11.3%
10.4%
16.9%
36.8%
12.4%
2001
19.9%
3.8%
14.7%
25.9%
11.1%
12.3%
19.4%
15.9%
20.8%
14.0%
2002
20.6%
3.7%
18.7%
29.2%
13.3%
17.4%
13.2%
17.8%
31.4%
15.6%
2003
11.4%
5.3%
25.8%
31.7%
14.6%
21.2%
20.0%
17.8%
36.4%
11.7%
2004
7.3%
4.0%
22.3%
31.8%
17.6%
12.4%
18.9%
23.4%
32.1%
18.5%
2005
7.9%
3.1%
25.4%
32.1%
13.3%
10.6%
14.1%
22.3%
33.5%
18.3%
2006
5.6%
2.7%
21.7%
26.5%
20.8%
16.8%
25.9%
18.8%
27.5%
15.5%
2007
9.7%
2.6%
17.0%
24.3%
14.4%
14.0%
19.6%
24.9%
22.7%
21.7%
2008
21.0%
6.1%
42.9%
51.9%
32.7%
16.6%
38.8%
40.3%
50.6%
38.6%
2009
22.3%
3.3%
24.5%
32.7%
22.5%
8.8%
19.0%
30.2%
31.9%
22.9%
2010
19.3%
2.9%
23.3%
27.8%
11.4%
10.5%
27.5%
35.2%
26.4%
33.4%
2011
15.9%
2.4%
20.8%
24.5%
30.8%
17.7%
24.5%
33.2%
23.9%
27.2%
S&P 500
BarCap U.S. aggregate
S&P GSCI index
Petroleum
Precious metal
Livestock
Industrial metal
Grains
Energy
Agriculture
0.0%
10.0%
20.0%
30.0%
40.0%
50.0%
60.0%
EXHIBIT 5.7 Commodity Indices: Annual Standard Deviation
151
1994
0.76
0.28
0.10
–0.36
0.40
0.20
0.40
0.17
0.39
1995
0.22
–0.14
–0.14
0.05
0.14
0.04
–0.07
–0.13
–0.15
1996
0.51
0.57
–0.13
–0.15
–0.11
0.14
0.14
0.54
0.15
1997
0.68
–0.11
0.16
0.10
0.35
0.40
–0.33
–0.09
–0.28
1998
–0.42
0.20
0.05
0.50
0.17
–0.09
0.55
0.09
0.54
1999
0.34
0.22
0.24
–0.25
–0.34
0.40
0.25
0.24
0.22
2000
0.40
0.02
0.05
–0.14
–0.06
0.15
0.06
0.01
0.14
2001
–0.40
0.27
0.23
–0.14
–0.15
0.68
0.28
0.12
0.62
2002
–0.72
–0.19
–0.21
–0.08
–0.13
0.81
–0.13
–0.18
–0.02
2003
–0.04
–0.16
–0.25
0.18
0.03
0.31
0.36
–0.20
0.24
2004
0.06
–0.51
–0.57
0.05
–0.14
0.44
0.20
–0.56
0.30
2005
–0.19
–0.01
–0.11
0.32
–0.10
0.47
0.51
–0.08
0.42
2006
0.28
–0.07
–0.08
0.30
–0.37
0.04
0.16
–0.11
0.36
2007
–0.44
0.05
–0.11
0.25
–0.47
0.37
0.11
0.01
0.05
2008
0.35
0.52
0.55
0.09
0.60
0.36
0.23
0.52
0.20
2009
0.64
0.49
0.43
0.00
–0.01
0.69
0.49
0.42
0.58
2010
–0.58
0.88
0.85
–0.08
0.51
0.92
0.56
0.85
0.52
2011
–0.35
0.80
0.81
0.32
–0.30
0.80
0.41
0.81
0.42
BarCapU.S. aggregate
S&P GSCI
Petroleum
Precious metal
Livestock
Industrial metal
Grains
Energy
Agriculture
–1.00
–0.80
–0.60
–0.40
–0.20
0.00
0.20
0.40
0.60
0.80
1.00
1.20
EXHIBIT 5.8 Commodity Indices: Annual Correlation with S&P 500
152
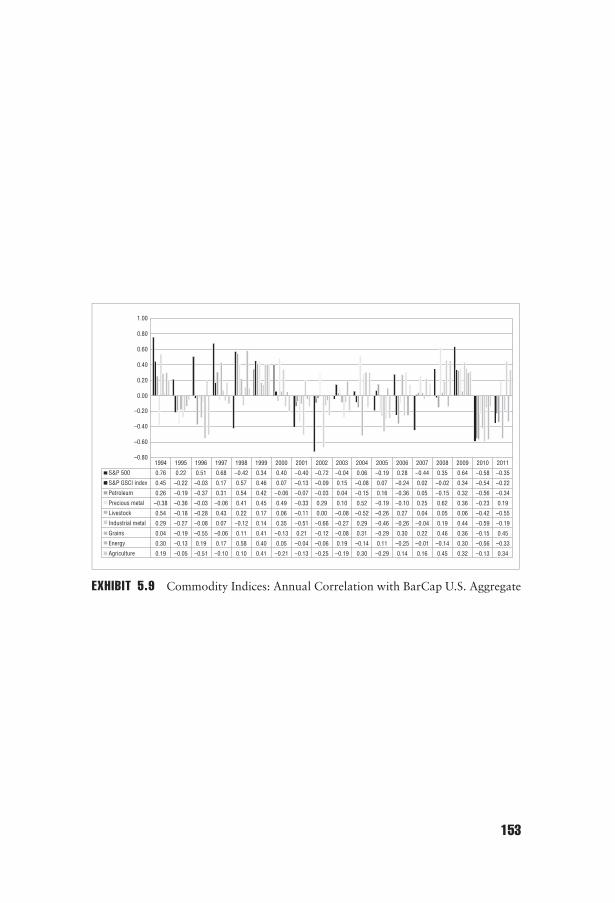
1994
0.76
0.45
0.26
–0.38
0.54
0.29
0.04
0.30
0.19
1995
0.22
–0.22
–0.19
–0.36
–0.18
–0.27
–0.19
–0.13
–0.05
1996
0.51
–0.03
–0.37
–0.03
–0.28
–0.08
–0.55
0.19
–0.51
1997
0.68
0.17
0.31
–0.06
0.43
0.07
–0.06
0.17
–0.10
1998
–0.42
0.57
0.54
0.41
0.22
–0.12
0.11
0.58
0.10
1999
0.34
0.46
0.42
0.45
0.17
0.14
0.41
0.40
0.41
2000
0.40
0.07
–0.06
0.49
0.06
0.35
–0.13
0.05
–0.21
2001
–0.40
–0.13
–0.07
–0.33
–0.11
–0.51
0.21
–0.04
–0.13
2002
–0.72
–0.09
–0.03
0.29
0.00
–0.66
–0.12
–0.06
–0.25
2003
–0.04
0.15
0.04
0.10
–0.08
–0.27
–0.08
0.19
–0.19
2004
0.06
–0.08
–0.15
0.52
–0.52
0.29
0.31
–0.14
0.30
2005
–0.19
0.07
0.16
–0.19
–0.26
–0.46
–0.29
0.11
–0.29
2006
0.28
–0.24
–0.36
–0.10
0.27
–0.26
0.30
–0.25
0.14
2007
–0.44
0.02
0.05
0.25
0.04
–0.04
0.22
–0.01
0.16
2008
0.35
–0.02
–0.15
0.62
0.05
0.19
0.46
–0.14
0.45
2009
0.64
0.34
0.32
0.36
0.06
0.44
0.36
0.30
0.32
2010
–0.58
–0.54
–0.56
–0.23
–0.42
–0.59
–0.15
–0.56
–0.13
2011
–0.35
–0.22
–0.34
0.19
–0.55
–0.19
0.45
–0.33
0.34
S&P 500
S&P GSCI index
Petroleum
Precious metal
Livestock
Industrial metal
Grains
Energy
Agriculture
–0.80
–0.60
–0.40
–0.20
0.00
0.20
0.40
0.60
0.80
1.00
EXHIBIT 5.9 Commodity Indices: Annual Correlation with BarCap U.S. Aggregate
153
154 POSTMODERN INVESTMENT
equity markets illustrated in Exhibit 5.8 are important. Recent globaleconomic integration, the rise of China, and new financial products thatemphasize commodities may have fundamentally changed historical rela-tionships between equity and commodities. Marketing presentations thatemphasize results based on 20, 30, or 40 years of historical data are inher-ently misleading. For commodities, such lengthy periods of analysis mayhide more than they reveal. Investors must consider the relevance of histori-cal data on corn before it became an energy substitute, on natural gas beforethe current supplies were discovered, and on many seasonal commoditiesbefore year-round production began. For commodities especially, investorsare warned to be hypervigilant.
COMMODITY SUBSECTOR INDEX: ANNUAL COMMODITYPERFORMANCE
The results in Exhibit 5.3 show that the commodity indices that report thehighest returns (i.e., energy and metals) often reported some of the higheststandard deviations (i.e., volatilities) for the period 1994–2011. The rela-tively greater return for energy- and metals-based commodity investment isconsistent with the economic argument that an underlying long-term positivereturn is more likely to exist for commodities for which supply may be con-strained. The diversification potential of combining the various sector indiceswith the S&P 500 was also reflected in Exhibit 5.3. Although the annualreturns of the S&P 500 and the S&P GSCI varied in many years, in recentyears, they generally moved in the same direction. These results again indi-cate the importance of viewing commodity performance over short subperi-ods rather than basing it strictly on its performance over the past 18 years.The results in Exhibits 5.6 through 5.9 at the sub-index level reflect similarreturn patterns at the commodity index level—varying returns, standarddeviation, and correlation over the 18 years of analysis—however, as indi-cated in Exhibit 5.8, in recent years there has been an increase in the relativecorrelation between many individual commodities and the S&P 500. Onlythe future will show if the increase in correlation between commodity andequity returns will continue; however, investors should be aware of whichcommodities are more closely linked with economic conditions and whichmay have a return process that is independent of global equity markets.
PERFORMANCE IN 2008
The relative performance of the S&P GSCI and comparison assets in2008 requires special emphasis. In 2008, global investment markets under-went a severe correction that was experienced across most traditional and
Commodities 155
alternative investment markets. Results of previous exhibits show the riskand return performance of the S&P 500, the S&P GSCI, and S&P GSCIsub-indices for 2008. In this year, the S&P GSCI, similar to the S&P 500,was impacted by the subprime crisis. Although for commodities, cumulativereturn for the S&P 500 and the S&P GSCI was negative for the wholeyear, the real story lies in halves. Results differed between the first half andthe latter half of the year. For the first six months of the year, the S&PGSCI had a positive return of 41.5 percent, while the S&P 500 reporteda negative return (−11.9 percent); in the second six months, the S&P 500had a negative return of −28.62 percent and the S&P GSCI had a negativereturn of −62.2 percent, as commodity markets responded to the decliningdrop in demand associated with declining global demand.
SPECIAL ISSUES IN COMMODITY INVESTMENT
While commodities remain a relatively small portion of most investors’portfolios, they have a demonstrated risk/return characteristic that showsthat proper deployment can enhance overall returns. As with traditionalinvestment opportunities, this asset class has continued to evolve. In thesections below, some of the more opportunistic developments are discussed.
Green Commodity Investment
There is currently a surge in investor interest in various green investmentareas. Several approaches to investing in the green economy are available.The dominant green investment strategy involves buying equities. A numberof indices track different sectors of the green equity markets. Similarly, thereare various means of investing in green commodity products, from variousbiofuel-based investments to more specific carbon-related commodity prod-ucts. (Biofuels are transportation fuels derived from non-fossilized biologicalsources.) Investment choices in the carbon economy include trading carboncredits, investment in carbon-reduction projects, and investment in corpo-rations that are developing carbon-reduction and sequestration technology.The following is a brief overview of direct commodity investments in thebiofuel area. In the commodity area, biofuel indices provide exposure toagricultural products used to create fuel in an environmentally friendly way.These indices include commodities, such as corn and sugar, which are usedin the production of ethanol. There is a range of alternatives for investingin the green commodity. Following is a list of important green indices:
Bache Commodity Green Index (BCGI): This index provides a bench-mark for green commodity investments as well as diversifiedinvestment vehicles. It offers a multifaceted approach to holding

156 POSTMODERN INVESTMENT
commodities and materials needed in the production of renewableenergy and the reduction of carbon emissions. It is composed of11 commodities that are traded on major exchanges and throughover-the-counter markets located in the United States, Canada,the United Kingdom, France, and Malaysia. The commodities thatcomprise the index are primarily traded via futures contracts, withothers being traded over-the-counter directly or through forwardcontracts.
Merrill Lynch Commodity Index (MLCX) Biofuels Index: This indexapplies the MLCX methodology to futures contracts on physi-cal commodities. Futures contracts on physical commodities thatare either biofuels themselves or feedstock commonly used in theproduction of biofuels are considered for eligibility in the index.
S&P GSCI Biofuel Index: This index reflects the total returns potentiallyavailable through an unleveraged investment in an index of fivecommodity contracts (i.e., corn, soybean oil, wheat, and sugar),with specific weights applied to each contract.
UBS Diapason Global Biofuel Index: This index covers a range ofcommodities used in the production of ethanol and biodiesel.Composed of various commodity futures, it is weighted to reflect theimportance of each individual commodity used in the productionof ethanol and biodiesel as well as the liquidity of the underlyingfutures.
S&P Global Clean Energy Index: This index includes 30 of the largestpublicly traded stocks from companies around the world involvedin clean energy. The index is composed of a diversified mix ofcompanies focusing on clean energy production and clean energyequipment and technology.
WilderHill Clean Energy Index: This index is composed of approxi-mately 54 companies that are publicly traded in the United Statesand engaged in a business or businesses that the Clean Energy IndexSelection Committee believes stand to benefit substantially from asocietal transition toward use of cleaner energy and conservation.
COMMODITIES AS AN INFLATION HEDGE
A significant part of the benefits that direct commodity investments provide issaid to evolve from unique fluctuations of commodity values as a function ofshifting economic forces. One such aspect of the commodity return patternis that commodity cash prices may benefit from periods of unexpected

Commodities 157
inflation, whereas stocks and bonds may suffer. Results from a recentanalysis, however, suggest that there is a slight positive correlation betweenthe S&P GSCI and reported Consumer Price Index (CPI): All Items (dueprimarily to the inclusion of energy and food), but results also show thatthere is almost no correlation between inflation and the S&P GSCI wheninflation is measured on CPI: All Items less food and energy. In short, withina given period there may be almost no relationship between inflation and agiven commodity.1
Commodity Total Return Attribution
Most investors do not get into the specifics of breaking down a commodityindex’s total return into various sources of that return. Although the totalreturn indicates the return that an investor can earn by holding a long-only,fully collateralized position in commodity futures, many commodity futures-based programs attempt to break the total return into three componentparts: spot return, roll return, and collateral return. The spot return issimply the price appreciation in the spot price of the commodity, which isbased on immediate delivery. Because investors in futures contracts have toroll contracts, they have to deal with contangos (i.e., longer-dated futuresare more expensive than near-month contracts) and backwardation (i.e.,longer-dated futures are cheaper). If the term structure is in backwardation,the roll yield is positive whereas it is negative when the term structure is incontango. (These concepts are discussed further in the next sections.) Thefinal source of return is the collateral yield, which is the return accruing toany margin held against a futures position, and which is normally the U.S.Treasury bill rate.
Backwardation and Contango
When the front-month futures contract price is higher than the next futurescontract price, the curve is said to be in backwardation. For investors, hereinlies the problem. For many years, firms marketing the potential benefits ofcommodities cited positive roll return as a central return to commodityinvestors. Commodity indices were even created to maximize the potentialroll return (i.e., overweight commodities in backwardation). However, asshown in Exhibit 5.10, although positive roll yield was evident primarilyin the 1990s and into the first part of 2000, since then there has notbeen a consistent positive roll. The lack of consistent backwardation hasalso impacted the profitability of commodity indices designed to focus onthe returns to roll. Investors may use the roll-return example as a case inpoint, in that some of the recently constructed commodity indices were
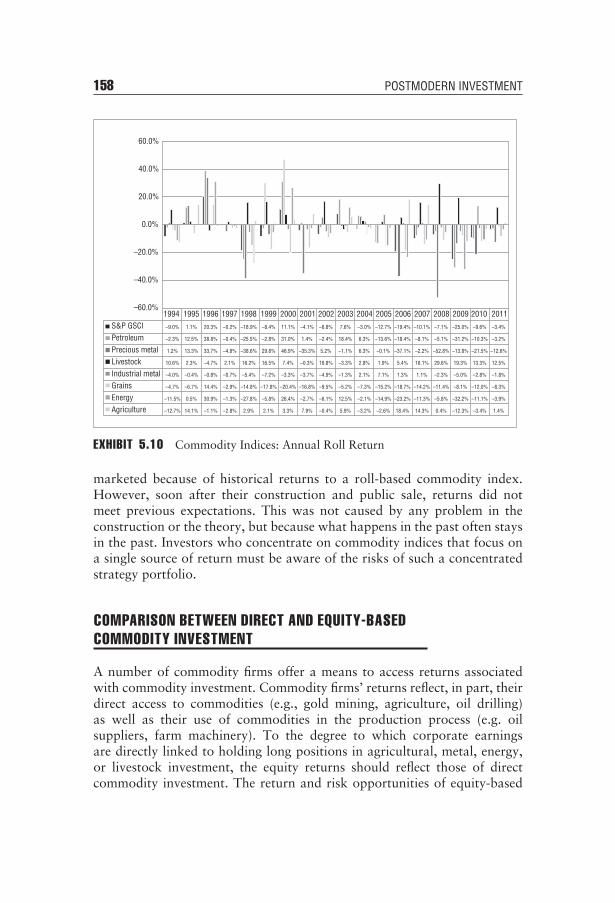
158 POSTMODERN INVESTMENT
1994 1995 1996 1997 1998 1999 2000 2001 2002 2003 2004 2005 2006 2007 2008 2009 2010 2011S&P GSCIPetroleumPrecious metalLivestockIndustrial metalGrainsEnergyAgriculture
–60.0%
–40.0%
–20.0%
0.0%
20.0%
40.0%
60.0%
–3.4%
–3.2%
–12.6%
12.5%
–1.8%
–8.3%
–3.9%
1.4%
–9.6%
–10.3%
–21.5%
13.3%
–2.8%
–12.0%
–11.1%
–3.4%
–25.0%
–31.2%
–13.8%
19.3%
–5.0%
–8.1%
–32.2%
–12.3%
–7.1%
–5.1%
–52.8%
29.6%
–2.3%
–11.4%
–5.8%
0.4%
–10.1%
–8.1%
–2.2%
16.1%
1.1%
–14.2%
–11.3%
14.3%
–19.4%
–18.4%
–37.1%
5.4%
1.3%
–18.7%
–23.2%
18.4%
–12.7%
–13.6%
–0.1%
1.9%
7.1%
–15.2%
–14.9%
–2.6%
–3.0%
6.3%
6.3%
2.8%
2.1%
–7.3%
–2.1%
–3.2%
7.6%
18.4%
–1.1%
–3.3%
–1.3%
–5.2%
12.5%
5.9%
–6.8%
–2.4%
5.2%
16.8%
–4.9%
–9.5%
–6.1%
–0.4%
–4.1%
1.4%
–35.3%
–0.3%
–3.7%
–16.8%
–2.7%
7.9%
11.1%
31.0%
46.9%
7.4%
–3.3%
–20.4%
26.4%
3.3%
–8.4%
–2.8%
29.8%
16.5%
–7.2%
–17.8%
–5.8%
2.1%
–18.9%
–25.5%
–38.6%
16.2%
–5.4%
–14.8%
–27.8%
2.9%
–0.2%
–0.4%
–4.8%
2.1%
–0.7%
–2.9%
–1.3%
–2.8%
20.3%
38.8%
33.7%
–4.7%
–0.8%
14.4%
30.9%
–1.1%
1.1%
12.5%
13.3%
2.3%
–0.4%
–6.7%
0.5%
14.1%
–9.0%
–2.3%
1.2%
10.6%
–4.0%
–4.7%
–11.5%
–12.7%
EXHIBIT 5.10 Commodity Indices: Annual Roll Return
marketed because of historical returns to a roll-based commodity index.However, soon after their construction and public sale, returns did notmeet previous expectations. This was not caused by any problem in theconstruction or the theory, but because what happens in the past often staysin the past. Investors who concentrate on commodity indices that focus ona single source of return must be aware of the risks of such a concentratedstrategy portfolio.
COMPARISON BETWEEN DIRECT AND EQUITY-BASEDCOMMODITY INVESTMENT
A number of commodity firms offer a means to access returns associatedwith commodity investment. Commodity firms’ returns reflect, in part, theirdirect access to commodities (e.g., gold mining, agriculture, oil drilling)as well as their use of commodities in the production process (e.g. oilsuppliers, farm machinery). To the degree to which corporate earningsare directly linked to holding long positions in agricultural, metal, energy,or livestock investment, the equity returns should reflect those of directcommodity investment. The return and risk opportunities of equity-based

Commodities 159
commodity-linked investment vehicles (and investment vehicles such asmutual funds, ETFs, and hedge funds, which are based on equity holdings)may also differ from their underlying commodity. For example, to the degreethat corporations who use a commodity in their production process holda number of real options based on the commodity, the value of the firmmay change, with little change in the underlying commodity price. At thesame time, if commodity price increases also increase future cash flows toa commodity-based firm or positively impact the value of its real options,equity returns of the firm may be positively related to increases in commodityprices. Stated another way, if corporate earnings are directly related to theproduction process that uses the underlying commodity as an input, thenthe degree to which price increases can be passed on to the consumer or thedegree to which price decreases can be absorbed will impact equity returns.Conversely, for firms in which the underlying commodity is one part ofthe production process, on which the profit of the firm primarily relies,there may be little relationship between firm returns and direct commodityinvestment returns.
Research has shown that direct investment in equity securities of firmsthat specialize in particular commodity sectors have moderate correlationwith the related commodity index. At the S&P GSCI level, the correlationbetween the S&P GSCI Energy Index and the S&P Energy subsector indicesis 0.52. Similarly, the correlation between the S&P GSCI Precious Metalsand Industrial Metals and the related S&P subsectors are all above 0.50. Incontrast, the correlation between the S&P 500 Agricultural Products Indexand the S&P GSCI Agricultural Index is only 0.18. Investors should alsonote that the positive correlation between energy futures-based commodityreturns and energy equity-based commodity returns is partially causedby periods of extreme commodity price movement and the underlyingmanagement process of the associated equity firm. Some commodity-basedequity firms hedge away the risk of unexpected changes in commodityprices. To the extent that the commodity-based equity firm in question hashedged unanticipated changes in the underlying commodity of the firm, onewould expect a relatively weak relationship between commodity returnsand the returns of the equity of the associated firm.
COMPARISON BETWEEN EQUITY-BASED MUTUAL FUNDAND EXCHANGE-TRADED FUND COMMODITYINVESTMENT
For the period analyzed, the correlation between the S&P GSCI andthe corresponding commodity-based mutual funds and commodity-based
160 POSTMODERN INVESTMENT
ETF/ETNs is consistently above 0.90. Results indicate that, to the degreethat the mutual fund or ETF/ETN is primarily a tracker of the underlyingindex (e.g., S&P GSCI), the return and risk are almost identical. The dif-ference in return between the non-investable index and the S&P GSCI ETFis caused by the costs of implementing the investment strategy. However,investors must be aware of the fundamental differences in the constructionof the ETF/ETN portfolios and the investment objective of the mutual fund.
A PERSONAL VIEW: ISSUES IN COMMODITYINVESTMENT
One of the central issues in commodity investment is the degree to whichcommodities offer a long-term positive expected return and the degree towhich retail investment products (e.g., ETFs) are viable approaches forgetting access to risk and return properties of commodities. There areother issues in commodity analysis including the degree to which historicalcommodity usage may not reflect current usage or that changing governmentpolicies (e.g., green investment, natural gas) may impact commodity returnand risk patterns.
Distributional Characteristics
The primary reason for commodity investment is the degree to which anindividual commodity provides unique risk and return characteristics noteasily available in other investment vehicles. Various commodity vehiclestrade in unique markets in unique forms. Moreover, these commodity vehi-cles have a dynamic element such that the instrument does not track aparticular long-only strategy. That said, the expected distributional char-acteristics of an individual commodity vehicle reflect the holdings of theunderlying product and the degree to which the commodity weights adjustto the driving factors of the portfolio (e.g., contango or backwardation).Several academic studies have addressed the additional higher moments ofsome commodities strategies, including yield-based products. Unfortunately,the conditional nature of various commodities makes any cross-sectional ortime series analysis of the historical distributional nature of a commodity asimple ‘‘prisoner’’ of the data. Researchers and reviewers are often enticedby the ‘‘more data is better’’ syndrome; that is, five years of data is good,10 years is better, 20 years is best. However, in a market partially drivenby rapidly changing technological and distribution channels as well as reg-ulatory rules, what is true of the 1980s may have little relevance for 2012.For example, many agricultural and livestock products have dramatically
Commodities 161
different seasonality characteristics in a global production market with lowtransportation costs. Many energy substitution products are driven more bychanges in regulation than by changes in product consumption.
Governance and Micromarket Structure
In many analyses of commodity markets, it is often assumed that a commod-ity is just there and can be easily accessed by a number of potential suppliers.An investor rarely sees a detailed description of the various governance orstructural holdups between the finding of a product and the delivery. Weonly note this because in our experience as part of a commodity index devel-opment team, we were surprised to find out, for example, that the amountof aluminum available for use is restricted to a limited monthly amount,regardless of the amount delivered to various warehouse sections—in short,controlled supply. There are numerous means by which supply and demandof commodities can be controlled; however, in our analysis, we found fewif any academic studies that truly understand the management or tradingprocess of any one commodity.
Other Issues
A number of other issues have not been analyzed in a manner that adequatelyreflects the actual commodity market structure. Many commodities areinternational in nature, but the effect of changing relative dollar value ondemand has not found its way into most commodity analyses. Finally, theplace of commodities in measuring worldwide inflation is a constant topicthat has been a hit-and-miss affair, if for no other reason than that inflationis measured differently in every nation. In sum, what we call inflation in theUnited States is not inflation in China.
The increased energy weighting in the S&P GSCI in the last decadehas made its return history somewhat problematic. Oil futures were notintroduced until the mid-1980s, and the high returns to the GSCI when itwas introduced were not due to an energy weighting but to the agriculturalweighting. Since the introduction of the GSCI in 1991, the energy componentof the index has increased while the agricultural component has fallen. Thishas unintended consequences for the current S&P GSCI. The increaseddemand for commodity index products as well as investor demand for newforms of financial products based on the S&P GSCI (e.g., S&P GSCI ETFs)has resulted in some elements (e.g., oil) of the S&P GSCI becoming moreexpensive in near-term contracts, and less expensive in far-term contracts.In short, historical prices and returns for commodity products may notprovide an accurate picture of current expected risks and returns. Here
162 POSTMODERN INVESTMENT
is the good and bad news: Most new commodity products are designed(correctly) to meet current economic conditions and investor demand (e.g.,green commodity indices and long/short commodity indices) as well as moredynamic modeling of portfolio construction. Unfortunately, these productsare created not only with a view to the future but with a nod to the past.The backfill bias in any new commodity index requires the creation ofan index that not only works for the present but has worked well in thepast. In brief, the business model of the firm has to be aligned with theperformance of the index and its potential customers. The dynamic elementof new commodity indices and products results in investors being requiredto have a fuller understanding of the underlying return drivers of commodityreturns as well as the business issues driving the creation of the product.Although we fully accept the argument that commodities reflect a uniqueand separate asset class, and as such, meaningful indices can be developedleading to more rational asset allocation decisions, we are also mindfulthat a commodity product or platform is in fact a structured product inwhich the individual business model ultimately determines performanceand risks.
WHAT EVERY INVESTOR SHOULD KNOW
Today, commodities are hot. It is somewhat surprising that while the impor-tance of commodities in the day-to-day consumer and corporate world iswithout question, its place in investors’ portfolios remains a bit of a mys-tery. In this chapter we focused on the growth of commodities as aninvestment vehicle either as a stand-alone real investment or through anindirect investment via equity in publicly traded commodity-based corpora-tions. Hopefully, we have removed some of the mystery of commodities byproviding some historical context. But even so, the investor must come torealize that commodity markets are in a constant state of evolution.
■ For the Individual Investor: Stay Away. Historically, direct commodityinvestment has been a minor part of an investor’s asset allocation deci-sion. In contrast, indirect investments (e.g., equity or debt ownership offirms specializing in direct commodity production) remain the princi-pal means by which many investors obtain exposure to this asset class.However, in recent years the number of long-only investable commodityindices and commodity-linked investments has increased dramatically.
Commodities 163
While certain market environments (e.g., commodity-based price infla-tion) may make direct commodity investment a worthwhile idea, forthe most part individual investors should go elsewhere. Many futures-based commodities do not fit well into a long-run positive expectedreturn environment. For institutional investors who have the resourcesto hire individuals to actively trade commodities both long and short,investment may make sense, but for everyone else we suggest a rethink.
■ Commodities Are Not Automatic Inflation Hedges. Often we seekcommodity investment as a means to protect against inflation. Firstan investor better get a fix on what they mean by inflation. Manycommodities are not directly included in most published measures ofinflation and often what we feel as inflation (food and energy) may ormay not be included in the reported numbers. In short, commoditiesmay protect an investor against certain types of price increases but notnecessarily in price increases measures by government reports of CPI. Ifyou want an inflation hedge, go elsewhere.
■ Don’t Believe the Evening News: According to the pundits, commodityinvesting is inherently evil and is akin to speculation, which for manyis akin to gambling. Investors who wish to invest in a commodity-based product should realize that each product has its own uniquecharacteristics, but there is little evidence that holding long-only futurescontracts fundamentally distorts the markets. Remember, for everyfutures contract held long, there is one held short. For the most part,this sounds like offering an offset to investors who wants to go short forcommercial reasons or for their own trading purposes. Investors have alot of reasons not to invest in commodities, but feeling guilty for doingso is not one of them.
MYTHS AND MISCONCEPTIONS OF COMMODITYINVESTMENT
Perhaps since commodity investment has been historically available toinvestors through both direct ownership in cash as well as through equityownership in commodity firms, there exists a large amount of potentialconfusion as to the risk and return characteristics of commodity investmentsand their place in investors’ portfolios. Of course, in the world of the blind,the one-eyed person is king. In a world of uncertainty and confusion aboutthe risk and returns of various commodity investments, acceptable mythsmay often outperform unacceptable facts.

164 POSTMODERN INVESTMENT
Myth 5.1: One Commodity Index Is Like the Other
Today, commodity indices attempt to replicate the return available toholding long positions in agricultural, metal, energy, or livestock investment.Since returns on a fully invested contract reflect the investment in theunderlying deliverable, commodity indices based on the returns of futurecontracts offer an efficient means to obtain commodity exposure. There area number of commodity indices currently on the market, however, for theequity market where the S&P 500 is king, in the commodity index worldthe S&P GSCI rules. Yet, just because it rules does not mean it should reignor that other index-based commodity products may not offer alternativesolutions. In recent years, a number of additional commodity indices havebeen introduced (e.g., Deutsche Bank), which have various degrees of a moreactive component in determining the allocation across various commodities.Commodity indices may differ in a number of ways as well, includingthe commodities that make up the index, the weightings of the individualcommodities, and a number of operational trading issues (e.g., roll period,rebalancing, etc.). Whatever one says about one commodity-based indexproduct may not be true about another. While there may be few mythsabout their relative performances, the fact that they all purport to offercommodity returns under different investing procedures will certainly leadto misconceptions.
Myth 5.2: Commodities Provide a Natural Diversifierto Traditional Assets (Stocks and Bonds)
Here is the good news and here is the bad news: The concept of a naturaldiversifier often refers to the idea that the return movement of a particularinvestment will consistently offer positive (or negative) returns when theother asset performs poorly (or well). The problem is that because manycommodities do not have a long-term positive expected rate of return (exceptfor certain commodities that have supply constraint, as discussed previouslyand for which returns move more randomly above and below zero) thenatural return may be regarded as near zero. An analysis could reveal alow correlation between the commodity and a stock or bonds return simplybecause the commodity has no consistent return pattern. The commoditycould be called a diversifier in the same way a U.S. Treasury bond would beidentified—a low expected return and no correlation with risky assets. Werecommend carefully considering a zero expected return asset as a naturaldiversifier to any other asset.

Commodities 165
Myth 5.3: Commodities Do Not Have to Be Part of anInvestor’s Portfolio If One Holds Commodity Stocks
For many investors, holding equity in a commodity-based publicly tradedfirm is regarded as an alternative to direct commodity investment. Althoughthe cash flows of commodity-linked firms are tied to the commodities theyproduce, research shows only moderate to low correlation of a commodityfirm’s equity returns and the stand-alone return of its underlying commodity.This is expected. Corporate earnings are impacted by a number of factors(e.g., hedging cash flows and operational risks) that do not directly impactthe underlying commodity prices. Moreover, depending on the constructionof the commodity index, each commodity-based index product may havesources of return (e.g., contango and backwardation) that are generally notdirectly accessible through equity investment in similar commodity-basedpublicly traded firms. In rare cases, when the commodity firm is a directpass-through for the commodity and for which the commodity price isabove the firms’ breakeven, such that the increase in commodity prices leadsto a direct increase in firm cash flow, equity in a commodity firm may bea substitute for the underlying commodity. In most cases, one thing is notlike the other.
Myth 5.4: Commodity Indices Are Similarto Equity Indices
An index is an index is an index? Unfortunately, no. In fact, commodityindices may be regarded as derivative products to the extent that theyare constructed from investment primarily in futures contracts. Futurescontracts are a zero-sum game as discussed in the CTA section. So one mayconclude that long-bias commodity indices, unlike equity indices, may notbe expected to offer a unique positive expected return similar to investmentin an equity index. In contrast, the return to investing in commodity indicesmay come from other return forms (e.g., roll return, active management inthe contract design) as well as the maturity of the futures contracts held.To the degree that they are the same, long-dated-based (i.e., long maturity)commodity indices may have performance more similar to commodity-based equity firms, because for those contracts, the underlying supply is stillwaiting to be made available, such that future changes in price will affectboth the index and a related firm. In contrast, the short-term maturity-basedcommodity indices may have performance more similar to firms that areinvolved in short-term shipping or storage.

166 POSTMODERN INVESTMENT
Myth 5.5: Commodity Investment Is Speculation
In recent years, there have been concerns that certain financial investmentin various commodity products was an improper use of commodities. Ingeneral, there is little evidence that the demand for commodities via var-ious commodity financial products, including ETFs, have fundamentallyimpacted commodity markets. However, even more important is the factthat simple ownership of a commodity is not indicative of a pure specu-lator. Speculation is a loaded word. Although it is normally referred to inthe context of individuals who trade futures contracts—not commercialhedgers—individuals or institutions who use commodity-based products asa means to diversify the risk of their asset portfolios may or may not beregarded as speculators.
CHAPTER 6Private Equity
Its True Value?
The first private equity (PE) transaction was probably initiated with theadvancement of seed for some percentage of a crop to be grown, or
some similar event. At its modern core, PE is a broad category that includesa range of direct investments that are made generally through structuredgeneral-partner and limited-partner governance vehicles. In past chapters,we have described the evolution of the modern investment managementbusiness and traced its origins to Markowitz and his work some 60 yearsago. The inception of modern PE can be traced back to this period as well.While there is no single definition of PE, for many, modern PE began inthe mid-1940s (e.g., American Research and Development Corporation andJ.H. Whitney & Co.). However, it was not until the 1960s that PE beganto be commonly formed as limited partnerships, consisting of a generalmanaging partner and passive limited partners, who provide much of thecapital. Also introduced was the compensation structure for the generalpartner (i.e., an annual management fee of 1 to 2 percent and a performancefee typically representing up to 20 percent of the profits).
As in any maturing asset class, the road to the current forms anduse of PE has not been smooth. The 1980s gave rise to management andleverage buyouts and the terms corporate raiders and hostile takeovers. Inthe 1980s, it was estimated that there were nearly 2,000 leveraged buyoutsvalued in excess of USD 250 million. However, the leverage buyout formof PE was not destined to become the dominant form. The market crash of1987 coupled with the collapse of Drexel Burnham Lambert—the leveragebuyout model’s primary architect—and the ensuing extraordinary rise ininterest rates led to PE firms refocusing from early stage investments (e.g.,venture capital) to more advanced, mature companies (e.g., PE).
Coincident with the growth of the U.S. economy following the economicslowdown in the late 1980s and early 1990s, the PE industry again began
167
168 POSTMODERN INVESTMENT
to grow, from approximately USD 20.8 billion of investor commitmentsin 1992 to USD 305.7 billion in 2000. However, just as the market crashin 1987 and the following economic slowdown hampered the then venturecapital and PE industries, the collapse of the Internet bubble in early2000 again forced retrenchment in the industry. It has been estimated thatinvestment monies in the venture capital industry declined to about half oftheir all-time high by 2003.
In some ways, the 2000 dot-com bubble set the stage for the birth ofthe modern PE industry. For many PE firms, the collapse of certain partsof the industry resulted in new opportunities for those that survived. U.S.economic policy immediately changed, both to provide lower interest ratesand to stimulate economic growth. Many PE and venture capital fundstook advantage of these lower rates and improved economic conditions toincrease buyout and initial investment. In addition, the changing regulatoryenvironment forced increased costs on existing and developing firms. Thesechanges encouraged some firms to go private and increased the need formature management supervision of smaller nonpublic firms. The collapse ofparts of the industry in the early part of the decade led to increased interestin the development of the secondary transaction market, as individualssought to reduce their exposures in certain industries. Finally, the improvedequity market of the mid-decade led to additional means for PE investorsto capture the increased worth of their investments, including taking theprivate firm public through an initial public offering (IPO). The developmentof secondary and public markets also helped in the development of publiclylisted PE firms and PE funds. Unfortunately, the development of these newinvestment and exit opportunities hit a wall similar to the one the industryhit in 1987. The worsening market conditions in 2007 and the credit freezeof October 2008 resulted in increased costs of financing, reduced expectedcash flows to any new deal, and the collapse of the IPO market as an exitopportunity for existing deals.
The changing nature of PE, as well as the changing economic patternsthat led to its historical rise and fall over the past 60 years, has led to astruggle with PE’s place in differing portfolios. In large part this struggleis about the proper definition of PE and, as such, determining its true riskand reward properties. For PE, perhaps more than for any other investmentasset class, past is not prologue. This is extremely difficult in an investmentindustry for which past performance is often a benchmark for how investorsregard or determine future return and risk opportunities. As discussed inthis chapter, PE occupies a very broad range of strategies and possible riskand return alternatives. In addition, if there is a common theme, that themelies in the almost total lack of transparency in how holdings are valued and,as a consequence, what investors will receive and when. In a previous book,
Private Equity 169
The New Science of Asset Allocation, we pointed out that on a quarter-to-quarter and year-to-year basis, investors receive performance numbersbased on the subjective valuation of the PE sponsor. We also discussed thefact that there is almost no way for an investor to conduct independentverification or analysis of these returns, and that the true economic valueof this investment could not be known until a particular fund had madeits final distribution. This final distribution is often five to seven yearsinto the future. As a consequence, a PE investment requires a tremendousleap of faith by investors and, even more so than other strategies, a keenappreciation of the sponsor’s business model and long-term track record.
More important, the asset allocation decision is by definition blurredbecause the subjective accounting returns during the course of the investmentmay differ wildly from the actual returns. Large U.S. public pension fundshave witnessed their internal actuarial assumptions turned on their headbecause the expected return of venture capital investments within theirportfolios did not live up to their billing. Yet this has not stopped theselarger public funds from increasing their allocations to PE in what weperceive as a vain attempt to use the illusion of historical performance tooffset the 7.5 to 8.0 percent actuarial assumption required to keep taxesfrom rising or benefits from decreasing. For the most part, public pensionplans make asset allocation decisions based on the historical performanceof asset classes. These pension plans then have actuarial assumptions thatprovide a basis for the expected growth of the pension plan. The stategovernment’s annual contributions and workers’ benefits are tied to thisassumption, irrespective of the actual return of the pension plan. Thus,there is a bias to move toward asset classes that have historically showngreater returns. Such an approach is completely counter to the Securitiesand Exchange Commission admonishment against using past performanceas the basis for an investment decision.
The business model and long-term track record, however, are just thesurface of the story. Many PE firms have multiple vehicles, often totaling50 or more for the larger funds or institutions. It is not unusual for theperformance of a successful fund to be put forward as representative ofthe firm’s body of work while ignoring the less-than-stellar performanceof others within the firm’s family of funds. It is also not unusual to findthat the professionals responsible for the returns of those outperformingfunds are no longer associated with the firm and have moved on to starttheir own firms or to find more financially lucrative opportunities. Thisis particularly true within large financial institutions. Similarly, it is notunusual for firms that have done well in one area of the economy to moveinto the next hot area without a substantial grounding in the economics orbusiness strategies of that area. By example, the economics of health care
170 POSTMODERN INVESTMENT
(a broad category with many subparts) and the economics of technology(again, with its different subparts) are fundamentally different and requiredifferent skill sets.
A recent meeting in London revealed that a number of the largerand more reputable firms share the concern that their industry is movingaway from providing fair information, transparency, and returns to theirinvestors into one of asset gathering. The chief concern is that more moneyis being raised because of the historical returns of this asset class than canbe meaningfully deployed going forward. Moreover, there is concern thatasset gatherers, rather than being true PE firms, behave like remoras—fishthat attach themselves to larger hosts for safety and transport while feedingon the hosts’ leftover fragments—and, as a result, are severely hurting theindustry, as their primary business model is simply to buy the deals ofothers while charging fees that are inconsistent with their body of work.These firms are typically characterized as ‘‘lifestyle’’ firms, in that theirtrue business is to support the current lifestyle of a few partners andnot necessarily to provide significant returns for their clients. Typically,these firms rarely generate investment returns greater than two times theinvestment capital on any single investment and in most instances the totalportfolio of investments after fees is breakeven at best; current assets undermanagement rarely exceed USD 500 million; and there is a new set of limitedpartners within each successive fund, because limited partners exit as soonas they are able. In contrast, firms such as Pantheon Financial Ltd—afee-based investment manager out of London—and Alternative Asset RiskManagement (AARM)—a fee-based firm out of Boston specializing in theevaluation and measurement of PE risk—are working to bring transparencyand structure to the business, yet they seem to be small voices against thescreams of past performance, no matter how dicey that performance.Beyond attempting to interject additional transparency into this asset class,the common denominator of these firms is that they are fee based and thushave aligned their interests with those of their clients.
The issue of value added is particularly troublesome in the PE fund offunds business. The business model of charging a 2 percent managementfee and an incentive fee is all but dead given the lack of returns thatthis model has provided clients over the past decade. At a recent tradeseminar called PartnerConnect, participants estimated that of the 400 orso PE firms in existence today, 200 have dead business models, and theremaining are struggling to survive. Of particular interest is that, of thosethat are struggling, most are tied to banks or private wealth organizationsin which the party responsible for due diligence and advising is also themoney manager. This is not a prescription for impartial analysis, whichprobably explains why they have not joined their brethren in death. Thefuture model for this group has to be one of the following: (1) managed
Private Equity 171
accounts, a model that is more aligned to customizing to clients’ risk andreward needs but requires a great deal of technical and professional supportnot heretofore required in this area; (2) specialized fund of funds withspecialist alpha focus, which again requires a great deal of technical andprofessional support not previously seen in this segment of the industry; or(3) coinvestment funds, for which there is no additional layer of fees, butthis requires work in deal negotiation and the ability to be something morethan a remora to the host PE specialist.
As this chapter searches for transparency and fairness for the investorin PE, it first looks to definitions. What is PE, and what are its differentsubclasses? It then examines the different subclasses and their associatedindices in determining sources of return and risk. Next, it provides certainobservations relating to the performance of PE in different portfolios andhow an investor could possibly use this asset class. Finally, it exploreselements of due diligence and some of the myths and misconceptionssurrounding investments in this area.
In this chapter, the risk and return characteristics of PE investmentsare reviewed, as well as the risk and return implications of adding PEto purely traditional stock and bond portfolios and portfolios composedof stocks, bonds, and various alternative investments. The results suggestthat although PE investments differ widely, traditional PE indices may bebetter viewed as return-enhancement vehicles to traditional equity-biasedportfolios. Although certain PE investments may provide diversification andreturn benefits, its general comovement with other asset classes suggeststhat the impact of adding PE to an existing stock and bond portfolio orto an existing mixed traditional (i.e., stock and bond) and alternative (i.e.,hedge fund, commodity trading advisor [CTA], real estate, and commodity)portfolio must be considered carefully. It is also important to point outthat the sector has undergone dramatic transformations in recent years.For example, several PE firms have undertaken public offerings, with theirperformance over time potentially reflecting the performance of other publicequity-oriented vehicles.
INVESTING IN PRIVATE EQUITY
PE is often viewed as ownership in private or nonpublicly traded business.These ownership stakes may take various forms (e.g., proprietorship, part-nership, and other corporate or legal entities). PE is viewed by some asincluding the entire range of nonpublic investments, from the early stagethrough the final stage of investment. For others, PE is limited to thatsection of the nonpublic investment process in which capital is soon tobe raised via public offering. Often PE is discussed within various distinct
172 POSTMODERN INVESTMENT
stages or forms of investment. These include angel investors (generally seedcapital), venture capital (i.e., start-up and first stage), leveraged buyouts,mezzanine investing, and distressed debt investing (i.e., late-stage invest-ing). The long-term goal of many PE investments is to have the enterprisesold to other investors through private sales, mergers, or IPOs. Investorsin PE should also be aware that the nonpublic nature of the PE holdingsmakes valuation of the underlying shares difficult. Valuations can be verysubjective, with an investor having no means of comparison. Often thebasis for valuation is either accounting (e.g., risk-adjusted cash flows) orvarious relative value assessments (e.g., comparisons to existing publiclytraded firms). All of these approaches include a large discretionary factor onthose providing the valuation assessments. In addition, the level of investorcontrol has a direct effect on relative value among the various ownershipgroups. We will discuss each of these sectors as well as available indices andinvestment products.1
Angel Investors
Angel investing is often referred to as capital that is raised at the initial stageof company creation. This capital is often provided even before the initialproduct or organization structure is finalized. Given the lack of informationas to the future profitability of such ventures, the expected risk and hence,expected return, on such angel investing is high. Moreover, future dilutionissues, as additional capital is required, form a vital part of the initialoperating agreements.
Venture Capital
Venture capital involves the financing of start-up companies that often donot have a sufficient historical track record to be able to raise capital fromtraditional outside sources. Often these companies lack tangible assets andmay not be expected to generate positive earnings in the near term. Venturecapitalists often finance these companies by acquiring senior equity stakes,with the expectation that these companies will ultimately be acquiredby other PE firms that focus on late-stage opportunities, acquired bycompetitors, or acquired by public-offering candidates. Many investors andindustry observers have expressed concern about the potential returns andrisks relating to venture capital in the technology sector. These investorshave noted a second Internet bubble, in which valuations are more in linewith hopes and dreams than any real economic activity. In fact, it hasrecently come to light that venture capital investors in this area discouragefirms from having or reporting revenues, because valuations then becometied to a tangible basis rather than to the expectations of their promoters.
Private Equity 173
Leveraged Buyouts
Leveraged buyouts (LBOs) are a way to take a publicly traded companyprivate. Buyouts of companies in which control is concentrated in the handsof management are often called management buyouts. The purchase of theoutstanding equity is usually financed with bonds issued by the corporationor loans from banks, which are often secured by the assets or cash flows ofthe acquired or the acquiring company.
Mezzanine and Distressed Debt Investing
Mezzanine and distressed debt investing can take various forms and servevarious purposes. The distinctions between mezzanine and distressed debtcan often become blurred. For example, mezzanine debt is often used in anLBO; however, the mezzanine debt can become distressed debt if the com-pany’s financial situation deteriorates following the LBO. Notwithstandingsuch a development, mezzanine debt can offer some portfolio enhancementfeatures not found in other areas of PE (as suggested by the results inExhibits 6.6 through 6.9). Mezzanine investors, such as Kohlberg KravisRoberts, have shown that the standard deviation of private equity returnscan be lowered by including this asset class within an overall allocation.This lowered risk experience is the result of three factors. First, mezzanineinvesting has been shown to have a lower loss ratio than other PE invest-ments. Second, interest earned on mezzanine investing has historically beenin the mid to high teens, higher than returns experienced by private equityover the past ten years or so. Finally, an indirect yet substantial benefit isthat within mezzanine investing the ‘‘J’’ curve effect is mitigated becausecash flows commence at the onset of an investment.
Private Investment in Public Equity
Although technically not a PE strategy in the strictest sense, it is worthmentioning private investment in public equity (PIPE). In PIPE investments,capital may be raised by direct placement of security issues. There are twoforms of PIPE: traditional and structured. Traditional PIPEs use common orpreferred equity, whereas structured PIPEs issue convertible debt. This typeof financing gained some prominence during the financial crisis, as invest-ment banking firms such as Morgan Stanley, Goldman Sachs, and Citigroupused structured preferred equity from investors Mitsubishi, Warren Buffett,and Prince Alwaleed bin Talal, respectively, to shore up their balance sheets.
As noted earlier, PE is a broad term for any type of equity investmentin a company that is generally not listed on a stock exchange. Holders of PEinvestments will typically realize value in the form of capital gains through
174 POSTMODERN INVESTMENT
a sale to, or merger with, a competitor in the same sector, a sale to anotherPE investor, or an eventual flotation on the stock market.
PE is generally regarded as an investment that offers investors theopportunity to achieve superior long-term returns compared to those oftraditional stock and bond investment vehicles. The long-term returns of PEare said to provide a premium over the performance of public equities. Thispremium is largely caused by PE’s participation in privately held companies,which are inaccessible to traditional investors. The basis for returns to PE issimilar to that for traditional stock and bond investment—that is, a claimon long-term earnings, a return premium for providing capital to an illiquidand risky investment, and a positive alpha generated from unique tradingstrategies or private information. However, private investment vehicles havea net asset value that is often determined as an internal appraisal value, notby a public market. Actual returns are often measured as an internal rateof return (IRR) or cash disbursements relative to capital investment. Thesecash flows may be lower at the initial stage than at later stages of the capitalinvestment (known as the J-curve effect). It is also important to point outthat private investors are often active participants in the management oftheir investments.
PRIVATE EQUITY STYLES AND BENCHMARKS
There is a range of additional PE indices available. Empirical results maydiffer based on which performance measures are used. An example of anon-investable PE index is one published by Cambridge Associates (CA).The CA U.S. Venture Capital Index is based on IRR data compiled onfunds representing more than three-fourths of venture capital dollars raisedsince 1981, and nearly two-thirds of leveraged buyout, subordinated debt,and special-situation partnerships since 1986. Although this index providesinformation on how the PE sectors are performing, an investor cannotdirectly place monies in this index and realize the reported returns. Anincreasing number of investable PE indices are being published, includingthose by LPX GmbH (LPX) and Standard & Poor’s (S&P).
The characteristics of the non-investable and investable PE indices usedin this chapter are as follows:
■ CA LLC U.S. Private Equity Index: An end-to-end calculation based ondata compiled from 944 U.S. PE funds (i.e., buyout, growth equity, PE,and energy and mezzanine funds), including fully liquidated partner-ships, formed between 1986 and 2011. Pooled end-to-end return, netof fees, expenses, and carried interest.
Private Equity 175
■ CA LLC U.S. Venture Capital Index: Based on data compiled from1,334 U.S. venture capital funds, including fully liquidated partnerships,formed between 1981 and 2010. Internal rates of return are net of fees,expenses, and carried interest. Vintage-year funds formed since 2009are too young to have produced meaningful returns.
■ Private Equity Index (PE Index): Based on monthly returns that arebased on the S&P Private Equity Index from December 2003 onward.For the period prior to December 2003, firms which were listed in theJune 2007 report were used to create an equal weighted monthly returnsprivate equity index back to 1991.
■ LPX50: The LPX50 is a global index consisting of the 50 largest liquidlisted private equity (LPE) companies covered by LPX.
■ LPX Major Market: The LPX Major Market represents the most activelytraded LPE companies covered by LPX.
■ LPX Buyout: The LPX Buyout represents the most actively traded LPEcompanies covered by LPX whose business model consists mainly inthe appropriation of buyout capital or in the investment in such funds.
■ LPX Composite: The LPX Composite is a broad global LPE indexwhose number of constituents is not limited.
■ LPX Europe: The LPX Europe represents the most actively traded LPEcompanies covered by LPX that are listed on a European exchange.
■ LPX America: The LPX America represents the most actively tradedLPE companies covered by LPX that are listed on an exchange in NorthAmerica.
■ LPX Venture: The LPX Venture represents the most actively tradedLPE companies covered by LPX whose core business lays mainly inthe provision of venture capital or in the investment in venture capitalfunds.
■ LPX Direct: The LPX Direct represents the largest liquid LPE companiescovered by LPX that mainly pursue a direct PE investment strategy. AnLPE company is not an eligible candidate for the LPX Direct if the sumof the indirect PE investment portfolio and the valuation of the PE fundmanagement exceed 20 percent of the net assets of the company.
■ LPX Indirect: The LPX Indirect represents the largest liquid LPE com-panies covered by LPX that mainly pursue an indirect PE investmentstrategy.
■ LPX UK: The LPX UK represents the largest liquid LPE companiescovered by LPX that are listed on an exchange in the United Kingdom.
■ LPX Mezzanine: The LPX Mezzanine represents the most activelytraded LPE companies covered by LPX whose business model consistsmainly in the appropriation of mezzanine capital or in the investmentin such funds.
176 POSTMODERN INVESTMENT
BASIC SOURCES OF RISK AND RETURN
In recent years, traditional forms of PE investment (e.g., IPOs, secondarysales) have met resistance in the difficult global credit and equity mar-kets. As a result, many PE firms are struggling to justify their existenceagainst accepted benchmarks of performance—that is, cash flows on initialinvestment and measured internal rates of return. PE returns are oftenunique to the time of investment and the form of the investment vehicle.Once a firm puts investor money to work, it often does not have theability to reallocate out of existing investments into new investments. Ifmarket conditions change and new investment opportunities are available,new funding is often required for a new investment vehicle. Two PE fundsfrom the same family may perform differently over time based merely ontheir date of inception and the unique holdings of each fund based on theinvestment opportunities unique to that period.
PERFORMANCE: FACT AND FICTION
For some, the performance of PE is based primarily on the unique businessopportunities corresponding to the ability of discretionary managers to selectlong-term investment opportunities whose performance may not be directlyrelated to general market factors. For others, the underlying ability of PEto meet performance goals is partially dependent on the underlying strengthof the economy as reflected in equity prices. To these latter investors, theimportant part of the term private equity is the equity and not the private.One of the principal problems in the analysis of PE is the quality of thedata, which supposedly reflects the changing value of a PE investment. Inthe following sections, we provide evidence not only on the stand-alonerisks of various public PE investments, but on the interrelationships of thepublic PE indices and various traditional (e.g., equity and fixed-incomemarket) and alternative asset classes using an index of publicly tradedequity firms. As in previous chapters, we examine these markets over abroad time period, shorter time intervals (e.g., annual), and their relativeperformance in extreme market conditions. Public PE indices are shownto have a high correlation with the comparison equity-based traditionaland alternative investments and therefore may be regarded as more of areturn enhancer than a risk diversifier to equity-based portfolios. The levelof return enhancement, of course, partially depends on the level of PErisk and expected returns. Results show that in periods of extreme equitymarket returns most publicly traded PE firms have similar return patterns;that is, falling in down equity markets and providing positive returns in

Private Equity 177
up equity markets. Again, to some this is expected, but investors may notwish take return and risk performance from extended time frames or frompublic PE performance as a basis for PE investment. There remains anunanswered question: the performance of publicly traded PE firms may notnecessarily reflect the performance of accounting-based PE funds. At theend, PE should provide the potential for unique return opportunities basednot on systematic return opportunities with the general equity market buton nonsystematic firm-based opportunities. Given the randomness of suchfirm success, it is not surprising that much of PE captures overall genericmarket returns patterns in contrast to the ‘‘black swan’’ of individual firmsuccess. At the end, investors may have to live with some issues simply beingunanswered.
RETURN AND RISK CHARACTERISTICS
In this section, we review the performance of a self-constructed PE index2
with a range of traditional stock and bond indices as well as a numberof alternative investment indices (e.g., real estate, commodities, CTAs, andhedge funds) over the period 1994–2011. In later sections, we focus onthe index’s performance in various subperiods. For this period, as shown inExhibit 6.1, the PE index exhibited higher annualized standard deviation,or volatility (28.1 percent), than that of the S&P 500 (15.7 percent).Depending on the background of the investor, this may be surprising. Manyinvestors who are familiar with IRR-based PE returns have become familiarwith reported PE volatility near or below that of the S&P 500. For otherinvestors, PE evokes feelings of high return expectations, as well as riskabove that seen in the public equity markets. Even at the individual publiclytraded PE firm, research3 has shown that the volatility of the average publiclytraded PE firm has volatility similar to that of the stocks in the Dow JonesIndustrial Average. Over the period of analysis, the PE index also reporteda higher annualized total return (8.0 percent) than that of the S&P 500(7.7 percent). The lower information ratio (i.e., return-to-risk ratio) of thePE index relative to the S&P 500 may not reflect either the return-to-risktrade-off in other periods or the current expected return-to-risk trade-off.For example, as shown in Exhibit 6.1, for the period analyzed, the PEindex has a relatively high correlation (0.74) with the S&P 500 and a lowcorrelation (−0.03) with the BarCap U.S. Aggregate Index. The relativelyhigh correlation of PE index with stock returns may lead investors toquestion PE as a primary means of diversification for equity-dominatedportfolios.
The relatively high correlation between the PE index and a range offinancial assets (e.g., real estate) may indicate that a portfolio of PE may
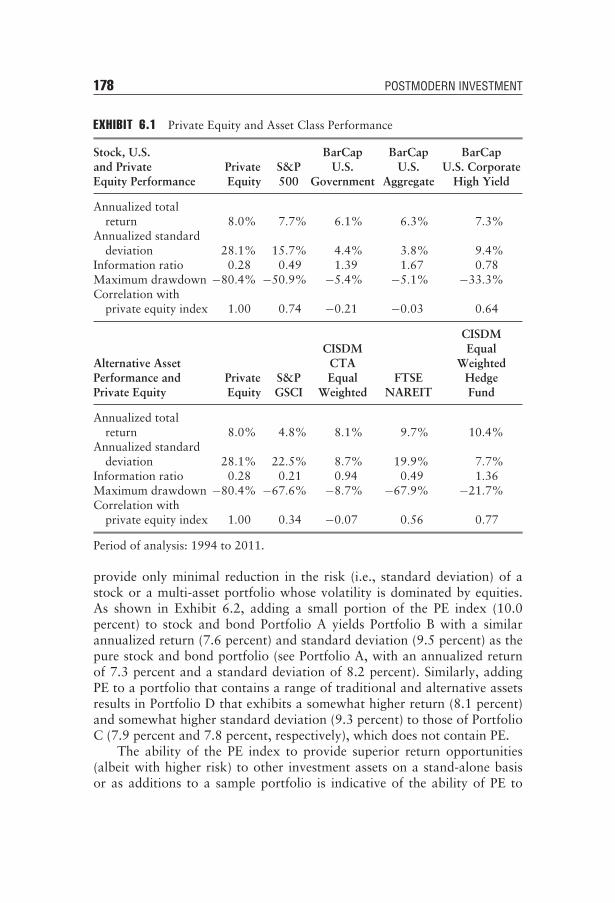
178 POSTMODERN INVESTMENT
EXHIBIT 6.1 Private Equity and Asset Class Performance
Stock, U.S.and PrivateEquity Performance
PrivateEquity
S&P500
BarCapU.S.
Government
BarCapU.S.
Aggregate
BarCapU.S. Corporate
High Yield
Annualized totalreturn 8.0% 7.7% 6.1% 6.3% 7.3%
Annualized standarddeviation 28.1% 15.7% 4.4% 3.8% 9.4%
Information ratio 0.28 0.49 1.39 1.67 0.78Maximum drawdown −80.4% −50.9% −5.4% −5.1% −33.3%Correlation with
private equity index 1.00 0.74 −0.21 −0.03 0.64
Alternative AssetPerformance andPrivate Equity
PrivateEquity
S&PGSCI
CISDMCTAEqual
WeightedFTSE
NAREIT
CISDMEqual
WeightedHedgeFund
Annualized totalreturn 8.0% 4.8% 8.1% 9.7% 10.4%
Annualized standarddeviation 28.1% 22.5% 8.7% 19.9% 7.7%
Information ratio 0.28 0.21 0.94 0.49 1.36Maximum drawdown −80.4% −67.6% −8.7% −67.9% −21.7%Correlation with
private equity index 1.00 0.34 −0.07 0.56 0.77
Period of analysis: 1994 to 2011.
provide only minimal reduction in the risk (i.e., standard deviation) of astock or a multi-asset portfolio whose volatility is dominated by equities.As shown in Exhibit 6.2, adding a small portion of the PE index (10.0percent) to stock and bond Portfolio A yields Portfolio B with a similarannualized return (7.6 percent) and standard deviation (9.5 percent) as thepure stock and bond portfolio (see Portfolio A, with an annualized returnof 7.3 percent and a standard deviation of 8.2 percent). Similarly, addingPE to a portfolio that contains a range of traditional and alternative assetsresults in Portfolio D that exhibits a somewhat higher return (8.1 percent)and somewhat higher standard deviation (9.3 percent) to those of PortfolioC (7.9 percent and 7.8 percent, respectively), which does not contain PE.
The ability of the PE index to provide superior return opportunities(albeit with higher risk) to other investment assets on a stand-alone basisor as additions to a sample portfolio is indicative of the ability of PE to

Private Equity 179
EXHIBIT 6.2 Private Equity and Multi-Asset Class Portfolio Performance
Portfolios A B C D
Annualized returns 7.3% 7.6% 7.9% 8.1%Standard deviation 8.2% 9.5% 7.8% 9.3%Information ratio 0.90 0.80 1.01 0.87Maximum drawdown −27.1% −35.2% −28.7% −36.4%Correlation with private
equity 0.70 0.74Portfolio A Equal weights S&P 500 and BarCap U.S. AggregatePortfolio B 90% Portfolio A and 10% private equityPortfolio C 75% Portfolio A and 25% CTA/commodities/real
estate/hedge fundsPortfolio D 90% Portfolio C and 10% private equity
Period of analysis: 1994 to 2011.
S&P PE
LPX 50
LPX Composite
LPX Major Market
LPX Europe
LPX Mezzanine
LPX Buyout
LPX Private Equity Venture
Annualized Standard Deviation
LPX Direct
LPX America
LPXUK
–5.0%
–4.0%
–3.0%
–2.0%
–1.0%
0.0%
1.0%
2.0%
3.0%
27.0% 28.0% 29.0% 30.0% 31.0% 32.0% 33.0% 34.0%
Annu
aliz
edRe
turn
EXHIBIT 6.3 Private Equity Index PerformancePeriod of analysis: 2004 to 2011.
provide the potential for a positive return-to-risk trade-off over a lengthyperiod of time. However, the PE index used in this analysis is only one ofseveral composite PE indices. Other PE indices may provide different perfor-mance results. Exhibit 6.3 shows the return and risk performance over the2004–2011 period for various PE trading subindices, which differ from thecomposite PE index. Equally important, results in Exhibits 6.8 and 6.9 illus-trate that individual PE indices report a relatively high correlation with theS&P 500, and a relatively low correlation with the BarCap U.S. Aggregate.
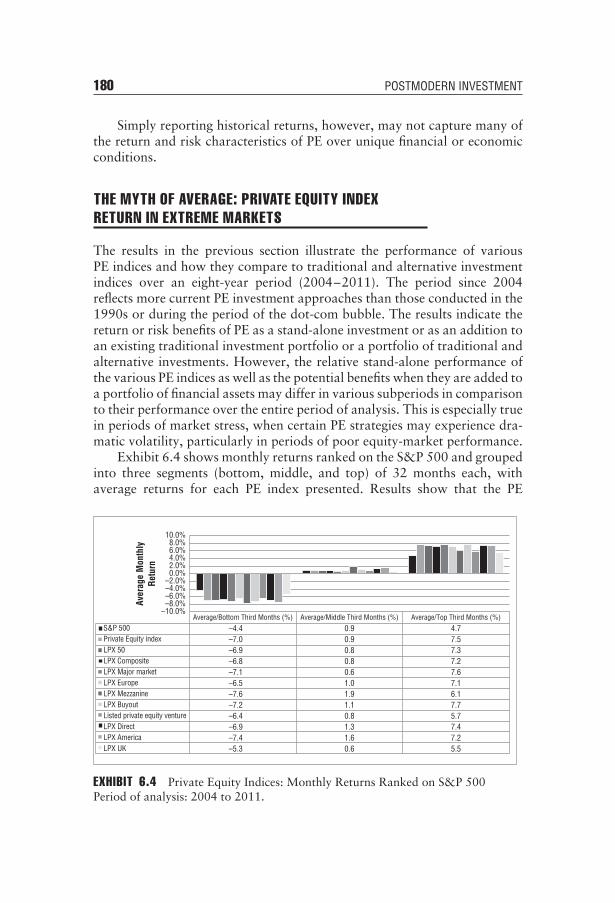
180 POSTMODERN INVESTMENT
Simply reporting historical returns, however, may not capture many ofthe return and risk characteristics of PE over unique financial or economicconditions.
THE MYTH OF AVERAGE: PRIVATE EQUITY INDEXRETURN IN EXTREME MARKETS
The results in the previous section illustrate the performance of variousPE indices and how they compare to traditional and alternative investmentindices over an eight-year period (2004–2011). The period since 2004reflects more current PE investment approaches than those conducted in the1990s or during the period of the dot-com bubble. The results indicate thereturn or risk benefits of PE as a stand-alone investment or as an addition toan existing traditional investment portfolio or a portfolio of traditional andalternative investments. However, the relative stand-alone performance ofthe various PE indices as well as the potential benefits when they are added toa portfolio of financial assets may differ in various subperiods in comparisonto their performance over the entire period of analysis. This is especially truein periods of market stress, when certain PE strategies may experience dra-matic volatility, particularly in periods of poor equity-market performance.
Exhibit 6.4 shows monthly returns ranked on the S&P 500 and groupedinto three segments (bottom, middle, and top) of 32 months each, withaverage returns for each PE index presented. Results show that the PE
Average/Middle Third Months (%)Average/Bottom Third Months (%) Average/Top Third Months (%)S&P 500Private Equity indexLPX 50LPX CompositeLPX Major marketLPX EuropeLPX MezzanineLPX BuyoutListed private equity ventureLPX DirectLPX AmericaLPX UK
–4.4–7.0–6.9–6.8–7.1–6.5–7.6–7.2–6.4–6.9–7.4–5.3
0.90.90.80.80.61.01.91.10.81.31.60.6
4.77.57.37.27.67.16.17.75.77.47.25.5
–10.0%–8.0%–6.0%–4.0%–2.0%0.0%2.0%4.0%6.0%8.0%
10.0%
Aver
age
Mon
thly
Retu
rn
EXHIBIT 6.4 Private Equity Indices: Monthly Returns Ranked on S&P 500Period of analysis: 2004 to 2011.
Private Equity 181
indices had more negative returns than the S&P 500 in the worst S&P 500return months and provided higher positive returns than the S&P 500 inthe best S&P 500 return months. The under-performance of PE relative tothe S&P 500 in the worst S&P 500 return months and the outperformanceof PE relative to the S&P 500 in the best S&P 500 return months may becaused in part by the use of public PE in this analysis. Public PE generallyhave betas above 1 such that they would be expected to underperform innegative equity market environments and outperform in periods in whichthe equity markets perform well. Notably, the results are not similar forfixed income. Exhibit 6.5 shows monthly PE returns ranked on the BarCapU.S. Aggregate Index and grouped into three segments (bottom, middle, andtop) of 32 months each, with average returns for each PE index presented.Results show that the PE indices had negative returns greater than thenegative BarCap U.S. Aggregate returns in the worst BarCap U.S. Aggregatereturn months, provided positive returns greater than the BarCap U.S.Aggregate return in the middle BarCap U.S. Aggregate months, and lowerreturns than the BarCap U.S. Aggregate in the top BarCap U.S. Aggregatereturn months. One reason for the results is the unique period of analysis;that is, 2004–2011 contains a significant period over which fixed incomeperformed well (post 2008 crash) and in which financial based equitieshave not. Thus to the degree that PE is regarded by investors as a similarinvestment to various financial securities, its public trading vehicles may notreflect the performance of private investment vehicles.
PRIVATE EQUITY ANNUAL PERFORMANCE
In the previous section, the average performance of the PE index andsub-indices over the best and worst performing equity and fixed-incomeenvironments was discussed. The representative PE index was shown toprovide for equities little potential diversification benefits in the worstmonths as well as in the best months of each index. In this section, weprovide a review of the relative performance by year of the PE index andthe LPX Composite indices and sub-indices, the S&P 500, and the BarCapU.S. Aggregate. Results in Exhibit 6.6 show that over the entire period, theannual returns of the S&P 500 and the various PE indices differed in manyyears. However, in six of the eight years, the PE index and the S&P 500moved in the same direction. In contrast, the PE index and the BarCap U.S.Aggregate moved in the same direction in only five of the eight years. Theseresults again indicate the importance of viewing PE performance over shortsubperiods rather than viewing it based strictly on its performance over thewhole 8-year period.
Exhibits 6.7, 6.8, and 6.9 show the standard deviations and correlationsof the PE index and the various LPX indices against those of the S&P 500 and

Average/MiddleThird Months (%)Average/Bottom Third Months (%) Average/TopThird Months (%)
BarCap U.S. aggregate
Private equity index
LPX50
LPX Composite
LPX Major market
LPX Europe
LPX Mezzanine
LPX Buyout
Listed private equity venture
LPX Direct
LPX America
LPX UK
–0.6
–1.9
–2.0
–2.1
–2.3
–1.6
–3.2
–2.3
–1.5
–1.8
–2.4
–1.7
0.5
3.1
3.0
3.0
3.0
2.7
2.7
3.0
2.5
3.1
3.2
2.6
1.5
0.1
0.2
0.3
0.3
0.5
1.0
0.8
–0.8
0.5
0.6
–0.1
–4.0%–3.0%–2.0%–1.0%0.0%1.0%2.0%3.0%4.0%
Aver
age
Mon
thly
Ret
urn
EXHIBIT 6.5 Private Equity Indices: Monthly Returns Ranked on BarCap U.S.AggregatePeriod of analysis: 2004 to 2011.
182

200410.9%4.3%28.1%24.2%24.4%21.4%34.8%13.0%21.7%20.3%30.5%14.3%35.0%
20054.9%2.4%17.6%21.7%22.9%20.3%18.7%12.3%20.3%19.0%19.0%8.2%16.5%
200615.8%4.3%
26.8%26.5%26.3%23.9%42.2%30.9%47.1%-2.8%45.8%29.1%35.8%
20075.5%7.0%
–10.4%–5.8%–6.7%–8.0%1.0%
–17.6%–4.6%–11.9%0.2%
–15.4%1.1%
2008–37.0%5.2%
–64.1%–65.8%–65.6%–66.0%–65.2%–65.1%–68.5%–51.3%–64.5%–64.1%–71.6%
200926.5%5.9%61.6%51.6%50.0%56.4%48.3%24.9%59.2%23.7%47.9%57.3%33.3%
201015.1%6.5%31.5%31.8%32.9%31.6%29.3%35.7%34.2%8.9%30.2%43.6%19.5%
20112.1%7.8%
–18.8%–18.8%–17.7%–19.7%–24.4%–12.9%–23.6%–4.6%–22.9%–8.1%–7.8%
S&P 500BarCap U.S. aggregatePE IndexLPX50LPX CompositeLPX Major marketLPX EuropeLPX MezzanineLPX BuyoutListed private equity ventureLPX DirectLPX AmericaLPX UK
–80.0%–60.0%–40.0%–20.0%
0.0%20.0%40.0%60.0%80.0%
EXHIBIT 6.6 Private Equity Indices: Annual Returns
183

2004 2005 2006 2007 2008 2009 2010 2011
S&P 500
BarCap U.S. aggregate
PE Index
LPX 50
LPX Composite
LPX Major market
LPX Europe
LPX Mezzanine
LPX Buyout
Listed private equity venture
LPX Direct
LPX America
LPX UK
LPX America
7.3%
4.0%
18.3%
14.8%
15.0%
15.5%
11.5%
14.2%
11.9%
21.4%
14.2%
18.5%
11.8%
18.5%
7.9%
3.1%
11.2%
9.6%
9.5%
10.7%
9.7%
9.1%
7.1%
19.2%
8.7%
10.0%
6.9%
10.0%
5.6%
2.7%
9.5%
10.7%
10.7%
11.4%
11.5%
6.2%
10.0%
19.2%
9.1%
8.2%
9.7%
8.2%
9.7%
2.6%
14.9%
14.6%
14.5%
15.1%
14.3%
16.3%
15.9%
18.8%
15.8%
19.2%
14.7%
19.2%
21.0%
6.1%
38.1%
41.1%
40.9%
42.1%
40.0%
52.9%
44.0%
35.5%
41.1%
50.6%
41.4%
50.6%
22.3%
3.3%
51.8%
49.6%
49.4%
52.3%
50.7%
61.1%
56.5%
46.6%
52.2%
51.8%
52.0%
51.8%
19.3%
2.9%
28.1%
27.5%
26.9%
29.4%
27.6%
25.4%
28.6%
23.2%
28.3%
27.7%
22.1%
27.7%
15.9%
2.4%
27.0%
27.4%
26.9%
29.0%
28.6%
21.6%
28.2%
26.0%
27.8%
25.4%
21.7%
25.4%
0.0%10.0%20.0%30.0%40.0%50.0%60.0%70.0%
EXHIBIT 6.7 Private Equity Indices: Annual Standard Deviations
184

2004 2005 2006 2007 2008 2009 2010 2011
BarCap U.S. aggregate
PE Index
LPX50 total return
LPX Composite total return
LPX Major market total return
LPX Europe total return
LPX Mezzanine total return
LPX Buyout total return
Listed private equity venture
LPX Direct total return
LPX America total return
LPX UK total return
0.06
0.80
0.83
0.83
0.79
0.87
0.37
0.66
0.82
0.82
0.53
0.72
–0.19
0.71
0.71
0.69
0.63
0.67
0.58
0.71
0.55
0.66
0.77
0.15
0.28
0.90
0.90
0.90
0.89
0.82
0.72
0.89
0.82
0.82
0.85
0.59
–0.44
0.72
0.69
0.69
0.69
0.49
0.86
0.81
0.47
0.76
0.87
0.49
0.35
0.84
0.88
0.89
0.88
0.90
0.72
0.84
0.85
0.85
0.74
0.72
0.64
0.94
0.92
0.92
0.93
0.91
0.93
0.94
0.85
0.93
0.92
0.79
–0.58
0.95
0.93
0.93
0.94
0.87
0.87
0.91
0.87
0.92
0.93
0.74
–0.35
0.98
0.96
0.96
0.96
0.92
0.95
0.95
0.86
0.95
0.96
0.90
–0.80–0.60–0.40–0.20
0.000.200.400.600.801.001.20
EXHIBIT 6.8 Private Equity Indices: Annual Correlation with S&P 500
185

2004 2005 2006 2007 2008 2009 2010 2011
S&P 500
PE Index
LPX 50
LPX Composite
LPX Major market
LPX Europe
LPX Mezzanine
LPX Buyout
Listed private equity venture
LPX Direct
LPX America
LPX UK
0.06
0.45
0.41
0.45
0.47
0.21
0.80
0.63
0.14
0.48
0.60
0.20
–0.19
0.04
0.01
0.06
0.18
–0.25
0.23
–0.04
–0.15
–0.08
0.11
–0.01
0.28
0.16
0.14
0.14
0.15
0.12
0.34
0.26
–0.11
0.29
0.36
0.25
–0.44
–0.25
–0.20
–0.20
–0.20
–0.11
–0.19
–0.20
–0.18
–0.25
–0.24
–0.03
0.35
0.00
0.14
0.16
0.12
0.22
0.12
0.14
0.32
0.09
0.10
–0.05
0.64
0.53
0.50
0.50
0.52
0.52
0.52
0.54
0.34
0.52
0.52
0.34
–0.58
–0.41
–0.38
–0.37
–0.38
–0.31
–0.31
–0.36
–0.42
–0.36
–0.39
–0.17
–0.35
–0.34
–0.31
–0.30
–0.32
–0.27
–0.31
–0.34
–0.28
–0.34
–0.36
–0.17
–0.80–0.60–0.40–0.200.000.200.400.600.801.00
EXHIBIT 6.9 Private Equity Indices: Annual Correlation with BarCap U.S.Aggregate
186

Private Equity 187
the BarCap U.S. Aggregate. Results in Exhibit 6.7 show that the standarddeviation of the PE index has remained consistently above that of the S&P500 and consistently above that of the BarCap U.S. Aggregate. Exhibits 6.8and 6.9 show that the intra-year correlation between the S&P 500 andthe BarCap U.S. Aggregate varies considerably over the years of analysis;however, the relationship between the PE index and other PE indices and theS&P 500 remains fairly stable, especially in recent years. Investors shouldbe aware that results from longer time frames may not reflect results forindividual years. We are surprised when we hear marketing presentationsthat emphasize the widespread diversification benefits of PE. For PE, lengthyperiods of analysis may hide more than they reveal. Although composite PEindices generally report consistently high volatility, their correlation withtraditional stock and bond markets changes from year to year.
PERFORMANCE IN 2008
In 2008, PE experienced its lowest returns since major databases startedtracking. When compared to the S&P 500, PE reported lower returnsand higher volatility in 2008. PE also reported lower returns and highervolatility than the BarCap U.S. Aggregate. In 2008, the correlation betweenthe PE index and the S&P 500 was approximately 0.84. This correlationwas partially caused by the common decline in valuation in the fall of2008. In 2008 most PE strategies, like those of traditional asset classes,were negatively impacted by the subprime crisis, the negative equity marketperformance, and the rise in credit spreads (e.g., decline in high-yield bondreturns).
In summary, PE often is used as a term to encompass a number ofstrategies (e.g., venture capital, mezzanine financing), and the performanceof those individual strategies is partially based on their underlying exposureto the markets in which they invest. In addition, there always exists a marketcondition in which a particular strategy or even, in fact, all strategies, mayperform poorly. The actual precipitating event may differ, but in each case,the result is a lack of liquidity and investor demand.
ISSUES IN PRIVATE EQUITY INVESTMENT
As mentioned earlier, PE returns are typically measured from the perspectiveof an IRR or cash disbursements as a percentage of capital investment.
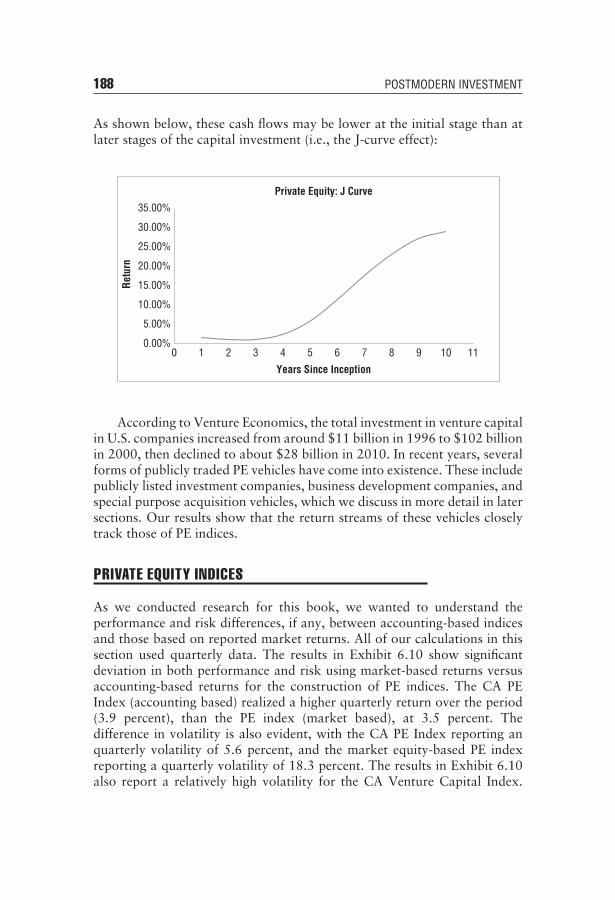
188 POSTMODERN INVESTMENT
As shown below, these cash flows may be lower at the initial stage than atlater stages of the capital investment (i.e., the J-curve effect):
0.00%
5.00%
10.00%
15.00%
20.00%
25.00%
30.00%
35.00%
0 1 2 3 4 5 6
Years Since Inception
7 8 9 10 11
Retu
rn
Private Equity: J Curve
According to Venture Economics, the total investment in venture capitalin U.S. companies increased from around $11 billion in 1996 to $102 billionin 2000, then declined to about $28 billion in 2010. In recent years, severalforms of publicly traded PE vehicles have come into existence. These includepublicly listed investment companies, business development companies, andspecial purpose acquisition vehicles, which we discuss in more detail in latersections. Our results show that the return streams of these vehicles closelytrack those of PE indices.
PRIVATE EQUITY INDICES
As we conducted research for this book, we wanted to understand theperformance and risk differences, if any, between accounting-based indicesand those based on reported market returns. All of our calculations in thissection used quarterly data. The results in Exhibit 6.10 show significantdeviation in both performance and risk using market-based returns versusaccounting-based returns for the construction of PE indices. The CA PEIndex (accounting based) realized a higher quarterly return over the period(3.9 percent), than the PE index (market based), at 3.5 percent. Thedifference in volatility is also evident, with the CA PE Index reporting anquarterly volatility of 5.6 percent, and the market equity-based PE indexreporting a quarterly volatility of 18.3 percent. The results in Exhibit 6.10also report a relatively high volatility for the CA Venture Capital Index.
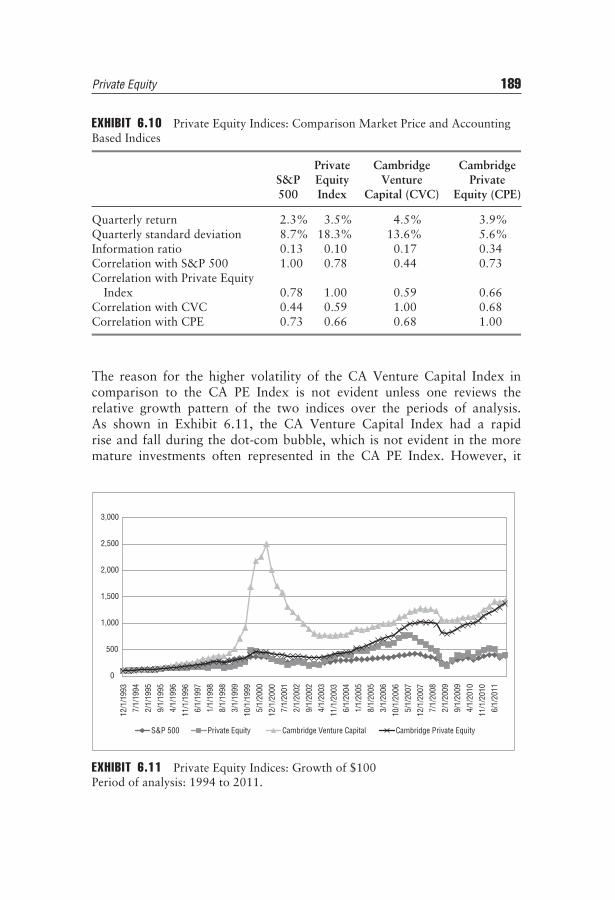
Private Equity 189
EXHIBIT 6.10 Private Equity Indices: Comparison Market Price and AccountingBased Indices
S&P500
PrivateEquityIndex
CambridgeVenture
Capital (CVC)
CambridgePrivate
Equity (CPE)
Quarterly return 2.3% 3.5% 4.5% 3.9%Quarterly standard deviation 8.7% 18.3% 13.6% 5.6%Information ratio 0.13 0.10 0.17 0.34Correlation with S&P 500 1.00 0.78 0.44 0.73Correlation with Private Equity
Index 0.78 1.00 0.59 0.66Correlation with CVC 0.44 0.59 1.00 0.68Correlation with CPE 0.73 0.66 0.68 1.00
The reason for the higher volatility of the CA Venture Capital Index incomparison to the CA PE Index is not evident unless one reviews therelative growth pattern of the two indices over the periods of analysis.As shown in Exhibit 6.11, the CA Venture Capital Index had a rapidrise and fall during the dot-com bubble, which is not evident in the moremature investments often represented in the CA PE Index. However, it
0
500
1,000
1,500
2,000
2,500
3,000
12/1
/199
3
7/1/
1994
2/1/
1995
9/1/
1995
4/1/
1996
11/1
/199
66/
1/19
97
1/1/
1998
8/1/
1998
3/1/
1999
10/1
/199
95/
1/20
00
12/1
/200
0
7/1/
2001
2/1/
2002
9/1/
2002
4/1/
2003
11/1
/200
3
6/1/
2004
1/1/
2005
8/1/
2005
3/1/
2006
10/1
/200
6
5/1/
2007
12/1
/200
7
7/1/
2008
2/1/
2009
9/1/
2009
4/1/
2010
11/1
/201
0
6/1/
2011
S&P 500 Private Equity Cambridge Venture Capital Cambridge Private Equity
EXHIBIT 6.11 Private Equity Indices: Growth of $100Period of analysis: 1994 to 2011.
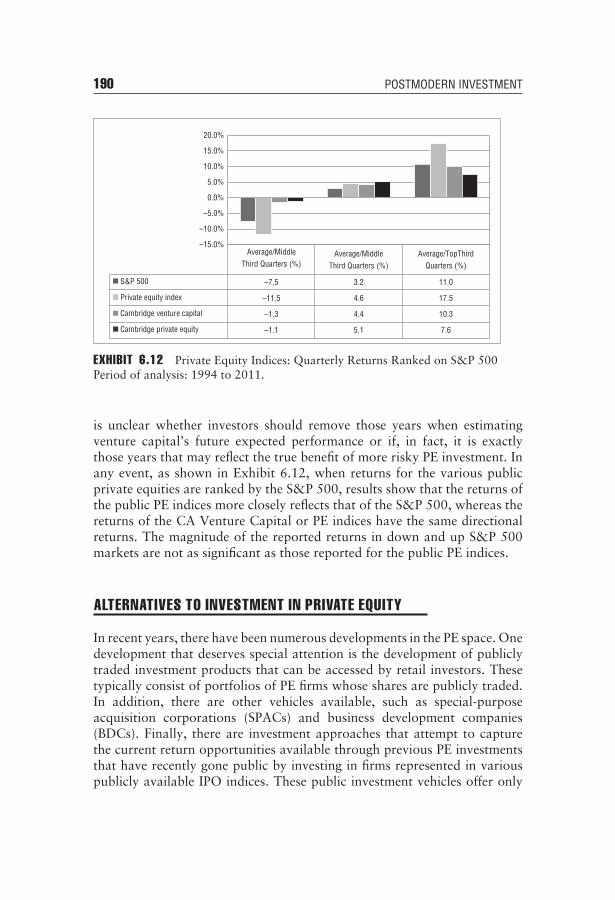
190 POSTMODERN INVESTMENT
Average/MiddleThird Quarters (%)
Average/MiddleThird Quarters (%)
Average/TopThirdQuarters (%)
S&P 500
Private equity index
Cambridge venture capital
Cambridge private equity
–7.5
–11.5
–1.3
–1.1
3.2
4.6
4.4
5.1
11.0
17.5
10.3
7.6
–15.0%
–10.0%
–5.0%
0.0%
5.0%
10.0%
15.0%
20.0%
EXHIBIT 6.12 Private Equity Indices: Quarterly Returns Ranked on S&P 500Period of analysis: 1994 to 2011.
is unclear whether investors should remove those years when estimatingventure capital’s future expected performance or if, in fact, it is exactlythose years that may reflect the true benefit of more risky PE investment. Inany event, as shown in Exhibit 6.12, when returns for the various publicprivate equities are ranked by the S&P 500, results show that the returns ofthe public PE indices more closely reflects that of the S&P 500, whereas thereturns of the CA Venture Capital or PE indices have the same directionalreturns. The magnitude of the reported returns in down and up S&P 500markets are not as significant as those reported for the public PE indices.
ALTERNATIVES TO INVESTMENT IN PRIVATE EQUITY
In recent years, there have been numerous developments in the PE space. Onedevelopment that deserves special attention is the development of publiclytraded investment products that can be accessed by retail investors. Thesetypically consist of portfolios of PE firms whose shares are publicly traded.In addition, there are other vehicles available, such as special-purposeacquisition corporations (SPACs) and business development companies(BDCs). Finally, there are investment approaches that attempt to capturethe current return opportunities available through previous PE investmentsthat have recently gone public by investing in firms represented in variouspublicly available IPO indices. These public investment vehicles offer only
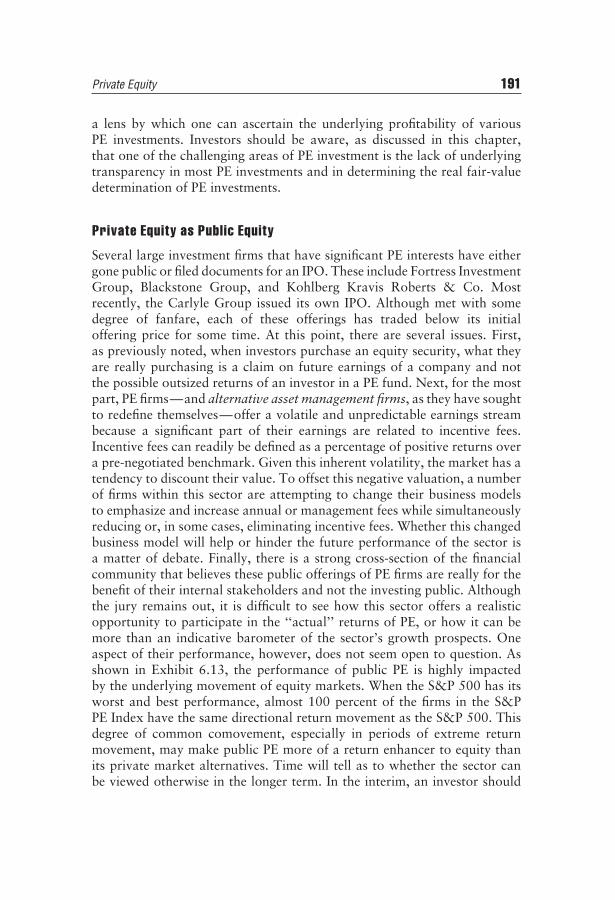
Private Equity 191
a lens by which one can ascertain the underlying profitability of variousPE investments. Investors should be aware, as discussed in this chapter,that one of the challenging areas of PE investment is the lack of underlyingtransparency in most PE investments and in determining the real fair-valuedetermination of PE investments.
Private Equity as Public Equity
Several large investment firms that have significant PE interests have eithergone public or filed documents for an IPO. These include Fortress InvestmentGroup, Blackstone Group, and Kohlberg Kravis Roberts & Co. Mostrecently, the Carlyle Group issued its own IPO. Although met with somedegree of fanfare, each of these offerings has traded below its initialoffering price for some time. At this point, there are several issues. First,as previously noted, when investors purchase an equity security, what theyare really purchasing is a claim on future earnings of a company and notthe possible outsized returns of an investor in a PE fund. Next, for the mostpart, PE firms—and alternative asset management firms, as they have soughtto redefine themselves—offer a volatile and unpredictable earnings streambecause a significant part of their earnings are related to incentive fees.Incentive fees can readily be defined as a percentage of positive returns overa pre-negotiated benchmark. Given this inherent volatility, the market has atendency to discount their value. To offset this negative valuation, a numberof firms within this sector are attempting to change their business modelsto emphasize and increase annual or management fees while simultaneouslyreducing or, in some cases, eliminating incentive fees. Whether this changedbusiness model will help or hinder the future performance of the sector isa matter of debate. Finally, there is a strong cross-section of the financialcommunity that believes these public offerings of PE firms are really for thebenefit of their internal stakeholders and not the investing public. Althoughthe jury remains out, it is difficult to see how this sector offers a realisticopportunity to participate in the ‘‘actual’’ returns of PE, or how it can bemore than an indicative barometer of the sector’s growth prospects. Oneaspect of their performance, however, does not seem open to question. Asshown in Exhibit 6.13, the performance of public PE is highly impactedby the underlying movement of equity markets. When the S&P 500 has itsworst and best performance, almost 100 percent of the firms in the S&PPE Index have the same directional return movement as the S&P 500. Thisdegree of common comovement, especially in periods of extreme returnmovement, may make public PE more of a return enhancer to equity thanits private market alternatives. Time will tell as to whether the sector canbe viewed otherwise in the longer term. In the interim, an investor should
192 POSTMODERN INVESTMENT
0%
20%
40%
60%
80%
100%
120%–1
6.8%
–8.9
%
–8.4
%
–7.2
%
–6.0
%
–5.2
%
–3.6
%
–2.0
%
–1.7
%
–0.8
%
–0.2
%
0.0%
1.0%
1.3%
1.6%
2.4%
3.1%
3.6%
3.8%
5.6%
6.0%
7.0%
8.8%
9.6%
EXHIBIT 6.13 Percent of Public Private Equity Firms with Same DirectionalReturn as S&P 500 (Ranked on S&P 500)Period of analysis: 2008 to 2011.
be extremely wary of using an investment in this sector as a proxy forPE returns.
Special-Purpose Acquisition Corporations
A special-purpose acquisition corporation, commonly known as a SPAC,and formally known as a development-stage company, is a corporationformed to raise capital through an IPO of its securities for the funding ofan acquisition of an existing operating company or companies. They arelisted on various exchanges, such as the American Stock Exchange (AMEX)and the National Association of Securities Dealers Automated Quotations(NASDAQ), as well as on the Over-the-Counter Bulletin Board (OTCBB).
Business-Development Companies
BDCs are closed-end funds whose shares trade publicly on the open market.BDCs are specially regulated retail investment companies that typicallymake PE-type investments in small- and middle-market companies. RecentBDCs sponsored by PE groups have generally focused on mezzanine anddebt investments. BDC managers may charge performance fees and havegreater flexibility than do typical mutual funds to use leverage and to engage
Private Equity 193
in certain affiliate transactions with portfolio companies. These companies,generally trade at a discount as do most closed-end mutual funds. Inaddition, the volatility of the revenue stream coupled with the inability todirectly approve the management team—the fund has total discretion inthis regard—provides a great deal of uncertainty as to the future returnand risk profile. Although it is possible that a select few will providesignificant returns for their investors, most simply will not. Investors shouldbe hypersensitive in monitoring these investments, pay attention to changesin investment personnel, and measure the general investment process againsthistorical norms and approaches. These funds are structured to provide themanagement team complete flexibility and control with little oversight. Inthis latter regard, an investor should closely review the governing structureand determine if there are sufficient independent directors to maintain thefund’s integrity.
A PERSONAL VIEW: ISSUES IN PRIVATE EQUITYINVESTMENT
There is an overriding constant in investment management. Firms sell theproduct they have; whether it fits within an investor’s portfolio or notis totally dependent on the investor. Most firms will not self-select outof making a sale. The corollary to this is that in investment, productdevelopment firms often create the product they can sell, not the productthey should sell. As investors traverse the differing sectors of PE, they shouldbe reminded that the vast majority of the institutions and people they willcome across have only one goal: to sell the product they have. Against thistruth, an investor must demand transparent and verifiable information, andexamine such information closely prior to making any decision.
PE Analysis: Academic research has often addressed the benefits of PEfrom the viewpoint of a fundamental valuation of new productopportunities. Research in this area has often failed to considerthe unique sources of return to current PE investments as well asthe potential risk involved in the changing nature of regulatory andeconomic conditions driving PE valuation. In addition, this researchhas tended to treat all PE the same by providing comparativeanalysis on a vintage-year basis. In sum, the research that has alsobeen adopted by the industry looks to the year of a fund’s launchas the sole basis of comparison and makes no effort to understandthe underlying assets or those assets’ suitability for comparisonacross funds. Perhaps this approach worked when there were a

194 POSTMODERN INVESTMENT
limited number of PE opportunities and approaches. However, PEinvestment has undergone dramatic evolution over the past 30years, from a long-term holding framework, to LBOs, to IPOs,and back to a fundamental cash flow IRR. Today, the changingnature of PE investment is such that comparing PE investments ona vintage-year basis simply does not inform, and investors mustmore directly consider the fundamental differences in portfolioinvestments and the sectors, accounting, and management teamsassociated with those returns. Simply put, vintage year comparisonsdo not advance a true understanding of a product’s contribution tothe asset allocation decision.
Distributional Characteristics: The primary reason for PE investment isthe degree to which individual PE investments provide unique riskand return characteristics not easily available in other investmentvehicles. Analysis of PE distributional characteristics, however,has been impacted by unique periods of investment as well asthe form of the return estimation. PE return has been measuredusing market-based prices as well as vintage-year IRR processes.Depending on the form of the investment measurement as well asthe use of comparable investments, the issue is the degree to whichthe performance reflects similar factors. The high sensitivity of PEto current economic variables requires a more dynamic investmentmodel, which drives the distributional characteristics of most realestate investment. Researchers and reviewers are often enticed bythe ‘‘more data is better’’ syndrome; that is, five years of data isgood, 10 years is better, 20 years is best. However, in a marketpartially driven by rapidly changing technological and distributionchannels as well as regulatory rules, what is true of the 1980s mayhave little relevance for 2012.
Micromarket Structure: Recent regulatory and market adjustments tothe 2008 financial crisis have fundamentally changed many of thetraditional approaches to PE investment. This is especially true inthe structured product and debt area. Today, reduced availabilityof capital, as well as retractions on banking structure and riskexposure, have fundamentally impacted how and where PE capitalis obtained.
WHAT EVERY INVESTOR SHOULD KNOW
PE is by its very nature a difficult subject to cover; that is, it is private.If we knew anything that we could talk about, we might be able to call

Private Equity 195
it ‘‘just a little bit’’ private or ‘‘partly’’ PE. Moreover, it is so enticing formany investors. Who does not want to be invested into a private club?The question is, even if you are invited in, you have to ask why. Is it yourgood looks or your wit? In this chapter we pointed out that for much ofthe history of PE, the individuals running the game were very private. Inaddition, to the degree that they became public, their public image was alittle questionable. In recent years, however, public equity has undergone atransformation. For the past decade, it has become more transparent andmore available through multiple investment sources. Yet there is still muchthe typical investor does not know.
■ Trust the People, Do Not Trust the Returns: Since most of the dataon past performance is private, and since most of the investmentopportunities (for certain types of direct fund investment) are unknownat the time of the investment, the question has to be: Who do you trust?As a result, the performance of any individual set of investment returnsmust be analyzed to see if they can be reproduced and to expose theframework for that belief. It reminds us of the old nuclear discussion,and it works here: Investors trust, but verify.
■ Do Not Be the Last One in the Pool: With the exception of funds thatonly do direct coinvestment, investing in a PE fund of funds is a verybad idea. In addition to fees on top of fees and limited upside, fund-of-funds managers have no voice in decision making and are providedunverifiable information, on a quarterly basis, by the general partnerthey invest in. The historical performance for these vehicles has beenabysmal and the value proposition on any diversification theme remote.As discussed above, when you enter a private club or you are invitedto enter, you have to be pleased, but then ask why. Are they askingfor new money to be added alongside theirs? Are they asking you tobuy out their own holdings? Have all the good boat slots been rentedout and all you have is the slip near the end of the dock? Maybe thereal nice club is full and this private club is one mile down the road.Proximity and ease does not necessarily equate to competency.
■ PE Is More Equity Than Private: PE investments may be better viewedas return-enhancement vehicles to traditional equity-biased portfolios.Although traditional PE investments may provide diversification andreturn benefits, the impact of their comovement with equity and equity-impacted assets, as well as their valuation difficulties, must be consideredcarefully. Finally, the PE sector has undergone significant changes inrecent years. These include the listing of major PE firms on stockexchanges. Investors must distinguish between PE firms that are pri-marily asset gatherers or clubs and those that functionally add value.
196 POSTMODERN INVESTMENT
If not publicly listed, ask for the firm’s financials. Review performancenumbers against equity and fixed-income indices. Examine the turnoverof their limited partners. Investors should not assume that because afirm is registered with the Securities and Exchange Commission or somesimilar regulatory body that the regulators have approved the firm froma due diligence perspective. Many firms have been seemingly in regula-tory compliance up to the day they close their doors due to misfeasanceor malfeasance. While regulatory compliance can inform, a regulatoryoversight scheme has a different objective than an investor searching foran appropriate opportunity—and at any given moment the investor’sand the regulator’s interest may not be in alignment. With the exceptionof a rare few, the value proposition for PE firms is remote, and historicaldata must be used or relied on with extreme care. Perhaps the mostimportant point we can end this section with is to repeat that the returnand risk characteristics of publicly traded PE firms differ from thoseof traditional accounting-based PE indices. Always remember that it iscurrent market conditions that drive valuations, and projections offerlittle beyond hope.
MYTHS AND MISCONCEPTIONS OF PRIVATE EQUITY
There is a common phrase that says it is always dangerous to discuss theaims and intentions of others. This is especially true when the issues oneis trying to divine are private and explicitly nontransparent. Any commenton the myths and misconceptions of PE is therefore more of a personalperspective than statements based on actual facts. There is myth in thefollowing myths. Perhaps time will provide the answer.
Myth 6.1: Last Year’s Private Equity Performance IsIndicative of Next Year’s Private Equity Performance
Just as for those who invest in traditional stock and bond mutual funds,hedge funds, and CTAs, investment in publicly traded PE is often based onpast performance. However, as with traditional stock and bond funds andvarious alternative investments, past performance provides little evidence asto near-term performance. For publicly traded equity, this is to be expected.Performance persistence does not exist for traditional assets, nor does itexist for PE. What of private market PE? Now the issues get more complex,but concern is that the historical return performance of any set of PE datareflects a historical event. For many PE firms, the past only reflects the

Private Equity 197
fact that they were able to make and manage investments in the past. Theunique skills that led to correct decisions in one market environment arenot necessarily easily transferable into the next economic environment (e.g.,technology to commodity investment). The seeming correlations betweenthe performance in year one and year two for PE firms may simply reflectgetting in at the right time. Since for the most part we only have quarterlydata on most firms, we simply do not have enough data to know.
Myth 6.2: One Private Equity BenchmarkIs As Good As Another
Indices are commonly used to provide a performance benchmark that reflectsthe particular style of an investment manager. Although benchmark indicesare common in the areas of stock and bond investment, many investorsare not familiar with the various benchmark indices in the PE area. Asin the traditional asset area, there exists no one benchmark that reflectsthe performance of the asset class. Each PE index (e.g., S&P, LPX, CA)has unique weighting, composition, and structural issues (market based oraccounting based), just as equity indices (e.g., S&P 500, Dow Jones) havetheir own unique weighting and asset composition. Nor does each index onits own capture the fundamental benchmark requirements of investability,systematic reproduction, and transparency.
Myth 6.3: A Single Private Equity Index Is Sufficientto Capture Private Equity Returns
In the first instance, an investor should question whether any PE index iscapable of capturing the return profile of investable PE investments. Forthe most part, this cannot be accomplished. These indices tend to focuson vintage-year comparisons, which, as previously discussed, do little toinform the investor as to the underlying assets of any fund. Next, to theextent that they eschew the vintage-year concept, they are based on somemethodology that includes publicly traded firms or some algorithmic mixof sources of return to provide a structured solution. For the most part,unless an investor has tasked someone with creating an index based onvery specific criteria and designed to be used in a very specific manner inanalyzing its portfolio, these PE indices provide little more than indicativeresults as to performance and associated risks. That said, the relianceon one index would be a mistake, and research has shown that two tothree indices should provide sufficient information to gauge performancepatterns.
198 POSTMODERN INVESTMENT
Myth 6.4: There Exists a Single Proper Way to MeasurePrivate Equity Performance
As discussed, the most well-known PE databases provide quarterly returnsfounded on IRR vintage year. In contrast, there are few public marketexamples of the fair value of current PE portfolios. For the past 20 years,publicly traded PE firms have existed. Research has shown a high correlationbetween generic equity market returns (e.g., S&P 500) and various equitymarket-based PE benchmarks. For certain years, there is evidence that thereturn patterns in various equity-based PE benchmarks reflect more reliableinformation than traditional consulting firm-based PE accounting-basedreturns. Of greater concern is the established fact that while the estimatedreturns may not differ dramatically, the estimated variance among thevarious indices does. The variance of publicly traded PE securities is oftentwice or three times that of accounting-based measures of PE performance.In sum, there is no established methodology to measure the performanceof individual PE firms. Frankly, that is one of their advantages in raisingcapital from the uninformed.

CHAPTER 7Real EstateThe New World
Real estate is perhaps the only asset class that evokes a visceral reaction ininvestors that at times transcends its monetary worth. There is something
mystical here; something amorphous that reflects a magnified stability andsense of eternity. In ancient times, real estate was the defining symbol ofwealth. The ownership of real property was the exclusive right of kings,and all others paid a toll for its use and enjoyment. In many ways, thattheme is the undercurrent of today’s trophy commercial properties, namedoffice buildings, and homes. In the modern investment world, real estateinvestment exists in many forms. It is both public and private—both fixedincome and equity—and both direct and indirect. Each has its own risk andreturn profile, and each has its own associated myths and misconceptions.
The types and forms of investment real estate are immense. Yet irre-spective of form, there are a number of defining characteristics inherentin all such investments. First, investment real estate is relatively illiquid.As a result, it is difficult to market directly in its basic form. The cashflows or valuations must generally be in some structured security beforebeing made available to investors. Second, real estate is subject to informa-tion asymmetries. By definition, investment real estate is not transportable.Thus, its risk and reward attributes are keenly influenced by local politics,sentiment, professional relationships, laws, regulations, tariffs, and growthpatterns. An office park in Silicon Valley has significantly different valuationand return characteristics than does the same structure located in Chicago.Third, investment real estate is usually levered. Leverage can be a part of theinitial transaction, when an investor places a down payment and financesthe remainder of the purchase price, or it can be embedded in the variousinstruments and business models that sponsors employ to distribute thisasset class. By example, a sponsor or developer may purchase raw landwith the intent to build an office park. That land could be financed through
199
200 POSTMODERN INVESTMENT
a local bank, with the sponsor paying a modest-percent down paymentand the bank financing the balance for a period of years. The sponsorcould then obtain a construction loan to build the office park, again withfinancing. Finally, once completed, that office park could be folded into asecuritized portfolio of similar properties to be redistributed as securitizedpartial interests in the larger portfolio. A degree of leverage and associatedcosts and fees exist at each level of this scenario, and all of the leverage andassociated costs are eventually folded into the securitized transaction. Assuch, any analysis relating to risks, sources of return, valuations, and duediligence are inextricably linked to the business platform or model used toprovide this asset class to investors.
Against these constants and despite the fact that real estate is considereda core allocation to most institutional portfolios, its intricacies requireinvestors to spend considerable expense and effort to either conduct theirown due diligence or find a suitable professional who can mitigate potentialrisks and understand the rewards. The office-park example is representativeof most real estate transactions in the United States. Securitization is morethe norm than the exception, even in the area of single-family homes. Localbanks have essentially become toll takers, in that they originate loans andsell them off to others who repackage those loans as underlying assetsfor a vast array of product offerings. These offerings take many forms,such as real estate investment trusts (REITs) or variations of collateralizeddebt obligations.
The real estate structure of today actually began in the 1930s when,among other factors, a lack of liquidity and informational asymmetries ledthe U.S. government to create the Federal Housing Administration (FHA)and the Federal National Mortgage Association (FNMA, or Fannie Mae)to both insure loans and create secondary markets in home mortgages.These agencies were tasked with purchasing and securitizing mortgagesfrom local banks, thus allowing local lenders to reinvest their assets intomore lending. These securitizations were called mortgage-backed securities(MBSs). FHA and Fannie Mae were hugely successful in spurring growth,and by the 1960s, the U.S. housing market had grown to the point wherethe Government National Mortgage Association (GNMA, or Ginnie Mae)and the Federal Home Loan Mortgage Corporation (FHLMC, or FreddieMac) were created as government-sponsored agencies to service the marketfor public and private real estate. This development provided the first activerole of the government in securitization of commercial real estate. Up to thispoint, banks had created syndicates to diversify the risks associated withlarge development projects. Although somewhat efficient, this approachmeant that the syndicating banks kept some portion of both the asset

Real Estate 201
and the liability on their balance sheets, and as a consequence, theirlending capacity was hampered. The ability to use government-sponsoredsecuritization provided the mechanism to shift these liabilities off to aninvesting public and thus increase a bank’s lending ability to the economyas a whole.
This implicit association with the U.S. government greatly opened themarket for these types of securities, both as debt instruments and as prox-ies for direct real estate investment. As the major rating agencies (suchas Moody’s and Standard & Poor’s [S&P]) began to rate these securitiesas investment grade, global demand increased significantly. Whether as aconsequence of local laws or federally created mandates, and irrespective oftheir country of origin, most pension funds, banks, and insurance companiesare required to have the bulk of their investments in rated investments. Thethought is simply that given the infinite number of choices available, a stan-dard associated with dispassionate ratings will assist those responsible withmaintaining the financial integrity of these types of portfolios. Underlyingthis is also the legal fiction known as the ‘‘reasonable person’’ standard. Afiduciary overseeing a portfolio is tasked with the obligation of acting withcare and objective intent in the management of another’s monies. To theextent that a fiduciary is purchasing rated securities, it is most often saidthat the standard has been met and that the fiduciary has little to no liabilityin the event that monies are lost on the investment.
With the substitution of ratings for judgment, and with the implicit butunacknowledged backing of the U.S. government, came increased innova-tions in these basic structures and soaring demand within securitization.Products such as Ginnie Mae pass-through certificates and Freddie Macparticipation certificates offered increasingly unique slices of the overallrisk and reward profile of both residential and commercial MBSs. Withgreater innovation also came greater disintermediation. Interestingly, thisdisintermediation was on both the buy and the sell sides of the equation.We must keep in mind one of the basic tenets of real estate investing: Allrisk and associated returns are local. Investors were far removed from theunderlying assets and, equally, so were the investment banks that created,marketed, and packaged these assets in more and more exotic fashions.Moreover, local risks became overlaid with unassociated economic, distri-bution, and political risks. Both the major rating agencies stood as Argus,the mythical guardian of reason; and as Argus, the rating agencies werefound wanting.
In the United States, the advancements in the real estate fixed-incomearea during the 1960s were running parallel with the development of equity-based real estate investments. The Real Estate Investment Trust Act of 1960
202 POSTMODERN INVESTMENT
created a framework for the first real estate investment trusts (REITs). Overthe next 30 years, as the fixed-income investment forms were evolving, newregulation was changing the framework for REIT investment (e.g., REITModernization Act of 1999). Although there exist a number of regulatoryrestrictions related to their construction and sale, in the United States, aREIT is a company that owns, and in most cases operates, income-producingreal estate. To be a REIT, a company must distribute at least 90 percentof its taxable income to shareholders annually in the form of dividends.The REIT structure is not unique to the United States, and each countryhas its own regulatory framework to protect investors and improve marketefficiency.
As noted, real estate investment has generally been regarded as a pri-mary part of individual and institutional investors’ strategic asset allocationportfolios. In recent years, the sector has undergone a dramatic transfor-mation both in investment structure and return opportunities. In the past,the physical real estate market has been characterized by a relative lack ofliquidity, high transaction costs, high management costs, high informationcosts, and low transparency. Today, some of the costs of investing in realestate have been reduced, as initiatives to enhance liquidity and transparencyin the property markets have been developed. Despite these changes, realestate investments remain relatively inefficient and substantially differentfrom country to country, region to region, and property type to propertytype. As real estate investment opportunities differ widely, traditional realestate may better be viewed as return-enhancement vehicles to equity-biasedand fixed-income investments. This is caused, in part, by the effect of interestrates on the present value of the fixed cash flows often generated by realestate. These cash flows are also impacted by dramatic changes in globaleconomic conditions, which may change both the structure of financing andthe demand of real estate investing.
In this chapter, the benefits, performance, and sources of return ofreal estate investment strategies are examined. We first present the differentforms of private and public equity and debt investments available in the U.S.real estate market, as well as the primary corresponding indices that havebeen designed to track each of these markets. Second, we discuss and presenta review of the literature on the determinants of real estate returns. Third, wereview the data, methodology, and performance results related to real estateinvestments. Fourth, in presenting conclusions, we discuss a number ofissues that are unique to real estate investment. As a final point, investmentproducts are designed, marketed, and purchased within a regulatory andeconomic paradigm. With the exception of direct investments in real estate,for many, this has meant subjugating their judgment to ratings. History hasshown that such an approach is wanting.
Real Estate 203
INVESTING IN REAL ESTATE
As discussed previously, with changes in regulation, variations in marketstructure, and advances in product creation, real estate investment nowincludes a wide range of investable forms in which investors can seekdistinct return opportunities: (a) private commercial real estate equity,(b) public commercial real estate equity, (c) private commercial real estatedebt, and (d) public commercial real estate debt.
The performance of each of these categories reflects a mix of equity anddebt behaviors. This point is illustrated with the following two examples.First, consider the case of a private real estate equity asset that has beenleased to a single high-quality tenant for a long period of time. The leasepayments in this case will reflect the fixed payments usually associated witha bond, and the value of this property to the investor will also fluctuate inresponse to the same factors that affect the value of a bond (e.g., inflation,interest rate changes, and creditworthiness of the tenant). Now, considerthe case of an equity position in an empty, speculative building. The valueof this property will be determined in the market by the supply and demandfor space—that is, by the forces that affect the price of an equity position.As the building is fully leased, this real estate investment changes from moreof an equity investment to a debt-equity hybrid, in which the consistent cashflows offer debt-like payments, and the future options for alternative use ofthe building provide continued equity-like risk components.
Exposure to the equity side of the real estate market can be achievedvia two principal modes of investment: private (also known as physical ordirect) and public (also known as securitized, financial, or indirect). Privatereal estate investment involves the acquisition and management of actualphysical properties. Public investment involves buying shares of REITs orother forms of indirect financial investment (e.g., futures or exchange-tradedfunds [ETFs] based on real estate). The real estate market is composed ofseveral segments, which include housing, or residential real estate properties;commercial real estate properties; farmland; and timberland. We will discusseach of these segments and available indices and investable products in thefollowing section.
HOUSING OR RESIDENTIAL REAL ESTATE PROPERTIES
The value of residential real estate properties has no single dominant market-based pricing service. One popular valuation index is the S&P/Case-ShillerHome Price Indices, which consist of 20 metropolitan regional indices,2 composite indices, and a national index. The indices are constructed
204 POSTMODERN INVESTMENT
using a methodology known as repeat sales pricing, a process that involvesrecording sale prices of specific single-family homes in a particular region.When a home is resold months or years later, the new sale price is alsorecorded, and the two sale prices are referred to as a sale pair. The differencesin the sale pairs of the region are measured and aggregated into one index.
Commercial Real Estate Properties
Currently, commercial property indices exist from a number of sources:The National Council of Real Estate Investment Fiduciaries (NCREIF)Property Index (NPI) is a quarterly total return index of a very largepool of individual commercial real estate properties acquired in the privatemarket for investment purposes only. The NPI return provides an estimateof the quarterly internal rate of return (IRR), assuming that a propertywas purchased at the beginning of the quarter and sold at the end of thequarter, with the investor receiving all the corresponding net cash flows(i.e., net operating profits minus capital expenditures) during the quarter.The NPI is an appraisal-based index. Because of the methodology used inconstructing the NCREIF, returns calculated solely on percentage changes inthe index suffer from a number of deficiencies, such as smoothed or laggedprice change estimates, which tend to cause downward-biased estimatesof total return volatility. Another index that measures the performanceof institutional commercial properties is the Massachusetts Institute ofTechnology (MIT) Center for Real Estate (CRE) Transactions-Based Index(TBI). The purpose of this index is to measure market movements andreturns on investment based on transaction prices of properties sold fromthe NPI database.
Farmland
The NCREIF Farmland Index is a quarterly index that measures the invest-ment performance of a large pool of individual agricultural propertiesacquired in the private market for investment purposes only. Only income-generating agricultural properties are included in the index. According toNCREIF, all properties in the Farmland Index have been acquired, at leastpartially, on behalf of tax-exempt institutional investors, the great major-ity being pension funds. As such, all properties are held in a fiduciaryenvironment. This index is also an appraisal-based index.
Timberland
Timber is a unique investment, characterized by very long-term illiquidinvestments and particular risk and return determinants. The main factorsimpacting timber prices are the underlying demand and supply, however,

Real Estate 205
timber demand and supply are very highly correlated to changes in thefundamental determinants of stocks and bonds. The NCREIF TimberlandIndex is a quarterly index that measures the investment performance ofinstitutional timberland investments. To qualify for the index, a propertymust be held in a fiduciary environment and marked to market at least onceper year. However, the lack of quarterly appraisals for many propertiesin the Timberland Index makes the annual return series more reflective ofchanges in the market than the quarterly series.
PRIVATE AND PUBLIC COMMERCIAL REAL ESTATE DEBT
Private commercial real estate debt can be held as directly issued wholeloans, commercial mortgages held in funds, or commingled vehicles. Publiccommercial real estate debt is often composed of commercial mortgage-backed securities (CMBSs). CMBSs consist of many single-mortgage loans(of varying size, property type, and location) that are pooled and thentransferred to a trust (see CRE Financial Council at www.crefc.org). Thetrust then issues a series of bonds that may vary in yield, duration, andpayment priority. Interest received from all of the pooled loans is paidto the investors, starting with the highest rated bonds, until all accruedinterest on those bonds is paid. Interest is then paid to the investors holdingthe next highest rated bonds, and so on. The same procedure is followedwith principal as payments are received. Credit-rating agencies then assignratings to the various bond classes. Investors choose which CMBS bonds topurchase based on the level of credit risk, yield, and duration that best suitstheir needs. Although CMBSs are a form of real estate debt, they also exhibitan equity-like behavior, given the nature of the CMBS market, in whichcash flows from pools of mortgages are divided to produce high-grade cashflow characteristics in the senior tranches and more equity-like cash flowcharacteristics in the most subordinate pieces.
REAL ESTATE STYLES AND BENCHMARKS
As with most investment strategies, real estate investments can often bedefined by the markets the manager trades in and the form of the tradingthat takes place. Similar to other traditional and alternative investmentmarkets, real estate investing has been divided into the markets they trade(e.g., commercial and residential) and some of the unique approaches totrading (e.g., REITS). In addition to the different types of real estate propertyheld, the primary difference between the various indices is the frequency ofthe reported returns and the methodology used to obtain the estimate forthe current market value.
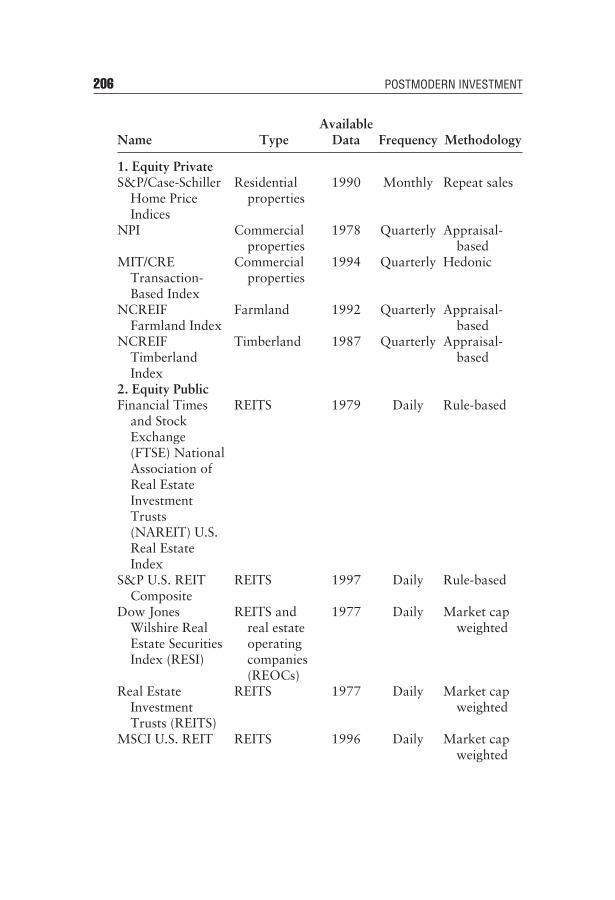
206 POSTMODERN INVESTMENT
Name TypeAvailable
Data Frequency Methodology
1. Equity PrivateS&P/Case-Schiller
Home PriceIndices
Residentialproperties
1990 Monthly Repeat sales
NPI Commercialproperties
1978 Quarterly Appraisal-based
MIT/CRETransaction-Based Index
Commercialproperties
1994 Quarterly Hedonic
NCREIFFarmland Index
Farmland 1992 Quarterly Appraisal-based
NCREIFTimberlandIndex
Timberland 1987 Quarterly Appraisal-based
2. Equity PublicFinancial Times
and StockExchange(FTSE) NationalAssociation ofReal EstateInvestmentTrusts(NAREIT) U.S.Real EstateIndex
REITS 1979 Daily Rule-based
S&P U.S. REITComposite
REITS 1997 Daily Rule-based
Dow JonesWilshire RealEstate SecuritiesIndex (RESI)
REITS andreal estateoperatingcompanies(REOCs)
1977 Daily Market capweighted
Real EstateInvestmentTrusts (REITS)
REITS 1977 Daily Market capweighted
MSCI U.S. REIT REITS 1996 Daily Market capweighted
Real Estate 207
As shown, these indices exist not only for the United States as a wholebut for regional equity and fixed-income markets. Each of these indices mayhave its own unique return-to-risk trade-off. Within any of the individualreal estate reporting sectors, more detailed subsectors are available, whichthemselves have their own return and risk profiles. Samples of additionalcommercial real estate sub-indices include the following:
NPI S&P CaseNCREIF Hotel NCREIF FarmlandNCREIF Apartment NCREIF TimberNCREIF Retail NCREIF TownsendNCREIF Industry NCREIF Value AddedNCREIF Office NCREIF OpportunisticMIT/TBI MIT/TBI IndustrialMIT/TBI Office MIT/TBI Retail
Each of these indices differs slightly in its construction. In addition, pastresearch indicates that the reported returns of the investable Financial Timesand Stock Exchange (FTSE) National Association of Real Estate InvestmentTrusts (NAREIT) indices often differ from those of similar market-basednoninvestable accounting-based indices.
BASIC SOURCES OF RISK AND RETURN
The performance of various investment vehicles attached to each subsectorreflects their underlying sources of cash flow as well as investors’perceptions of the current and future quality of that cash flow. Real estatedebt and equity prices are determined both by overall market factors andby a myriad of real estate supply and demand factors, including: (a) long-term population growth affecting the demand for real estate housing;(b) government planning and regulations on the use of land playing acrucial role in the real estate market through their possible influence onreal estate supply; (c) disposable income and availability of financing; (d)regional differences in insurance costs as well as maintenance and repaircosts; and (e) differential tax treatment of real estate investments.
Real estate markets often follow economic cycles, and forecasting mod-els accounting for these complex relationships are in development. Forexample, there has been substantial research in analyzing economic riskfactors that are priced into real estate markets.1 These researchers haveidentified growth in consumption, real interest rates, the term structure of
208 POSTMODERN INVESTMENT
interest rates, and unexpected inflation as systematic determinants of realestate returns. In exploring returns in global property markets and ques-tioning their integration and relation to fundamental economic variables,researchers also found that a substantial amount of the correlation acrossglobal real estate markets is attributed to changes in economic growth. Thus,real estate can be considered a bet on internationally correlated fundamentaleconomic variables.
Real estate cycles may operate at both international and local levels.The implication is that true international real estate diversification canonly be achieved by investing on an intercontinental basis. Also, near-optimal diversification can be achieved by targeting one country fromeach continent. Some researchers,2 however, warn that those investinginternationally suffer from an information disadvantage over local investors.Research also concludes that high prices are not caused by shortages in spacebut by local zoning and land use regulations.3 We have also seen that therisk of regulation speeds up the development of unregulated land.4
In general, empirical research has focused on REITs because of theavailability of a series of monthly historical data for these investmentvehicles as well as their liquidity and importance as a real estate investmentalternative. REITs—corporations that invest in real estate markets and arerequired to distribute 90 percent of their income—can be thought of as thereal estate equivalent of mutual funds. As mentioned previously, we alsopresent a similar analysis on commercial and residential real estate towardthe end of the chapter, as well as an analysis of the performance of otheralternative real estate investment vehicles (e.g., mutual funds, closed-endfunds, ETFs, and hedge funds that invest in real estate). We leave theconsideration and analysis of data on private and public commercial realestate debt for another day.
PERFORMANCE: FACT AND FICTION
Real estate has been a major investment class for both retail and institutionalinvestors. For decades, real estate investment across a wide range of realestate sectors has been promoted both by governmental policies as wellas by changes in financial markets, which created additional investmentvehicles that helped expand the demand for direct real estate investment.The question is whether, going forward, real estate investments will reflect aseparate growth pattern as reflected in the period prior to the dot-com bubbleor if real estate will continue to track traditional equity markets as it has forthe period since the dot-com bubble. For some, the performance of real estateis based primarily on the unique business opportunities corresponding to the
Real Estate 209
ability of investment managers to select real estate investment opportunitieswith performance that may not be directly related to general market factors.For others, the underlying ability of real estate to meet performance goals ispartially dependent on the underlying strength of the economy as it impactsreal estate demand on a U.S. or global basis. Thus what is an accepted factfor one real estate investor may be regarded as fiction for another. One of theprincipal problems in the analysis of real estate is the term real, in that there islittle evidence on the quality of the data that supposedly reflects the changingvalue of a real estate investment. In the following sections, we provideevidence not only on the stand-alone risks of various real estate investments,but on the interrelationships between real estate and various traditional (e.g.,equity and fixed-income market) and alternative asset classes using an indexof publicly traded real estate firms. As in previous chapters, we examinethese markets over both broad and short time intervals (e.g., annual) aswell as their relative performance in extreme market conditions. Using theFTSE NAREIT indices as a basis for measuring the benefits of real estateinvestment, results demonstrate that real estate is shown to have a highcorrelation with the comparison equity-biased traditional and alternativeinvestments and provides little potential diversification benefits especiallyin periods of extreme equity returns, that is, negative returns in downequity markets and positive returns in up equity markets. To some, this isexpected, but investors should not take return and risk performance fromextended time frames as a basis for how various certain real estate equityindices may perform over relatively shorter time periods (e.g., annual).Lastly, as discussed in Chapter 6, relative to investment in private equity,the performance of publicly traded REITS may not necessarily reflect theperformance of accounting-based private real estate investment. In the end,real estate should provide the potential for unique return opportunities basednot on systematic return opportunities with the general equity market buton nonsystematic firm-based opportunities. However, given the randomnessof such individual REIT success, it is not surprising that since much of realestate is held in portfolio form, many real estate investments seem to captureoverall generic equity market patterns in contrast to the ‘‘black swan’’ of anindividual real estate investment success.
RETURN AND RISK CHARACTERISTICS
In this section, we review the performance of the FTSE NAREIT CompositeIndex with a range of traditional stock and bond indices as well as anumber of alternative investment indices (i.e., private equity, real estate,commodities, commodity trading advisors [CTAs], and hedge funds) over
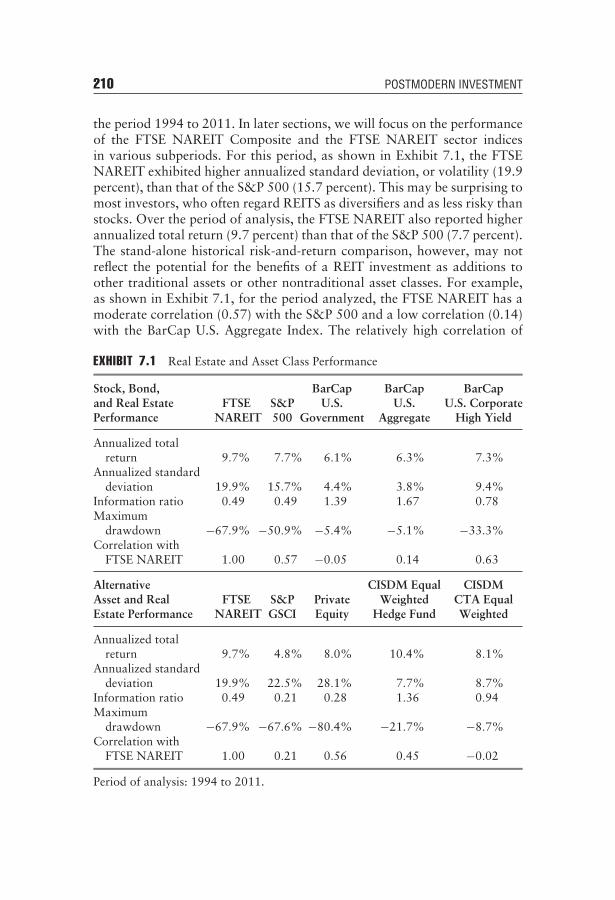
210 POSTMODERN INVESTMENT
the period 1994 to 2011. In later sections, we will focus on the performanceof the FTSE NAREIT Composite and the FTSE NAREIT sector indicesin various subperiods. For this period, as shown in Exhibit 7.1, the FTSENAREIT exhibited higher annualized standard deviation, or volatility (19.9percent), than that of the S&P 500 (15.7 percent). This may be surprising tomost investors, who often regard REITS as diversifiers and as less risky thanstocks. Over the period of analysis, the FTSE NAREIT also reported higherannualized total return (9.7 percent) than that of the S&P 500 (7.7 percent).The stand-alone historical risk-and-return comparison, however, may notreflect the potential for the benefits of a REIT investment as additions toother traditional assets or other nontraditional asset classes. For example,as shown in Exhibit 7.1, for the period analyzed, the FTSE NAREIT has amoderate correlation (0.57) with the S&P 500 and a low correlation (0.14)with the BarCap U.S. Aggregate Index. The relatively high correlation of
EXHIBIT 7.1 Real Estate and Asset Class Performance
Stock, Bond,and Real EstatePerformance
FTSENAREIT
S&P500
BarCapU.S.
Government
BarCapU.S.
Aggregate
BarCapU.S. Corporate
High Yield
Annualized totalreturn 9.7% 7.7% 6.1% 6.3% 7.3%
Annualized standarddeviation 19.9% 15.7% 4.4% 3.8% 9.4%
Information ratio 0.49 0.49 1.39 1.67 0.78Maximum
drawdown −67.9% −50.9% −5.4% −5.1% −33.3%Correlation with
FTSE NAREIT 1.00 0.57 −0.05 0.14 0.63
AlternativeAsset and RealEstate Performance
FTSENAREIT
S&PGSCI
PrivateEquity
CISDM EqualWeighted
Hedge Fund
CISDMCTA EqualWeighted
Annualized totalreturn 9.7% 4.8% 8.0% 10.4% 8.1%
Annualized standarddeviation 19.9% 22.5% 28.1% 7.7% 8.7%
Information ratio 0.49 0.21 0.28 1.36 0.94Maximum
drawdown −67.9% −67.6% −80.4% −21.7% −8.7%Correlation with
FTSE NAREIT 1.00 0.21 0.56 0.45 −0.02
Period of analysis: 1994 to 2011.
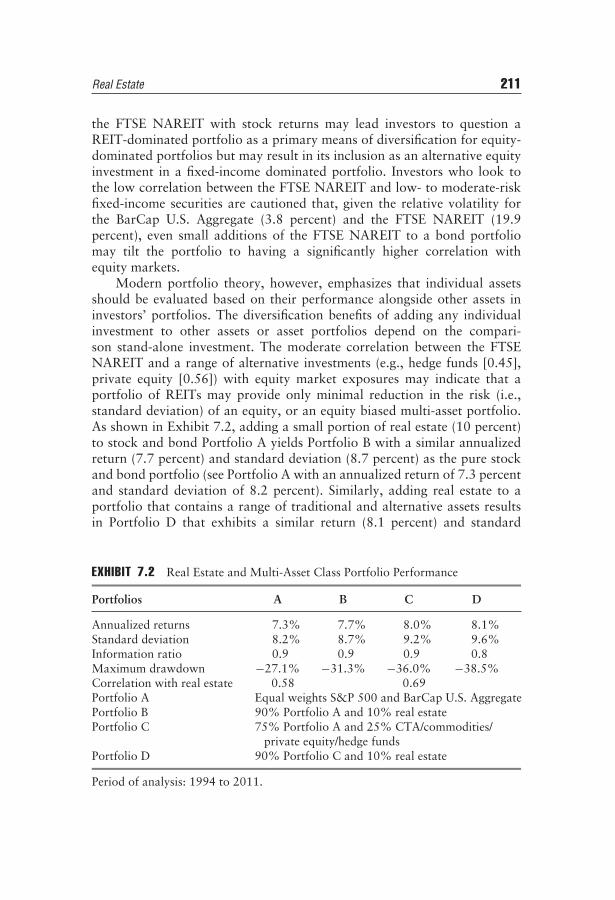
Real Estate 211
the FTSE NAREIT with stock returns may lead investors to question aREIT-dominated portfolio as a primary means of diversification for equity-dominated portfolios but may result in its inclusion as an alternative equityinvestment in a fixed-income dominated portfolio. Investors who look tothe low correlation between the FTSE NAREIT and low- to moderate-riskfixed-income securities are cautioned that, given the relative volatility forthe BarCap U.S. Aggregate (3.8 percent) and the FTSE NAREIT (19.9percent), even small additions of the FTSE NAREIT to a bond portfoliomay tilt the portfolio to having a significantly higher correlation withequity markets.
Modern portfolio theory, however, emphasizes that individual assetsshould be evaluated based on their performance alongside other assets ininvestors’ portfolios. The diversification benefits of adding any individualinvestment to other assets or asset portfolios depend on the compari-son stand-alone investment. The moderate correlation between the FTSENAREIT and a range of alternative investments (e.g., hedge funds [0.45],private equity [0.56]) with equity market exposures may indicate that aportfolio of REITs may provide only minimal reduction in the risk (i.e.,standard deviation) of an equity, or an equity biased multi-asset portfolio.As shown in Exhibit 7.2, adding a small portion of real estate (10 percent)to stock and bond Portfolio A yields Portfolio B with a similar annualizedreturn (7.7 percent) and standard deviation (8.7 percent) as the pure stockand bond portfolio (see Portfolio A with an annualized return of 7.3 percentand standard deviation of 8.2 percent). Similarly, adding real estate to aportfolio that contains a range of traditional and alternative assets resultsin Portfolio D that exhibits a similar return (8.1 percent) and standard
EXHIBIT 7.2 Real Estate and Multi-Asset Class Portfolio Performance
Portfolios A B C D
Annualized returns 7.3% 7.7% 8.0% 8.1%Standard deviation 8.2% 8.7% 9.2% 9.6%Information ratio 0.9 0.9 0.9 0.8Maximum drawdown −27.1% −31.3% −36.0% −38.5%Correlation with real estate 0.58 0.69Portfolio A Equal weights S&P 500 and BarCap U.S. AggregatePortfolio B 90% Portfolio A and 10% real estatePortfolio C 75% Portfolio A and 25% CTA/commodities/
private equity/hedge fundsPortfolio D 90% Portfolio C and 10% real estate
Period of analysis: 1994 to 2011.
212 POSTMODERN INVESTMENT
deviation (9.6 percent) to those of Portfolio C (8.0 percent and 9.2 percent,respectively), which does not contain real estate.
As pointed out for other asset classes, the composite real estate index(i.e., FTSE NAREIT) reflects just one of several alternative REIT indices.Other REIT-based indices may provide different performance results. Inaddition, a composite REIT index covers a wide range of real estate sectors.Exhibit 7.3 shows risk-and-return performance over the 1994–2011 periodfor the FTSE NAREIT Composite Index and various FTSE NAREIT sectorindices. The REIT sector indices report similar standard deviations andcorrelation with the S&P 500 and BarCap U.S. Aggregate, with all of theREIT sector indices reporting a moderate to high correlation (above 0.40)with the S&P 500 and a correlation generally below 0.20 with the BarCapU. S. Aggregate Index.
In summary, there is much in the historical returns for the period1994–2011 to support the view that the relatively high correlation of theFTSE NAREIT with the S&P 500 and the relatively high correlation ofthe FTSE NAREIT sector indices with the S&P 500 is such that manyREIT-based indices may be better regarded as return enhancers than as riskreducers.
THE MYTH OF AVERAGE: REAL ESTATE INVESTMENTTRUST INDEX RETURN IN EXTREME MARKETS
The results in the previous section illustrate the performance of the FTSENAREIT and various sector indices and how they compare to traditionaland alternative investment indices over an 18-year period (1994–2011).However, the relative stand-alone performance of the various REIT indicesand their potential benefits when added to a portfolio of traditional assetsmay differ in various subperiods in comparison to their performance overthe entire period of analysis. This is especially true in periods of equity andfixed-income market stress, when certain REIT strategies may experiencesignificant return movement, similar to the markets in which they trade.
Exhibit 7.4 shows the FTSE NAREIT Index and sector indices monthlyreturns ranked on the S&P 500 and grouped into three segments (bottom,middle, and top) of 72 months each, with average returns for each NAREITindex and sector index presented. Results show that the NAREIT indices andsector indices would have had negative returns (but less negative than theS&P 500 except in one sector [see Lodging/Resorts]) in the worst S&P 500return months and would have provided positive returns (but less positivethan the S&P 500 except in one sector [see Lodging/Resorts]) in the best S&P500 return months. The comparable performance in up and down S&P 500markets may be partially caused by the economic conditions driving both

EXHIBIT 7.3 Real Estate Index Performance
FTSENAREIT
EquityIndustrial/
OfficeEquityOffice
EquityIndustrial
EquityRetail
EquityShoppingCenters
EquityRegional
Malls
EquityFree
StandingEquity
ResidentialEquity
Apartments
EquityManufactured
HomesEquity
Diversified
EquityHealthCare
EquityLodging/Resorts
EquitySelf
Storage
Annualizedreturn 9.7% 10.1% 11.2% 7.5% 11.0% 9.1% 12.9% 13.5% 12.1% 12.3% 9.2% 8.3% 13.2% 3.6% 16.0%
Annualizedstandarddeviation 19.9% 23.9% 22.8% 32.7% 23.6% 23.0% 27.6% 17.7% 20.4% 20.8% 18.4% 22.3% 21.4% 32.9% 20.2%
Informationratio 0.49 0.42 0.49 0.23 0.47 0.39 0.47 0.76 0.59 0.59 0.50 0.37 0.62 0.11 0.79
Maximumdrawdown −67.9% −74.8% −70.9%−85.4%−75.3%−72.9% −82.0% −37.9% −67.0% −67.7% −47.5% −68.8% −48.1%−83.9%−51.6%
Correlationwith S&P500 0.57 0.56 0.56 0.48 0.49 0.50 0.46 0.42 0.53 0.52 0.45 0.54 0.43 0.58 0.40
Correlationwith BarCapAggregate 0.14 0.13 0.11 0.19 0.13 0.15 0.09 0.22 0.05 0.04 0.17 0.11 0.19 0.02 0.17
Correlationwith realestate 1.00 0.97 0.95 0.86 0.96 0.95 0.91 0.81 0.90 0.90 0.76 0.93 0.84 0.83 0.84
Period of analysis: 1994 to 2011.
213

Average/Middle Third Months (%)Average/Bottom Third Months (%) Average/Top Third Months (%)S&P 500FTSE NAREITEquity industrial/officeEquity officeEquity industrialEquity retailEquity shopping centersEquity regional mallsEquity free standingEquity residentialEquity apartmentsEquity manufactured homesEquity diversifiedEquity health careEquity lodging/resortsEquity self storage
–4.3–2.7–3.2–3.1–3.7–2.5–2.6–2.6–1.6–2.2–2.3–1.7–2.9–1.9–4.8–1.2
1.22.02.42.42.92.42.12.72.31.91.91.41.72.31.52.4
5.33.63.94.14.13.53.43.92.93.73.82.93.83.25.53.1
–6.0%–4.0%–2.0%
0.0%2.0%4.0%6.0%8.0%
Aver
age
Mon
thly
Retu
rn
EXHIBIT 7.4 Real Estate Indices: Monthly Returns Ranked on S&P 500Period of analysis: 1994 to 2011.
214
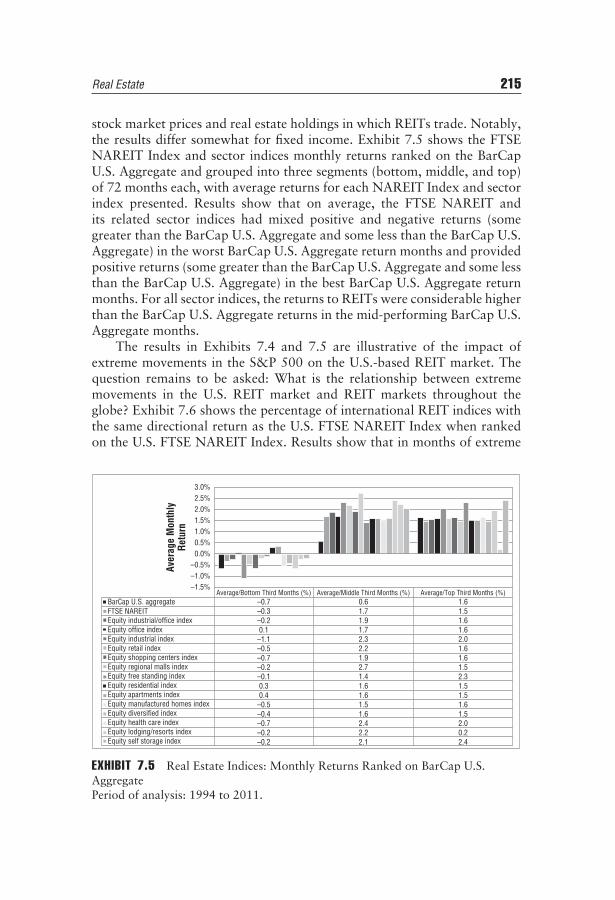
Real Estate 215
stock market prices and real estate holdings in which REITs trade. Notably,the results differ somewhat for fixed income. Exhibit 7.5 shows the FTSENAREIT Index and sector indices monthly returns ranked on the BarCapU.S. Aggregate and grouped into three segments (bottom, middle, and top)of 72 months each, with average returns for each NAREIT Index and sectorindex presented. Results show that on average, the FTSE NAREIT andits related sector indices had mixed positive and negative returns (somegreater than the BarCap U.S. Aggregate and some less than the BarCap U.S.Aggregate) in the worst BarCap U.S. Aggregate return months and providedpositive returns (some greater than the BarCap U.S. Aggregate and some lessthan the BarCap U.S. Aggregate) in the best BarCap U.S. Aggregate returnmonths. For all sector indices, the returns to REITs were considerable higherthan the BarCap U.S. Aggregate returns in the mid-performing BarCap U.S.Aggregate months.
The results in Exhibits 7.4 and 7.5 are illustrative of the impact ofextreme movements in the S&P 500 on the U.S.-based REIT market. Thequestion remains to be asked: What is the relationship between extrememovements in the U.S. REIT market and REIT markets throughout theglobe? Exhibit 7.6 shows the percentage of international REIT indices withthe same directional return as the U.S. FTSE NAREIT Index when rankedon the U.S. FTSE NAREIT Index. Results show that in months of extreme
Average/Middle Third Months (%)Average/Bottom Third Months (%) Average/Top Third Months (%)BarCap U.S. aggregateFTSE NAREITEquity industrial/office indexEquity office indexEquity industrial indexEquity retail indexEquity shopping centers indexEquity regional malls indexEquity free standing indexEquity residential indexEquity apartments indexEquity manufactured homes indexEquity diversified indexEquity health care indexEquity lodging/resorts indexEquity self storage index
–0.7–0.3–0.20.1
–1.1–0.5–0.7–0.2–0.10.30.4
–0.5–0.4–0.7–0.2–0.2
0.61.71.91.72.32.21.92.71.41.61.61.51.62.42.22.1
1.61.51.61.62.01.61.61.52.31.51.51.61.52.00.22.4
–1.5%–1.0%–0.5%0.0%0.5%1.0%1.5%2.0%2.5%3.0%
Aver
age
Mon
thly
Retu
rn
EXHIBIT 7.5 Real Estate Indices: Monthly Returns Ranked on BarCap U.S.AggregatePeriod of analysis: 1994 to 2011.
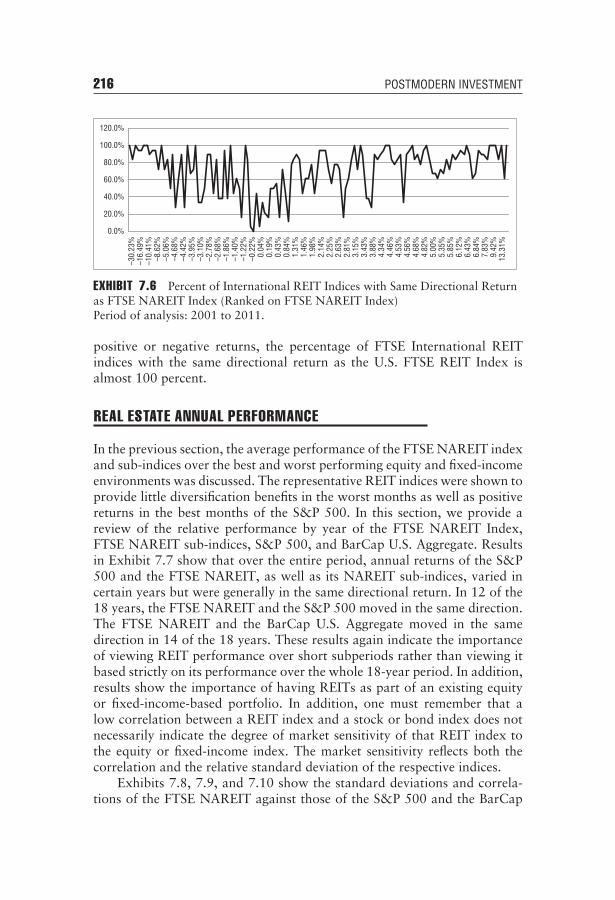
216 POSTMODERN INVESTMENT
0.0%
20.0%
40.0%
60.0%
80.0%
100.0%
120.0%–3
0.23
%–1
6.49
%–1
0.41
%–8
.62%
–5.0
6%–4
.68%
–4.4
2%–3
.95%
–3.1
0%–2
.78%
–2.6
8%–1
.86%
–1.4
0%–1
.22%
–0.2
2%0.
04%
0.19
%0.
43%
0.84
%1.
31%
1.46
%1.
98%
2.14
%2.
25%
2.63
%2.
81%
3.15
%3.
43%
3.88
%4.
34%
4.46
%4.
53%
4.56
%4.
68%
4.82
%5.
00%
5.35
%5.
85%
6.12
%6.
43%
6.84
%7.
83%
9.42
%13
.31%
EXHIBIT 7.6 Percent of International REIT Indices with Same Directional Returnas FTSE NAREIT Index (Ranked on FTSE NAREIT Index)Period of analysis: 2001 to 2011.
positive or negative returns, the percentage of FTSE International REITindices with the same directional return as the U.S. FTSE REIT Index isalmost 100 percent.
REAL ESTATE ANNUAL PERFORMANCE
In the previous section, the average performance of the FTSE NAREIT indexand sub-indices over the best and worst performing equity and fixed-incomeenvironments was discussed. The representative REIT indices were shown toprovide little diversification benefits in the worst months as well as positivereturns in the best months of the S&P 500. In this section, we provide areview of the relative performance by year of the FTSE NAREIT Index,FTSE NAREIT sub-indices, S&P 500, and BarCap U.S. Aggregate. Resultsin Exhibit 7.7 show that over the entire period, annual returns of the S&P500 and the FTSE NAREIT, as well as its NAREIT sub-indices, varied incertain years but were generally in the same directional return. In 12 of the18 years, the FTSE NAREIT and the S&P 500 moved in the same direction.The FTSE NAREIT and the BarCap U.S. Aggregate moved in the samedirection in 14 of the 18 years. These results again indicate the importanceof viewing REIT performance over short subperiods rather than viewing itbased strictly on its performance over the whole 18-year period. In addition,results show the importance of having REITs as part of an existing equityor fixed-income-based portfolio. In addition, one must remember that alow correlation between a REIT index and a stock or bond index does notnecessarily indicate the degree of market sensitivity of that REIT index tothe equity or fixed-income index. The market sensitivity reflects both thecorrelation and the relative standard deviation of the respective indices.
Exhibits 7.8, 7.9, and 7.10 show the standard deviations and correla-tions of the FTSE NAREIT against those of the S&P 500 and the BarCap

1994 1995 1996 1997 1998 1999 2000 2001 2002 2004 2005 2006 2007 2008 2009 2010 2011S&P 500 BarCap U.S. aggregateFTSE NAREIT indexEquity industrial/officeEquity officeEquity industrial Equity retail Equity shopping centers Equity regional malls Equity free standing Equity residentialEquity apartments Equity manufactured homesEquity diversifiedEquity health care Equity lodging/resorts Equity self storage
1.3%
–2.9%
0.8%
16.6%
2.9%
18.7%
3.0%
1.3%
8.8%
–5.5%
2.3%
2.2%
3.3%
–6.0%
4.1%
–8.9%
8.9%
37.6%
18.5%
18.3%
25.8%
38.8%
16.2%
5.1%
7.4%
3.0%
31.6%
12.0%
12.3%
10.7%
21.1%
24.9%
30.8%
34.4%
23.0%
3.6%
35.8%
44.4%
51.8%
37.2%
34.6%
33.5%
45.3%
30.9%
29.5%
28.9%
34.9%
34.0%
20.4%
49.2%
42.8%
33.4%
9.7%
18.9%
27.5%
29.0%
19.0%
16.9%
21.4%
13.7%
17.7%
16.3%
16.0%
16.2%
21.7%
15.8%
30.1%
3.4%
28.6%
8.7%
–18.8%
–14.4%
–17.4%
–11.7%
–4.7%
–7.0%
–2.6%
–6.2%
–8.1%
–8.8%
–0.9%
–22.1%
–17.4%
–52.8%
–7.2%
21.0%
–0.8%
–6.5%
3.4%
4.3%
3.9%
–11.8%
–10.7%
–14.6%
–4.9%
9.5%
10.7%
–2.8%
–14.4%
–24.8%
–16.1%
–8.0%
–9.1%
11.6%
25.9%
33.4%
35.5%
28.6%
18.0%
15.1%
23.5%
8.9%
34.3%
35.5%
20.9%
24.1%
25.8%
45.8%
14.7%
–11.9%
8.4%
15.5%
7.1%
6.6%
7.4%
30.4%
29.9%
31.9%
24.0%
9.0%
8.7%
13.7%
12.5%
51.8%
–8.6%
43.2%
–22.1%
10.3%
5.2%
0.9%
–6.3%
17.3%
21.1%
17.7%
24.6%
21.8%
-6.0%
–6.1%
–4.1%
4.2%
4.8%
–1.5%
0.6%
2003
28.7%
4.1%
38.5%
33.3%
34.0%
33.1%
46.8%
43.1%
52.2%
35.9%
25.9%
25.5%
30.0%
40.3%
53.6%
31.7%
38.1%
10.9%
4.3%
30.4%
25.2%
23.3%
34.1%
40.2%
36.3%
45.0%
32.9%
32.7%
34.7%
6.4%
32.4%
21.0%
32.7%
29.7%
4.9%
2.4%
8.3%
12.9%
13.1%
15.4%
11.8%
9.3%
16.5%
–0.5%
13.7%
14.7%
–2.6%
9.9%
1.8%
9.8%
26.5%
15.8%
4.3%
34.4%
39.4%
45.2%
28.9%
29.0%
34.9%
23.8%
30.7%
38.9%
39.9%
15.3%
38.0%
44.5%
28.2%
40.9%
5.5%
7.0%
17.8%
14.9%
19.0%
0.4%
–15.8%
–17.7%
–15.9%
–0.4%
–25.2%
–25.4%
–19.3%
–22.3%
–2.1%
–22.4%
–24.8%
–37.0%
5.2%
–37.3%
–50.3%
–41.1%
–67.5%
–48.4%
–38.8%
–60.6%
–15.1%
–24.9%
–25.1%
–20.2%
–28.2%
–12.0%
–59.7%
5.0%
26.5%
5.9%
27.4%
29.2%
35.5%
12.2%
27.2%
–1.7%
63.0%
25.9%
30.8%
30.4%
40.9%
17.0%
24.6%
67.2%
8.4%
15.1%
6.5%
27.6%
17.0%
18.4%
18.9%
33.4%
30.8%
34.6%
37.4%
46.0%
47.0%
27.0%
23.8%
19.2%
42.8%
29.3%
2.1%
7.8%
7.3%
–1.5%
–0.8%
–5.2%
12.2%
–0.7%
22.0%
0.4%
15.4%
15.1%
20.4%
2.8%
13.6%
–14.3%
35.2%
-
-
–80.0%–60.0%–40.0%–20.0%
0.0%20.0%40.0%60.0%80.0%
EXHIBIT 7.7 Real Estate Indices: Annual Returns
217

1994 1995 1996 1997 1998 1999 2000 2001 2002 2003 2004 2005 2006 2007 2008 2009 2010 201110.6%
4.4%11.2%12.6%13.0%18.7%11.4%11.4%
8.9%14.6%17.0%17.0%18.8%
7.9%13.5%14.1%11.8%
5.2%3.5%7.7%9.0%8.3%
10.1%8.8%8.6%9.2%
12.7%10.4%10.2%13.8%
6.1%8.5%9.6%7.9%
10.9%4.3%9.5%
13.4%14.7%12.6%10.1%10.1%11.9%11.8%
8.7%8.4%
13.0%9.6%8.7%
15.1%13.8%
15.9%3.6%
10.4%16.3%20.5%10.8%
8.0%7.1%
10.2%15.5%10.4%10.9%10.0%
9.7%9.6%
19.1%14.8%
21.5%2.7%
14.6%14.7%15.5%17.1%12.4%14.2%10.4%16.7%11.2%11.6%11.3%16.0%13.1%22.5%19.3%
13.1%2.7%
13.3%14.9%17.0%10.4%12.1%11.6%15.0%15.5%13.0%13.0%13.6%14.3%15.6%18.0%16.2%
17.2%2.8%
14.1%14.2%14.5%13.2%14.0%13.2%17.7%11.0%16.0%16.5%16.3%15.2%24.8%22.2%16.8%
19.9%3.8%
10.8%13.0%14.3%12.6%11.2%
6.4%18.2%
8.5%12.5%13.6%
7.5%9.5%
11.9%41.6%13.0%
20.6%3.7%
12.0%14.7%16.2%11.5%
9.3%7.8%
11.4%14.8%16.6%17.2%15.3%12.0%12.0%23.3%18.6%
11.4%5.3%8.3%8.0%8.8%8.6%7.7%7.4%9.5%8.2%9.4%9.3%
18.2%11.4%16.4%26.8%14.8%
7.3%4.0%
21.0%20.8%19.5%23.5%25.1%22.8%28.5%19.3%15.6%16.0%17.1%20.8%23.5%16.8%22.5%
7.9%3.1%
15.1%15.5%15.4%18.3%18.2%16.4%21.1%13.7%17.5%18.0%12.5%16.0%16.4%13.6%12.5%
5.6%2.7%
11.8%14.7%14.7%16.4%13.2%14.9%13.7%18.0%13.9%14.1%14.1%14.7%12.9%13.5%16.8%
9.7%2.6%
19.6%19.7%20.5%20.2%24.9%24.3%27.9%19.2%24.9%25.3%18.4%19.9%26.7%20.8%23.8%
21.0%6.1%
43.4%59.5%48.9%
104.9%53.5%53.6%58.1%38.5%36.6%36.8%39.0%41.1%50.8%47.6%36.9%
22.3%3.3%
44.0%52.3%50.3%63.8%58.3%57.1%71.5%30.8%46.3%47.7%30.3%60.5%38.0%85.5%38.5%
19.3%2.9%
18.7%21.2%20.8%25.5%21.1%22.7%23.3%14.2%22.6%22.8%23.0%24.2%16.5%36.8%20.2%
15.9%2.4%
21.0%25.8%24.2%35.0%22.7%22.6%25.3%11.7%23.7%24.2%16.6%22.3%18.5%38.8%21.8%
0.0%
20.0%
40.0%
60.0%
80.0%
100.0%
120.0%
S&P 500
BarCap U.S. aggregate
FTSE NAREIT index
Equity industrial/office
Equity office
Equity industrial
Equity retail
Equity shopping centers
Equity regional malls
Equity free standing
Equity residential
Equity apartments
Equity manufactured homes
Equity diversified
Equity health care
Equity lodging/resorts
Equity self storage
EXHIBIT 7.8 Real Estate Indices: Annual Standard Deviations
218

1994 1995 1996 1997 1998 1999 2000 2001 2002 2003 2004 2005 2006 2007 2008 2009 2010 2011
BarCap U.S. aggregate
FTSE NAREIT
Equity industrial/office
Equity office
Equity industrial
Equity retail
Equity shopping centers
Equity regional malls
Equity free-standing
Equity residential
Equity apartments
Equity manufactured homes
Equity diversified
Equity health care
Equity lodging/resorts
Equity self storage
0.76
0.44
0.43
0.61
0.09
0.30
0.29
0.12
0.44
0.32
0.31
0.36
0.72
0.32
0.05
0.65
0.22
0.33
0.09
0.00
–0.02
0.43
0.45
0.38
0.17
0.31
0.31
0.26
0.20
0.04
0.43
0.03
0.51
–0.03
–0.07
0.01
–0.15
–0.17
–0.21
–0.11
0.07
–0.07
–0.07
–0.05
0.16
0.03
0.32
0.05
0.68
0.53
0.42
0.40
0.52
0.42
0.36
0.44
0.57
0.61
0.59
0.64
0.27
0.63
0.29
0.28
–0.42
0.71
0.68
0.76
0.54
0.74
0.81
0.59
0.45
0.61
0.59
0.55
0.74
0.59
0.51
0.56
0.34
0.33
0.35
0.29
0.57
–0.01
0.13
–0.11
–0.15
0.35
0.35
0.40
0.26
0.39
0.43
0.19
0.40
–0.12
0.03
0.00
0.13
–0.30
–0.06
–0.42
–0.44
–0.11
–0.10
–0.08
–0.23
–0.07
–0.20
–0.04
–0.40
0.43
0.17
0.05
0.44
0.52
0.30
0.59
0.30
0.13
0.14
–0.19
0.46
0.05
0.68
0.04
–0.72
0.28
0.27
0.32
0.02
–0.03
0.14
–0.16
0.04
0.39
0.42
–0.25
0.28
0.28
0.36
–0.29
–0.04
0.58
0.40
0.57
–0.06
0.14
0.03
0.16
0.50
0.55
0.52
0.47
0.49
0.69
0.59
0.19
0.06
0.44
0.40
0.39
0.39
0.37
0.38
0.35
0.46
0.48
0.46
0.57
0.46
0.29
0.58
0.35
–0.19
0.69
0.68
0.62
0.75
0.65
0.71
0.57
0.81
0.56
0.56
0.31
0.60
0.57
0.67
0.55
0.28
0.56
0.31
0.25
0.35
0.66
0.50
0.69
0.67
0.40
0.40
0.41
0.60
0.57
0.47
0.46
–0.44
0.76
0.73
0.74
0.61
0.57
0.52
0.57
0.57
0.78
0.78
0.78
0.74
0.51
0.72
0.57
0.35
0.83
0.82
0.87
0.65
0.80
0.77
0.82
0.64
0.73
0.73
0.73
0.84
0.65
0.86
0.61
0.64
0.89
0.82
0.79
0.89
0.78
0.78
0.73
0.86
0.91
0.91
0.81
0.84
0.89
0.81
0.84
–0.58
0.88
0.92
0.87
0.92
0.82
0.91
0.70
0.71
0.67
0.65
0.85
0.79
0.65
0.87
0.72
–0.35
0.95
0.92
0.88
0.90
0.93
0.89
0.93
0.50
0.79
0.79
0.54
0.90
0.88
0.89
0.86
–1.00–0.80–0.60–0.40–0.200.000.200.400.600.801.001.20
EXHIBIT 7.9 Real Estate Indices: Annual Correlation with S&P 500
219

1994 1995 1996 1997 1998 1999 2000 2001 2002 2003 2004 2005 2006 2007 2008 2009 2010 2011
S&P 500
FTSE NAREIT
Equity industrial/office
Equity office
Equity industrial
Equity retail
Equity shopping centers
Equity regional malls
Equity free-standing
Equity residential
Equity apartments
Equity manufactured homes
Equity diversified
Equity health care
Equity lodging/resorts
Equity self storage
0.76
0.34
0.34
0.41
0.11
0.30
0.30
0.22
0.12
0.20
0.21
0.10
0.41
0.06
–0.04
0.61
0.22
0.36
0.31
0.42
0.26
0.23
0.21
0.24
0.63
0.12
0.13
0.06
0.59
–0.06
0.04
–0.37
0.51
0.00
–0.11
–0.20
–0.05
–0.13
0.01
–0.30
0.25
–0.02
0.00
–0.15
0.06
0.06
0.01
0.02
0.68
0.34
0.26
0.20
0.55
0.27
0.28
0.11
0.39
0.26
0.23
0.63
0.11
0.47
0.26
0.17
–0.42
0.25
0.29
0.15
0.47
0.22
0.13
0.27
0.56
0.29
0.31
–0.05
–0.03
0.34
0.01
0.38
0.34
–0.03
–0.15
–0.20
0.02
–0.21
–0.18
–0.29
0.02
–0.08
–0.08
–0.10
0.07
0.26
0.19
–0.05
0.40
–0.01
0.04
0.00
0.18
–0.23
-0.08
–0.34
–0.08
0.12
0.12
0.02
0.11
–0.20
–0.22
0.26
–0.40
–0.68
–0.72
–0.68
–0.69
–0.37
–0.37
–0.35
–0.28
–0.70
–0.70
0.14
–0.68
0.21
–0.45
–0.20
–0.72
–0.36
–0.32
–0.33
–0.25
–0.17
–0.28
–0.03
–0.31
–0.39
–0.42
0.24
–0.37
–0.57
–0.46
–0.06
–0.04
–0.03
0.29
0.14
0.56
–0.21
–0.13
–0.26
0.00
–0.26
–0.34
0.33
0.00
0.02
0.01
0.10
0.06
0.74
0.75
0.78
0.69
0.79
0.75
0.80
0.76
0.60
0.57
0.71
0.61
0.80
0.55
0.67
–0.19
–0.04
–0.18
–0.21
–0.12
0.06
0.08
0.06
0.02
–0.20
–0.21
0.16
0.04
0.14
0.08
–0.06
0.28
0.27
0.25
0.14
0.48
0.35
0.26
0.38
0.23
0.21
0.21
0.16
0.29
0.49
0.02
0.39
–0.44
–0.12
–0.08
–0.16
0.16
0.15
0.17
0.11
0.11
–0.49
–0.49
–0.18
–0.26
0.18
–0.30
0.07
0.35
0.32
0.38
0.32
0.46
0.31
0.36
0.24
0.22
0.20
0.19
0.26
0.24
0.21
0.30
0.28
0.64
0.43
0.38
0.37
0.47
0.30
0.31
0.25
0.52
0.44
0.43
0.49
0.36
0.57
0.28
0.46
–0.58
–0.39
–0.45
–0.37
–0.61
–0.39
–0.41
–0.37
–0.07
–0.27
–0.27
–0.34
–0.24
–0.18
–0.51
–0.29
–0.35
–0.08
–0.09
–0.01
–0.27
–0.02
0.04
–0.08
0.29
0.16
0.16
0.26
–0.03
0.01
–0.33
–0.05
–0.80–0.60–0.40–0.20
0.000.200.400.600.801.00
EXHIBIT 7.10 Real Estate Indices: Annual Correlation with BarCap U.S.Aggregate
220
Real Estate 221
U.S. Aggregate. Results in Exhibit 7.8 show that the standard deviation ofthe FTSE NAREIT was generally below that of the S&P 500 prior to 2003,generally above that of the S&P 500 post-2003, and consistently above thatof the BarCap U.S. Aggregate in all years. These results, however, showdramatic changes over the years in the volatility of the FTSE NAREIT.There are various reasons for this changing risk, including both increases inthe underlying volatility of the markets in which REITs trade and the factthat the FTSE NAREIT itself has changed over time.
Exhibits 7.9 and 7.10 show the intra-year correlation between the FTSENAREIT and its sub-indices and both the S&P 500 and the BarCap U.S.Aggregate. The correlation varies considerably over the years of analysis;however, the correlation with the S&P 500 remains fairly stable post-2003.In sum, investors should be aware that results from longer time framesmay not reflect results for individual years. For REITs, lengthy periodsof analysis may hide more than they reveal. Although composite REITsindices generally report relatively consistent correlation with the stockmarket over time, particularly post-2003, their volatility and correlationwith fixed-income markets change from year to year. One example ofthe changing economic conditions on REIT investment, however, may beseen in the relative performance of one particular REIT sector—that is,the self-storage REIT. During the past four years, in those periods withnegative REIT returns, the self-storage REIT has remained positive. Wheninvestors remark that they are currently invested in REITs or that they haverecently added REITs to their portfolio, they must also detail the exactstrategy invested in and, if they invested in the strategy based on these REITindices, the degree to which their investment reflects the performance of therepresentative REIT index.
PERFORMANCE IN 2008
In 2008, REITs experienced their lowest return for the period analyzed.When compared to the returns (–37.0 percent) and volatility (21.0 percent)of the S&P 500, the FTSE NAREIT reported similar low returns (–37.3 per-cent) and higher volatility (43.4 percent). In 2008, the correlation betweenthe FTSE NAREIT and the S&P 500 was 0.83. This correlation was par-tially caused by the common decline in valuation in the fall of 2008. Inshort, in 2008, most REIT indices, like those of traditional asset classes,were negatively impacted by the subprime crisis, the negative equity marketperformance, and the rise in credit spreads (e.g., decline in high-yield bondreturns). As shown in Exhibit 7.7, this was especially true for REITs withexposure to equity markets (e.g., industrial). In contrast, certain real estateindices (e.g., health care) with less direct equity exposure provided smallernegative returns.
222 POSTMODERN INVESTMENT
THE U.S. REAL ESTATE “BUBBLE” AND THE SUBPRIMEMORTGAGE CRISIS OF 2007 TO 2010
Real estate valuations collapsed in 2007 when, according to the S&P/Case-Shiller Home Price Indices, home prices in the United States experienced an8.9 percent decline through 2010, the first yearly drop in 16 years and thelargest decline in home prices in at least the past 20 years. Was this really areal estate bubble that was bursting? Some researchers5 argue that bubblesare more likely to develop in the housing market than in the stock marketfor the following reasons:
■ Real estate markets lack a central exchange and are quite illiquid.■ Short selling is almost impossible in the underlying real estate market,
especially in particular regions. Consequently, prices tend to be drivenby individuals who overestimate potential value.
■ Lenders whose primary business is real estate lending and who have theability to off-load loans tend to increase lending as much as possibleduring real estate booms.
■ Real estate supply tends to adapt slowly over time, and the supply seenat the time of construction may no longer reflect the demand of the day.
■ Real estate markets with stricter planning and building regulationsexhibit greater uncertainty as to supply adjustments, increasingvolatility.
Some research also contends that there is evidence that property pricesare ‘‘sticky downwards’’ in the declining phase of real estate cycles.6 Thisresearch argues that prices do not tend to fall because owners set minimumreservation prices, below which they are unwilling to sell. As a result, thenumber of real estate transactions declines when property prices decline.Others, analyzing data from downtown Boston in the 1990s, argue thatloss-aversion determines seller behavior in the housing market, and thatthere is a positive price-volume relationship in the real estate market.7
To complicate matters, a mortgage crisis erupted in 2007, related to asharp decline in home prices. Some of the research during this era suggeststhat a rapid expansion in the supply of mortgages, which had been drivenby disintermediation in the mortgage industry, can explain a large fractionof the initial U.S. house price appreciation.8 The research also argues thatthe expansion in the mortgage supply was targeted at subprime loans, asector of the market consisting of high-default-risk borrowers, who aretraditionally unable to borrow in the mortgage market. The resulting sharpshift in mortgage supply caused a significant increase in the risk profile ofborrowers and pressed housing prices upward. Subsequently, when defaultrates started to increase in 2007, they had the effect of depressing thehousing market.
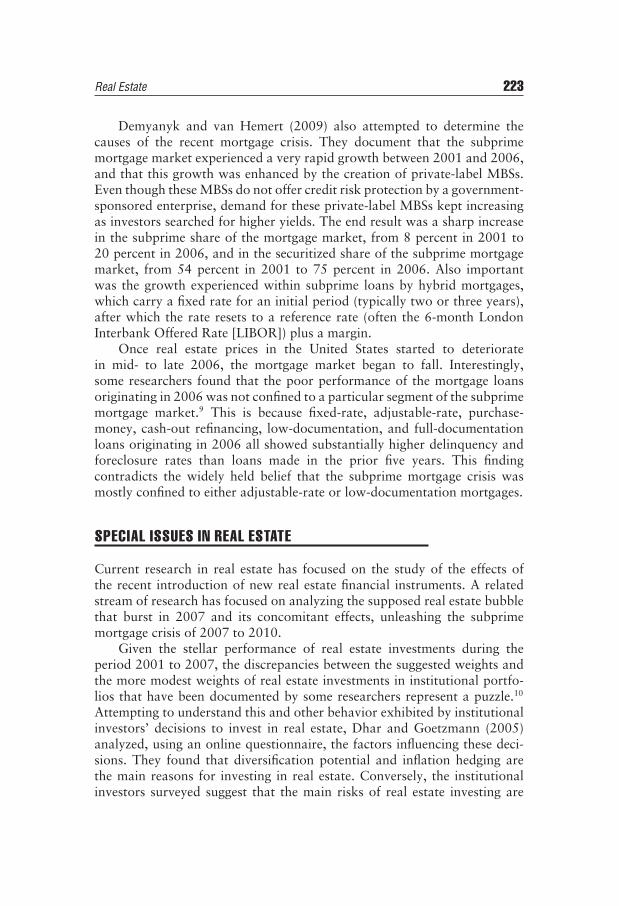
Real Estate 223
Demyanyk and van Hemert (2009) also attempted to determine thecauses of the recent mortgage crisis. They document that the subprimemortgage market experienced a very rapid growth between 2001 and 2006,and that this growth was enhanced by the creation of private-label MBSs.Even though these MBSs do not offer credit risk protection by a government-sponsored enterprise, demand for these private-label MBSs kept increasingas investors searched for higher yields. The end result was a sharp increasein the subprime share of the mortgage market, from 8 percent in 2001 to20 percent in 2006, and in the securitized share of the subprime mortgagemarket, from 54 percent in 2001 to 75 percent in 2006. Also importantwas the growth experienced within subprime loans by hybrid mortgages,which carry a fixed rate for an initial period (typically two or three years),after which the rate resets to a reference rate (often the 6-month LondonInterbank Offered Rate [LIBOR]) plus a margin.
Once real estate prices in the United States started to deterioratein mid- to late 2006, the mortgage market began to fall. Interestingly,some researchers found that the poor performance of the mortgage loansoriginating in 2006 was not confined to a particular segment of the subprimemortgage market.9 This is because fixed-rate, adjustable-rate, purchase-money, cash-out refinancing, low-documentation, and full-documentationloans originating in 2006 all showed substantially higher delinquency andforeclosure rates than loans made in the prior five years. This findingcontradicts the widely held belief that the subprime mortgage crisis wasmostly confined to either adjustable-rate or low-documentation mortgages.
SPECIAL ISSUES IN REAL ESTATE
Current research in real estate has focused on the study of the effects ofthe recent introduction of new real estate financial instruments. A relatedstream of research has focused on analyzing the supposed real estate bubblethat burst in 2007 and its concomitant effects, unleashing the subprimemortgage crisis of 2007 to 2010.
Given the stellar performance of real estate investments during theperiod 2001 to 2007, the discrepancies between the suggested weights andthe more modest weights of real estate investments in institutional portfo-lios that have been documented by some researchers represent a puzzle.10
Attempting to understand this and other behavior exhibited by institutionalinvestors’ decisions to invest in real estate, Dhar and Goetzmann (2005)analyzed, using an online questionnaire, the factors influencing these deci-sions. They found that diversification potential and inflation hedging arethe main reasons for investing in real estate. Conversely, the institutionalinvestors surveyed suggest that the main risks of real estate investing are
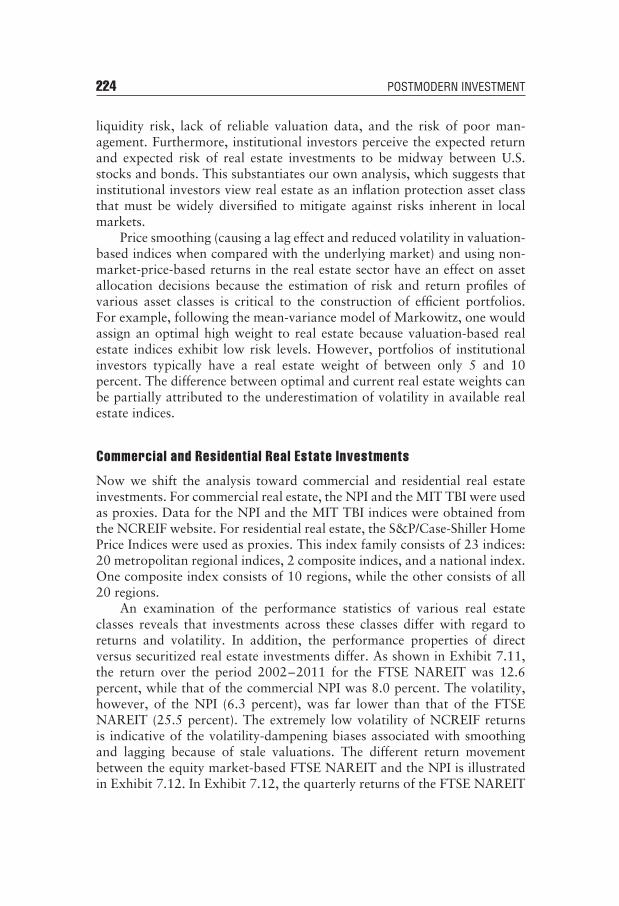
224 POSTMODERN INVESTMENT
liquidity risk, lack of reliable valuation data, and the risk of poor man-agement. Furthermore, institutional investors perceive the expected returnand expected risk of real estate investments to be midway between U.S.stocks and bonds. This substantiates our own analysis, which suggests thatinstitutional investors view real estate as an inflation protection asset classthat must be widely diversified to mitigate against risks inherent in localmarkets.
Price smoothing (causing a lag effect and reduced volatility in valuation-based indices when compared with the underlying market) and using non-market-price-based returns in the real estate sector have an effect on assetallocation decisions because the estimation of risk and return profiles ofvarious asset classes is critical to the construction of efficient portfolios.For example, following the mean-variance model of Markowitz, one wouldassign an optimal high weight to real estate because valuation-based realestate indices exhibit low risk levels. However, portfolios of institutionalinvestors typically have a real estate weight of between only 5 and 10percent. The difference between optimal and current real estate weights canbe partially attributed to the underestimation of volatility in available realestate indices.
Commercial and Residential Real Estate Investments
Now we shift the analysis toward commercial and residential real estateinvestments. For commercial real estate, the NPI and the MIT TBI were usedas proxies. Data for the NPI and the MIT TBI indices were obtained fromthe NCREIF website. For residential real estate, the S&P/Case-Shiller HomePrice Indices were used as proxies. This index family consists of 23 indices:20 metropolitan regional indices, 2 composite indices, and a national index.One composite index consists of 10 regions, while the other consists of all20 regions.
An examination of the performance statistics of various real estateclasses reveals that investments across these classes differ with regard toreturns and volatility. In addition, the performance properties of directversus securitized real estate investments differ. As shown in Exhibit 7.11,the return over the period 2002–2011 for the FTSE NAREIT was 12.6percent, while that of the commercial NPI was 8.0 percent. The volatility,however, of the NPI (6.3 percent), was far lower than that of the FTSENAREIT (25.5 percent). The extremely low volatility of NCREIF returnsis indicative of the volatility-dampening biases associated with smoothingand lagging because of stale valuations. The different return movementbetween the equity market-based FTSE NAREIT and the NPI is illustratedin Exhibit 7.12. In Exhibit 7.12, the quarterly returns of the FTSE NAREIT
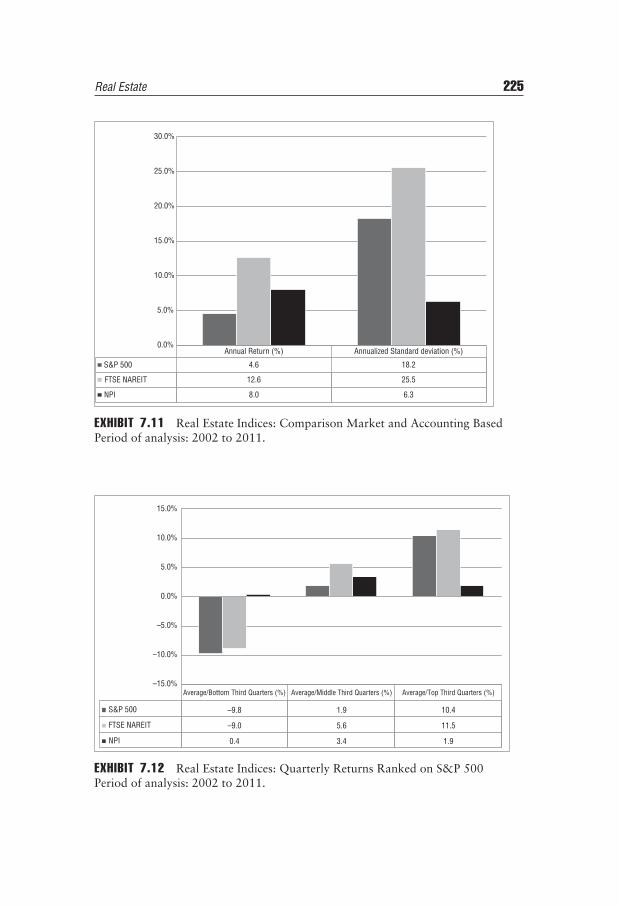
Real Estate 225
Annual Return (%) Annualized Standard deviation (%)
S&P 500 4.6 18.2
FTSE NAREIT 12.6 25.5
NPI 8.0 6.3
0.0%
5.0%
10.0%
15.0%
20.0%
25.0%
30.0%
EXHIBIT 7.11 Real Estate Indices: Comparison Market and Accounting BasedPeriod of analysis: 2002 to 2011.
Average/Middle Third Quarters (%)Average/Bottom Third Quarters (%) Average/Top Third Quarters (%)
S&P 500 –9.8 1.9 10.4
FTSE NAREIT –9.0 5.6 11.5
NPI 0.4 3.4 1.9
–15.0%
–10.0%
–5.0%
0.0%
5.0%
10.0%
15.0%
EXHIBIT 7.12 Real Estate Indices: Quarterly Returns Ranked on S&P 500Period of analysis: 2002 to 2011.
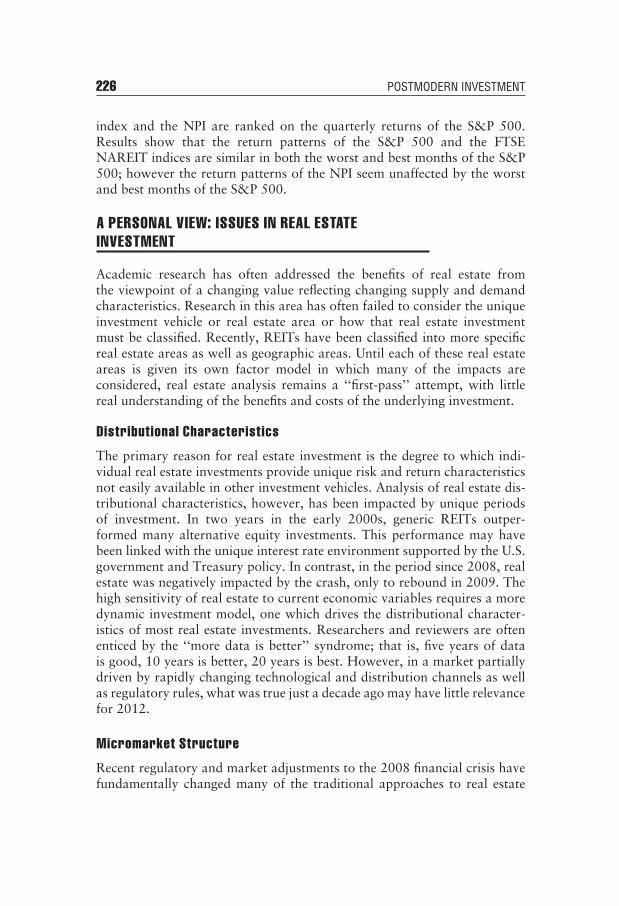
226 POSTMODERN INVESTMENT
index and the NPI are ranked on the quarterly returns of the S&P 500.Results show that the return patterns of the S&P 500 and the FTSENAREIT indices are similar in both the worst and best months of the S&P500; however the return patterns of the NPI seem unaffected by the worstand best months of the S&P 500.
A PERSONAL VIEW: ISSUES IN REAL ESTATEINVESTMENT
Academic research has often addressed the benefits of real estate fromthe viewpoint of a changing value reflecting changing supply and demandcharacteristics. Research in this area has often failed to consider the uniqueinvestment vehicle or real estate area or how that real estate investmentmust be classified. Recently, REITs have been classified into more specificreal estate areas as well as geographic areas. Until each of these real estateareas is given its own factor model in which many of the impacts areconsidered, real estate analysis remains a ‘‘first-pass’’ attempt, with littlereal understanding of the benefits and costs of the underlying investment.
Distributional Characteristics
The primary reason for real estate investment is the degree to which indi-vidual real estate investments provide unique risk and return characteristicsnot easily available in other investment vehicles. Analysis of real estate dis-tributional characteristics, however, has been impacted by unique periodsof investment. In two years in the early 2000s, generic REITs outper-formed many alternative equity investments. This performance may havebeen linked with the unique interest rate environment supported by the U.S.government and Treasury policy. In contrast, in the period since 2008, realestate was negatively impacted by the crash, only to rebound in 2009. Thehigh sensitivity of real estate to current economic variables requires a moredynamic investment model, one which drives the distributional character-istics of most real estate investments. Researchers and reviewers are oftenenticed by the ‘‘more data is better’’ syndrome; that is, five years of datais good, 10 years is better, 20 years is best. However, in a market partiallydriven by rapidly changing technological and distribution channels as wellas regulatory rules, what was true just a decade ago may have little relevancefor 2012.
Micromarket Structure
Recent regulatory and market adjustments to the 2008 financial crisis havefundamentally changed many of the traditional approaches to real estate
Real Estate 227
investment. This is especially true in the structured product and debt area.Today, reduced availability of capital, as well as retractions on bankingstructure and risk exposure, has fundamentally impacted how and wherereal estate capital is obtained. Future research may wish to concentrate lesson what has happened in the developed and undeveloped real estate marketsand more on what may or may not happen in the development of globalreal estate investments.
WHAT EVERY INVESTOR SHOULD KNOW
The world changes. For some, change is good, for others, not so much.Real estate remains, for most individual investors and many institutionalinvestors, the bedrock of their investment portfolio. The forms and typesof real estate investment are numerous and require an in-depth knowledgeof the financial instrument as well as the cash flows or investments theyprovide access to. However, as for private equity, much of real estate ishidden from the public view. As a result, it requires, more than many othermore transparent offerings, a more thorough knowledge of the inside natureof the investment. In this chapter, we provided a brief review of how oldforms of real estate investment evolved over time and how new forms arecurrently being presented. We certainly do not have all the answers for howto best invest in real estate. Today’s real estate is a new world.
■ Before You Buy the House, Go in the Door and Look Around: With theexception of direct investments, real estate investment returns are com-pletely dependent on the business model of the sponsor. The businessmodel reflects items such as accounting practices, leverage used, distri-bution, and management cost. Each is highly volatile, and collectively,they will create return differentials from one product to the next, evenwithin the same sector. Remember, real estate investment forms thatare not valued in open-market exchange-traded environments but arevalued primarily from appraisal or accounting-based approaches oftenhave historical-based risk measures that underestimate the true marketrisk of the investment. Although historical data may show that realestate provides some diversification and return benefits to a traditionalor mixed traditional and alternative investment, those benefits must beconsidered carefully because of potential problems in risk-and-returnestimation.
■ All Homes Look the Same from the Outside: Real estate investmentsrequire a commitment to rigorous due diligence and analysis. Realestate has become a securitized investment scheme, with each level of

228 POSTMODERN INVESTMENT
the scheme containing elements of risk and return. Although relianceon rating agencies can protect an investor from lawsuits regardingnegligence and violation of reasonable-person standards, such reliancecannot protect against deterioration of wealth.
■ Private or Public, There Is a Difference: Although returns differ widelydepending on sectors and timing, traditional public real estate may bebetter viewed as return enhancement vehicles to equity-biased portfo-lios. Investors should realize there is a lot of competition for qualityinvestment. The question is what happens to the bad ones and how arethey sold, especially in an illiquid risk-adverse world (see the section‘‘Performance in 2008’’). Not only should you know how much youown, you should know how much others own of what you own andwho gets out the door first. Also know how big the door is in case of afire. You cannot trust the promise.
MYTHS AND MISCONCEPTIONS OF REAL ESTATE
If any investment vehicle or asset class has undergone a reassessment inrecent years, real estate investment must be near the top. A real estate firmcalled our offices several months ago looking for a new potential hire. Wepointed out that we had many young analysts who might fit the need, butnone of them had direct experience in the real estate area. He answeredthat they were exactly who he was looking for. His final comment struckhome. He said he did not want analysts with experience in real estate sincethey would continue to do things the way they had been done before. Hiscomment made it clear that individuals with experience in the field wouldbring with themselves all the historical myths and misconceptions. We list afew here.
Myth 7.1: Real Estate Investments Are aNatural Diversifier
For many investors, real estate seems like a natural diversifier to traditionalstock and bond markets. While equity portfolios and bond portfolios seemto respond to national or global changes in basic economic factors (e.g.,growth in gross domestic product [GDP], changes in credit spreads), realestate seems more affected by local or regional economic conditions thatmay seem separate from overall economic conditions. For many, real estate(at least if managed well) seems a natural diversifier. Not to overemphasizea point, but recent experience has indicated that in the current nationaland global economic scene, economic impacts seem to affect a broader set
Real Estate 229
of regional and global markets. Even if local conditions dominate, manymodern real estate-based products are based on a diversified set of cashflows where their final value is impacted more by general economic eventsthan is assumed in historical models. This is not to say that certain regionalor specialized real estate products do not act uniquely (e.g., storage-basedREITS in 2008), but today most real estate investments should no longerbe regarded as equity risk diversifiers but as equity return enhancers. Moreimportant, if any concept has been made clear in today’s environment, it isthat real estate is a highly illiquid asset class and that the outcome of thevaluation processes is dependent on the strength of the credit markets.
Myth 7.2: Real Estate Benchmarks Reflect Reality
Most investors are comfortable with investment indices’ (e.g., S&P 500,BarCap U.S. Aggregate) ability to provide a performance benchmark thatreflects the particular style of an investment manager. Although benchmarkindices are common in the areas of stock and bond investment, manyinvestors are not familiar with the various benchmark indices in the realestate area. To the degree that a benchmark exists, many investors use whatis easily available. In the case of real estate, real estate investment trust-basedequity indices are often used to provide a measure of the returns to variousreal estate investments. Of course, as in the traditional asset area, thereexists no one benchmark that reflects the performance of the asset class.Each real estate index (e.g., S&P/Case-Shiller, FTSE NAREIT, Dow Jones)has unique weighting, composition, and structural issues (market based oraccounting based), just as equity indices (e.g., S&P 500, NASDAQ) havetheir own unique weighting and asset composition. In addition, none of theindices capture the fundamental benchmark requirements of investability,systematic reproduction, and transparency. Investors should take the timeto ensure that they understand the investment characteristics of the indexthat they use in their investment management decisions and that the actualinvestments that they hold reflect the return and risk characteristics of theindex they used in their analysis.
Myth 7.3: Local Commercial and Noncommercial RealEstate Investments Have Similar Performance Patterns
This is the problem: One would expect so, but we just do not know. Inthis book, we report on various measures of commercial and residentialreal estate performance. These performance measures now exist even forthe regional or local area. In fact, the characteristics of the commercialproperties may be so different, the source of valuations so unconnected
230 POSTMODERN INVESTMENT
except in rare economic conditions, that relying on historical performancedata may simply offer no answer. The purpose of raising this myth ormisconception is that the basis for determining if local commercial ornoncommercial real estate have similar performance patterns cannot orshould not be based on some historical set of data but based on a moredirect analysis of economic cash flow determinants. In short, the data is sobad we cannot even tell if a myth is truly a myth or if a fact is truly a fact.
Myth 7.4: International Real Estate Offers SignificantDiversification Potential
One would hope so; however, in recent years, the global slowdown hasindicated a higher level of comovement among various global real estateproducts than historical data would have suggested prior to the financialmarket crash. While in relatively calm market environments, U.S. and inter-national REIT returns may reflect relatively low correlation, in periods ofglobal market stress, there seems to be a growing comovement. The reasonsfor this increased correlation may have less to do with the actual correlationin local economic conditions than with the increasing globalization in howfunds are raised or fund portfolios are created. In periods of market stress,the lack of transparency of both local and global real estate results in acommon discounting of all real estate-based investment products. Theremay be solutions to this generic discounting in the future as the differentialmeans of evaluating local conditions are designed; but for the foreseeablefuture, the commonly held belief that global real estate offers (at least at thesize required for major investors) inherent diversification benefits may haveto be put on hold.

CHAPTER 8Asset Allocation
The Simple Way and the Hard Way
For many, the central question of modern finance is where to investin order to maximize return relative to risk. Over the past 60 years,
advances in financial theory and the introduction of new financial products,as well as the growth of new financial markets, have added complexityto how best to answer that question. For most investors, modern financeremains focused on the original portfolio selection approach put forth byHarry Markowitz (modern portfolio theory [MPT]). At its core, MPT isan analytical approach through which knowledge of the expected returnsand the return correlation among assets provides a means to find a set ofassets, which, in turn, provides the highest expected return for a level ofexpected risk. At its inception, simple correlation-based asset diversificationwas the principal means of return and risk management. What it lacked, inpart, was a simple mechanism to forecast assets’ expected returns. As notedin Chapter 1, the capital asset pricing model (CAPM) attempts to link allassets into a single-factor approach in which all assets are priced relative totheir common sensitivity to a single common market portfolio, but CAPMis completely useless as a forecasting tool because (a) we need a forecast ofthe expected return on the market and (b) the portion of the stock returnsnot explained by the return on the market is rather large. To be fair, CAPMwas not meant to be a forecasting tool; rather it is an explanation of whichstocks will earn a return higher than the market, and which will earn areturn less than the market. In addition, these differences in returns weremeant to be entirely due to differences to riskiness—no free lunches.
Other authors have attempted to design various multifactor approaches,each aimed at producing a manageable set of security groupings (e.g., assetclasses), such that each group may be said to offer unique characteristicsthat separate it from other investments. For the most part, these multifactormodels are of little use in forecasting the absolute returns on a given
231
232 POSTMODERN INVESTMENT
investment opportunity. They do a much better job of explaining differencesin return, especially among various asset classes. Let us recall that accordingto the efficient market hypothesis (EMH), there is no point in forecastingreturns because in a world of informational transparency and tradingefficiency, investors could feel safe that the prices that existed in the marketat any one time reflected the true expected return-to-risk trade-off embeddedin current information.
The threshold question is what makes a security fit into a unique assetgrouping? To get to the answer, there must be a determination as to whetherthe securities share some common feature or quality. Simple return and riskmodels fail to incorporate directly a host of qualitative risks (e.g., liquidity,counterparty risks, political risks, transparency) that may or may not bereflected in the price risk of a set of tradable assets. Moreover, most modelsof expected return and risk determination have failed to adequately measurethe relative impacts of illiquid assets, including the investor’s ‘‘personalvalue’’ in any applicable model of asset class determination.
There are unique features of some investment strategies (e.g., fixed-income and publicly traded equities) that have permitted them to beuniversally accepted as an asset class. Extrapolating from these conven-tions provides an aid to understanding the return and risk properties andthe inherent trading patterns that can be said to establish the requisitebehavior of an accepted asset class. We know that, in the case of hedgefunds, there are sets of investment opportunities, which have a centralfocus and market risk exposure. In addition, they have well-defined tradingprocesses that separate them from other potential asset classes. We alsoknow that various hedge-fund strategies can be seen as an extension of thesecurity markets in which they trade (e.g., equity long/short in the equityspace and distressed debt in the fixed-income area). With this knowledge,it is also possible to create a taxonomy in which hedge funds (or at leastequity-based hedge funds) are regarded as variants of the equity asset classrather than a separate asset class on their own.
As we find our way through new terrain, there are a range of issuesin determining the taxonomy for asset class determination. The degree ofdifficulty must not be the stopping point of establishing a process by whichwe address asset allocation issues. The approach must be the creation of amap. In designing any map, we first look to its purpose and then gauge thelevel of detail required to make it useful. Here, usefulness is analogous tothe risks involved with any particular investment path. Every path has itsown risks, and every map its faults.
How do investors determine risk and benefits involved in variousapproaches to asset allocation? If more than 30 years in the investmentmanagement business has taught us anything, it is that for the most part,

Asset Allocation 233
asset allocation services remain a seemingly free service with firms promot-ing a particular product as a solution to an investment problem and usingtheir own investment products as a basis for asset recommendations. Thereare numerous examples of the conflict between business management andpotential investor products. In the early 1980s, there existed disagreementin the consulting community about the benefit of new forms of investormutual funds. At that time, investment firms often offered a limited numberof investment products to its potential clients: an equity fund, a corporateand government bond fund, and a money market fund. With the growthof stock and bond markets, there was some investor demand for increasingthe number of equity funds (U.S., international, and emerging markets),and increasing the number of bond funds (government, corporate, andhigh yield), as well as creating a series of multi-asset balanced stock andbond portfolios to provide access to mixed stock and bond portfolios thatwere conservative, moderate, and aggressive in focus. However, many firmsconsidered the idea to be detrimental to their investors. The counter argu-ments were that too many choices would confuse the investor. These firmsalso argued that offering individuals high-risk/high-return products wouldencourage them to leave lower risk/lower return ‘‘safe’’ products in theirsearch for higher return. It was their responsibility not to increase the num-ber of choices to investors but, just the opposite, to control those choices inthe best interests of the investor. For the next 30 years, the same battle wasfought repeatedly. Each firm approached its investors as if they were smallchildren. It was their purpose not to overburden their investors with theparticulars of the investment, only to ensure that their approach (e.g., diver-sified stock, diversified bond, mixed portfolios, etc.) provided a completeor, at least, an important solution to the investor’s investment concerns.
The parental approach offers simple solutions to one of the basictenets of modern investment, that is, the trade-off between risk and return.However, if the asset allocation solution is free and simple, it probably offersa very low benefit to the investor and this is also consistent with the tenetof return for risk. Against this proposition, let us explore both the meaningand implementation of the asset allocation decision. MPT suggests thatindividuals can select a group of financial assets, which provides maximumreturn for a given level of risk (i.e., standard deviation). This theory ispremised on (a) the financial assets to be considered, (b) the validity of thereturn and risk inputs into the model to represent the current and futurefinancial conditions, and (c) the desired level of risk of the investor. As tothe financial assets to be considered, most asset allocation services focus ona single set of assets or, at most, a limited set of asset classes. This approachassumes that an investor exists in a regional incubator. Further, it ignoresthe geographic, cultural, economic, and political risks of a global economy.
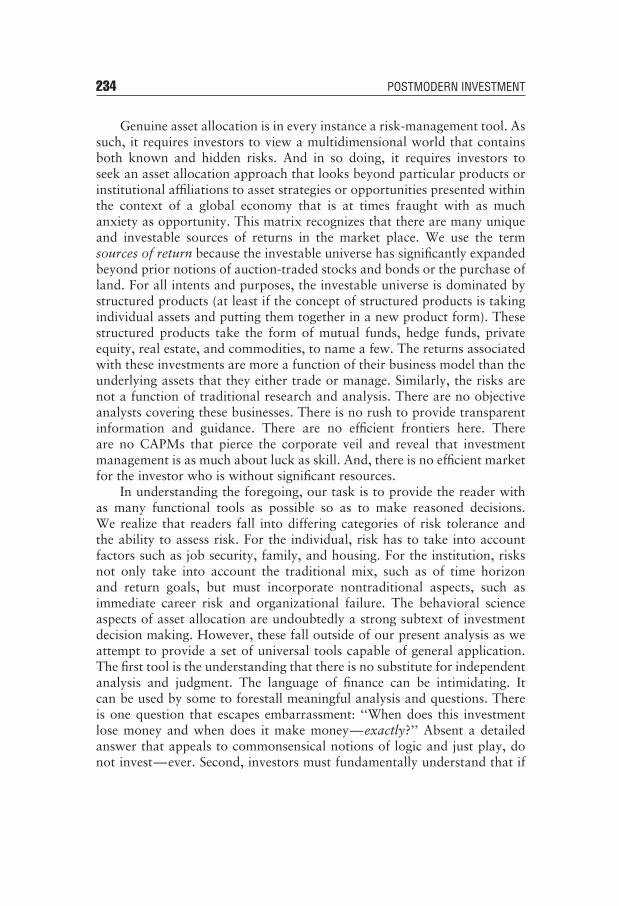
234 POSTMODERN INVESTMENT
Genuine asset allocation is in every instance a risk-management tool. Assuch, it requires investors to view a multidimensional world that containsboth known and hidden risks. And in so doing, it requires investors toseek an asset allocation approach that looks beyond particular products orinstitutional affiliations to asset strategies or opportunities presented withinthe context of a global economy that is at times fraught with as muchanxiety as opportunity. This matrix recognizes that there are many uniqueand investable sources of returns in the market place. We use the termsources of return because the investable universe has significantly expandedbeyond prior notions of auction-traded stocks and bonds or the purchase ofland. For all intents and purposes, the investable universe is dominated bystructured products (at least if the concept of structured products is takingindividual assets and putting them together in a new product form). Thesestructured products take the form of mutual funds, hedge funds, privateequity, real estate, and commodities, to name a few. The returns associatedwith these investments are more a function of their business model than theunderlying assets that they either trade or manage. Similarly, the risks arenot a function of traditional research and analysis. There are no objectiveanalysts covering these businesses. There is no rush to provide transparentinformation and guidance. There are no efficient frontiers here. Thereare no CAPMs that pierce the corporate veil and reveal that investmentmanagement is as much about luck as skill. And, there is no efficient marketfor the investor who is without significant resources.
In understanding the foregoing, our task is to provide the reader withas many functional tools as possible so as to make reasoned decisions.We realize that readers fall into differing categories of risk tolerance andthe ability to assess risk. For the individual, risk has to take into accountfactors such as job security, family, and housing. For the institution, risksnot only take into account the traditional mix, such as of time horizonand return goals, but must incorporate nontraditional aspects, such asimmediate career risk and organizational failure. The behavioral scienceaspects of asset allocation are undoubtedly a strong subtext of investmentdecision making. However, these fall outside of our present analysis as weattempt to provide a set of universal tools capable of general application.The first tool is the understanding that there is no substitute for independentanalysis and judgment. The language of finance can be intimidating. Itcan be used by some to forestall meaningful analysis and questions. Thereis one question that escapes embarrassment: ‘‘When does this investmentlose money and when does it make money—exactly?’’ Absent a detailedanswer that appeals to commonsensical notions of logic and just play, donot invest—ever. Second, investors must fundamentally understand that if

Asset Allocation 235
an asset allocation process suggests that it can produce positive returns inany economic environment, the return it offers should be the risk-free rate.
Against these rather fundamental thoughts, in this chapter, we concen-trate on the liquid financial part of an investor’s portfolio. When looking atfinancial asset portfolios, however, every investor must keep in mind thatit represents only a part of his or her asset portfolio, and financial assetportfolio decisions should not be made outside of understanding the otherilliquid assets in the portfolio. In addition, in this chapter, we concentrate onthe traditional Markowitz mean-variance asset allocation approach acrossmultiple asset classes. We realize that concentrating on the mean-varianceapproach to asset allocation is, in the words of William Sharpe, ‘‘not anentirely happy state of affairs.’’1 We understand that the mean-varianceapproach is really a special case of various approaches to asset allocation.However, as William Sharpe further explained, mean-variance-based assetallocation is a ‘‘special case with many practical advantages.’’2 We attemptto put some constraints around the mean-variance approach by consideringthe impact of alternative means of portfolio risk management. In addi-tion, we will briefly discuss volatility targeting, risk parity, and portfolioinsurance as special cases of asset allocations.
THE WHY AND WHEREFORE OF MULTIPLE ASSETALLOCATION APPROACHES
As noted, we are faced with the dilemma of providing universal tools.Here, we can provide simple solutions that will be of limited use giventhe changing economic environment and the fact that there are as manyunique circumstances as there are investors. The simple solutions are easilyunderstood by many investors, but actually pretty worthless. Alternatively,we can provide a more complex model that offers a greater appreciation forthe dynamics of asset allocation. We offered such a view in our last book,The New Science of Asset Allocation, and discovered that the audiencefor that book was almost exclusively traders, academics, and policy wonkswith mathematical backgrounds. Now, we have chosen a building-blockapproach. One designed to provide investors with the means to question andanalyze the accepted models surrounding asset allocation and, in so doing,effectively protect themselves in a global multi-asset class environment.Our building blocks ask and answer the question of whether alternativeinvestments provide investors with valuable return and risk opportunitiesbeyond those easily available in the traditional equity and fixed-incomemarkets. In addition, it explores the nature of individual assets and their
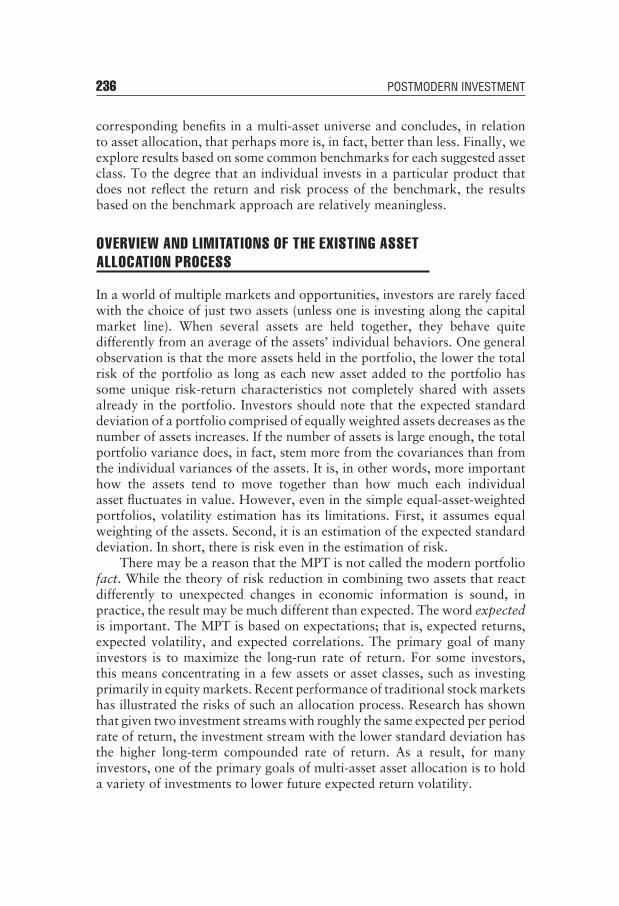
236 POSTMODERN INVESTMENT
corresponding benefits in a multi-asset universe and concludes, in relationto asset allocation, that perhaps more is, in fact, better than less. Finally, weexplore results based on some common benchmarks for each suggested assetclass. To the degree that an individual invests in a particular product thatdoes not reflect the return and risk process of the benchmark, the resultsbased on the benchmark approach are relatively meaningless.
OVERVIEW AND LIMITATIONS OF THE EXISTING ASSETALLOCATION PROCESS
In a world of multiple markets and opportunities, investors are rarely facedwith the choice of just two assets (unless one is investing along the capitalmarket line). When several assets are held together, they behave quitedifferently from an average of the assets’ individual behaviors. One generalobservation is that the more assets held in the portfolio, the lower the totalrisk of the portfolio as long as each new asset added to the portfolio hassome unique risk-return characteristics not completely shared with assetsalready in the portfolio. Investors should note that the expected standarddeviation of a portfolio comprised of equally weighted assets decreases as thenumber of assets increases. If the number of assets is large enough, the totalportfolio variance does, in fact, stem more from the covariances than fromthe individual variances of the assets. It is, in other words, more importanthow the assets tend to move together than how much each individualasset fluctuates in value. However, even in the simple equal-asset-weightedportfolios, volatility estimation has its limitations. First, it assumes equalweighting of the assets. Second, it is an estimation of the expected standarddeviation. In short, there is risk even in the estimation of risk.
There may be a reason that the MPT is not called the modern portfoliofact. While the theory of risk reduction in combining two assets that reactdifferently to unexpected changes in economic information is sound, inpractice, the result may be much different than expected. The word expectedis important. The MPT is based on expectations; that is, expected returns,expected volatility, and expected correlations. The primary goal of manyinvestors is to maximize the long-run rate of return. For some investors,this means concentrating in a few assets or asset classes, such as investingprimarily in equity markets. Recent performance of traditional stock marketshas illustrated the risks of such an allocation process. Research has shownthat given two investment streams with roughly the same expected per periodrate of return, the investment stream with the lower standard deviation hasthe higher long-term compounded rate of return. As a result, for manyinvestors, one of the primary goals of multi-asset asset allocation is to holda variety of investments to lower future expected return volatility.

Asset Allocation 237
The asset allocation process often starts with the following three steps:
1. Description of available investment opportunities. In this step, the rel-evant asset classes and their risk-to-return characteristics are analyzed.Considerable academic research exists detailing the unique risk andreturn attributes of stocks, bonds, private equity, and hedge funds.
2. Investor’s preference, assets, and liabilities. This step begins with adescription of the investor’s financial condition (e.g., assets, liabilities,financial goals, taxes, etc.) and then proceeds with an estimation of theclient’s risk capacity and risk tolerance.
3. Optimal asset mix. In this final stage, the above information is employedto develop an investment policy statement and to recommend a strate-gic optimal asset mix. Recent studies have shown that asset classesshould include investments that create alternative risk-to-return pat-terns through the use of investments such as private equity, which offerreturn enhancement to traditional stock and bond investments, andhedge funds, which also provide investment opportunities and exposureto economic factors that are not available through traditional assetclasses.3
If alternative investments, such as private equity and hedge funds, areto be included in an investor’s optimal portfolio allocation, investors needto determine if alternative investments, such as private equity and hedgefunds, represent a distinct asset class and therefore, should be includedin the analysis. The common denominator within each of these steps orscenarios is unbiased information and research. Neither risk and returncharacteristics, nor preferences, nor optimal asset mix can be determinedwithout understanding the economics, liquidity, correlations, or regulatorystructure of a particular asset class or its underlying components.
ASSET ALLOCATION IN TRADITIONAL AND ALTERNATIVEINVESTMENTS: A ROAD MAP
If a person is going to go on a journey, he needs a map. The details of themap, of course, depend on the distance of the journey and the terrain ofthe path. The map may also be affected by where the mapmaker wants youto go. In this section, we provide two maps covering the same geography.In the first, we construct the map with four primary forms of geography(i.e., traditional stock, traditional bond, traditional alternatives [i.e., realestate, commodities, and private equity] and modern alternatives [i.e., hedgefunds, managed futures, etc.]). In this map, an equity class consists of various

238 POSTMODERN INVESTMENT
security groupings such as the Standard & Poor’s (S&P) 500, MSCI Europe,Australasia, Far East (EAFE) and MSCI Emerging Markets indices. Fixedincome may include government bonds, corporate bonds, and high-yielddebt within an overall fixed-income asset class. Traditionally, other lessliquid, less transparent, or nonequity-based investments have been groupedas ‘‘traditional alternative investments,’’ since they are viewed primarilyas alternatives to the traditional stock and bond asset classes. This groupof traditional alternatives includes investments such as private equity, realestate (residential and commercial), and commodity investments. In recentyears, an additional set of ‘‘modern alternative investments,’’ such as hedgefunds and managed futures, has become increasingly available for both retailand institutional investors. Of course, in each geographical area, differentdetails are needed to understand the risks of travel in that area. Our maplooks to proven market tools such as standard deviation, beta, and multiplerisk dimensions (liquidity and transparency) for guidance.
The second map is based on a grouping of the assets founded primarilyon the relative market factor correlations within each group, such that thegroupings reflect an equity factor, an interest rate factor, and a high-yieldfactor, and a final grouping with a low correlation to each of the threemarket factors. It is important to note that the primary emphasis on thesetwo approaches is partially due to the necessity of keeping it simple. Giventhe number of external personnel involved in the investment managementprocess, the asset class structure may be, by necessity, designed to fit arequired business model which, while academically flawed, is workablefrom an organizational viewpoint.
RETURN AND RISK ATTRIBUTESAND STRATEGY ALLOCATION
MPT emphasizes that the benefits of individual assets should be evaluatedbased on their performance alongside other assets in investor’s portfolios.The diversification benefits of adding any individual investment to othersecurities within an asset class, or the benefits of adding any individualasset classes to other asset classes, depends on the comparison stand-aloneinvestment. As discussed in the previous section, in the traditional assetclass breakdown shown in Exhibit 8.1, stocks and bonds were regarded asseparate asset classes due primarily to the assumed low correlation betweenstocks and bonds. Similarly, real estate, private equity, and commoditieswere assumed to, in many cases, be in a unique asset class due to opportunityfor positive return in economic conditions for which stocks and bonds didpoorly. In recent years, two additional investment areas, hedge funds
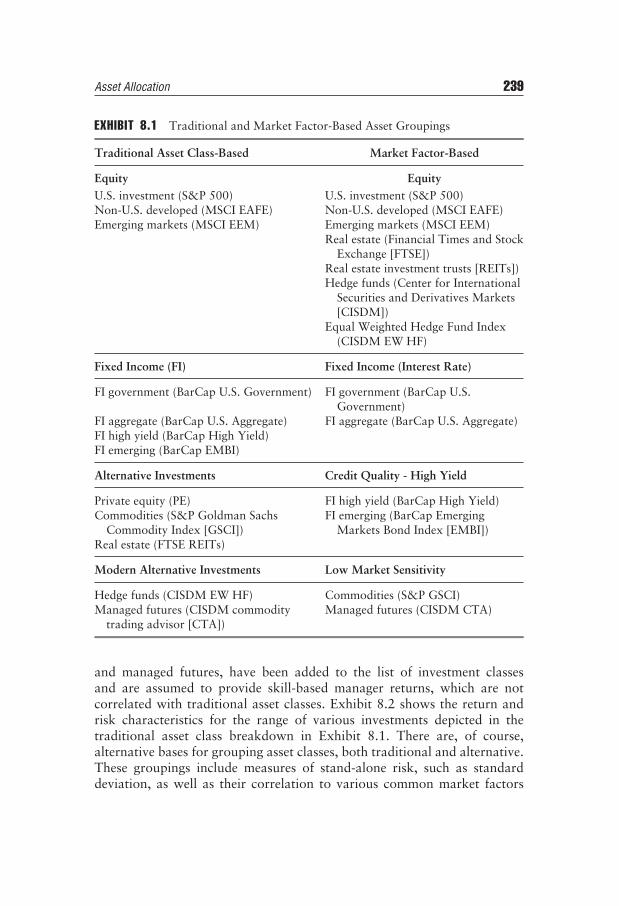
Asset Allocation 239
EXHIBIT 8.1 Traditional and Market Factor-Based Asset Groupings
Traditional Asset Class-Based Market Factor-Based
Equity EquityU.S. investment (S&P 500) U.S. investment (S&P 500)Non-U.S. developed (MSCI EAFE) Non-U.S. developed (MSCI EAFE)Emerging markets (MSCI EEM) Emerging markets (MSCI EEM)
Real estate (Financial Times and StockExchange [FTSE])
Real estate investment trusts [REITs])Hedge funds (Center for International
Securities and Derivatives Markets[CISDM])
Equal Weighted Hedge Fund Index(CISDM EW HF)
Fixed Income (FI) Fixed Income (Interest Rate)
FI government (BarCap U.S. Government) FI government (BarCap U.S.Government)
FI aggregate (BarCap U.S. Aggregate) FI aggregate (BarCap U.S. Aggregate)FI high yield (BarCap High Yield)FI emerging (BarCap EMBI)
Alternative Investments Credit Quality - High Yield
Private equity (PE) FI high yield (BarCap High Yield)Commodities (S&P Goldman Sachs
Commodity Index [GSCI])FI emerging (BarCap Emerging
Markets Bond Index [EMBI])Real estate (FTSE REITs)
Modern Alternative Investments Low Market Sensitivity
Hedge funds (CISDM EW HF) Commodities (S&P GSCI)Managed futures (CISDM commodity
trading advisor [CTA])Managed futures (CISDM CTA)
and managed futures, have been added to the list of investment classesand are assumed to provide skill-based manager returns, which are notcorrelated with traditional asset classes. Exhibit 8.2 shows the return andrisk characteristics for the range of various investments depicted in thetraditional asset class breakdown in Exhibit 8.1. There are, of course,alternative bases for grouping asset classes, both traditional and alternative.These groupings include measures of stand-alone risk, such as standarddeviation, as well as their correlation to various common market factors
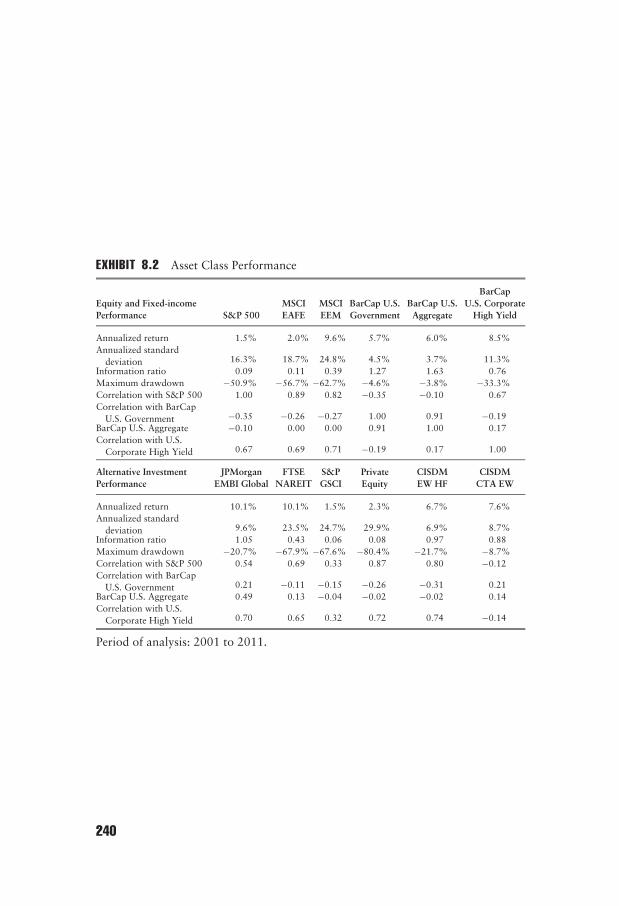
EXHIBIT 8.2 Asset Class Performance
Equity and Fixed-incomePerformance S&P 500
MSCIEAFE
MSCIEEM
BarCap U.S.Government
BarCap U.S.Aggregate
BarCapU.S. Corporate
High Yield
Annualized return 1.5% 2.0% 9.6% 5.7% 6.0% 8.5%Annualized standard
deviation 16.3% 18.7% 24.8% 4.5% 3.7% 11.3%Information ratio 0.09 0.11 0.39 1.27 1.63 0.76Maximum drawdown −50.9% −56.7% −62.7% −4.6% −3.8% −33.3%Correlation with S&P 500 1.00 0.89 0.82 −0.35 −0.10 0.67Correlation with BarCap
U.S. Government −0.35 −0.26 −0.27 1.00 0.91 −0.19BarCap U.S. Aggregate −0.10 0.00 0.00 0.91 1.00 0.17Correlation with U.S.
Corporate High Yield 0.67 0.69 0.71 −0.19 0.17 1.00
Alternative Investment JPMorgan FTSE S&P Private CISDM CISDMPerformance EMBI Global NAREIT GSCI Equity EW HF CTA EW
Annualized return 10.1% 10.1% 1.5% 2.3% 6.7% 7.6%Annualized standard
deviation 9.6% 23.5% 24.7% 29.9% 6.9% 8.7%Information ratio 1.05 0.43 0.06 0.08 0.97 0.88Maximum drawdown −20.7% −67.9% −67.6% −80.4% −21.7% −8.7%Correlation with S&P 500 0.54 0.69 0.33 0.87 0.80 −0.12Correlation with BarCap
U.S. Government 0.21 −0.11 −0.15 −0.26 −0.31 0.21BarCap U.S. Aggregate 0.49 0.13 −0.04 −0.02 −0.02 0.14Correlation with U.S.
Corporate High Yield 0.70 0.65 0.32 0.72 0.74 −0.14
Period of analysis: 2001 to 2011.
240
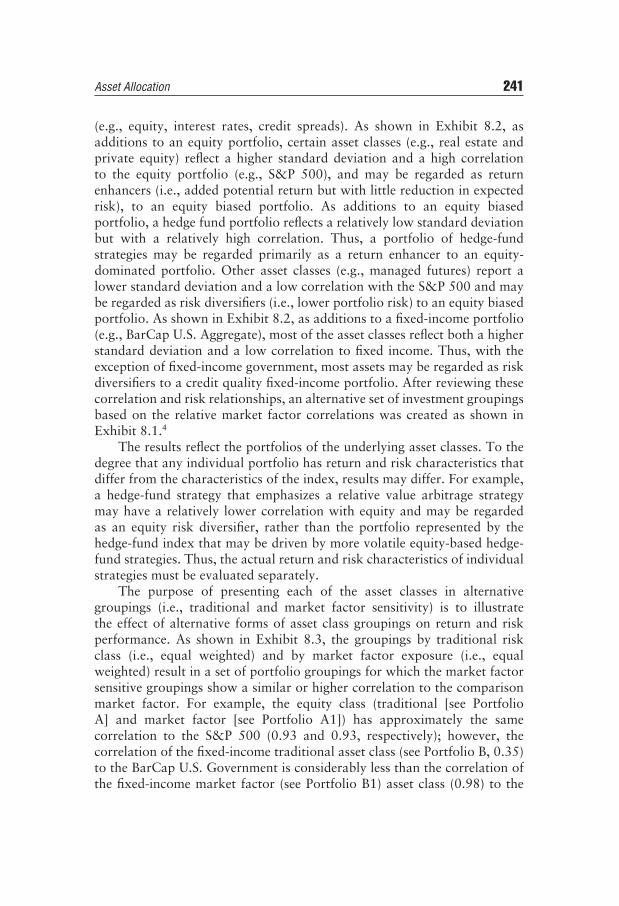
Asset Allocation 241
(e.g., equity, interest rates, credit spreads). As shown in Exhibit 8.2, asadditions to an equity portfolio, certain asset classes (e.g., real estate andprivate equity) reflect a higher standard deviation and a high correlationto the equity portfolio (e.g., S&P 500), and may be regarded as returnenhancers (i.e., added potential return but with little reduction in expectedrisk), to an equity biased portfolio. As additions to an equity biasedportfolio, a hedge fund portfolio reflects a relatively low standard deviationbut with a relatively high correlation. Thus, a portfolio of hedge-fundstrategies may be regarded primarily as a return enhancer to an equity-dominated portfolio. Other asset classes (e.g., managed futures) report alower standard deviation and a low correlation with the S&P 500 and maybe regarded as risk diversifiers (i.e., lower portfolio risk) to an equity biasedportfolio. As shown in Exhibit 8.2, as additions to a fixed-income portfolio(e.g., BarCap U.S. Aggregate), most of the asset classes reflect both a higherstandard deviation and a low correlation to fixed income. Thus, with theexception of fixed-income government, most assets may be regarded as riskdiversifiers to a credit quality fixed-income portfolio. After reviewing thesecorrelation and risk relationships, an alternative set of investment groupingsbased on the relative market factor correlations was created as shown inExhibit 8.1.4
The results reflect the portfolios of the underlying asset classes. To thedegree that any individual portfolio has return and risk characteristics thatdiffer from the characteristics of the index, results may differ. For example,a hedge-fund strategy that emphasizes a relative value arbitrage strategymay have a relatively lower correlation with equity and may be regardedas an equity risk diversifier, rather than the portfolio represented by thehedge-fund index that may be driven by more volatile equity-based hedge-fund strategies. Thus, the actual return and risk characteristics of individualstrategies must be evaluated separately.
The purpose of presenting each of the asset classes in alternativegroupings (i.e., traditional and market factor sensitivity) is to illustratethe effect of alternative forms of asset class groupings on return and riskperformance. As shown in Exhibit 8.3, the groupings by traditional riskclass (i.e., equal weighted) and by market factor exposure (i.e., equalweighted) result in a set of portfolio groupings for which the market factorsensitive groupings show a similar or higher correlation to the comparisonmarket factor. For example, the equity class (traditional [see PortfolioA] and market factor [see Portfolio A1]) has approximately the samecorrelation to the S&P 500 (0.93 and 0.93, respectively); however, thecorrelation of the fixed-income traditional asset class (see Portfolio B, 0.35)to the BarCap U.S. Government is considerably less than the correlation ofthe fixed-income market factor (see Portfolio B1) asset class (0.98) to the
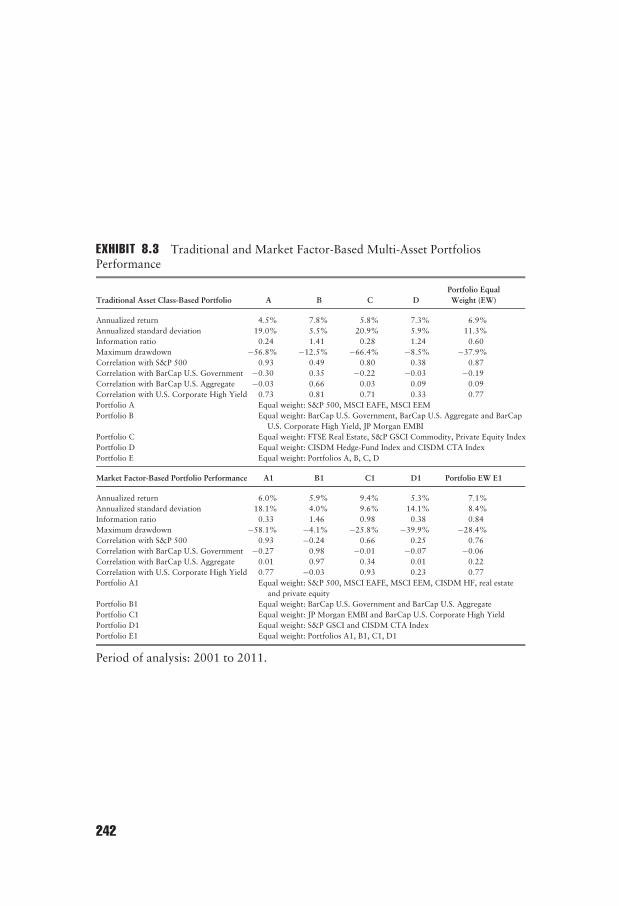
EXHIBIT 8.3 Traditional and Market Factor-Based Multi-Asset PortfoliosPerformance
Traditional Asset Class-Based Portfolio A B C DPortfolio EqualWeight (EW)
Annualized return 4.5% 7.8% 5.8% 7.3% 6.9%Annualized standard deviation 19.0% 5.5% 20.9% 5.9% 11.3%Information ratio 0.24 1.41 0.28 1.24 0.60Maximum drawdown −56.8% −12.5% −66.4% −8.5% −37.9%Correlation with S&P 500 0.93 0.49 0.80 0.38 0.87Correlation with BarCap U.S. Government −0.30 0.35 −0.22 −0.03 −0.19Correlation with BarCap U.S. Aggregate −0.03 0.66 0.03 0.09 0.09Correlation with U.S. Corporate High Yield 0.73 0.81 0.71 0.33 0.77Portfolio A Equal weight: S&P 500, MSCI EAFE, MSCI EEMPortfolio B Equal weight: BarCap U.S. Government, BarCap U.S. Aggregate and BarCap
U.S. Corporate High Yield, JP Morgan EMBIPortfolio C Equal weight: FTSE Real Estate, S&P GSCI Commodity, Private Equity IndexPortfolio D Equal weight: CISDM Hedge-Fund Index and CISDM CTA IndexPortfolio E Equal weight: Portfolios A, B, C, D
Market Factor-Based Portfolio Performance A1 B1 C1 D1 Portfolio EW E1
Annualized return 6.0% 5.9% 9.4% 5.3% 7.1%Annualized standard deviation 18.1% 4.0% 9.6% 14.1% 8.4%Information ratio 0.33 1.46 0.98 0.38 0.84Maximum drawdown −58.1% −4.1% −25.8% −39.9% −28.4%Correlation with S&P 500 0.93 −0.24 0.66 0.25 0.76Correlation with BarCap U.S. Government −0.27 0.98 −0.01 −0.07 −0.06Correlation with BarCap U.S. Aggregate 0.01 0.97 0.34 0.01 0.22Correlation with U.S. Corporate High Yield 0.77 −0.03 0.93 0.23 0.77Portfolio A1 Equal weight: S&P 500, MSCI EAFE, MSCI EEM, CISDM HF, real estate
and private equityPortfolio B1 Equal weight: BarCap U.S. Government and BarCap U.S. AggregatePortfolio C1 Equal weight: JP Morgan EMBI and BarCap U.S. Corporate High YieldPortfolio D1 Equal weight: S&P GSCI and CISDM CTA IndexPortfolio E1 Equal weight: Portfolios A1, B1, C1, D1
Period of analysis: 2001 to 2011.
242
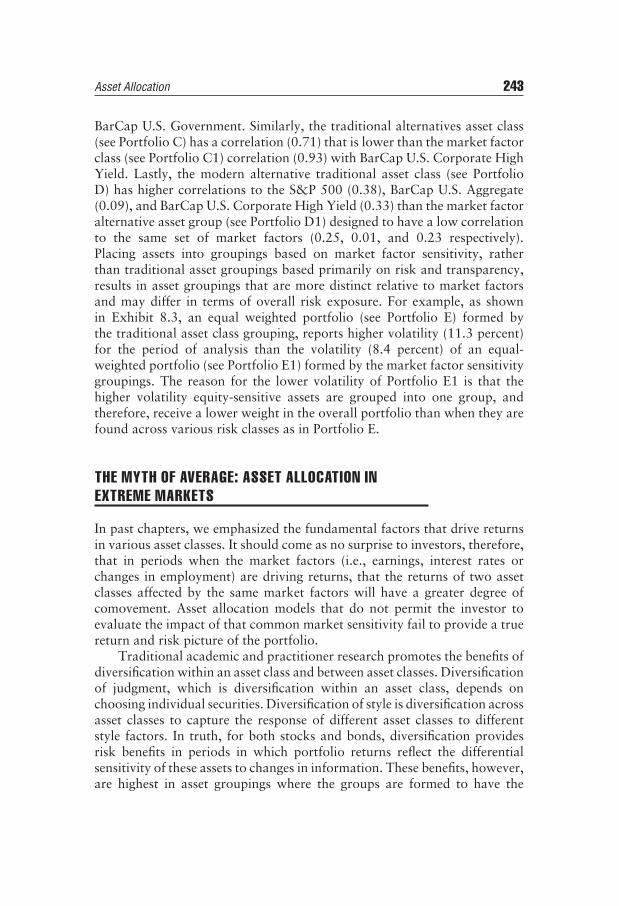
Asset Allocation 243
BarCap U.S. Government. Similarly, the traditional alternatives asset class(see Portfolio C) has a correlation (0.71) that is lower than the market factorclass (see Portfolio C1) correlation (0.93) with BarCap U.S. Corporate HighYield. Lastly, the modern alternative traditional asset class (see PortfolioD) has higher correlations to the S&P 500 (0.38), BarCap U.S. Aggregate(0.09), and BarCap U.S. Corporate High Yield (0.33) than the market factoralternative asset group (see Portfolio D1) designed to have a low correlationto the same set of market factors (0.25, 0.01, and 0.23 respectively).Placing assets into groupings based on market factor sensitivity, ratherthan traditional asset groupings based primarily on risk and transparency,results in asset groupings that are more distinct relative to market factorsand may differ in terms of overall risk exposure. For example, as shownin Exhibit 8.3, an equal weighted portfolio (see Portfolio E) formed bythe traditional asset class grouping, reports higher volatility (11.3 percent)for the period of analysis than the volatility (8.4 percent) of an equal-weighted portfolio (see Portfolio E1) formed by the market factor sensitivitygroupings. The reason for the lower volatility of Portfolio E1 is that thehigher volatility equity-sensitive assets are grouped into one group, andtherefore, receive a lower weight in the overall portfolio than when they arefound across various risk classes as in Portfolio E.
THE MYTH OF AVERAGE: ASSET ALLOCATION INEXTREME MARKETS
In past chapters, we emphasized the fundamental factors that drive returnsin various asset classes. It should come as no surprise to investors, therefore,that in periods when the market factors (i.e., earnings, interest rates orchanges in employment) are driving returns, that the returns of two assetclasses affected by the same market factors will have a greater degree ofcomovement. Asset allocation models that do not permit the investor toevaluate the impact of that common market sensitivity fail to provide a truereturn and risk picture of the portfolio.
Traditional academic and practitioner research promotes the benefits ofdiversification within an asset class and between asset classes. Diversificationof judgment, which is diversification within an asset class, depends onchoosing individual securities. Diversification of style is diversification acrossasset classes to capture the response of different asset classes to differentstyle factors. In truth, for both stocks and bonds, diversification providesrisk benefits in periods in which portfolio returns reflect the differentialsensitivity of these assets to changes in information. These benefits, however,are highest in asset groupings where the groups are formed to have the
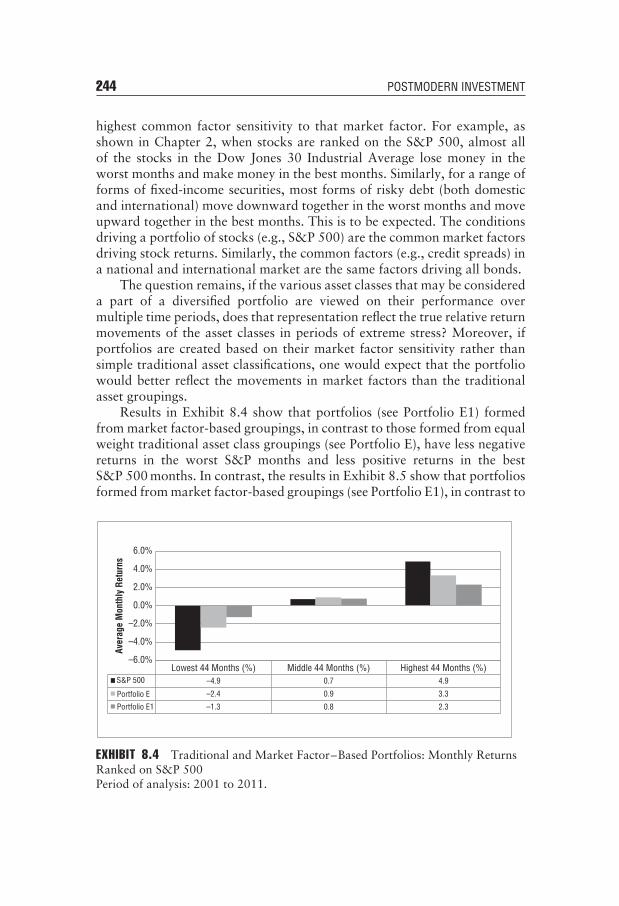
244 POSTMODERN INVESTMENT
highest common factor sensitivity to that market factor. For example, asshown in Chapter 2, when stocks are ranked on the S&P 500, almost allof the stocks in the Dow Jones 30 Industrial Average lose money in theworst months and make money in the best months. Similarly, for a range offorms of fixed-income securities, most forms of risky debt (both domesticand international) move downward together in the worst months and moveupward together in the best months. This is to be expected. The conditionsdriving a portfolio of stocks (e.g., S&P 500) are the common market factorsdriving stock returns. Similarly, the common factors (e.g., credit spreads) ina national and international market are the same factors driving all bonds.
The question remains, if the various asset classes that may be considereda part of a diversified portfolio are viewed on their performance overmultiple time periods, does that representation reflect the true relative returnmovements of the asset classes in periods of extreme stress? Moreover, ifportfolios are created based on their market factor sensitivity rather thansimple traditional asset classifications, one would expect that the portfoliowould better reflect the movements in market factors than the traditionalasset groupings.
Results in Exhibit 8.4 show that portfolios (see Portfolio E1) formedfrom market factor-based groupings, in contrast to those formed from equalweight traditional asset class groupings (see Portfolio E), have less negativereturns in the worst S&P months and less positive returns in the bestS&P 500 months. In contrast, the results in Exhibit 8.5 show that portfoliosformed from market factor-based groupings (see Portfolio E1), in contrast to
Lowest 44 Months (%) Middle 44 Months (%) Highest 44 Months (%)S&P 500
Portfolio E
Portfolio E1
–4.9 0.7 4.9
–2.4 0.9 3.3
–1.3 0.8 2.3
–6.0%
–4.0%
–2.0%
0.0%
2.0%
4.0%
6.0%
Aver
age
Mon
thly
Ret
urns
EXHIBIT 8.4 Traditional and Market Factor–Based Portfolios: Monthly ReturnsRanked on S&P 500Period of analysis: 2001 to 2011.
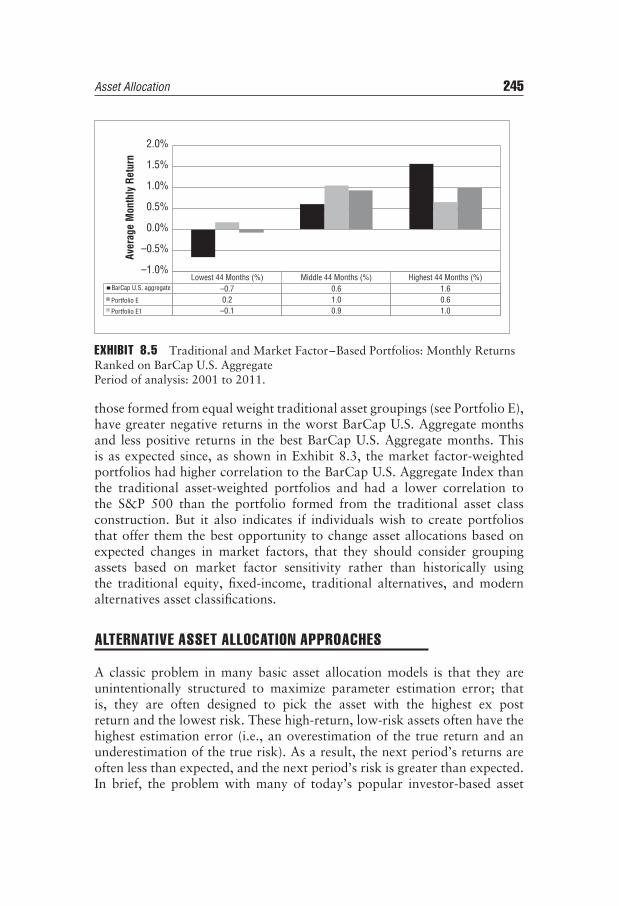
Asset Allocation 245
Lowest 44 Months (%) Middle 44 Months (%) Highest 44 Months (%)BarCap U.S. aggregate
Portfolio E
Portfolio E1
–0.7 0.6 1.60.2 1.0 0.6–0.1 0.9 1.0
–1.0%
–0.5%
0.0%
0.5%
1.0%
1.5%
2.0%Av
erag
e M
onth
ly R
etur
n
EXHIBIT 8.5 Traditional and Market Factor–Based Portfolios: Monthly ReturnsRanked on BarCap U.S. AggregatePeriod of analysis: 2001 to 2011.
those formed from equal weight traditional asset groupings (see Portfolio E),have greater negative returns in the worst BarCap U.S. Aggregate monthsand less positive returns in the best BarCap U.S. Aggregate months. Thisis as expected since, as shown in Exhibit 8.3, the market factor-weightedportfolios had higher correlation to the BarCap U.S. Aggregate Index thanthe traditional asset-weighted portfolios and had a lower correlation tothe S&P 500 than the portfolio formed from the traditional asset classconstruction. But it also indicates if individuals wish to create portfoliosthat offer them the best opportunity to change asset allocations based onexpected changes in market factors, that they should consider groupingassets based on market factor sensitivity rather than historically usingthe traditional equity, fixed-income, traditional alternatives, and modernalternatives asset classifications.
ALTERNATIVE ASSET ALLOCATION APPROACHES
A classic problem in many basic asset allocation models is that they areunintentionally structured to maximize parameter estimation error; thatis, they are often designed to pick the asset with the highest ex postreturn and the lowest risk. These high-return, low-risk assets often have thehighest estimation error (i.e., an overestimation of the true return and anunderestimation of the true risk). As a result, the next period’s returns areoften less than expected, and the next period’s risk is greater than expected.In brief, the problem with many of today’s popular investor-based asset

246 POSTMODERN INVESTMENT
allocation models, especially as they relate to risk management, is theirtendency to focus on what we can measure in contrast to what we shouldmeasure. Armies of consultants, computer specialists, and risk managers arefocused on technical and quantitative approaches that are easily understoodand accepted by the investing public and regulatory authorities. For example,many money managers are forced by regulatory rules or market practice totrack a particular benchmark. Now, by limiting the manager to tracking aparticular benchmark, both return and risk are constrained. The manageris not permitted to consider a much wider range of risks such as drawdownand changing-risk environments. This problem was expressly shown in2008 when many fund managers lost over 30 percent because they wererequired by regulation or convention to track a benchmark that lost 40percent. This occurred while volatility on the benchmark rose from 20 to 40percent. If managers had been permitted to target volatility while trackingthe benchmark, losses could have been dramatically reduced. In the future,managers must focus on the risks they want to control, not necessarily therisk embedded in the tools readily available to them.
Academics and practitioners have been aware of this important limi-tation of quantitative asset allocation models. When too many parameters(e.g., expected returns, volatilities, and correlations) have to be estimated,then there are more opportunities to make mistakes and increase allocationsto assets that have provided abnormally high returns in the past. These assetsare more than likely to provide abnormally low returns going forward. Afterall, competition is the great leveler of playing fields, and capital will flow towhere profits have been the highest in the past, lowering the profits goingforward. The problem with estimation risk has led investors to seek assetallocation models that rely less on past data.
While equally weighed asset allocation relies less on past data and issimple to implement, it may lead investors to leave some money on thetable. As was indicated previously, some characteristics of assets can beestimated with less uncertainty than others. In particular, expected returnsare notoriously difficult to estimate. Therefore, any asset allocation modelthat relies heavily on estimates of expected returns should be viewed skep-tically. Conversely, estimates of volatility, especially if an investor hasfrequent observations (e.g., daily data) tend to suffer less from estima-tion error. This observation has led to four asset allocation models thatrely heavily on estimates of volatility and ignore estimates of expectedreturns.
1. Minimum Volatility: This approach requires the investor to developan asset allocation that has displayed minimal volatility in the past. Ifadditional constraints are not imposed, the portfolio with minimal past
Asset Allocation 247
volatility is likely to be rather strange with large positive and negativeallocations to various investments. Therefore, constraints should beimposed. Even when sensible constraints are imposed, the investors canstill develop a portfolio with relatively low past volatility. The next stepin this process is rather scary and strange to most investors: Use leverageto increase the volatility and hopefully the return of the portfolio. Thereare two reasons for this: First, the minimum volatility portfolio is likelyto have a rather low rate of return going forward. Most investors wouldfind both the risk and the return on this portfolio rather low. Leveragecan be used to increase both. Second, academic research has shownthat low volatility equities tend to outperform high volatility equities.Since the minimal volatility portfolio is likely to have large allocationsto low volatility stocks, it is likely to perform rather well (of course,given its risk level). The last statement explains why we start with a lowvolatility portfolio and then lever it up rather than creating a moderatevolatility portfolio to begin with. The minimal volatility portfolio hasgained enough attention from the investment community that it has ledMSCI to create a minimum volatility index.
2. Volatility Ranked Equally Weighted Portfolio: As noted above, researchhas shown that stocks that have displayed high volatility in the past arelikely to underperform the stocks that have displayed low volatility inthe past. Using this observation, an investor can rank stocks accordingto their past volatilities (e.g., previous 6–12 months) and then createan equally weighed portfolio of stocks that rank at the bottom of theranking. To make this approach more sophisticated, the investor cancreate a more diversified portfolio by ensuring that most sectors of theeconomy are present in the portfolio. Clearly, this approach is suited forthe construction of equity portfolios, and its effectiveness when appliedto other asset classes has not been examined.
3. Volatility (Estimated) Weighed Allocation: This approach is a simplifiedversion of the so-called risk parity approach and can be applied toequities and other asset classes. The process requires the investor toestimate the volatility of available asset classes. Then the share of eachasset class will be proportional to the estimated volatility. For example,if the past volatility of the S&P GSCI has been twice as high as thevolatility of BarCap Bond Index, then the weight of the S&P GSCIwill be half the weight of the BarCap Bond Index. Here, as with theminimal volatility approach, the investor will need to employ someleverage to create a portfolio with an acceptable risk-to-return profile.This approach has been adopted by a number of large and smallinvestors, and there are funds that offer risk-parity products. Becauserisk parity portfolios are likely to have large allocations to low risk
248 POSTMODERN INVESTMENT
fixed-income instruments, their pro forma performance will be quiteattractive. However, it is almost a certainty that going forward, fixedincome cannot repeat the performance of the last several years. In fact,since late 1980s there has been a secular decline in interest rates, andgiven the current low levels of interest rates, it is reasonable to concludethat this once-in-a-generation secular decline has run its course.
4. Portfolio Insurance: This approach is a combination of risk managementand asset allocation. It assumes that the investor has already developedan optimal portfolio of risky assets, and now the decision is how much ofthe investor’s wealth should be allocated to this risky portfolio. Portfolioinsurance can be implemented through the purchase of derivatives, suchas put options, or through dynamic trading. The latter is rather easy toimplement, and many investors may feel that it is a cheaper method ofprotecting the value of their investments. To implement this strategy,the investor must specify the minimum value of the portfolio that heor she is willing to accept. For example, the investor may state thatany loss greater than 10 percent within the next 24 months will not beacceptable. The next step is to determine the amount that should beinvested in safe fixed-income assets that can guarantee that minimumvalue. This amount will be the present value of the minimal value. Forexample, if the current value of a portfolio is $10 million, and theinvestor is not willing to accept a value lower than $9 million after24 months, the amount needed to be invested in fixed-income assetswhen the two-year interest rate is 1 percent per year will be $8.82million. This means the investor has a cushion of $1.18 million. Theinvestor then allocates a multiple of this figure in the risky portfolio. Forexample, given a multiplier of 5, the investor would invest $5.9 millionin the risky portfolio and the rest, $4.1 million, in the safe fixed-incomeasset. The level of the multiplier depends on the risk preference ofthe investor as well the riskiness of the investment environment. Forexample, with a multiplier of 5, the investor can be assured that thevalue of his or her portfolio will not go below the prescribed floor aslong as there is no decline of more than 20 percent (that is, one-fifth)in the value of the risky portfolio between any rebalancing. Therefore,if an investor is willing to rebalance the portfolio more often, or theportfolio of risky assets has a low volatility, then a multiplier greaterthan 5 can be selected. Of course, there are a number of issues such astransaction costs, leverage, and changing interest rates that we have nottouched on in this brief description of portfolio insurance. Interestedinvestors should educate themselves about these and other aspects ofthis strategy before attempting to implement it.

Asset Allocation 249
Given the wide range of issues involved in asset allocation, a system-atic approach to its use across traditional and alternative asset classes isimportant for client education, client marketing, and product creation andmanagement. As discussed in previous chapters, the level of sophisticationand detail may differ for each client. For more sophisticated investors, awider range of asset allocation techniques and approaches is often intro-duced, if for no other reason, than to indicate that the firms’ modelingprocesses are competitive in areas such as tracking error, capacity, andliquidity adjustments. At the basic investor level, the simple Markowitzmean-variance asset allocation is often used simply because of the clients’background with the methodology.
A PERSONAL VIEW: ISSUES IN ASSET ALLOCATION
A brief review of the academic literature on asset allocation stresses the algo-rithmic and mathematical models (e.g., mean-variance) that form the basisfor asset allocation across multiple asset classes. In contrast, while thepractitioner literature on asset allocation also provides various model-basedapproaches to asset allocation, this literature also attempts to focus on theart of asset allocation; that is, the required interaction between advisor andinvestor to determine the best set of approaches to ensure that the investorholds a portfolio that reflects that particular investor’s true return and riskattitudes. This would be all well and good, if one could divine an investor’strue risk appetite, evaluate that risk appetite over time, and constantly adjustone’s investment portfolio (real and financial) to meet the changing needsof the investor.
A review of major asset allocation recommendations across majorinvestment firms shows little if any difference in the recommended holdingsfor a range of investor types (e.g., conservative, moderate, aggressive). Ofgreater concern is that there is no means of determining any consistencyof how those firms evaluate if an investor is conservative, moderate, oraggressive in nature, or if that determination is beneficial in determining theasset mix for a particular investor.
As discussed earlier, additional problems are inherent in the businessmodel of the recommending firm. Most firms sell what they know. If anindividual is not conversant with commodities, how could any individualexpect that firm to recommend commodities? If a firm has little backgroundin hedge funds, hedge funds will not be recommended. Similarly, in almostany area of investment, one generally requires a background in the assetbefore recommending its use. This problem exists not only in the individual
250 POSTMODERN INVESTMENT
investor area but at the institutional level as well. Increasingly, the boardsof large pension plans are requiring that they have their own investmentrepresentative rather than solely accepting the recommendations of theadvising investment firms or their own internal staffs. These boards knowthat the advising firms have their own set of preanalyzed, compliance-basedfirms that have passed certain screening tests. A different firm would offer adifferent set of firms, not because one is better or worse than another butsimply because it is costly to analyze firms, and these are the firms that theconsultant believes would be accepted by the investor.
An even greater problem is that once a firm or asset allocation processhas been recommended and accepted (i.e., benchmarks agreed to, risk allo-cations determined), it is difficult to change the process despite changingproduct and market conditions. Individuals have made decisions and haveplaced capital based on recommendations and educational material pro-duced by the firm. If firms are fundamentally going to change an investmentbalance or a particular benchmark, they generally have to contact all indi-viduals currently using the product to ensure that each and every individualis assessed of the reason for the change and the potential effect of the changeon the underlying portfolio. It is simply not worth the time, cost, and legalexposure.
For most firms, staying with the tried and true trumps change. Formany firms, it is safer to be consistently wrong than sometimes right. Inaddition, the crux of asset allocation is reliable and independently verifiableinformation. The creation of asset classes for which the fundamental returnprocess cannot be monitored or managed may be of little use. Assetallocation selection models are often little more than black boxes, whetherin the form of investment processes or in the form of assets provided forselection. Do investors using these models appreciate that the results aredependent on the data provided or that historical returns for stocks andbonds may have little to do with expected returns and risk for the future?The historical return for the S&P 500 and historical returns for the Barclaysbond indices may have little to do with current or expected returns to eitherindex. Past historical measures of correlation are a function of the dataperiod used and may not represent risks under a wide range of economicenvironments of greater concern to the investor. With technological andinformation advances, the character and definition of assets have changed.Therefore, most investors do not realize that returns associated with realestate and private equity are, for the most part, accounting returns basedon the business model of the investment vehicle or management firm. Forexample, every investor should ensure that the benchmarks or asset indicesused in his analysis reflects the return performance of actual investableassets. As shown in Exhibit 8.6, for each of the asset class benchmarks often
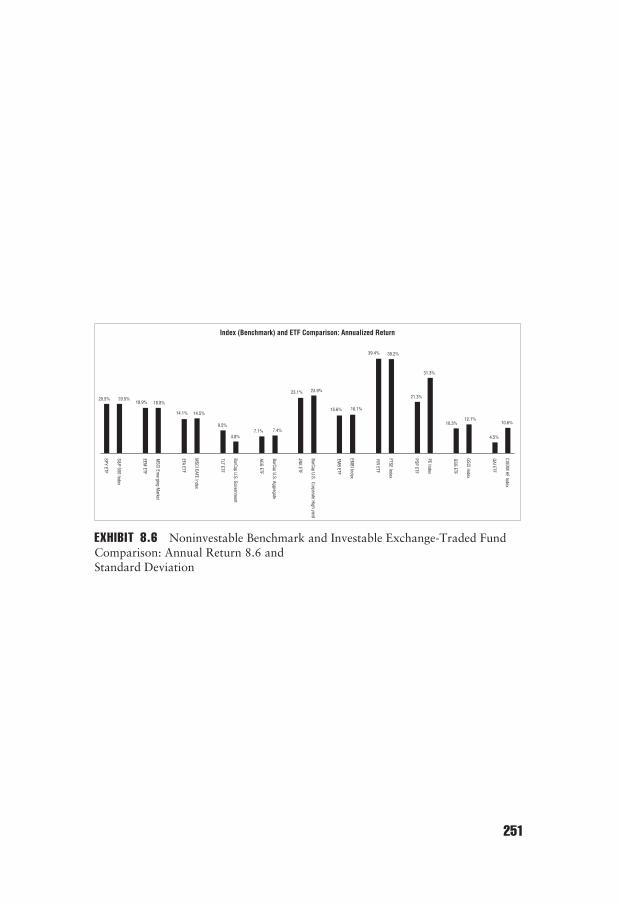
20.5% 20.5%18.9% 18.8%
14.1% 14.5%
9.5%
4.8%7.1% 7.4%
23.1% 23.9%
Index (Benchmark) and ETF Comparison: Annualized Return
15.6% 16.1%
39.4% 39.2%
21.3%
31.3%
10.3%12.1%
4.5%
10.6%
SPY ETF
S&P 500 Index
EEM ETF
MSCI Em
erging Market
EFA ETF
MSCI EAFE Index
TLT ETF
BarCap U.S. Government
AGG ETF
BarCap U.S. Aggregate
JNK ETF
BarCap U.S. Corperate High yield
EMB ETF
EMBI Index
IYR ETF
FTSE Index
PSP ETF
PE Index
GSG ETF
GSCI Index
QAI ETF
CISDM HF Index
EXHIBIT 8.6 Noninvestable Benchmark and Investable Exchange-Traded FundComparison: Annual Return 8.6 andStandard Deviation
251

16.9% 16.8%
27.6%25.2%
22.3% 21.5%
15.6%
3.8% 3.0% 2.7%
13.5%11.0%
8.6%7.1%
26.2% 25.1%
29.1%
32.6%
22.9% 22.0%
5.5%7.9%
SPY ETF
S&P 500 Index
EEM ETF
MSCI Em
erging Market
EFA ETF
MSCI EAFE Index
TLT ETF
BarCap U.S. Goverment
AGG ETF
BarCap U.S. Aggregate
JNK ETF
BarCap U.S. corperate high yield
EMB ETF
EMBI Index
IYR ETF
FTSE Index
PSP ETF
PE Index
GSG ETF
GSCI Index
QAI ETF
CISDM HF Index
Index (Benchmark) and ETF Comparison: Standard Deviation
EXHIBIT 8.6 (continued)
252
Asset Allocation 253
used in this analysis, there exists a number of exchange-traded funds (ETFs)that have performance (annualized returns and standard deviations) similar,but not identical, to the comparison benchmark. Similar analysis should bedone at the mutual fund or manager level to ensure that the results impliedby the use of commonly used benchmarks can be replicated in the real world.Similarly, one should ensure that individual products created to meet uniqueinvestor needs, are not impacted or conditioned by the balance sheet of theprovider or his or her prime broker and other borrowing relationships. Verylittle of this information is in the public domain, and rarely, if ever, dofinancial consultants or brokers incorporate these facts into their analysesfor clients or prospects.
WHAT EVERY INVESTOR SHOULD KNOW
In this chapter we showed that the asset allocation decision lies at the heartof successful investing. At the same time, we showed that there is no singlesimple, all-accepted approach to making this most important decision. Theapproach you use is often founded on your list of acceptable assets andknown risk tolerance. With so much at stake, there is simply too much toknow. Perhaps the following list may help.
■ There Is NO Wizard. The financial disturbances of 2007 and 2008have forced the discipline of asset allocation, and those who profess topractice it, to enter into this new reality phase. Many asset allocators,before (and unfortunately after) continue to use equity and fixed-incomemarkets as the primary investment vehicles in any asset allocationsolution. They continue to use historical data from benchmarks thatno longer exist or have changed so fundamentally that the historicalresults are meaningless. Of even greater significance, if you start usingtheir system: how significantly different are their results from others’?It amazes us how all the major firms seem to advocate the same basicholdings. This seems strange. Either they all have the truth or they areall hoping not to be the odd person out. Investors should use differentasset allocation models (e.g., traditional asset classes, factor based, riskparity).
■ Do Not Expect or Accept the Impossible, but Also Do Not AcceptJust the Possible. Asset allocation is a risk-management tool and,although not as commonly accepted, a return-enhancement vehicle.Investors must fundamentally understand that if an asset allocationprocess suggests that it can produce positive returns in any economicenvironment, the return it offers should be the risk-free rate. In short,

254 POSTMODERN INVESTMENT
asset allocation should not be viewed as merely low-cost insurance. Ifit is, then as with any other low-cost insurance, it will fail to meetthe needs of the investor at the most critical times. Rather, at its core,asset allocation permits a meaningful discussion of the risk-to-returntrade-offs within a portfolio.
■ Accept Tension: We know that the human condition is a constant trade-off between the comfort of constancy and the necessity for change. Itis this tension that creates innovation. One of the major challengesfacing an educator or manager is how to get others to change or reviseheartfelt views that may have once proved useful but no longer fitreality. Often, our advisors become almost like friends. They want itthat way. Investors (retail, institutional) should encourage and accept ahealthy tension between themselves and their advisors. Losing moneyis never easy; it should be painful but within a boundary you, youradvisor, and your asset allocation model understand. Remember, anasset allocation model is not set up to solve a problem (although that ishow they are often marketed), it simply puts the problem in perspective.
MYTHS AND MISCONCEPTIONS IN ASSET ALLOCATION
Change is a common part of the investment world as well as academicresearch. Research in the areas of stock and bond investment, and all otherasset classes, evolves. New theories and information come into existence,which better explain past relationships. Over time, we have developeda host of proposed asset allocation methods, models, and recommendedprocedures. Some of them are simple, some of them are hard, but all ofthem are established on a set of assumptions. At one time many of theseassumptions may have correctly represented reality, but as in any field, astime changes, the conditions that supported these model approaches change.Today we have a set of simple models of asset allocation and asset allocationapproaches, which, for the average as well as the experienced investor, aredifficult to discern. But one thing is certain, they all contain myths andmisperceptions.
Myth 8.1: Diversification across Equity Issuesor Countries Is Sufficient
MPT, advanced originally by Markowitz in the 1950s, centers on thecorrelation relationships and risk reduction opportunities of adding togethersecurities that respond differently to changing economic conditions. Bycombining securities, an investor can reduce a portfolio’s variance. Recent

Asset Allocation 255
experience, however, shows that especially during periods of market stress,such as unexpected increases in credit risk, combining securities may have anegative effect on both stocks and bonds. The market effect on stocks andbonds domestically and globally dominates returns, such that simple stockor international diversification may not reduce volatility in such marketenvironments. As a result, diversification into alternative investments, whichrespond to different market factors than stocks or bonds, is required foran investor to most benefit from asset diversification. Even in this case,investors should be warned. As discussed in this book, many traditionallyclassified alternative investments (e.g., private equity, real estate, hedgefunds) often react to extreme equity and credit movements as traditionalequity and fixed-income securities. Asset allocation models that attempt toprovide downside risk management can generally only be provided withtargeted risk solutions (e.g., options). Diversification within or across assetsmay offer some reduction in asset or country-specific risk but is not often asolution to generic market risks.
Myth 8.2: Algorithmic Approaches to Asset AllocationAre Superior to Discretionary Asset Allocation
There is an increasing desire for asset allocation programs to be runusing a set of decision rules based on a systematic algorithmic-basedasset allocation model. These model-based approaches may cover not onlystrategic asset allocation (e.g., long-term weights) but also tactical (e.g.,short-term rebalancing among asset classes) and dynamic (i.e., changes inthe underlying risk distribution). One of the most well-known of thesealgorithmic asset allocation programs is Target Date funds, each with itsown asset allocation model (e.g., glide path) that adjusts stock and bondinvestments over time. The issue really is in the degree to which these modelshave internal adjustments for changing market environments. The earliestforms of target date programs often put individuals in stocks when young,and bonds when old, even if current market conditions call for bonds nowand stocks later. (Who wants to be in bonds when yields are 2.0 percent?)Algorithmic models may reduce the risk of certain discretionary manager-based decisions, but often replace it with poor, fixed, nondiscretionary assetallocation choices. One is simply replacing manager risk with model risk.Investors should be clear what those risks are.
Myth 8.3: Alpha Is Alpha
Asset allocation models are often driven by not only the desire to lowerrisk but to increase expected return. For many programs, those securities
256 POSTMODERN INVESTMENT
with higher alpha (i.e., excess return above that reflected in the securities’sensitivity to the market) are often selected over similar risk securities withlower alpha. However, the measured alpha may not be the true alpha. If thereis a low estimate of true risk, then the program model also reports a higherestimated alpha than its true alpha. Of course, the asset allocation modelpicks all the assets with the high false alpha. It is even possible to regress Aon B, and A will show an excess return (i.e., positive alpha). Similarly, wecan run B on A with B showing an excess return (i.e., positive alpha). Bothcannot be right. Simple models of alpha often give incorrect answers—oneshould know when or at least that alpha is often not true alpha.
Myth 8.4: Low Volatility Portfolios Provide a Solutionto Investors Desiring Low Market Exposure
The relatively poor equity performance commensurate with high equityvolatility have led to an increased desire for risk-managed products. Manyof these products are aimed at creating a set of portfolios that capturethe low volatility end of the traditional MPT efficient frontier. Theseproducts are created using a range of asset allocation techniques. Someattempt to find the lowest volatility portfolio by assuming certain historicalcorrelation relationships between the securities in the sample. Of course,when market stress increases, and correlation increases, the correlationbetween securities increases, and the low volatility portfolio becomes ahigh volatility portfolio. Other techniques, such as raising cash or goingshort on certain futures contracts to try to keep the portfolio’s risk levelrelatively constant, may not capture sudden moves in the market suchthat volatility-controlled portfolios are sensitive to market dynamics. Oneadditional aspect should be considered: Low volatility programs are alsolow expected return programs. Many investors attempting to capture lowrisk may also simply be guaranteeing low returns.
CHAPTER 9Risk Management
An Oxymoron
In Chapter 8, we noted that for many investors, portfolio creation isbased primarily on the well-known and often used mean-variance asset
allocation model. We also pointed out that over the past 30 years, therehave been major advancements in financial products (e.g., options andfutures) and product design (e.g., portfolio insurance, option-based riskmanagement, targeted mutual funds), which have attempted to directlymanage a portfolio’s expected volatility.
It is a truism in investments that it is easier to forecast risk than it is toforecast return. Unfortunately, it is also a truism that individual investorstarget return as their goal rather than risk. In our years as investmentadvisors, most individuals have come to us with an expected return in mind.Few individuals have come to us with the idea of working the other way,which means finding a level of return volatility the investor was willing tolive with and living with the accompanying expected return.
In fact, few individuals have a clear idea of the concept of risk. In ourexperience, it seems that what investors want is an investment professionalto both protect their assets on the downside and offer them the potential forgains on the upside. They may be willing to lose a little on the downside, butthat loss has to be well defined. From the investment manager’s perspective,our hope lies only in helping to determine what the investor’s expectationsare and how to define them. If we cannot control the future, then we canattempt to control how our investors evaluate us in those various futurestates of the world. We work with the knowledge that if we cannot controlfuture return, perhaps, at least, we can control the risk of how investorsview our efforts in achieving that return.
Even when we discuss the concept of risk management with investors, wehave to make sure that investors realize the risk in risk management. Manyinvestors believe risk management should protect them against loss. In fact,
257

258 POSTMODERN INVESTMENT
in terms of mean-variance asset allocation, managing a portfolio’s standarddeviation does not protect against loss, it only provides a scale of theprobability of potential losses using estimates of variance from the sampleperiod and believing that it is likely to reflect that of the future investmentperiod. Of even greater importance is the fact that price volatility is not theonly definition of risk. In fact, there are states of the world in which we havelittle ability to assess the risk of an event (i.e., the probability that the eventwill occur), and we are often left with simple assessments of certainty oruncertainty (i.e., what one thinks might or might not happen). Thus, assetrisk remains in the view of the beholder, and if the previous chapters areany guide, the truth is that almost 60 years after the introduction of modernportfolio theory, we are still struggling to find ways to precisely define andmeasure the individual factors that affect the expected risk of individualassets and to determine how best to manage the risk of those assets. In theprevious chapters, we explained that the basic message of modern financehas been evolving. In modern portfolio theory, risk was initially viewedas the measured price risk. In fact, risk is multidimensional, whereas theoften-used standard deviation of the historical return of an asset is merelyone possible representation of price risk.
In this chapter, we do not explore the history of risk or even presenta complete framework for its presentation. The typical measures recom-mended for review are risk measures that identify various market risks suchas beta, and absolute risks, such as standard deviation. While concentratingon relatively simple approaches to risk analysis, market-only based riskmeasure may seem to miss more subtle risk exposures. They do not takeinto account many types of risk (e.g., uncertain changes in inflation orregulatory environment, changing correlations between and among assets,new assets, or the vagaries of herd instincts of investors). Often our mostbasic models of risk management assume an efficient market in ideas,intellect, information, process, company structure, and delivery systems aswell as regulatory design. More damning, they are right just enough to beseductive, but not enough to protect against the event that can genuinelydestroy wealth. They appeal to our central hope that the world is fair, allinformation is understandable, and all asset allocation models exist in anefficient market of ideas in which each model is well reviewed and tested,such that while differing in emphasis, each approach stands on the solidground of academic theory and practitioner experience.
It is not that more advanced or complete risk-management models,which go beyond simple variance-based bonds of risk assessment, do not tryto consider imperfections in market information and market structure, onlythat it is our belief that a unique definition of risk is almost unattainableand is surely impossible to measure completely. For example, even if the
Risk Management 259
probability that particularly negative news (e.g., a company missing on itsearnings) could arrive can be estimated with a high degree of accuracy, it stilldoes not mean that we can measure the risk associated with that negativenews. The information would have different implications for differentinvestors. Consider the case of an investor who has substantial investmentsin the equity of the firm that may report the negative news, and worksfor the same firm as well. The risk is clearly far more substantial to thisinvestor than to an investor who works for a competing firm and has afully diversified portfolio of assets. Risk depends on context, and therefore,it is simply too multidimensional to measure by a single number. Yet, themore daunting the task, often the more worthy the venture. In this chapter,some of the most basic approaches to investment risk measurement andmanagement are reviewed. One reason for the emphasis on examples ofrelatively simple risk estimation is that, for many, risk is simply any factorthat may lead to the possibility of losing some or all of an investment. Riskmeasurement is the means by which one attempts to assess that likelihood ofloss, its magnitude and duration, and to, perhaps, design investment policiesaimed at managing that risk.
The typical measures recommended for review are risk measures thatidentify various relative market risks, such as beta, and absolute risks, suchas standard deviation. While concentration on relatively simple approachesto risk analysis may seem to miss more subtle risk exposures, basic assetand portfolio risks are the foundation of any risk analysis. In addition tobasic models of risk assessment and management, we do provide a briefreview of what some investors may regard as more advanced forms of riskmanagement. These approaches are partially based on the development ofvarious derivatives such as futures and options. However, while introducingthese advances to the reader, for more complex approaches to risk estimationat the individual asset or portfolio level, investors are directed to morecomplete presentations.1 The reason we do not concentrate on more complexmodels is that for most investments discussed in this book, the less complexmethods of risk assessment apply. In short, if you need a sledgehammer toknock in a nail, either you have the wrong hammer or you are trying toknock in the wrong nail.
RISK MANAGEMENT VERSUS RISK MEASUREMENT
Measuring and managing risk is the center of the activities undertakenby financial institutions. In fact, some institutions exist only because theyprovide a service to the investor in the risk-management area. Take acommercial bank. It provides a number of services to its clients, but one
260 POSTMODERN INVESTMENT
of the most important ones is to help them manage liquidity risk. Atypical commercial bank takes liquid deposits and invests them in illiquidinvestments, such as commercial and real estate loans, and in the processearns a spread. Its clients have access to liquid investments that offer someminimal returns. Mutual funds are another example of how a financialinstitution provides risk-management services to investors. Mutual fundsallow investors to diversify their portfolios even when the size of theirinvestments are rather small. There are investment products that exist mostlybecause of their abilities to manage risk. Portfolio insurance and coveredcall strategies are two well-known examples of these products. To evaluatethe services provided by these financial institutions and these investmentproducts, investors need to be able to measure risk. In some instances,measuring a particular risk is rather elusive, while managing that particularrisk could be within reach. For example, operational risk is one such risk thatis extremely difficult, if not impossible, to measure, but relatively speaking,it can be managed by instituting enough checks and balances within anorganization such that this immeasurable risk is mitigated. Therefore, it isimportant to understand that while certain risks can be measured, they maynot be the most important ones. The financial industry has developed awhole set of risk measures not because they measure the most importantrisks, but because they are the easiest ones to develop and implement.
To develop useful models of risk measure, we must first decide on thetypes of risks that are important to investors. Once a list of relevant risksis provided, we can examine various ways that the risk can be measured.Next, we may want to look back at historical records of these measures tosee if they would have been effective in informing investors of the risks thatthey were exposed to. Investors can learn a great deal from past financialdisasters about how various risk measures should be used and implemented.
In general, risk measures can be put into two broad buckets. Absolutemeasures of risk refer to those measures that examine risk characteristics ofassets as stand-alone investments. Standard deviation and value at risk are,for example, prominent measures of an investment’s stand-alone portfoliorisk. These measures are most useful for institutional investors or individualinvestors who have well-diversified portfolios and who may apply thesemeasures to the entire portfolio rather than the individual securities thatcomprise the portfolio. In this context, absolute measures of risk do providesome valuable information. The same cannot be said when they are appliedto single securities, because such investments do not have stable properties(e.g., standard deviation), and therefore, historically based risk measuresare often not useful indicators of the future risks associated with theseinvestments. Conversely, relative measures of risk, as the name implies,measure risk characteristics of an investment either in the context of a
Risk Management 261
portfolio or relative to a benchmark. Examples of these measures arebeta and marginal value at risk. These risk measures are widely usedby institutional investors as they typically have well-diversified portfolios.While there is some ambiguity and uncertainty about absolute measures ofrisk, the relative measures are far less reliable measures of risk. The reasonis that they tend to be more complex and they rely not only on the pastbehavior of the investment but also on the behavior of a whole set of otherassets. Beta of an investment depends on both the volatility of the investmentand its correlation with respects to other assets, and potential instabilities inthese relationships could make measured beta a poor indicator of future risk.
Once we have a measure of risk, whether absolute or relative, we cango further and obtain a measure of risk-adjusted return. For example, thecapital asset pricing model (CAPM) is simply a measure of risk-adjustedreturn, where beta is used to measure risk, while Sharpe ratio (discussedbelow) is a measure of risk-adjusted return where standard deviation is usedas a measure of risk. Since the 2007–2008 financial crisis, the term systemicrisk has come to dominate conversations related to risk. Systemic risk refersto events or breakdowns in established economic relationships that affecta wide set of investments. These are macro risks and generally anonymouswith distress and turbulence in financial markets. While investors should beconcerned with systemic and idiosyncratic risks of portfolios, systemic riskis generally of paramount importance to regulators and institutions thathave many counterparties in the financial system. From an investor’s pointof view, there is very little that the investor can do to avoid or managesystemic risk of a portfolio, and any meaningful lowering of exposure tosystemic risk is typically associated with lower return. Finally, while thereare many quantitative and qualitative models of idiosyncratic risk of aninvestment, there are no generally accepted measures of the systemic riskthat may be present in a portfolio. For example, beta is supposed to measurethe exposure of an investment’s return to changes in a diversified portfolioof securities (e.g., market portfolio), but it is not a measure of the systemicrisk embedded in that security. In the presence of systemic risk, most of oldeconomic and statistical relationships will cease to work. Security dealersrefuse to submit a bid for securities in which they are supposed to make amarket, and all but the most liquid assets can be sold only at deep discounts.In this case, knowing that your asset used to have a low beta is not a usefulmeasure of its risk.
Every finance textbook contains a list of risks that investors face. Theytypically include the following:
■ Market risk: This is related to random behavior of traded securitiesthat are included in an investor’s portfolio. Since we have long histories
262 POSTMODERN INVESTMENT
of prices of liquid equity and fixed-income securities, this has been anactive area of quantitative risk measures. Beta, duration, value at risk(VaR), and other measures of volatility or exposures to market riskfactors are primarily used in this area. Market risk itself can be furtherrefined by examining the source of market risk:
■ Equity risk: This is the most well-known and best understood sourceof risk. It results from unexpected changes in global economic prices.Since equity prices should have a positive return in the long run, higherexposure to this risk should lead to higher return.
■ Interest risk: This is also a fairly well understood source of risk, and itmostly affects fixed-income instruments and equity prices of financialinstitutions.
■ Currency risk: Positions denominated in foreign currencies have directexposure to this source of risk. However, currency risk is not one ofthose risks that would contribute to a higher return on a portfolio. Thismeans that if the hedging cost is zero, one may consider eliminating thisrisk.
■ Commodity risk: Investment in commodities has become an increasinglyimportant asset class in recent years. A portfolio may have exposure tounexpected changes in commodity prices even if it does not have directinvestment in commodities; for example, an unexpected increase in oilprice will significantly affect several sectors of the economy.
■ Inflation risk: This risk will manifest itself through changes in interestrates and commodity prices. Further, this is an unappreciated risk forthose portfolios where the total return is supposed to fund operations ofan entity, cover the cost of living of a family, or pay for the replacementof real assets.
■ Credit risk: This is associated with the failure of a company or coun-terparty to fulfill its obligations. Unlike market risk, which arises fromunexpected changes in economy-wide risk factors, such as interest rates,equity prices, and currency rates, credit risk is primarily related to thenonperformance of one or more counterparties. Also in contrast to mar-ket risk, which may lead to symmetrical returns (e.g., a bell-curve shapefor return distribution), credit risk generally leads to return distributionsthat are substantially skewed to the left. The upside performance of aposition exposed to credit risk is limited to the recovery of the originalinvestment plus the promised yield, while the downside performancecould lead to the loss of the entire investment. Credit risk models are farmore complex than market models, and this is an area where academicand industry research is trying to catch up with events on the ground.In its simplest form, credit risk can be measured by the probabilityof default or credit downgrade of an investment. This can be further
Risk Management 263
expanded by taking into account the potential recovery rate of the claimin the case of default and the systemic component of the credit event.The latter requires the investor to determine the degree to which defaultby counterparty could trigger defaults by other parties.
■ Liquidity risk: This is an important and equally difficult risk to dealwith. This risk can be broken into two types: funding risk and assetliquidity risk. The first type arises when an investor needs to fund long-term assets through short-term funding. The risk arises because thereare market conditions under which an investor may not have accessto any source of short-term or long-term funding, and this typicallyleads to forced selling of assets. Some commercial banks, investmentbanks, hedge funds, and endowments learned painful lessons during the2007–2008 financial crisis when short-term credit markets froze, andthey were forced to sell assets to reduce their funding requirements. Theforced selling in itself does not have to be costly to investors unless theassets lack sufficient liquidity, especially in times of crisis. This bringsus to the second type of liquidity risk: illiquidity of assets. Forced sellingof illiquid assets requires the seller to accept deep discounted pricesfor the assets. The potential size of the discount is a measure of therisk faced by the investor. Academic and industry practitioners havegrappled with liquidity risk for many years, and we have yet to see aworkable and reliable measure of this risk.
■ Operational risk: This is by far the most difficult, and some wouldargue the most significant, risk that financial institutions could face.In other words, this is a risk for an investor who delegates managingand monitoring of an investment portfolio to a money managementfirm. Financial press is quick to point out the spectacular losses thatinvestors have experienced because of operational risk, meaning riskdue to fraud, rogue traders, or poor risk management. The most recentexamples of these were losses experienced by investors with Madoff,Amaranth Advisors, and Bayou Hedge Fund. As much as operationalrisk is important, it is the most difficult risk to measure quantitatively.Even qualitative models employed by auditors and compliance officersare not capable of providing a measure of operational risk. Finally,while exposures to market, credit, and liquidity risks can be justifiedbecause they may lead to higher returns, there is simply no reason tobelieve that increased exposure to operational risk will somehow leadto higher return. In other words, operational risk is the one risk thathas to be avoided all together.
■ Political and regulatory risk: This risk was at center stage during the1960s and 1970s when a number of emerging economies decided tonationalize some major industries previously owned by multinational
264 POSTMODERN INVESTMENT
companies. While the risk of nationalization has been reduced in recentyears, the risks posed by changes in regulations have increased. Themost recent example of this risk was the ban on short-selling that wasinstituted by some of the major industrialized countries at the heightof the 2007 to 2008 financial crisis. The financial industry is the mostregulated industry and thus investments in equity and fixed income areespecially susceptible to this risk. In addition, investments where taxtreatment of the income is important have exposures to this risk. Forexample, high-dividend stocks could be hurt if favorable tax treatmentof dividends is changed. There are some quantitative models of politicalrisk, but there are no well-accepted measures of regulatory risk. Morerecently, sovereign bond traders are learning that quantitative modelsare inadequate in dealing with risk and volatility that is created byuncertain outcomes of the political process.
MEASURES OF RISK
There are numerous quantitative measures of risk, and a discussion of allthese measures is beyond the scope of this book and, in our opinion, nota useful exercise. In addition, there is a great deal of commonality amongvarious measures of risk. For example, all else being equal, the higher a secu-rity’s standard deviation, the higher its beta. In other words, after lookingat less than a handful of measures of absolute and relative risk, estimatingadditional measures will contribute very little to our understanding of therisk characteristic of an investment.
Standard Deviation or Variance
This is the most well-known and accessible measure of risk. Basically, itmeasures the degree of dispersion or variation that exists from the averageor mean return. Academic research has made much progress during the last30 years in obtaining more accurate and robust estimates of volatility,which has been fueled by the expansion of derivative markets wherevolatility typically plays a crucial role in price determination. Similar toother estimates of an investment’s characteristics, historical data is usedto obtain estimates of volatility. Therefore, it is subject to various formsof estimation error, and if the estimate is obtained during normal marketconditions, it is likely to prove highly inadequate during periods of financialdistress. An important development during the past 10 years is that thevolatility itself has become the basis of investment products. Whether itis futures contracts on volatility index (VIX) or volatility swaps, investors
Risk Management 265
are now able to use these products to make directional bets on the marketvolatility or manage their volatility exposures.
Value at Risk
As discussed in previous chapters, many of the recommended asset allocationor asset class-based investment programs were often as much a function ofinvestor needs as the business needs of the product provider. The promotionof a security’s beta as the sole measure of its riskiness was partially theresult of early 1960s-era computers requiring a simple means to determinean asset’s expected return and risk; a security’s beta gave them just thattool. The advancement of technology, market structure, and governmentregulation brought about major changes in risk management by forcingrestrictions on what risks we managed and how we managed them. Forexample, regulations that encouraged asset managers to track establishedbenchmarks for their strategy focused them on reducing a fund’s trackingerror relative to the cited benchmark. The change in regulations in themid-1970s, which partially led to the rapid increase in defined pension fundassets, also led to the rise in firms providing risk-management services thatattempted to insure that the asset returns tracked liability forecasts (e.g.,asset liability-managed or liability-driven investment). In the latter half ofthe 1980s, partially because of increased pressures on financial institutions,central bankers from around the world met in Basel, Switzerland, andthey published a set of minimum capital requirements for banks. In time,these efforts led to the development and adoption of the Basel Accords Ithrough III, which were attempts to find better ways to come to gripswith changing financial markets and financial products. This effort, in part,led to new, more structured approaches to determining the potential riskor value exposure of banks, including one of the most commonly usedrisk-evaluation measures known today: VaR.
The development of VaR was partially due to advances in computertechnology and market structure, which led major investment banks toconsider new methods of determining their overall risk exposure. In theearly 1990s, two large money center banks, J.P. Morgan and BankersTrust, generated two approaches to portfolio risk measurement known asRiskMetrics and risk-adjusted return on capital (RAROC). For many, thesetwo models were the birth of modern risk management. While multifactormodels of return estimation had long been part of the financial world, thesemodels took a more structured approach to determining how the potentialchanges in the measured risk factors affected portfolio value. By assumingdifferent future scenarios for each risk factor, the changes in a portfolio’svalue for changing market conditions could be estimated.
266 POSTMODERN INVESTMENT
Again, the statistical concepts and risk measures used in both RiskMet-rics and RAROC were not new to the academic or practitioner communities.What both approaches did was provide an impetus and a benchmark bywhich additional approaches to measuring the effect of changing marketconditions on portfolios could be evaluated. The programs permitted firmsto evaluate their portfolios over a range of risk measures.
The concept of VaR is highly connected to the concept of standard devi-ation. In fact, in its most common form, there is a one-to-one relationshipbetween standard deviation and VaR. Given this fact, it is rather surprisinghow much attention is paid to VaR. One reason, as was mentioned, is thatcertain regulations require financial institutions to estimate and report theirVaR to regulatory bodies. The other reason is that VaR makes standarddeviation more intuitive. For a given portfolio, probability, and time hori-zon, VaR is defined as the loss that is expected to be exceeded with the givenprobability, over the given time horizon, under normal market conditions,assuming that there is no portfolio rebalancing. For example, if a portfolioof stocks has a one-day VaR of $1 million at the 95 percent confidence level,then there is 5 percent chance that the one-day loss of the portfolio couldexceed $1 million, assuming normal market conditions and no intradayrebalancing.
The VaR has well-known shortcomings, including:
■ The return distribution of the portfolio is assumed to be normal. Thismeans that mean and standard deviation are enough to adequatelydescribe the probability of bad outcome. If the return distribution isnot normal, then knowledge of the form of the distribution is requiredbefore further analysis can be made. In most applications of VaR, themean of the distribution is ignored because (a) the mean return is arather small figure over short periods (e.g., one day) and (b) the meanof the distribution is notoriously difficult to estimate.
■ Even if the distribution is normal, the problem then becomes howto measure standard deviation and whether the measured standarddeviation is specific to the interval used or to the historical period ofanalysis. Thus, one of the principal decisions to be made when measuringrisk or any return-based statistical parameter is the return interval to beemployed and the period of analysis. For example, research has shownthat if one day in 2008 is left out, the estimate of annualized standarddeviation based on daily data can differ dramatically from weekly ormonthly data. In brief, how are past observations that may not berelevant in future risk environments handled?
■ VaR assumes that the investment is liquid enough so that, if desired, theportfolio can be liquidated at the assumed loss. For example, stating that
Risk Management 267
the daily VaR of a portfolio of illiquid assets is $1 million provides verylittle useful information because the investor will have a difficult timeliquidating the portfolio if a loss greater than $1 million is supposed totrigger some type of sell signal.
■ VaR measures only one type of risk, and measures that risk ratherimprecisely. VaR has little to say about credit risk, operational risk,political and regulatory risk, and risks that have not been observed inthe past (the so-called black swan).
There are numerous books on the measurement and use of VaR.Despite its known limitations, it remains a principal means by whichvarious regulatory agencies and firms track the potential downside risk ofa current or anticipated portfolio. In recent months, J.P. Morgan’s use ofVaR or, more importantly, its alleged misuse of VaR, has been at the coreof concerns over the trading loss of one of its divisions. Investors again arewarned that passive or active risk-based models are susceptible to errors ofomission or commission. Given the above concerns, investors should notuse VaR as a sole or primary means of evaluating the risk of a portfolio.
Maximum Drawdown
While the relationship between VaR and standard deviation is in mostcases highly predictable, the relationship between standard deviation andmaximum drawdown (MDD) is not so well known. This measure of risk,which is rather popular in the alternative investment area, measures themaximum loss of an investment from peak to trough over a given period.It is argued that MDD can capture the risk-management skills of aninvestment manager and his ability to cut the losses resulting from a giveninvestment strategy. Related to MDD is time under high water mark, whichis also believed to measure the risk-management skills of a fund manager.Basically, high water marks measure the maximum value that an investmenthad achieved over an earlier given period. Therefore, time under high watermark measures the ability of a fund manager to recover losses and recapturethe old maximum value for the fund. Of course, analyzing only those fundmanagers who recover from loses may reflect a high degree of backfill biasin that only the strong or the lucky survive.
Beta
As we have tried to emphasize throughout this book, asset allocation is theprocess of creating a portfolio with a proper risk-to-return balance. Further,as we have also argued, the performance of a diversified portfolio is mostly
268 POSTMODERN INVESTMENT
determined by its exposures to various sources of risk. In a multifactormodel approach to risk estimation, one may wish to evaluate how thevolatility of a security can be decomposed to determine how allocation toeach asset class contributes to the total risk of the portfolio. In this way, theportfolio manager can balance the potential return from each allocation bythe contribution of the allocation to the total risk of the portfolio.
It is essential that a portfolio manager be fully aware of how much riskeach asset class or investment contributes to the total risk of the portfolio(i.e., its incremental risk). For a portfolio that is properly balanced in termsof risk and return, the expected return from each asset class should bedirectly related to the marginal contribution of that asset class to the riskof the portfolio. Therefore, if the contribution of an asset class to the totalrisk of a portfolio is twice as high as the marginal contribution of anotherasset, then the expected contribution of the first asset to the portfolio’sperformance should be about twice as high as that of the second asset.Investors should realize that there is not just one measure of the marginalimpact of an asset to the risk of a portfolio. It partially depends on howthat risk is measured.
Beta is the most well-known measure of relative risk. In a single-factor framework, beta measures the sensitivity of the return on an equityinvestment to the return on a well-diversified portfolio (e.g., the marketportfolio). Also, beta offers an assessment of the marginal effect of a securityon the variance of the benchmark. While in theory one can calculate the betaof any investment, beta is not typically used for fixed-income investments.The primary reason for this is that we know the beta of a fixed income willchange through its life; that is, a 10-year bond will be a 9-year bond nextyear, an 8-year bond the following year, and so on. How do you measurethe beta of a bond and how does that historical beta relate to the futurebeta of the bond?
In a multifactor framework, beta measures the exposure of an invest-ment to some important economy-wide source of risk. For example, theexposure of investments to inflation can be measured through its beta withrespect to inflation or even better to an investment whose return is highlycorrelated with unexpected inflation. There have been many books and arti-cles written about beta, and a detailed discussion of this concept is beyondthe scope of our book.
Marginal Value at Risk
The same way that beta measures the contribution of an investment to thetotal risk (i.e., standard deviation) of a portfolio, marginal VaR measuresthe marginal contribution of an investment to the total VaR of a portfolio.
Risk Management 269
It is important to note that marginal VaR of an investment is almost alwaysless than its own VaR. The reason is diversification. Some of the riskembedded in VaR is diversified away in the context of a portfolio, andtherefore the margin VaR of the investment could be substantially lowerthan its own VaR. The concept of risk budgeting is partly based on themeasure of marginal VaR. In this approach to portfolio management, theinvestor establishes a risk budget for each asset class and then finds the bestinvestments that can be put into that bucket.
Duration
Duration of a fixed-income asset is similar to the beta of an equity invest-ment. For plain vanilla fixed-income instruments, duration provides anadequate measure of the exposure of the investment to changes in thegeneral level of interest rates over a short period of time. Over long peri-ods, duration is of little use because the duration of a bond changes as itapproaches maturity. Further, the duration of a bond changes as interestrates change. For this reason, duration works reasonably well only whenthere are small changes in interest rates. Generally speaking, longer maturityand lower coupon rate means longer duration. Intuitively, when a bond issaid to have a duration of, say, five years, it means that it behaves similar toa five-year zero-coupon bond.
Tracking Error
This measure of relative risk is applied when there is proper benchmarkfor the investment, and the investment manager’s performance is measuredrelative to that benchmark. Tracking error is basically the standard deviationof the differences between periodic returns on an investment product andperiodic returns on the benchmark. Generally speaking, investors are willingto accept some degree of tracking error if there is a chance that the managercould outperform the benchmark. For certain asset classes (e.g., large-capU.S. equities), money managers rarely display skills needed to outperformtheir benchmark (e.g., Standard & Poor’s [S&P] 500) on a consistent basis.Therefore, one could argue that there are likely to be no rewards to bearingtracking-error risk for this asset class.
Each of the measures of risk may be based on a range of estimatedvalues. These values may be estimated using a range of estimation techniquesincluding historical simulation as well as Monte Carlo simulation. Each ofthese methodologies has their own set of assumptions. One of the issuesin the use of prepackaged methods of risk assessment is that a particularportfolio or asset may not fit well into the preprocessed risk package.
270 POSTMODERN INVESTMENT
For example, the assets in a given portfolio may not be tracked by thepricing systems incorporated into the generic risk program.
For the average investor, both the cost and the level of detail offeredby the current versions of these risk-management models make their useprohibitive. In addition, the systems are usually ex post in that they help inmeasuring the risk of an existing portfolio rather than helping to determinethe potential impacts of programs aimed at directly managing the risk targetof a defined program.
RISK-ADJUSTED MODELS
In many cases the risk measures discussed in the above sections are used toobtain risk-adjusted estimates of an investment’s performance. Below, wediscuss a few of these measures of risk-adjusted performance.
Sharpe Ratio
Among the primary forms of risk assessment, an asset’s standard deviationremains the industry’s primary benchmark for risk evaluation. While weunderstand the wide range of choices in risk evaluation, for many, whenthe choice is between two (or more) assets, one way of ranking investmentsis to simplify risk into a single parameter (e.g., standard deviation). TheSharpe ratio essentially divides the return of the asset or security (after firstsubtracting the risk-free rate of return from the return) by the risk (i.e.,standard deviation) of the asset or security. The higher the ratio, the morefavorable the assumed risk-to-return characteristics of the investment. TheSharpe ratio is computed as:
Expected return − Riskless rateStandard deviation of return
This measure can be taken to show return obtained per unit of risk.While the Sharpe ratio does offer the ability to rank assets with different
return and risk characteristics (measured as standard deviation), its usemay be limited to comparing portfolios that may realistically be viewed asalternatives to one another. First, the Sharpe ratio has little to say about therelative return-to-risk trade-off of individual securities. There is simply toomuch randomness of the price movement of individual securities to make theSharpe ratio any real use at the individual asset level. Moreover, the Sharperatio does not take into account that the individual assets may themselvesbe formed to create a portfolio. The risk of a portfolio stems more from the
Risk Management 271
covariance of the assets in the portfolio than from the stand-alone risk ofthe individual assets.
The Sharpe ratio has other well-known shortcomings, including:
■ In periods of historical negative returns, the strict Sharpe comparisonshave little value. The Sharpe ratio should be based on expected returnand risk. However, in practice, actual performance over a particularperiod of time is often used. In periods of negative mean return, anasset may have a lower negative return and a lower standard deviation,yet report a lower Sharpe ratio (e.g., more negative) than an alternativeasset with a more negative return and with a higher relative standarddeviation.
■ Gaming the Sharpe ratio. A manager with a high Sharpe ratio will geta close look from institutional investors even if the absolute returns areless than stellar. Investment managers employ a number of tactics toimprove their measured Sharpe ratio. For many asset classes, increasingthe time interval used to measure standard deviation will typically resultin a lower estimate of volatility. For example, the annualized standarddeviation using daily returns is generally higher than when weeklyreturns are used, which is again higher than when monthly returns areused. Lengthening the measurement interval will not alter return, butwill generally lower the standard deviation. Another trick involves theway returns are reported. If the annual return measure is an arithmeticaverage of monthly returns, and the standard deviation is calculatedfrom the monthly returns, the Sharpe ratio will be upwardly biased.
■ Options change the return distribution. Rather than approximating anormal distribution, options produce nonnormal return distributions,depending on the choice of option types and strikes. For example,writing a 10 percent out-of-the-money put on a portfolio indexed tothe S&P 500 each month generates annual premiums. If the manager islucky, this strategy will show a significantly higher Sharpe ratio, as thepremiums flow directly to the bottom line with no apparent increase involatility. Strategies that involve taking on default risk, liquidity risk,or other forms of catastrophe risk have the same ability to report anupwardly biased Sharpe ratio. Purchasing a put or constructing a collarhas other impacts, both in the return and the probability of extremevalues. In both of these cases (i.e., purchasing put or active collar), theimpact of measured volatility may be greater than the negative effect onexpected return.
■ Smoothing is also a source of potential bias. Smoothing is also apotential problem when the assets in a portfolio are difficult to priceor for which the investment manager has a role in estimating an asset’s
272 POSTMODERN INVESTMENT
current price. The investment manager (or the pricing model employedby the manager or outside pricing service) may bias returns in ways thatunderstate monthly gains or losses, thereby reducing reported volatility.
Investors are trained to ask for a portfolio’s Sharpe ratio despiteconcerns as to how it is measured and what it measures. Other simplesingle factor measures (e.g., skewness or kurtosis), are often used to describerisk differences between assets with little or no knowledge as to their use,investor understanding, or problems in their construction. For example,we constantly see investment reports of a security’s skewness with noinformation as to its meaning (e.g., for two assets with the same standarddeviation, the one with the high level of positive [negative] skewnesssupposedly has a higher probability of very high [low] returns) or itslevel of significance (e.g., it is possible that while a security may reporta historical measure of positive or negative skewness, the security’s trueexpected skewness going forward may be zero).
Treynor Ratio
One potential disadvantage of the Sharpe ratio measure is that even if itis used solely at the portfolio level, if it exists within a multi-asset classenvironment, it may not provide a reasonable base for comparing portfoliosof alternative assets (e.g., commodities, hedge funds, private equity, etc.)since it is based on a portfolio’s stand-alone variance, and not its covariancewith other assets that are included in a multi-asset portfolio. Anothermeasure suggested in the literature is the Treynor measure. This measureflows from an understanding of CAPM. The Treynor model states thatperformance of an investment can be measured as the ratio of return inexcess of a safe investment divided by the beta of that investment. That is,
Treynor ratio = Expected return − Riskless rateBeta of the investment
As a consequence, the Treynor measure addresses one of the drawbacksmentioned earlier regarding the Sharpe ratio. The Treynor measure workswell when adding assets to a multi-asset portfolio because the betas of theassets can be used as surrogates for the marginal risk of adding the asset tothe multi-asset portfolio.
Other well-known shortcomings of the Treynor measure include:
■ Market Portfolio and Benchmark Measurements: As discussed inChapter 1, the CAPM is not as generally accepted today as it was
Risk Management 273
at its inception nearly 40 years ago. Finding the market portfolio is amore difficult task than was initially believed. It is not clear what thatproxy should be.
■ Correlation or Beta: Beta is often used as a measure of relative movementbetween two assets. However, beta is determined by its correlation witha proxy index and the relative standard deviations of the security andthe proxy index. A security can have a high beta and a low correlationwith the proxy index if its relative standard deviation is high, or itcan have a low beta and a high correlation with the proxy index ifits standard deviation is relatively low. In short, beta does not equalcorrelation.
■ Time Period of Analysis: There is no single way to determine how manydata points, or the time interval, to be used to capture a security’s beta.If too long a period is used, you average over periods in which the truebeta is not the same; if too short a period is used, you fail to capture therelative sensitivity of the security and the proxy index.
In almost any investment security report, a security’s beta is presented.Almost no information is presented as to the benchmark used, the timeperiod of estimation, the return interval used, or the significance of the betain terms of the certainty of the level of the beta. The use of beta without thiscritical information is a useless exercise in understanding risk.
Information Ratio
There are various definitions of the information ratio. Therefore, investorsneed to be careful when they see reports containing this ratio. The simplestversion of the information ratio is to divide the estimated mean returnby the estimated standard deviation. In this case, the information ratiowould be identical to the Sharpe ratio when the riskless rate is zero. Thedisadvantage of the information ratio, when compared to the Sharpe ratio,is that a portfolio manager could increase the reported information ratioby using more leverage. This does not apply to the Sharpe ratio, whichis mostly fixed for different degrees of leverage. Another version of theinformation ratio requires dividing the alpha of an active portfolio by thetracking error of the portfolio. To apply this definition, the investor needsa well-defined benchmark, where it is used to estimate both the alpha of aportfolio, which is the difference between the return on the portfolio andthe return on the benchmark, and the tracking error, which is the volatilityof the differences in returns. In this form, the information ratio is a measureof active management risk and reward. Clearly, an investor should prefera manager who can generate consistent alpha, which would lead to a veryhigh information ratio.
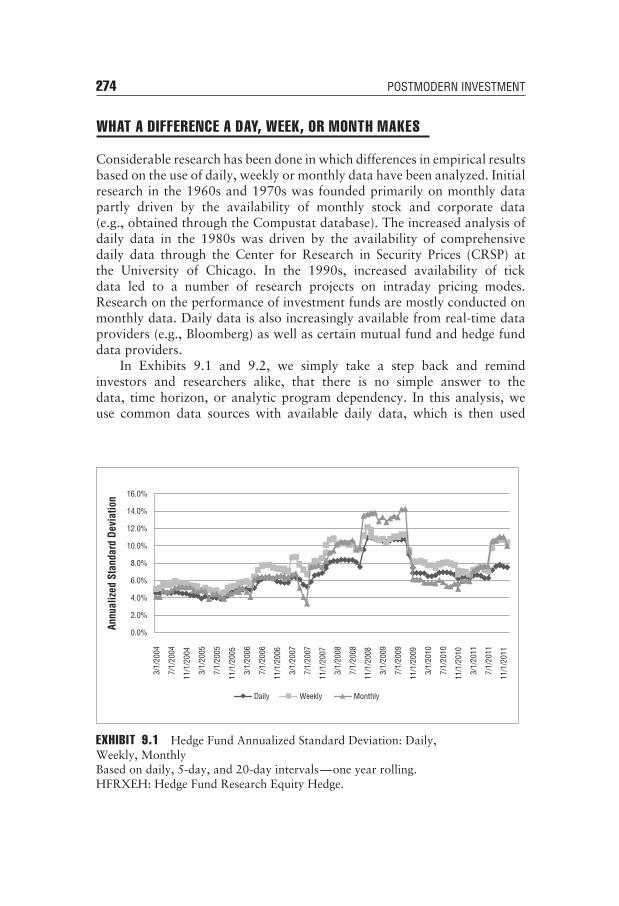
274 POSTMODERN INVESTMENT
WHAT A DIFFERENCE A DAY, WEEK, OR MONTH MAKES
Considerable research has been done in which differences in empirical resultsbased on the use of daily, weekly or monthly data have been analyzed. Initialresearch in the 1960s and 1970s was founded primarily on monthly datapartly driven by the availability of monthly stock and corporate data(e.g., obtained through the Compustat database). The increased analysis ofdaily data in the 1980s was driven by the availability of comprehensivedaily data through the Center for Research in Security Prices (CRSP) atthe University of Chicago. In the 1990s, increased availability of tickdata led to a number of research projects on intraday pricing modes.Research on the performance of investment funds are mostly conducted onmonthly data. Daily data is also increasingly available from real-time dataproviders (e.g., Bloomberg) as well as certain mutual fund and hedge funddata providers.
In Exhibits 9.1 and 9.2, we simply take a step back and remindinvestors and researchers alike, that there is no simple answer to thedata, time horizon, or analytic program dependency. In this analysis, weuse common data sources with available daily data, which is then used
0.0%
2.0%
4.0%
6.0%
8.0%
10.0%
12.0%
14.0%
16.0%
3/1/
2004
7/1/
2004
11/1
/200
4
3/1/
2005
7/1/
2005
11/1
/200
5
3/1/
2006
7/1/
2006
11/1
/200
6
3/1/
2007
7/1/
2007
11/1
/200
7
3/1/
2008
7/1/
2008
11/1
/200
8
3/1/
2009
7/1/
2009
11/1
/200
9
3/1/
2010
7/1/
2010
11/1
/201
0
3/1/
2011
7/1/
2011
11/1
/201
1
Annu
aliz
ed S
tand
ard
Devi
atio
n
Daily Weekly Monthly
EXHIBIT 9.1 Hedge Fund Annualized Standard Deviation: Daily,Weekly, MonthlyBased on daily, 5-day, and 20-day intervals—one year rolling.HFRXEH: Hedge Fund Research Equity Hedge.
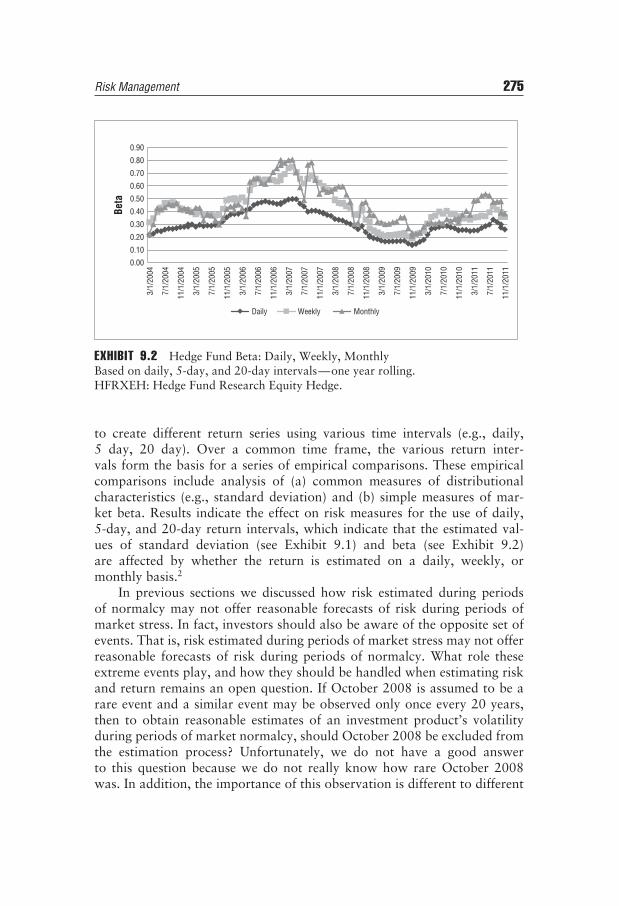
Risk Management 275
0.00
0.10
0.20
0.30
0.40
0.50
0.60
0.70
0.80
0.90
Beta
Daily Weekly Monthly
3/1/
2004
7/1/
2004
11/1
/200
4
3/1/
2005
7/1/
2005
11/1
/200
5
3/1/
2006
7/1/
2006
11/1
/200
6
3/1/
2007
7/1/
2007
11/1
/200
7
3/1/
2008
7/1/
2008
11/1
/200
8
3/1/
2009
7/1/
2009
11/1
/200
9
3/1/
2010
7/1/
2010
11/1
/201
0
3/1/
2011
7/1/
2011
11/1
/201
1
EXHIBIT 9.2 Hedge Fund Beta: Daily, Weekly, MonthlyBased on daily, 5-day, and 20-day intervals—one year rolling.HFRXEH: Hedge Fund Research Equity Hedge.
to create different return series using various time intervals (e.g., daily,5 day, 20 day). Over a common time frame, the various return inter-vals form the basis for a series of empirical comparisons. These empiricalcomparisons include analysis of (a) common measures of distributionalcharacteristics (e.g., standard deviation) and (b) simple measures of mar-ket beta. Results indicate the effect on risk measures for the use of daily,5-day, and 20-day return intervals, which indicate that the estimated val-ues of standard deviation (see Exhibit 9.1) and beta (see Exhibit 9.2)are affected by whether the return is estimated on a daily, weekly, ormonthly basis.2
In previous sections we discussed how risk estimated during periodsof normalcy may not offer reasonable forecasts of risk during periods ofmarket stress. In fact, investors should also be aware of the opposite set ofevents. That is, risk estimated during periods of market stress may not offerreasonable forecasts of risk during periods of normalcy. What role theseextreme events play, and how they should be handled when estimating riskand return remains an open question. If October 2008 is assumed to be arare event and a similar event may be observed only once every 20 years,then to obtain reasonable estimates of an investment product’s volatilityduring periods of market normalcy, should October 2008 be excluded fromthe estimation process? Unfortunately, we do not have a good answerto this question because we do not really know how rare October 2008was. In addition, the importance of this observation is different to different
276 POSTMODERN INVESTMENT
investors and, therefore, we cannot develop a one-size-fits-all approach tosolving this problem.
QUALITATIVE RISK MANAGEMENT
We recommend that investors choose a number of managers within aparticular investment to reduce the risks of an individual manager. Whilethis chapter has concentrated on reviewing various risk processes andconcerns regarding their implementation, for most investors, the process ofevaluating and monitoring investment risk selection begins and ends withchoosing an individual who will provide both portfolio asset selection andrisk management. In short, for most investors the manager would handleboth investment and risk management.
The decision begins and ends with the choice of an investor’s personalinvestment and risk advisor. It is impossible in this brief section to detail allof the various due diligence aspects required for an in-depth analysis. Thefollowing points simply reflect some of the principal points involved in adue diligence review:
Financial Advisor or Consultant: For the most part separate yourself,at least emotionally, from your advisor. This may be a strangestatement especially after pointing out the importance of investmentadvisors, but this is a business decision. Investors have to (a) verifyeducation and certification, (b) understand the depth and breadthof the investment and support teams, (c) understand and testthe fundamental investment methodology and investment process,(d) be aware of risk presentation bias, and (e) understand and testsystems and procedures (including disaster recovery, back officeand compliance practices).
Trading Process: If the manager has direct investing control, ensure thatyou know (a) who has authority to trade the portfolio and whattheir backgrounds are; (b) who are the counterparties and what isthe due diligence regimen for their selection; (c) who are the auditorsand whether they are independent; (d) who is responsible for riskmanagement and what are the day-to-day procedures for trackingrisks, portfolio composition, and allocations, as well as liquidity,and if risk management has the authority to stop unauthorizedtrades or the authority to demand that the portfolio be broughtback into compliance with investment guidelines; and (e) who theinternal and outside legal teams employed by the firm are.
Risk Management 277
Strategy: The manager must provide (a) investment style characteriza-tion; (b) instruments used for investment; (c) description of fundstrategy and its principles; (d) trading philosophy; (e) information asto when the strategy will make money and when it will lose money;(f) strengths and weaknesses of the fund’s investment strategy;(g) number of investments in the fund’s portfolio; (h) breakdown ofinstruments traded (by percentage); (i) current long, short, and cashpositions; (j) firm administration; (k) investment vehicles offered;and (l) brokerage firms and prime brokers used.
No matter how an investor arrives at managers or which vehiclesare chosen for implementation, monitoring the strategy over time is key.Just as market fluctuations will gradually move the initial asset allocationdecision, manager and/or product goals and objectives should be periodicallyreviewed.
A PERSONAL VIEW: ISSUES IN RISK MANAGEMENT
Simply put, economic and financial change is difficult for all of us. Moreover,the dynamics of the ultimate winners and losers is not an easy forecast.For much of the past, larger-fund firms with all their financial resourceswould have seemed easily positioned to defeat smaller rivals; however, newtechnology and regulatory freedoms have permitted smaller specialized firmsto compete directly with larger rivals. Technology, globalization in tradeand investment, and the ease of knowledge transfer enables many smallerfirms to provide specialized local financial products with a comparativeadvantage as they take advantage of global risk-management tools. Just asthis technology has arrived to permit a more level playing field, the worryis, of course, that government regulation will tilt the game back in favorof larger financial firms that can meet the cost and oversight needs of newregulatory controls. It would also be negligent of us not to point out thatsimple reliance on technology is not the answer.
As mentioned earlier, a quick click on a web search engine for assetallocation brings up millions and millions of hits. A multitude of modelsexist, each with their own unique twist on pricing and risk management.Complex problems are not solved with simple solutions. Risk-managementmodels are mostly based on historical data that either does not reflecttoday’s markets or fails to capture the probability of potential events. In anycase, the dynamics have changed. Recent events in the United States haveconfirmed the failure of a rule-based-only approach to risk management.Even if it works in general, it may fail in the particular.

278 POSTMODERN INVESTMENT
Is there a simple one-size-fits-all regulatory, technological, and financialframework that provides markets with both the financial needs and thecompetitive environment required for long-term market survival? It wouldhave to protect the existing system from the impacts of that change whiletaking into consideration the competing interests of government, firms, andinvestors, who are the partners and the players in the modern global worldof financial change. Even more so, how we proceed with this change willcertainly affect the outcome. Given the dynamics of the competing interestsand competing economic reality, how best can investors deal with futureuncertainty? For those who manage funds, the concepts of option pricingshould be familiar. Firms or funds that succeed must be flexible enough toreact to any new reality. Firms must hold, if possible, a number of costlessreal call options that may not provide them with success in this currenteconomic environment, but which can be easily turned on in the next. Fundsare able to have the characteristics (costless real options) that allow themto mutate and enable firms, funds, or countries to meet those changes. Itdoes not require much time in thinking of past examples of firms, funds,countries, or species that were dominant, only to fail as they were unableto adapt to new conditions and reality. Maybe the best thing we can learnfrom the past is that it is just that, the past. The future remains open tothose who are prepared to meet the new realities of the present and are notconstrained to constantly attempt to correct past shortcomings.
For many of the reasons provided above, risk management has hadan increasing reliance on quantitative models that provide one-size-fits-all solutions to complex problems. If finance theory has provided anyperspective on the investment world, it is that expected return is a functionof risk (i.e., there are no free solutions without return and risk impact), andone can adjust the normal return and risk profile only through the use ofoptions or their synthetic alternatives. In short, financial theory providesus with a limited framework that quantitative models, however neutral,generic, or evolutionary can fundamentally change. As a result, discretionin the asset allocation process is a necessity. It is an additional factor ina multidimensional equation. For much of this book, we have centeredour discussions on the concept of risk management (e.g., a process fordetermining the probabilistic impacts of various investor choices). However,we also emphasized very early in our discussions, that in fact, most of ouractions exist not in the world of risk, but in the galaxy of uncertainty.Again, we know what we know, we know what we do not know, we donot know what we do not know. To borrow a concept from the efficientmarkets, the known is a random variable with drift. The use of discretionadds an evolutionary control variable on both the changing risk posturesof the asset allocation process as well as adding an additional factor to
Risk Management 279
potential risk. For many, market-sensitive risk models only work if theyare used by most participants such that there is an agreement as to themeaning of the outcomes of the model. At the same time, the fact thatnumerous individuals are using the model makes the system sensitive to theassumptions of the model being used. Both the failure in the assumptionsbehind the use of the copula model in measuring credit risks, or the currentfailure of the federal macroeconomic model to adequately forecast grossdomestic product (GDP) growth, are but two examples of the failure ofquantitative models in providing guidance for risk management.
Finally, in this chapter we have attempted to discuss various aspectsof risk management. For various approaches to risk management, one ofthe assumptions is the existence of systemic risk and non-systemic risk.Investors diversify across multiple assets to reduce non-systemic risk, butsystemic risk (i.e., the exposure to certain common risk factors) cannotbe removed. One of the reasons for multiple assets is that not every assethas the same sensitivity to the same risk factors. Risks in various marketenvironments can be managed by adjusting portfolio holdings to the variousexpected states of the world. But what happens if all the states of the worldgo to one—the advantages of asset diversification vanish. This is simplythe truth of the matter. There is a substantial body of research regardingthe causes of such risks. Yet researching and identifying causes such asmarket concentration, liquidity, and leverage cannot provide escape fromthe inevitable: It is virtually impossible to steel a portfolio against systemicrisks. Hence, the need and requirement for discretion and flexibility inportfolio risk management.
WHAT EVERY INVESTOR SHOULD KNOW
Oxymoron is often viewed as a contradiction in terms. In truth, a betterchoice of subtitle for this chapter would have been OXI-moron (OXI isthe Greek word for ‘‘No’’). The idea that an investor can honestly andcompletely manage risk is a level of hubris that no one should approach.In this chapter, we attempted to provide a brief history of the developmentof risk management and discuss some of the current approaches. The veryfact that we are constantly changing how we approach risk managementshould leave every investor with the understanding that there is risk in riskmanagement.
■ Risk Management Is an Approximation: Risk is almost impossible todefine and is surely impossible to measure completely. It is simplytoo multidimensional in nature. Moreover, given the multidimensional
280 POSTMODERN INVESTMENT
nature of the investing public (i.e., individual versus institutional, privateversus public), it is impossible to come up with a single one-size-fits-allasset allocation model. For every investor, the question really is howmuch risk do you want in your risk-management system? What is thetime frame in which you are willing to hold that risk? What risks doyou really want managed (e.g., standard deviation or shortfall risk)?There is simply no single all-inclusive risk-management system. Certainsystems are fit for one type of investment (e.g., liquid equity) but not forothers (e.g., portfolios of tradable and nontradable assets). We gener-ally advise following risk-management systems that provide actionableresults.
■ Beware of Model Risk: The problem remains that if asset allocationis the primary means by which investors attempt to reach the highestexpected return at the lowest level of risk, then investors are simplyexposed to too much risk from many of the more simplified methodsof asset allocation. Most current asset allocation models use long-term return, historical volatility, and correlation when attempting toevaluate potential return and risk alternatives. The shortcomings of suchmodels in current global markets in which the dynamics of technology,regulation, and economics make historic data of little use and requirea more dynamic means of tracking changing risk relationships, isobvious. Finally, beware of accepting the common approach. Bondratings remain a primary way for individuals to assess bond risk, eventhough we know the shortcomings of the ratings. In today’s world,VaR remains one of the primary approaches to measure exposure toloss, but we also know its dramatic limitations. There is risk in any riskmodel—ask your advisor what they are and how he or she hopes tomanage it.
■ Beware of Simple Solutions to Hard Problems: Within the past year,various firms have offered relatively simple solutions to managingportfolio risk. These methods include volatility targeting, minimumvariance portfolios, and risk-based investment vehicles. They often offerhistorical evidence of the benefits they offered in periods of crisis. Ofcourse they do; who would ever offer a new product that did not showevidence of solving a past problem (known as backfitting the model)?A typical example is a portfolio that uses historical low correlationsbetween assets to create a low volatility portfolio that becomes a highvolatility portfolio in periods of market stress when correlations go to 1.It sounded so simple to the investor; the risk-management guaranteedreturn seemed so enticing. Simple products that offer seemingly simpleanswers are generally too good to be true. No free lunch here. As forany product, know the cost of the insurance.
Risk Management 281
MYTHS AND MISCONCEPTIONS OF RISK MANAGEMENT
Recent market performance, which found many investors faced with largelosses across a range of investment vehicles, has drawn into question manyof the most strongly held beliefs about the benefits of a range of risk-management products and approaches. The financial disturbances of 2007and 2008 have forced the discipline of asset allocation, and those whoprofess to practice it, to enter into this new reality phase. This is a difficultendeavor because it may very well be that mistakes were made that, onreflection, could have been prevented. The issue remains to what degreewas the failure of many risk-management tools caused primarily by mythsand/or misconceptions as to their use and supposed benefits.
Myth 9.1: Risk Can Be Quantified
Eighty years ago, Frank Knight attempted to distinguish risk from uncer-tainty. For Knight, risk meant the probability of an event that could beestimated and quantified. At the other extreme was the concept of uncer-tainty under which the probability of an outcome could not be estimated. Inthis case, one generally talked in generalities, such as: this could happen ormight happen or is expected to happen. One reason for the failure of manyrisk- (i.e., probability) based models of risk management is that perhaps riskcannot be quantified in that fashion. Perhaps, the best we can do is to saysomething is most likely to happen or most likely to fail. Unfortunately, theuse of the concept of uncertainty leaves many risk-management decisionsin the eye of the beholder and not in the actual probability of the eventsucceeding or failing. However, investors must be aware that many modelsare based on the concept of risk (probability based on a set of accepteddata), not because it is right, only that risk models have difficulty if basedon the eye of the beholder.
Myth 9.2: Futures Contracts Provide Risk Controlthrough Their Ability to Forecast the Future
Often individuals think of futures contracts as potential risk-control vehicles,since they maintain that futures forecast future prices. In fact, many futurescontracts may be useful risk-control vehicles, not because they forecast thefuture (in many cases they do not), but because they track the return of thecurrent cash price. Most futures contract prices are based on a cash-to-carrymodel in which the change in futures prices often reflect the change in thecurrent spot price. If the cash price changes, the futures price changes. It isnot necessarily the other way around.
282 POSTMODERN INVESTMENT
Myth 9.3: Simple Measures of Risk Measurement Work
In this book we have discussed various simple measures of security riskestimation. Each of them, such as Sharpe ratio and implied volatility, hasits own inherent problems. One measure that remains in common use tomeasure equity risk is a security’s beta. However, beta, by itself, is not ameasure of a security’s total risk (i.e., variance) or even its systemic risk.In addition it may not even indicate how two securities move together. Anasset can have a high correlation with another asset but a low beta simplyif its standard deviation is low, or an asset can have a low correlation withanother asset but a high beta if its relative standard deviation is high. Inshort, beta does not equal correlation.
Myth 9.4: Risk Minimization Ensures Reduced Risk
Just as the promise of returns attracts certain investors, the promise of riskminimization also attracts a set of investors. The problem is, of course, thatrisk reduction has its costs. Some of those costs are explicit (e.g., limitedupside gain for downside protection), others of them are less transparent(e.g., the use of target funds with a specific glide path that may result inan investor holding bonds just when they are the riskiest). Investors shouldknow that (1) seemingly cheap risk-management programs would not beexpected to produce risk-free solutions and (2) seemingly riskless solutionsby definition should be expensive. For example, current risk targeted fundshave their place, but remember it is only a risk target.
Myth 9.5: Masters of Risk Assessment Exist
Like the wizard in The Wizard of Oz, most risk-management wizards aregood people, not necessarily good wizards. While most investors have cometo accept the fact that superior outperforming investment managers generallydo not exist, somehow we continue to believe that there exists someone,somewhere, who somehow has come up with a foolproof method to measureand manage investment risk. The problem is if they focus on algorithmicsolutions, those approaches are subject to model error (e.g., the use ofthe copula model of correlation, which led to individuals misrepresentingthe risks of various tranches of collateralized debt obligation [CDO] ofmortgage-backed securities, etc.). If you believe in discretionary approachesto override algorithmic models, you are faced with the problem that peoplemake mistakes. In May of 2012 JPMorgan Chase, announced that one of itstrading divisions lost a minimum of USD 2 billion while trading syntheticcredit products. Senior management of the bank described this loss as an‘‘egregious’’ failure of its risk management policies.
Risk Management 283
Myth 9.6: Regulation Reduces Risk
Regulation is often presented as a part of the risk-management process.Since regulation comes with a cost, it is often assumed that it must alsocome with a matched benefit. Examples of regulation directly aimed atmanaging risk are the Basel Accord recommendation of VaR and theDodd-Frank rules on speculative limits. While government regulations havetheir anticipated benefits, they may also have secondary effects that mayoverwhelm the anticipated benefits. The use of VaR may force certain banksto reduce certain types of loan and trading activities beneficial to economicgrowth. Restrictions on speculation or a one-size-fits-all definition mayreduce liquidity of futures markets and increase the cost of hedging for truehedgers. In short, regulations may reduce one risk while increasing others.
Myth 9.7: We Know How to Measure Systemic Risk
Whenever we hear that there is a set of measures that provides answersto the current level of systemic risk, we are reminded of The Black Swan:The Impact of the Highly Improbable written by Nassim Nicholas Taleb,or the classic statement: ‘‘We know what we know, we know what we donot know, we do not know what we do not know.’’ Personally, we favorthe statement: ‘‘We monitor what we measure.’’ There are constantly newsuggestions as to methods of testing market liquidity and transparency, butby its very nature, systemic risk cannot be controlled or it would not besystemic risk.
Myth 9.8: The Most Important Investor Risk Is Financial
As discussed in the preceding myth, we manage what we measure; however,financial risk is only one part of an investor’s overall asset portfolio risk.The average person’s total asset wealth, real estate, and private equity(i.e., a person’s job), often add up to over 75 percent of total wealth(e.g., house, current discounted value of job, etc.). Equally important, thecorrelation between an investor’s house, job, and the rest of his or herfinancial portfolio could be relatively high. When the plant closes, the housefalls in value, equity in the IRA drops, and his or her job is on the line.We have not even added the liability stream into the picture. To sum it up,everyone’s investment model should be a liability-driven model of asset riskmanagement. But that is a book for a different time.


CHAPTER 10In Conclusion
Throughout this book, we have consciously made no distinction betweenindividuals and institutions when using the term investor. We saw no need
to make a distinction since they confront the same issues and challengesas they navigate differing investment opportunities and associated risks.Furthermore, while at times we are seemingly harsh on managers and theirinstitutions, we are reminded that this is a harsh business. It is a businesswhere retirements, basic comforts of life, and careers are at stake. It isalso a business where people are paid vast sums of money to producevery specific results. These vast sums also have, at times, the ability tocompromise moral and intellectual compasses. We have no doubt thatinvestment banks were not designed simply to relieve investors of theirmoney. These institutions play a valuable role in the efficient movementand disbursement of monies and the building of opportunities. Similarly,there is no doubt that the vast majority of people in the investment andmoney management industry are just trying to do their jobs on a day-to-day basis. However, like all industries as large and complex as this, thelevel of competence, service, and expertise is at best uneven. At times, thelack of competence is forgivable, if not understandable. Far too often inthe recent past, it has not been. The Financial Crisis Inquiry Commission(FCIC), a United States government commission tasked with the goal ofinvestigating the causes of the 2007–2010 financial crisis, concluded in itsJanuary 2011 final report that dramatic failures in corporate governance andrisk management, excessive household borrowing, systemic breakdowns inaccountability and ethics, failure of financial regulation and supervision,and failure of rating agencies to properly inform, all contributed to thefinancial collapse. In short, a collective euphoria of unchecked greed andthe suspension of well-tested norms created a contagion of doubt that ledto the destabilization of the global economy.
285
286 POSTMODERN INVESTMENT
The people in the United States who designed and wrote the securitieslaws of 1933 and 1934 pretty much followed the lead of their predecessorswho wrote the U.S. Constitution. In each case, there was an unflattering butaccurate view of human nature. They knew that if given the opportunity,most of us would try to get something for nothing. They also knew thatpeople would gladly trade off long-term security for immediate gains. Asa consequence, both designed systems of checks and balances meant totemper the desire for immediate gratification and to force introspection. Inthe case of financial regulatory oversight, the drafters of those laws andregulations assumed that information transparency and the elimination ofinsider self-dealing would ensure a level playing field and thus efficientand unbiased markets. Generally, given the monetary and penal sanctionssurrounding violations of basic securities laws, the system worked and stillworks. The model breaks down, both for the institutional and individualinvestor, where a sense of restraint and responsibility is lost, and whereincentives are not properly aligned. Institutions and their professionals areresponsible for providing clients with transparent investable programs thattell investors when they will most likely make money and when they willmost likely lose money. Investors, conversely, have to view these productofferings with skepticism. The regulators can neither change human naturenor save us from ourselves.
The greatest threat to an investor’s wealth and to the financial systemas a whole is not overt fraud. Ponzi, Madoff, and Stanford, in some formor another, will always exist and the effect of their schemes on the overallmarket will always be de minimis. The greatest threat is average peoplewho work in a model of entitlement and have no idea of how very fragilethe balance between dynamic capitalism and personal security truly is. Atthe writing of this book, it has become clear that one of the key globalbenchmarks—LIBOR—that affects the price of over USD 350 trillion ofconsumer and business borrowings—has been manipulated by a consortiumof traders in the employ of varying international banks. One result of thismanipulation was to present a positive but false picture of each bank’s abilityto borrow in an uncertain lending environment and to increase the traders’bonus pools. The more consequential result has been the introduction ofadditional uncertainty and suspicion into global capital markets by makingborrowers question whether they are paying fair interest rates on homes,automobiles, credit cards and business loans.
Embedded in this affair is whether and to what extent each bank’ssenior management was involved in the scheme and whether the schemewas tacitly blessed by key governmental oversight authorities. Given thecomplexity of the issues, it will take years to fully unravel and begin tounderstand the design and impact of this fraud. Yet, even in its infancy
In Conclusion 287
there is a constant. Perhaps the most unsettling aspect of this scandal is howfamiliar it has all become—the subprime mortgage fraud, the J.P. Morganhedging mess and the all but constant insider trading indictments appear tobe more the norm than the exception. Moreover, regulators as well as theirpolitical overlords seem intent upon proving themselves at best indifferentand at worse ineffective in managing the infrastructure of global economies.It is all kind of human, pathetic and sad.
Over the years, both investors and those who would serve them havecome to expect outsized gains and great lifestyles without the risk of failure.This very real sense of entitlement and expectation leads to a reliance onwhat we want to hear rather than what is plausible. In a meeting with seniorofficials at the Securities Investor Protection Corporation (SIPC), a U.S.agency tasked with protecting investor assets in the event of a brokeragefirm’s failure, we learned that even after the events of 2007 and 2008,investors still rely on historical and hypothetical returns when makinginvestment decisions; they are genuinely surprised when these returns donot pan out, and the values of their holdings are substantially less thananticipated.
A central thesis of this book is that investors must be aware of therisks involved in modern asset management, including the simple fact thatthey work without all the facts. Within each chapter, we sought to explainboth the history and the effect of selected asset classes on the market andon investors’ ability to appreciate their contribution to their portfolio. Westarted with a brief overview of the financial markets and their evolution.We traced the development of the central features of financial models.We noted the strengths and weaknesses of these models, and the fact thatsome have become the bases for even more complex investment productsand risk and return solutions. While acknowledging the value of someof these approaches, we cautioned the reader to understand that financialmodels have underlying assumptions and thus limitations, and that whenthe limitations are exceeded, the model simply fails. We then examinedthe traditional equity and fixed-income markets, recognizing that for mostinvestors, the investment world around them is dominated by two assetclasses: stocks and bonds. The reasons for their dominance are many, thefirst being their fundamental sources of risk (e.g., price change) and return(e.g., firm earnings: fixed income gets them first, and the residual goes tothe equity owner). They are generally the easiest to trade, the most liquid,and the most transparent; even more importantly, they often differ in theirsensitivity to changes in economic factors. For many investors, stocks andbonds make a perfect pair, and since they have been married for such a longtime, there is a long history of how they act together.
288 POSTMODERN INVESTMENT
From the expansion of models, and to investments beyond the tradi-tional, we examined the unique aspects of certain alternative investments.Our analysis of hedge funds, private equity, managed futures, commodities,and various forms of real estate led us to the conclusion that the perfor-mances of these asset classes are determined by the business models used toprovide investable opportunities. The cost of capital, accounting methods,and infrastructure costs all are a part of an investor’s ultimate return. Wealso noted the limitations of some alternative indices, reminding the readerthat indices are, in fact, the product of businesses and have embeddedand explicit biases. Within this analysis, we also touched on the fact thatgovernmental regulations play a key role in returns. Tax policy, lendingconstraints, and fiduciary mandates all contribute to the growth and typeof transparency required for certain markets to grow, and these regulatorymandates also contribute to the failure of some products. We also reviewedthe role of professionals and institutions in providing advice. Overall, ourmessage to the reader has been to be wary and cautious.
Finally, we return to where we began. We have a simple story. Asauthors, we are torn between the simple, easy-to-act-on, yet incorrectanswer, and the more complex, costly, often-misunderstood, and, in theauthors’ view, correct one. If truth comes at a price, it ought to be anexpensive one. Much of the financial community believes that it offersinvestors investment product, asset allocation, or risk management basedon the perceived needs of the client and the expressed demands of the client;and, within their ability to provide products and services that fulfill theseneeds within the context of a given firm’s overall business operation andregulatory oversight. Within this genuine belief system, mistakes happen.Critical points are misunderstood. Wealth is lost. Some believe that thefinancial industry is to blame and that it did not protect the investors. Whileconvenient, there is a strong argument that the onus of protection extendsbeyond these institutions and to the investor.
George Orwell has often been quoted as saying, ‘‘We sleep soundly inour beds because rough men stand ready in the night to visit violence onthose who would do us harm.’’ Perhaps, just perhaps, it is the investor whomust stand ready.

Notes
CHAPTER 11. Credit should go to a group of academics and practitioners, including Jack
Treynor, John Lintner, and Jan Mossin, for developing this CAPM relationship.E(Ri) = Rf + [E(Rm) − Rf ]β i, where βi = Corr(Ri, Rm) × σi
σm, Rf = return on the
riskless asset; E(Rm) and E(Ri) = expected returns on the market portfolio anda security, σm and σ i = standard deviations of the market portfolio and thesecurity, and Corr(Ri,Rm) = correlation between the market portfolio and thesecurity. The βi is often determined using what is called the market model, whichis derived from measuring the systematic relationship between the return onsecurity E(Ri) and the market portfolio E(Rm):E(Rm) = alpha + β i * E(Rm).
2. Standard & Poor’s Indices Versus Active (SPIVA) Scorecard, 2011http://www.standardandpoors.com/indices/spiva/en/us.
3. ‘‘Poking Holes in a Theory on Markets,’’ New York Times, June 2009.4. R. Ball, ‘‘The Global Financial Crisis and the Efficient Market Hypothesis: What
Have We Learned?’’ Journal of Applied Corporate Finance 21, no. 4 (Fall 2009):8–16.
CHAPTER 2
1. J. A. Boquist, G. A. Racette, and G. G. Schlarbaum, The Journal of Finance 30,no. 5 (December 1975): 1360–65.
2. T. Schneeweis and C. Schweser, ‘‘A Note on the Usefulness of Bond Ratingsas Measures of Systematic Risk,’’ Nebraska Journal of Economics and Business(Winter 1980): 62–71.
3. For example, during this period there was an increase in the sale of junk bonds,which while they had high coupons, may have had lower duration than similarmaturity high-rated bonds.
4. W. F. Sharpe, Investors and Markets: Portfolio Choices, Asset Prices, andInvestment Advice, Princeton Lectures in Finance (Princeton, NJ: PrincetonUniversity Press, 2007), 185–212.
5. Z. Bodie, A. Kane, and A. J. Marcus, Investments, 9th ed. (New York:Irwin/McGraw-Hill, 2010 356–368.
CHAPTER 31. In fact, research (Schneeweis 2012b) has shown that for the period 2001–2011,
the average standard deviation (20.4 percent) of equity long/short hedge fundswith full data for the period (from the Morningstar database) was less than the
289

290 NOTES
average standard deviation (27.8 percent) of the stocks in the Dow Jones 30Industrial Average.
2. T. Schneeweis, H. Kazemi, and G. Martin, ‘‘Understanding Hedge Fund Perfor-mance: Research Issues Revisited—Part I,’’ The Journal of Alternative Invest-ments 5 (2002): 6–22.
3. For example, as reported in Schneeweis (2012b), the average correlation betweenthe reporting equity long/short (ELS) hedge-fund managers (reporting to theMorningstar database and with full data for the period 2001–2011) was 0.70.This may be regarded as high, but the average correlation had a standarddeviation of 0.12. Similarly, the average standard deviation of the ELS managerswas 20.4 percent, considerably above that of the CISDM ELS index (6.3 percent)for the period, and the average standard deviation was 8.3 percent, indicating awide range of reported volatility for the individual managers.
4. For discussions of various hedge fund indices see Kat and Brooks (2001), Amencand Martellini (2002), and Schneeweis (2012b).
CHAPTER 4
1. J. Lintner, ‘‘The Potential Role of Managed Commodity-Financial FuturesAccounts (and/or Funds) in Portfolios of Stocks and Bonds.’’ Presented at theAnnual Conference of the Financial Analysts Federation, Toronto, Canada,May 1983.
2. D. Chance, Managed Futures and Their Role in Investment Portfolios (Char-lottesville, VA: Research Foundation of the Institute of Chartered FinancialAnalysts, 1991); T. Schneeweis, R. Spurgin, and D. McCarthy, ‘‘Investment inCTAs: An Alternative Managed Futures Investment,’’ Journal of Derivatives 3,no. 4 (Summer, 1996): 36–47.
3. P. Gogoi, ‘‘Futures Are Now,’’ BusinessWeek, March 19, 2001.4. T. Schneeweis, The Benefits of Managed Futures (INGARM, 2012c). www
.ingarm.org/public/benefits5. In fact, research (Schneeweis 2012c) has shown that for the period 2001–2011,
the average standard deviation (19.6 percent) of systematic CTAs with fulldata for the period (from the Morningstar database) was less than the averagestandard deviation (27.8 percent) of the stocks in the Dow Jones 30 IndustrialAverage. http://www.ingarm.org/public/benefits
6. R. Spurgin, ‘‘A Benchmark for Commodity Trading Advisor Performance,’’ TheJournal of Alternative Investments 2, no. 1 (Summer 1999): 11–21.
7. For example, as reported in Schneeweis (2012c), the average correlation betweenthe reporting systematic CTA (reporting to the Morningstar database and withfull data for the period 2001–2011) was 0.60. This may be regarded as high, butthe average correlation had a standard deviation of 0.25. Similarly the averagestandard deviation of the CTA managers was 19.64 percent, considerably abovethat of the CISDM systematic CTA index (9.73 percent) for the period. Theaverage standard deviation was 9.73 percent indicating a wide range of reportedvolatility for the individual managers.

Notes 291
8. Note that the period before the data inception of a CTA may contain survivor-ship and backfill bias. For example, if a CTA started in 2002, returns pre 2002would contain backfill bias and survivorship bias.
9. K. Black, D. Chambers, and H. Kazemi., eds., ‘‘Risk and Performance Analysisin Managed Futures Strategies,’’ in CAIA Level II: Advanced Core Topics inAlternative Investments, 2nd ed. CAIA Knowledge Series. Hoboken, NJ: JohnWiley & Sons, 2012, Chapter 31.
10. For a discussion of CTA and CPO performance see Thomas Schneeweis, RajGupta and, Jason Remillar (2011), Geetesh Bhardwaj, Gary B. Gorton andK. Geert Rouwenhorst (2008) and Schneeweis (2012c).
11. See Schneeweis (2012c) and Burghardt and Walls (2011).12. See Greg N. Gregoriou and Joe Zhu (2005), Schneeweis (2012c), and Burghardt
and Walls (2011).13. See Black, Chambers, and Kazemi (2012); Schneeweis (2012c); and Spurgin
(1998).14. See George Comer (2006) and Schneeweis (2012b).15. T. Schneeweis, R. Spurgin, and E. Szado, ‘‘Managed Futures Research: A
Composite CTA Performance Review,’’ Journal of Alternative Investments(forthcoming, 2012). W. Fung and D. A. Hsieh, ‘‘Empirical Characteristics ofDynamic Trading Strategies: The Case of Hedge Funds,’’ Review of FinancialStudies, 10 (1997): 275–302; W. Fung and D. A. Hsieh, ‘‘Asset-Based StyleFactors for Hedge Funds,’’ Financial Analyst Journal (September/October 2002);W. Fung, and D. A. Hsieh, ‘‘Hedge Funds: An Industry in Its Adolescence,’’Federal Reserve Bank of Atlanta (Fourth Quarter, 2006).
CHAPTER 5
1. Schneeweis, Crowder, and Kazemi (2011) and Anson et al. (2012).
CHAPTER 6
1. Investors are directed to organizations such as the European Private Equityand Venture Capital Association for detailed discussion of best practices inperformance reporting of PE investments. Whatever the standards, investorsshould realize that fair value accounting, in which the underlying estimate valuetracks actual market value at sale, is still in a process of evolution.
2. This PE index is based on monthly returns from the S&P PE Index (December2003 onward). For the period prior to December 2003, firms that were listed inthe June 2007 report were used to create an equal-weighted monthly returns PEindex back to 1991. Other research has shown a high correlation between thisconstructed index and other PE indices (e.g., CA), which are based on nonpublicreported PE nonmarket-based returns published quarterly.
3. T. Schneeweis, The Benefits of Private Equity, INGARM, 2012e. www.ingarm.org/public/benefits

292 NOTES
CHAPTER 71. D. Ling and A. Naranjo, ‘‘Economic Risk Factors and Commercial Real
Estate Returns,’’ Journal of Real Estate Finance and Economics 14 (1997):283–307.
2. M. Hoesli, J. Lekander, and W. Witkiewicz, ‘‘Real Estate in the InstitutionalPortfolio: A Comparison of Suggested and Actual Weights,’’ The Journal ofAlternative Investments 6 (2003): 53–59; M. Hoesli and J. Lekander, ‘‘SuggestedVersus Actual Institutional Allocations to Real Estate in Europe: A Matter ofSize?’’ The Journal of Alternative Investments 8 (2005): 62–70.
3. E. Glaeser and J. G. Gyourko, ‘‘The Impact of Zoning on Housing Afford-ability,’’ Economic Policy Review. Federal Reserve Bank New York 9, no. 2,21–39.
4. G. Turnbull, ‘‘The Investment Incentive Effects of Land Use Regulations,’’Journal of Real Estate Finance and Economics 31 (2005): 357–77.
5. R. Herring and S. Wachter, ‘‘Real Estate Booms and Banking Busts: An Inter-national Perspective’’ (Working Paper No. 99–27, University of Pennsylvania,The Wharton School, 1999); R. Herring and S. Wachter, ‘‘Bubbles in RealEstate Markets’’ (Presented at the Federal Reserve Bank of Chicago and WorldBank Group’s Conference, ‘‘Asset Price Bubbles: Implications for Monetary,Regulatory and International Policies,’’ 2003).
6. R. Shiller, ‘‘Understanding Recent Trends in Housing Prices and Home Owner-ship’’ (NBER Working Paper 13553, 2007).
7. D. Genovese and C. Mayer, ‘‘Loss Aversion and Seller Behaviour: Evidencefrom the Housing Market’’ (CEPR Discussion Paper No. 2813, 2001).
8. A. R. Mian and A. Sufi, ‘‘The Consequences of Mortgage Credit Expan-sion: Evidence from the 2007 Mortgage Default Crisis,’’ January 1, 2010,http://ssrn.com/abstract=1072304.
9. Y. Demyanyk and O. van Hemert, ‘‘Understanding the Subprime Mortgage Cri-sis’’ (Working paper, last modified June 20, 2009), doi:102139/ssrn.1020396.
10. Hoesli et al., ‘‘Real Estate in the Institutional Portfolio,’’ 53–59; Hoesli andLekander, ‘‘Suggested Versus Actual Institutional Allocations to Real Estate inEurope,’’ 62–70.
CHAPTER 81. Sharpe, Investors and Markets, 4.2. Ibid.3. See T. Schneeweis, Benefits of Commodity Investments (INGARM, 2012a); T.
Schneeweis, The Benefits of Hedge Funds (INGARM, 2012b); T. Schneeweis,The Benefits of Managed Futures (INGARM, 2012c); T. Schneeweis, Benefits ofReal Estate (INGARM, 2012d), and T. Schneeweis, Benefits of Private Equity(INGARM, 2012e), www.ingarm.org/public/benefits.
4. Each of the index components is readily investable, and there are multipleinvestment alternatives that closely reflect the performance of these indices.

Notes 293
CHAPTER 91. P. Jorion, Financial Risk Managers Handbook, 6th. ed. (Hoboken, NJ: John Wiley
& Sons, 2003); P. Jorion, Value at Risk: The New Benchmark for ManagingFinancial Risk, 3rd. ed. (Hoboken, NJ: John Wiley & Sons, 2006).
2. For readers interested in the methodology for these exhibits, see H. Kazemi,T. Schneeweis, and E. Szado, ‘‘Issues in Hedge Fund Analysis: What A Dif-ference a Day, Week, Month Makes,’’ Alternative Investment Analyst Review(forthcoming, 2013).


Bibliography
Anson, Mark J. P., Donald R. Chambers, Keith H. Black, and Hossein Kazemi.CAIA Level I: An Introduction to Core Topics in Alternative Investments, 2nded. CAIA Knowledge Series. Hoboken, NJ: John Wiley & Sons, 2012.
Bhardwaj, Geetesh, Gary B. Gorton, and K. Geert Rouwenhorst. ‘‘Fooling Someof the People All of the Time: The Inefficient Performance and Persistence ofCommodity Trading Advisors.’’ NBER Working Paper No. 14424, October2008, http://www.nber.org/papers/w14424.
Black, Keith H., Donald R. Chambers, and Hossein Kazemi, eds. CAIA Level II:Advanced Core Topics in Alternative Investments, 2nd ed. CAIA KnowledgeSeries. Hoboken, NJ: John Wiley & Sons, 2012.
Bodie, Zvi, Alex Kane, and Alan J. Marcus. Investments, 9th ed. New York:Irwin/McGraw-Hill, 2010.
Brueggeman, William, and Jeffrey Fisher. Real Estate Finance and Investments. NewYork: Irwin/McGraw-Hill, 2010.
Burghardt, Galen, and Brian Walls. Managed Futures for Institutional Investors:Analysis and Portfolio Construction. Bloomberg Financial. Hoboken, NJ: JohnWiley & Sons, 2011.
Christoffersen, Peter. Elements of Financial Risk Management. Waltham, MA:Academic Press, 2003.
Comer, George. ‘‘Hybrid Mutual Funds and Market Timing Performance.’’ TheJournal of Business 79, no. 2 (March 2006): 771–798.
Darst, David. The Art of Asset Allocation. New York: McGraw Hill, 2008.Demaria, Cyril. Introduction to Private Equity. Wiley Finance Series. Hoboken, NJ:
John Wiley & Sons, 2010.Demyanyk, Yuliya S., and Otto van Hemert. ‘‘Understanding the Sub-
prime Mortgage Crisis.’’ Working paper, last modified June 20, 2009.doi:10.2139/ssrn.1020396.
Derman, Emanuel. Models. Behaving. Badly: Why Confusing Illusion with RealityCan Lead to Disaster, on Wall Street and in Life. New York: Free Press, 2011.
Dhar, Ravi, and William N. Goetzmann. ‘‘Institutional Perspectives on Real EstateInvesting: The Role of Risk and Uncertainty.’’ Yale ICF Working PaperNo. 05–20, June 2005, http://ssrn.com/abstract=739644.
Dunsby, Adam, John Eckstein, Jess Gaspar, and Sarah Mulholland. CommodityInvesting. Hoboken, NJ: John Wiley & Sons, 2008.
Fabozzi, Frank J., Roland Fuss, and Dieter G. Kaiser, eds. The Handbook ofCommodity Investing. Frank J. Fabozzi Series. Hoboken, NJ: John Wiley &Sons, 2008.
295

296 BIBLIOGRAPHY
Fabozzi, F. J., and Steven V. Mann. The Handbook of Fixed Income Securities, 8thed. New York: McGraw-Hill, 2011.
Friedman, Jack P., Jack C. Harris, and J. Bruce Lindeman. Dictionary of Real EstateTerms. Barron’s Business Guides. Hauppauge, NY: Barron’s Educational Series,2008.
Geltner, David. ‘‘Benchmarking Manager Performance within the Private Real EstateInvestment Industry.’’ Real Estate Finance 17, no. 1 (2000): 23–34.
Geltner, D., and David Ling. ‘‘Ideal Research and Benchmark Indexes in PrivateReal Estate: Some Conclusions from the REPI/PREA Technical Report.’’ RealEstate Finance 17, no. 4 (2001): 17–28.
Geltner, D., Bryan D. MacGregor, and Gregory M. Schwann. ‘‘Appraisal Smoothingand Price Discovery in Real Estate Markets.’’ Urban Studies 40, no. 5–6 (2003):1047–1064.
Geltner, David M., Norman G. Miller, Jim Clayton, and Piet Eichholtz. CommercialReal Estate Analysis and Investments. Cincinnati, OH: South-Western, 2006.
Geman, Helyette, ed. Risk Management in Commodity Markets. Hoboken, NJ: JohnWiley & Sons, 2008.
Gregoriou, Greg N., and Joe Zhu. Evaluating Hedge Fund and CTA Performance:Data Envelopment Analysis Approach. Hoboken, NJ: John Wiley & Sons,2005.
Harris, Robert, Tim Jenkinson, and Steven N. Kaplan. ‘‘Private Equity Performance:What Do We Know?’’ Fama-Miller Working Paper; Chicago Booth ResearchPaper No. 11–44; Darden Business School Working Paper No. 1932316.doi:10.2139/ssrn.1932316.
Jorion, Philippe. Financial Risk Managers Handbook, 6th ed. Hoboken, NJ: JohnWiley & Sons, 2012.
. Value at Risk: The New Benchmark for Managing Financial Risk, 3rd ed.New York: McGraw-Hill, 2006.
Kazemi, Hossein, Thomas Schneeweis, and Edward Szado. ‘‘Issues in Hedge FundAnalysis: What a Difference a Day, Week, Month Makes.’’ Alternative Invest-ment Analyst Review (forthcoming, 2013).
Kritzman, Mark, Yuanzhen Li, Sebastien Page, and Roberto Rigobon. ‘‘PrincipalComponents as Measure of Systemic Risk.’’ Journal of Portfolio Management37, no. 4 (Summer 2011): 112–126.
Lerner, Josh, Felda Hardymon, and Ann Leamon. Venture Capital and PrivateEquity: A Casebook. Hoboken, NJ: John Wiley & Sons, 2012.
Lerner, Josh, Ann Leamon, Felda Hardymon. Venture Capital, Private Equity, andthe Financing of Entrepreneurship. Hoboken, NJ: John Wiley & Sons, 2012.
Lo, Andrew. Hedge Funds: An Analytic Perspective. Princeton, NJ: PrincetonUniversity Press, 2010.
Lo, Andrew. ‘‘Reading about the Financial Crisis: A 21 Book Review.’’ Journal ofEconomic Leadership (forthcoming).
Lo, Andrew W., and A. Craig MacKinlay. A Non-Random Walk Down Wall Street.Princeton, NJ: Princeton University Press, 1999.
Malkiel, Burton. A Random Walk Down Wall Street, rev. ed. New York: W. W.Norton, 2012.

Bibliography 297
Schneeweis, Thomas, Raj Gupta, and Jason Remillard, ‘‘CTA/Managed FuturesStrategy Benchmarks: Performance and Review.’’ In The Handbook of Com-modity Investing, edited by F. J. Fabozzi, R. Fuss, and D. G. Kaiser, Chapter 11.Hoboken, NJ: John Wiley & sons, 2008.
Schneeweis, Thomas. Benefits of Commodity Investments. INGARM, 2012a.Schneeweis, Thomas. The Benefits of Hedge Funds. INGARM, 2012b.Schneeweis, Thomas. The Benefits of Managed Futures. INGARM, 2012c.Schneeweis, Thomas. Benefits of Real Estate. INGARM, 2012d.Schneeweis, Thomas. Benefits of Private Equity. INGARM, 2012e.Schneeweis, Thomas, Garry B. Crowder, and Hossein Kazemi. The New Science
of Asset Allocation: Risk Management in a Multi-Asset World. Hoboken, NJ:John Wiley & Sons, 2011.
Sharpe, William F. Investors and Markets: Portfolio Choices, Asset Prices, andInvestment Advice. Princeton Lectures in Finance. Princeton, NJ: PrincetonUniversity Press, 2007.
Swensen, David. Pioneering Portfolio Management. New York: Free Press, 2009.

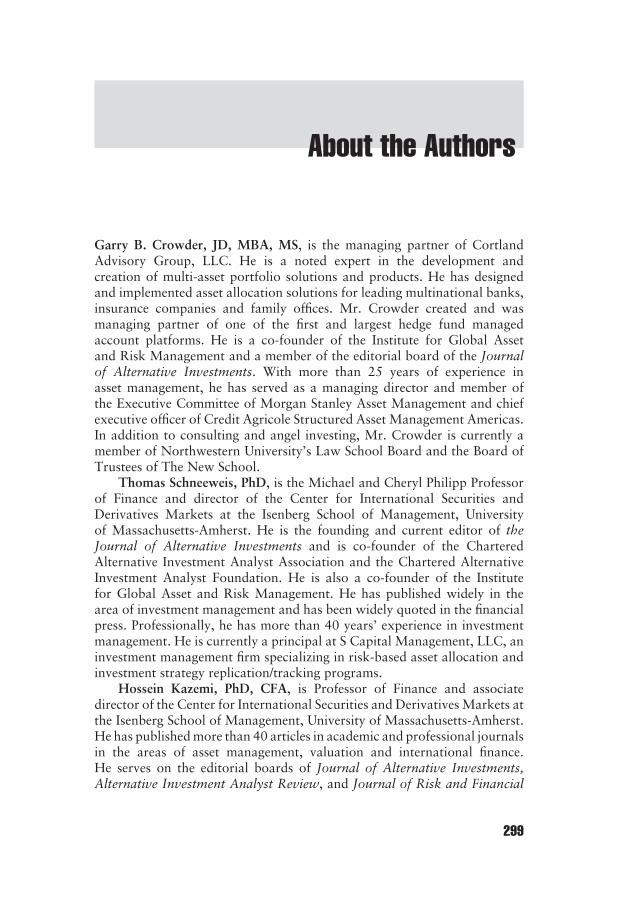
About the Authors
Garry B. Crowder, JD, MBA, MS, is the managing partner of CortlandAdvisory Group, LLC. He is a noted expert in the development andcreation of multi-asset portfolio solutions and products. He has designedand implemented asset allocation solutions for leading multinational banks,insurance companies and family offices. Mr. Crowder created and wasmanaging partner of one of the first and largest hedge fund managedaccount platforms. He is a co-founder of the Institute for Global Assetand Risk Management and a member of the editorial board of the Journalof Alternative Investments. With more than 25 years of experience inasset management, he has served as a managing director and member ofthe Executive Committee of Morgan Stanley Asset Management and chiefexecutive officer of Credit Agricole Structured Asset Management Americas.In addition to consulting and angel investing, Mr. Crowder is currently amember of Northwestern University’s Law School Board and the Board ofTrustees of The New School.
Thomas Schneeweis, PhD, is the Michael and Cheryl Philipp Professorof Finance and director of the Center for International Securities andDerivatives Markets at the Isenberg School of Management, Universityof Massachusetts-Amherst. He is the founding and current editor of theJournal of Alternative Investments and is co-founder of the CharteredAlternative Investment Analyst Association and the Chartered AlternativeInvestment Analyst Foundation. He is also a co-founder of the Institutefor Global Asset and Risk Management. He has published widely in thearea of investment management and has been widely quoted in the financialpress. Professionally, he has more than 40 years’ experience in investmentmanagement. He is currently a principal at S Capital Management, LLC, aninvestment management firm specializing in risk-based asset allocation andinvestment strategy replication/tracking programs.
Hossein Kazemi, PhD, CFA, is Professor of Finance and associatedirector of the Center for International Securities and Derivatives Markets atthe Isenberg School of Management, University of Massachusetts-Amherst.He has published more than 40 articles in academic and professional journalsin the areas of asset management, valuation and international finance.He serves on the editorial boards of Journal of Alternative Investments,Alternative Investment Analyst Review, and Journal of Risk and Financial
299

300 ABOUT THE AUTHORS
Management. He is a managing director at Chartered Alternative InvestmentAssociation, the only global professional designation covering hedge funds,commodities, private equity, real assets and structured products. He hasmore than 20 years experience in the investment management industry andhas worked with major financial institutions in asset allocation and riskmanagement.

Index
Absolute measures of risk 260Absolute return approach 138Absolute return strategy 72Absolute return vehicles 68, 96–97, 129Absolute returns 96Absolute risks 259Accounting-based PE funds 176Accounting-based returns vs. reported
market returns 188Accredited investors 69Advisor investible indices
exchange traded funds (ETFs) 125–126mutual funds products 125–126passive trackers 125
After fee returns 38AIG Commodity Index 133Algorithmic approaches vs. discretionary
asset allocation 255Algorithmic trading models 107Alpha 11, 12, 73, 95, 256Alpha is alpha 255–256Alpha of portfolio 273Alpha transfer 18Alternative approaches to investing in asset
allocation 246–249Alternative approaches to investing in hedge
fundsexchange traded funds (ETFs) 90–91fund-of-funds investments 89hedge fund trackers 90individual fund investment 87–89investible-hedge fund indices 90mutual funds 90–91
Alternative asset management firms 191Alternative investments 235Alternatives to private equity
about 190–191business-development companies
192–193private equity as public equity 191–192special-purpose acquisition corporations
192
Analysisconvergence and micromarket structure
54–55distributional characteristics 53–54of equity and fixed income 52–55
Angel investors 172Annual fees 191Annual performance
commodities 148–154commodity trading 115–119equity and fixed income 46hedge funds 80–84private equity 181–187real estate investment 216–221
Asset addition, marginal risk of 272Asset allocation models 243, 245–246, 253,
254, 255Asset allocation process steps 237Asset allocation selection models 250Asset allocations 22, 169
about 231–235algorithmic programs 255alternative approaches to investing
246–249in extreme markets 243–246issues in 249–253knowledge requirements 253–254multiple asset allocation approaches
235–237myths and misconceptions of 254–256return and risk attributes 238–243traditional and alternatives 237–238
Asset class performance 288Asset class structure 238Asset classes 21, 22, 38, 238Asset diversification 279Asset gatherers 170, 195Asset illiquidity 263Asset prices 29Asset risk 5, 259Asset risk management 283Asset valuation models 37
301

302 INDEX
Asset volatility 57Automatic inflation hedge 163
Bachelier, Louis 17Backfill bias 122, 162, 267Backfitting 280Backwardation 157–158Balanced portfolio 52Barrons 66Basel Accords 265, 283Behavioral finance 27–28Behavioral science 4Benchmark focused funds 138Benchmark measurements 272–273Benchmark prices 51Benchmark reality 229Benchmark requirements 197Benchmarks 12, 13, 95, 246
establishments of 265manipulation 286
Beta 9, 11, 35, 181, 259, 261, 262, 264,267–268
vs. correlation 273and correlation 282in multifactor framework 268origins of 265
Beta is dead 24–25Biases 88, 122, 288Biofuels 155Black, Fisher 17Black box trading systems 98The Black Swan: The Impact of the Highly
Improbable (Taleb) 283Black swans 177, 209, 267Bond indices 51Bond markets 28–29Bond ratings 31Bubbles 14Business development companies (BDCs) 190Business models 5Business properties 204Business Week 103Business-development companies 192–193
Capital asset pricing model (CAPM) 9–11,12, 16, 24, 27, 37, 231, 261, 272
Capital market line (CML) 9Catastrophe risk 271Center for Research in Security Prices
(CRSP) 274
Change vs. tried and true 250Changing market conditions 265Chartered financial analyst (CFA) 16Checks and balances 286Chicago Board of Options Exchange 20Closed-end funds 105Coinvestment funds 171Collateral return 157Collateralized debt obligations (CDOs) 15,
200, 282Collateralized loan obligations (CLOs) 15Commercial and residential investments
224–226Commercial mortgage back securities
(CMBSs) 205Commercial vs. noncommercial real estate
229–230Commodities
about 133–137annual performance 148–154inflation hedge 156–158investing in 137–138knowledge requirements 162–163performance fact and fiction 142performance in 2008 154–155return and risk characteristics 142–145return and risk sources 140–141styles and benchmarks 139–140
Commodities vs. commodity stocks 165Commodity ETF 138Commodity futures advisors (CFAs) 101Commodity index
annual performance 154return in extreme markets 146–148
Commodity indices 133, 135, 139Commodity indices vs. equity indices 165Commodity investment
commodities vs. commodity stocks 165commodity indices vs. equity indices 165direct vs. equity based 158–159distributional characteristics 160–161equity based mutual funds vs. exchange
traded funds (ETFs) 159–160governance and micromarket structure
161green commodity 155–156issues in 160–162myths and misconceptions of 163–166natural diversifier to traditional asset 164one index like another 164private 137–138

Index 303
public 138special issues in 155–156speculation 166other issues 161
Commodity pool operators (CPOs) 104Commodity producers 137Commodity risk 262Commodity trading
annual performance 115–119in extreme markets 113–115
Commodity trading advisor performanceindividual fund performance 120–122market volatility 123trading time frame 122–123
Commodity trading advisors (CTAs) 101,209–210
Commodity-rated indices 139Comovement 191, 230Consumer Price Index (CPI) 157Contango 157–158Convenience yield 141Convergence and micromarket structure
54–55Convertible arbitrage 72Convertible arbitrage strategy 70Corporate raider 167Correlation 154, 177, 179, 187, 212, 216,
221, 230, 241, 280vs. beta 273and beta 282copula model of 282
Costless real options 278Cost-of-carry factors 140Covariance of assets in portfolio 271Covered call strategies 260Crash-to-carry model 281Credit default swaps 27Credit risk 262–263, 267Credit risk models vs. market models 262Credit spread exposure 73Credit spreads 221Crowder, Garry B. 169, 235CTA benchmarks 106CTA indices 106, 113CTA investing approaches 124–125CTA pool analysis 126CTA risk 128CTA trackers 124Currency futures 101Currency risk 262Current assets 170
Data anomalies 266–267Data providers 274Database biases 99Default rates 222Default risk 271Delta hedging 17Demyanyk, Yuliya S. 223Derivative markets 28Derivatives 127, 248Derivatives exposure 61Development stage companies 192Dhar, Ravi 223Direct vs. securitized real estate investments
224Disclosure 95Dispersion degree. See VolatilityDistressed debt 172, 173Distressed securities 72Distressed strategy 70Distribution characteristics 126Distributional characteristics 53–54, 93,
160–161, 194, 226, 275Diversification 177, 243, 255, 269Diversification across equity issues 58Diversification benefits 39, 75, 108, 142,
187, 209, 211, 216, 230Diversification mathematics 6Diversification potential 223, 230Diversification sufficiency 254–255Dividends vs. capital gains 57Dodd-Frank rules 283Dot-com bubble 80, 168, 180, 189Due diligence 91–92, 200, 227Duration of bond 32, 262, 269Dynamic capitalism 286Dynamic trading 248
Economic risk factors 207–208Efficient frontier 7, 8Efficient market hypothesis (EMH) 5–8, 13,
14, 15, 16, 19–21, 232Employee Retirement Income Security Act
(ERISA) 22Entitlement sentiment 287Equity allocation 247Equity and fixed income
about 31–35analysis of 52–55annual performance 46derivatives exposure 61diversification across equity issues 58
304 INDEX
Equity and fixed income (Continued)dividends vs. capital gains 57historical equity returns 59knowledge requirements 55–56manager fund performance 59–60manager superiority 61market efficiency 60mutual fund leverage 62myths and misconceptions 56–62performance fact and fiction 38–39performance in 2008 46return and risk characteristics 39–43return in extreme markets 43–45review 35–36risk and return sources 36–38stock and bond indices 46–52stock and bond value drivers 57styles and benchmarks 36time diversification 58
Equity based mutual funds vs. exchangetraded funds (ETFs) 159–160
Equity exposure 73Equity indices 36Equity investment issues 187–188Equity long/short strategy 71Equity return enhancers 229Equity risk 262Estimated mean return 273Estimated standard deviation 273Estimated values 269Estimation error 21, 245, 264Estimation risk 246European sovereign debt 33Event driven strategy 70Event driven styles and benchmarks 70Evil investing 163EW CTA 108–109EW portfolio 55Exchange-traded funds (ETFs) 13, 90–91,
104, 105, 125–126, 136, 253Exchange-traded notes (ETNs) 90–91, 136Expected conditions 236Extreme markets 113–115, 243–246
Fair value 197False alpha 256Farmland 204Fatal flaws 23Fees 61, 69, 92, 103, 195Financial advisors 276Financial crises 14
Financial crises of 2007–2010 285Financial crisis of 2007–2008 13, 281Financial crisis of 2008 226Financial risk importance 283Fixed-income arbitrage strategy 70Fixed-income index 43Fixed-income investments 238Flight to safety 45, 46, 114Forecasting tools 231Forward price volatility 141Fraud 263, 286FTSE NAREIT 209–212, 216, 221Full return 157Fund size 277Fundamental indices 51Funding risk illiquidity 263Fund-of-funds investments 89, 91–93, 171Futures commission merchant (FCM) 137Futures contracts 165Futures contracts forecast ability 281Futures-based commodity indices 139–140
Global commodities 134Global diversification 28Global equity markets 28–29Global macro strategy 71Global real estate investment 227Globalization 230Goetzmann, William N. 223Governance 93–94Governance and micromarket structure 161Government agencies 200Government regulation 277, 288Government sponsored securitization 201Grantham, Jeremy 14Green commodity 155–156Gross fees 98Growth index 36GSCI commodity index 133–134Guiding principles 3Gut options 248
Hedge 123, 124Hedge for equity returns 128–129Hedge fund strategies 72, 86Hedge fund trackers 90Hedge funds
about 63–67alternative approaches to investing in
87–91

Index 305
annual performance 80–84database 67described 68–69index return in extreme markets 78–79indices 85–87investing in 69investment issues 91–95knowledge requirements 95–96myths and misconceptions 96–99performance fact and fiction 73–74performance in 2008 85platform characteristics 65return and risk characteristics 74–78return and risk sources 71–73styles and benchmarks 69–71
Hedge-fund strategies 232Highly levered risky investments 97High-return/low-risk assets 245Historical equity returns 59Historical negative returns gaming 271Historical performance 169Hope over history (HOH) model 16Hostile takeover 167Hybrid mortgages 223
Illiquid investment 199Illiquidity 229
of assets 263funding risk 263
Immeasurable risk mitigation 260Implied volatility 282Impossible to just the possible 253Incentive fees 69, 92, 170, 191Incubation bias 122Index return in extreme markets 78–79Index weighting 86Individual fund and pool investment
124–125Individual fund investment 87–89Individual fund performance 120–122Individual investor 285Inflation 161Inflation hedge
backwardation 157–158commodities 156–158contango 157–158total return attribution 157
Inflation hedging 223Inflation risk 262Information 170Information asymmetries 199, 200
Information ratio 177, 273Informational advantages 15Informational transparency 11–17, 232Initial public offerings 168Insider trading 287Institutional investor 285Institutional model 65Interest risk 262Internal rate of return (IRR) 174, 204Internet bubble 136, 168Investible-hedge fund indices 90Investing in hedge funds 69Investing in managed futures 105Investing in private equity
angel investors 172distressed debt 173leveraged buyouts 173mezzanine debt 173public equity 173–174venture capital 172–173
Investing in real estate 203Investment advisors 276Investment banks 285Investment classes 238–239Investment ideas
about 1–4efficient market hypothesis 19–21information transparency 11–17knowledge requirements 23–24modern investment evolution 17–18modern investment impact 21–23modern investment myths 24–29opportunities and risks 18–19origins of 4–11
Investment indices 209Investment issues 91–95Investment issues in hedge funds
distributional characteristics 93fund-of-funds investments 91–93governance 93–94other issues 94–95
Investment limit 24Investment management 20Investment managers 26Investment models 35Investment opportunities 237Investment risk measurement 259Investor types 249Investor’s expectation 257Investor’s preference 237IPO indices 190

306 INDEX
J-curve effect 174, 188JPMorgan Chase 38, 265, 267, 282, 286Just bonds 56Just stocks 56
Kahneman, Daniel 27Kazemi, Hossein 169, 235Knight, Frank 281Knowledge requirements
asset allocations 253–254commodities 162–163equity and fixed income 55–56hedge funds 95–96investment ideas 23–24managed futures 127–128private equity 194–196real estate investment 227–228risk management 279–280
Large cap indices 39Last year vs. next year performance 196–197Leverage 62, 72, 97, 199, 200, 273Leveraged buyouts 167, 172, 173Liability forecasts 265Linter, John V. 102, 103Liquidity 33, 45, 85, 108, 124, 187, 200,
202Liquidity risk 224, 260, 263, 271Little beta 24–25Long volatility 129Loss prevention 258Loss-aversion 222Low volatility and low market exposure 256Luck 61, 234, 267
Madoff scandal 91–92Managed accounts 171Managed futures
about 101–104advisor investible indices 125–126alternative approach to CTA investing
124–125commodity trading advisor performance
120–124described 104–105investing in 105issues on 126–127knowledge requirements 127–128myths and misconceptions 128–131performance fact and fiction 108–109
performance in 2008 120risk and return characteristics 109–112risk and return sources 107–108styles and benchmarks 106
Management buyouts 173–174Management fees 92, 170, 191Management team 193Manager fees 69, 98Manager fund performance 59–60Manager superiority 61Manager’s performance 73, 107, 108Marginal risk of asset addition 272Marginal value at risk (VaR) 261,
268–269Market and trading structures 19Market beta 275Market correlation 57Market efficiency 60Market factor correlations 238Market factor exposure 241Market factor sensitivity grouping 243Market factor-based groupings 244Market factors 243, 245, 255Market models vs. credit risk models 262Market neutral strategy 70Market portfolio 9Market portfolio measurements 272–273Market risk 227, 261–262, 263Market tools 238Market volatility 123Market-sensitive risk models 279Markowitz, Harry 5, 6, 58, 224, 231, 235,
249, 254Maximum drawdown (MDD) and standard
deviation 267Mean-reversion in commodity prices 135Mean-variance asset allocation 235, 249,
257, 258Mean-variance efficient frontier 7, 16Mean-variance model 224Mean-variance optimization 25–26Measured price risk 258Measurement unique 130Measures of risk
beta 267–268duration of bond 269marginal value at risk (VaR) 268–269maximum drawdown (MDD) 267standard deviation or variance 264–265tracking error 269–270value at risk (VaR) 265–267

Index 307
Merger arbitrage strategy 70Merger arbitrages 72Merton, Robert 17Mezzanine debt 172, 173Micromarket structure 194, 226–227Minimum volatility 246–247MITTTBI 224Model risk 255, 280Modern alternative investments 238Modern asset management, risk in 287Modern investment evolution 17–18Modern investment impact 21–23Modern investment myths
asset prices 29behavioral finance 27–28beta is dead 24–25bond markets 28–29derivative markets 28global equity markets 28–29investment managers 26mean variance optimization 25–26structured products 27yield to maturity (YTM) 26
Modern portfolio theory (MPT) 5–8, 16, 40,58, 75, 211, 231, 232, 236, 254, 258
Momentum traders 129Mortgage-backed securities (MBSs)
200–201, 223Mt. Luca Management (MLM) Index 125Multifactor framework, beta in 268Multifactor models 35, 37, 265, 268Multiple asset allocation approaches
overview and limitations 236–237why and wherefore of 235–236
Murphy’s Law of Diversification 20Mutual fund leverage 62Mutual fund managers performance 38Mutual funds 90–91, 232, 260Mutual funds products 125–126Myths and misconceptions
asset allocations 254–256benchmark reality 229commercial vs. noncommercial real estate
229–230commodity investment 163–166diversification potential 230equity and fixed income 56–62natural diversifier 228–229private equity 196–198real estate 228–230risk management 281–283
Myths and misconceptions of assetallocations
algorithmic approaches vs. discretionaryasset allocation 255
alpha is alpha 255–256diversification sufficiency 254–255low volatility and low market exposure
256Myths and misconceptions of hedge funds
absolute return vehicles 96–97black box trading systems 98database biases 99highly levered risky investments 97manager fees 98unique strategy 98–99
Myths and misconceptions of managedfutures
absolute return vehicles 129hedge for equity returns 128–129long volatility 129measurement unique 130risk relative to stocks 129–130strategy duplication 130–131
Myths and misconceptions of private equitylast year vs. next year performance
196–197private equity benchmark 197private equity performance 198private equity returns 197
Myths and misconceptions of riskmanagement
financial risk importance 283futures contracts forecast ability 281reduced risk ensured by 282regulation and risk 283risk assessment masters 282risk quantification 281simple risk measurement 282systemic risk measurement 283
Naıve diversification 5Nationalization 264Natural diversifier 228–229Negative news risk 259The New Science of Asset Allocation
(Schneeweis, Crowder, and Kazemi)169, 235
Non-systemic risk 279
Oil futures 161One index like another 164

308 INDEX
One-size-fits-all security selection 21, 278Operational risk 260, 263, 267Opportunistic styles and benchmarks 70–71Opportunities and risks 18–19Optimal asset mix 237Option protection 60Options 22, 278Options and return distribution 271Options trading 18Origins of investment ideas
about 4–5capital asset pricing model 9–11efficient market hypothesis 5–8modern portfolio theory 5–8
Orwell, George 288Oxymoron 279
Parental approach 232Passive index 16, 60Passive index strategies 98Passive investment vs. active management 36Passive investments 12Passive trackers 125Past performance 59, 169Pension funds 22Pension plans 250Performance 66Performance fact and fiction
commodities 142equity and fixed income 38–39hedge funds 73–74managed futures 108–109private equity 176–177real estate 208–209
Performance fees 192Performance in 2008
commodities 154–155equity and fixed income 46hedge funds 85managed futures 120private equity 187real estate investment 221
Performance properties 224Personal security 286Political risk 263–264, 267Portfolio
alpha of 273covariance of assets in 271value at risk (VaR) of 268–269
Portfolio creation 257Portfolio insurance 248–249
Portfolio risks 259, 270–271Portfolio volatility 247Price smoothing 224Price volatility 258Prime broker 64Private equity
about 167–171alternatives to 190–193annual performance 181–187equity investment issues 187–188investing in 171–174issues in 193–194knowledge requirements 194–196myths and misconceptions of 196–198origin of modern 167performance fact and fiction 176–177performance in 2008 187private equity indices 188–190return and risk characteristics 177–180risk and return sources 175–176styles and benchmarks 174–175
Private equity analysis 194–195Private equity as public equity 191–192Private equity benchmark 197Private equity fund of funds 195Private equity indices 174, 177, 178–179,
187private equity 188–190return in extreme markets 180–181
Private equity performance 198Private equity returns 197Private funds 105Private investment in public equity (PIPE)
173–174Professionals 2Property prices 222Proxy index 273Public equity investing in private equity
173–174Public futures 105Public private equity indices 190
Qualified investors 69Qualitative risk management 276–277Quantitative models for risk management
279Quantitative risk models 264Quantitative-based trading models 107
Random walk 123, 129Rate of return 87

Index 309
Rating agencies 67, 201, 228, 285Real estate
about 199–202business models 227business properties 204commercial and residential investments
224–226farmland 204investing in 203myths and misconceptions of 228–230performance fact and fiction 208–209private and public 205residential properties 203–204return and risk characteristics 209–212risk and return sources 207–208special issues 223–226styles and benchmarks 205–207timberland 204–205
Real estate bubble 222–223Real estate cycles 208Real estate indices 204–205, 207, 224,
229Real estate investment
annual performance 216–221distributional characteristics 226global 227issues in 226–227knowledge requirements 227–228micromarket structure 226–227performance in 2008 221return in extreme markets 212–216
Real estate investment trusts (REITS) 200,202, 203, 208, 221, 226
Real estate investment trusts (REITS) indices212
Real Income Investment Trust Act of 1960201–202
Reasonable person standard 201Reduced risk ensured belief 282Regulation and risk 283Regulatory change 17Regulatory risk 263–264, 267REIT indices 229Relative measures of risk 260, 269Relative returns 24Relative risk 268Relative standard deviation 282Relative value 69–70Relative volatility 46Repeat sales pricing 204Replication indices 90
Reported market returns vs.accounting-based returns 188
Reporting bias 88Residential properties 203–204Retirement and Income Security Act (ERISA)
34Return and risk attributes 238–243Return and risk characteristics 39–43,
74–78, 142–145private equity 177–180real estate 209–212
Return and risk estimation 227Return and risk sources 71–73,
140–141Return distribution 266–267Return enhancements 176, 191, 241Return forecast 257Return in extreme markets
commodity investment 146–148equity and fixed income 43–45private equity 180–181real estate investment 212–216
Return patterns 109Return premium 174Return-enhancement vehicles 171, 195, 228,
253Returns and volatility 256Return-to-risk trade-off 77, 178, 270Return-to-risk-trade-off 3, 76, 111, 141,
146, 232Risk
complete measurement 258concept of 257measures of 264–270relative market 259types of 258vs. uncertainty 281
Risk advisors 276Risk and return 56Risk and return characteristics 109–112Risk and return sources 36–38
managed futures 107–108private equity 175–176real estate 207–208
Risk appetite 249Risk assessment 234Risk assessment masters 282Risk classes 241Risk diversifiers 241Risk exposure 258Risk level. See Standard deviation

310 INDEX
Risk managementabout 257–259as approximation 279–280definition of 258failures 263issues in 277–279knowledge requirements 279–280models 258, 270myths and misconceptions of 281–283new forms of 18policies 282qualitative 276–277quantitative models to 279vs. risk measurement 259–264risk-adjusted models 270–274risk-based models of 281services 260skills 267timing 274–276
Risk measure models 260Risk measurement vs. risk management
259–264Risk measures 275Risk Metrics 265–266Risk parity approach 247Risk periods 275Risk quantification 281Risk reduction 40Risk relative to stocks 129–130Risk tolerance 23, 234Risk-adjusted models
Information ratio 273Sharpe ratio 270–272Treynor ratio 272–273
Risk-adjusted return 261Risk-adjusted returns on capital (RAROC)
265–266Risk-evaluation measures 265Risk-free rate 9, 253Risk-free rate of return 270Riskless solutions 282Risk-management tools 234Risks 2Risk-to-return balance 267Risk-to-return trade-offs 254Rogue traders 263Roll return 157Rules of investing 55
S&P GSCI 142, 157, 161Sale price 204
Samuelson effect 141Scandal 286Schneeweis, Thomas 169, 235Scholes, Myron 17Securities and Exchange Commission (SEC)
67Securities Investor Protection Corporation 67Securitization 18, 200Security market line (SMML) 10Selection bias 88Sharpe, William 9, 235Sharpe ratio 261, 270–272, 273, 282Sharpe ratio gaming 271Silent fees 92Simple risk measurement 282Simple solution to hard problems 280Single factor measurers 272Skewness 272Small cap indices 39Smoothing 271–272Sources of investment return 5Sources of returns 234Special-purpose acquisition corporations
(SPACs) 190, 192Speculation in commodity investment 166Spot return 157Stale valuations 224Stand-alone mix 239Standard & Poor’s 500 36Standard deviation 74, 109, 110, 123, 124,
128, 130, 154, 177, 178, 216, 221, 232,241, 259, 261, 264–267, 270
Stock and bond indices 46–52Stock and bond value drivers 57Stock market value 57Storage theory 141Strategy 277Strategy duplication 130–131Structured products 27, 234Styles and benchmarks
commodities 139–140equity and fixed income 36event driven 70hedge funds 36managed futures 106opportunistic 70–71private equity 174–175real estate 205–207relative value 69–70
Subprime crisis 46Subprime loans 222, 223

Index 311
Subprime mortgage 33Subprime mortgage crisis (2007–2010) 221,
222–223Subprime mortgage fraud 286Supply and demand 161Survival 22Survivor bias 88, 99, 122Survivorship bias 88, 122Synthetic option 17Systematic risk 10, 11, 12, 82Systemic risk 27, 261, 279, 282, 283Systemic risk measurement 283
Taleb, Nissam Nicholas 283Target Date Funds 255Tension and innovation 254Timberland 204–205Time diversification 58Time period of analysis 273Time period performance 74Time under high water mark 267Timing 274–276Total return attribution 157Tracker CTA 103Tracker funds 99Tracking error 269–270, 273Trading models 107Trading process 276Trading strategies 70Trading time frame 122–123Traditional and alternative asset allocations
237–238Traditional and alternatives 238Traditional asset-weighted alternatives
244–245Transparency 65, 86, 95, 98, 168, 170, 191,
202, 288Trend followers 129Treynor model 272Treynor ratio 272–273True alpha 256True beta 273
True risk 15Truth vs. easiness 288Tversky, Amos 27
Uncertainty 278Unique strategy 98–99Upward bias 271
Valuation 169Valuation data 224Valuation index 203Valuations 172, 173–174, 199, 222Value added 170Value at risk (VaR) 262, 283
defined 266of portfolio 268–269shortcomings 266–267
Value estimation 269–270Value proposition 195Van Hemert, Otto 223Variance 264–265Venture capital 168, 172–173Volatility 72, 85, 97, 109, 123, 130, 177,
180, 187, 188, 191, 193, 224, 246, 272Volatility (estimated) weighted allocation
247Volatility and returns 256Volatility index (VIX) 20, 264Volatility risk 141Volatility swaps 264Volatility weighted equally weighted
portfolio 247
We monitor what we measure practice 283Wizards 253, 282
Yield to duration (YTD) 31, 32Yield to maturity (YTM) 26, 31, 32
Zero-sum games 127–128Zurich Capital Markets (ZCM) 64

Related Documents