Report Post-Implementation Travel Time Survey - Barrington Street to Innes Road Prepared for Christchurch City Council (Client) By Beca Infrastructure Ltd (Beca) 3 June 2011 © Beca 2011 (unless Beca has expressly agreed otherwise with the Client in writing). This report has been prepared by Beca on the specific instructions of our Client. It is solely for our Client’s use for the purpose for which it is intended in accordance with the agreed scope of work. Any use or reliance by any person contrary to the above, to which Beca has not given its prior written consent, is at that person's own risk.

Welcome message from author
This document is posted to help you gain knowledge. Please leave a comment to let me know what you think about it! Share it to your friends and learn new things together.
Transcript

Report
Post-Implementation Travel Time Survey - Barrington Street to Innes Road Prepared for Christchurch City Council (Client)
By Beca Infrastructure Ltd (Beca)
3 June 2011
© Beca 2011 (unless Beca has expressly agreed otherwise with the Client in writing).
This report has been prepared by Beca on the specific instructions of our Client. It is solely for our Client’s use for the purpose for which it is intended in accordance with the agreed scope of work. Any use or reliance by any person contrary to the above, to which Beca has not given its prior written consent, is at that person's own risk.

Beca // 1 June 2011
3390950 // NZ1-4478537-4 0.4
Revision History
Revision Nº Prepared By Description Date
A Rohit Singh Draft Report for review 1 June 2011
B Rohit Singh Final Report 3 June 2011
Document Acceptance
Action Name Signed Date
Prepared by Rohit Singh
Reviewed by Marcus Brown
Approved by Melissa Foster
on behalf of Beca Infrastructure Ltd
Post-Implementation Travel Time Survey - Barrington Street to Innes Road
Beca // 1 June 2011 // Page 1
3390950 // NZ1-4478537-4 0.4
Table of Contents Executive Summary .................................................................................................... 2
1 Introduction .......................................................................................................... 3
1.1 Background: Christchurch Congestion Monitoring .................................................... 3
1.2 Background: Barrington Street to Innes Road Corridor Survey ................................. 3
1.3 Purpose of this Report ............................................................................................. 3
1.4 Report Structure ...................................................................................................... 4
2 Methodology ......................................................................................................... 5
2.1 Survey Route ........................................................................................................... 5
2.2 Data Collection Methodology ................................................................................... 6
3 Survey Observations ............................................................................................ 8
3.1 Weather ................................................................................................................... 8
3.2 Factors Affecting Traffic Flow ................................................................................... 8
4 Summary Results ................................................................................................. 9
4.1 Travel Times ............................................................................................................ 9
4.2 Travel Speed ......................................................................................................... 10
Appendices Appendix A - Travel Time Survey Results

Post-Implementation Travel Time Survey - Barrington Street to Innes Road
Beca // 1 June 2011 // Page 2
3390950 // NZ1-4478537-4 0.4
Executive Summary
In May 2011, Beca Infrastructure Ltd. (Beca) were approached by the NZTA (acting on behalf of CCC) to conduct travel time surveys on the route consisting of Barrington Street, Whiteleigh Ave, Clarence Street, Straven Road, Idris Road, Glandovey Road, Heaton Street and Innes Road to assess the effects of changes made to the intersection approach and departure lane configurations within the Barrington Street / Southern Motorway to Idris Road / Glandovey Road section.
Post-implementation travel time surveys were organised on the selected route between Tuesday 24 May and Thursday 26 May 2011 (inclusive). Travel time and speed data from these dates has been compared to those observed during the corresponding days in April (Tuesday 4 April to Thursday 6 April 2011).
The survey involved one drive in each direction (northbound and southbound) of the route during the AM and PM peak periods on each of the three survey days. The start time throughout the survey period was fixed at 7:30 am for the morning peak and 4:30 pm for the evening peak.
Key survey results are detailed below:
Travel time: n Average northbound travel time on the Barrington/CSM to Idris/Glandovey route was reduced by
1 minute in the AM and 3 minutes in the PM peak periods. n Average southbound travel time on the Barrington/CSM to Idris/Glandovey route was reduced by
13 minutes in the AM and 1 minute in the PM peak periods.
Travel speed: n Average northbound speeds on the Barrington/CSM to Idris/Glandovey route increased by 4 kph
during both the AM and PM peak periods. n A significant increase was observed in average speeds in the AM peak in the southbound
direction from 16 kph in April to 28 kph in May. Average speeds in the PM peak in the southbound direction in April and May were observed to be similar.

Post-Implementation Travel Time Survey - Barrington Street to Innes Road
Beca // 1 June 2011 // Page 3
3390950 // NZ1-4478537-4 0.4
1 Introduction
1.1 Background: Christchurch Congestion Monitoring
In February 2004, Beca Infrastructure Ltd. (Beca) were commissioned by Transit New Zealand, now the New Zealand Transport Agency (NZTA), to carry out travel time surveys on motorways and arterial routes in the Christchurch region. These surveys commenced in 2006 and were conducted during March and November each year, in order to be consistent and directly comparable with data collected in other major New Zealand cities.
The objectives of the Christchurch Travel Time Surveys are to:
n Gather accurate information about speed and travel times on State Highways and local arterials in the greater Christchurch region; and
n Provide data to give a realistic picture of congestion, speed and travel trends over time.
In addition to conducting the surveys, Beca were requested to prepare a travel time performance indicator to compare the performance of the Christchurch network against other cities in New Zealand and Australia. This performance measure, known as the Congestion Indicator (CGI), has been calculated in accordance with the methodology set out by the Ministry for the Environment1. The details of the Congestion Indicators are included in a separate Beca report titled ‘Christchurch Traffic System Performance Monitoring Report November 2010’
1.2 Background: Barrington Street to Innes Road Corridor Survey
The Canterbury earthquakes of September 2010 and February 2011 affected a large proportion of the Christchurch road network resulting in significantly increased congestion. Following the February earthquake and various subsequent communications between NZTA and Beca, it was decided to go ahead with the travel time surveys scheduled for March 2011. These were subsequently conducted during the first week of April 2011.
In addition to the usual routes, an additional route was surveyed at the request of Christchurch City Council (CCC) during April. This route consisted of the key north-south corridor consisting of Barrington Street, Whiteleigh Ave, Clarence Street, Straven Road, Idris Road, Glandovey Road, Heaton Street and Innes Road.
In May 2011, Beca were approached by NZTA (acting on behalf of CCC) to conduct travel time surveys on this route to assess the effects of changes made to the intersection approach and departure lane configurations within the Barrington Street / Southern Motorway to Idris Road / Glandovey Road section.
1.3 Purpose of this Report
This report describes the methodology adopted during the April 2011 (pre-implementation) and May 2011 (post-implementation) travel time surveys on the Barrington Street to Innes Road corridor and presents results from the same.
Travel time and speed information from May 2011 is reported, and this is compared with corresponding data collected in April prior to the implementation of changes along the route.
1 Jollands.N. (2001) Indicators of the environmental effects of transport – Travel-time indicator

Post-Implementation Travel Time Survey - Barrington Street to Innes Road
Beca // 1 June 2011 // Page 4
3390950 // NZ1-4478537-4 0.4
1.4 Report Structure
The structure of this report is given below:
n Section 2 describes the methodology used to undertake the travel time surveys. n Section 3 notes observations made during the survey period. n Section 4 presents summary travel time and speed results for the selected route. n Appendix A presents detailed travel time and speed data tables and shows comparison
between April and May 2011 data.
Post-Implementation Travel Time Survey - Barrington Street to Innes Road
Beca // 1 June 2011 // Page 5
3390950 // NZ1-4478537-4 0.4
2 Methodology
The following section describes the selected route and methodology used for conducting the travel time surveys. With the exception of the inter-peak survey which was not conducted in May, the methodology adopted remains unchanged from that used in the April 2011 surveys. This is expected to maintain consistency of data collected during the two surveys and to allow meaningful comparison and analysis.
2.1 Survey Route
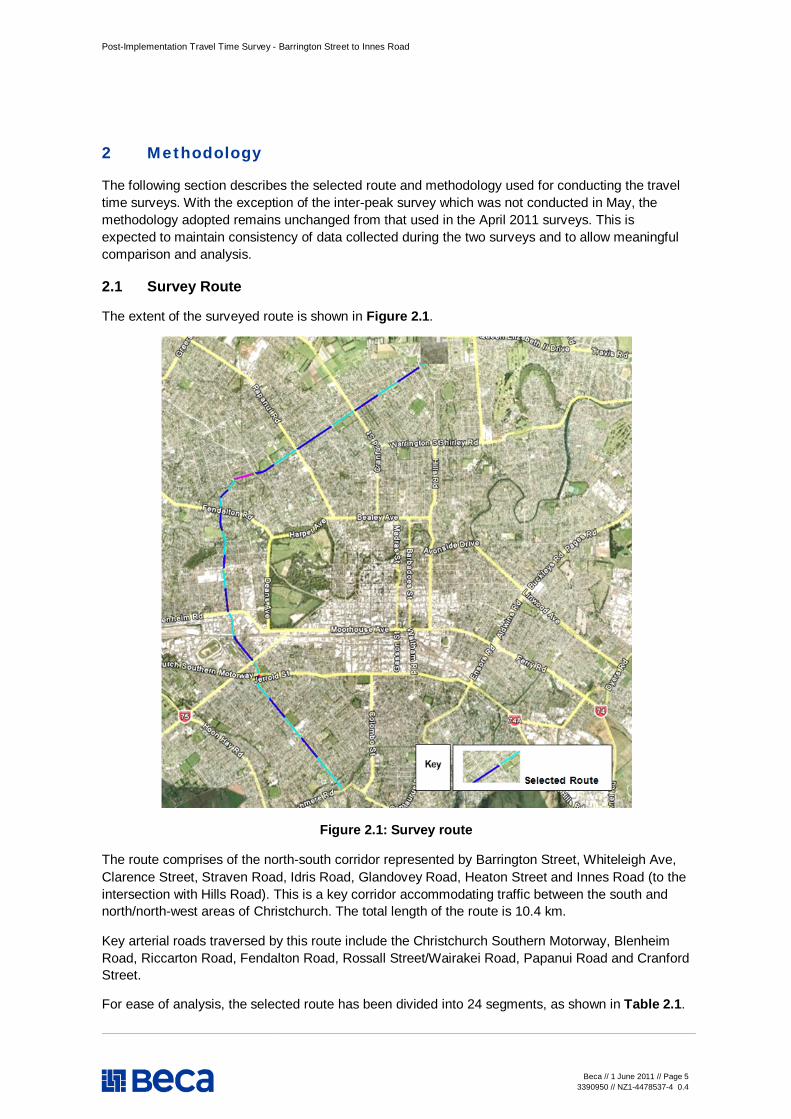
The extent of the surveyed route is shown in Figure 2.1.
Figure 2.1: Survey route
The route comprises of the north-south corridor represented by Barrington Street, Whiteleigh Ave, Clarence Street, Straven Road, Idris Road, Glandovey Road, Heaton Street and Innes Road (to the intersection with Hills Road). This is a key corridor accommodating traffic between the south and north/north-west areas of Christchurch. The total length of the route is 10.4 km.
Key arterial roads traversed by this route include the Christchurch Southern Motorway, Blenheim Road, Riccarton Road, Fendalton Road, Rossall Street/Wairakei Road, Papanui Road and Cranford Street.
For ease of analysis, the selected route has been divided into 24 segments, as shown in Table 2.1.

Post-Implementation Travel Time Survey - Barrington Street to Innes Road
Beca // 1 June 2011 // Page 6
3390950 // NZ1-4478537-4 0.4
Table 2.1: Route segments
Segment No.
Length (m)
Road Name From To
1 772.8 Barrington St Cashmere Rd Studholme St 2 472.8 Barrington St Studholme St Milton St 3 469.1 Barrington St Milton St Wychbury St 4 467.2 Barrington St Wychbury St Heward St 5 400.4 Barrington St Heward St CSM (SH 73) West bound 6 246.0 Barrington St CSM (SH 73) East bound Lincoln Rd 7 583.0 Whiteleigh Ave Lincoln Rd Rail crossing 8 439.2 Whiteleigh Ave Rail crossing Blenheim Rd 9 452.0 Clarence St Blenheim Rd Peverel St 10 341.0 Clarence St Peverel St Riccarton Rd 11 264.9 Straven Rd Riccarton Rd Kilmarnock St 12 456.4 Straven Rd Kilmarnock St Rochdale St 13 369.1 Straven Rd Rochdale St Fendalton Rd 14 224.0 Idris Rd Fendalton Rd Brandor Rd 15 205.7 Idris Rd Brandor Rd Wroxton Tce 16 214.5 Idris Rd Wroxton Tce Glandovey Rd 17 387.2 Glandovey Rd Indris Rd Strowan Rd 18 392.6 Heaton St Strowan Rd Allister Ave 19 495.3 Heaton St Allister Ave Papanui Rd 20 784.4 Innes Rd Papanui Rd Rutland St 21 476.9 Innes Rd Rutland St Crandord St 22 521.1 Innes Rd Cranford St Nancy Ave 23 451.4 Innes Rd Nancy Ave Mahars Rd 24 489.2 Innes Rd Mahars Rd Hills Rd
While the whole route has been surveyed to maintain consistency with the April surveys, CCC have indicated that the section of specific interest lies between Christchurch Southern Motorway and the Idris/Glandovey intersection (highlighted sections 6-16 above). Summary results for this section are reported separately in Section 4, while detailed results for all sections are provided in Appendix A.
2.2 Data Collection Methodology
Travel time surveys were conducted using the floating car method, so that the data recorded represents the mean travel times of the traffic stream being measured. A GPS unit located within the survey vehicle was used to record travel time and speed information. The GPS unit records a trail of positions (x, y coordinates) and times recorded at 1-second intervals.
Data from each unit was uploaded to a computer at the completion of each day. The data was then analysed using Visual Basic macros to determine the closest survey point to each network node for each period to determine start/end times and to calculate the travel time and average speed for each road section listed in Table 2.1.

Post-Implementation Travel Time Survey - Barrington Street to Innes Road
Beca // 1 June 2011 // Page 7
3390950 // NZ1-4478537-4 0.4
2.2.1 Survey Dates
Travel time surveys were organised on the selected route between Tuesday 24 May and Thursday 26 May 2011 (inclusive). Travel time and speed data from these dates has been compared to those observed during the corresponding days in April (Tuesday 4 April to Thursday 6 April 2011).
2.2.2 Survey Start Times
The survey involved one drive in each direction (northbound and southbound) of the route during the AM and PM peak periods on each of the three survey days. The start time throughout the survey period was fixed at 7:30 am for the morning peak and 4:30 pm for the evening peak.
Unlike the April surveys, inter-peak travel time data was not recorded during the post-implementation travel time surveys.
Post-Implementation Travel Time Survey - Barrington Street to Innes Road
Beca // 1 June 2011 // Page 8
3390950 // NZ1-4478537-4 0.4
3 Survey Observations
Travel times across the network show a degree of natural variability and day to day fluctuations in speeds are considered typical. As part of the validation of the survey data, unusual circumstances are checked. Typically these results are kept as part of the survey database as they reflect this natural variability due to incidents, events, or weather.
The following is a brief description of key observations made during the May survey period.
3.1 Weather
The weather during the survey period was predominantly overcast but not rainy, except for Tuesday morning when fine weather was reported.
3.2 Factors Affecting Traffic Flow
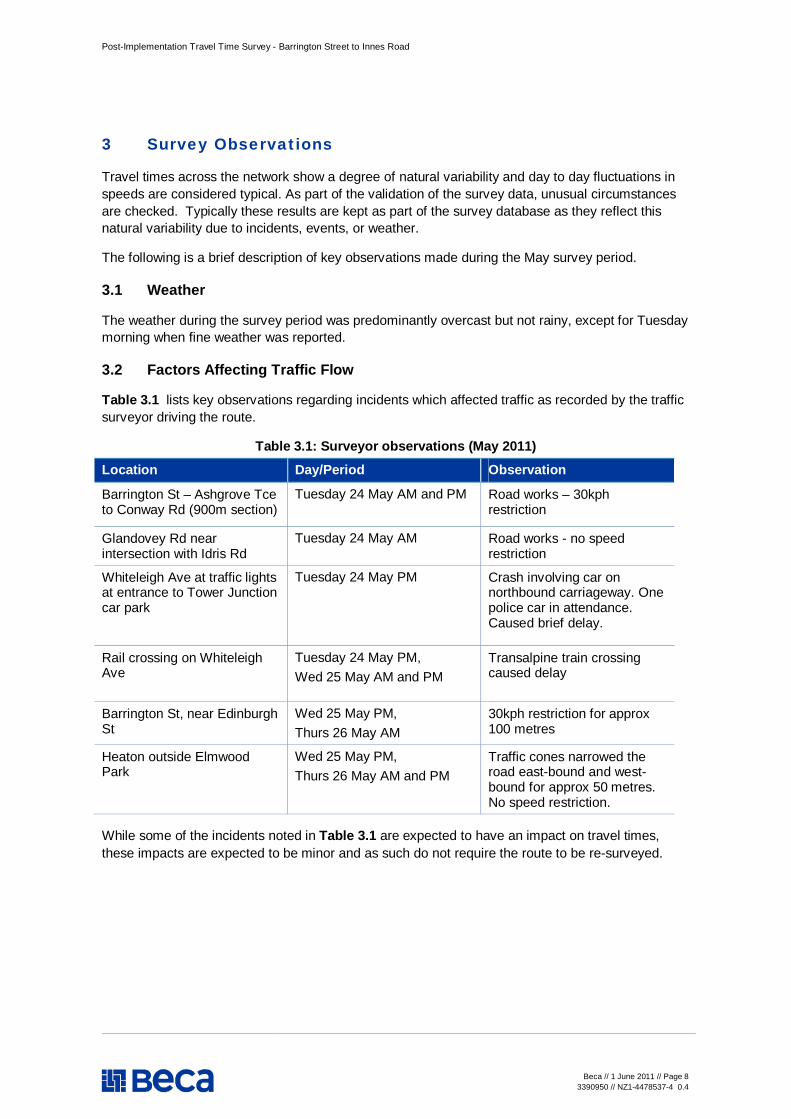
Table 3.1 lists key observations regarding incidents which affected traffic as recorded by the traffic surveyor driving the route.
Table 3.1: Surveyor observations (May 2011)
Location Day/Period Observation
Barrington St – Ashgrove Tce to Conway Rd (900m section)
Tuesday 24 May AM and PM Road works – 30kph restriction
Glandovey Rd near intersection with Idris Rd
Tuesday 24 May AM Road works - no speed restriction
Whiteleigh Ave at traffic lights at entrance to Tower Junction car park
Tuesday 24 May PM Crash involving car on northbound carriageway. One police car in attendance. Caused brief delay.
Rail crossing on Whiteleigh Ave
Tuesday 24 May PM, Wed 25 May AM and PM
Transalpine train crossing caused delay
Barrington St, near Edinburgh St
Wed 25 May PM, Thurs 26 May AM
30kph restriction for approx 100 metres
Heaton outside Elmwood Park
Wed 25 May PM, Thurs 26 May AM and PM
Traffic cones narrowed the road east-bound and west-bound for approx 50 metres. No speed restriction.
While some of the incidents noted in Table 3.1 are expected to have an impact on travel times, these impacts are expected to be minor and as such do not require the route to be re-surveyed.

Post-Implementation Travel Time Survey - Barrington Street to Innes Road
Beca // 1 June 2011 // Page 9
3390950 // NZ1-4478537-4 0.4
4 Summary Results
The following section presents the travel time and speed information collected during the post-implementation (May 2011) surveys, and compares it to data from April 2011.
Detailed travel time and speed information by day and peak period for the selected route, along with comparisons with April 2011 data, is given in Appendix A of this report.
In addition, summary statistics showing the total travel time and speeds are presented below. These results have been reported for the following route sections:
n Complete route, as shown in Section 2.1. n Section of interest, between the Barrington Street/CSM and Idris Road/Glandovey Road
intersections.
4.1 Travel Times
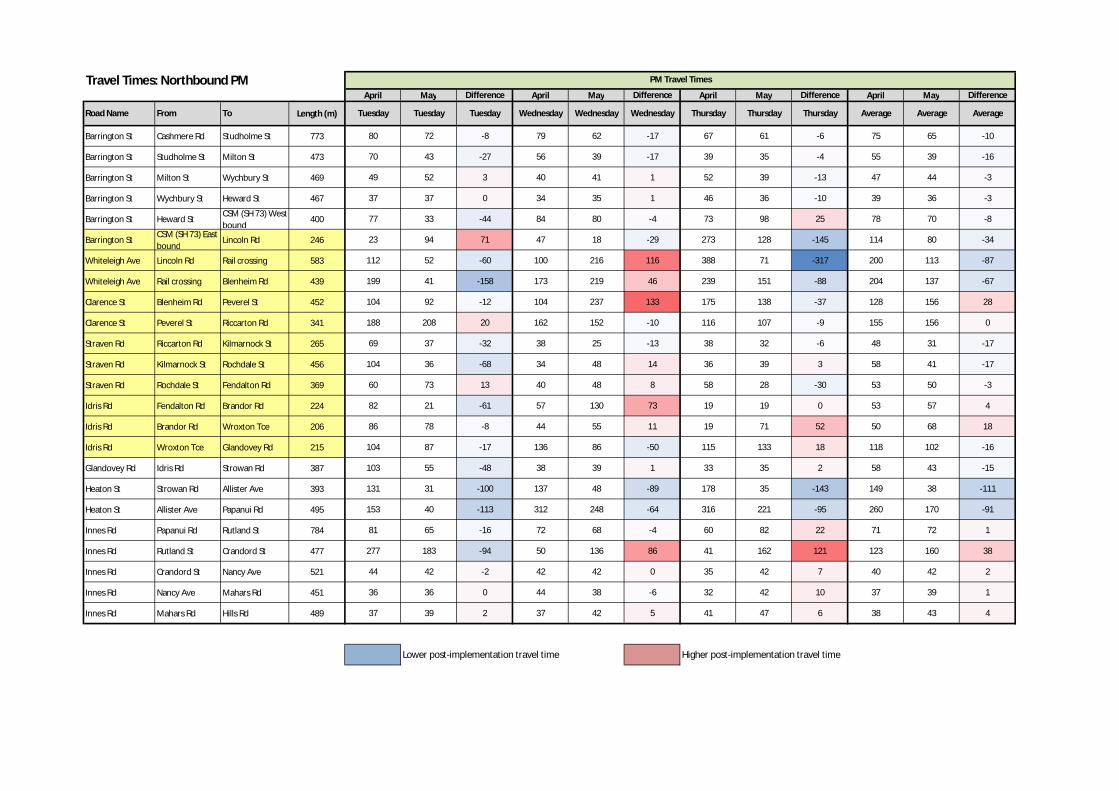
Table 4.1 shows a comparison of total travel times in the northbound direction, by month, day and peak period, for the two route sections listed above..
Table 4.1: Northbound travel times
Complete Route Barrington/CSM to Idris/Glandovey
The figures shown in Table 4.1 indicate that PM peak travel times for this direction of travel far exceed those experienced in the AM peak. The comparison between the April and May data also shows that the post-implementation PM peak travel times along both routes showed significant reductions (more than 10 minutes for the whole route and between 5 and 10 minutes for the Barrington/CSM to Idris/Glandovey route) on Tuesday and Thursday, although a slight increase in travel time was observed during the Wednesday PM peak, which may have been caused by the delay experienced at the rail crossing.
On average, northbound travel time on the Barrington/CSM to Idris/Glandovey route was reduced by one minute in the AM and 3 minutes in the PM peak periods. Overall, AM travel times showed little variation from those observed in April.
The data for each section within the Barrington/CSM to Idris/Glandovey route shows definite improvements in travel on Barrington Street (between CSM and Lincoln Road) (AM and PM), Clarence Street (between Peverel Street and Riccarton Road) (AM) and Whiteleigh Ave (between Lincoln Road and Blenheim Road) (AM). The exception is Straven Road (between Kilmarnock Street and Rochdale Street) which appears to have experienced a slight increase in travel time across most days.

Post-Implementation Travel Time Survey - Barrington Street to Innes Road
Beca // 1 June 2011 // Page 10 3390950 // NZ1-4478537-4 0.4
In addition, significant reductions in travel time are observed on Heaton Street in the PM peak period.
Table 4.2 compares total travel times from April and May 2011 in the southbound direction, by day and peak period.
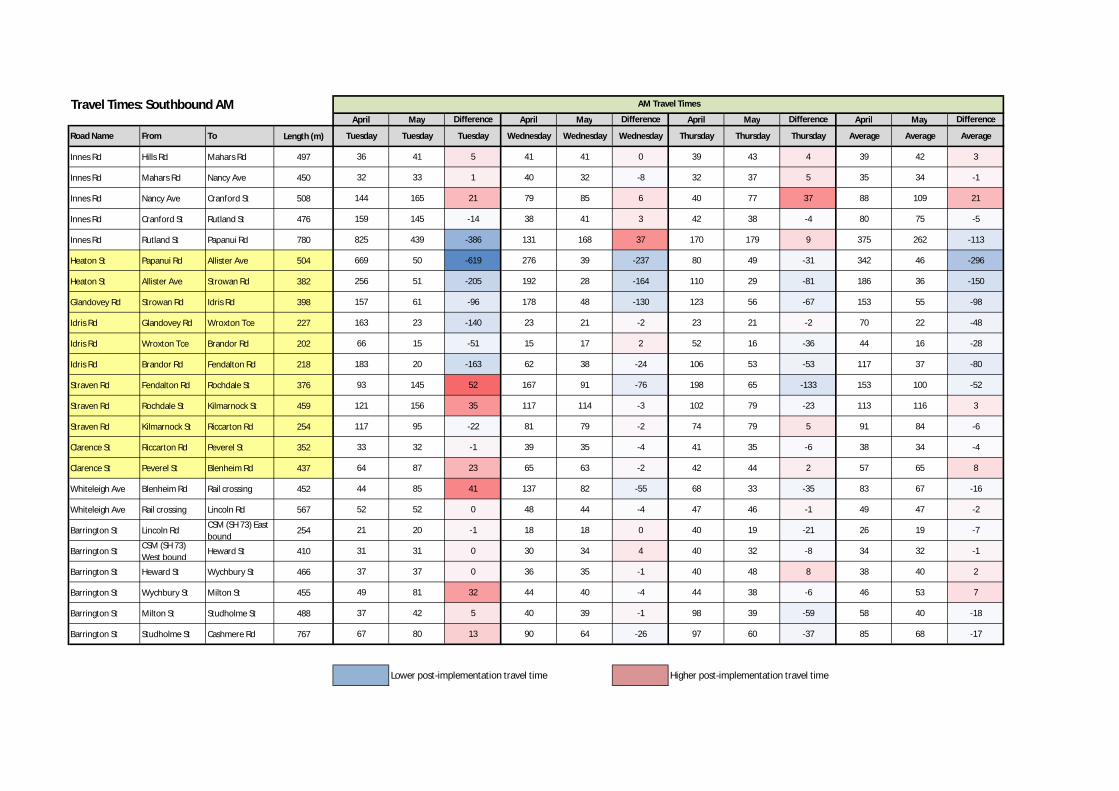
Table 4.2: Southbound travel times
Complete Route Barrington/CSM to Idris/Glandovey
The figures shown in Table 4.2 indicate that southbound AM peak travel times have reduced significantly as compared to April, with reductions of around 10 minutes observed for both routes. A large reduction in AM peak travel times is observed on Tuesday. This is likely to be a case of bad weather exacerbating traffic congestion on the morning of the Tuesday survey in April.
Southbound travel times in the PM peak do not show the level of reductions seen in the AM peak, and are observed to increase slightly on Thursday.
On average, southbound travel time on the Barrington/CSM to Idris/Glandovey route was reduced by 13 minutes in the AM and 1 minute in the PM peak periods.
The data for each section within the Barrington/CSM to Idris/Glandovey route shows definite improvements in travel on Idris Road / Straven (Brandor Road - Fendalton Road – Rochdale Street) (AM) and Straven Road (between Kilmarnock Street and Riccarton Road) (PM).
Significant reductions in travel time on Heaton Street and Glandovey Road are also noted in the AM peak period.
4.2 Travel Speed
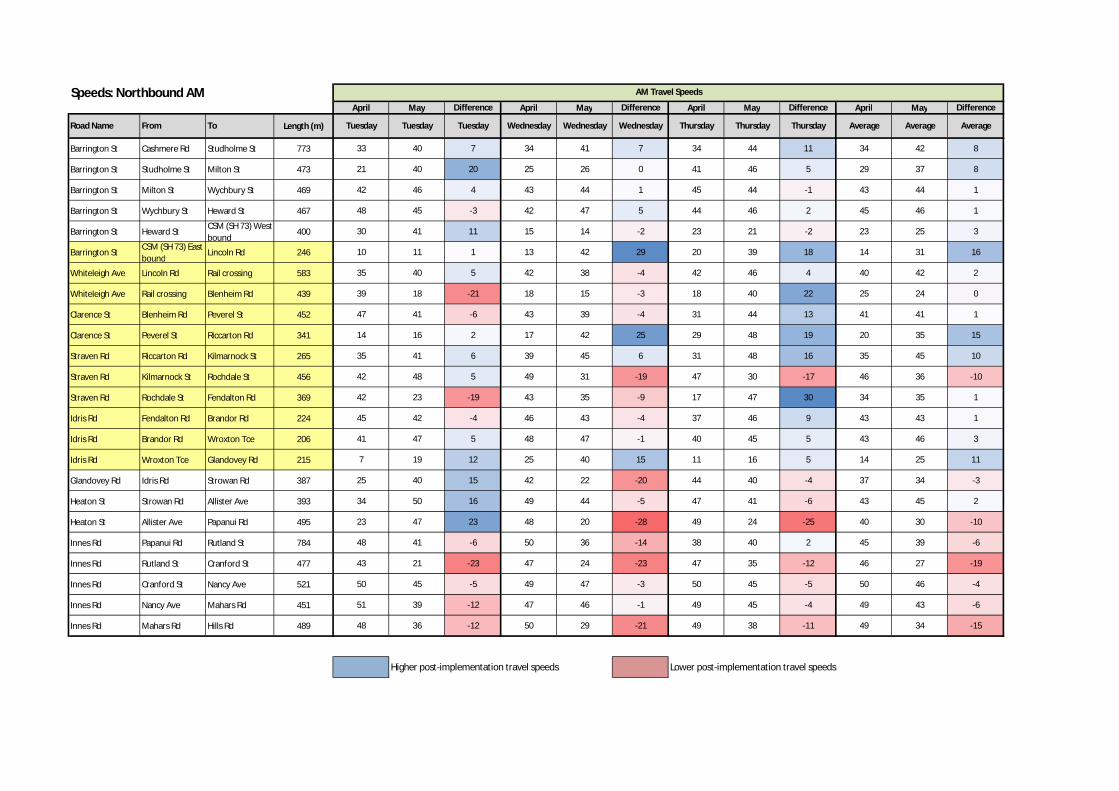
Table 4.3 shows a comparison of travel speeds in the northbound direction, by month, day and peak period, for the two route sections.

Post-Implementation Travel Time Survey - Barrington Street to Innes Road
Beca // 1 June 2011 // Page 11 3390950 // NZ1-4478537-4 0.4
Table 4.3: Northbound speeds
Complete Route Barrington/CSM to Idris/Glandovey
The changes in northbound speeds between April and May reinforce the trends observed in travel times in this direction.
On average, northbound speeds on the Barrington/CSM to Idris/Glandovey route increased by 4 kph during both the AM and PM peak periods.
Table 4.4 compares speed data from April and May 2011 in the southbound direction, by day and peak period.
Table 4.4: Southbound speeds
Complete Route Barrington/CSM to Idris/Glandovey
The figures in Table 4.4 indicate that the Barrington/CSM to Idris/Glandovey route has experienced more significant speed increases as compared to the complete route, with a higher observed level of variation in speeds as well. Thursday PM southbound speeds in particular show a decrease of around 7kph in May as compared to those in April.
On average, a significant increase was observed in AM southbound speeds from April (16 kph) to May (28 kph).
This corresponds to the large decrease in travel times observed during this period, as shown in Table 4.2. Little variation is observed in the average PM southbound speeds.

Appendix A
Travel Time Survey Results

Travel Times: Northbound AMApril May Difference April May Difference April May Difference April May Difference
Road Name From To Length (m) Tuesday Tuesday Tuesday Wednesday Wednesday Wednesday Thursday Thursday Thursday Average Average Average
Barrington St Cashmere Rd Studholme St 773 83 69 -14 79 67 -12 82 62 -20 81 66 -15
Barrington St Studholme St Milton St 473 82 42 -40 65 64 -1 41 36 -5 63 47 -15
Barrington St Milton St Wychbury St 469 39 36 -3 38 37 -1 37 38 1 38 37 -1
Barrington St Wychbury St Heward St 467 34 36 2 39 34 -5 37 35 -2 37 35 -2
Barrington St Heward StCSM (SH 73) West bound
400 48 34 -14 94 102 8 62 68 6 68 68 0
Barrington StCSM (SH 73) East bound
Lincoln Rd 246 83 75 -8 66 21 -45 43 22 -21 64 39 -25
Whiteleigh Ave Lincoln Rd Rail crossing 583 59 51 -8 48 54 6 49 45 -4 52 50 -2
Whiteleigh Ave Rail crossing Blenheim Rd 439 40 86 46 89 104 15 89 39 -50 73 76 4
Clarence St Blenheim Rd Peverel St 452 34 39 5 37 41 4 50 36 -14 40 39 -2
Clarence St Peverel St Riccarton Rd 341 85 75 -10 72 28 -44 41 25 -16 66 43 -23
Straven Rd Riccarton Rd Kilmarnock St 265 26 23 -3 23 20 -3 29 19 -10 26 21 -5
Straven Rd Kilmarnock St Rochdale St 456 37 33 -4 32 51 19 33 53 20 34 46 12
Straven Rd Rochdale St Fendalton Rd 369 30 57 27 29 37 8 75 27 -48 45 40 -4
Idris Rd Fendalton Rd Brandor Rd 224 16 19 3 17 18 1 21 17 -4 18 18 0
Idris Rd Brandor Rd Wroxton Tce 206 16 15 -1 14 15 1 18 16 -2 16 15 -1
Idris Rd Wroxton Tce Glandovey Rd 215 110 40 -70 29 19 -10 65 45 -20 68 35 -33
Glandovey Rd Idris Rd Strowan Rd 387 54 34 -20 32 61 29 31 34 3 39 43 4
Heaton St Strowan Rd Allister Ave 393 41 28 -13 28 31 3 29 33 4 33 31 -2
Heaton St Allister Ave Papanui Rd 495 76 37 -39 37 89 52 36 75 39 50 67 17
Innes Rd Papanui Rd Rutland St 784 58 67 9 56 78 22 74 69 -5 63 71 9
Innes Rd Rutland St Cranford St 477 39 82 43 36 71 35 35 48 13 37 67 30
Innes Rd Cranford St Nancy Ave 521 37 40 3 37 39 2 36 41 5 37 40 3
Innes Rd Nancy Ave Mahars Rd 451 31 40 9 33 34 1 33 36 3 32 37 4
Innes Rd Mahars Rd Hills Rd 489 36 48 12 35 61 26 35 45 10 35 51 16
Lower post-implementation travel time Higher post-implementation travel time
AM Travel Times
Speeds: Northbound AMApril May Difference April May Difference April May Difference April May Difference
Road Name From To Length (m) Tuesday Tuesday Tuesday Wednesday Wednesday Wednesday Thursday Thursday Thursday Average Average Average
Barrington St Cashmere Rd Studholme St 773 33 40 7 34 41 7 34 44 11 34 42 8
Barrington St Studholme St Milton St 473 21 40 20 25 26 0 41 46 5 29 37 8
Barrington St Milton St Wychbury St 469 42 46 4 43 44 1 45 44 -1 43 44 1
Barrington St Wychbury St Heward St 467 48 45 -3 42 47 5 44 46 2 45 46 1
Barrington St Heward StCSM (SH 73) West bound
400 30 41 11 15 14 -2 23 21 -2 23 25 3
Barrington StCSM (SH 73) East bound
Lincoln Rd 246 10 11 1 13 42 29 20 39 18 14 31 16
Whiteleigh Ave Lincoln Rd Rail crossing 583 35 40 5 42 38 -4 42 46 4 40 42 2
Whiteleigh Ave Rail crossing Blenheim Rd 439 39 18 -21 18 15 -3 18 40 22 25 24 0
Clarence St Blenheim Rd Peverel St 452 47 41 -6 43 39 -4 31 44 13 41 41 1
Clarence St Peverel St Riccarton Rd 341 14 16 2 17 42 25 29 48 19 20 35 15
Straven Rd Riccarton Rd Kilmarnock St 265 35 41 6 39 45 6 31 48 16 35 45 10
Straven Rd Kilmarnock St Rochdale St 456 42 48 5 49 31 -19 47 30 -17 46 36 -10
Straven Rd Rochdale St Fendalton Rd 369 42 23 -19 43 35 -9 17 47 30 34 35 1
Idris Rd Fendalton Rd Brandor Rd 224 45 42 -4 46 43 -4 37 46 9 43 43 1
Idris Rd Brandor Rd Wroxton Tce 206 41 47 5 48 47 -1 40 45 5 43 46 3
Idris Rd Wroxton Tce Glandovey Rd 215 7 19 12 25 40 15 11 16 5 14 25 11
Glandovey Rd Idris Rd Strowan Rd 387 25 40 15 42 22 -20 44 40 -4 37 34 -3
Heaton St Strowan Rd Allister Ave 393 34 50 16 49 44 -5 47 41 -6 43 45 2
Heaton St Allister Ave Papanui Rd 495 23 47 23 48 20 -28 49 24 -25 40 30 -10
Innes Rd Papanui Rd Rutland St 784 48 41 -6 50 36 -14 38 40 2 45 39 -6
Innes Rd Rutland St Cranford St 477 43 21 -23 47 24 -23 47 35 -12 46 27 -19
Innes Rd Cranford St Nancy Ave 521 50 45 -5 49 47 -3 50 45 -5 50 46 -4
Innes Rd Nancy Ave Mahars Rd 451 51 39 -12 47 46 -1 49 45 -4 49 43 -6
Innes Rd Mahars Rd Hills Rd 489 48 36 -12 50 29 -21 49 38 -11 49 34 -15
Higher post-implementation travel speeds Lower post-implementation travel speeds
AM Travel Speeds
Travel Times: Southbound AMApril May Difference April May Difference April May Difference April May Difference
Road Name From To Length (m) Tuesday Tuesday Tuesday Wednesday Wednesday Wednesday Thursday Thursday Thursday Average Average Average
Innes Rd Hills Rd Mahars Rd 497 36 41 5 41 41 0 39 43 4 39 42 3
Innes Rd Mahars Rd Nancy Ave 450 32 33 1 40 32 -8 32 37 5 35 34 -1
Innes Rd Nancy Ave Cranford St 508 144 165 21 79 85 6 40 77 37 88 109 21
Innes Rd Cranford St Rutland St 476 159 145 -14 38 41 3 42 38 -4 80 75 -5
Innes Rd Rutland St Papanui Rd 780 825 439 -386 131 168 37 170 179 9 375 262 -113
Heaton St Papanui Rd Allister Ave 504 669 50 -619 276 39 -237 80 49 -31 342 46 -296
Heaton St Allister Ave Strowan Rd 382 256 51 -205 192 28 -164 110 29 -81 186 36 -150
Glandovey Rd Strowan Rd Idris Rd 398 157 61 -96 178 48 -130 123 56 -67 153 55 -98
Idris Rd Glandovey Rd Wroxton Tce 227 163 23 -140 23 21 -2 23 21 -2 70 22 -48
Idris Rd Wroxton Tce Brandor Rd 202 66 15 -51 15 17 2 52 16 -36 44 16 -28
Idris Rd Brandor Rd Fendalton Rd 218 183 20 -163 62 38 -24 106 53 -53 117 37 -80
Straven Rd Fendalton Rd Rochdale St 376 93 145 52 167 91 -76 198 65 -133 153 100 -52
Straven Rd Rochdale St Kilmarnock St 459 121 156 35 117 114 -3 102 79 -23 113 116 3
Straven Rd Kilmarnock St Riccarton Rd 254 117 95 -22 81 79 -2 74 79 5 91 84 -6
Clarence St Riccarton Rd Peverel St 352 33 32 -1 39 35 -4 41 35 -6 38 34 -4
Clarence St Peverel St Blenheim Rd 437 64 87 23 65 63 -2 42 44 2 57 65 8
Whiteleigh Ave Blenheim Rd Rail crossing 452 44 85 41 137 82 -55 68 33 -35 83 67 -16
Whiteleigh Ave Rail crossing Lincoln Rd 567 52 52 0 48 44 -4 47 46 -1 49 47 -2
Barrington St Lincoln RdCSM (SH 73) East bound
254 21 20 -1 18 18 0 40 19 -21 26 19 -7
Barrington StCSM (SH 73) West bound
Heward St 410 31 31 0 30 34 4 40 32 -8 34 32 -1
Barrington St Heward St Wychbury St 466 37 37 0 36 35 -1 40 48 8 38 40 2
Barrington St Wychbury St Milton St 455 49 81 32 44 40 -4 44 38 -6 46 53 7
Barrington St Milton St Studholme St 488 37 42 5 40 39 -1 98 39 -59 58 40 -18
Barrington St Studholme St Cashmere Rd 767 67 80 13 90 64 -26 97 60 -37 85 68 -17
Lower post-implementation travel time Higher post-implementation travel time
AM Travel Times

Speeds: Southbound AMApril May Difference April May Difference April May Difference April May Difference
Road Name From To Length (m) Tuesday Tuesday Tuesday Wednesday Wednesday Wednesday Thursday Thursday Thursday Average Average Average
Innes Rd Hills Rd Mahars Rd 497 49 43 -6 42 43 0 45 41 -4 46 42 -3
Innes Rd Mahars Rd Nancy Ave 450 50 47 -3 39 48 9 49 43 -6 46 46 0
Innes Rd Nancy Ave Cranford St 508 12 11 -2 22 21 -2 45 23 -21 26 18 -8
Innes Rd Cranford St Rutland St 476 11 12 1 44 41 -3 40 44 4 32 32 1
Innes Rd Rutland St Papanui Rd 780 3 6 3 21 17 -4 16 15 -1 14 13 -1
Heaton St Papanui Rd Allister Ave 504 3 35 33 7 45 39 22 37 14 11 39 28
Heaton St Allister Ave Strowan Rd 382 5 27 21 7 48 41 12 46 33 8 40 32
Glandovey Rd Strowan Rd Idris Rd 398 9 23 14 8 29 22 11 25 14 9 26 16
Idris Rd Glandovey Rd Wroxton Tce 227 5 34 29 35 37 2 34 37 3 25 36 11
Idris Rd Wroxton Tce Brandor Rd 202 11 45 34 44 41 -2 13 44 30 23 43 21
Idris Rd Brandor Rd Fendalton Rd 218 4 37 33 12 20 8 7 14 7 8 24 16
Straven Rd Fendalton Rd Rochdale St 376 14 9 -5 8 15 7 7 21 14 10 15 5
Straven Rd Rochdale St Kilmarnock St 459 13 11 -3 14 14 0 16 21 5 14 15 1
Straven Rd Kilmarnock St Riccarton Rd 254 8 9 2 11 11 0 12 11 -1 10 11 0
Clarence St Riccarton Rd Peverel St 352 37 39 2 31 35 4 29 35 5 33 36 4
Clarence St Peverel St Blenheim Rd 437 25 18 -7 24 24 0 36 34 -2 28 25 -3
Whiteleigh Ave Blenheim Rd Rail crossing 452 36 19 -17 12 19 8 24 48 24 24 29 5
Whiteleigh Ave Rail crossing Lincoln Rd 567 39 39 0 42 45 3 42 44 1 41 43 2
Barrington St Lincoln RdCSM (SH 73) East bound
254 43 44 1 48 49 2 22 45 22 38 46 8
Barrington StCSM (SH 73) West bound
Heward St 410 46 45 -1 48 43 -5 36 45 9 43 44 1
Barrington St Heward St Wychbury St 466 44 44 0 46 47 1 41 34 -8 44 41 -2
Barrington St Wychbury St Milton St 455 33 20 -13 37 41 4 36 43 6 35 34 -1
Barrington St Milton St Studholme St 488 46 41 -5 44 44 1 18 44 27 36 43 7
Barrington St Studholme St Cashmere Rd 767 41 34 -7 30 43 12 28 46 17 33 41 8
Higher post-implementation travel speeds Lower post-implementation travel speeds
AM Travel Speeds
Travel Times: Northbound PMApril May Difference April May Difference April May Difference April May Difference
Road Name From To Length (m) Tuesday Tuesday Tuesday Wednesday Wednesday Wednesday Thursday Thursday Thursday Average Average Average
Barrington St Cashmere Rd Studholme St 773 80 72 -8 79 62 -17 67 61 -6 75 65 -10
Barrington St Studholme St Milton St 473 70 43 -27 56 39 -17 39 35 -4 55 39 -16
Barrington St Milton St Wychbury St 469 49 52 3 40 41 1 52 39 -13 47 44 -3
Barrington St Wychbury St Heward St 467 37 37 0 34 35 1 46 36 -10 39 36 -3
Barrington St Heward StCSM (SH 73) West bound
400 77 33 -44 84 80 -4 73 98 25 78 70 -8
Barrington StCSM (SH 73) East bound
Lincoln Rd 246 23 94 71 47 18 -29 273 128 -145 114 80 -34
Whiteleigh Ave Lincoln Rd Rail crossing 583 112 52 -60 100 216 116 388 71 -317 200 113 -87
Whiteleigh Ave Rail crossing Blenheim Rd 439 199 41 -158 173 219 46 239 151 -88 204 137 -67
Clarence St Blenheim Rd Peverel St 452 104 92 -12 104 237 133 175 138 -37 128 156 28
Clarence St Peverel St Riccarton Rd 341 188 208 20 162 152 -10 116 107 -9 155 156 0
Straven Rd Riccarton Rd Kilmarnock St 265 69 37 -32 38 25 -13 38 32 -6 48 31 -17
Straven Rd Kilmarnock St Rochdale St 456 104 36 -68 34 48 14 36 39 3 58 41 -17
Straven Rd Rochdale St Fendalton Rd 369 60 73 13 40 48 8 58 28 -30 53 50 -3
Idris Rd Fendalton Rd Brandor Rd 224 82 21 -61 57 130 73 19 19 0 53 57 4
Idris Rd Brandor Rd Wroxton Tce 206 86 78 -8 44 55 11 19 71 52 50 68 18
Idris Rd Wroxton Tce Glandovey Rd 215 104 87 -17 136 86 -50 115 133 18 118 102 -16
Glandovey Rd Idris Rd Strowan Rd 387 103 55 -48 38 39 1 33 35 2 58 43 -15
Heaton St Strowan Rd Allister Ave 393 131 31 -100 137 48 -89 178 35 -143 149 38 -111
Heaton St Allister Ave Papanui Rd 495 153 40 -113 312 248 -64 316 221 -95 260 170 -91
Innes Rd Papanui Rd Rutland St 784 81 65 -16 72 68 -4 60 82 22 71 72 1
Innes Rd Rutland St Crandord St 477 277 183 -94 50 136 86 41 162 121 123 160 38
Innes Rd Crandord St Nancy Ave 521 44 42 -2 42 42 0 35 42 7 40 42 2
Innes Rd Nancy Ave Mahars Rd 451 36 36 0 44 38 -6 32 42 10 37 39 1
Innes Rd Mahars Rd Hills Rd 489 37 39 2 37 42 5 41 47 6 38 43 4
Lower post-implementation travel time Higher post-implementation travel time
PM Travel Times

Speeds: Northbound PMApril May Difference April May Difference April May Difference April May Difference
Road Name From To Length (m) Tuesday Tuesday Tuesday Wednesday Wednesday Wednesday Thursday Thursday Thursday Average Average Average
Barrington St Cashmere Rd Studholme St 773 34 38 4 35 44 10 41 45 4 37 42 6
Barrington St Studholme St Milton St 473 24 38 14 30 43 13 43 47 4 32 43 10
Barrington St Milton St Wychbury St 469 34 32 -2 41 41 -1 32 42 10 36 38 3
Barrington St Wychbury St Heward St 467 45 44 -1 47 47 0 35 46 11 42 46 3
Barrington St Heward StCSM (SH 73) West bound
400 18 43 24 17 18 1 19 14 -5 18 25 7
Barrington StCSM (SH 73) East bound
Lincoln Rd 246 38 9 -29 18 44 26 3 7 4 20 20 0
Whiteleigh Ave Lincoln Rd Rail crossing 583 19 40 21 21 10 -11 5 29 24 15 26 11
Whiteleigh Ave Rail crossing Blenheim Rd 439 8 38 31 9 7 -2 6 10 4 8 19 11
Clarence St Blenheim Rd Peverel St 452 15 17 2 15 7 -9 9 12 3 13 12 -1
Clarence St Peverel St Riccarton Rd 341 6 6 -1 7 8 1 10 11 1 8 8 0
Straven Rd Riccarton Rd Kilmarnock St 265 13 25 12 24 38 14 24 29 5 20 31 10
Straven Rd Kilmarnock St Rochdale St 456 16 44 29 46 33 -12 45 41 -4 35 39 4
Straven Rd Rochdale St Fendalton Rd 369 22 17 -4 32 27 -5 22 45 23 25 30 4
Idris Rd Fendalton Rd Brandor Rd 224 10 37 28 14 6 -8 39 41 3 21 28 8
Idris Rd Brandor Rd Wroxton Tce 206 8 9 1 16 13 -3 37 10 -26 20 11 -10
Idris Rd Wroxton Tce Glandovey Rd 215 7 9 1 6 9 3 7 6 -1 7 8 1
Glandovey Rd Idris Rd Strowan Rd 387 13 25 11 36 35 -1 41 39 -2 30 33 3
Heaton St Strowan Rd Allister Ave 393 11 44 34 10 29 19 8 39 31 10 37 28
Heaton St Allister Ave Papanui Rd 495 12 44 33 6 7 2 6 8 2 8 20 12
Innes Rd Papanui Rd Rutland St 784 34 43 9 39 41 2 46 34 -12 40 40 0
Innes Rd Rutland St Crandord St 477 6 9 3 33 12 -21 40 10 -30 27 11 -16
Innes Rd Crandord St Nancy Ave 521 42 44 2 43 43 0 52 44 -9 46 44 -2
Innes Rd Nancy Ave Mahars Rd 451 44 44 0 36 42 5 49 38 -11 43 41 -2
Innes Rd Mahars Rd Hills Rd 489 47 45 -3 47 41 -6 43 37 -6 46 41 -5
Higher post-implementation travel speeds Lower post-implementation travel speeds
PM Travel Speeds

Travel Times: Southbound PMApril May Difference April May Difference April May Difference April May Difference
Road Name From To Length (m) Tuesday Tuesday Tuesday Wednesday Wednesday Wednesday Thursday Thursday Thursday Average Average Average
Innes Rd Hills Rd Mahars Rd 497 37 40 3 38 42 4 36 46 10 37 43 6
Innes Rd Mahars Rd Nancy Ave 450 37 34 -3 32 34 2 32 42 10 34 37 3
Innes Rd Nancy Ave Crandord St 508 35 80 45 43 79 36 65 82 17 48 80 33
Innes Rd Crandord St Rutland St 476 35 37 2 37 44 7 42 58 16 38 46 8
Innes Rd Rutland St Papanui Rd 780 58 97 39 91 102 11 72 72 0 74 90 17
Heaton St Papanui Rd Allister Ave 504 43 40 -3 51 40 -11 49 59 10 48 46 -1
Heaton St Allister Ave Strowan Rd 382 33 37 4 28 55 27 38 67 29 33 53 20
Glandovey Rd Strowan Rd Idris Rd 398 34 85 51 70 37 -33 49 56 7 51 59 8
Idris Rd Glandovey Rd Wroxton Tce 227 18 21 3 17 20 3 19 20 1 18 20 2
Idris Rd Wroxton Tce Brandor Rd 202 14 15 1 14 15 1 16 17 1 15 16 1
Idris Rd Brandor Rd Fendalton Rd 218 33 43 10 15 22 7 25 44 19 24 36 12
Straven Rd Fendalton Rd Rochdale St 376 29 29 0 25 28 3 25 29 4 26 29 2
Straven Rd Rochdale St Kilmarnock St 459 132 96 -36 76 59 -17 73 51 -22 94 69 -25
Straven Rd Kilmarnock St Riccarton Rd 254 212 22 -190 145 19 -126 35 96 61 131 46 -85
Clarence St Riccarton Rd Peverel St 352 137 41 -96 81 91 10 47 224 177 88 119 30
Clarence St Peverel St Blenheim Rd 437 148 132 -16 227 121 -106 73 115 42 149 123 -27
Whiteleigh Ave Blenheim Rd Rail crossing 452 349 325 -24 288 319 31 347 240 -107 328 295 -33
Whiteleigh Ave Rail crossing Lincoln Rd 567 73 96 23 147 171 24 82 110 28 101 126 25
Barrington St Lincoln RdCSM (SH 73) East bound
254 78 19 -59 33 18 -15 18 21 3 43 19 -24
Barrington StCSM (SH 73) West bound
Heward St 410 43 31 -12 67 57 -10 28 39 11 46 42 -4
Barrington St Heward St Wychbury St 466 39 39 0 47 216 169 33 106 73 40 120 81
Barrington St Wychbury St Milton St 455 197 84 -113 96 241 145 206 219 13 166 181 15
Barrington St Milton St Studholme St 488 37 39 2 48 40 -8 43 38 -5 43 39 -4
Barrington St Studholme St Cashmere Rd 767 87 207 120 82 70 -12 98 113 15 89 130 41
Lower post-implementation travel time Higher post-implementation travel time
PM Travel Times

Speeds: Southbound PMApril May Difference April May Difference April May Difference April May Difference
Road Name From To Length (m) Tuesday Tuesday Tuesday Wednesday Wednesday Wednesday Thursday Thursday Thursday Average Average Average
Innes Rd Hills Rd Mahars Rd 497 47 44 -3 46 42 -4 48 38 -10 47 41 -6
Innes Rd Mahars Rd Nancy Ave 450 44 46 3 48 47 -1 48 37 -11 47 43 -3
Innes Rd Nancy Ave Crandord St 508 51 22 -29 42 23 -19 28 22 -6 40 22 -18
Innes Rd Crandord St Rutland St 476 48 46 -3 46 38 -8 40 29 -11 45 38 -7
Innes Rd Rutland St Papanui Rd 780 48 29 -19 31 27 -4 39 38 0 39 31 -8
Heaton St Papanui Rd Allister Ave 504 41 45 4 35 44 9 36 30 -5 37 40 2
Heaton St Allister Ave Strowan Rd 382 40 36 -4 47 24 -23 35 20 -15 41 27 -14
Glandovey Rd Strowan Rd Idris Rd 398 42 17 -25 20 38 18 29 25 -4 30 27 -4
Idris Rd Glandovey Rd Wroxton Tce 227 44 37 -7 45 39 -6 40 39 -1 43 38 -4
Idris Rd Wroxton Tce Brandor Rd 202 49 45 -3 48 47 0 42 42 1 46 45 -1
Idris Rd Brandor Rd Fendalton Rd 218 23 17 -6 48 34 -14 31 17 -14 34 22 -11
Straven Rd Fendalton Rd Rochdale St 376 44 45 1 53 46 -6 52 45 -7 50 45 -4
Straven Rd Rochdale St Kilmarnock St 459 12 17 5 21 28 7 22 32 9 18 25 7
Straven Rd Kilmarnock St Riccarton Rd 254 4 39 35 6 45 39 26 9 -17 12 31 19
Clarence St Riccarton Rd Peverel St 352 9 30 21 15 14 -2 26 6 -21 17 16 -1
Clarence St Peverel St Blenheim Rd 437 10 12 1 7 13 6 21 14 -8 13 13 0
Whiteleigh Ave Blenheim Rd Rail crossing 452 5 5 0 6 5 0 5 7 2 5 6 1
Whiteleigh Ave Rail crossing Lincoln Rd 567 28 21 -6 14 12 -2 24 18 -6 22 17 -5
Barrington St Lincoln RdCSM (SH 73) East bound
254 12 47 35 27 47 20 48 41 -7 29 45 16
Barrington StCSM (SH 73) West bound
Heward St 410 33 45 12 22 25 3 51 38 -13 35 36 1
Barrington St Heward St Wychbury St 466 42 41 -1 35 8 -27 50 16 -34 42 22 -21
Barrington St Wychbury St Milton St 455 8 19 11 17 7 -10 8 7 0 11 11 0
Barrington St Milton St Studholme St 488 47 44 -2 36 43 7 41 45 4 41 44 3
Barrington St Studholme St Cashmere Rd 767 31 13 -18 33 39 6 28 24 -4 31 26 -5
Higher post-implementation travel speeds Lower post-implementation travel speeds
PM Travel Speeds
Related Documents

![INDEX [resources.ccc.govt.nz]resources.ccc.govt.nz/files/TheCouncil/policiesreportsstrategies/... · INDEX PART ONE: BRIEF ... civic square for the purpose of community gathering,](https://static.cupdf.com/doc/110x72/5aac91207f8b9aa9488d29fb/index-part-one-brief-civic-square-for-the-purpose-of-community-gathering.jpg)


