Post-Depression Economics Neal Solomon† The essay presents the argument that the U.S. experienced a shallow economic depression in 2007-9 reminiscent of pre-war economic contractions. The economic data are analyzed to show that the downturn was more severe than any previous post-war downturn. Though technically over, the severity of the depression has led to extremely slow growth and a protracted period of high unemployment. The policies of the 2000s and the concentrated industrial structure they spawned are shown to have contributed to the severity of the downturn and to the slow recovery. The Keynesian and libertarian schools of economic thought are discussed in the context of their roles in offering prescriptions for improving economic growth. The essay critiques the academic economics profession for not predicting the downturn or providing useful prescriptions for solving economic problems. It is shown that China’s policies created a monetary and trade environment in the 2000s for the depression and that they are constraining economic growth as the U.S. exits the depression. A number of policy prescriptions are provided to improve economic growth. These best practices include constraining federal government spending, adjusting and balancing tax, competition, trade and intellectual property policies, promoting investment, education and innovation policies, and modulating Fed monetary policy. Index Introduction: What Happened to America? 2 Economic Analysis of the Downturn 5 Was the Downturn a Recession or a Depression? 13 This Time IS Different 25 Causes and Consequences of the Depression 36 The Rise of China 45 Policy Factors in the Economic Bubble and Aftermath 49 Redefining Conservatism 57 Failed Economics 62 Policy Prescriptions 66 List of Figures 78 List of Charts 78 Bibliography 79 † B.A., Reed College, 1981; A. M., University of Chicago, 1982; CEO, Advanced System Technologies, Inc. © 2010 by N eal Solomon. All rights reserv ed.

Welcome message from author
This document is posted to help you gain knowledge. Please leave a comment to let me know what you think about it! Share it to your friends and learn new things together.
Transcript
8/2/2019 Post Depression Economics
http://slidepdf.com/reader/full/post-depression-economics 1/82
Post-Depression Economics
Neal Solomon†
The essay presents the argument that the U.S. experienced a shallow economic depression in2007-9 reminiscent of pre-war economic contractions. The economic data are analyzed to showthat the downturn was more severe than any previous post-war downturn. Though technicallyover, the severity of the depression has led to extremely slow growth and a protracted period of high unemployment.
The policies of the 2000s and the concentrated industrial structure they spawned are shown tohave contributed to the severity of the downturn and to the slow recovery. The Keynesian andlibertarian schools of economic thought are discussed in the context of their roles in offeringprescriptions for improving economic growth. The essay critiques the academic economicsprofession for not predicting the downturn or providing useful prescriptions for solving
economic problems.
It is shown that China’s policies created a monetary and trade environment in the 2000s for thedepression and that they are constraining economic growth as the U.S. exits the depression.
A number of policy prescriptions are provided to improve economic growth. These bestpractices include constraining federal government spending, adjusting and balancing tax,competition, trade and intellectual property policies, promoting investment, education andinnovation policies, and modulating Fed monetary policy.
Index
Introduction: What Happened to America? 2Economic Analysis of the Downturn 5Was the Downturn a Recession or a Depression? 13This Time IS Different 25Causes and Consequences of the Depression 36The Rise of China 45Policy Factors in the Economic Bubble and Aftermath 49Redefining Conservatism 57Failed Economics 62Policy Prescriptions 66
List of Figures 78List of Charts 78Bibliography 79____________
† B.A., Reed College, 1981; A.M., University of Chicago, 1982; CEO, Advanced System Technologies, Inc.
© 2010 by Neal Solomon. All rights reserved.

8/2/2019 Post Depression Economics
http://slidepdf.com/reader/full/post-depression-economics 2/82
Post-Depression Economics
- 2 -
Introduction: What Happened to America?
“After the most severe recession since the 1930s, the U.S. economy appears to berecovering. Real (inflation-adjusted) gross domestic product (GDP) grew during thethird quarter of 2009, after having fallen 3.7 percent since the recession began in thefourth quarter of 2007. However, the economy’s output is still about 7 percent belowthe Congressional Budget Office’s (CBO’s) estimate of potential GDP—the outputthe economy would produce if its resources were fully employed. From December2007 to December 2009, the unemployment rate jumped from 4.9 percent to 10.0percent, and payrolls fell by about 7.2 million jobs. Moreover, if employment hadgrowth during this period at the same rate at which it had growth from 1990 to 2007,millions of additional jobs would have been added to the economy during that period;all told, the recession has lowered employment by about 11 million relative to what itwould otherwise be. Nearly all professional forecasters believe that the economy haspassed the trough of the recession, but many also predict that the pace of the recoverywill be slow.” [CBO, Policies for Increased Economic Growth and Employment
in 2010 and 2011, p. 1, 2010]
In 2000, the U.S. government experienced record federal budget surpluses and the federal
debt was being paid down. Middle class wages were growing and economic growth was strong.
Industrial corporations experienced a productivity revolution with robust profits and high
competition. Unemployment and poverty rates were at historic lows.
In 2010, the U.S. government experienced record federal budget deficits while adding to
an extraordinary federal debt. The unemployment rate peaked at 10.6% and industrial capacity
was at a record post-war low. With a poverty rate of 14.3%, 44.3 million people were in
poverty. Industry concentration was at a peak and income structures were more stratified than at
any time since 1928. High commodity prices from a commodity bubble in 2008 squeezed an
already strained middle class. Remarkably, real median income of $49,777 in 2009 was lower
than in 2000. The U.S. education system did not make the top 10 list among industrial countries.
And, two significant wars were being wound down.
What happened in such a short time? America obviously witnessed the consequences of
the application of a “conservative” economic and social experiment. To identify the solutions to
the economic problems, it is essential to understand the anatomy and sources of the problems.
8/2/2019 Post Depression Economics
http://slidepdf.com/reader/full/post-depression-economics 3/82
Post-Depression Economics
- 3 -
There is no debate about the fact that the United States experienced a significant
economic downturn. There is considerable controversy, however, about the technical
classification of the downturn. Was it a recession or a depression? Are we still in the downturn?
What policy programs got us into the problems and what policy programs are most likely to
improve economic conditions? These questions require historical and analytical insight to
answer.
A thesis of this essay is that the U.S. was in, and is recovering from, a shallow economic
depression. While there are numerous technical factors that require analysis to understand the
scale and scope of the economic contraction and aftermath, the present analysis seeks to clarify
the economic events of 2007-9 and its recovery. The evidence reveals that the U.S. is in a major
historical economic structural transformation. In addition to the empirical evidence about the
U.S. economy in the last few years, evidence about the international economy shows several
factors that influence the U.S. economic picture.
The main argument is that the U.S. adopted policies in the 2000’s that led to a sharp
economic contraction with a “long tail” that is caused by the process of continued deleveraging
of debt from a substantial financial bubble. This process of GDP decline and deleveraging was
complicated, and aggravated, by a financial industry crisis, which was apt to prolong economic
growth prospects. During this long recovery period, unemployment and debt levels are likely to
remain high while housing prices and industrial capacity are likely to have downward pressure
from a protracted period of constrained demand. Further, the evidence suggests that the U.S. is
in a pre-war type of shallow economic depression that, even after heroic policy actions, now
constrains government policy makers to engineer near-term economic solutions and thereby
protracts the downturn. In the environment of the long tail, federal government political
paralysis and Federal Reserve policy constraints will likely limit significant economic growth.
8/2/2019 Post Depression Economics
http://slidepdf.com/reader/full/post-depression-economics 4/82
Post-Depression Economics
- 4 -
While there is little controversy about the economic depression in the housing sector, the
long-term effects of the housing bubble are detrimental to consumers and economic growth.
Furthermore, while the housing bubble and economic contraction are indisputable, perhaps more
problematic are the facts about the erosion of the middle class during the 2000’s. Economic
pressures have resulted in a fundamental restructuring of the composition of the middle class.
The effect of these changes is to increase the stratification of American society, with the top 1%
responsible for 23%, and the top tenth of 1% responsible for 11%, of income in 2007. However,
it is argued that stratification is the effect, not the cause, of economic challenges and that a
consequence of increased stratification is increased economic instability.
The parallels between the economic policies of the 1920’s and the 2000’s are very
similar.1 It should be no surprise, then, that the consequences of these policies lead to financial
crises and economic instability.
While the U.S. experienced a housing bubble, a middle class decline and an economic
depression, China experienced an economic Renaissance in the 2000s. It is argued that China’s
rise had adverse effects on the U.S. economy during this period.
Though the economics profession largely failed to predict the downturn, whether because
of increased specialization, an overemphasis on math, a lack of policy or historical experience, or
1 Income inequality is similar when comparing the 1920s and 2000s. “Income disparities before [the1929] crisis and before the recent one were the greatest in approximately the last 100 years. In 1928, thetop 10 percent of earners received 49.29 percent of total income. In 2007, the top 10 percent earned a
strikingly similar percentage: 49.74%. In 1928, the top 1 percent received 23.94 percent of income. In2007, those earners received 23.5 percent.” Story, L., “Income Inequality and Financial Crises,” NYT,2010 [drawing parallels between economic conditions of the Depression and the recent downturn]. Realmedian household income was $21.7K in 1947, $28K in 1977 and $50.2K in 2007, according to U.S.Census Bureau data. In 1977, the top 1 percent of the top 1 percent earned $2M and by 2009, the top.01% earned $11.5M, showing far faster growth at the top. See Atkinson, T. and T. Piketty, Top Incomes
Over the Twentieth Century: A Contrast Between Continental European and English-speaking Countries,2007 [showing 20th century income patterns between several countries] and; Saez, E. and T. Piketty,“Income Inequality in the United States, 1913-1998,” Quarterly J. of Economics, 2003 [showing 20th
century U.S. income inequality patterns].

8/2/2019 Post Depression Economics
http://slidepdf.com/reader/full/post-depression-economics 5/82
Post-Depression Economics
- 5 -
ideological biases, it is crucial to analyze empirical economic data and economic policy in order
to develop cogent, pragmatic and bipartisan policy prescriptions.
Economic Analysis of the Downturn
Chart 1 shows GDP changes from the third quarter of 2007 to the third quarter of 2010.
Chart 1
U.S. Gross Domestic Product (Trillions of dollars)
2007III
2007
IV
2008
I
2008
II
2008
III
2008
IV
2009
I
2009
II
2009III
2009IV
2010I
2010II
2010III
13.95 14.03 14.37 14.49 14.54 14.34 14.05 14.03 14.11 14.28 14.45 14.57 14.68*
Source: Federal Reserve Flow of Funds Report [F.6 “Distribution of Gross Domestic Product: 9/18/08,9/17/09 and 9/17/10] * Projected
The economy grew very slowly from the fourth quarter of 2007 to the third quarter of
2008. The financial crisis that was triggered by the failure of Lehman Brothers in September of
2008 shows a decline of 4.2%2 in the fourth quarter of 2008, a decline of 8% in the first quarter
of 2009 and a decline of .7% in the second quarter of 2009. The economy then grew 1.6% in the
third quarter of 2009 and 5% in the fourth quarter of 2009. 2007 had a growth rate of about
2.5%, 2008 experienced a decline of 2.7% and 2009 had a growth rate of .2%. From the third
quarter of 2008 to the second quarter of 2009, however, the economy declined at a 4.1%
annualized rate, the largest and most protracted post-war economic decline.3
2 The economic growth and decline data are annualized.3 If the U.S. economy had grown at 5% a year from 2007 to 2011, GDP would be $17T at the end of 2010, rather than its actual $15T. Therefore, the U.S. economy lost about thirteen percent of its potentialgrowth in the downturn in a three year period.
8/2/2019 Post Depression Economics
http://slidepdf.com/reader/full/post-depression-economics 6/82
Post-Depression Economics
- 6 -
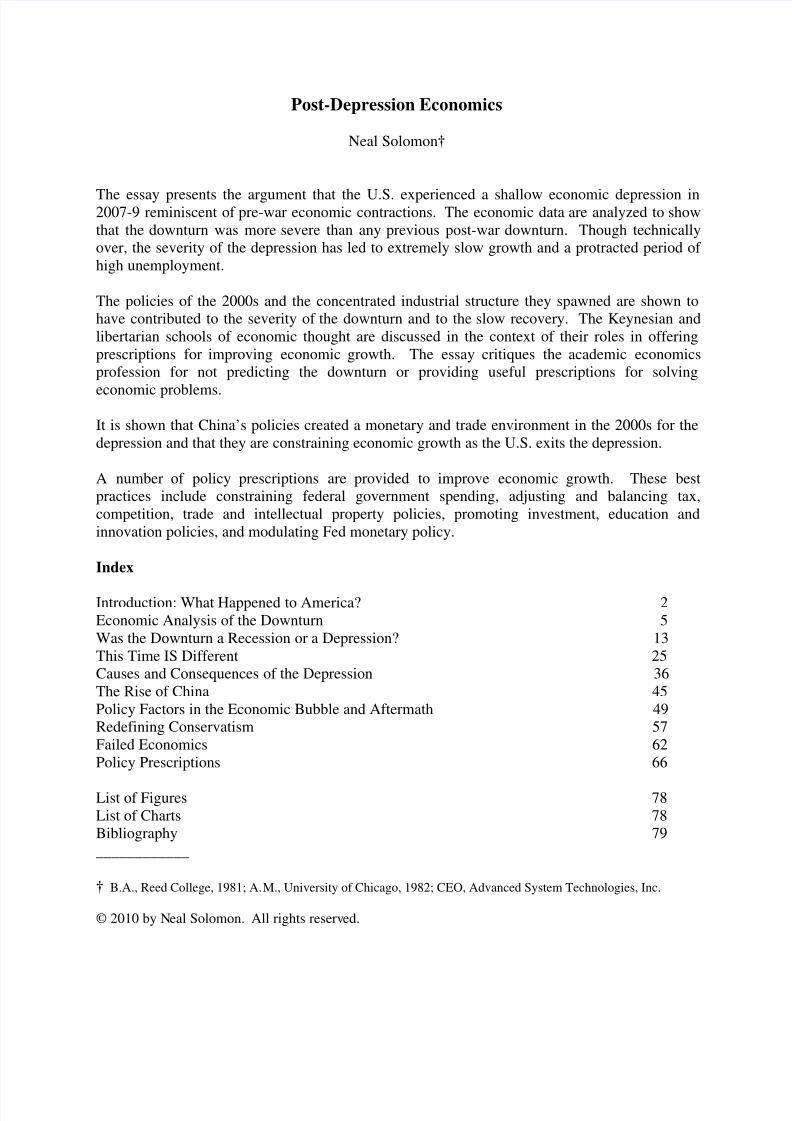
Figure 1
Relative GDP Decline of 2007-9 Downturn
Figure 1 shows the 2007-9 downturn GDP decline relative to post-war recessions. The chart
illustrates the relative severity of the downturn in technical terms. Both the length (18 months)
and depth (negative 4.1% GDP) show a severe contraction.
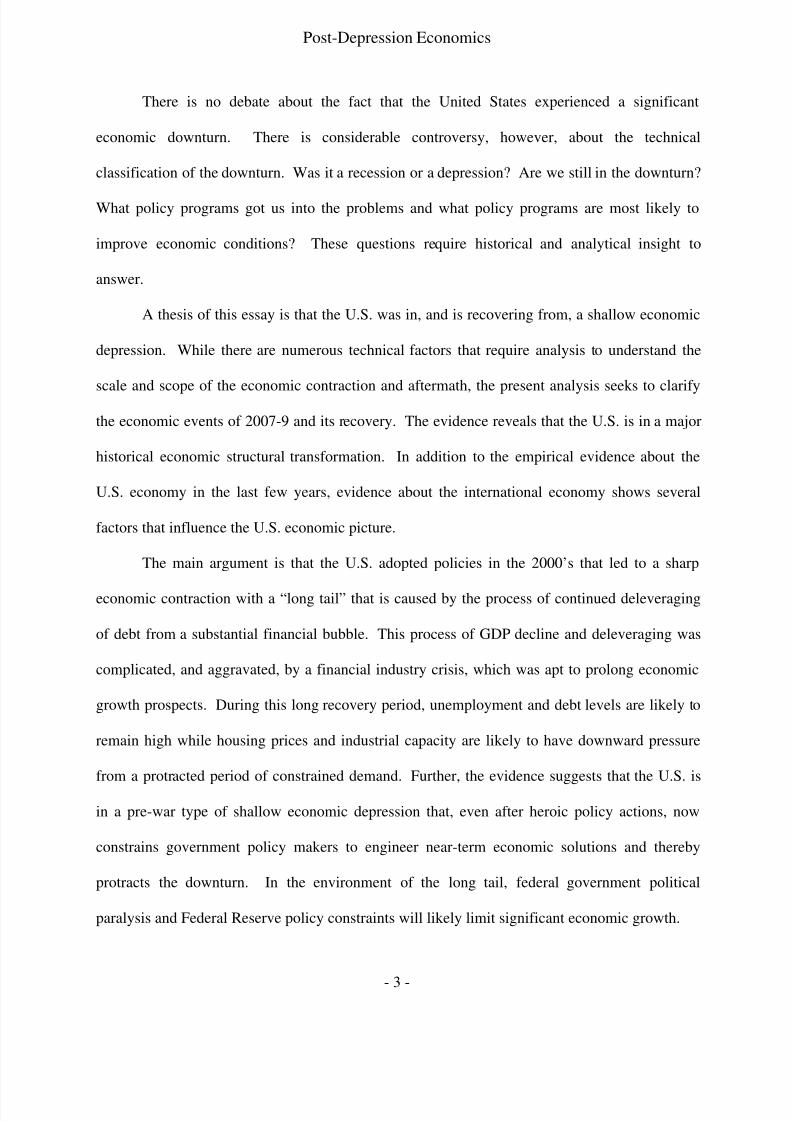
Chart 2
Total Net Worth 2007-2010
2007I
2007II
2007III
2007
IV
2008
I
2008
II
2008
III
2008
IV
2009
I
2009II
2009III
2009IV
2010I
2010
II
56.8 58 58.7 58.1 61.4 60.6 57.8 52.9 48.8 50.5 53 53.6 55 53.5
Source: Federal Reserve Flow of Funds Report [B.100 “Balance Sheet of Households and NonprofitOrganizations” 9/18/08, 9/17/09 and 9/17/10]
Chart 2 shows the total net worth data. These data reveal a much more substantial 19%
decline in the one year period from the second quarter of 2008 to the first quarter of 2009. The
8.4% decline from the third quarter of 2008 to the fourth quarter was the largest quarterly drop
since record keeping in 1951, reflecting the financial crisis in the immediate aftermath of the

8/2/2019 Post Depression Economics
http://slidepdf.com/reader/full/post-depression-economics 7/82
Post-Depression Economics
- 7 -
failure of Lehman Brothers. This was followed by a 7.7% decline in the first quarter of 2009.
While the GDP data reflect public and private spending and show federal government spending
comprising a disproportionately larger share, the net worth data show a very severe downturn
that affected the private sector.4 The contraction in net worth from the fourth quarter of 2007 to
the third quarter of 2009 more clearly maps the extent of the downturn. According to this data, it
will take three and a half more years (early 2014) at a five percent annual growth rate to return to
the peak level of net worth shown in the first quarter of 2008.
Figure 2
Total Household Net Worth
Figure 2 graphically shows the relative decline in net worth since 1952. This illustrates
several post-war recessions, but the extraordinary decline of 2008-9 is illustrated at the right side.
The 2000s are shown as the “V” immediately prior to the precipitous decline.
4 The decline in net worth in the fourth quarter of 2008 and first quarter of 2009 reflected the drop invalue in the prices of both real estate and equities.

8/2/2019 Post Depression Economics
http://slidepdf.com/reader/full/post-depression-economics 8/82
Post-Depression Economics
- 8 -
The U.S. equity markets declined significantly in the downturn, with the Dow dropping
from about $14,000 in 2007 to about $6,500 in March, 2009, for a total decline of 53%,
comparable to the peak post-war decline in 1973-4.
Figure 3
S&P 500 [September 2007 to September 2010]
Source: S&P 500
Figure 3 shows S&P 500 data from September, 2007 to September, 2010. The equity
markets have been in a relatively narrow trading range during much of late 2009 and 2010,
reflecting the realities of slow expected economic growth. Note that it took the Dow Jones
Industrials twenty three years to return to its October, 1929, levels.5
The unemployment rate, however, rose rapidly beginning in the third quarter of 2008.
According to the U.S. Bureau of Labor Statistics, the unemployment rate moved from 4.6% in
2007, to 5.8% in 2008, 9.3% in 2009 and 9.9% in 2010. The unemployment rate peaked at
10.6% in March of 2010. This shows that while the economy grew nominally in the third quarter
5 The NASDAQ peaked at 5050 in March, 2000 and was about half of this level in 2010, suggesting thepotential for several more years to return to its peak level. The NASDAQ may be tracking the Dow’s1930s and 1940s performance.

8/2/2019 Post Depression Economics
http://slidepdf.com/reader/full/post-depression-economics 9/82
Post-Depression Economics
- 9 -
of 2009, unemployment was increasing to a peak level before declining in April of 2010.6 The
aftereffects of the downturn show a long tail in which unemployment continues to be unusually
high after the technical end of the downturn.7
Figure 4
Job Losses in Recent Recessions, as a Share of Employment
6 To show the relative severity of the depression, the total number of unemployed in 2008-10 was greaterthan in the downturns of 1981-2, 1990-1 and 2001 combined. While these data show the generalunemployment rate, the actual rate may be higher since those who are underemployed or who stoppedlooking are not counted. The Bureau of Labor Statistics indicated that the real unemployment rate peakedin 2010 at 16.6% (26M people) including underemployed and discouraged workers. An average of five
individuals applied for each job opening in 2010, the worst percentage since the 1930s.7 Poverty in the U.S. increased to its highest level – over 14% – since records were kept in the 1960s.An estimated twenty percent of children were in poverty. An eighth of Americans were on food stamps.The reason that our cities do not have Hoover town encampments of homeless and soup lines is that NewDeal and Great Society federal programs of unemployment insurance, food stamps, Welfare and socialsecurity provide a crucial social safety net. The idea of unraveling the safety net as a way to increaseeconomic efficiency and to save money is to shift risk onto individuals’ at their most vulnerable time,leading to nasty, brutish and short lives in a disintegrated post-industrial modern society. In the absenceof economic growth, the U.S. government maintains the burden of responsibility for surplus labor, whichpresents an economic conundrum in the long-run.

8/2/2019 Post Depression Economics
http://slidepdf.com/reader/full/post-depression-economics 10/82
Post-Depression Economics
- 10 -
Source: U.S. Department of Labor
Figure 4 shows the extraordinary unemployment decline in the 2007-9 downturn
compared to several prior recessions. The aggregate unemployment decline show the worst
downturn since the Great Depression.
Figure 5
Case Shiller Index
Source: S&P/Case Shiller Home Price Index
Housing price data show a substantial market decline as well. In the U.S., California,
Arizona, Florida, Nevada, Michigan and Ohio were particularly affected by the housing
contraction. In the aggregate, the U.S. experienced a dramatic housing price decline of over
30%, shown in figure 5, mainly driven by the oversupply of homes from record foreclosures.
The depression was not isolated to the U.S. World trade data – with declines of 12.2%
from 2008 to 2009 – also reflect a severe contraction akin to an economic depression. These
data are mirrored in commodity price declines from 2008 to 2010 and in industrial capacity data.

8/2/2019 Post Depression Economics
http://slidepdf.com/reader/full/post-depression-economics 11/82
Post-Depression Economics
- 11 -
Figure 6
Volume of World Merchandise Exports, 1965-2009
Source: WTO Secretariat
Figure 6 shows a 12.2% contraction in the volume of global trade from 2008 to 2010, the
worst post-war trade contraction.
Figure 7
Real GDP and Trade Growth of OECD Countries, 2008-9
Source: OECD Quarterly National Accounts
Figure 7 shows an even larger trade decline among Organisation of Economic Co-
operation and Development (OECD) countries, with corresponding GDP declines. Note that,
though global trade declined 12.2%, trade in the OECD countries – in both imports and exports –
declined at a sharper 15% from Q3 2008 to Q2 2009.
8/2/2019 Post Depression Economics
http://slidepdf.com/reader/full/post-depression-economics 12/82
Post-Depression Economics
- 12 -
Figure 8
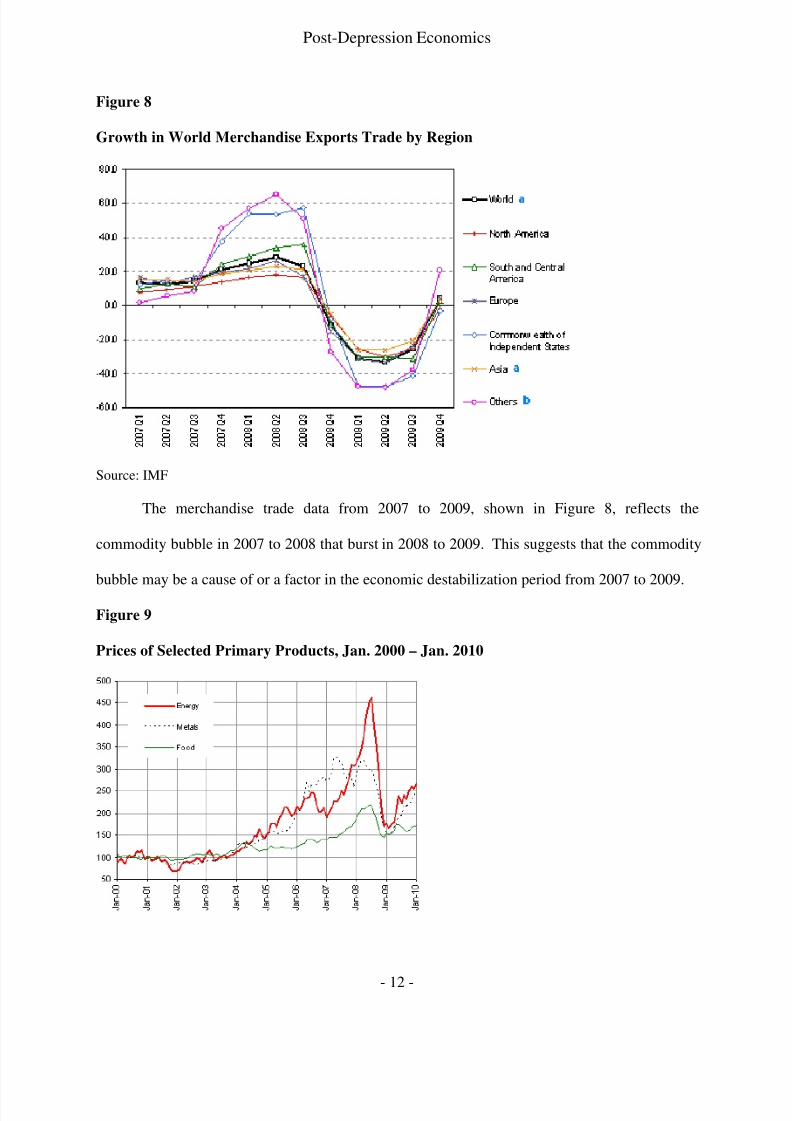
Growth in World Merchandise Exports Trade by Region
Source: IMF
The merchandise trade data from 2007 to 2009, shown in Figure 8, reflects the
commodity bubble in 2007 to 2008 that burst in 2008 to 2009. This suggests that the commodity
bubble may be a cause of or a factor in the economic destabilization period from 2007 to 2009.
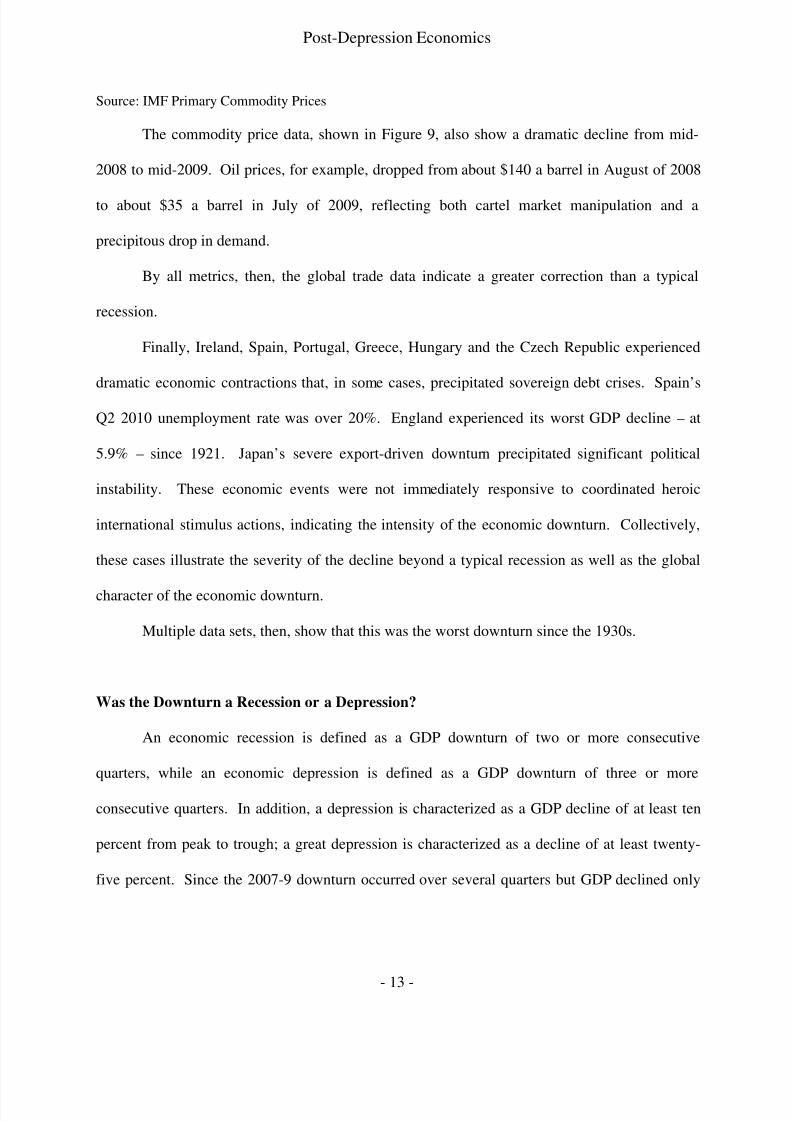
Figure 9
Prices of Selected Primary Products, Jan. 2000 – Jan. 2010
8/2/2019 Post Depression Economics
http://slidepdf.com/reader/full/post-depression-economics 13/82
Post-Depression Economics
- 13 -
Source: IMF Primary Commodity Prices
The commodity price data, shown in Figure 9, also show a dramatic decline from mid-
2008 to mid-2009. Oil prices, for example, dropped from about $140 a barrel in August of 2008
to about $35 a barrel in July of 2009, reflecting both cartel market manipulation and a
precipitous drop in demand.
By all metrics, then, the global trade data indicate a greater correction than a typical
recession.
Finally, Ireland, Spain, Portugal, Greece, Hungary and the Czech Republic experienced
dramatic economic contractions that, in some cases, precipitated sovereign debt crises. Spain’s
Q2 2010 unemployment rate was over 20%. England experienced its worst GDP decline – at
5.9% – since 1921. Japan’s severe export-driven downturn precipitated significant political
instability. These economic events were not immediately responsive to coordinated heroic
international stimulus actions, indicating the intensity of the economic downturn. Collectively,
these cases illustrate the severity of the decline beyond a typical recession as well as the global
character of the economic downturn.
Multiple data sets, then, show that this was the worst downturn since the 1930s.
Was the Downturn a Recession or a Depression?
An economic recession is defined as a GDP downturn of two or more consecutive
quarters, while an economic depression is defined as a GDP downturn of three or more
consecutive quarters. In addition, a depression is characterized as a GDP decline of at least ten
percent from peak to trough; a great depression is characterized as a decline of at least twenty-
five percent. Since the 2007-9 downturn occurred over several quarters but GDP declined only
8/2/2019 Post Depression Economics
http://slidepdf.com/reader/full/post-depression-economics 14/82
Post-Depression Economics
- 14 -
4.1%, it is generally seen as a severe recession, the so-called “Great Recession.”8 I have
suggested using the word “repression” to show an intermediary position between a recession and
a depression. However, the net worth, housing, trade, and industrial capacity declines of 12-30%
and the extraordinary unemployment data suggest that the contraction was more severe than a
recession. For example, the present downturn experienced an aggregate unemployment (viz.,
over 15M people) of greater than those in all of the last three recessions combined, including the
severe recessions of 1981-2 and 1990-1. The extraordinary unemployment data simply point to
the extreme depth and intensity of the fall-off of industrial production.9
There is some controversy about precisely when the contraction occurred. According to
Federal Reserve data, the contraction in GDP occurred from Q3 of 2008 (Lehman Brothers
collapse) to Q2 of 2009. This would provide a term of ten months. On the other hand, the
National Bureau of Economic Research (NBER) places the contraction period beginning in
December of 2007 and running to June of 2009 for a total of 18 months. If, however, the U.S.
economy did not come out of the contraction, based on NBER data, until Q1 of 2010 when
unemployment peaked at 10.6% in March, 2010.10 The period from December, 2007, to March,
2010, would constitute a 28 month contraction period if one includes the phase of the downturn
that accommodates the peak of unemployment. However, whether using the NBER 18 month
8 In 1931, Herbert Hoover used the term “Great Depression” to distinguish the severity of the economiccontraction to other events in recent historical memory. In 1981, the Reagan administration used the term“Great Recession” to describe the relative severity of the economic downturn at that time. The economiccontraction from 2007 to 2009 could be characterized as neither a “recession” nor as a “Great
Depression,” thus suggesting that the terms “depression” or “shallow depression” are more accuratedescriptions.9 See Barro, R. and J. Ursua, “Stock-Market Crashes and Depressions,” NBER Working Paper W14760,2009 [showing links between financial crises and economic contractions] and; Barro, R. and J. Ursua,“Macroeconomic Crises since 1870,” NBER Working Paper W13940, 2008 [analyzing post-Civil Wareconomic cycles].10 If the economy contracts from Q2 of 2010 to Q2 of 2011, following a trend of weak housing data andhigh unemployment, then the contraction period may be interpreted as qualifying as a “double diprecession” or as a continuous depression of up to 42 months. The evidence shows a net worth decline inthe third quarter of 2010 providing the prospect of a continuation of the contraction.
8/2/2019 Post Depression Economics
http://slidepdf.com/reader/full/post-depression-economics 15/82
Post-Depression Economics
- 15 -
mark or the 28 month mark that factors in a period to the peak phase of unemployment, the
downturn was empirically the worst continuous period of economic contraction since 1929-32.
In retrospect, there appears to have been three phases of the contraction. First, the initial
phase from Q4 2007 to Q3 2008 shows a period of disinflation and GDP atrophy. The second
phase, comprising the financial crisis and its immediate aftermath, consisted of a period of GDP
contraction from Q3 2008 to Q2 2009. The final phase, comprised of a period from Q2 2009 to
Q2 2010, witnessed an unemployment spike as industrial capacity dropped to a new equilibrium.
Though unemployment is a lagging indicator, and is expected to remain stubbornly high with a
gradual decline over several years, this later phase is a key characteristic of a severe economic
contraction. The multi-phasal view of the anatomy of the downturn suggests that the 2007-9
downturn was a protracted shallow depression much more reminiscent of pre-war downturns
than post-war downturns. However, even the minimalist view of the three-quarter technical
GDP contraction (i.e., phase II alone) qualifies as a shallow depression by historical standards.11
It is instructive to compare the 2007-9 downturn to the U.S. downturns since the Civil
War in order to assess its relative impact.
Chart 3 shows the history of U.S. post-Civil-war downturns.
11 A case can be made that a fourth, atrophy, phase may occur in 2010-12 from a further housing pricecontraction; this period has begun to experience disinflation as measured by price data and by net worthdeclines in the third quarter of 2010 from the second quarter of 2010.

8/2/2019 Post Depression Economics
http://slidepdf.com/reader/full/post-depression-economics 16/82
Post-Depression Economics
- 16 -
Chart 3
Business Contractions: Business Cycle Dates
Peak (Quarter) Trough (Quarter) Contraction
(months)
Prior Expansion
(months) June 1869 (II) December 1870 (IV) 18 18
October 1873 (III) * March 1879 (I) 65 18
March 1882 (I) May 1885 (II) 38 36
March 1887 (II) April 1888 (I) 13 22
July 1890 (III) May 1891 (II) 10 27
January 1893 (I) * June 1894 (II) 17 20
December 1895 (IV) June 1897 (II) 18 18
June 1899 (III) December 1900 (IV) 18 24
September 1902 (IV) August 1904 (III) 23 21
May 1907 (II) * June 1908 (II) 13 33
January 1910 (I) (dd) January 1912 (IV) 24 19January 1913 (I) (dd) December 1914 (IV) 23 12
August 1918 (III) ** (dd) March 1919 (I) 7 44
January 1920 (I) (dd) July 1921 (III) 18 10
May 1923 (II) July 1924 (III) 14 22
October 1926 (III) November 1927 (IV) 13 27
August 1929 (III) * March 1933 (I) 43 21
May 1937 (II) June 1938 (II) 13 50
February 1945 (I) ** October 1945 (IV) 8 80
November 1948 (IV) October 1949 (IV) 11 37
July 1953 (II) ** May 1954 (II) 10 45
August 1957 (III) April 1958 (II) 8 39
April 1960 (II) February 1961 (I) 10 24
December 1969 (IV) ** November 1970 (IV) 11 106
November 1973 (IV) March 1975 (I) 16 36
January 1980 (I) (dd) July 1980 (III) 6 58
July 1981 (III) (dd) November 1982 (IV) 16 12
July 1990 (III) March 1991 (I) 8 92
March 2001 (I) November 2001 (IV) 8 120
December 2007 (IV)* [June 2009 (III)] 18 73
Source: National Bureau of Economic Research
* Financial crisis ** War dd: Double dip
It is significant to note – and it is a key thesis of this essay to show – that the average
economic contraction from the Civil War to the Great Depression was 20.5 months, or about
exactly the average period – 18 months – of the 2007-9 downturn. On the other hand, the post-

8/2/2019 Post Depression Economics
http://slidepdf.com/reader/full/post-depression-economics 17/82
Post-Depression Economics
- 17 -
War recessions were generally far more moderate at only 10.8 months each. The only anomaly
was the “double dip” recessions from 1980 to 1982 that could be described as a continuous
recession promulgated by activist Fed policy to correct exogenous inflationary pressures. The
depth of the downturn, in terms of industrial production, international trade, housing price
deflation and unemployment data is consistent with a prolonged and substantial pre-war slump.
As Chart 3 shows, excluding the Great Depression, in the 42 years between 1887 and
1929, there were thirteen downturns, for an average of one downturn roughly every three years.
The average downturn duration was 16.2 months and the average recovery period was 22.8
months. This Progressive era appears to have been an extremely volatile period of
entrepreneurship, financial crisis and urbanization. The intensely stratified configuration of the
economy was likely a key reason for explaining the unusually destabilized macroeconomic
system in this period of rapid industrial growth. With an average recession and expansion period
of about 39 months over this forty year period, this era is not a good harbinger for the near-term
future of the U.S. economy as it trends to an extremely stratified configuration. One key
implication of this observation is that before the Great Depression endogenous instability
generated from a stratified economic configuration. For instance, in contrast to the extreme
stratification from 1890 to 1930, the U.S. middle class thrived after WWII and the U.S.
witnessed a remarkable growth period to about the mid-70s. But projecting the model forward, it
is suggested that the U.S. may experience either a difficult period of slow growth or a worse
period of instability and a succession of crises.12
12 Using the analogy of the Progressive era, a period in which there was a recession after the trough of aprevious downturn every 22.8 months, there may be another recession in the U.S. shortly after mid-2011assuming the 2007-9 contraction ended at the end of the second quarter of 2009. Further, in the long-run,if the macroeconomic system is tracking this volatile period – with the absence of government policyinfluences – the U.S. may be in a generational period of extreme volatility in which significant recessionsoccur every three or four years, rather than every ten years like in the past generation. If we recall theperiod in the 1970s – the instability of which was largely caused by exogenous factors – we obtain a

8/2/2019 Post Depression Economics
http://slidepdf.com/reader/full/post-depression-economics 18/82
Post-Depression Economics
- 18 -
The financial crisis of 1907 created an unstable period, with recessions in 1907, 1910 and
1913, to which the central bank was a response. The Federal Reserve Bank was created by
President Wilson in 1913 as a monetarist mechanism to moderate the extremes of market
speculation. But even with the genesis of the modern Fed, the frequency of recessions were not
moderated until after WWII.
One major theory used to describe the reduction in severity of post-War recessions to pre-
Great Depression contractions was the Fed’s active use of monetary policy to modulate
economic activity.13 It is interesting to note the protracted periods of growth between each
recession before 2007, at 92, 120 and 73 months, respectively, signifying the effectiveness of
Fed policy in a period of general growth.14 This evidence would support the view that
monetarist policy has been generally stimulative and effective to modulate growth and constrain
unemployment. However, even with supererogatory action, the Fed’s power is severely
closer picture of the potential for macroeconomic disequilibrium created from endogenous factors causedby extreme stratification. The massive build-up of debt (public, consumer and business), the difficulty of deleveraging, the limits of Fed and international central bank policy, the political paralysis, a massivewave of retiring baby boomers, sovereign debt crises and enormous trade imbalances all point to thepotential of a destabilizing period of continuous recessions and shallow recoveries for at least a
generation. It is possible, then, that the U.S. may witness a new equilibrium period of slowgrowth, increasingly frequent recessions and a new range of unemployment between 8% and12%. On the other hand, it is possible that the rate of growth will pick up in 2011 and 2012,much as the economy experienced a rapid growth phase in late 1993 after the 1990-1 recessionand long tail from a deleveraging process.13 See Bernanke, B., Essays on the Great Depression, 1994 [discussing Depression era monetary policy];
Bernanke, B., “The Macroeconomics of the Great Depression,” NBER Working Paper No. 4814, 1994[identifying economic policy conditions and prescriptions in the Depression]; Bernanke, B.,“Nonmonetary Effects of the Financial Crisis in the Propagation of the Great Depression,” The American
Economic Review, Vol. 73 (June), pp. 257-276, 1983 [showing the role of the banking crisis in theDepression] and; Bernanke, B. and H. James, “The Gold Standard, Deflation, and Financial Crisis in theGreat Depression: An International Comparison,” NBER Working Paper No. W3488, 1990 [showing therole of the gold standard on monetary conditions in the Depression].14 In the twelve post-war recessions, though the average contraction duration was 10.8 months, theaverage recovery period was 60 months, for an average cycle period of 71 months or about double theduration of business cycles before the Great Depression.

8/2/2019 Post Depression Economics
http://slidepdf.com/reader/full/post-depression-economics 19/82
Post-Depression Economics
- 19 -
constrained at the present time, suggesting that we are in a new equilibrium period. In fact,
monetarism may be worthless in a disinflationary economy in which interest rates are near zero.
The duration of the recent downturn has been unusually protracted. While the decline in
GDP stopped in mid-2009,15 according to technical factors, the recovery period has been
particularly slow, with annual growth below 2%. With growth at a steady state level, total
employment will not change beyond the population growth rate, thereby maintaining a high
unemployment rate. Clearly, this relatively slow growth period is consistent with a downturn
that is accompanied by a financial crisis.16 When identifying those periods of economic
downturns accompanied by financial crises, such as 1873, 1907 and 1929, the present period
qualifies as a longer downturn than a typical recession.
The financial industry crisis had as the root cause the housing bubble. 17 The housing
industry has clearly been in a protracted economic depression that began in 2006 and persisted
through 2010.18 Since most people use their house as a source of economic value, the housing
price declines have affected the debt and credit components of a large portion of the economy.
Until excessive debt is liquidated, the housing sector will continue to languish. In addition, when
15 In some ways, the 2008 financial crisis was a perfect storm of events, particularly with the politicaluncertainty of a major presidential election and transition. While the early stimulus legislation likelyaverted a more severe downturn, the Obama administration clearly inherited the legacy of previous policyefforts to limit damage from the financial crisis. The severity of the crisis left few good options.16 See Reinhart, C. and K. Rogoff, “The Aftermath of the Financial Crises,” NBER Working Paper, No.W14656, 2009 [showing the macroeconomic effects of financial crises, indicating a pattern of protracteddownturns after crises].17
The sub-prime lending sector was not the only problem of the financial industry in the 2000s. Inretrospect, offering creative, adjustable, loans with no credit or down payment, securitizing the loans,mis-rating the securities (often with conflicts of interest), offering “credit default swap” insurance on thesecurities by the London-based AIG Financial Products group and paying absurdly high transaction-feesand bonuses to bankers to perform these financial services was probably not a good idea. One U.S.securities industry regulator responsible for policing the industry never heard of the credit default swapsused to insure mortgage backed securities, which seems a little puzzling.18 Fannie and Freddie offer home loans on median sized mortgages at 3% to 4% in 2009-2010, far belowthe 6% to 8% private market interest rates. Despite these subsidized loan prices the market still remainssoft in 2010.

8/2/2019 Post Depression Economics
http://slidepdf.com/reader/full/post-depression-economics 20/82
Post-Depression Economics
- 20 -
unemployment is high, further pressure is put on housing prices, deepening the cycle of debt
deleveraging. Since the bursting of the housing bubble was at the core of the recession, it is
critical to get control of this debt deleveraging process. Continuing housing price declines,
which are expected with a high backlog of foreclosures in the pipeline, will likely be a drag on
economic growth for the next few years.19
International trade, a measure of industrial production, experienced a 12.2% decline in
2008-2009, consistent with a significant economic depression. The trade data reflect the sharp
manufacturing contractions in the U.S., Japan, Europe and China as consumer demand dropped
precipitously. Furthermore, commodity prices dropped dramatically from 2008 to 2009,
reflecting a global economic depression caused by a sharp drop in demand.
The global character of the downturn is particularly indicative of an economic
depression. All economic data sets point to the greatest declines in GDP, employment, industrial
capacity, trade and housing prices since the Great Depression of the 1930s, suggesting that there
was a more severe economic downturn than a recession. In fact, the similarity of the downturn
to the early 1930s is instructive since there are parallels with the housing crises and the financial
crises between the periods.20
Going further, one can argue that the world economy experienced a
depression in 2007-10 that originated in the U.S.
If the U.S. experienced a shallow depression from 2007-9, an analysis of history shows
that the period from 2010 to 2015 is likely to witness protracted unemployment and a long tail of
19
There appears to be about five million homes in the foreclosure pipeline in 2010. At a rate of 95K amonth, this excess housing inventory is likely to have deflationary consequences. See the argumentbelow on the causes and consequences of the economic downturn. Finding ways to control the continuingsoft demand in the housing sector is critical to arresting the slow economic growth rate. On the otherhand, some argue that letting the housing market bottom is the best way to realize eventual healthyeconomic growth.20 See Stiglitz., J., Freefall: America, Free Markets, and the Sinking of the World Economy , 2010[arguing that the U.S. is in a structural economic decline] and; Day, V., The Return of the Great
Depression, 2009 [arguing that the economic conditions in 2008-9 are similar to the conditions in theearly 1930s].

8/2/2019 Post Depression Economics
http://slidepdf.com/reader/full/post-depression-economics 21/82
Post-Depression Economics
- 21 -
slow economic growth from reduced demand and continued debt deleveraging.21 This period of
relative stagnation may be reminiscent of the Japanese “lost decade” of the 1990s. The two
periods are likely to share similar economic and policy causes of a slow deleveraging process as
banks are unwilling to write off bad loans and as protracted high unemployment diminish
consumer demand. This period of relative stagnation may be part of a longer process associated
with a shallow economic depression, but is also a period highly susceptible to exogenous
economic shocks, such as commodity bubbles that lead to corresponding inflation. One way to
transmit this inflation is with a weakening dollar that is likely to occur, based on historical
experience, because of the large federal debt, projected federal deficits, U.S. trade imbalances
and expansionary Fed monetary policy. The effects of the stagnation and bubbles will lead to
further pressures on, and perhaps a recomposition of, the middle class. The possibility exists,
then, that the U.S. is only in the early phases of a protracted economic depression with a period
of tepid recovery, but then a period of declining demand, possibly a deflationary period and then
rapid inflation akin to the experience of the 1970s. These economic conditions will make the
Fed’s policy decisions particularly challenging.
For much of the 19th
century there was no central bank to moderate economic downturns
by supplying and regulating money to banks, companies and consumers. The markets were at
the mercy of the industrial and financial institutions – and their entrepreneurial leaders – which
tended to experience booms and busts. The post-Civil War depression of 1873 lasted five years,
with nearly half of the population unemployed at some point during the period. The depression
of 1893 was also substantial and protracted. These depressions were protracted because of the
21 See Reinhart, C. and K. Rogoff, This Time is Different: Eight Centuries of Financial Folly, Princeton,2009 [arguing that economic bubbles share a common pattern] and; Reinhart, C. and V. Reinhart, “Afterthe Fall,” op. cit. [arguing that economic crises that stem from financial crises require several years of debt deleveraging from which to recover].

8/2/2019 Post Depression Economics
http://slidepdf.com/reader/full/post-depression-economics 22/82
Post-Depression Economics
- 22 -
limited ability of the federal government to provide an antidote, particularly in the absence of a
central bank. The private economy was forced to repair itself without any assistance and these
self-organizing mechanisms were relatively slow to act. Similarly, the downturns of 190722 and
1929 witnessed a limited ability of the federal government to respond. In the 1930s, the Fed
made substantial policy mistakes that had the adverse effects of protracting the Depression in
1931 and 1937.
It should be obvious in hindsight that the present situation is reminiscent of these periods
that limits the extent to which government or the Fed can intervene.23 For example, with interest
rates at record lows, there is little more ammunition the Fed possesses to stimulate the economy
with monetary policy. Similarly, the federal government’s ideological polarization has led to
severe political constraints that limit the ability to stimulate the economy by adding to deficits.
In terms of economic policy, the period of the 2000s was very similar to the 1920s.24 The
1920s industrial and financial deregulation policy resulted in a housing bubble and industrial
concentration that led to a financial crisis that stimulated the protracted economic downturn of
the 1930s. In the 2000s, similar industrial and financial deregulation policy resulted in a similar
housing bubble and industrial concentration that led to a financial crisis that stimulated a
protracted downturn in its aftermath. These similarities suggest that there are clear policy
considerations that led to both economic downturns. While the 1931 bank crisis contributed to
making the 1929 recession a protracted – 43 month – depression, which resulted in a 96%
22 See Bruner and Carr, The Panic of 1907: Lessons Learned from the Market’s Perfect Storm , 2007[describing multiple conditions for the 1907 financial crisis].23 In September of 2008, the Fed held $480B of treasuries. By Q2 of 2010, the Fed held $2T of securities, including $1.2T in mortgage securities. In the first three quarters of 2010, Americans bought$200B of all debt securities and foreign holders bought $375B in treasuries. These actions have driveninterest rates to near zero.24 See Leuchtenburg, The Perils of Prosperity, 1914-32, 1993 [arguing that the conditions for the GreatDepression were sewn by adhering to laissez faire policies].

8/2/2019 Post Depression Economics
http://slidepdf.com/reader/full/post-depression-economics 23/82
Post-Depression Economics
- 23 -
decline in the value of the Dow from 1929 to 1932, the 2008 banking crisis25 may be shown to
have made the 2007 recession a depression that led to a 53% decline in the value of the Dow
from 2007 to 2009, rivaling the worst post-war equity price decline in 1973-4.26
Although the composition of industry in 1930s America is not completely analogical to
the present situation, mainly because the country now enjoys a much larger27 and more
diversified economy, comparing the 2007-9 downturn to the recession of 1991 to 1992 is more
instructive. The real estate bubble of the 1980s led to a financial industry crisis that required
several years to deleverage debt and was accompanied by slow growth and a period of high
protracted unemployment. The economy did not substantially rebound until the fourth quarter of
1993, while real estate prices declined an average of five percent a year from 1990 to 1998 in
many cities. However, the financial and real estate bubbles of the 2000s were larger and more
pervasive than those in the 1980s – fed by both deregulation and Fed easing – suggesting a far
more substantial downturn from 2007-9 than in 1990-1.
While viewing GDP data alone provides an ambiguous interpretation, viewing strategic
industries such as real estate, automobile and manufacturing as well as trade data, which
collectively experienced thirty percent declines from 2007 to 2009, shows that the recent
economic contraction was particularly onerous. Similarly, when viewing the net worth data
declines, it appears that the downturn was much more severe than the GDP data show, indicating
25 See Murphy, “An Analysis of the Financial Crisis of 2008: Causes and Solutions,” SSRN, 2008[revealing the anatomy of the financial crisis]; Reinhart, C. and K. Rogoff, “Banking Crises: An Equal
Opportunity Menace,” NBER Working Paper W14656, 2009 [arguing that banking crises typically showsimilar patterns] and; Reinhart, C. and K. Rogoff, “Is the 2007 U.S. Sub-Prime Financial Crisis soDifferent? An International Historical Comparison,” NBER Working Paper W13761, 2008 [usinghistorical and international evidence to show common patterns of banking crises].26 Without aggressive Fed policy and U.S. government stimulus and TARP policy actions, the declinewould likely have been more severe.27 The U.S. income tax receipts in 1929 were $1.1B and in 1935 were about $500M. Even after factoringin inflation, when considering that the sources of federal government income were personal income taxes,corporate taxes and excise taxes, the size of the federal government in the 1930s was significantly smallerthan the present time.
8/2/2019 Post Depression Economics
http://slidepdf.com/reader/full/post-depression-economics 24/82
Post-Depression Economics
- 24 -
that the private sector was particularly hard hit and that public spending from government stimuli
was crucial to mitigate even further declines. The implications of a more severe contraction than
traditional measurements of GDP data alone show are that these past metrics may be inadequate
to capture the depth of the downturn. If the data were much more straightforward to interpret,
the NBER would not have waited fifteen months after the technical indicators showed an end to
the downturn to define its parameters.
Although the aggregate data regarding the typology of the economic downturn is
controversial, the effects of the downturn on specific classes of individuals are less controversial.
The manufacturing sector experienced a structural decline responsible for a reduction from 30%
of GDP in 1970 to only 12% of GDP in 2009.28 Similarly, the middle class experienced an after-
inflation net decline of wages from 2001 to 2010 even while energy, education and health costs
increased at rates higher than the core rate of inflation. For the middle class, the average worker
and the poor, then, this downturn was, and is, structural and persistent.
Given these economic data points, it is appropriate to consider that the U.S. experienced a
significant, but relatively shallow, economic depression from late 2007 to at least mid-2009. The
depth, intensity, speed, prolonged duration and global character of the downturn suggest that the
U.S. experienced significantly more than a recession. For these reasons, the case can be made
that the U.S. was in, and is gradually recovering from, a shallow economic depression.
28 Much of U.S. manufacturing is concentrated in a few industries dominated by incumbents such asBoeing, Caterpillar, Intel, Ford and GM.

8/2/2019 Post Depression Economics
http://slidepdf.com/reader/full/post-depression-economics 25/82
Post-Depression Economics
- 25 -
This Time IS Different29
How was this time different? The magnitude and duration of the downturn, the
international aspect of the downturn and the inclusion of the financial (bank and sovereign debt)
crises suggest that 2007-9 was substantially worse than any economic downturn since 1929-32.
The case for an economic depression from 2007-9 is reinforced by looking at both
empirical and policy data from 2001 to 2010 and by comparing the data to historical economic
downturns. The depth of the decline is registered in unemployment data, industrial utilization
data, trade data and real estate price data from 2007 to 2010. According to these data, the
economic decline was unequivocally greater than any post-war recession. The argument for
viewing the economic contraction as a shallow depression suggests that we are in a new
destabilizing period with a long tail of recovery.30
In the aftermath of the contraction phase, the long tail that characterizes the slow
recovery is notable because of a new post-contraction equilibrium phase characterized by
29
See Reinhart, C. and K. Rogoff, This Time is Different: Eight Centuries of Financial Folly, 2009[arguing that similar patterns of boom and bust are seen at different times and places].30 The argument for a continuous shallow depression sees the increase in factory production of the lasthalf of 2009 and the first half of 2010 as a period of inventory restoration that, once complete, will thenlead to a period of protracted demand decline that mirrors the experience of the early 1930s. Further, theGDP gains in the last half of 2009 are likely caused by the federal government stimulus and by arelatively weak dollar that artificially stimulated exports. However, this modest temporary increase ismore typically part of a period of protracted decline characteristic of a continuous deflationary (ordisinflationary) period.
The notion that the U.S. may witness a “double dip” recession of a second phase of GDPcontraction is consistent with the view of one single continuous event. The U.S. experienced one post-war “double dip” recession in 1980 and in 1981-1982. However, this period could also be characterized
as a single continuous event, with two stimulative components. The first cause was the Iranian oilembargo that raised oil prices by two to three times, thereby causing both contraction and inflation.Because of the high inflation, the Fed, in keeping with its inflation targeting strategy, raised interest ratesin 1981-2 so high as to stimulate the second phase of the recession. It is argued that these phases of aprocess were causal and continuous and thus a single event, not a double dip. Nevertheless, parts of Europe appear to be experiencing either a double dip recession in 2010 or one continuous depression. SeeBernanke, B. and M. Woodford, eds., The Inflation-Targeting Debate, 2006 [discussing the Fed’sinflation targeting strategies] and; Bernanke, B., T. Laubach, F. Mishkin and A. Posen, Inflation
Targeting: Lessons from the International Experience, 2001 [articulating the use of inflation targeting bycentral banks in the international context].
8/2/2019 Post Depression Economics
http://slidepdf.com/reader/full/post-depression-economics 26/82
Post-Depression Economics
- 26 -
consistently slow growth. The industrial utilization and employment data are at post-war lows in
the aftermath of the initial downturn period largely because of persistent constrained demand. It
is this long tail that one can argue characterizes a “repression” or a protracted stagnation phase of
a prolonged period of severe recession. While the near-zero growth stagnation period is not a
depression, it is not characteristic of post-war growth either. Using a medical analogy, it appears
as though, after the original sickness, the patient has lost a considerable amount of weight and
cannot gain the weight back to return to a normal healthy state. We appear to be in a completely
new equilibrium going forward.
However, most post-war recessions have ended with a period of 5-6% annual growth.
With anticipated 1.5-2.5% annual growth in 2010-2011 and with unemployment at or near
double digits for the foreseeable future, the present long tail is not characteristic of past
termination periods of recessions. With only 80K jobs created monthly in 2010, this tepid
employment growth, experienced with 2.5% or less annual GDP growth, will not keep up with
population growth. It will take four years of 5% GDP growth to reduce the unemployment rate
from about 10% to a pre-downturn unemployment rate of about 4.6%. At an economic growth
rate substantially less than 5%, the U.S. may experience a structural employment slump over five
years.
Most U.S. recessions in the twentieth century had common profiles. For instance, 1907
and 1931 had financial crises. 191831 and 1945 were characterized by the end of WWI and
WWII. Each of the recessions from 1973 to 2001 was characterized by economic bubbles. In
1973 and 1979, the recessions resulted from commodity (i.e., exogenous oil) bubbles, 1990-1
from the 1980s real estate bubble and 2001 by the Internet and telecommunications bubble.
31 The influenza epidemic probably did not help the economic conditions in 1918.
8/2/2019 Post Depression Economics
http://slidepdf.com/reader/full/post-depression-economics 27/82
Post-Depression Economics
- 27 -
Each recession experienced a prolonged period of asset price deflation. In effect, each recession
was a solution to a period of abnormal price inflation.32
The 2000s real estate bubble was caused in part by an unusually protracted period of low
interest rates promulgated by the Fed to control the 2001 recession and by deregulation of
financial institutions in the aftermath of Glass-Steagall. However, the middle class from 2000-
2007 experienced slow employment growth (about two million, generally low quality service,
net jobs created mainly from 2003 to 2007) and a net after-inflation decline in real wages while
manufacturing was substantially off-shored. The considerable stress on the middle class in the
2000s set up a high-debt period that would lead to the intensity of the depth of the downturn,
much like the 1920s set up the conditions for the 1930s protracted contraction.
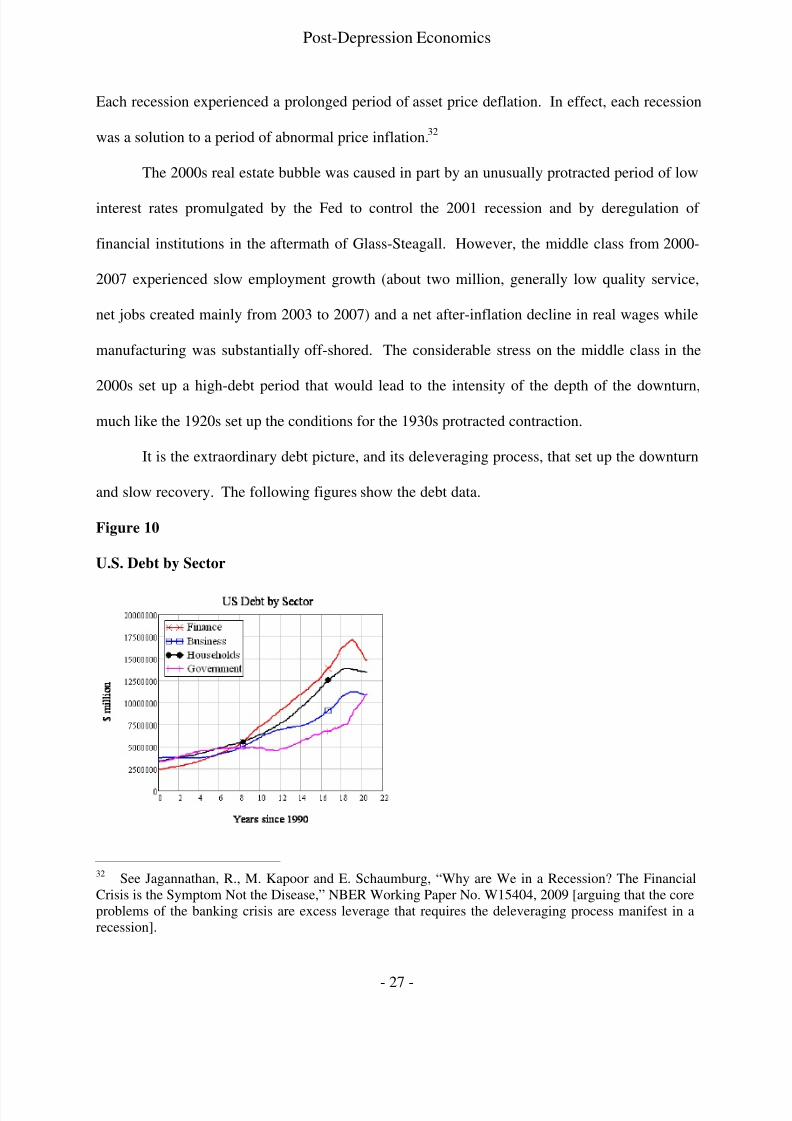
It is the extraordinary debt picture, and its deleveraging process, that set up the downturn
and slow recovery. The following figures show the debt data.
Figure 10
U.S. Debt by Sector
32 See Jagannathan, R., M. Kapoor and E. Schaumburg, “Why are We in a Recession? The FinancialCrisis is the Symptom Not the Disease,” NBER Working Paper No. W15404, 2009 [arguing that the coreproblems of the banking crisis are excess leverage that requires the deleveraging process manifest in arecession].
8/2/2019 Post Depression Economics
http://slidepdf.com/reader/full/post-depression-economics 28/82
Post-Depression Economics
- 28 -
Source: Fed Flow of Funds 2010
Fig. 10 shows the dramatic buildup of debt since 1990 in business, household, finance
and government sectors.
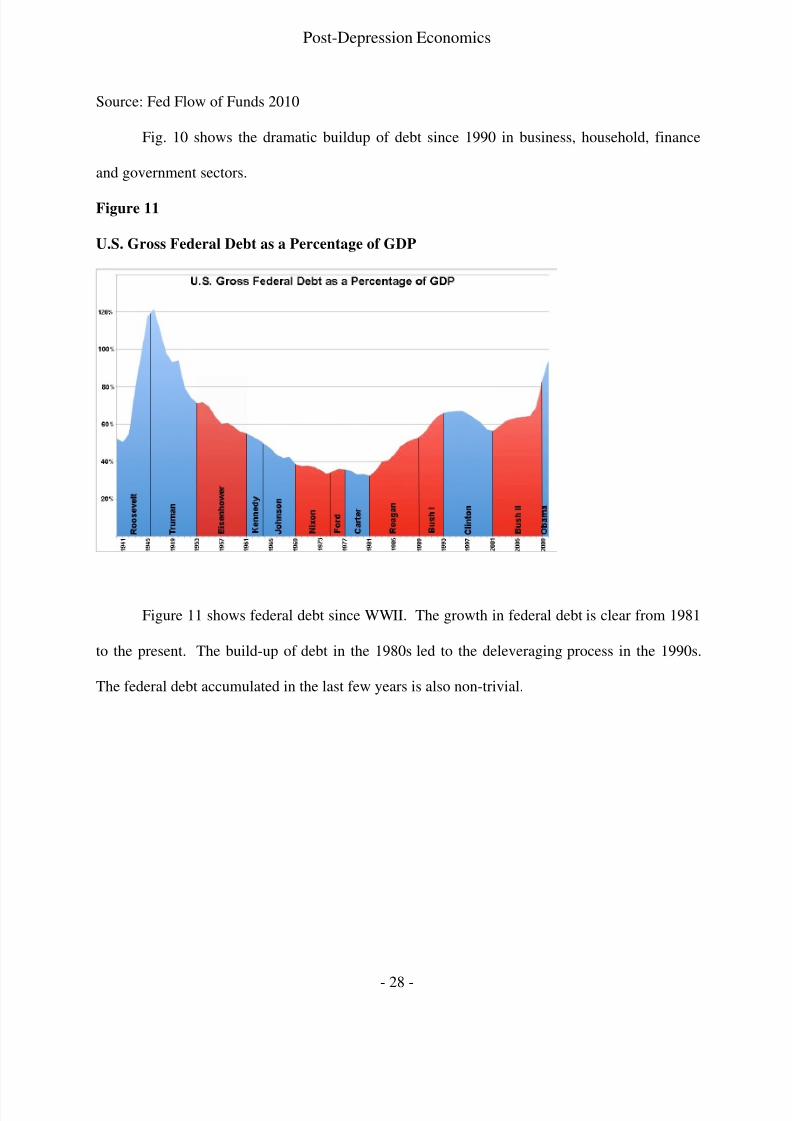
Figure 11
U.S. Gross Federal Debt as a Percentage of GDP
Figure 11 shows federal debt since WWII. The growth in federal debt is clear from 1981
to the present. The build-up of debt in the 1980s led to the deleveraging process in the 1990s.
The federal debt accumulated in the last few years is also non-trivial.
8/2/2019 Post Depression Economics
http://slidepdf.com/reader/full/post-depression-economics 29/82
Post-Depression Economics
- 29 -
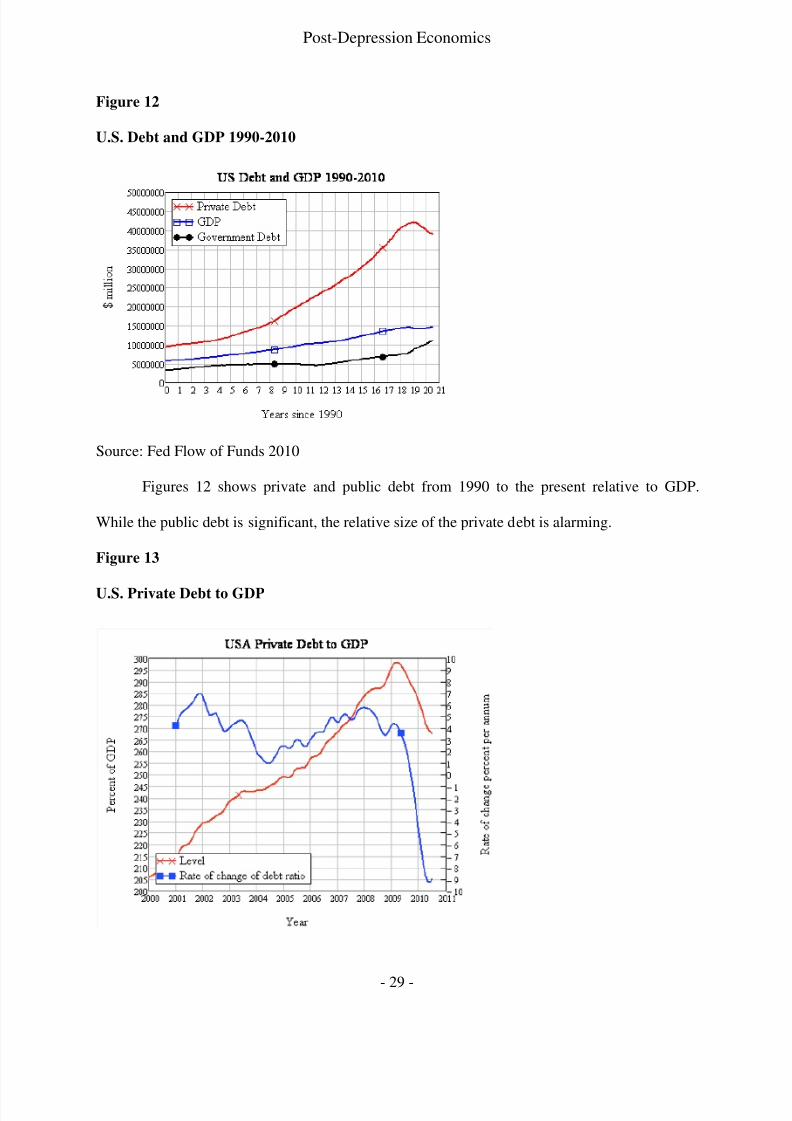
Figure 12
U.S. Debt and GDP 1990-2010
Source: Fed Flow of Funds 2010
Figures 12 shows private and public debt from 1990 to the present relative to GDP.
While the public debt is significant, the relative size of the private debt is alarming.
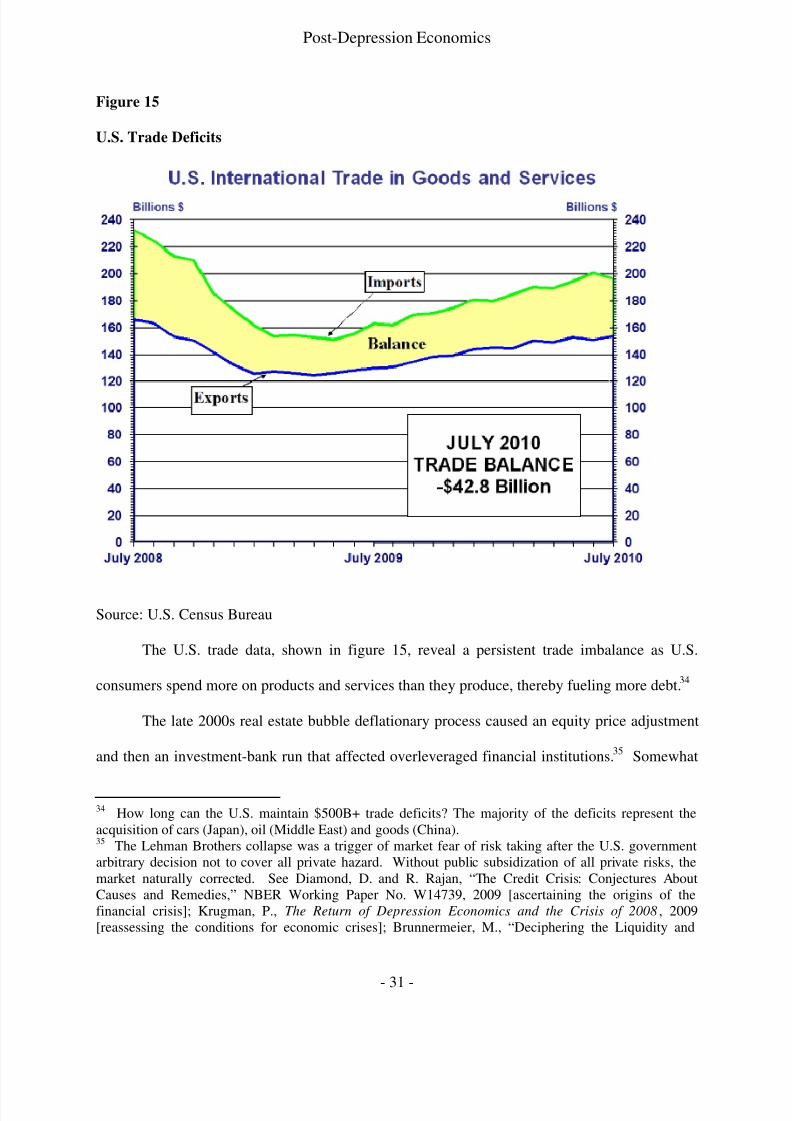
Figure 13
U.S. Private Debt to GDP

8/2/2019 Post Depression Economics
http://slidepdf.com/reader/full/post-depression-economics 30/82
Post-Depression Economics
- 30 -
Source: Fed Flow of Funds 2010
Figure 13 shows the level of private debt relative to the change in debt. The drop in the
rate of change of debt ratio in the downturn is dramatic.
Figure 14
Correlation of Change in Debt and Unemployment
Source: Fed
The change of debt ratio, shown in figure 14, is correlated to the unemployment rate
change, showing the drop in demand that led to the dramatic increase of unemployment in the
downturn. It can be inferred from this correlation that the demand for goods was driven by debt.
This imbalance is also manifest in the U.S. trade deficits.33
33 Does the correlation of debt and employment imply that debt supports overconsumption and highemployment?
8/2/2019 Post Depression Economics
http://slidepdf.com/reader/full/post-depression-economics 31/82
Post-Depression Economics
- 31 -
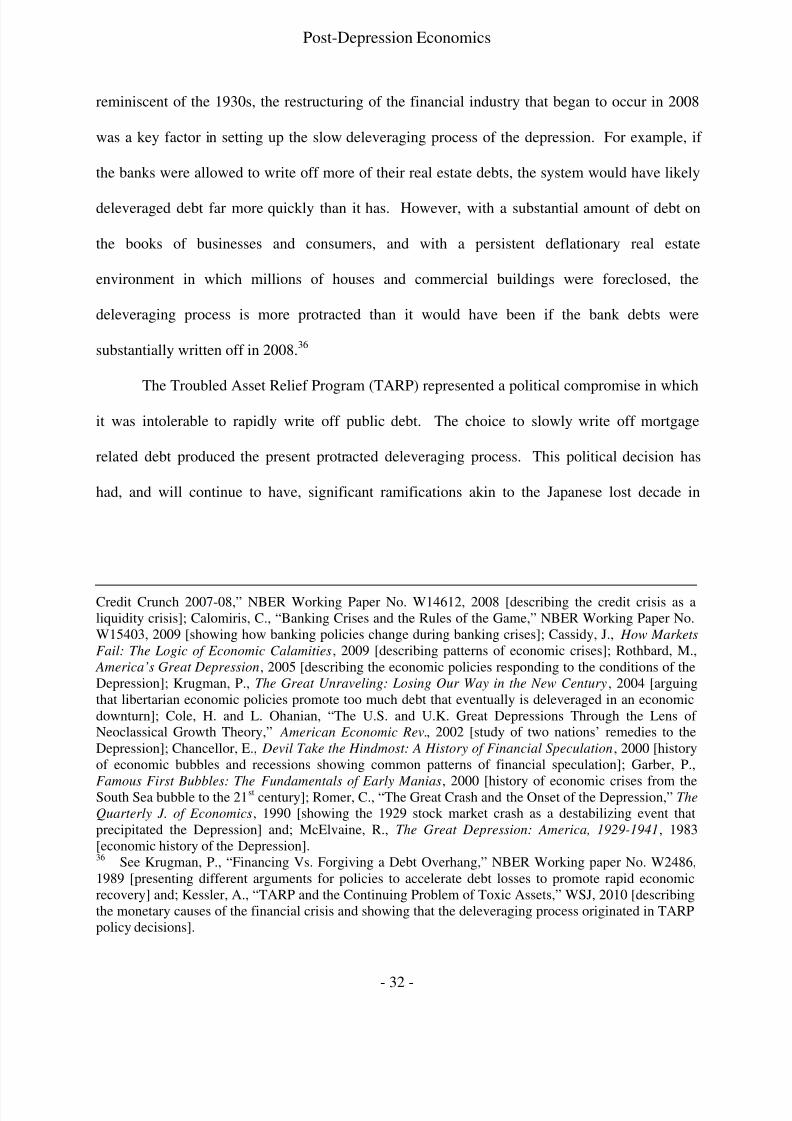
Figure 15
U.S. Trade Deficits
Source: U.S. Census Bureau
The U.S. trade data, shown in figure 15, reveal a persistent trade imbalance as U.S.
consumers spend more on products and services than they produce, thereby fueling more debt.34
The late 2000s real estate bubble deflationary process caused an equity price adjustment
and then an investment-bank run that affected overleveraged financial institutions.35 Somewhat
34 How long can the U.S. maintain $500B+ trade deficits? The majority of the deficits represent theacquisition of cars (Japan), oil (Middle East) and goods (China).35 The Lehman Brothers collapse was a trigger of market fear of risk taking after the U.S. governmentarbitrary decision not to cover all private hazard. Without public subsidization of all private risks, themarket naturally corrected. See Diamond, D. and R. Rajan, “The Credit Crisis: Conjectures AboutCauses and Remedies,” NBER Working Paper No. W14739, 2009 [ascertaining the origins of thefinancial crisis]; Krugman, P., The Return of Depression Economics and the Crisis of 2008, 2009[reassessing the conditions for economic crises]; Brunnermeier, M., “Deciphering the Liquidity and
8/2/2019 Post Depression Economics
http://slidepdf.com/reader/full/post-depression-economics 32/82
Post-Depression Economics
- 32 -
reminiscent of the 1930s, the restructuring of the financial industry that began to occur in 2008
was a key factor in setting up the slow deleveraging process of the depression. For example, if
the banks were allowed to write off more of their real estate debts, the system would have likely
deleveraged debt far more quickly than it has. However, with a substantial amount of debt on
the books of businesses and consumers, and with a persistent deflationary real estate
environment in which millions of houses and commercial buildings were foreclosed, the
deleveraging process is more protracted than it would have been if the bank debts were
substantially written off in 2008.36
The Troubled Asset Relief Program (TARP) represented a political compromise in which
it was intolerable to rapidly write off public debt. The choice to slowly write off mortgage
related debt produced the present protracted deleveraging process. This political decision has
had, and will continue to have, significant ramifications akin to the Japanese lost decade in
Credit Crunch 2007-08,” NBER Working Paper No. W14612, 2008 [describing the credit crisis as aliquidity crisis]; Calomiris, C., “Banking Crises and the Rules of the Game,” NBER Working Paper No.W15403, 2009 [showing how banking policies change during banking crises]; Cassidy, J., How Markets
Fail: The Logic of Economic Calamities, 2009 [describing patterns of economic crises]; Rothbard, M., America’s Great Depression, 2005 [describing the economic policies responding to the conditions of theDepression]; Krugman, P., The Great Unraveling: Losing Our Way in the New Century, 2004 [arguingthat libertarian economic policies promote too much debt that eventually is deleveraged in an economicdownturn]; Cole, H. and L. Ohanian, “The U.S. and U.K. Great Depressions Through the Lens of Neoclassical Growth Theory,” American Economic Rev., 2002 [study of two nations’ remedies to theDepression]; Chancellor, E., Devil Take the Hindmost: A History of Financial Speculation, 2000 [historyof economic bubbles and recessions showing common patterns of financial speculation]; Garber, P.,
Famous First Bubbles: The Fundamentals of Early Manias, 2000 [history of economic crises from theSouth Sea bubble to the 21st century]; Romer, C., “The Great Crash and the Onset of the Depression,” The
Quarterly J. of Economics, 1990 [showing the 1929 stock market crash as a destabilizing event thatprecipitated the Depression] and; McElvaine, R., The Great Depression: America, 1929-1941, 1983[economic history of the Depression].36 See Krugman, P., “Financing Vs. Forgiving a Debt Overhang,” NBER Working paper No. W2486,1989 [presenting different arguments for policies to accelerate debt losses to promote rapid economicrecovery] and; Kessler, A., “TARP and the Continuing Problem of Toxic Assets,” WSJ, 2010 [describingthe monetary causes of the financial crisis and showing that the deleveraging process originated in TARPpolicy decisions].

8/2/2019 Post Depression Economics
http://slidepdf.com/reader/full/post-depression-economics 33/82
Post-Depression Economics
- 33 -
which banks refused to write down real estate debt and suffered average annual real estate price
declines of 5% from 1990 to 2005.37
If we are in a protracted economic depression, we may not have definitive information
for another several years about persistent price declines. In other words, we may not have
enough data to determine whether we are in a more substantial depression or stagnation period at
the present time, akin to only seeing the first two to three years of the Great Depression. But if
we are in a protracted depression, the federal government and Fed stimulus policy are limited to
modulate the economy going forward, thereby complicating economic development.38
The argument that a steep downturn leads to a strong recovery – which has been the
general rule in post-war recessions – has not been actualized in the present period. For the most
part, the rate of debt liquidation appears to determine the rate of recovery. In effect, a sharp
contraction is the cure for the mania of the 2000s, wherein a deleveraging period is required to
re-equilibrate the economy.39
But the 2007-9 contraction period, like the periods of 1929-32 and the early 1990s, also
witnessed financial industry crises. In the current period, the financial industry is constraining
credit and thereby perpetuating the duration of the deleveraging process.40
This financial
37 See Schularick, M. and A. Taylor, “Credit Booms Gone Bust: Monetary Policy, Leverage Cycles, andFinancial Crises, 1870-2008,” NBER Working Paper No. 15512, 2010 [describing the history of post-Civil War economic cycles from a perspective of monetary policy]; Taylor, J., “The Financial Crisis andthe Policy Responses: An Empirical Analysis of What Went Wrong,” NBER Working Paper No.W14631, 2009 [an anatomy of policy options to solve the financial crisis]; Taylor, J. and J. Williams, “A
Black Swan In the Money Market,” NBER Working Paper No. W13943, 2008 [arguing that the smallprobability of catastrophe was not adequately measured in monetary risk analyses] and; Whalen, R., “TheSubprime Crisis: Cause, Effect and Consequences,” Networks Financial Institute Policy Brief No. 2008-PB-04, 2008 [analysis of the sub-prime mortgage market as a key cause of the financial crisis].38 See Mishkin, F., “Is Monetary Policy Effective During Financial Crises?,” NBER Working Paper No.W14678, 2009 [arguing the limits of monetarism particularly when it is needed most].39 See Minsky, H., Stabilizing an Unstable Economy, 1986 [showing the policy choices in economiccrises with a particular focus on monetary institutions].40 See Ivanshina, V. and D. Scharfstein, “Bank Lending During the Financial Crisis of 2008,” EFA 2009Bergen Meetings Paper, 2009 [showing the transformation of bank lending as the crisis evolved].
8/2/2019 Post Depression Economics
http://slidepdf.com/reader/full/post-depression-economics 34/82
Post-Depression Economics
- 34 -
industry crisis was exacerbated by the extreme and rapid concentration of the industry in 2008.
In other words, while housing is a drag on the economy, the financial industry has limited credit
at the precise time that consumers need credit to sustain economic growth. Substantial evidence
shows that limited consumer and business lending created by the banking sector is stifling the
recovery.
Furthermore, the correlation between high unemployment data and a very soft housing
market suggests a negative feedback loop that will be particularly slow to change in the next few
years. The unemployment rate needs to come down substantially before consumers buy homes,
consumers need to buy homes before prices stabilize and prices need to stabilize before
economic growth will continue so as to bring the U.S. out of a protracted downturn.
While the technical factors show a severe contraction from 2007-9 from which the U.S. is
slowly recovering, some positive data reflect the successful performance of industrial
corporations. After a decline of corporate profits in 2008-9 of about thirteen percent, the profits
of large corporations have been robust in 2009-10. Unique factors that pertain to the increased
industrial globalization and concentration of American corporations in the 2000s have allowed
them to maintain robust profits in the aftermath of the downturn. Many industries, including
energy, finance, technology, communications and pharmaceutical, are oligopolously configured,
and consequently enjoy substantial monopoly profits. Therefore, while much of the U.S. is
experiencing a substantial downturn, including record post-war aggregate unemployment,
corporate profits in several industries have been excellent. Rarely in history have these
industries seen more highly valued corporations combined with record profits. Although the
extreme concentration of industrial organization is a result of decades of lax antitrust regulation,
the success of large corporations is contrasted to the performance of small and mid-sized
8/2/2019 Post Depression Economics
http://slidepdf.com/reader/full/post-depression-economics 35/82
Post-Depression Economics
- 35 -
businesses. This extreme industrial stratification41 in the 2000s has similarities to the period of
the 1890s to 1920s of U.S. industrial development.42
It is this lack of government regulation that provides a similarity of the 2000s to the
1920s and suggests there is little the government can do to mitigate the depth of the downturn at
the present time. The theory that we are in a shallow depression similar to those in the 19th
century follows the view that the U.S. government did little to prevent 19 th century recessions
because of industry structure constraints and limited potential government stimuli.43
The prevailing logic is that Keynesian44 economic stimulus would add to the already
absorbitant deficits and restrict further stimulus actions. In other words, there is a perception
that, politically, there is little that the government can do to deal with the depth of the economic
downturn. Both the federal government and the Fed simply have no ammunition left in their
economic arsenal to stimulate the economy. This is particularly problematic if an exogenous
event occurs that plunges the economy into a new stage of decline, such as another Middle-
Eastern crisis.
According to the prevailing economic theory, then, the contraction occurred from 2007 to
2009 and could be mapped by “catastrophe” mathematical theory, while the technical “recovery”
began in mid-2009 and continues at a relatively slow pace. However, the data also seem to show
that a more substantial depression may be occurring in which the shallow depression of 2007-9
41 See Williamson, O., The Economic Institutions of Capitalism, 1998 [showing the market hierarchy of
industrial organizations] and; Williamson, O., Markets and Hierarchies: Analysis and Antitrust Implications, 1983 [showing how markets organize and evolve].42 See Porter, G., The Rise of Big Business, 1860-1920, 2006 [mapping the growth of corporations fromthe Civil War to the Progressive period] and; Prechel, H., Big Business and the State: Historical
Transitions and Corporate Transformation, 1880s to 1990s, 2000 [showing the complex relations of government and big business over the 20th century].43 This extreme industrial stratification is related to the increased, even symbiotic, relations of bigbusiness and the federal government in the 2000s.44 See Keynes, J., The General Theory of Employment, Interest and Money, 1936 [the classic economicwork arguing for activist government policy during economic crisis periods].
8/2/2019 Post Depression Economics
http://slidepdf.com/reader/full/post-depression-economics 36/82
Post-Depression Economics
- 36 -
was merely the first component of a longer process, particularly when factoring in the period of
unusually high unemployment rates or the duration of a return to the point of peak net worth or
potential economic growth.
While post-war recessions have shown similar patterns, the recent depression and
aftermath are substantially different in depth and duration. This time it was different.
Causes and Consequences of the Depression
There are several causes of the depression. In general, the core of the problem is
diminished demand from consumers. The source of diminished consumer demand is the housing
contraction caused by the bursting of the housing bubble in 2007. The economic downturn was
complicated by the financial crisis in 2008, which was promulgated by over-leverage, poor risk
management, short-term incentives and limited oversight. The financial crisis was a debt crisis
that moved from a U.S. consumer housing crisis to a European sovereign debt crisis. With
substantially diminished consumer demand, industrial capacity dropped and, with it,
employment. In general, consumers stopped buying goods financed by borrowing from the
inflating value of their homes.45
There are several causes of the prolonged downturn after the initial debt crisis. These
include (a) a liquidity crisis, (b) a deleveraging process and (c) a savings paradox. Many
businesses require capital flows that were interrupted by the financial crisis in 2008. With
diminished access to capital, many businesses were adversely affected by the downturn, which
was protracted as banks moved from an overt liberal strategy to an overt conservative strategy
during the downturn. Since capital flows were constrained, high debt worked through the
45 See Phelps, E., Structural Slumps: The Modern Equilibrium Theory of Unemployment, Interest, and
Assets, 1998 [dialectically discussing advantages and limits of various macroeconomic schools].
8/2/2019 Post Depression Economics
http://slidepdf.com/reader/full/post-depression-economics 37/82
Post-Depression Economics
- 37 -
system. Because about 75% of jobs are created by small business, the challenges of business
entrants are especially prominent in a downturn. Particularly with constrained access to capital
and relatively higher energy and health care costs, small businesses are disincentivized to grow
and hire workers. High relative debt requires a period of time to deleverage, which is
detrimental to stable business and consumer activity. While consumers had too much debt prior
to the downturn – in fact, a record negative savings rate – they are now saving relatively too
much. With too much savings, consumers are not spending as much on goods, which further
prolongs the recovery.46 The sum of these factors suggests that the downturn’s contraction
period was complicated by debt deleveraging aspects more typical in economic depressions.
47
While some have argued that increased class stratification has caused the crisis,48 I argue
that class stratification is a consequence of a set of economic events rather than its cause. One
can argue that when 1% of the population has 23% of income (and .1% with 11%) the economy
is very stratified, but this is only a symptom of an economic system that configured industries
into cartels and that removed constraints on economic incentives for the top.49 This elite group
benefited from relaxation of taxes on the wealthy but also from the increasingly stratified
structure of organizations that is made possible in a global economy by increasing efficiency and
productivity from using technology and from offshoring cheap labor. It is argued that the
stratification of the elite classes is merely an indicator of the larger issue of the restructuring of
organizations within industries.
Figure 16
46 It is logical for Congress to consider instituting policies to promote savings so as to encourageinvestment in a primarily consumer-driven nation.47 See Shiller, R., Irrational Exuberance , 2001 [showing how investor over-confidence leads to bubbles].48 See Reich, R., Aftershock: The Next Economy and America’s Future, 2010 [arguing that stratificationcaused the 2000s economic bubble].49 See Saez, E. and T. Piketty, op. cit. and; Atkinson, T. and T. Piketty, op. cit. See footnote 1.

8/2/2019 Post Depression Economics
http://slidepdf.com/reader/full/post-depression-economics 38/82
Post-Depression Economics
- 38 -
Median Family Net Worth by Percentile of Net Worth
Source: Federal Reserve
The distribution of net worth is shown in Figure 16. The top ten percent of families have about
ten times the net worth of the top 75-89.9% and about thirty times the net worth of the bottom
half of the population. This sort of stratification is reminiscent of the economic structure of a
Third World country.50
The lack of competition policy enforcement yielded a set of strategic industries – in
technology, communications, energy, pharmaceuticals and finance – that are extremely
concentrated. In most cases, there are only several mega-capitalized corporations in each
industry with large market shares, often with $100B or greater market capitalizations, and a few
relatively small or mid-sized competitors.51
This situation of extreme industrial concentration
lies at the end of a three decade period of merger activity that created a set of giant U.S.-based
50 The reader may be reminded of Swift’s Gulliver’s Travels (1726) in which those within the top 75-89.9% are able to live in “average” suburbia, those in the bottom half are the Lilliputians (one tenth thesize of the “average”) and those in the top 10% are the giants (ten times the size of the “average”).Pushing the analogy further, those in the top 1% are ten times larger than the giants and those in the topone percent of the top one percent are ten times larger still.51 See Porter, G., op. cit. and; Prechel, H., op. cit.

8/2/2019 Post Depression Economics
http://slidepdf.com/reader/full/post-depression-economics 39/82
Post-Depression Economics
- 39 -
corporations representing about 70% of global profits. This extreme industrial concentration and
polarization explains why the largest companies have such robust and record profits. Exxon
Mobil,52 Chevron, GE, IBM, Hewlett Packard, Microsoft, Intel, Apple, Cisco, Oracle, AT&T,
Verizon, Merck, Pfizer, Johnson and Johnson, Berkshire Hathaway, Wal-Mart Stores, Goldman
Sachs and JP Morgan Chase enjoy unusually high market caps and typical 11-digit
($10,000,000,000.00+) annual profits characteristic of monopolies. Surprisingly, these
Brobdingnagian profits were made even during the economic contraction period of 2008 and
2009. These cartels are sitting on hundreds of billions of dollars, in contradistinction to cash-
starved smaller competitors, and thereby perpetuate their advantages. This industrial structure
polarization is a key source of economic challenge in the U.S.
With extreme industry concentration and extreme organizational structures,53 the benefits
of economic growth flow to a very small slice of the population. The industry and organizational
configuration changes over the last generation has mirrored the stratification of American
society. While middle class incomes have not grown in the last decade, the upper classes have
experienced high income growth rates, with an increase to $11.5M+ annual incomes for the top
1% of the top 1% in 2007, $1.6M for the top .12% and a mere $410K for the top 1%.54
With this
dramatic increase of extremely wealthy along with the atrophied middle class, the gap between
the average worker and the most elite executives has produced an extreme polarization. Yet, it
should be clear that the extreme income gap is a product, not a cause, of the economic
stratification caused by reduced enforcement of unfair competition policy, and limited control of
incentives for the highly compensated, that results from extreme industrial concentration. In
fact, evidence shows that by not controlling the top compensation of the most highly
52 Exxon Mobile enjoyed windfall profits of about $40B in 2006 and in 2008.53 See Williamson, O., op. cit.54 See footnote 1.

8/2/2019 Post Depression Economics
http://slidepdf.com/reader/full/post-depression-economics 40/82
Post-Depression Economics
- 40 -
compensated earners of many organizations, there is a tendency to increase the instability of
organizations; it would appear that there is a natural tendency to find a balance between the
highest- and average-compensated workers.55
The economic polarization mirrored in such extreme industrial concentration is more
characteristic of a Third-World country, which typically has a financial institution, an energy
institution and a telecommunications institution, whether state-owned or a monopoly. The U.S.
has not seen this sort of industrial concentration or economic stratification in about 100 years.
Not coincidentally, this extreme gap between the wealthiest 1% and the median 50% has not
been seen since at least 1928, or, possibly, since the 1890s.
Though the economic stratification followed the industrial concentration, it was
exacerbated by the biased 2001 and 2003 tax cuts that accelerated the gap between the top 1%
and median income earners.
In particular, the financial industry is far too concentrated. Only a handful of companies
have combined 80% market share in some markets: Goldman Sachs, J.P. Morgan Chase, Bank of
America Merrill Lynch, Citigroup, Wells Fargo and Morgan Stanley. With Wachovia,
Washington Mutual, Merrill Lynch, Bear Stearns, AIG and Lehman Brothers acquired or
eliminated, the current configuration of financial institutions presents a dangerous obstacle to
future industrial growth. Furthermore, 40% of U.S. corporate profits in 2008 were attributed to
the financial industry, compared to about 15% in 1970.56 This suggests that the financial
55 See Rajan, R., Fault Lines: How Hidden Fractures Still Threaten the World Economy , 2010[suggesting the conditions for economic crises still lurk in the international system]. This view isreinforced by Rajan’s arguments about the skewed incentives of investment banking compensation rates.England and the EU elected to tax banker bonuses to realign private incentives with public duties.56 It is interesting that Wall Street compensation numbers for 2007, 2008 and 2009 do not show adownturn. For example, many Goldman Sachs Group “partners” get paid more than Fortune 500 CEOs,even in bad years. This promotes moral hazard, which ultimately requires public institutions to bail outthe risky bets of the financial institutions. It is surprising that shareholders allow such high executivecompensation. Private incentives need to be realigned with public duties. If the companies themselves
8/2/2019 Post Depression Economics
http://slidepdf.com/reader/full/post-depression-economics 41/82
Post-Depression Economics
- 41 -
industry evolved to become a critical strategic industry. In effect, finance replaced
manufacturing in the U.S. economy. A thesis of this essay is that there are adverse effects of this
economic repositioning.
FDIC data show that American banks had $620 billion less in assets in mid-2010 than at
the end of 2008. Further, business loans in the period dropped twenty percent, from $1.49T to
$1.175T. A $600B drop in total loans from $7.996T to $7.395T is also shown. One of the
reasons attributed for the loan declines is that in 2009-10 U.S. government regulators (in
accordance with financial reform and the Basel II and III regimes) began to require greater bank
capitalization. With higher capitalization requirements, banks have less to lend. Therefore,
while the money center U.S. banks have substantial cash on their balance sheets ($185B for
Citibank, $172B for Bank of America Merrill Lynch and $72B for JP Morgan Chase in 2010),
they have smaller lending programs and higher lending standards at the precise time when
businesses need loans.57
Similarly, the consumer savings rate went from a historic low of below 1% before the
depression to 6% in 2010, suggesting that the pendulum for consumers had swung too far too
fast. The paradox of savings suggests that consumers should be spending cash in order to
increase demand for goods. Instead, they are saving and liquidating debt, thereby constraining
demand and protracting the recovery.
Evidence shows that the financial industry went from too lax credit policies to far too
restrictive policies in 2008. The after-effects of the financial crisis continue to affect the long tail
period of the economic recovery from the depression, but the financial industry configuration is a
cannot control this problem, the government should intervene, as the governments of England and the EUhave intervened to tax absurdly excessive banker compensation. It is neither logical nor moral for theU.S. to publicly subsidize losses while allowing the benefits of risky bets to be privatized.57 See Ivashina, V. and D. Scharfstein, op. cit.

8/2/2019 Post Depression Economics
http://slidepdf.com/reader/full/post-depression-economics 42/82
Post-Depression Economics
- 42 -
major problematic source of restrictive competition that adds a capital layer between the Fed and
businesses.58
While the symptom of a financial industry layer that blocked liquidity also existed
in the 1990-1 recession, with adverse effects that prolonged the recovery, the present prolonged
tail of the depression is particularly affected by the adverse effects of the extremely concentrated
financial industry.
Much like the effect of the financial industry on the economy during Japan’s lost decade
in the 1990s, it is argued that the extremely concentrated configuration of the U.S. financial
industry is largely responsible for a slow deleveraging of real estate debt from the 2000s. Like
with Japan, the refusal to write down these loans has protracted the recovery. So far, in July of
2010, 14% of home loans were in foreclosure or delinquent. The inventory of homes was at an
all time high in 2010, at about 100K homes foreclosed per month, with the longest time-to-sale
period (i.e., one year or longer) since records were maintained. In effect, the refusal to write off
bad loans forces real estate prices down further. With a second round of housing declines in the
downturn in 2010, the rest of the economy may experience asset disinflation in 2010 and 2011
and, perhaps, a period of deflation.
Historically, employment gains are unlikely to come from large corporations. The
economic advantages of the wealthiest corporations have been reinforced by investment into
productivity enhancing technologies that allow for increased automation and a decreased need
for human capital. With reduced employment during the downturn, larger corporations are
outsourcing employment to lower cost countries and increasing the use of automation to increase
productivity of existing employees. Therefore, one would not expect the largest corporations to
be the greatest source of employment in the recovery.
58 A manifestation of the adverse effects of the financial industry layer is the refusal of banks toreorganize mortgage debt in accordance with congressional legislation. This problem of theunwillingness of banks to write down debt is a key source of continued housing market instability.
8/2/2019 Post Depression Economics
http://slidepdf.com/reader/full/post-depression-economics 43/82
Post-Depression Economics
- 43 -
Rather, the greatest source of employment in the private economy will come from small
businesses. Traditionally, small and new businesses hire about 75% of total employees. Yet, the
strains to small business are particularly severe in the economic downturn.
While the increased industrial concentration and competitive pressures of small
companies are causes of the extreme U.S. economic stratification, the effects are limited demand
for goods and high unemployment. There are correlations of high unemployment with
constrained demand, on the one hand, and of high unemployment and the housing crisis, on the
other.
The 2000s witnessed a generally soft demand for employment that barely kept up with
population growth. Between 2003 and 2007 about two million net jobs were created,59 compared
to the 1990s, during which twenty two million net jobs were created. However, median wages
atrophied after inflation from 2000 to 2007; 2007 real median wages were actually marginally
lower than in 2000. The depression, however, knocked out over eight million jobs from 2008 to
2010. The data on unemployment are unarguably the worst since the Great Depression.60
In addition to having a relatively extreme unemployment rate, the employment picture is
extremely lopsided. Though college educated workers had a 5.6% unemployment rate in the
third quarter of 2010, those with less than a college degree, those over fifty years old or those
under 25 years old, particularly minorities, had a 15-25% unemployment rate. Children of color
had a stunning 25% or greater rate of being on food stamps. Moreover, some regions have a
59 Over eight million jobs were created from 2003 to 2007, but six million jobs were also lost in theperiod, mainly to offshoring.60 Including the underemployed and those that stopped looking, the Bureau of Labor Statistics states theunemployment rate of about 16.6% peaked in the first quarter of 2010. About five unemployed appliedfor each job opening on average, a record. The total unemployed in the 2007-9 depression were greaterthan the aggregate unemployed in the 1981-2, 1990-1 and 2001 recessions combined.
8/2/2019 Post Depression Economics
http://slidepdf.com/reader/full/post-depression-economics 44/82
Post-Depression Economics
- 44 -
higher unemployment rate than others. For instance, California’s 2010 unemployment rate was
12.4%.
While the unemployment rate spiked and remains at an unusually high equilibrium rate
with a slow economic growth rate, evidence shows that the U.S. is slipping further behind in the
one area that has a hope of improving the quality of life for most Americans, viz., education. A
positive feedback loop is recognized in the advantages of an investment in education. Yet by
2010, the U.S. had slipped to eleventh place in science, ninth place in math and fifteenth place in
reading literacy among industrial countries.
If the correlation between education and innovation, productivity and economic growth is
a strong one, then the improvement in education would be a strategic goal. However, the
investment in education, particularly public education by the states, is jeopardized by extremely
tight public budgets and a political choice of spending on health care and prisons over education.
Education is a barometer of progress, particularly for the middle class, and in this case, the
barometer is measuring dangerous signs of a future of missed opportunities. While opportunities
exist for the elite, the middle class is clearly falling very far behind as measured by virtually
every metric. Without an intensive investment in education, the future of the U.S. economy is
jeopardized. As a 1984 Department of Education report acknowledged, if a foreign power were
to threaten to harm our schools the way that we have harmed them through neglect and extreme
poor investment, then we would consider the acts hostile and justifying a war. Nevertheless, the
deteriorated state of the education system is a symptom of the effects of an elite-biased
conservative economic philosophy.

8/2/2019 Post Depression Economics
http://slidepdf.com/reader/full/post-depression-economics 45/82
Post-Depression Economics
- 45 -
The Rise of China
Given the ordinary economic equilibrium established in the post-war period, perhaps the
U.S. economy would not be suffering an economic downturn as significant as the one it
encountered in 2007-9. However, a critical destabilizing force in the global economy has been
the rise of China. China’s hybrid capitalist-mercantilist economic system and the present historic
period of industrialization and urbanization have had profound effects on industrialized
economies. If Japan’s rise was a “miracle” of economic growth from 1960 to 1990, China’s
quantum speed of growth from 1980 to the present can be characterized as similarly
phenomenal.
61
But China’s communist government has applied aggressive economic and
monetary policies to promote its domestic industries and manage rapid growth at the expense of
trading rivals. While the U.S. economic development of the 2000s experienced substantial
effects of China’s economic development, typically in moderately priced goods and lost
manufacturing jobs, the effects of China’s policies during the downturn were egregious.
In the 2000s, China used capital from trade surpluses to buy U.S. treasuries, effectively
financing our debt. This had the positive effect of keeping down U.S. interest rates. Further, a
weak yuan had the consequence of limiting inflation, which allowed the U.S. to maintain a
relatively lower inflation rate target regime. In an ordinary economic growth paradigm, low
prices for goods and low interest rates are optimal, but during the economic slump, there was
downward pressure on prices that produced disinflation and deflation. In the present period,
disinflation is protracted by the effects of China’s currency and trade manipulations.62 In a
61 Along with spectacular economic growth, it is interesting to observe China’s own extreme economicstratification, which is ironic in light of communist “egalitarian” political ideology. Nevertheless, despitestrong economic growth to parity with Japan, GDP per capita in China is only one tenth of Japan’s in2010.62 For much of the past two decades, the yuan was pegged to the dollar. However, as the yuan floats andthe dollar weakens, inflation will likely be transmitted. The main question remains as to the degree of theU.S. trade deficit (25% in 2010) that will result as a consequence of a strong yuan. There is a better than

8/2/2019 Post Depression Economics
http://slidepdf.com/reader/full/post-depression-economics 46/82
Post-Depression Economics
- 46 -
period of slow economic growth, employment and wage growth are prominent problems; while
the U.S. experienced slow employment and wage growth during the 2000s period, it is
particularly problematic in the aftermath of the depression. Similarly, when the effects of
China’s economic manipulation on manufacturing was detrimental in the 2000s, it is devastating
in the period after the depression when the U.S. economy is experiencing economic growth so
slow that employment growth is not keeping up with population growth, thereby perpetuating an
unusually high unemployment rate. Consequently, while the new economic equilibrium that
resulted from the rise of China has resulted in benefits of cheap goods and low interest rates
during the moderate growth period of the 2000s, it has had disastrous consequences during the
slump and afterwards.63
The Chinese economic model has several features that result in unfair trade practices.
For example, China uses subsidized land grants, unusually cheap labor costs and low interest
loans to accelerate their export industries.64 Using Japan’s government-coordinated export
industrial policy as a model, the Chinese have turbo-charged economic subsidization with
systematic unfair trading practices. In addition to subsidizing land, labor and capital and
coordinating export industries, the Chinese tax imports so as to create protectionism. For
instance, automobile tariffs are 25%. Furthermore, the Chinese systematically pirate intellectual
property. In the case of the alternative energy industry, China requires companies that want
access to the burgeoning Chinese market to give up their intellectual property – the only
even chance, based on the experience of the strong yen in the 1980s that there will be little effect on theAmerican-Chinese trade deficit from a strong yuan. Compare the view of a floating Chinese currency tothe view that Americans should save more and the Chinese should consume more. The Fed’s Bernankehas echoed these sentiments in the past. See Roach, S., “Cultivating the Chinese Consumer,” NYT, 2010[arguing that a floating yuan may not matter to American consumers since their appetite for Chinesegoods is high].63 See Kaletsky, A., “Blaming China Won’t Help the Economy,” NYT, 2010 [arguing that the U.S.should find multi-lateral solutions to Chinese trade imbalances].64 See Bradsher, K., “China Takes Lead in Clean Energy, With Aggressive State Aid,” NYT, 2010[stating that China subsidizes its clean energy industry in opposition to WTO rules].
8/2/2019 Post Depression Economics
http://slidepdf.com/reader/full/post-depression-economics 47/82
Post-Depression Economics
- 47 -
remaining competitive asset – which creates a no-win solution for foreign companies. One clear
consequence of this systematic economic manipulation is to produce artificial trade surpluses at
the expense of foreign industries and jobs.
The effects of these unfair trade practices on the U.S. are substantial. First, by dumping
cheap products in the U.S., the Chinese have an unfair competitive advantage against the
indigenous U.S. manufacturing industry. The U.S. manufacturing industry dropped from 30% of
GDP in 1970 to 12% of GDP by 2008. With a diminished manufacturing sector, the U.S. is now
dependent on foreign manufacturers for goods; if the dollar weakens, inflation will be
transmitted since foreign goods become expensive. Second, the middle class is adversely
affected since they lost manufacturing jobs. For example, most of the U.S. jobs created from
2003-7 were low paying service industry jobs. Without indigenous U.S. jobs, consumers lack
the capital resources to buy goods, which further constrains economic growth.
The consequences of the phenomenon of China’s rapid industrial growth are not limited
to the U.S., but affect trading partners Europe, Japan, Korea and emerging economies as well.
The same effects on industrialized nations’ middle classes from China’s economic growth engine
have had strong implications for our own middle class since the U.S. laissez faire economic
system is particularly susceptible to Chinese economic manipulation. One long-term effect of
China’s economic growth has been a structural shift for the U.S. middle class. The only way to
maintain a growth of the U.S. middle class is through improving higher education and promoting
innovative technology industries, yet the U.S. education system has declined while the Chinese
are educating at least ten times the number of engineers as the U.S., suggesting that the U.S. is
relatively uncompetitive. With high federal and state debt, it appears that the U.S. is not
prepared to dramatically improve the education system that is required to substantially increase
economic growth, particularly for the benefit of the middle class.

8/2/2019 Post Depression Economics
http://slidepdf.com/reader/full/post-depression-economics 48/82
Post-Depression Economics
- 48 -
The U.S., Europe and Japan need to cooperate with China to adjust China’s present
policy practices so as to prevent a trade war. China must open its markets to foreign goods, it
must let its currency float on the currency exchanges, it must stop stealing intellectual property
and it must stop subsidizing its industries at the expense of foreign industries. A multi-lateral
solution to China’s aggressive economic policies is the preferred approach to this complex
economic problem, but a readjustment of the present equilibrium is necessary if the U.S.
economic recovery is to accelerate to post-war historic standards.
It is a likely scenario that China will gradually devalue the yuan. But this is a mixed
blessing for the U.S. Since China uses its surplus capital to buy U.S. treasuries, which allows the
U.S. to keep interest rates low, China will likely move to a basket of currencies to value the
yuan, away from a close dollar link. As the dollar weakens, and China’s dollar-denominated
investments fall, China will limit their losses by diversifying away from treasuries. Not only will
this transmit inflation to U.S. consumers who buy foreign goods with a weaker dollar, but as the
Chinese buy less U.S. debt, aggregate demand for U.S. debt declines and interest rates will move
higher. So far, the Chinese surpluses reinvested in U.S. debt have allowed the U.S. to enjoy a
subsidized reduction in interest rates in the 2000s. In the absence of these investments in our
burgeoning debt, the U.S. may experience an inflationary depression. U.S. policy with China
must therefore proceed cautiously in order to avoid over-reacting to trade imbalances.65 A
conflict with China will likely hurt American growth prospects at a particularly vulnerable time
in the economic recovery.
65 This view is somewhat between Gary Becker’s claim that the Chinese should let the yuan float andPaul Krugman’s claim that the U.S. should be much tougher with China. See Becker, G., “China’s NextLeap Forward,” WSJ, 2010 [proposing strategies for China in the future] and; Krugman, P., “Taking OnChina,” NYT, 2010 [proposing aggressive U.S. strategies to address the yuan undervaluation issue]. Weshould be careful what we wish for, in part since the Chinese have substantial power to manipulateeconomic factors that are not favorable to the U.S.
8/2/2019 Post Depression Economics
http://slidepdf.com/reader/full/post-depression-economics 49/82
Post-Depression Economics
- 49 -
In the long-run, though, the U.S. risks becoming marginalized by the relative economic
success of the Asiatic economic philosophies if it does not make dramatic policy changes. The
U.S. cannot blame the Asiatic economies alone for its multilateral trade deficits when there are
ninety countries with which it has deficits. The U.S. needs to develop less of a consumption
economy and more of a productive and savings oriented economy if it is to be successful in the
long-run. This is only possible by adjusting incentives.
There are larger geo-political implications of the rise of China on American foreign and
military policy as well. With the dissolution of the USSR, the rise of China shows that the U.S.
has a potential military competitor. The military growth of China is a natural adjunct of its rising
regional economic supremacy. Consequently, the U.S. has a complex relationship with China
that has complex long-term geopolitical implications.
China awakened while America slept.
Policy Factors in the Economic Bubble and Aftermath
There are clear causes of the economic bubble of the 2000s. First, the real estate bubble
was created by lax credit finance standards. Second, removing Glass-Steagall barriers increased
risk-taking with public guarantees. Third, insufficient government regulation of the financial
services industry – including permitting extraordinary short-term compensation – contributed to
moral hazard and excessive risk-taking. Fourth, the Fed’s low interest rate policy from 2001-4
inflated the bubble. Fifth, the high leverage of financial institutions was an exacerbating factor
that was a problem as the bubble developed and ruptured. Finally, extreme industrial
concentration – caused by weak antitrust and patent law enforcement – hurt competition.
Collectively, these deregulatory actions represented policy applications of a conservative
libertarian philosophy. But while these factors were responsible for creating conditions for the
8/2/2019 Post Depression Economics
http://slidepdf.com/reader/full/post-depression-economics 50/82
Post-Depression Economics
- 50 -
depression, the government response inadvertently initiated the financial crisis and limited its
damage.
Federal government intervention in the economy was crucial to limit damage once the
economic and financial crises were initiated. The TARP and stimulus legislation were
instrumental in preventing further catastrophe resulting from the financial crisis and economic
contraction. The central bank’s aggressive monetary actions were also critical to prevent further
declines during the crisis. These actions collectively constitute the paradigmatic Keynesian
policy responses to economic crisis.
However, the recovery in 2010 should be far more robust than the anemic sub-2% annual
growth based on a comparison to post-war recoveries. The stimulative effects of the federal
government and Fed actions should have had a greater effect so as to propel the economy into a
faster growth period. What went wrong? Viewed retrospectively, the size of the stimuli was
evidently insufficient.66 The deleveraging of debt in the financial industry in the aftermath of
TARP was inadequate to promote healthy growth. The Fed’s present policy of near-zero interest
rates are reminiscent of the Japanese67 lost decade, which experienced very slow growth amid a
protracted period of low interest rates because of a very slow debt deleveraging process. If the
government and Fed stimuli were sufficient, the economy would be on track for a robust
recovery reminiscent of all previous post-war recoveries. The depth of the downturn may have
limited the degree of the recovery as debt was slowly deleveraged through the system. In
retrospect, allowing a substantially greater amount of debt to have been written off from bank
66 See Tyson, L., “Why We Need a Second Stimulus,” NYT, 2010 [arguing for a need for furthereconomic stimulus].67 In retrospect, the cartel structure of the Japanese banking system was a key cause of the slowdeleveraging process. The oligopolous configuration of the U.S. banking industry appears to follow theJapanese.

8/2/2019 Post Depression Economics
http://slidepdf.com/reader/full/post-depression-economics 51/82
Post-Depression Economics
- 51 -
balance sheets in 2008 would have allowed a more robust recovery, akin to all previous post-war
recoveries.68
The political and monetary policy options are now constrained.
The policies that got the U.S. into the deep hole of the financial crisis in 2008 were
clearly preventable. The anti-government conservative crusade in the 2000s had at least two
main components. The tax cuts were intended to stimulate the economy and the deregulation
was intended to promote competition. But the opposite occurred. The economy did not grow
rapidly in the 2000s relative to other periods. The period from 2003 to 2007 experienced a
dramatic restructuring of industrial configuration that was clearly anti-competitive, while the tax
cuts stimulated neither a significant increase in aggregate employment nor economic growth to
increase real median wages. Further, the depth of the downturn was largely caused by an
application of supply-side libertarian government policies and was thus preventable.69 Only
Keynesian government policies in 2008 and 2009 prevented a far worse economic decline.
While the 2000s policies contributed to the downturn, once the federal government and
Fed stimuli have worked through the system, the effects of further marginal stimulus on the
protracted economic recovery are limited. Much like the Japanese lost decade, the Fed is
constrained in its ability to control the economy, because of the limited number of arrows in its
quiver after the severe economic contraction period, and is thus unable to halt the long debt
deleveraging process.70 Like Japan in the 1990s, at near-zero interest rates, the Fed now has
limited ammunition with which to use if a future economic or financial shock is initiated. If the
68 See Kessler, A., op. cit. and; Krugman, P., “Financing Vs. Forgiving a Debt Overhang,” op. cit.69 One argument to illustrate the preventability of the extent of the downturn shows a counterfactual of the banking system. Both Canada and Australia maintained sound banking industry policies and did notexperience severe downturns as a result. The question remains as to whether U.S. financial industryreform is sufficient to prevent future crises.70 One constructive idea, however, is to allow the accelerated depreciation of losses, particularly in themortgage market.
8/2/2019 Post Depression Economics
http://slidepdf.com/reader/full/post-depression-economics 52/82
Post-Depression Economics
- 52 -
Fed increases money supply too much, it risks activating inflationary forces, while if it is
inactive it risks prolonging the slow growth.
The U.S. is thus very likely in a new equilibrium period of slow growth and high
unemployment. If the dollar weakens, this situation of slow growth will be accompanied by
relatively high inflation as well, particularly as the U.S. is dependent on foreign goods in the
absence of a significant manufacturing sector. If this analysis is correct, then the U.S. economy
may eventually enter a new structural paradigm of an inflationary depression. This structural
paradigm will have adverse consequences for the middle class because of continued debt
deleveraging, restricted capital access, high relative unemployment, diminished industrial
capacity, competition constraints, relatively lower consumer demand and diminished quality of
life.
The Fed has twin mandates. On the one hand, the Fed is entrusted with the goal of
limiting inflation. On the other hand, the Fed is entrusted with the goal of maintaining economic
growth, including high employment. The two goals are sometimes in conflict, but the aim is to
have a balance between moderate inflation and moderate employment, which is possible in a
stable period of economic growth. In the period from 2007-9, however, the Fed was required to
lower interest rates dramatically to promote growth and constrain unemployment. Now, with a
record low interest rate regime, the Fed is constrained in its ability to stimulate growth. The Fed
suffers from a liquidity trap and is now immobilized in the event of a future crisis. In fact, as
with the low interest rate regime of the early 2000s, the Fed risks creating a bubble as institutions
use cheap capital to finance risky endeavors. Notwithstanding the low interest rate regime, the
risks of disinflation in the near-term in the face of a continuing housing crisis, slow economic
growth and high unemployment are substantial. While the inflation-indexing approach of the

8/2/2019 Post Depression Economics
http://slidepdf.com/reader/full/post-depression-economics 53/82
Post-Depression Economics
- 53 -
Fed needs to be reactivated as economic growth rates become moderately higher in the coming
years, higher rates are improbable in the short-run.71
The only tools left in the Fed toolkit are to increase money supply and to buy debt, but
using these tools lead to a high risk of over-stimulating inflation and weakening the dollar. This
problem suggests that the Fed risks creating booms and yet may be constrained to limit busts.72
While there is considerable debate about the effects of government stimulus on economic
growth, one main economic theory that involves government stimulus policy originated with
Keynes in the Great Depression.73 In order to stimulate the economy, the Keynesian theory
recommends increased national government spending and extended tax cuts during an economic
downturn, adding to the federal deficit, while cutting federal spending and increasing taxes to
limit deficits during periods of economic growth.74 The main thesis is that in a severe downturn,
no one has the ability to spend except the national government because only the national
government has the ability to add public debt in the absence of a healthy private credit market.
While there is criticism of the idea of government spending during periods of economic growth
since it merely adds to the federal debt without providing a significant multiplier, the main
Keynesian idea is that during economic downturns the federal government has the ability to
spend to promote jobs and thereby diminish the extent of the private sector employment losses.
71 The elephant in the room is China. The effects of China’s trade and currency policies on the U.S. hadconstrained the Fed’s actions in the 2000s and may have contributed to an artificially low inflation period,while China’s policies going forward may aggravate the Fed’s stimulative actions. See the discussion on
China.72 See Rajan, R., op. cit.73 See Keynes, J., op. cit.74 There are two generations of Keynesian thinking, with New Keynesians integrating tax policy intomacroeconomics. See Romer, C. and D. Romer, “The Macroeconomic Effects of Tax Changes:Estimates Based on a New Measure of Fiscal Shocks,” Am. Economic Rev., 100, pp. 763-801, June, 2010[arguing for using tax policy for effective fiscal action]. However, even the 1937 U.S. tax increases thatstimulated the 1937-8 recession were well known as a problem. See Cogan, J., T. Cwik, J. Taylor and V.Wieland, “New Keynesian versus Old Keynesian Government Spending Multipliers,” ECB WorkingPaper No. 1090, 2009 [discussing different stimulus strategies for fiscal policy].
8/2/2019 Post Depression Economics
http://slidepdf.com/reader/full/post-depression-economics 54/82
Post-Depression Economics
- 54 -
On the other hand, conservative economists have a preference of promoting tax cuts to
stimulate the economy.75
In the 1980s and 2000s, the hope was that the tax cuts would trigger an
economic expansion, but, much like giving sugar to a child, this stimulus was short lived as the
economy readjusted to the new equilibrium.76 There are limits of the effect of tax cuts. First, tax
cuts are optimized only when there is a federal surplus. In other words, cutting taxes makes
sense only in a period of sound fiscal policy so as to provide capital to the private sector to
stimulate growth. In an optimum scenario, tax cuts yield higher growth and marginally more
aggregate revenues to tax. Second, the tax cuts need to be equitable. Tax cuts for the middle
class are generally spent so as to increase demand, which increases economic growth, while tax
cuts for the wealthy are generally not spent since the wealthy do not need the extra small
percentage of income; rather, the wealthy tend to save the extra tax bonus, which is inefficient
since tax revenues are useful to balance the federal budget. This view of focusing on middle
class tax cuts is consistent with the neoclassical view of marginal utility in which one spends
capital only after a marginal equilibrium point. The view of the conservatives, however, in
pushing tax cuts for the wealthy, is to promote investment capital.77 To be effective, though, this
position requires a focus on specific types of investment, such as risky long-term research, or the
investment incentive promotes moral hazard that fuels bubbles.
75 See Alesina , A., “Tax Cuts vs. ‘Stimulus’: The Evidence is In,” WSJ, 2010 [arguing that tax cuts aresuperior to fiscal stimulus in affecting economic growth]; Boskin, M., “Summer of Economic
Discontent,” WSJ, 2010 [discussing different options for fiscal policy with an aim to optimize economicgrowth]; Feldstein, M., “Rethinking the Role of Fiscal Policy,” NBER Working Paper No. W14684, 2009and; Hubbard, R. and P. Navarro, Seeds of Destruction: Why the Path to Economic Ruin Runs Through
Washington, and How to Reclaim American Prosperity, 2010 [arguing that fiscal policy, particularlyKeynesian stimulus, is an inferior strategy for activating economic growth].76 Note that median real estate prices rose more than 10% a year over ordinary growth rates for threeyears in the 1980s corresponding to the tax cuts, stimulating inflation and creating a new priceequilibrium.77 This is why tax cuts biased to the wealthy, capital gains tax cuts and estate tax cuts are a three-fer forinvestors.

8/2/2019 Post Depression Economics
http://slidepdf.com/reader/full/post-depression-economics 55/82
Post-Depression Economics
- 55 -
When used as a stimulus, then, tax cuts fit the Keynesian doctrine, because they are used
at a time of economic distress – and may be justified – in a long-term deficit in order to stimulate
the short-term economy. Contrarily, during times of economic growth, taxes should be tailored
to pay down the long-term deficit in conjunction with spending limits.
Nevertheless, the conservative economists focus on tax cuts in part to constrain the size
of government. With less capital from lower taxes, the government has fewer resources with
which to use; the idea is that government spending is a lower multiplier than the private
allocation of capital. In general, then, the argument is that smaller government promotes faster
economic growth.
78
While this may be true during an optimal period of economic growth, the
Keynesian response is that since only the federal government has the capacity to borrow during
periods of economic crisis, only government spending during a crisis will limit the downturn and
stimulate growth in the recovery period even when it enhances deficits.79 A patient takes
medicine when sick and exercises when healthy.
Although the U.S. provided tax cuts in the 2000s – biased to the wealthy with an aim to
stimulate investment – when the federal government had a surplus from the 1990s fiscal
austerity, this was a period to actually raise taxes, particularly on the wealthy, because of a need
to pay higher costs associated with two wars. In other words, the U.S. needed to limit spending,
reduce the deficit and adjust taxation correspondingly, but instead lowered taxes and increased
spending which contributed to an unstable fiscal period. Consequently, the tax cuts had the
adverse effects of higher deficits, increased stratification, diminished demand from constrained
78 See Reinhart, C. and V. Reinhart, op. cit., 2009 [arguing from international evidence that lowergovernment spending after an economic contraction, particularly after a financial crisis, results in a fasterrecovery period]. See also Reinhart, C. and K. Rogoff, “From Financial Crash to Debt Crisis,” NBERWorking Paper, 2010 [discussing the relations between the debt deleveraging process and the initialfinancial crisis].79 See Krugman, P., “Is Fiscal Policy Poised for a Comeback?,” Oxford Rev. of Economic Policy, 2005[arguing for a Keynesian approach to stimulating economic growth].
8/2/2019 Post Depression Economics
http://slidepdf.com/reader/full/post-depression-economics 56/82
Post-Depression Economics
- 56 -
middle class capital availability and increased economic instability while the U.S. government at
the same time increased spending.
What is now needed are relatively modest tax cuts targeted to the middle class, which is
most likely to spend the bonus and which will then nominally increase economic demand. Once
the economy grows, then taxes need to rise on both the middle class and the higher income
brackets in order to limit the deficit. At the same time, federal spending needs to be constrained
after the economy recovers so as to further limit the deficit.80 In effect, a healthy economy
requires a balanced budget with constrained spending and moderate taxes. Balancing the federal
budget is especially challenging, however, in a period of economic decline, particularly at a time
when the states are strained with increased demands for services that have largely been shifted
from the federal government.
Supply-side tax policy, therefore, fits squarely in neo-Keynesian economic policy. The
application of the extreme approach to tax cuts used in the 2000s illustrates a politicization of tax
policy that allowed the upper class effectively to sack the treasury for personal benefit while
destabilizing the middle class and the general economy in the long-run.
In addition to tax policy, libertarian ideology promoted industrial deregulation that
affected competition policy with perhaps long lasting adverse economic consequences. If the
competitive configuration of industry is a major factor in setting up and protracting a downturn,81
then antitrust and patent laws are crucial for maintaining balanced industry competition. On the
80 See Lazear, E., “How to Grow Out of the Deficit,” WSJ, 2010 [advocating a creative “inflation-rateminus 1%” federal spending stratagem.] A derivative idea is “pay-go” minus 1%.81 It is interesting to note the extreme concentration of Japanese industry and the effects of oligopolousindustry configuration on Japan’s slow economic growth. One can make a similar case in Europe. Weak patents in both regions perpetuate incumbent market power and represent a contradiction to democraticcapitalism. Is the U.S. repeating these mistakes?
8/2/2019 Post Depression Economics
http://slidepdf.com/reader/full/post-depression-economics 57/82
Post-Depression Economics
- 57 -
one hand, antitrust law constrains dominant firms while, on the other hand, patent law gives
market entrants important competitive tools.
In the 2000s, antitrust policy was, predictably, very lax. The effect of this was extreme
industry concentration and polarization. The effects of cartel industry organization are to retard
competition, particularly for job-creating market entrants.
At the same time, patent laws were weakened in a succession of judicial decisions in the
2000s, showing the increased market power of dominant beneficiary technology firms protecting
incumbent monopoly profits. Strong patent laws promote investment in risky technologies and
provide valuable incentives for market entrants. It is therefore essential to a healthy economy to
maintain strong patent rights. Without a strong patent system, competition suffers.
The projected slow economic growth of the next few years will be caused by a number of
factors, but extreme industry concentration is a chief cause. Enforcing strong antitrust and patent
laws are an important way to correct the imbalances, with the effect of improved competition and
accelerated economic growth. Particularly since small and new companies create the majority of
jobs, protecting these endangered species is essential.
There are thus clear logical contradictions of libertarian economic principles. These
contradictions were applied to policies that had adverse effects on America’s economic
performance in the 2000s.
Redefining Conservatism
The rise of conservatism in the 1980s and 2000s reveals a philosophy that encompasses
social, economic and international issues. While the religious conservatives and international
“neocons” are part of the conservative movement, the focus here is on the libertarian strain of
conservatism that affects economic policy. The thesis is that there are contradictions in the
8/2/2019 Post Depression Economics
http://slidepdf.com/reader/full/post-depression-economics 58/82
Post-Depression Economics
- 58 -
libertarian philosophy that have contributed to the economic policies of the 2000s and that these
led to the economic depression in 2007-9, much as a similar conservative economic philosophy
in the 1920s led to the Great Depression. Though there are two distinct waves of libertarianism
from Reagan-Bush in the 1980s that led to the 1990-1 recession and Bush II in the 2000s that led
to the 2007-9 depression, the present discussion is focused on the 2000s.
In general, the libertarian philosophy promotes laissez faire economics espoused by the
Chicago School.82 This view has several components. First, it promotes limitations on
government regulation with a goal to promote private competition. Second, it restricts
progressive taxation. Third, it removes the obligation for social programs from the federal
government and transfers them to the states and localities as much as possible. Fourth, it
advocates diminished government. Taken together, these principles represent a sort of social
Darwinism to promote a private economy. The main aim is to decentralize government to the
private sector with an aim to promote competition through incentives.83 Unfortunately, the
results have been reduced competition, enhanced stratification and increased economic stability.
One main supply-side economic idea is that by providing economic benefits to investors,
mainly through regressive taxation policies, a “trickle-down” from the wealthy to the middle
class will occur. That is, this view maintains that by providing policies that benefit investment
capital, businesses will hire more workers and the economy will flourish. However, classical
economics has shown that industrial development is contingent on demand, not supply alone, in
82 The “Chicago School” is the University of Chicago economics department, which, under theleadership of Milton Friedman, was honored by no less than 23 Nobel prizes in economics or over a thirdof these awards so far. Though there are several components of the Chicago School, the main thrustfocuses on monetarism and laissez faire economics. The Chicago School is often contrasted to theeconomic philosophies of Harvard University and the University of Cambridge (UK). Ironically, thoughReagan and Bush II embodied the Chicago philosophy, Obama actually taught, and maintains a home at,the University of Chicago.83 See Barro, R., “Obamanomics Meets Incentives,” WSJ, 2010 [arguing that private incentives aresuperior than Keynesian stimulus in activating economic growth].

8/2/2019 Post Depression Economics
http://slidepdf.com/reader/full/post-depression-economics 59/82
Post-Depression Economics
- 59 -
the long-run. By constraining capital resources for the middle class, demand is suppressed and
companies cannot grow and hire employees. Contrarily, when the middle class has resources,
they buy goods and companies grow by hiring employees to make the goods. The tax cuts
provided by supply-side economics distort the incentives in the short-run by temporarily
increasing demand and creating artificial demand. On the other hand, when the tax cuts are
provided during periods of economic growth when the government increases spending, deficits
increase and jeopardize future growth. In other words, there are only limited conditions for the
successful economic effects of tax cuts: focus tax cuts only on the middle class, only during
periods of economic decline and only when the cuts are balanced by spending cuts so as not to
increase the deficit. Both Presidents Kennedy and Clinton observed these principles with
substantial success.
It is clear that the effect of the libertarian philosophy is to promote benefits for the
wealthy at the expense of the middle class. The suppression of resources for the middle class
reduces the education system and infrastructure spending as the deficit is increased, with lasting
adverse strategic consequences since spending on education and infrastructure are clear
multipliers of economic growth as witnessed by investments in the 1950s and 1960s.
Seen in the light of responsible economics, balanced budgets and economic growth, it is a
contradiction for libertarians to simultaneously want both lower taxes targeted to the wealthy and
deficit reduction. Tax cuts targeted to the wealthy is the greatest waste of public resources
possible since the wealthy generally save any tax bonus. The rich are the least likely to spend a
tax cut and do not need a tax cut and the U.S. cannot afford to give them a tax cut. This simply
illustrates a massive abuse of arithmetic.
To the degree that tax cuts are stimulative, they should be targeted to the middle class,
which tends to spend them to create demand for goods. The best time to use this approach, since

8/2/2019 Post Depression Economics
http://slidepdf.com/reader/full/post-depression-economics 60/82
Post-Depression Economics
- 60 -
it has an adverse effect on the deficit without simultaneously cutting spending, is either during an
economic downturn, which then adds to the deficit, or during a period of economic growth while
the government also cuts spending. In either approach, since tax cuts are stimulative, they
represent macroeconomic policy that fits into Keynesian economic stimulus policy.
The libertarian quest to provide tax breaks that are biased to the wealthy are actually
economically inefficient since the stimulus is used, not to spend on goods which then stimulates
production, but to spend on speculative investments. This unnecessary incentive to speculate
allows a small class of investors to take greater risks. This increased risk taking promotes a
moral hazard since the government may eventually be required to bail out the riskiest
investments.
The libertarian view of promoting tax breaks biased to the wealthy also encourage
hoarding by the wealthy. After a limited threshold, the wealthy are likely to save their tax
breaks. Rather than spend the tax break on goods that they could otherwise buy from other
income, their savings are increased. In fact, savings are given to a group that least needs to save
since they already have surplus capital beyond their needs. This is why they are rich.
One credible libertarian argument is that small business owners, who create jobs by
growing their businesses, are often rich and that by providing tax cuts as investment incentives
economic growth is promoted. However, it is possible to exempt this small group
(approximately 3% of small business owners earn over $250K a year according to Census data)
from tax increases so as to target maximum investment effects.
One consequence of the libertarian view is the reinforcement of long-term structural
inequality. With more wealth for the wealthy and relatively less for the middle class, society
becomes far more stratified. This stratification is more reminiscent of the social structure of
Third World countries. Such stratification increases economic instability for the whole society,

8/2/2019 Post Depression Economics
http://slidepdf.com/reader/full/post-depression-economics 61/82
Post-Depression Economics
- 61 -
as witnessed by the severe economic downturns of 1929-32 and 2007-9. One adverse effect of
the long-term tax cuts of the 2000s, then, was the decline of the middle class relative to all prior
historical measures.
While conservative economists focus on the success of a small group of elite corporations
that inhabit concentrated industries, they ignore the facts that the middle class supports the
demand for products and services from these companies. When the middle class is diminished,
the profits of the large corporations that cater to them also suffer. The long-term effects of
diminished industrial regulation are to decrease competition, which promotes monopoly pricing.
A consequence of these elite-focused tax and deregulation policies leaves the middle class
between a rock and a hard place.
There is a cynical view that the libertarians are focused on limiting political choices, such
as through the promotion of high federal debt, in order to tie the hands of future generations to
limit spending money on entitlement programs such as social security, Medicare and welfare.
The long-term effects of the conservative economic policies have been to harm
education, energy, health care, finance, tax and innovation policies. Since it is only through the
management of these policy agendas that the U.S. has a promise of prosperity, the conservative
economic policies need to be constrained and moderated.
It would appear that the middle class was repeatedly deceived by ideological rhetoric to
vote for policies that harmed their interests. From a utilitarian viewpoint, there is no moral
component in the social Darwinism espoused by the libertarian agenda since it appears to benefit
a small group at the expense of the larger society. In fact, if a main duty of democratic
government is to promote equity and fairness, the U.S. failed its citizens at a critical turning
point in history. Law and policy should be used to protect the weakest in a civil society not to
hurt them.

8/2/2019 Post Depression Economics
http://slidepdf.com/reader/full/post-depression-economics 62/82
Post-Depression Economics
- 62 -
The effects of the application of these extreme libertarian economic policies have been
far more negative than a single economic business cycle. The structural changes to the economy
from the implementation of libertarian policies are bound to have long-term adverse economic
consequences.
The conservative libertarian agenda represented a revolution of political ideology in the
1980s and 2000s. Yet, the libertarian economic philosophy turned out to be reckless and un-
strategic. Now, what is most needed is real “conservatism” – a new moderation – to solve a
broad range of problems. We need responsible economics more than ever. Finding these
solutions is our present challenge.
Failed Economics
Economics is not a science. Academic economists are technical specialists operating
within a quantitative paradigm since WWII. Economics did not predict the onset of the real
estate bubble, the burst of the bubble, the consequences on the financial industry, the
concentration of strategic industries, the effects of monopolization, the timing of events or their
collective consequences on the economy or society. One must question the connection, then,
between what economists do and the real economy.
On December 5, 2008, after the Lehman Brothers bank failure precipitated the global
financial crisis, the Queen of England, in a routine visit to the London School of Economics,
asked economists: “If these things were so large, how come everybody missed them?” After
months of analysis, in a letter to the Queen dated July 22, 2009, the economists replied in a
public mea culpa:
“Many people did foresee the crisis. However, the exact form that it would take and thetiming of its onset and ferocity were foreseen by nobody. . . . There were many warnings aboutimbalances in financial markets in the global economy. . . . But the difficulty was seeing the risk
8/2/2019 Post Depression Economics
http://slidepdf.com/reader/full/post-depression-economics 63/82
Post-Depression Economics
- 63 -
to the system as a whole rather than to any specific financial instrument or loan. Risk calculations were most often confined to slices of financial activity, using some of the bestmathematical minds in our country and abroad. . . [T]hey frequently lost sight of the biggerpicture. . . . But against those who warned, most were convinced that banks knew what theywere doing. They believed that the financial wizards had found new and clever ways of
managing risks. . . . These views were abetted by financial and economic models that were goodat predicting the short-term and small risks, but few were equipped to say what would happenwhen things went wrong as they have. . . . There was a broad consensus that it was better to dealwith the aftermath of bubbles in stock markets and housing markets than to try to head them off in advance.
“. . . The failure was to see how collectively this added up to a series of interconnectedimbalances over which no single authority had jurisdiction. This, combined with the psychologyof herding and the mantra of financial and policy gurus, lead to a dangerous recipe. Individualrisks may rightly have been viewed as small, but the risk to the system as a whole was vast.
“So in summary, Your Majesty, the failure to foresee the timing, extent and severity of the crisis and to head it off, while it had many causes, was principally a failure of the collective
imagination of many bright people, both in this country and internationally, to understand therisks to the system as a whole.” (“Letter to the Queen: The Global Financial Crisis – WhyDidn’t Anybody Notice?,” July 22, 2009)84
Perhaps there was no experience for the current members of the economics profession to
such a substantial economic decline. Yet the 1980s and subsequent 1990-1 recession illustrated
an adequate dress rehearsal for the present downturn. Also, the experience of the 1920s and its
aftermath are clearly etched in the historical experience, with a clear repetition of economic
policies in the 2000s.
A plausible explanation for the lapse of the economics profession in anticipating the
economic downturn and financial crisis comes from understanding the ideological polarization of
the profession. The conservative movement, with its roots at the University of Chicago, has been
persuasive in convincing policy makers of the righteousness of the libertarian laissez faire
economics approach to political economics. There are times when this group focuses on its
ideological bias at the expense of sound economic principles. This may have been one of those
times.
84 As a program note, the British voters responded to the adverse economic conditions by electing aconservative biased coalition government, which instituted near-Draconian austerity measures to addressthe aftermath of the economic downturn.
8/2/2019 Post Depression Economics
http://slidepdf.com/reader/full/post-depression-economics 64/82
Post-Depression Economics
- 64 -
What we need is evidence-based economics. It is interesting that the economics
profession cannot agree on the causes and effects of economic phenomena until years after a
forensic analysis. For example, why cannot economists come to a common ground on tax
policy, on Keynesian policy (especially during economic stress periods) and on social equity? It
would appear that only evidence-based economics would make a difference in understanding the
causes and effects of economic phenomena. Without an objective analysis of economics, it is
impossible to make accurate forecasts or provide policy prescriptions. From such objective
economic analysis a collective consensus should evolve.
In retrospect, the shallow depression of 2007-9 was predicable. An analysis of history in
the 1920s and a comparison with policies in the 2000s showed clear parallels. Libertarianism
had the same effects in both periods. The train wreck of the depression was predictable but not
actually predicted. Perhaps if the economics profession had scientific credibility these
predictions would have been clear and prescriptions would have been made to correct the
problems before they became severe. Instead, ideological policy makers kept drinking the Kool-
Aid and the problems festered until they literally led to a financial breakdown.
An example of economic policy that appears to have had clear influence on avoiding
economic problems is industrial regulation with competition policy. While antitrust policy
affects fair competition, patent law is useful to provide tools for market entrants. Both antitrust
regulation and strong patent laws are useful, yet in the 2000s both were weakened. The
cumulative effects of industrial deregulation were clear industrial stratification that had
deleterious aggregate economic effects.
Another area is the regulation of the financial services industry. The strategic importance
of the financial industry shows, in retrospect, that U.S. regulation was instrumental to a healthy
functioning economy.

8/2/2019 Post Depression Economics
http://slidepdf.com/reader/full/post-depression-economics 65/82
Post-Depression Economics
- 65 -
The libertarian ideologues appear to have only one tool in their policy agenda: tax cuts.
But tax policy is not clearly analyzed and has been misused and misunderstood. The adverse
consequences of using only tax cuts as an economic tool has become apparent, viz., a stratified
society with a large deficit that leads to economic instability. Tax cuts appear to be prominent
for libertarians since they fit in with the larger ideological component of smaller government.
The lack of objective clarity on economics has blemished the dismal science. Without an
evidence-based approach to economics, the economy is a social experiment without sound
science behind the policy. There is plenty of room for the economics profession to adapt to get it
right in order to predict, and to provide solutions to minimize the impact of, the next economic
crisis. A study of economic history would be a good start, but, evidently, most economists do
not believe in the value of learning from history and are not apparently well versed in economic
history. Along with a review of economic methodology itself and recognition of the over-
reliance on math, the shortcomings of learning economic history should be rectified by a change
in the academic curriculum.
The failure of the economics profession to predict or resolve the economic downturn says
something fundamental about the failure of the academic bureaucracy. Academia is
marginalized by over-specialization, over-used quantitative thinking and undue politicization. At
the end of the day, the social sciences are part science and part art. The origins of economics
show that the profession evolved from moral philosophy. Viewed as moral philosophy, it is
clear that the ideological polarization of the economics profession has been politicized by
rhetoric and biased financial influences. The evidence is that economics has been less an
objective science than the exercise of political power.

8/2/2019 Post Depression Economics
http://slidepdf.com/reader/full/post-depression-economics 66/82
Post-Depression Economics
- 66 -
Policy Prescriptions
There is a rising consensus for policy prescriptions to improve the economy. First, the
U.S. needs to stabilize the housing sector. Second, the U.S. needs to stimulate domestic
consumer and business demand. Third, the U.S. needs to bring down unemployment by
increasing domestic production. The main challenge is to figure out how to stimulate the
economy within financial constraints, but without over-stimulating inflation.
The libertarians want to stimulate the economy by providing tax “incentives.” The
Keynesians want to increase government spending, particularly during downturns, in order to
stimulate the economy. There is a need to find some balance between these different
perspectives. What is needed is a philosophical synthesis.
If the Keynesians and libertarians both fail, then the U.S. will be shown to be in a
structural decline, an end of an epic of American power driven by its laissez-faire capitalist
model. The U.S. will have followed England as a great power that declined relative to other
economic systems. The U.S. will be seen as uncompetitive relative to East Asian hybrid
communitarian capitalist models. The U.S. leadership of liberal capitalism and American
national security will also wane along with the decline of American economic power, like Rome
before it. While, in the aggregate, this is a fatalistic and cynical conclusion, in the aftermath of
an economic depression there is an inevitability of a reduced quality of life for many in the
middle and lower classes. The depression signifies the structural termination of the
consequences of a failed conservative philosophy.
The political paralysis that reflects the divergence of economic philosophies between the
Keynesians and the libertarians shows that American democracy itself has a problem. The
immobilization of democratic institutions seems to be a reflection of the polarized party system.
Moreover, political polarization constrains government action; with much talk about the

8/2/2019 Post Depression Economics
http://slidepdf.com/reader/full/post-depression-economics 67/82
Post-Depression Economics
- 67 -
problems of deficit spending, there is a fundamental limit to further Keynesian stimulus
spending. Yet, it should be clear that without government action, the shallow depression would
have been a full scale 19th century style of depression that would have had substantially worse
outcomes. Consequently, though the federal government and the Fed have provided some
stimulus, there are limits to future stimulus because of the political paralysis. With consumers in
a particularly weak position, we can thus expect a slow rebuilding process after a period of debt
liquidation and consolidation.
Only one president in the last generation has been successful in instituting conservative
economic policies. In the 1990s, Clinton was successful at instituting nominal tax increases that
ultimately balanced the federal budget and brought down the federal debt. With less public debt,
the economy flourished in a golden epoch. In addition to balancing the budget, Clinton applied
progressive taxation to limit the inequities of prior periods. Further, Clinton regulated the
financial industry, maintained a clear and fair competition policy that limited incumbent
monopoly power and promoted strong patent policy that maintained competition. It seems that
these policies are worth careful inspection for applying to future economic policy.
For now, though, what can be done to accelerate the recovery from the depression?
Doing nothing, as anti-government ideologues prefer, is insufficient. To analogize the economy
to a patient, not intervening by withholding medicine or surgery would be archaic and inhumane.
As a counter-factual, it is uncontroversial to consider that without stimulus in 2008 and 2009 the
economy would be substantially worse; despite its limits, stimulus did not fail since it stopped a
major decline. We know that balanced economic policy has worked in the past, but what
policies should be invoked going forward?
In January, 2010, the non-partisan Congressional Budget Office ranked a set of policy
options in order to promote economic growth and greater employment. Ranked in order, the

8/2/2019 Post Depression Economics
http://slidepdf.com/reader/full/post-depression-economics 68/82
Post-Depression Economics
- 68 -
prescriptions include: (1) Increasing aid to the unemployed; (2) Reducing employers’ payroll
taxes; (3) Reducing employers’ payroll taxes for firms that increase their payroll; (4) Reducing
employees’ payroll taxes; (5) Providing an additional one-time social security payment; (6)
allowing full or partial expensing of investment costs; (7) Investing in infrastructure; (8)
Providing aid to states for purposes other than infrastructure; (9) Providing additional refundable
tax credits for lower- and middle-income households in 2011; (10) Extending higher exemption
amounts for the alternative minimum tax and; (11) Reducing income taxes in 2011.85 These
remedies should be carefully inspected; the best of these practices should be implemented.
Here is a summary of additional policy recommendations for stimulating economic
growth:
• Finance
1. Accelerate debt liquidation
2. Provide housing stimulus
3. Maintain government debt reduction
• Infrastructure and education investment
• Incentives for small business
1. Enforce antitrust laws to promote competition
2. Strengthen patent laws to promote competition
3. U.S. tax incentives should be targeted to R&D
4.
Health care costs should be capped
5. Promote energy independence to control costs
• Targeted tax cuts in short-run
85 See CBO, “Policies for Increasing Economic Growth and Employment in 2010 and 2011,” January,2010.

8/2/2019 Post Depression Economics
http://slidepdf.com/reader/full/post-depression-economics 69/82
Post-Depression Economics
- 69 -
1. Focus tax cuts on the middle class
2. Exempt small business from tax increases
• Raise taxes gradually during recovery
1. Increase taxes on financial industry compensation
2. Tax foreign profits of U.S. corporations to repatriate capital
• The Fed should modulate monetary policy
1. The money supply should be increased in the short-run
2. Interest rates need to be increased in the medium term to control inflation
• Social security should be balanced
1. Means test for social security
2. Increase the retirement age as a selectable preference
• Insist that allies pay more for military budgets
1. Reduce the U.S. defense budget
• Address China trade policy
1. Insist the yuan is in equilibrium with other currencies
2. Enforce WTO issues with China’s unfair trade practices
• Change media and campaign finance laws
1. Limit media companies to balanced representation, like before 1986
2. Limit corporate campaign contributions that taint democratic politics
When these policies are implemented, the U.S. economy will be far stronger, economic
growth will increase, unemployment will drop significantly and stratification will be reduced.
It is imperative to find ways to liquidate consumer and business debt. The crisis began in
2007-8 with the decision not to write off a substantial amount of debt from bank balance sheets.
Yet, this is reminiscent of Japan’s lost decade, which the U.S. appears to be repeating. The
8/2/2019 Post Depression Economics
http://slidepdf.com/reader/full/post-depression-economics 70/82
Post-Depression Economics
- 70 -
failure to write off debt is particularly evident in the real estate sector. Specifically, we need to
work hard to restructure mortgage debt to reduce foreclosures. Congress authorized assistance
that banks refuse to implement. The U.S. must accelerate the write off of some types of debt.
The 2006 bankruptcy act, largely written by financial services industry lobbyists to
prevent debt from being easily written off, needs to be completely revised to accommodate a
democratic paradigm of allowing consumers to write off onerous debts to start fresh.
Banks need to be allowed by regulators to restructure their balance sheets to have
somewhat less capitalization in order to make more business and consumer loans. While the
pendulum swung from one extreme to the other, it needs to be moderated.
Glass-Steagall legislation, which separated commercial and investment banking
institutions, needs to be reinstituted in order to manage financial risks and increase banking
industry competition. Dodd-Frank only brought us halfway to the goal.
Clearly, the U.S. needs to instigate a housing stimulus. The $8K new owner housing tax
credit was very successful, but needs to be extended and applied to all home buyers in order to
arrest the oversupply of homes from the dramatic rise in foreclosures that is a root economic
problem. A low interest loan program to help home buyers sell their present homes would help
both home sales (and prop up property prices) but would also allow the unemployed to find jobs
in other areas.
The U.S. needs to promote policies that will encourage long-term savings. The U.S.
needs to move from a consumption-based economy to a production-based economy. Tax policy
may be useful to reward savers.
While it may seem to be inconsistent with Keynesian economics, in the long run, the U.S.
government needs to limit the federal deficits and the federal debt. One main way to do this is to
raise taxes and to cut costs. These processes can be done gradually. If they are done gradually,
8/2/2019 Post Depression Economics
http://slidepdf.com/reader/full/post-depression-economics 71/82
Post-Depression Economics
- 71 -
as in the 1990s, consumers and businesses will have enough advance warning to plan and adjust
their expectations. But, after the recovery improves, a relatively smaller government86
and a
larger private sector are healthy for long-term economic growth.
The U.S. needs to control costs. The right wants to limit entitlements and the left wants
to limit defense. Both categories need to be reviewed. Foreign wars need to be reigned in since
we cannot afford them and they are at best strategically debatable. A ten to fifteen percent
decline in government spending is possible, and even necessary, over five to ten years. DOD can
be cut twenty to thirty percent (from a stunning $895B in FY 2011 – including veterans costs but
excluding supplemental war costs – equal to all other national defense budgets combined) and
improve readiness with increased automation and competition.
The U.S. needs to improve its infrastructure. The transportation and telecommunications
systems need to be updated. Infrastructure improvement is a long-term multiplier; one dollar
spent now gives several dollars of benefits over several decades.
Another area of needed infrastructure improvement is intellectual. The education system
requires a systematic rethinking. One controversial idea, which is somewhat realistic but
constrains the vision of American middle class opportunities, is to adopt the “tracking” system
used in Europe. At the middle school period, students are tracked for either vocational education
or college preparation. This would increase efficiency in the education system to allow us to
devote public resources to advanced kids that will propel the economy with a significant
multiplier. Another idea is to provide economic incentives akin to a GI plan for high school and
college students to excel. Perhaps we should stop teaching to the test and even reduce the
86 Most of FY 2011 federal government expenses are defense ($895B), social security ($774B), Medicare($829B) and welfare ($557B). While the goal is to increase efficiency with program cuts, the timing of this process is critical so as not to exacerbate the economy as it slowly recovers.
8/2/2019 Post Depression Economics
http://slidepdf.com/reader/full/post-depression-economics 72/82
Post-Depression Economics
- 72 -
emphasis on testing since it clearly does not work. Finally, the U.S. should allow corporations to
write off education investments so as to encourage retraining.
Many ideas and much money have been thrown at the education problem, with a
persistent downward trend. But the U.S. education system is in decline by every conceivable
metric, except at the most elite levels. States have been forced to increase funding for health
care and prisons at the expense of schools, which is problematic in the long-run. The middle
class has been short-changed and policies need to be developed to arrest the terrible decline.
Like infrastructure, intellectual capital is a multiplier. In the long-run, the U.S. needs to invest in
education.
Small and new businesses provide about three fourths of new jobs. The U.S. needs to
find ways to help small business since bank lending has declined. One way to help small
business and market entrants is to enforce the antitrust laws. The large corporations now
dominate virtually every industry and use high barriers of entry to support their advantages. The
large corporations need to be restrained in their competitive tactics to promote competition for
small and mid-sized companies. One way to promote fair competition is to enforce criminal
penalties and treble damages for antitrust violations, particularly focused in the financial, energy,
technology and communications industries. The courts and Congress need to look carefully at
reinstituting the pre-1977 period of effective antitrust enforcement. Moreover, large corporation
patent portfolios should be available to market entrants (not peer rivals) by implementation of
common carrier policies.
One main way to provide tools to small companies to compete is to strengthen patent
laws. Patents are critical tools that incentivize innovation and investment and promote
competition. Patents help David against Goliath. Historically, enforcement of strong patent laws
has led to periods of sustained growth and weak patent laws have allowed industry incumbents to

8/2/2019 Post Depression Economics
http://slidepdf.com/reader/full/post-depression-economics 73/82
Post-Depression Economics
- 73 -
restrain competition and growth to maintain monopoly profits. The U.S. needs to address this
critical arena after a period during the 2000s of weakening patent rights with several onerous and
narrow judicial decisions that harmed competition, technological progress and economic growth.
Pending patent legislation in Congress (written by electronics cartel lobbyists) needs to be
completely rewritten and fundamentally rethought in order to promote market entrants rather
than the predatory incumbents. Further, the Patent Office needs to accelerate the processing of
patents. Since the majority of jobs are created by new and small businesses, promoting strong
patents creates jobs. Only the U.S. has a democratic patent system that helps any entrepreneur
with a new idea to compete in the marketplace. If history is a guide, strengthening patent laws
will create an outsized share of GDP growth, fair competition and robust job creation. Finally,
promoting innovation through strengthening patent law should improve productivity in the long-
run, which is a tremendous engine of economic growth. Particularly since the U.S. has limited
manufacturing, it is necessary to promote innovation through the democratization of strong
patent laws. Because innovation is America’s only remaining competitive advantage, it is absurd
not to promote strong patents in order to rebuild the economy in the 21st century.
Tax incentives should be carefully targeted for specific innovation investments. Rather
than applying capital gains tax cuts to all investors, the capital gains tax cuts should be focused
on R&D and small business investments that lead to long-term economic growth. The idea is to
provide an incentive for investors to take risks. For a decade, investment capital went into
inefficient investments (like mortgage securities) and not into innovation. As a consequence, the
U.S. has fallen behind in technology development according to any metric compared to a decade
ago.
The U.S. needs to modify the health care law to control costs. To require health care
insurance without controlling costs is a contradiction. Whether through the promotion of

8/2/2019 Post Depression Economics
http://slidepdf.com/reader/full/post-depression-economics 74/82
Post-Depression Economics
- 74 -
competition or some sort of insurance exchange, the U.S. needs to address this loose end.
Particularly since health care costs are a fundamental part, and, with an aging baby boom
generation, represents an increasingly larger share, of the economy, we need to control these
costs fairly and humanely.
The U.S. also needs to address its energy issues and provide ample alternatives to fossil
fuels. Only the government can provide the extensive resources to stimulate the evolution of an
alternative energy industry, but the examples of the Brazilian and Chinese energy industry
developments are interesting. It is apparent that China is making a push in this area and the U.S.
may be able to work symbiotically with the Chinese by promoting innovation and consumer
subsidized incentives to increase energy independence with clean energy. In order to promote
energy independence, it is clear that the oligopolists in the energy industry need to be provided
with carrots and sticks to modify policies to invest in alternatives. Business as usual is not an
option. The environment will benefit from these investments.
The U.S. needs to promote targeted middle class tax cuts in the short-run in order to
provide incentives to increase demand, production and economic growth. In order to encourage
small business investment, the tax cuts could be extended to the 3% of small businessmen that
earn over $250K a year. Accelerating small business capital expense deductions temporarily is
also a way to stimulate demand. A short-term payroll tax holiday is another method of providing
incentive for the middle class to spend money to increase demand. Overall, progressive taxation
helped the middle class to prosper and benefited the public good. This is why a value added tax,
which tends to be regressive, is not a solution.
Taxes for the wealthy should to be raised, however, in order to responsibly pay for
federal programs and deficits. Tax cuts for the wealthy were based on the presumption of a 2001
federal surplus, which is obviously now no longer relevant. Specifically, the U.S. needs to
8/2/2019 Post Depression Economics
http://slidepdf.com/reader/full/post-depression-economics 75/82
Post-Depression Economics
- 75 -
follow Europe to tax financial industry bonuses to realign incentives with the public interest.
The U.S. also needs to raise taxes on estates over $3M. Limited tax cuts can be maintained only
if they are structured to target specific R&D investments.
However, in the long-run, higher marginal taxes need to be paid by the wealthy and the
middle class in order to responsibly pay for government programs if spending can be reduced to
nullify the deficit. Clinton raised taxes in 1994, and also reduced spending, and the economy
experienced a sustained growth for eight years that created 22 million net new jobs. If the tax
increases are gradual and responsible and occur during the growth phase after a substantial
economic recovery then they will have a positive long-term economic effect. Higher taxes,
however, need to be combined with federal spending cuts.
U.S. corporate profits from foreign sources need to be taxed as an incentive to repatriate
capital.
The Fed needs to increase the money supply in the short-run to offset the decline in
borrowing and the consumer and business deleveraging process of debt liquidation. It is
straightforward monetarist economics that an increase in the money supply will cause inflation,
yet, in the face of disinflation, this is the cure. One can argue that the Fed created the 2003-7
bubble that led to the perfect storm of the financial crisis and depression with its unusually low
interest rates in 2001-4. However, no medicine is working now and the Fed is running out of
ammunition. If the long tail of the depression continues for another two years, it will be a missed
opportunity not to do all that could be done to promote economic growth.
The U.S. needs to make the tough decision that it cannot alone cover the military
expenses of Europe and Japan. If Japan steps up to share power, the U.S. military budget can be
substantially pared. This critical obligation will initially help Japan’s economic recovery. As
8/2/2019 Post Depression Economics
http://slidepdf.com/reader/full/post-depression-economics 76/82
Post-Depression Economics
- 76 -
China’s economy and military grow, the U.S. must share power with regional allies to maintain
strategic equilibrium.
Regarding world trade, China’s aggressive (and occasionally unfair) economic policies
have promoted disequilibrium. The U.S. must present cases in the WTO to prevent unfair
trading practices that benefit China and hurt American industry and jobs and that open markets.
Chinese industrial subsidies, IP theft and protectionism must stop. The U.S. and other nations
must work with China to moderate the valuation of the yuan. Failing this, moderate, not
punitive, U.S. tariffs for China’s goods must rise to a level of ordinary trade equilibrium.
On the other hand, the Fed needs to be careful to increase interest rates when the
economic growth period accelerates and needs to apply interest rate indexing to the core inflation
rate. The world runs a risk of another bubble that will require the Fed, and other central banks,
to be vigilant. Because of the artificial manipulation of the Chinese yuan and its effects on
international exchange rates, the Fed and central banks also need to carefully monitor currency
equilibria and international trade.
In the long-run, social security, like health care, poses risks to government financial
stability. It is clear that social security needs to be means tested, payroll tax rates increased and
retirement ages selectively increased in order to balance the budget. This is similar in
importance to a balanced federal budget.
It is imperative to address the problem that is at the root of the instability of the
democratic system in the U.S., namely the connections between corporate money and politics.
The U.S. Congress and courts need to limit corporate campaign contributions if the U.S.
democratic system is to be fair and balanced. In addition, the U.S. needs to reinstitute rules,
abolished in 1986, to require fair and balanced media enterprises.
8/2/2019 Post Depression Economics
http://slidepdf.com/reader/full/post-depression-economics 77/82
Post-Depression Economics
- 77 -
When these responsible and common sense proposals are enacted, which take the best
practices of several diverse political ideologies into account, the U.S. economy will thrive.

8/2/2019 Post Depression Economics
http://slidepdf.com/reader/full/post-depression-economics 78/82
Post-Depression Economics
- 78 -
List of Figures
1 Relative GDP Decline of 2007-9 Downturn 6
2 Total Household Net Worth 7
3 S&P 500 [September 2007 to September 2010] 8
4 Job Losses in Recent Recessions, as Share of Employment 9
5 Case Shiller Index 10
6 Volume of World Merchandise Exports, 1965-2009 11
7 Growth in World Merchandise Exports Trade by Region 11
8 Real GDP and Trade Growth of OECD Countries, 2008-9 12
9 Prices of Selected Primary Products, Jan. 2000 – Jan. 2010 12
10 U.S. Debt by Sector 27
11 U.S. Gross Federal Debt as a Percentage of GDP 28
12 U.S. Debt and GDP 1990-2010 29
13 U.S. Private Debt to GDP 29
14 Correlation of Change in Debt and Unemployment 30
15 U.S. International Trade in Goods and Services 31
16 Median Family Net Worth by Percentile of Net Worth (thousands of dollars) 38
List of Charts
1 U.S. Gross Domestic Product (Trillions of Dollars) 5
2 Total Net Worth, 2007-2010 6
3 Business Contractions: Business Cycle Dates 16
8/2/2019 Post Depression Economics
http://slidepdf.com/reader/full/post-depression-economics 79/82
Post-Depression Economics
- 79 -
Bibliography
Alesina, A., “Tax Cuts vs. ‘Stimulus’: The Evidence is In,” WSJ, September 15, 2010.
Atkinson, T. and T. Piketty, Top Incomes Over the Twentieth Century: A Contrast Between
Continental European and English-speaking Countries, Oxford, 2007.
Barro, R., “Obamanomics Meets Incentives,” WSJ, September 14, 2010.
Barro, R. and J. Ursua, “Stock-Market Crashes and Depressions,” NBER Working PaperW14760, 2009.
-----------------------, “Macroeconomic Crises Since 1870,” NBER Working Paper W13940, 2008.
Becker, G., “China’s Next Leap Forward,” WSJ, September 29, 2010.
Bernanke, B., Essays on the Great Depression, Princeton, 1994.
-----------------, “The Macroeconomics of the Great Depression: A Comparative Approach,”NBER Working Paper No. W4814, 1994.
-----------------, “Nonmonetary Effects of the Financial Crisis in the Propagation of the GreatDepression,” The American Economic Review, Vol. 73 (June), pp. 257-276, 1983.
Bernanke, B. and H. James, “The Gold Standard, Deflation, and Financial Crisis in the GreatDepression: An International Comparison,” NBER Working Paper No. W3488, 1990.
Bernanke, B. and M. Woodford, eds., The Inflation-Targeting Debate, Chicago, 2006.
Bernanke, B., T. Laubach, F. Mishkin and A. Posen, Inflation Targeting: Lessons from the
International Experience, Princeton, 2001.
Boskin, M., “Summer of Economic Discontent,” WSJ, September 2, 2010.
Bradsher, K., “China Takes Lead in Clean Energy, With Aggressive State Aid,” NYT,September 8, 2010.
Bruner, R. and S. Carr, The Panic of 1907: Lessons Learned from the Market’s Perfect Storm,Wiley, 2007.
Brunnermeier, M., “Deciphering the Liquidity and Credit Crunch 2007-08,” NBER WorkingPaper No. W14612, 2008.
Calomiris, C., “Banking Crises and the Rules of the Game,” NBER Working Paper No. W15403,2009.
8/2/2019 Post Depression Economics
http://slidepdf.com/reader/full/post-depression-economics 80/82
Post-Depression Economics
- 80 -
Cassidy, J., How Markets Fail: The Logic of Economic Calamities, Farrar, Straus and Giroux,2009.
Chancellor, E., Devil Take the Hindmost: A History of Financial Speculation, Plume, 2000.
Cogan, J., T. Cwik, J. Taylor and V. Wieland, “New Keynesian versus Old KeynesianGovernment Spending Multipliers,” ECB Working Paper No. 1090, 2009.
Cole, H. and L. Ohanian, “The U.S. and U.K. Great Depressions Through the Lens of Neoclassical Growth Theory,” the American Economic Review, vol. 92, 2002.
Congressional Budget Office, Policies for Increasing Economic Growth and Employment in
2010 and 2011, January, 2010.
Day, V., The Return of the Great Depression, WND, 2009.
Diamond, D. and R. Rajan, “The Credit Crisis: Conjectures About Causes and Remedies,”NBER Working Paper No. W14739, 2009.
Feldstein, M., “Rethinking the Role of Fiscal Policy,” NBER Working Paper No. W14684, 2009.
Garber, P., Famous First Bubbles: The Fundamentals of Early Manias, MIT, second ed., 2000.
Hubbard, R. and P. Navarro, Seeds of Destruction: Why the Path to Economic Ruin Runs
Through Washington, and How to Reclaim American Prosperity, FT Press, 2010.
Ivashina, V. and D. Scharfstein, “Bank Lending During the Financial Crisis of 2008,” EFA 2009Bergen Meetings Paper, 2009.
Jagannathan, R., M. Kapoor and E. Schaumburg, “Why are We in a Recession? The FinancialCrisis is the Symptom Not the Disease,” NBER Working Paper No. W15404, 2009.
Judis, J., “You Say Recession, I Say Depression,” The New Republic,” Sept. 7, 2010.
Kaletsky, A., “Blaming China Won’t Help the Economy,” NYT, Sept. 27, 2010.
Kessler, A., “TARP and the Continuing Problem of Toxic Assets,” WSJ, August 31, 2010.
Keynes, J., The General Theory of Employment, Interest and Money, 1936, reprint, CreateSpace,2009.
Krugman, P., “Taking on China,” NYT, October 1, 2010.
--------------, The Return of Depression Economics and the Crisis of 2008 , Norton, 2009.
--------------, “Is Fiscal Policy Poised for a Comeback?,” Oxford Review of Economic Policy,Vol. 21, Issue 4, pp. 515-523, 2005.

8/2/2019 Post Depression Economics
http://slidepdf.com/reader/full/post-depression-economics 81/82
Post-Depression Economics
- 81 -
--------------, The Great Unraveling: Losing Our Way in the New Century , Norton, 2004.
--------------, “Financing Vs. Forgiving a Debt Overhang,” NBER Working Paper No. W2486,1989.
Lazear, E., “How to Grow Out of the Deficit,” WSJ, Sept. 27, 2010.
Levine, R., “An Autopsy of the U.S. Financial System,” NBER Working Paper No. W15956,2010.
Leuchtenburg, W., The Perils of Prosperity, 1914-32, Chicago, 1993.
McElvaine, R., The Great Depression: America, 1929-1941, Times Books, 1983.
Minsky, H., Stabilizing an Unstable Economy, Yale, 1986.
Mishkin, F., “Is Monetary Policy Effective During Financial Crises?,” NBER Working PaperNo. W14678, 2009.
Murphy, A., “An Analysis of the Financial Crisis of 2008: Causes and Solutions,” SSRN, 2008.
Phelps, E., Structural Slumps: The Modern Equilibrium Theory of Unemployment, Interest, and
Assets, Harvard, 1998.
Porter, G., The Rise of Big Business, 1860-1920, Harlan Davidson, third ed., 2006.
Prechel, H., Big Business and the State: Historical Transitions and Corporate Transformation,
1880s to 1990s, SUNY, 2000.
Rajan, R., Fault Lines: How Hidden Fractures Still Threaten the World Economy, Princeton,2010.
Reich, R., Aftershock: The Next Economy and America’s Future, Knopf, 2010.
Reinhart, C. and V. Reinhart, “After the Fall,” NBER Working Paper No. 16334.
Reinhart, C. and K. Rogoff, “From Financial Crash to Debt Crisis,” NBER Working Paper No.15795, 2010.
------------------------, “Growth in a Time of Debt,” NBER Working Paper No. W15639, 2010.
------------------------, “The Aftermath of the Financial Crises,” NBER Working Paper No.W14656, 2009.
------------------------, “Banking Crises: An Equal Opportunity Menace,” NBER Working PaperNo. W14587, 2008.
8/2/2019 Post Depression Economics
http://slidepdf.com/reader/full/post-depression-economics 82/82
Post-Depression Economics
------------------------, This Time is Different: Eight Centuries of Financial Folly, Princeton, 2009.
------------------------, “Is the 2007 U.S. Sub-Prime Financial Crisis so Different? An InternationalHistorical Comparison,” NBER Working Paper W13761, 2008.
Roach, S., “Cultivating the Chinese Consumer,” NYT, September 29, 2010.
Romer, C., “The Great Crash and the Onset of the Depression,” The Quarterly J. of Economics,Vol. 105, No. 3, pp. 597-624, 1990.
Romer, C., and D. Romer, “The Macroeconomic Effects of Tax Changes: Estimates Based on aNew Measure of Fiscal Shocks,” Am. Economic Rev., 100, pp. 763-801, June, 2010.
-----------------------, “Do Tax Cuts Starve the Beast? The Effect of Tax Changes on GovernmentSpending,” Brookings Papers on Economic Activity, Spring, 2009.
Rothbard, M., America’s Great Depression, Mises Institute, sixth ed., 2005.
Saez, E. and T. Piketty, “Income Inequality in the United States, 1913-1998”, Quarterly J. of Economics, 118(1), 1-39, 2003.
Schularick, M. and A. Taylor, “Credit Booms Gone Bust: Monetary Policy, Leverage Cycles,and Financial Crises, 1870-2008,” NBER Working Paper No. 15512, 2010.
Shiller, R., Irrational Exuberance, Princeton, 2001.
Stiglitz, J., Freefall: America, Free Markets, and the Sinking of the World Economy , Norton,2010.
Story, L., “Income Inequality and Financial Crises,” NYT, August 21, 2010.
Taylor, J., “The Financial Crisis and the Policy Responses: An Empirical Analysis of What WentWrong,” NBER Working Paper No. W14631, 2009.
Taylor, J. and J. Williams, “A Black Swan in the Money Market,” NBER Working Paper No.W13943, 2008.
Related Documents


