Energy Procedia 63 (2014) 7389 – 7397 Available online at www.sciencedirect.com ScienceDirect 1876-6102 © 2014 The Authors. Published by Elsevier Ltd. This is an open access article under the CC BY-NC-ND license (http://creativecommons.org/licenses/by-nc-nd/3.0/). Peer-review under responsibility of the Organizing Committee of GHGT-12 doi:10.1016/j.egypro.2014.11.775 GHGT-12 Post-combustion CO 2 capture from natural gas combined cycles by solvent supported membranes Alberto Voleno a , Matteo C. Romano a *, Davide M. Turi a , Paolo Chiesa a , Minh T. Ho b , Dianne E. Wiley b a Politecnico di Milano, Department of Energy, via Lambruschini 4, 20156 Milano, Italy b Cooperative Research Centre for Greenhouse Gas Technologies (CO2CRC), School of Chemical Engineering, The University of New South Wales, NSW 2052, Australia Abstract Among the CO 2 separation technologies, CO 2 membranes are currently receiving an increasing interest, largely thanks to the development of solvents such as ionic liquids and deep eutectic solvents, which are suitable for use in solvent supported membrane systems. The aim of this work is to perform a techno-economic analysis of a natural gas-fired combined cycle power plant integrating CO 2 membranes. Such a configuration is based on a two- membrane system, the first one separating the CO 2 for final sequestration, the second one used to generate a selective CO 2 -rich flue gas recycle. The techno-economic assessment uses three modelling tools: (i) process modelling of the complete power plant, performed with the in-house GS code and Aspen Plus, (ii) modelling of the membrane, performed with a finite difference method implemented in Matlab and (iii) economic modelling by a bottom-up approach. The final material balances show that using a moderate pressurization of the combined cycle flue gas results in the lowest energy loss and lowest capture cost. Keywords: CO2 capture power plants, CO2 membranes, solvent supported membranes, SILM, deep eutectic solvents, CO2 capture cost * Corresponding author. Tel.: +39-0223993846; fax: +39-0223993913. E-mail address: [email protected] © 2014 The Authors. Published by Elsevier Ltd. This is an open access article under the CC BY-NC-ND license (http://creativecommons.org/licenses/by-nc-nd/3.0/). Peer-review under responsibility of the Organizing Committee of GHGT-12

Welcome message from author
This document is posted to help you gain knowledge. Please leave a comment to let me know what you think about it! Share it to your friends and learn new things together.
Transcript

Energy Procedia 63 ( 2014 ) 7389 – 7397
Available online at www.sciencedirect.com
ScienceDirect
1876-6102 © 2014 The Authors. Published by Elsevier Ltd. This is an open access article under the CC BY-NC-ND license (http://creativecommons.org/licenses/by-nc-nd/3.0/).Peer-review under responsibility of the Organizing Committee of GHGT-12doi: 10.1016/j.egypro.2014.11.775
GHGT-12
Post-combustion CO2 capture from natural gas combined cycles by solvent supported membranes
Alberto Volenoa, Matteo C. Romanoa*, Davide M. Turia, Paolo Chiesaa,Minh T. Hob, Dianne E. Wileyb
a Politecnico di Milano, Department of Energy, via Lambruschini 4, 20156 Milano, Italy b Cooperative Research Centre for Greenhouse Gas Technologies (CO2CRC), School of Chemical Engineering,
The University of New South Wales, NSW 2052, Australia
Abstract
Among the CO2 separation technologies, CO2 membranes are currently receiving an increasing interest, largely thanks to the development of solvents such as ionic liquids and deep eutectic solvents, which are suitable for use in solvent supported membrane systems. The aim of this work is to perform a techno-economic analysis of a natural gas-fired combined cycle power plant integrating CO2 membranes. Such a configuration is based on a two-membrane system, the first one separating the CO2 for final sequestration, the second one used to generate a selective CO2-rich flue gas recycle. The techno-economic assessment uses three modelling tools: (i) process modelling of the complete power plant, performed with the in-house GS code and Aspen Plus, (ii) modelling of the membrane, performed with a finite difference method implemented in Matlab and (iii) economic modelling by a bottom-up approach. The final material balances show that using a moderate pressurization of the combined cycle flue gas results in the lowest energy loss and lowest capture cost.
© 2013 The Authors. Published by Elsevier Ltd. Selection and peer-review under responsibility of GHGT.
Keywords: CO2 capture power plants, CO2 membranes, solvent supported membranes, SILM, deep eutectic solvents, CO2 capture cost
* Corresponding author. Tel.: +39-0223993846; fax: +39-0223993913. E-mail address: [email protected]
© 2014 The Authors. Published by Elsevier Ltd. This is an open access article under the CC BY-NC-ND license (http://creativecommons.org/licenses/by-nc-nd/3.0/).Peer-review under responsibility of the Organizing Committee of GHGT-12
7390 Alberto Voleno et al. / Energy Procedia 63 ( 2014 ) 7389 – 7397
Nomenclature
DES Deep eutectic solvents E Specific CO2 emissions [kg/MWh] e.m. electric motor GT Gas turbine HRSG Heat recovery steam generator J Flux through membrane [mol/s/m2]k Permeance [gpu] or [mol/s/m2/Pa]NGCC Natural gas combined cycle ref Reference power plant without CO2 capture SILM Supported ionic liquid membranes SPECCA Specific primary energy consumption for CO2 avoided [MJLHV/kgCO2]TIT Turbine inlet temperature (total temperature at 1st rotor inlet)
Greek pol Polytropic efficiency
1. Introduction
Membranes for CO2 separation are receiving growing attention for application in the field of CCS. They allow CO2 separation by means of a continuous process, they do not lead additional water consumption and they do not need steam for regeneration, thus not affecting steam turbine operations in power plants. In addition, being CO2separators with no need of thermal duty, CO2 membranes can be applied in energy intensive industries both as post-combustion and pre-combustion separators.
Technical challenges in the development of CO2 membranes are related to the improvement of their permeability and selectivity, in order to limit the area required for a given separation efficiency and obtain a high purity of the CO2 separated. It is well known that performance of polymeric membranes, the most investigated CO2 membrane technology, are characterized by an ‘upper bound’ that correlates the maximum permeability and selectivity [1]. In other words, polymeric membranes with high permeability usually have low selectivity and vice-versa.
More recently, a new class of membranes has been receiving attention, namely solvent supported membranes. In these devices, a solvent with a negligible volatility which provides the necessary selectivity is incorporated in a porous membrane. Ionic liquids represent good candidates to be used in such membranes and superior performance of supported ionic liquid membranes (SILMs) over polymeric membranes has been obtained [2]. Other promising solvents for such application are deep eutectic solvents (DES), which is a class of solvents which can be obtained from precursors that are solids at ambient temperature. [3]. DES can be prepared readily from renewable, non-toxic naturally occurring chemicals, are relatively inexpensive and can be tailored to specific uses by a wide variety of formulations [4]. The use of ionic liquids and DES in membrane separators also represents an alternative maybe more suitable application for these solvents with respect to conventional absorption systems based on absorption and desorption columns. As a matter of fact, the extremely high viscosity of these solvents makes their circulation in a column based absorption system extremely difficult and requires high energy consumption.
In addition to membrane materials, research has been conducted on CO2 membranes focused on their integration in power plants. The application as post-combustion capture systems in coal fired power plants has received the largest attention from researchers [5-9]. Different configurations with two or more membrane modules in series or parallel to achieve high CO2 capture rate and high purity with the lowest cost have been examined. Integration of CO2 membranes in natural gas combined cycles (NGCCs) is more challenging, due to the much lower CO2 content in the flue gases with respect to coal plants. In order to increase the CO2 concentration in the membrane feed, Merkel et al. [10] proposed a novel configuration with two membranes in series, where the second membrane allows for a selective CO2 recycle to the gas turbine (GT) compressor inlet, significantly increasing the CO2 partial pressure in the flue gas.
Alberto Voleno et al. / Energy Procedia 63 ( 2014 ) 7389 – 7397 7391
The aim of this paper is to assess the thermodynamic performance and economics of the integration of solvent supported CO2 membranes in NGCCs according to the process configuration proposed by Merkel et al. [10]. Reference is made to solvent supported membranes due to the novelty of such technology and the expected wide variability in their performance and cost, but the same considerations made throughout the paper are also valid for polymeric membrane.
2. Methodology
2.1. Plant description
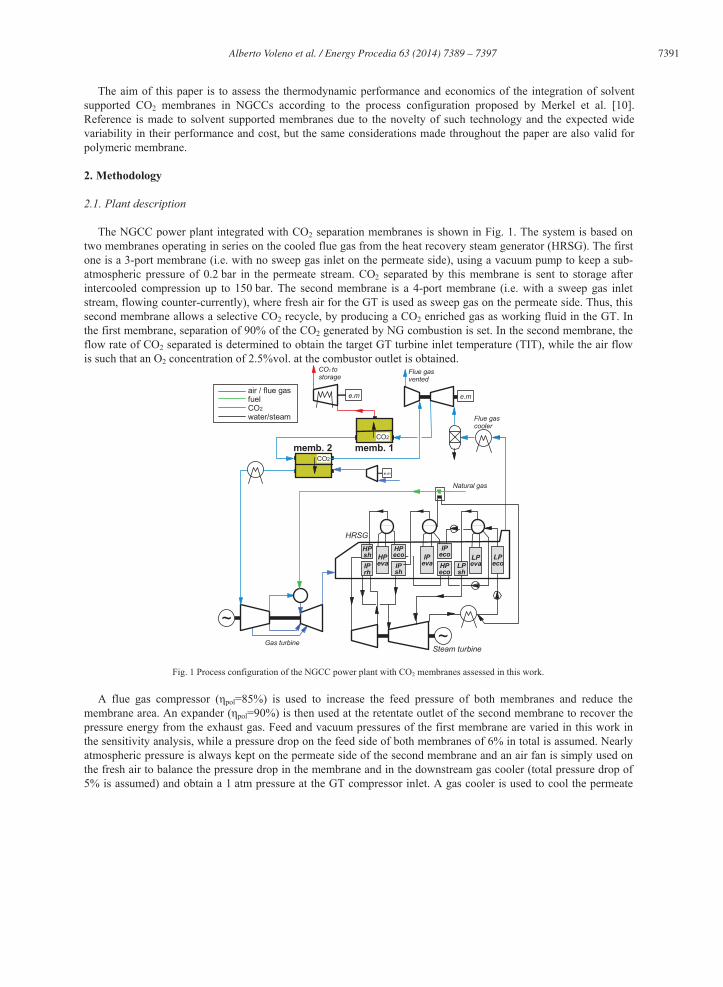
The NGCC power plant integrated with CO2 separation membranes is shown in Fig. 1. The system is based on two membranes operating in series on the cooled flue gas from the heat recovery steam generator (HRSG). The first one is a 3-port membrane (i.e. with no sweep gas inlet on the permeate side), using a vacuum pump to keep a sub-atmospheric pressure of 0.2 bar in the permeate stream. CO2 separated by this membrane is sent to storage after intercooled compression up to 150 bar. The second membrane is a 4-port membrane (i.e. with a sweep gas inlet stream, flowing counter-currently), where fresh air for the GT is used as sweep gas on the permeate side. Thus, this second membrane allows a selective CO2 recycle, by producing a CO2 enriched gas as working fluid in the GT. In the first membrane, separation of 90% of the CO2 generated by NG combustion is set. In the second membrane, the flow rate of CO2 separated is determined to obtain the target GT turbine inlet temperature (TIT), while the air flow is such that an O2 concentration of 2.5%vol. at the combustor outlet is obtained.
Fig. 1 Process configuration of the NGCC power plant with CO2 membranes assessed in this work.
A flue gas compressor ( pol=85%) is used to increase the feed pressure of both membranes and reduce the membrane area. An expander ( pol=90%) is then used at the retentate outlet of the second membrane to recover the pressure energy from the exhaust gas. Feed and vacuum pressures of the first membrane are varied in this work in the sensitivity analysis, while a pressure drop on the feed side of both membranes of 6% in total is assumed. Nearly atmospheric pressure is always kept on the permeate side of the second membrane and an air fan is simply used on the fresh air to balance the pressure drop in the membrane and in the downstream gas cooler (total pressure drop of 5% is assumed) and obtain a 1 atm pressure at the GT compressor inlet. A gas cooler is used to cool the permeate
e.m
e.m
CO2
CO2
Flue gas vented
air / flue gasfuelCO2
water/steam
~Gas turbine
Steam turbine
HRSG
~
HPeva
IPeva
LPecoIP
rh
HP sh
IPeco
HPeco
IPsh
HPeco LP
evaLPsh
memb. 2 memb. 1
CO2 tostorage
Natural gas
Flue gas cooler
e.m

7392 Alberto Voleno et al. / Energy Procedia 63 ( 2014 ) 7389 – 7397
gas from the membrane to the GT compressor inlet temperature of 30°C. Such cooling is needed due to the relatively high temperature of the gas permeating through the second membrane, due to a temperature increase resulting from the flue gas compression.
The gas turbine flow conditions are calculated considering a pressure ratio of 18.1 and a TIT of 1360°C, in line with large scale state of the art heavy duty GTs. It must be said that commercial GTs could probably not be adapted for operating under the conditions imposed on this plant. The increase of CO2 content in the GT working fluid (25-30% vol. at the compressor inlet) leads to modified properties of the working fluid and requires a redesign of the machines and the combustor. In this work, the gas turbine flows are calculated with the model presented in [11], by assuming a dedicated machine design, but considering the current technological level, i.e. keeping the maximum blade temperature unchanged with respect to the benchmark GT cycle with no gas recycle.
The heat recovery steam cycle is based on a 3 pressure level with reheat HRSG (130/28/4 bar, 565/565/300°C) with pinch point Ts of 10°C. Steam is expanded in a steam turbine with HP/IP/LP section isentropic efficiency of 94/92/88% and condensed at 0.048 bar by cooling water from a cooling tower. All the main assumptions for the power cycle are based on [12]. A constant fuel input of 711 MWLHV is assumed in all the cases, as estimated for the benchmark NGCC without capture.
Mass and energy balances are solved with the in-house code GS, developed at the Department of Energy of Politecnico di Milano [13], except CO2 compression, for which Aspen Plus V8.2 with the Peng Robinson equation of state and default binary interaction parameters has been used.
2.2. Membrane model
Permeation through the membrane is calculated through eq.(1). The flux (flow per unit of time per unit of membrane area) of each gas species i is proportional to the difference in partial pressures on the two sides of the membrane, with a proportionality related to the membrane permeance .
(1)
Calculation of the membrane performance is achieved by dividing the membrane area in 20 steps of equal surface, where the equation above is applied. The stream on the permeate side is considered to flow perfectly counter-current with respect to the feed stream. The membrane has been modelled with a Matlab code, which adjusts the membrane surface area to achieve the target CO2 separation efficiency. A selectivity of CO2 with respect to all the other species (N2, H2O, O2, Ar) of 70 is assumed.
2.3. Economic analysis
The economic analysis has been performed by using the CO2CRC method [6]. The main assumptions for the economic analysis and the methodology for the calculation of the capital cost are shown in Table 1 and Table 2.
The total capital costs are calculated as shown in Table 2. For the membrane, a specific cost has been used and defined as the cost per square meter divided by the permeability ( ). A baseline membrane cost of 0.025 US$/m2/gpu has been assumed, corresponding for example to a membrane with a permeability of 2000 gpu1†
and a specific cost of 50 US$/m2, similar to the polymeric membrane used in [10]. For the gas turbine, HRSG and steam cycle, the EBTF cost functions from [12] have been used, corrected to
US$2012 using the CEPCI index and currency conversion for €/$ based on 2012 values. For the GT, a 20% additional cost has been assumed for the plants with selective flue gas recycle to take into account the costs for the development for the machines operating with CO2-enriched gas.
1†1 gpu is equal to 10-6 (Ncm3/s)/(cm2*cmHg) and hence corresponds to 2.7*10-3 (Nm3/h)/(m2*bar)

Alberto Voleno et al. / Energy Procedia 63 ( 2014 ) 7389 – 7397 7393
Table 1 Main assumptions for the economic analysis
Currency US$2012
Discount rate 7 % pa (real)
Project life 25 years
Construction period 2 years
Plant load factor 90%
Price of natural gas 4 $/GJ LHV
Price of electricity 43 $/MWh
General and maintenance cost 6% Capex
Cooling water cost 0.025 $/m3
Expected membrane life 3 years
Table 2 Capex calculation methodology
Parameter Value
A Process equipment cost (PEC) Sum of all equipment cost
B General cost 30% PEC
C Total equipment cost (TEC) A + B
D Instrumentation 15% TEC
E Electrical 7% TEC
F Piping 20% TEC
G Total installed cost (TIC) A+B+D+E+F
H Set-up cost 8% TIC
I Engineering 5% TIC
L Owners cost 7% (G+H+I)
M Engineering, procurement, construction and owner’s cost (EPCO)
G+H+I+L
N Contingency 10% EPCO
O Total capital cost (CAPEX) M+N
3. Results
3.1. Mass and energy balance
In Figure 2, the effect of membrane feed pressure on the net plant efficiency and on the total specific membrane area (i.e. the sum of both membrane areas) is shown. The specific membrane area shown is defined to be independent of the membrane and corresponds to an inverted permeation driving force (i.e. units equivalent to [(mol/s) Pa]-1). Units usual to membrane technology are used and this specific membrane area is calculated as the membrane area (in million of square meters) multiplied by the membrane permeability (in gpu). For example, for the case with 2 bar membrane feed pressure, a specific area of about 1500*106 m2*gpu is required. This means that if a membrane with a permeability of 1000 gpu is used, a total membrane area of 1.5*106 m2 is needed.
The energy balance of the plants is reported in Table 3, together with data for the benchmark NGCC without capture. Compared to alternative technologies, competitive efficiencies are obtained for moderate flue gas pressurization, with net efficiencies over 50% for pressurization lower than 2.5 bar and up to 53% for a membrane feed pressure of 1.5 bar. The efficiency reduces as the membrane feed pressure increases due to the need for flue gas pressurization before entering the membrane system. Flue gas compression is responsible for an efficiency reduction of about 2% points for a 1.5 bar feed pressure (while accounting for pressure energy recovery on expansion), 3.4% points for a 2 bar feed pressure and up to 7.4% points for a 4 bar of feed pressure.
The specific primary energy consumption for CO2 avoided (SPECCA), defined in eq.(2), can be used to evaluate with a single index the energy and environmental performance of plants with CO2 capture. The values of 2-2.6 MJLHV/kgCO2 obtained for the cases with moderate membrane feed pressurization are highly competitive with alternative technologies based on MEA absorption that have a SPECCA of the order of 3 MJ/kg [12].
(2)
It is also important to note that the high CO2 concentration at the inlet to the first membrane (>30% vol.) achieves CO2 purities of 95% or more (and up to 96.7% for a 4 bar feed pressure), which may be sufficient for storage sites (e.g. aquifers) where extremely high purities (>99%) are not required.

7394 Alberto Voleno et al. / Energy Procedia 63 ( 2014 ) 7389 – 7397
Fig. 2 Effect of membrane feed pressure on efficiency and total membrane surface area.
Table 3 Power balance of the investigated membrane cases
Ref. NGCC Membrane cases
First membrane feed pressure, bar 1.52 2.03 3.04 4.05
Power balance, MW:
Gas turbine net power 272.1 249.8 249.4 249.2 249.0
Steam turbine gross power 147.1 167.3 167.6 167.7 168.0
Steam cycle pumps -1.79 -2.13 -2.14 -2.14 -2.15
Aux. for cond. heat rejection -1.86 -2.05 -2.05 -2.05 -2.05
Aux. for heat reject. other than cond. -0.77 -0.82 -0.90 -0.98
Fresh air fan -2.08 -2.05 -2.03 -2.01
Flue gas compressor -25.55 -45.44 -76.60 -100.8
Flue gas expander 11.65 21.25 36.46 48.03
CO2 compression -19.20 -19.02 -18.89 -18.59
Gross Power, MW 419.2 417.1 417.0 417.0 416.9
Net Power, MW 415.6 376.9 366.7 350.8 338.4
Heat input, MW, LHV 711.3 711.3 711.3 711.3 711.3
Net efficiency, %LHV 58.4 53.0 51.6 49.3 47.6
CO2 capture efficiency, % 90.0 90.0 90.0 90.0
Specific emission, kg/MWh 353.7 40.3 41.5 43.3 44.9
CO2 avoided, % 88.6 88.3 87.8 87.3
SPECCA, MJ/kg 2.01 2.63 3.66 4.55
CO2 purity, %mol dry 95.2 96.0 96.5 96.7
3.2. Economic analysis
The breakdown of the cost of electricity for the different case studies is shown in Fig. 3. The COE calculated for the reference NGCC is lower than reported by NETL [14] (41.0 $/MWh vs. 59.6 $/MWh). The difference in cost is
0
500
1000
1500
2000
2500
3000
3500
4000
4500
45
46
47
48
49
50
51
52
53
54
1.0 1.5 2.0 2.5 3.0 3.5 4.0 4.5
Totalspe
cific
mem
branearea,106m
2 *gpu
Net
electricefficiency,%LH
V
Membrane feed pressure, bar

Alberto Voleno et al. / Energy Procedia 63 ( 2014 ) 7389 – 7397 7395
due to the different fuel costs assumed (4 US$/GJ in our case vs. 6.1 $/GJ in [14]) and the electrical efficiency of the plant (58.4% vs. 55.7%LHV).
For the plants with CO2 capture, the COE increases by about 22 $/MWh to 40 $/MWh compared to the reference plant. Fig. 3 shows that as the feed pressure increases, so does the COE. This is because as the feed pressure increases, larger compressors and expanders are needed, although a smaller membrane is required. This is also clear from Fig. 4, where the equipment cost breakdown and the effect of the membrane feed pressure on membrane and flue gas compressor/expander cost is shown. As a consequence, the increase in capital cost due to the flue gas compressor and expander and the increase in the fuel cost on the COE offset any capital cost reduction from the smaller membrane. The membrane case with the lowest cost of electricity is at 1.5 bar feed pressure. In this case, the COE is 63.8 $/MWh
Fig. 3 Effect of membrane feed pressure on efficiency and total membrane surface area.
Fig. 4 Breakdown of the specific equipment cost.
0
10
20
30
40
50
60
70
80
NGCC w/ocapt.
p_f=1.5bar p_f=2bar p_f=3bar p_f=4bar
Costof
electricity,U
S$/M
Wh
Other Opex
Fuel
Capex other
Capex CO2 compr. and treatm.
Capex flue gas compr./exp.
Capex membranes
0
200
400
600
800
1000
1200
1400
1600
1800
NGCC w/ocapt.
p_f=1.5bar p_f=2bar p_f=3bar p_f=4bar
Equipm
entcost,US$/kW Other costs
Membrane 2
Membrane 1
CO2 compression and treatment
Flue gas expander
Flue gas compressor
HRSG, steam cycle and auxiliaries
Gas turbine
7396 Alberto Voleno et al. / Energy Procedia 63 ( 2014 ) 7389 – 7397
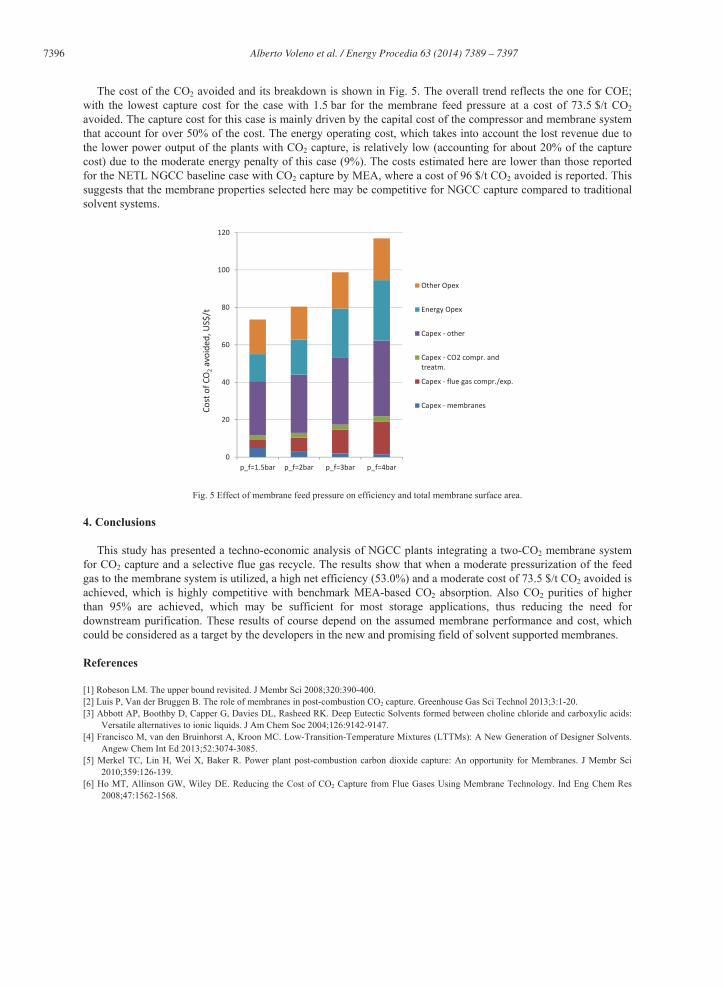
The cost of the CO2 avoided and its breakdown is shown in Fig. 5. The overall trend reflects the one for COE; with the lowest capture cost for the case with 1.5 bar for the membrane feed pressure at a cost of 73.5 $/t CO2avoided. The capture cost for this case is mainly driven by the capital cost of the compressor and membrane system that account for over 50% of the cost. The energy operating cost, which takes into account the lost revenue due to the lower power output of the plants with CO2 capture, is relatively low (accounting for about 20% of the capture cost) due to the moderate energy penalty of this case (9%). The costs estimated here are lower than those reported for the NETL NGCC baseline case with CO2 capture by MEA, where a cost of 96 $/t CO2 avoided is reported. This suggests that the membrane properties selected here may be competitive for NGCC capture compared to traditional solvent systems.
Fig. 5 Effect of membrane feed pressure on efficiency and total membrane surface area.
4. Conclusions
This study has presented a techno-economic analysis of NGCC plants integrating a two-CO2 membrane system for CO2 capture and a selective flue gas recycle. The results show that when a moderate pressurization of the feed gas to the membrane system is utilized, a high net efficiency (53.0%) and a moderate cost of 73.5 $/t CO2 avoided is achieved, which is highly competitive with benchmark MEA-based CO2 absorption. Also CO2 purities of higher than 95% are achieved, which may be sufficient for most storage applications, thus reducing the need for downstream purification. These results of course depend on the assumed membrane performance and cost, which could be considered as a target by the developers in the new and promising field of solvent supported membranes.
References
[1] Robeson LM. The upper bound revisited. J Membr Sci 2008;320:390-400. [2] Luis P, Van der Bruggen B. The role of membranes in post-combustion CO2 capture. Greenhouse Gas Sci Technol 2013;3:1-20. [3] Abbott AP, Boothby D, Capper G, Davies DL, Rasheed RK. Deep Eutectic Solvents formed between choline chloride and carboxylic acids:
Versatile alternatives to ionic liquids. J Am Chem Soc 2004;126:9142-9147. [4] Francisco M, van den Bruinhorst A, Kroon MC. Low-Transition-Temperature Mixtures (LTTMs): A New Generation of Designer Solvents.
Angew Chem Int Ed 2013;52:3074-3085. [5] Merkel TC, Lin H, Wei X, Baker R. Power plant post-combustion carbon dioxide capture: An opportunity for Membranes. J Membr Sci
2010;359:126-139. [6] Ho MT, Allinson GW, Wiley DE. Reducing the Cost of CO2 Capture from Flue Gases Using Membrane Technology. Ind Eng Chem Res
2008;47:1562-1568.
0
20
40
60
80
100
120
p_f=1.5bar p_f=2bar p_f=3bar p_f=4bar
Costof
CO2avoide
d,US$/t
Other Opex
Energy Opex
Capex other
Capex CO2 compr. andtreatm.
Capex flue gas compr./exp.
Capex membranes

Alberto Voleno et al. / Energy Procedia 63 ( 2014 ) 7389 – 7397 7397
[7] Zhao L, Riensche E, Blum L, Stolten D. Multi-stage gas separation membrane processes used in post-combustion capture: Energetic and economic analyses. J Membr Sci 2010;359:160-172.
[8] Scholes CA, Ho MT, Wiley DE, Stevens GW, Kentish SE. Cost competitive membrane-cryogenic post-combustion carbon capture. Int J Greenh Gas Con 2013;17:341-348.
[9] Zhai H, Rubin ES. Membrane-based CO2 Capture Systems for Coal-fired Power Plants. NETL-DOE Report, 2012. [10] Merkel TC, Wei X, He Z, White LS, Wijmans JG, Baker RW. Selective Exhaust Gas Recycle with Membranes for CO2 Capture from
Natural Gas Combined Cycle Power Plants. Ind Eng Chem Res 2013; 52:1150-1159. [11] Chiesa P, Macchi E. A thermodynamic analysis of different options to break 60% electric efficiency in combined cycle power plants. J. Eng
Gas Turbines Power 2004;126:770-785. [12] EBTF, 2011. European Best Practice Guidelines for Assessment of CO2 Capture Tech-nologies.
www.gecos.polimi.it/research/EBTF best practice guide.pdf [13] Gecos, 2013. Gas–Steam Cycle Simulation Code. www.gecos.polimi.it/software/gs.php [14] DOE/NETL, 2012. Updated Costs (June 2011 Basis) for Selected Bituminous Baseline Cases. DOE/NETL-341/082312.
Related Documents