Citation: Li, J.; Laptev, R.; Bordulev, I.; Siemek, K.; Horodek, P.; Shen, H.; Lomygin, A.; Cui, J. Positron Annihilation Spectroscopy Study of Metallic Materials after High-Speed Cutting. Materials 2022, 15, 1017. https://doi.org/10.3390/ ma15031017 Academic Editors: Xingzhong Cao, Peng Kuang, Te Zhu and Eryang Lu Received: 15 December 2021 Accepted: 27 January 2022 Published: 28 January 2022 Publisher’s Note: MDPI stays neutral with regard to jurisdictional claims in published maps and institutional affil- iations. Copyright: © 2022 by the authors. Licensee MDPI, Basel, Switzerland. This article is an open access article distributed under the terms and conditions of the Creative Commons Attribution (CC BY) license (https:// creativecommons.org/licenses/by/ 4.0/). materials Article Positron Annihilation Spectroscopy Study of Metallic Materials after High-Speed Cutting Jinquan Li 1, *, Roman Laptev 2, * , Iurii Bordulev 2 , Krzysztof Siemek 3,4 , Pawel Horodek 3,4 , Haolun Shen 1 , Anton Lomygin 2 and Jian Cui 2 1 School of Mechanical Engineering, Shenyang Ligong University, No.6 Nanping Center Road, Hunnan New District, Shenyang 110159, China; [email protected] 2 Division for Experimental Physics, National Research Tomsk Polytechnic University, 634050 Tomsk, Russia; [email protected] (I.B.); [email protected] (A.L.); [email protected] (J.C.) 3 Institute of Nuclear Physics Polish Academy of Sciences, PL-31342 Krakow, Poland; [email protected] (K.S.); [email protected] (P.H.) 4 Joint Institute for Nuclear Research, Joliot-Curie 6, 141980 Dubna, Russia * Correspondence: [email protected] (J.L.); [email protected] (R.L.); Tel.: +7-913-852-3733 (R.L.) Abstract: During high-speed cutting, a white layer is often produced on the machined surfaces after mechanical machining, seriously affecting the mechanical properties. These properties are related to the material structure and the defects induced by cutting. However, there is a lack of research on the atomic-scale defects of the white layer. This paper studied the influence of cutting parameters, namely the feed rate, cutting speed and cutting depth, on atomic-scale defects induced by high-speed cutting in GCr15 steel. Positron annihilation studies showed typical plastically deformed or tempered carbon steel defects with additional vacancy cluster components. The quantity of these clusters changed with cutting parameters. Furthermore, significant changes were observed in the subsurface region up to 1 μm, occurring as a result of simultaneous phase transformations, deformation and thermal impacts. The predominant accumulation of only one type of atomic-scale defect was not observed. Keywords: positron annihilation; metals; high-speed cutting; white layer; microstructure; defects 1. Introduction During the high-speed cutting process, a tool and a machined surface instantly collide at high speed, causing the temperature of the partial area to rise sharply. Under the action of the cutting edge of the tool, the surface layer of the machined material is subjected to the solid thermo-mechanical coupling effect, which gives rise to the deformed thermal layer on the machined surface. This effect has a significant influence on the mechanical properties of the workpiece [1]. The plastic deformation is most significant on the surface of the deformed thermal layer, and gradually decreases below the machined surface until a certain depth at which its microstructure is consistent with the matrix material. The microstructures and mechanical properties of the degenerating layer vary with different processing methods. During the high-speed cutting process, for many metal materials, a layer that appears white under an optical microscope is produced on top of the degenerating layer, caused by the machining of the workpiece’s surface [2]. This ultrafine-grain white layer has a surface hardness much higher than that of the matrix, ranging from 800 to 1200 HV, while its thickness ranges from 10 to 50 μm[3]. The high brittleness of the white layer may allow cracks to form, making it possible for the white layer to fall off and become a fatigue source, dramatically reducing the fatigue limit of the structure piece [4]. Thus far, the formation mechanism of the white layer has been studied in depth. Chou and Evans [5] suggested that during the machining process of iron-based alloys, the temperature of the machined surface rises sharply due to the intense friction between the tool and the chip, reaching the A C1 transformation temperature to produce austenitization. Materials 2022, 15, 1017. https://doi.org/10.3390/ma15031017 https://www.mdpi.com/journal/materials

Welcome message from author
This document is posted to help you gain knowledge. Please leave a comment to let me know what you think about it! Share it to your friends and learn new things together.
Transcript
�����������������
Citation: Li, J.; Laptev, R.; Bordulev,
I.; Siemek, K.; Horodek, P.; Shen, H.;
Lomygin, A.; Cui, J. Positron
Annihilation Spectroscopy Study of
Metallic Materials after High-Speed
Cutting. Materials 2022, 15, 1017.
https://doi.org/10.3390/
ma15031017
Academic Editors: Xingzhong Cao,
Peng Kuang, Te Zhu and Eryang Lu
Received: 15 December 2021
Accepted: 27 January 2022
Published: 28 January 2022
Publisher’s Note: MDPI stays neutral
with regard to jurisdictional claims in
published maps and institutional affil-
iations.
Copyright: © 2022 by the authors.
Licensee MDPI, Basel, Switzerland.
This article is an open access article
distributed under the terms and
conditions of the Creative Commons
Attribution (CC BY) license (https://
creativecommons.org/licenses/by/
4.0/).
materials
Article
Positron Annihilation Spectroscopy Study of Metallic Materialsafter High-Speed CuttingJinquan Li 1,*, Roman Laptev 2,* , Iurii Bordulev 2 , Krzysztof Siemek 3,4 , Pawel Horodek 3,4 , Haolun Shen 1,Anton Lomygin 2 and Jian Cui 2
1 School of Mechanical Engineering, Shenyang Ligong University, No.6 Nanping Center Road, Hunnan NewDistrict, Shenyang 110159, China; [email protected]
2 Division for Experimental Physics, National Research Tomsk Polytechnic University, 634050 Tomsk, Russia;[email protected] (I.B.); [email protected] (A.L.); [email protected] (J.C.)
3 Institute of Nuclear Physics Polish Academy of Sciences, PL-31342 Krakow, Poland;[email protected] (K.S.); [email protected] (P.H.)
4 Joint Institute for Nuclear Research, Joliot-Curie 6, 141980 Dubna, Russia* Correspondence: [email protected] (J.L.); [email protected] (R.L.); Tel.: +7-913-852-3733 (R.L.)
Abstract: During high-speed cutting, a white layer is often produced on the machined surfaces aftermechanical machining, seriously affecting the mechanical properties. These properties are related tothe material structure and the defects induced by cutting. However, there is a lack of research on theatomic-scale defects of the white layer. This paper studied the influence of cutting parameters, namelythe feed rate, cutting speed and cutting depth, on atomic-scale defects induced by high-speed cuttingin GCr15 steel. Positron annihilation studies showed typical plastically deformed or tempered carbonsteel defects with additional vacancy cluster components. The quantity of these clusters changedwith cutting parameters. Furthermore, significant changes were observed in the subsurface regionup to 1 µm, occurring as a result of simultaneous phase transformations, deformation and thermalimpacts. The predominant accumulation of only one type of atomic-scale defect was not observed.
Keywords: positron annihilation; metals; high-speed cutting; white layer; microstructure; defects
1. Introduction
During the high-speed cutting process, a tool and a machined surface instantly collideat high speed, causing the temperature of the partial area to rise sharply. Under the actionof the cutting edge of the tool, the surface layer of the machined material is subjected to thesolid thermo-mechanical coupling effect, which gives rise to the deformed thermal layer onthe machined surface. This effect has a significant influence on the mechanical properties ofthe workpiece [1]. The plastic deformation is most significant on the surface of the deformedthermal layer, and gradually decreases below the machined surface until a certain depth atwhich its microstructure is consistent with the matrix material. The microstructures andmechanical properties of the degenerating layer vary with different processing methods.During the high-speed cutting process, for many metal materials, a layer that appearswhite under an optical microscope is produced on top of the degenerating layer, causedby the machining of the workpiece’s surface [2]. This ultrafine-grain white layer has asurface hardness much higher than that of the matrix, ranging from 800 to 1200 HV, whileits thickness ranges from 10 to 50 µm [3]. The high brittleness of the white layer may allowcracks to form, making it possible for the white layer to fall off and become a fatigue source,dramatically reducing the fatigue limit of the structure piece [4].
Thus far, the formation mechanism of the white layer has been studied in depth.Chou and Evans [5] suggested that during the machining process of iron-based alloys, thetemperature of the machined surface rises sharply due to the intense friction between thetool and the chip, reaching the AC1 transformation temperature to produce austenitization.
Materials 2022, 15, 1017. https://doi.org/10.3390/ma15031017 https://www.mdpi.com/journal/materials
Materials 2022, 15, 1017 2 of 13
The heat then decreases sharply as the chip peels, rapidly chilling and quenching thesurface of the workpiece, and produces a phase change as austenite is transformed intofine-grained martensite. The white layer is simply a high-density structure composed ofthese sub-grains and recrystallized grains. However, research indicates that the white layercan also be formed below the phase transition temperature as a result of strong plasticdeformation during the cutting process. The plastic deformation results in grain refinement,which promotes the formation of the white layer [6]. The study of Bulpett et al. [7] showedthat the white layer is formed by the combined effects of the phase transformation at ahigh temperature and the plastic deformation. The heat generated during the processingraises the partial temperature to the phase transition temperature, while the grain cansimultaneously be refined by the strong plastic deformation. Barry and Byrne [8] reportedthat during the high-speed cutting process, under the action of significant strain anda high strain rate, severe plastic deformation in the contact area between the tool andthe machined surface produces many dislocations. The dislocation density within thematerial thus increases sharply. The plastic work accumulates gradually, and the heat isreleased slowly. The rapid temperature rise is exceptionally high. When the processedsurface reaches the dynamic recrystallization temperature, the deformed grains grow intonew grains around a core of sub-crystalline material with a higher dislocation density orimpurity phases to form the white layer.
Existing research into the formation mechanism of the white layer during the high-speed hard cutting process is primarily concentrated on two aspects [9,10]: the phasetransformation caused by the thermal load and the plastic deformation caused by themechanical load. There are four main viewpoints [3,8,11], as follows. (1) Mechanismof thermal action: it is believed that the formation of the white layer results from themetal phase transition caused by the mechanism of thermal action. (2) Plastic deformationmechanism: it is believed that the formation of the white layer is unrelated to the thermaleffect. Instead, strong plastic deformation leads to grain refinement and thus promotes theformation of the white layer. (3) Dynamic recrystallization mechanism: when the machinedsurface reaches the dynamic recrystallization temperature, new grains are produced toform the white layer. (4) The coupling mechanism of thermal–plastic deformation: thehigh temperature in the partial area of the machined surface reaches or exceeds the phasetransition temperature, and the strong plastic deformation of the machined surface causesthe grain refinement to generate high pressure, which results in a reduction in the criticalphase transition temperature to promote the generation of the white layer. The white layerthus results from the coupling effect of temperature and plastic deformation.
Summarizing the current research on the formation mechanism of the surface layer,the microstructures of the white layer observed by electronic microscopes are usuallymartensite, austenite, ultra-fine grains, high-density dislocations, phase boundaries, grainboundaries, twinning, slip line, and so on, which form a relatively macroscopic set oforganization, defects, and various phase transformation structures. Experimentally, con-ventional testing methods are typically used, such as optical microscopy, scanning electronmicroscopy (SEM), transmission electron microscopy (TEM), X-ray diffraction, scanningtunnelling electron microscopy, and backscattered electron imaging. The most frequentlyused methods are SEM and TEM. However, SEM is only used to observe surface topog-raphy, and cannot detect subsurface or interface defects. TEM is also used to indirectlyexamine dislocation and other defects based on the electron diffraction pattern, and it isdifficult to produce samples featuring dislocation. In terms of theoretical analysis andnumerical simulation, the study of the microstructures of the white layer is based on contin-uum mechanics. Although valuable results have been obtained, it is difficult to characterizepartial defect information at the atomic scale using these methods [12], and it is impossibleto study interface characteristics and the relationship between microstructural defects andmacroscopic properties at the atomic level—this requires further research at the electronicstructure level to understand the nature of the problem. The design and choice of the alloymaterial from the atomic or electronic scale is one of the most active frontiers of current
Materials 2022, 15, 1017 3 of 13
material science. At present, positron annihilation technology is an indispensable methodfor studying material defects and phase transitions due to its sensitivity to the atomic-scaledefects in samples and its non-destructive detection characteristics, and it has been widelyused in many fields, such as solid-state physics and materials science [13]. Therefore,positron annihilation technology may compensate for the lack of current research methodsregarding the formation mechanism of the white layer.
The types and concentrations of defects can be measured using positron annihilation,which can be used to study the distribution of elements around or within defects, as wellas the electronic structure characteristics. It can also be used to study the characteristics ofdefect configurations and the interaction mechanism among the added elements, impurityatoms, and micro-defects [14]. In particular, positron annihilation technology plays anirreplaceable role in analyzing the mechanisms of crystallization and precipitation causedby the migration of trace elements with the defects in the material.
Information on the electron momentum distribution in a portion of the impurity, theprecipitation deposition phase, and the elemental momentum distribution can be obtainedby using the effect that the positrons are trapped by impurity clusters. The diffusion, precipi-tation, deposition of impurities in the material, and cluster growth mechanism significantlyimpact the mechanical properties of metals and metal alloys. All these microstructurecharacteristics are difficult to observe via high-resolution electron microscopy, so positronannihilation spectroscopy (PAS) offers a promising new experimental analysis method.
Consequently, positron annihilation technology has been widely used in many studyfields to explore a range of effects, including the defects on the atomic scale, such asvacancies, caused by object deformation and quenching; the deformation, phase transition,hydrogen embrittlement [15,16], and fatigue damage in the initial stage for metals andalloys; the defect types and scales located in the surface and interface structures [17]; themicrostructure characterization of various functional materials [18]; and the mechanisms ofthe formation and evolution of vacancies in semiconductor materials [19–21].
In this paper, the characteristics of the atomic-scale defects in the white layer and bulkof GCr15 steel were studied using positron annihilation spectroscopy techniques to makethe research on the formation mechanism of the white layer more complete.
2. Materials and Methods2.1. Cutting Test
The single-factor dry cutting experiment was conducted on a MULTUS B400-W CNClathe. PCBN cubic boron nitride blades were used. The tool rake angle was γ0 = 5◦, therear angle was α0 = 7◦, the cutting edge angle and inclination were kr = 90◦ and λs = 0◦,respectively, and the corner radius was rc = 0.8 mm. The test material was GCr15 bearingsteel that was heated to 850 ◦C, held for 2 h, quenched with 10% saltwater, tempered at320 ◦C, and then held for 4 h, with a hardness of HRC60. Its chemical composition is shownin Table 1.
Table 1. The chemical composition of GCr15 (wt %).
Material C Si Mn P, S Cr Ni Mo
GCr15 0.95–1.05 0.15–0.35 0.25–0.45 0.025 0.40–1.65 Max 0.3 Max 0.10
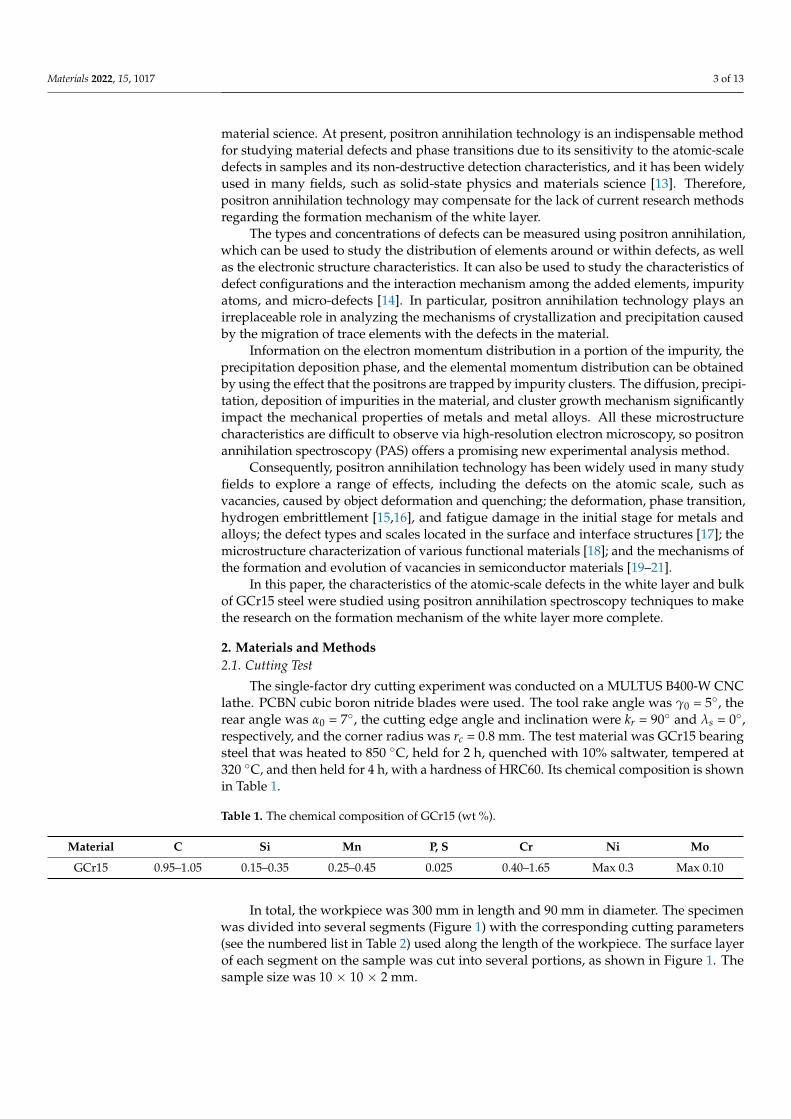
In total, the workpiece was 300 mm in length and 90 mm in diameter. The specimenwas divided into several segments (Figure 1) with the corresponding cutting parameters(see the numbered list in Table 2) used along the length of the workpiece. The surface layerof each segment on the sample was cut into several portions, as shown in Figure 1. Thesample size was 10 × 10 × 2 mm.
Materials 2022, 15, 1017 4 of 13
Materials 2022, 15, x FOR PEER REVIEW 4 of 13
In total, the workpiece was 300 mm in length and 90 mm in diameter. The specimen was divided into several segments (Figure 1) with the corresponding cutting parameters (see the numbered list in Table 2) used along the length of the workpiece. The surface layer of each segment on the sample was cut into several portions, as shown in Figure 1. The sample size was 10 × 10 × 2 mm.
1 2 3 4 5 6 7 8 9 10
Specimen
Numbered list (Table 2)
Figure 1. A schematic diagram of the surface layer sample.
Table 2. The cutting parameters.
Numbered List Cutting Speed (V)
(m/min) Feed Rate (f) (mm/r) Cutting Depth (ap)
(mm) 1 520 0.20 0.25 2 520 0.20 0.20 3 462 0.20 0.20 4 404 0.20 0.20 5 347 0.20 0.20 6 520 0.10 0.20 7 520 0.15 0.20 8 520 0.24 0.20 9 520 0.20 0.15
10 520 0.20 0.10
2.2. Positron Annihilation Experiment PAS is a promising method for analyzing the defect structure of materials during
high-speed cutting, allowing researchers to study the mechanisms and control the dy-namics of the appearance, transformation, and disappearance of defects of different di-mensions (from point to extended) in a wide range of concentrations. Positron lifetime studies allow the type, size, and concentration of defects to be determined, and, when combined with Doppler annihilation line broadening spectroscopy (DBS), allow the ob-servation of phase transformations and analysis of the chemical environment at the an-nihilation site. The mean positron implantation depth emitted from the44Ti isotope into steel is around 150 µm. To analyze the surface and the subsurface region (up to ~1.2 µm), it is necessary to use a variable-energy positron beam. The physical bases and features of the applications of PAS are presented in detail in a number of modern reviews [22–24].
The white layer was studied using the Doppler broadening of the annihilation line using the variable positron energy at the JINR DLNP in Dubna, Russia [25,26]. A mo-noenergetic flux of positrons with a diameter of 5 mm and an intensity of 106 e+/s was used. The energy range of the implanted positrons ranged from 0.1 to 36 keV. The Dop-pler broadening measurements were performed and annihilation γ-radiation was de-tected by an HPGe detector model GEM25P4-70 (AMETEK ORTEC, USA) with an energy resolution of 1.20 keV, interpolated for the energy of 511 keV. The obtained DBS spectra were analyzed by extracting the S and W parameters, defined as the zone below the cen-
Figure 1. A schematic diagram of the surface layer sample.
Table 2. The cutting parameters.
Numbered List Cutting Speed (V)(m/min) Feed Rate (f ) (mm/r) Cutting Depth (ap)
(mm)
1 520 0.20 0.252 520 0.20 0.203 462 0.20 0.204 404 0.20 0.205 347 0.20 0.206 520 0.10 0.207 520 0.15 0.208 520 0.24 0.209 520 0.20 0.1510 520 0.20 0.10
2.2. Positron Annihilation Experiment
PAS is a promising method for analyzing the defect structure of materials during high-speed cutting, allowing researchers to study the mechanisms and control the dynamicsof the appearance, transformation, and disappearance of defects of different dimensions(from point to extended) in a wide range of concentrations. Positron lifetime studies allowthe type, size, and concentration of defects to be determined, and, when combined withDoppler annihilation line broadening spectroscopy (DBS), allow the observation of phasetransformations and analysis of the chemical environment at the annihilation site. Themean positron implantation depth emitted from the 44Ti isotope into steel is around 150 µm.To analyze the surface and the subsurface region (up to ~1.2 µm), it is necessary to use avariable-energy positron beam. The physical bases and features of the applications of PASare presented in detail in a number of modern reviews [22–24].
The white layer was studied using the Doppler broadening of the annihilation lineusing the variable positron energy at the JINR DLNP in Dubna, Russia [25,26]. A mo-noenergetic flux of positrons with a diameter of 5 mm and an intensity of 106 e+/s wasused. The energy range of the implanted positrons ranged from 0.1 to 36 keV. The Dopplerbroadening measurements were performed and annihilation γ-radiation was detected byan HPGe detector model GEM25P4-70 (AMETEK ORTEC, USA) with an energy resolutionof 1.20 keV, interpolated for the energy of 511 keV. The obtained DBS spectra were analyzedby extracting the S and W parameters, defined as the zone below the central or wing partsof the annihilation line divided by the total area below this line, respectively.
For bulk analysis, complex spectroscopy based on the positron annihilation lifetimespectrometry (PALS) module and Coincidences Doppler broadening spectroscopy (CDBS)were used [27,28]. The temporal resolution of the PALS module was 230 ± 6 ps, with a countrate of 105 ± 30 events/s. The count rate for the CDBS module was 130 ± 20 events/sat an energy resolution of 1.15 ± 0.04 keV. The radioactive isotope 44Ti was used as a
Materials 2022, 15, 1017 5 of 13
positron source, with an activity of 1.38 MBq and maximum energy of 1.47 MeV. For eachsample, two PALS spectra and one two-dimensional CDBS spectrum were collected, withthe statistics of 3 × 10⁶ and 18 × 106 events, respectively. The PALS spectra were analyzedby the ‘four-state trapping model’ using the LT10 software (version 10.2.2.2) [29–31]. In thismodel, the spectrum is analyzed using four time components, τA, τB, τC, and τF; intensities,IA, IB, and IC; trapping rates, kA, kB, and kC; and the average positron lifetime τavg. Thefirst three components correspond to the positron annihilation in A, B, and C states, whileτF corresponds to the lifetime of a delocalized positron in the lattice GCr15. The lifetimecomponents were partially common for all samples. The contribution of the positron sourcewas determined using an empirical function and amounted to approximately 9%. Thetime components of positron annihilation in the source were equal: τ1 = 142 ps (48.2%),τ2 = 468 ± 3 ps (42.8%), and τ3 = 2800 ± 27 ps (9.0%).
The obtained DBS spectra were analyzed by extracting the S and W parameters. Theseparameters were obtained by processing the spectra in the CDBTools software [32]. Toanalyze the two-dimensional spectrum, relative curves were plotted as R(E) = N(E)/N0(E),where N(E) is the spectrum of the sample under study and N0(E) is the spectrum of thereference sample. A defect-free Fe sample was used as a reference material for N0(E). Thespectra of annealed samples of silicon, chromium, carbon, copper, and nickel were alsoused for constructing the relative curves.
3. Results and Discussion
PALS and DBS spectra for GCr15 steel samples after high-speed cutting with differentparameters, and two-dimensional CDBS spectra, are given in the Supplementary Materials.
3.1. Influence of the Cutting Speed
The PALS experimental results for GCr15 samples as a function of the cutting speedare shown in Table 3.
Table 3. PALS parameters of GCr15 samples depending on cutting speed.
Cutting Speed,m/min χ2 τA,
±2 psτB,
±4 psτF,
±6 ps kA, ns−1 kB, ns−1 IA, % IB, % τavg, ps
347 1.16
147 240 106
19.1 ± 0.4 0.04 ± 0.08 86.7 0.2 149404 1.09 15.4 ± 0.1 0.21 ± 0.03 83.4 1.0 146462 1.12 21.0 ± 0.2 0.96 ± 0.04 84.0 3.5 159520 1.17 22.2 ± 0.5 0.61 ± 0.05 84.9 2.3 155
All samples’ spectra contain four time components: τF = 106 ± 6 ps, τA = 147 ± 1 ps,τB = 240 ± 4 ps, and τC = 1.75 ± 0.04 ns (τC is associated with the annihilation of positronsin the sample holder and was not used in further analysis; IC < 1.2%). The time componentτF with a lifetime of 106 ± 6 ps corresponds to the theoretical and experimental valuesof the lifetime of delocalized positrons in the iron crystal lattice [33]. The componentτA = 147 ± 2 ps is very close to the experimental values of positrons trapped by plasticdeformation-induced defects [34]. These can be dislocations or defects associated withthem, such as jogs, vacancies [35–37], and vacancy–solute complexes for steel components(e.g., v-Cr (153 ps), v-Mn (152 ps), v-Cu (153 ps), and v-C (160 ps)) [38–40]. Moreover,similar positron lifetimes were found for martensite (159 ± 3 ps), bainite (164 ± 3 ps),pearlite (151 ± 3 ps), and austenite (149 ± 3 ps) steel structures [41,42] after different heattreatments. This implies that this lifetime cannot be unequivocally assigned to only onetype of defect.
Unambiguous identification of the second time component, τB = 240 ± 4 ps, is alsoproblematic. A similar value is typical for vacancy clusters (~5) in the Fe lattice [35–37,42,43],as well as defects associated with second-phase precipitates (e.g., the Fe3C cementite–matrix interface [44]). Comparable values are also found for iron and chromium oxides, theformation of which is often due to natural oxidation (rust) and annealing in the air [45]. It
Materials 2022, 15, 1017 6 of 13
is known that the presence of large clusters of defects is related to the cracking mechanismand may adversely affect the mechanical properties of the white layer. Analysis of PALSspectra alone does not allow the determination of the nature of positron trapping centersin steel after high-speed cutting; therefore, it is necessary to supplement it with DBS andCDBS data.
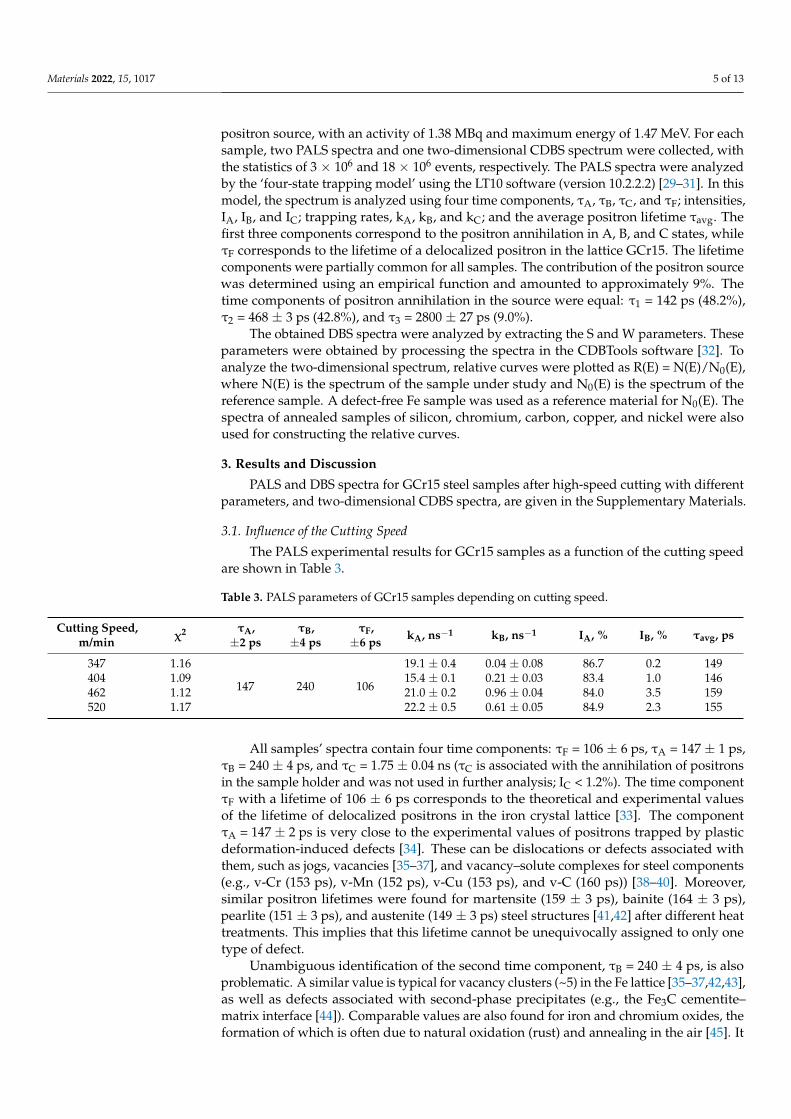
Figure 2 shows the DBS parameters (a) and the average positron lifetime (b) for GCr15steel samples as a function of cutting speed.
Materials 2022, 15, x FOR PEER REVIEW 6 of 13
v-Cr (153 ps), v-Mn (152 ps), v-Cu (153 ps), and v-C (160 ps)) [38–40]. Moreover, similar positron lifetimes were found for martensite (159 ± 3 ps), bainite (164 ± 3 ps), pearlite (151 ± 3 ps), and austenite (149 ± 3 ps) steel structures [41,42] after different heat treatments. This implies that this lifetime cannot be unequivocally assigned to only one type of de-fect.
Unambiguous identification of the second time component, τB = 240 ± 4 ps, is also problematic. A similar value is typical for vacancy clusters (~5) in the Fe lattice [35–37,42,43], as well as defects associated with second-phase precipitates (e.g., the Fe3C ce-mentite–matrix interface [44]). Comparable values are also found for iron and chromium oxides, the formation of which is often due to natural oxidation (rust) and annealing in the air [45]. It is known that the presence of large clusters of defects is related to the cracking mechanism and may adversely affect the mechanical properties of the white layer. Analysis of PALS spectra alone does not allow the determination of the nature of positron trapping centers in steel after high-speed cutting; therefore, it is necessary to supplement it with DBS and CDBS data.
Figure 2 shows the DBS parameters (a) and the average positron lifetime (b) for GCr15 steel samples as a function of cutting speed.
(a) (b)
Figure 2. Dependencies of S (black) and W (blue) parameters (a) and average positron lifetime (b) as a function of cutting speed for GCr15 steel.
It is clearly seen that the S parameter and the mean lifetime have opposite trends, which is unusual, as both parameters are sensitive to the free volume defects in similar ways [46,47]. This behavior indicates the significant influence of the chemical environ-ment (e.g., secondary phase precipitate formation) or phase transformations (e.g., trans-formation of martensite to austenite) [42]. Increasing the cutting speed of GCr15 steel produces intense heating above the austenitic transformation temperature and promotes secondary quenching in which cryptocrystalline martensite and cementite are formed, thus causing the S parameter to decrease and the average lifetime of the positrons to in-crease.
The CDB ratio curves for pure annealed iron obtained from all the studied samples of GCr15 steel are shown in Figure 3, along with the ratio curves for the major alloying elements (C, Si, Cu, Ni, and Cr).
Figure 2. Dependencies of S (black) and W (blue) parameters (a) and average positron lifetime (b) asa function of cutting speed for GCr15 steel.
It is clearly seen that the S parameter and the mean lifetime have opposite trends,which is unusual, as both parameters are sensitive to the free volume defects in similarways [46,47]. This behavior indicates the significant influence of the chemical environment(e.g., secondary phase precipitate formation) or phase transformations (e.g., transformationof martensite to austenite) [42]. Increasing the cutting speed of GCr15 steel producesintense heating above the austenitic transformation temperature and promotes secondaryquenching in which cryptocrystalline martensite and cementite are formed, thus causingthe S parameter to decrease and the average lifetime of the positrons to increase.
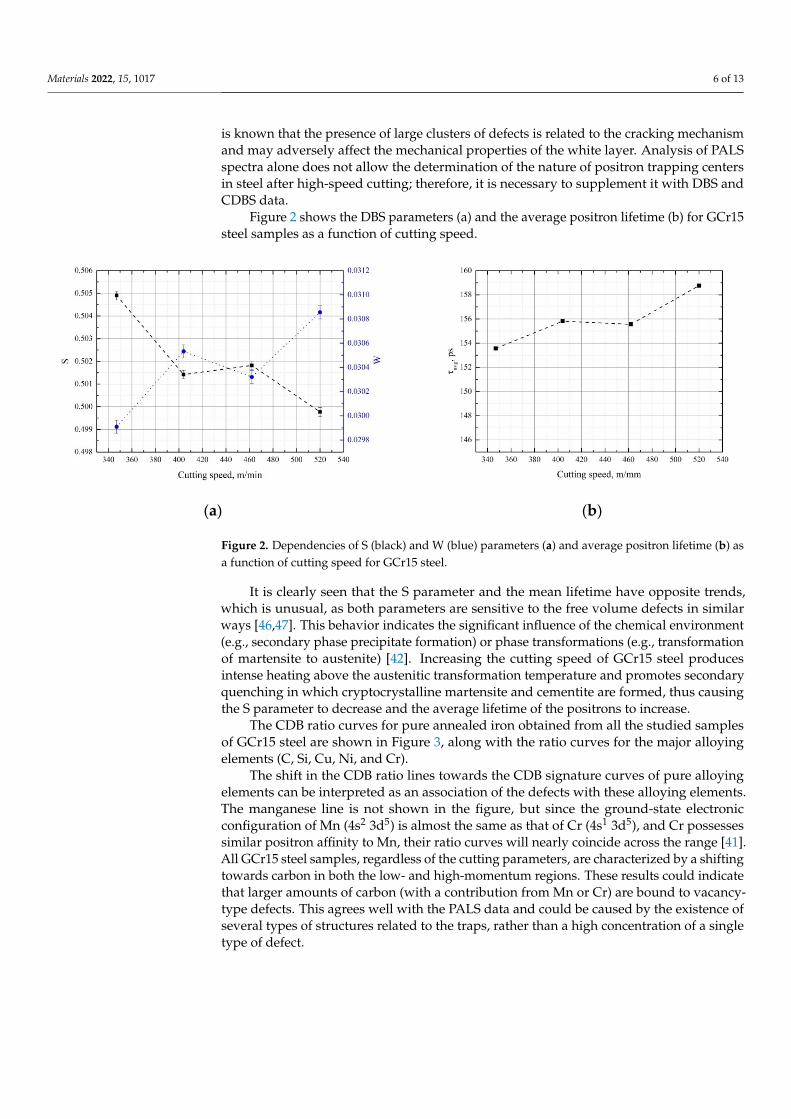
The CDB ratio curves for pure annealed iron obtained from all the studied samplesof GCr15 steel are shown in Figure 3, along with the ratio curves for the major alloyingelements (C, Si, Cu, Ni, and Cr).
The shift in the CDB ratio lines towards the CDB signature curves of pure alloyingelements can be interpreted as an association of the defects with these alloying elements.The manganese line is not shown in the figure, but since the ground-state electronicconfiguration of Mn (4s2 3d5) is almost the same as that of Cr (4s1 3d5), and Cr possessessimilar positron affinity to Mn, their ratio curves will nearly coincide across the range [41].All GCr15 steel samples, regardless of the cutting parameters, are characterized by a shiftingtowards carbon in both the low- and high-momentum regions. These results could indicatethat larger amounts of carbon (with a contribution from Mn or Cr) are bound to vacancy-type defects. This agrees well with the PALS data and could be caused by the existence ofseveral types of structures related to the traps, rather than a high concentration of a singletype of defect.
Materials 2022, 15, 1017 7 of 13
Materials 2022, 15, x FOR PEER REVIEW 7 of 13
Figure 3. Ratio curves to Fe for GCr15 samples with different cutting parameters and steel com-ponents. Description of samples is given in Table 1.
The shift in the CDB ratio lines towards the CDB signature curves of pure alloying elements can be interpreted as an association of the defects with these alloying elements. The manganese line is not shown in the figure, but since the ground-state electronic con-figuration of Mn (4s2 3d5) is almost the same as that of Cr (4s1 3d5), and Cr possesses sim-ilar positron affinity to Mn, their ratio curves will nearly coincide across the range [41]. All GCr15 steel samples, regardless of the cutting parameters, are characterized by a shifting towards carbon in both the low- and high-momentum regions. These results could indicate that larger amounts of carbon (with a contribution from Mn or Cr) are bound to vacancy-type defects. This agrees well with the PALS data and could be caused by the existence of several types of structures related to the traps, rather than a high concentration of a single type of defect.
The results of layer-by-layer analysis using variable-energy positron beams are shown in Figure 4. The characteristic increase in the S parameter for low-energy positrons observed in all spectra is caused by the increased number of positrons annihilated from the surface state. Above 15 keV in energy, all positrons are annihilated inside the mate-rial, and only a negligible number of positrons can diffuse and annihilate on surface de-fects. Due to the difficulty of assigning changes to only one type of defect, these changes will only be interpreted in terms of the difference between cutting parameters. Typically, the S parameter can be considered an integral characteristic representing the total open volume defect level, but, as shown above, in the case of high-speed steel cutting, it is also influenced by phase transformations. The phase transformation from the martensitic to austenitic phase is accompanied by a decrease in the S parameter [41,48]. The reverse martensitic transformation leads to the S parameter increasing. Thus, it is not possible to separate the contribution from phase transformations in steel during high-speed cutting that are associated with the accumulation of deformation or quench defects, and herein-after we will consider only their cumulative effect.
Figure 3. Ratio curves to Fe for GCr15 samples with different cutting parameters and steel compo-nents. Description of samples is given in Table 1.
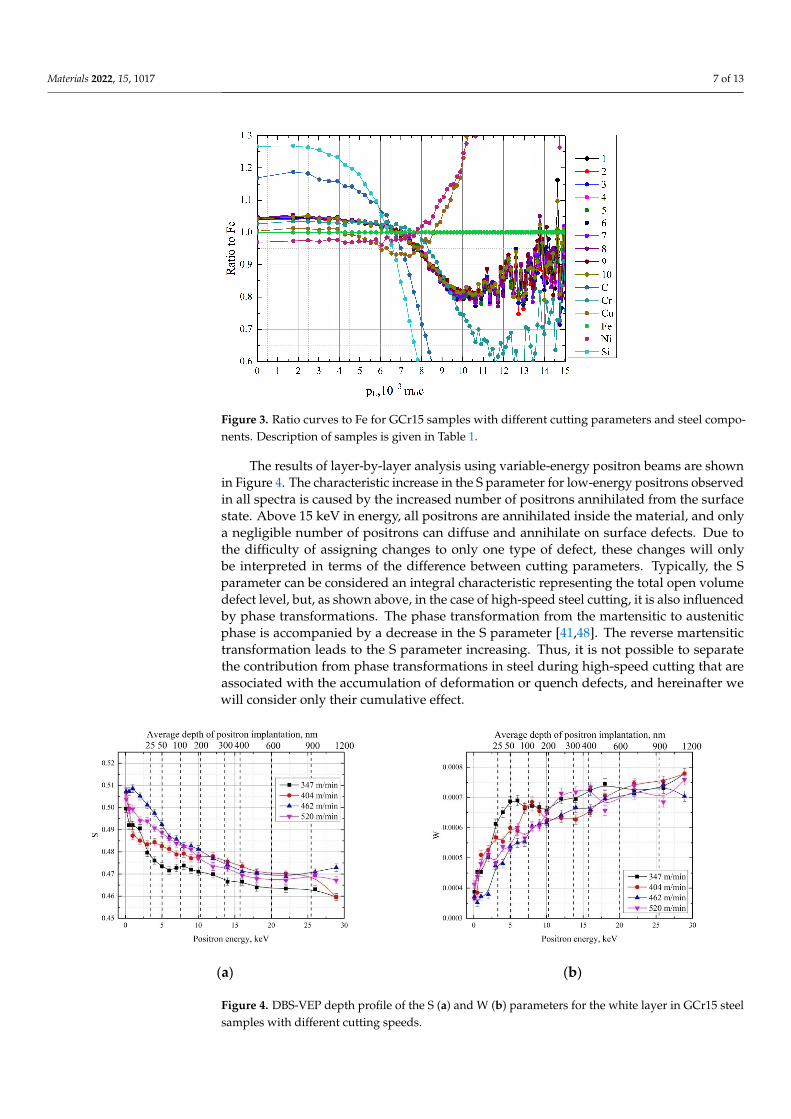
The results of layer-by-layer analysis using variable-energy positron beams are shownin Figure 4. The characteristic increase in the S parameter for low-energy positrons observedin all spectra is caused by the increased number of positrons annihilated from the surfacestate. Above 15 keV in energy, all positrons are annihilated inside the material, and onlya negligible number of positrons can diffuse and annihilate on surface defects. Due tothe difficulty of assigning changes to only one type of defect, these changes will onlybe interpreted in terms of the difference between cutting parameters. Typically, the Sparameter can be considered an integral characteristic representing the total open volumedefect level, but, as shown above, in the case of high-speed steel cutting, it is also influencedby phase transformations. The phase transformation from the martensitic to austeniticphase is accompanied by a decrease in the S parameter [41,48]. The reverse martensitictransformation leads to the S parameter increasing. Thus, it is not possible to separatethe contribution from phase transformations in steel during high-speed cutting that areassociated with the accumulation of deformation or quench defects, and hereinafter wewill consider only their cumulative effect.
Materials 2022, 15, x FOR PEER REVIEW 8 of 13
(a) (b)
Figure 4. DBS-VEP depth profile of the S (a) and W (b) parameters for the white layer in GCr15 steel samples with different cutting speeds.
The GCr15 steel samples cut at the minimum cutting speed (347 m/min) are charac-terized by the minimum S parameter and maximum W up to 1.2 µm depth. An increase in cutting speed by 16.5% leads to a rise in the S parameter, accompanied by a decrease in the W term at depths from 25 to 900 nm. Increasing the cutting speed to 462 m/min then leads to a further increase in the S parameter, with the most noticeable differences oc-curring at depths up to 30 nm. At the highest cutting speed of 520 m/min, there is a de-crease in the S parameter compared to the speed of 462 m/min, but only at depths up to 50 nm. At greater depths, there are no noticeable changes. The results agree with the data presented in [49], which demonstrate that with the increase in cutting speed, the retained austenite content tends to first increase and then decrease.
3.2. Influence of the Feed Rate The PALS experimental results for GCr15 samples, showing the dependence on the
feed rate, are shown in Table 4.
Table 4. PALS parameters of GCr15 samples depending on feed rate.
Feed Rate, (mm/r) χ2 τA,
± 1 ps τB,
± 4 ps τF,
± 6 ps kA, ns−1 kB, ns−1 IA, % IB,% τavg, ps
0.10 1.18
147 240 106
17.4 ± 0.1 0.47 ± 0.05 83.6 2.0 152 0.15 1.26 21.1 ± 0.1 0.39 ± 0.01 86.2 1.4 154 0.20 1.12 21.0 ± 0.2 0.96 ± 0.04 84.0 3.5 159 0.24 1.13 15.5 ± 0.2 0.55 ± 0.02 81.8 2.5 152
The PALS data at different feed rates identify the same lifetime components as at different cutting speeds (see Table 3). Increasing the feed rate first increases the intensity of the component τA, and then decreases it below the starting level. The intensity varia-tion of the second component τB has no clear trend.
Figure 5 presents the DBS parameters (a) and the average positron lifetime (b) for GCr15 steel samples as a function of feed rate.
Figure 4. DBS-VEP depth profile of the S (a) and W (b) parameters for the white layer in GCr15 steelsamples with different cutting speeds.
Materials 2022, 15, 1017 8 of 13
The GCr15 steel samples cut at the minimum cutting speed (347 m/min) are character-ized by the minimum S parameter and maximum W up to 1.2 µm depth. An increase incutting speed by 16.5% leads to a rise in the S parameter, accompanied by a decrease in theW term at depths from 25 to 900 nm. Increasing the cutting speed to 462 m/min then leadsto a further increase in the S parameter, with the most noticeable differences occurring atdepths up to 30 nm. At the highest cutting speed of 520 m/min, there is a decrease in the Sparameter compared to the speed of 462 m/min, but only at depths up to 50 nm. At greaterdepths, there are no noticeable changes. The results agree with the data presented in [49],which demonstrate that with the increase in cutting speed, the retained austenite contenttends to first increase and then decrease.
3.2. Influence of the Feed Rate
The PALS experimental results for GCr15 samples, showing the dependence on thefeed rate, are shown in Table 4.
Table 4. PALS parameters of GCr15 samples depending on feed rate.
Feed Rate,(mm/r) χ2 τA,
±1 psτB,
±4 psτF,
±6 ps kA, ns−1 kB, ns−1 IA, % IB,% τavg, ps
0.10 1.18
147 240 106
17.4 ± 0.1 0.47 ± 0.05 83.6 2.0 1520.15 1.26 21.1 ± 0.1 0.39 ± 0.01 86.2 1.4 1540.20 1.12 21.0 ± 0.2 0.96 ± 0.04 84.0 3.5 1590.24 1.13 15.5 ± 0.2 0.55 ± 0.02 81.8 2.5 152
The PALS data at different feed rates identify the same lifetime components as atdifferent cutting speeds (see Table 3). Increasing the feed rate first increases the intensity ofthe component τA, and then decreases it below the starting level. The intensity variation ofthe second component τB has no clear trend.
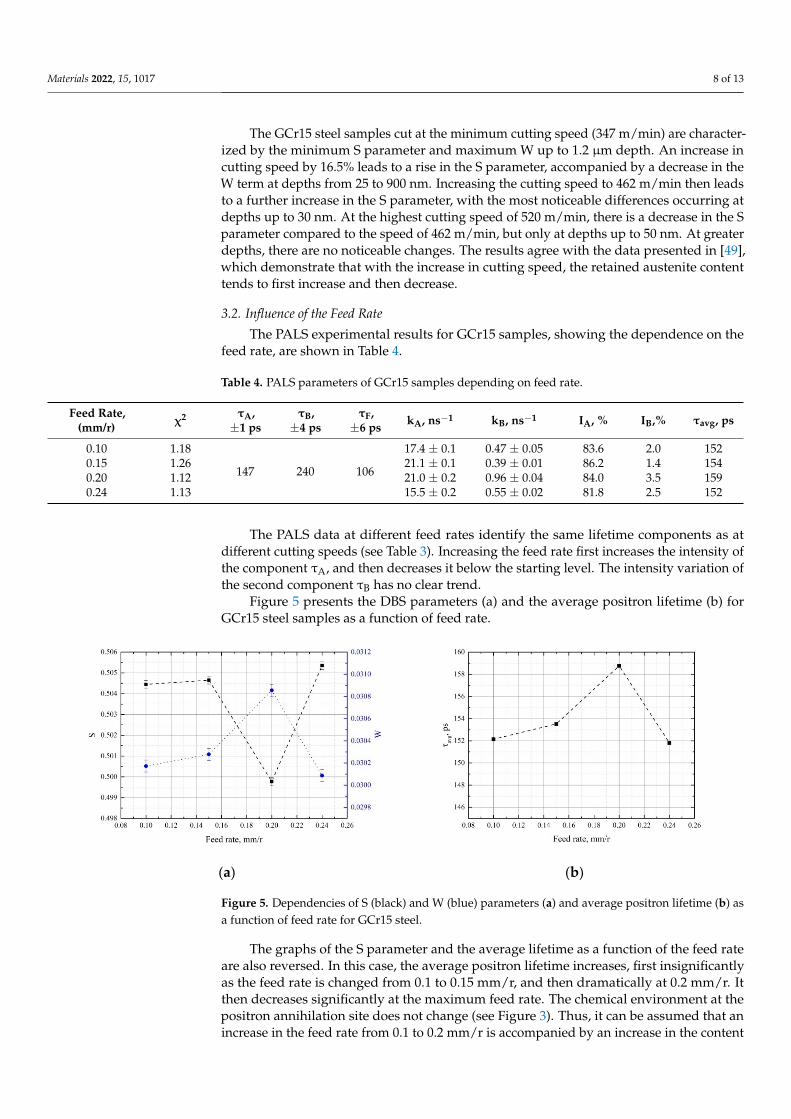
Figure 5 presents the DBS parameters (a) and the average positron lifetime (b) forGCr15 steel samples as a function of feed rate.
Materials 2022, 15, x FOR PEER REVIEW 9 of 13
(a) (b)
Figure 5. Dependencies of S (black) and W (blue) parameters (a) and average positron lifetime (b) as a function of feed rate for GCr15 steel.
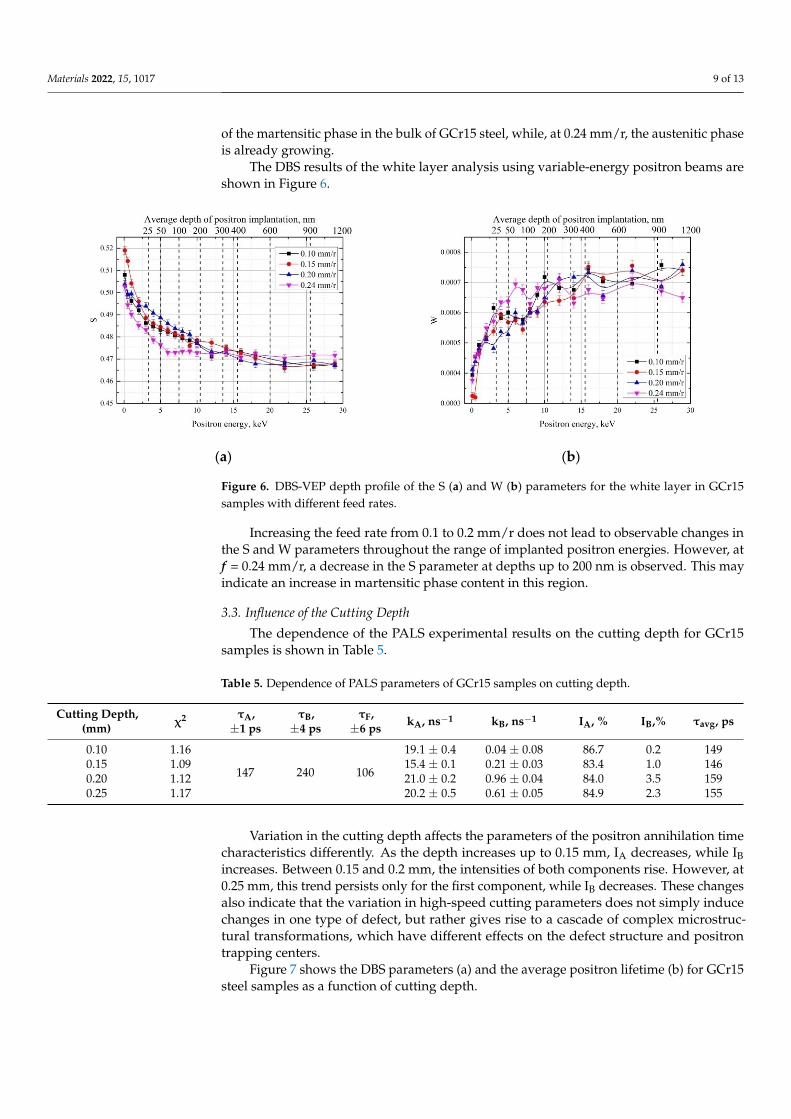
The graphs of the S parameter and the average lifetime as a function of the feed rate are also reversed. In this case, the average positron lifetime increases, first insignificantly as the feed rate is changed from 0.1 to 0.15 mm/r, and then dramatically at 0.2 mm/r. It then decreases significantly at the maximum feed rate. The chemical environment at the positron annihilation site does not change (see Figure 3). Thus, it can be assumed that an increase in the feed rate from 0.1 to 0.2 mm/r is accompanied by an increase in the content of the martensitic phase in the bulk of GCr15 steel, while, at 0.24 mm/r, the austenitic phase is already growing.
The DBS results of the white layer analysis using variable-energy positron beams are shown in Figure 6.
(a) (b)
Figure 6. DBS-VEP depth profile of the S (a) and W (b) parameters for the white layer in GCr15 samples with different feed rates.
Increasing the feed rate from 0.1 to 0.2 mm/r does not lead to observable changes in the S and W parameters throughout the range of implanted positron energies. However, at f = 0.24 mm/r, a decrease in the S parameter at depths up to 200 nm is observed. This may indicate an increase in martensitic phase content in this region.
3.3. Influence of the Cutting Depth The dependence of the PALS experimental results on the cutting depth for GCr15
samples is shown in Table 5.
Figure 5. Dependencies of S (black) and W (blue) parameters (a) and average positron lifetime (b) asa function of feed rate for GCr15 steel.
The graphs of the S parameter and the average lifetime as a function of the feed rateare also reversed. In this case, the average positron lifetime increases, first insignificantlyas the feed rate is changed from 0.1 to 0.15 mm/r, and then dramatically at 0.2 mm/r. Itthen decreases significantly at the maximum feed rate. The chemical environment at thepositron annihilation site does not change (see Figure 3). Thus, it can be assumed that anincrease in the feed rate from 0.1 to 0.2 mm/r is accompanied by an increase in the content
Materials 2022, 15, 1017 9 of 13
of the martensitic phase in the bulk of GCr15 steel, while, at 0.24 mm/r, the austenitic phaseis already growing.
The DBS results of the white layer analysis using variable-energy positron beams areshown in Figure 6.
Materials 2022, 15, x FOR PEER REVIEW 9 of 13
(a) (b)
Figure 5. Dependencies of S (black) and W (blue) parameters (a) and average positron lifetime (b) as a function of feed rate for GCr15 steel.
The graphs of the S parameter and the average lifetime as a function of the feed rate are also reversed. In this case, the average positron lifetime increases, first insignificantly as the feed rate is changed from 0.1 to 0.15 mm/r, and then dramatically at 0.2 mm/r. It then decreases significantly at the maximum feed rate. The chemical environment at the positron annihilation site does not change (see Figure 3). Thus, it can be assumed that an increase in the feed rate from 0.1 to 0.2 mm/r is accompanied by an increase in the content of the martensitic phase in the bulk of GCr15 steel, while, at 0.24 mm/r, the austenitic phase is already growing.
The DBS results of the white layer analysis using variable-energy positron beams are shown in Figure 6.
(a) (b)
Figure 6. DBS-VEP depth profile of the S (a) and W (b) parameters for the white layer in GCr15 samples with different feed rates.
Increasing the feed rate from 0.1 to 0.2 mm/r does not lead to observable changes in the S and W parameters throughout the range of implanted positron energies. However, at f = 0.24 mm/r, a decrease in the S parameter at depths up to 200 nm is observed. This may indicate an increase in martensitic phase content in this region.
3.3. Influence of the Cutting Depth The dependence of the PALS experimental results on the cutting depth for GCr15
samples is shown in Table 5.
Figure 6. DBS-VEP depth profile of the S (a) and W (b) parameters for the white layer in GCr15samples with different feed rates.
Increasing the feed rate from 0.1 to 0.2 mm/r does not lead to observable changes inthe S and W parameters throughout the range of implanted positron energies. However, atf = 0.24 mm/r, a decrease in the S parameter at depths up to 200 nm is observed. This mayindicate an increase in martensitic phase content in this region.
3.3. Influence of the Cutting Depth
The dependence of the PALS experimental results on the cutting depth for GCr15samples is shown in Table 5.
Table 5. Dependence of PALS parameters of GCr15 samples on cutting depth.
Cutting Depth,(mm) χ2 τA,
±1 psτB,
±4 psτF,
±6 ps kA, ns−1 kB, ns−1 IA, % IB,% τavg, ps
0.10 1.16
147 240 106
19.1 ± 0.4 0.04 ± 0.08 86.7 0.2 1490.15 1.09 15.4 ± 0.1 0.21 ± 0.03 83.4 1.0 1460.20 1.12 21.0 ± 0.2 0.96 ± 0.04 84.0 3.5 1590.25 1.17 20.2 ± 0.5 0.61 ± 0.05 84.9 2.3 155
Variation in the cutting depth affects the parameters of the positron annihilation timecharacteristics differently. As the depth increases up to 0.15 mm, IA decreases, while IBincreases. Between 0.15 and 0.2 mm, the intensities of both components rise. However, at0.25 mm, this trend persists only for the first component, while IB decreases. These changesalso indicate that the variation in high-speed cutting parameters does not simply inducechanges in one type of defect, but rather gives rise to a cascade of complex microstruc-tural transformations, which have different effects on the defect structure and positrontrapping centers.
Figure 7 shows the DBS parameters (a) and the average positron lifetime (b) for GCr15steel samples as a function of cutting depth.
Materials 2022, 15, 1017 10 of 13
Materials 2022, 15, x FOR PEER REVIEW 10 of 13
Table 5. Dependence of PALS parameters of GCr15 samples on cutting depth.
Cutting Depth, (mm)
χ2 τA,
± 1 ps τB,
± 4 ps τF,
± 6 ps kA, ns−1 kB, ns−1 IA, % IB,% τavg, ps
0.10 1.16
147 240 106
19.1 ± 0.4 0.04 ± 0.08 86.7 0.2 149 0.15 1.09 15.4 ± 0.1 0.21 ± 0.03 83.4 1.0 146 0.20 1.12 21.0 ± 0.2 0.96 ± 0.04 84.0 3.5 159 0.25 1.17 20.2 ± 0.5 0.61 ± 0.05 84.9 2.3 155
Variation in the cutting depth affects the parameters of the positron annihilation time characteristics differently. As the depth increases up to 0.15 mm, IA decreases, while IB increases. Between 0.15 and 0.2 mm, the intensities of both components rise. However, at 0.25 mm, this trend persists only for the first component, while IB decreases. These changes also indicate that the variation in high-speed cutting parameters does not simply induce changes in one type of defect, but rather gives rise to a cascade of complex mi-crostructural transformations, which have different effects on the defect structure and positron trapping centers.
Figure 7 shows the DBS parameters (a) and the average positron lifetime (b) for GCr15 steel samples as a function of cutting depth.
(a) (b)
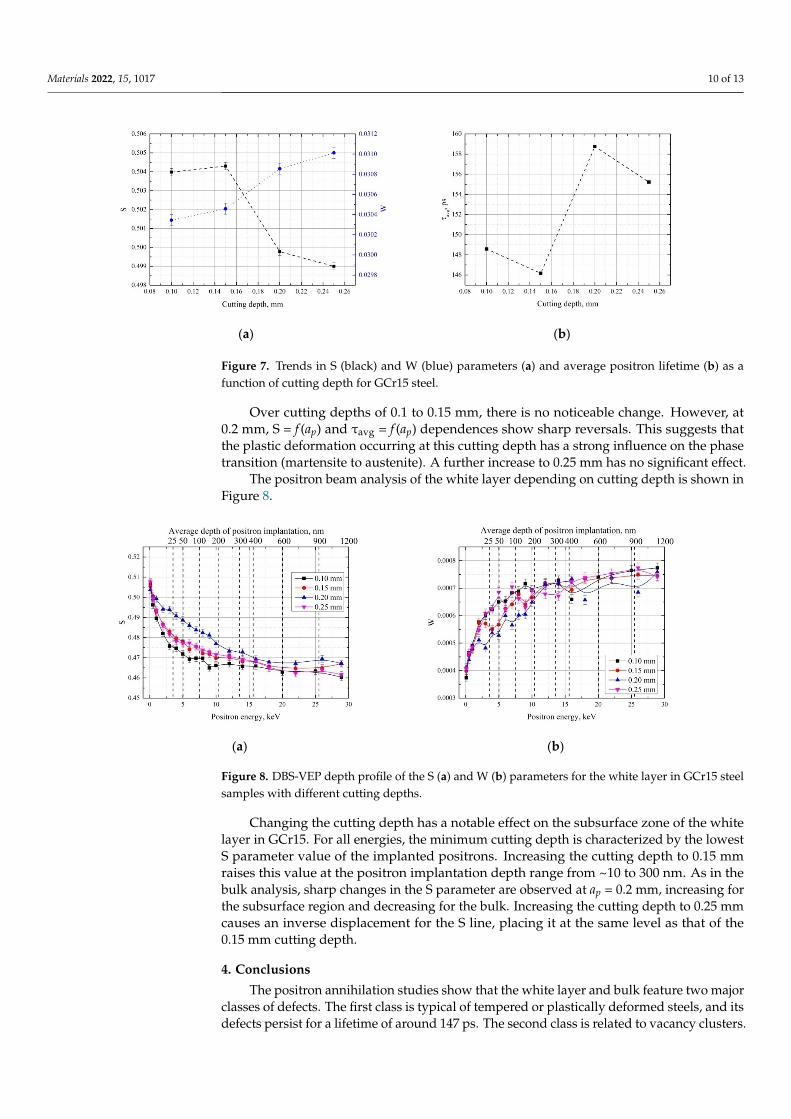
Figure 7. Trends in S (black) and W (blue) parameters (a) and average positron lifetime (b) as a function of cutting depth for GCr15 steel.
Over cutting depths of 0.1 to 0.15 mm, there is no noticeable change. However, at 0.2 mm, S = f(ap) and τavg = f(ap) dependences show sharp reversals. This suggests that the plastic deformation occurring at this cutting depth has a strong influence on the phase transition (martensite to austenite). A further increase to 0.25 mm has no significant ef-fect.
The positron beam analysis of the white layer depending on cutting depth is shown in Figure 8.
Figure 7. Trends in S (black) and W (blue) parameters (a) and average positron lifetime (b) as afunction of cutting depth for GCr15 steel.
Over cutting depths of 0.1 to 0.15 mm, there is no noticeable change. However, at0.2 mm, S = f (ap) and τavg = f (ap) dependences show sharp reversals. This suggests thatthe plastic deformation occurring at this cutting depth has a strong influence on the phasetransition (martensite to austenite). A further increase to 0.25 mm has no significant effect.
The positron beam analysis of the white layer depending on cutting depth is shown inFigure 8.
Materials 2022, 15, x FOR PEER REVIEW 11 of 13
(a) (b)
Figure 8. DBS-VEP depth profile of the S (a) and W (b) parameters for the white layer in GCr15 steel samples with different cutting depths.
Changing the cutting depth has a notable effect on the subsurface zone of the white layer in GCr15. For all energies, the minimum cutting depth is characterized by the low-est S parameter value of the implanted positrons. Increasing the cutting depth to 0.15 mm raises this value at the positron implantation depth range from ~10 to 300 nm. As in the bulk analysis, sharp changes in the S parameter are observed at ap = 0.2 mm, increasing for the subsurface region and decreasing for the bulk. Increasing the cutting depth to 0.25 mm causes an inverse displacement for the S line, placing it at the same level as that of the 0.15 mm cutting depth.
4. Conclusions The positron annihilation studies show that the white layer and bulk feature two
major classes of defects. The first class is typical of tempered or plastically deformed steels, and its defects persist for a lifetime of around 147 ps. The second class is related to vacancy clusters. Larger clusters can negatively affect the white layer’s properties and can contribute to its brittleness, potentially causing it to fall off. A variation in the cutting parameters has a different effect on plastic deformation, and the phase transition is ob-served in the near-surface zone. Therefore, adequately chosen cutting parameters can limit the number of vacancy clusters. The lowest prevalence of these defects was ob-served from the studied parameters for a cutting depth of 0.1 mm, feed rate of 0.15 mm/r, and cutting speed of 347 m/min.
Supplementary Materials: The following supporting information can be downloaded at: www.mdpi.com/xxx/s1, Figure S1: PALS spectra for GCr15 steel after high-speed cutting, Figure S2: DBS spectra for GCr15 steel after high-speed cutting, Figure S3: CDBS spectra for GCr15 steel after high-speed cutting.
Author Contributions: J.L. organized the experimental procedure and preparation of the manu-script. R.L. conducted the bulk PALS analysis. I.B. examined samples using the CDBS and DBS methods. K.S. and P.H. performed layer-by-layer analysis using positron spectroscopy methods. A.L., H.S. and J.C. conducted sampling and manuscript preparation. All authors have read and agreed to the published version of the manuscript.
Funding: This work was financially supported by RFBR (project number 21-58-53039) and the Na-tional Natural Science Foundation of China (Grant No. 51775357).
Institutional Review Board Statement: Not applicable.
Informed Consent Statement: Not applicable.
Data Availability Statement: The data presented in this study are available on request from the corresponding author. The data are not publicly available due to privacy reasons.
Figure 8. DBS-VEP depth profile of the S (a) and W (b) parameters for the white layer in GCr15 steelsamples with different cutting depths.
Changing the cutting depth has a notable effect on the subsurface zone of the whitelayer in GCr15. For all energies, the minimum cutting depth is characterized by the lowestS parameter value of the implanted positrons. Increasing the cutting depth to 0.15 mmraises this value at the positron implantation depth range from ~10 to 300 nm. As in thebulk analysis, sharp changes in the S parameter are observed at ap = 0.2 mm, increasing forthe subsurface region and decreasing for the bulk. Increasing the cutting depth to 0.25 mmcauses an inverse displacement for the S line, placing it at the same level as that of the0.15 mm cutting depth.
4. Conclusions
The positron annihilation studies show that the white layer and bulk feature two majorclasses of defects. The first class is typical of tempered or plastically deformed steels, and itsdefects persist for a lifetime of around 147 ps. The second class is related to vacancy clusters.
Materials 2022, 15, 1017 11 of 13
Larger clusters can negatively affect the white layer’s properties and can contribute to itsbrittleness, potentially causing it to fall off. A variation in the cutting parameters has adifferent effect on plastic deformation, and the phase transition is observed in the near-surface zone. Therefore, adequately chosen cutting parameters can limit the number ofvacancy clusters. The lowest prevalence of these defects was observed from the studiedparameters for a cutting depth of 0.1 mm, feed rate of 0.15 mm/r, and cutting speed of347 m/min.
Supplementary Materials: The following supporting information can be downloaded at: https://www.mdpi.com/article/10.3390/ma15031017/s1, Figure S1: PALS spectra for GCr15 steel afterhigh-speed cutting, Figure S2: DBS spectra for GCr15 steel after high-speed cutting, Figure S3: CDBSspectra for GCr15 steel after high-speed cutting.
Author Contributions: J.L. organized the experimental procedure and preparation of the manuscript.R.L. conducted the bulk PALS analysis. I.B. examined samples using the CDBS and DBS methods.K.S. and P.H. performed layer-by-layer analysis using positron spectroscopy methods. A.L., H.S.and J.C. conducted sampling and manuscript preparation. All authors have read and agreed to thepublished version of the manuscript.
Funding: This work was financially supported by the National Natural Science Foundation of China(Grant No. 51775357) and RFBR (project number 21-58-53039).
Institutional Review Board Statement: Not applicable.
Informed Consent Statement: Not applicable.
Data Availability Statement: The data presented in this study are available on request from thecorresponding author. The data are not publicly available due to privacy reasons.
Conflicts of Interest: The authors declare no conflict of interest.
References1. Poulachon, G.; Albert, A.; Schluraff, M.; Jawahir, I.S. An experimental investigation of work material microstructure effects on
white layer formation in PCBN hard turning. Int. J. Mach. Tools Manuf. 2005, 45, 211–218. [CrossRef]2. Duan, C.; Zhang, F.; Kong, W. Modeling and prediction of white layer thickness in dry and hard machining of hardened steel. J.
Mech. Eng. 2015, 51, 194–202. [CrossRef]3. Zhang, F.Y.; Duan, C.Z.; Wang, M.J. Research status of the machined surface metamorphic layer. Mach. Des. Manuf. 2014, 10,
265–268.4. König, W.; Komanduri, R.; Toenshoff, H.K.; Ackershott, G. Machining of hard materials. CIRP Ann. 1984, 33, 417–427. [CrossRef]5. Chou, Y.K.; Evans, C.J. White layers and thermal modeling of hard turned surfaces. Int. J. Mach. Tools Manuf. 1999, 39, 1863–1881.
[CrossRef]6. Han, S.; Melkote, S.N.; Haluska, M.S.; Watkins, T.R. White layer formation due to phase transformation in orthogonal machining
of AISI 1045 annealed steel. Mater. Sci. Eng. A 2008, 488, 195–204. [CrossRef]7. Bulpett, R.; Eyre, T.S.; Ralph, B. The characterization of white layers formed on digger teeth. Wear 1993, 162, 1059–1065. [CrossRef]8. Barry, J.; Byrne, G. TEM study on the surface white layer in two turned hardened steels. Mater. Sci. Eng. A 2002, 325, 356–364.
[CrossRef]9. Umbrello, D. Analysis of the white layers formed during machining of hardened AISI 52100 steel under dry and cryogenic
cooling conditions. Int. J. Adv. Manuf. Technol. 2013, 64, 633–642. [CrossRef]10. Chen, T.; Liu, X.; Li, S.; Li, K.; Liu, T. Mechanism of White Layer Formation on Machined Surface of High-speed Hard Machining.
J. Mech. Eng. 2015, 51, 23. [CrossRef]11. Zhanqiang, L. Thermo-mechanical Coupling Mechanisms for White Layer Formation on Machined Surface of Powder Metallurgi-
cal Nickel-based Superalloy. J. Mech. Eng. 2014, 50, 186. (In Chinese)12. Weng, H.; Zhou, X.; Ye, B.; Han, R. Others Films, interfaces and near surface studies using variable energy positron beam. Wuli
2000, 29, 308–312.13. Hu, Y.-C.; Cao, X.; Li, Y.-X.; Zhang, P.; Jin, S.; Lu, E.; Yu, R.S.; Wei, L.; Wang, B. Applications and progress of slow positron beam
technique in the study of metal/alloy microdefects. Acta Phys. Sin. 2015, 64, 247804.14. Cheng, G.; Cao, X.; Wu, J.; Wu, H.; Yang, J.; Jiang, X.; Yu, R.; Wang, B. Advances in Investigating Micro-defects in Fe-Cu Alloys
Using Positron Annihilation Techniques. Mater. Rev. 2013, 3, 133–136.15. Xiaoyong, W.; Tao, P.A.N.; Hua, W.; Hang, S.U.; Xiangyang, L.I.; Xingzhong, C.A.O. Investigation of the toughness of low carbon
tempered martensite in the surface of Ni-Cr-Mo-B ultra-heavy plate steel. Acta Met. Sin. 2012, 48, 401–406.16. Wu, Y.; Zhang, X. Applications of positron annihilation technology for metals and alloys. Wuli 2000, 29, 401–405.
Materials 2022, 15, 1017 12 of 13
17. Padma, N.; Maheshwari, P.; Bhattacharya, D.; Tokas, R.B.; Sen, S.; Honda, Y.; Basu, S.; Pujari, P.K.; Rao, T.V.C. Investigationson substrate temperature-induced growth modes of organic semiconductors at dielectric/semiconductor interface and theircorrelation with threshold voltage stability in organic field-effect transistors. ACS Appl. Mater. Interfaces 2016, 8, 3376–3385.[CrossRef]
18. Zhang, L.; Cheng, B.; Zhang, J.; Zhang, L.; Guo, W.; Liu, J.; Zhang, L.; Ye, B. Microstructure of functional materials probed bypositron annihilation spectroscopy. Sci. Sin. Phys. Mech. Astron. 2012, 42, 1217–1225.
19. Cao, X.; Song, L.-G.; Jin, S.; Zhang, R.-G.; Wang, B.; Wei, L. Advances in applications of positron annihilation spectroscopy toinvestigating semiconductor microstructures. Acta Phys. Sin. 2017, 66, 027801.
20. Arutyunov, N.Y.; Elsayed, M.; Krause-Rehberg, R.; Emtsev, V.V.; Oganesyan, G.A.; Kozlovski, V.V. Positron annihilation on defectsin silicon irradiated with 15 MeV protons. J. Phys. Condens. Matter 2012, 25, 35801. [CrossRef]
21. Sedivy, L.; Cizek, J.; Belas, E.; Grill, R.; Melikhova, O. Positron annihilation spectroscopy of vacancy-related defects in CdTe:CI and CdZnTe: Ge at different stoichiometry deviations. Sci. Rep. 2016, 6, 20641. [CrossRef] [PubMed]
22. Cizek, J. Characterization of lattice defects in metallic materials by positron annihilation spectroscopy: A review. J. Mater. Sci.Technol. 2018, 34, 577–598. [CrossRef]
23. Selim, F.A. Positron annihilation spectroscopy of defects in nuclear and irradiated materials-a review. Mater. Charact. 2021,174, 110952. [CrossRef]
24. Krsjak, V.; Degmova, J.; Noga, P.; Petriska, M.; Sojak, S.; Saro, M.; Neuhold, I.; Slugen, V. Application of Positron AnnihilationSpectroscopy in Accelerator-Based Irradiation Experiments. Materials 2021, 14, 6238. [CrossRef]
25. Horodek, P.; Kobets, A.G.; Meshkov, I.N.; Sidorin, A.A.; Orlov, O.S. Slow positron beam at the JINR, Dubna. Nukleonika 2015, 60,725–728. [CrossRef]
26. Horodek, P.; Bugdol, M.; Kobets, A.G.; Meshkov, I.N.; Orlov, O.S.; Rudakov, A.Y.; Sidorin, A.A.; Yakovenko, S.L. Development ofpositron annihilation spectroscopy at LEPTA facility. Phys. Part. Nucl. Lett. 2014, 11, 708–712. [CrossRef]
27. Kuznetsov, P.V.; Mironov, Y.P.; Tolmachev, A.I.; Bordulev, Y.S.; Laptev, R.S.; Lider, A.M.; Korznikov, A.V. Positron spectroscopy ofdefects in submicrocrystalline nickel after low-temperature annealing. Phys. Solid State 2015, 57, 219–228. [CrossRef]
28. Stepanova, E.; Bordulev, Y.; Kudiiarov, V.; Laptev, R.; Lider, A.; Xinming, J. Effect of hydrogen on the structural and phase stateand defect structure of titanium alloy. In AIP Conference Proceedings; AIP Publishing LLC: Melville, NY, USA, 2016; Volume 1772,p. 30016.
29. Giebel, D.; Kansy, J. A new version of LT program for positron lifetime spectra analysis. Mater. Sci. Forum 2011, 666, 138–141.[CrossRef]
30. Giebel, D.; Kansy, J. LT10 program for solving basic problems connected with defect detection. Phys. Procedia 2012, 35, 122–127.[CrossRef]
31. Krause-Rehberg, R.; Leipner, H.S. Positron Annihilation in Semiconductors: Defect Studies; Springer: Berlin, Germany, 1999.32. Petriska, M.; Sabelová, V.; Slugevn, V. CDBTools-evaluate positron annihilation coincidence Doppler broadening spectrum. Defect
Diffus. Forum 2016, 373, 71–74. [CrossRef]33. Mizuno, M.; Araki, H.; Shirai, Y. Theoretical calculation of positron lifetimes for defects in solids. Adv. Quant. Chem. 2003, 42,
109–126.34. Hosseini, S.B.; Klement, U.; Kaminski, J. Microstructure Characterization of White Layer Formed by Hard Turning and Wire
Electric Discharge Machining in High Carbon Steel (AISI 52100). Adv. Mater. Res. 2011, 409, 684–689. [CrossRef]35. Kamimura, Y.; Tsutsumi, T.; Kuramoto, E. Calculations of positron lifetimes in a jog and vacancies on an edge-dislocation line in
Fe. Phys. Rev. B 1995, 52, 879. [CrossRef] [PubMed]36. Kamimura, Y.; Tsutsumi, T.; Kuramoto, E. Influence of dislocations on positron lifetime in iron. J. Phys. Soc. Jpn. 1997, 66,
3090–3096. [CrossRef]37. Hidalgo, C.; González-Doncel, G.; Linderoth, S.; San Juan, J. Structure of dislocations in Al and Fe as studied by positron-
annihilation spectroscopy. Phys. Rev. B 1992, 45, 7017. [CrossRef]38. Chen, Y.Z.; Csiszár, G.; Cizek, J.; Borchers, C.; Ungár, T.; Goto, S.; Kirchheim, R. On the formation of vacancies in α-ferrite of a
heavily cold-drawn pearlitic steel wire. Scr. Mater. 2011, 64, 390–393. [CrossRef]39. Dominguez-Reyes, R.; Auger, M.A.; Monge, M.A.; Pareja, R. Positron annihilation study of the vacancy clusters in ODS Fe–14Cr
alloys. Philos. Mag. 2017, 97, 833–850. [CrossRef]40. Chen, Y.Z.; Csiszár, G.; Cizek, J.; Westerkamp, S.; Borchers, C.; Ungár, T.; Goto, S.; Liu, F.; Kirchheim, R. Defects in carbon-rich
ferrite of cold-drawn pearlitic steel wires. Metall. Mater. Trans. A 2013, 44, 3882–3889. [CrossRef]41. Rementeria, R.; Dominguez-Reyes, R.; Capdevila, C.; Garcia-Mateo, C.; Caballero, F.G. Positron Annihilation Spectroscopy Study
of carbon-Vacancy interaction in Low-temperature Bainite. Sci. Rep. 2020, 10, 487. [CrossRef]42. Dryzek, E.; Sarnek, M.; Wrobel, M. Reverse transformation of deformation-induced martensite in austenitic stainless steel studied
by positron annihilation. J. Mater. Sci. 2014, 49, 8449–8458. [CrossRef]43. Campillo Robles, J.; Ogando, E.; Plazaola, F. Positron Lifetime Calculation of the Elements of the Periodic Table. J. Phys. Condens.
Matter 2007, 19, 176222. [CrossRef] [PubMed]44. Hidalgo, C.; de Diego, N. Positron trapping in the alloy Fe-1.25 wt.% C. Phys. Status Solidi. A Appl. Res. 1983, 80, K145–K148.
[CrossRef]

Materials 2022, 15, 1017 13 of 13
45. Uhlmann, K.; Britton, D.T.; Heger, S. Investigations of Goethite, Haematite and Magnetite. Mater. Sci. Forum 1994, 175–178,225–228. [CrossRef]
46. Gläser, U.H.; Dlubek, G.; Krause, R. Vacancies and precipitates in Al-1.9 at.% Cu studied by positrons. Phys. Status Solidi B-BasicSolid State Phys. 1991, 163, 337–343. [CrossRef]
47. Resch, L.; Gigl, T.; Klinser, G.; Hugenschmidt, C.; Sprengel, W.; Würschum, R. In situ monitoring of artificial aging and solutionheat treatment of a commercial Al–Mg–Si alloy with a high intensity positron beam. J. Phys. Condens. Matter 2019, 32, 85705.[CrossRef]
48. Horodek, P.; Dryzek, J.; Wrobel, M. Positron Annihilation Study of Defects Induced by Various Cutting Methods in Stainless SteelGrade 304. Tribol. Lett. 2012, 45, 341. [CrossRef]
49. Zhang, F.-y.; Duan, C.-z.; Xu, X.-x.; Wang, W.-j. Influence of cutting condition on white layer induced by high speed machining ofhardened steel. Int. J. Adv. Manuf. Technol. 2018, 98, 77–84. [CrossRef]
Related Documents


![Positron Annihilation Lifetime Spectroscopy Studies of ... · positron annihilation lifetime spectroscopy (PALS) [3, 4]. Over the past half century, the positron method plays an important](https://static.cupdf.com/doc/110x72/5f4d35c8342b4030c521785f/positron-annihilation-lifetime-spectroscopy-studies-of-positron-annihilation.jpg)