Positive Adolescent Functioning: An Assessment of Measures Across Time and Group Brian K. Barber Department of Child and Family Studies The University of Tennessee Knoxville, TN 37996-1900 [email protected] This study was supported by a FIRST Award from the National Institute of Mental Health (R29- MH47067-03) to Brian K. Barber. Appreciation is expressed to the administrators, teachers, and families of the Ogden Utah City School District for participating in this study. A version of this paper was presented at the Child Trends Indicators of Positive Development Conference, Washington, DC, March 12-13, 2003.

Welcome message from author
This document is posted to help you gain knowledge. Please leave a comment to let me know what you think about it! Share it to your friends and learn new things together.
Transcript
Positive Adolescent Functioning: An Assessment of Measures Across Time and Group
Brian K. Barber
Department of Child and Family Studies The University of Tennessee Knoxville, TN 37996-1900
[email protected] This study was supported by a FIRST Award from the National Institute of Mental Health (R29-MH47067-03) to Brian K. Barber. Appreciation is expressed to the administrators, teachers, and families of the Ogden Utah City School District for participating in this study. A version of this paper was presented at the Child Trends Indicators of Positive Development Conference, Washington, DC, March 12-13, 2003.

For Indicators of Positive Development Conference March 12-13, 2003
2
Abstract
Positive Adolescent Functioning: An Assessment of Measures Across Time and Group
The intent of this study was to contribute to the growing interest in positive adolescent
functioning by thoroughly testing the reliability of several, theoretically relevant measures: self-
esteem, perspective taking, empathy, social initiative, peer connection, and communication with
mothers and fathers. Using an NIMH-funded, longitudinal data set, these seven measures were
assessed for kurtosis, skew and Cronbach’s alpha. Tests were conducted for 5- and 3-item
versions of every scale in each of 5 consecutive years of self-reported data from adolescents, and
separately in each year on the key sex, age, social class, and religious affiliation sub-groupings of
the data set. Almost without exception, the tests revealed adequate psychometric properties for
all of the scales.
For Indicators of Positive Development Conference March 12-13, 2003
3Positive Adolescent Functioning: An Assessment of Measures Across Time and Group
Introduction
The welcome shift in focus from negative to positive aspects of adolescents currently
being pursued by many social science and public health researchers (e.g., Arnett, 1999; Barber &
Erickson, 2001; Larson, 2000; Halpern-Felsher, Millstein, & Irwin, 2002; Yates & Youniss,
1999) brings with it the important challenge of identifying, revising, and/or developing adequate
measurement instruments. Efficient progress in understanding adolescent competence rests
largely on this key task of solidifying reliable and valid measures that can be used in the
substantial research that is sure to follow this trend in attention to the positive aspects of
adolescent functioning. Accordingly, the purpose of this study was to thoroughly assess the
psychometric properties of several indices of positive adolescent functioning to determine their
adequacy for use in future research.
Not unlike measuring maladaptive behavior, assessing competence or positive
functioning is complex given the intricate nature of adolescent experience. However, unlike the
traditional approach to studying adolescent problem behaviors that has organized inquiry by type
or severity of specific problems (e.g., internalized and externalized problem syndromes and their
many sub-categories, e.g., Achenbach & Edelbrock, 1987), assessing positive adolescent
functioning might better be organized according to the developmental tasks that face children in
the second decade of life.
Developmental theory suggests that adolescence is characterized by at least two
fundamental domains of adolescent functioning, competent functioning at both of which is used

For Indicators of Positive Development Conference March 12-13, 2003
4as a marker of successful development and preparation for advancement to the challenges yet to
come in the adult years.
First, central to many theoretical approaches to adolescence is the consolidation of self
and its increasing awareness of others, two interrelated components of identity formation.
Indeed, according to Erikson (1968), a basic task of adolescence is the establishment of an
autonomous self-concept that is composed of a recognition of self in the past, present, and future.
Further, with increased cognitive and emotional capacities coincident with adolescence, youth
develop the capacity to recognize others, understand their differences and assume their
perspectives when engaged in social interaction. These skills or attributes are critical to
successful navigation of the many impending interactions adolescent engage in the educational,
occupational, romantic and family realms of life.
Thus, one lens for viewing positive adolescent functioning is to assess adolescent feelings
or satisfaction with self and the degree to which adolescents have the capacity to focus outside of
self on to others. For the purposes of the present analyses, this domain is labeled Intrapersonal
Functioning, and is assessed specifically by measures of self-esteem, perspective taking, and
empathy.
Second, theory on adolescents also gives key importance to social competence. Thus,
beyond development on the self-other dynamic described above, adolescents are faced with
increasing opportunity and requirement to interact with peers and adults in various contexts. This
opportunity comes first because of longer hours spent away from the home – either at school or
in the labor force – and it is augmented by required or desired interaction with peers, dating
For Indicators of Positive Development Conference March 12-13, 2003
5partners, teachers, and other adults in the community (e.g, coaches, religious leaders,
employers, community leaders, etc.). Particularly, contrary to earlier theoretical interpretations
that dismissed the continued value of the parent-adolescent relationship, research has
documented well the enduring need and desire of youth to maintain and enhance relationships
with parents or other significant adult care-givers (e.g., Baumrind, 1991; Steinberg, 1990).
For the purposes of this study, this domain will be referred to as Interpersonal
Functioning, and will be assessed specifically with indexes of social initiative, peer connection,
communication with mother, and communication with father.
While theory is clear on the importance to adolescents of the development and exercise of
intra- and interpersonal competencies, empirical documentation of these competencies, how they
develop, and how they enhance later functioning lags far behind. The first step in generating
answers to these questions is the establishment of reliable assessment tools that can be used in
research designs. This paper contributes to this need by thoroughly testing the reliability of 7
measures of positive adolescent functioning. This foundational information will be used in
subsequent analyses that document the conceptual organization of these dimensions, patterns of
change over time, and the predictive validity of these measures.
Method
The analytical design of this investigation is informed by two general purposes. First,
analyses of measures are conducted as thoroughly as possible to maximize confidence in their
reliability. Specifically, using an NIMH-funded longitudinal data set, this was accomplished by
assessing these adolescent-reported measures over 5 consecutive annual assessments. Further,

For Indicators of Positive Development Conference March 12-13, 2003
6analyses were conducted for each wave of data separately on all relevant demographic
subgroups of the sample. Thus, for all 5 years of data, all analyses were conducted first on the
entire sample, then, separately, on the eight major subgroups of the sample: males and females,
younger and older adolescents, not poor and poor, and non-Mormon and Mormon. In other
words, beyond the average coefficient calculated for the entire sample in each year, each
psychometric statistic (kurtosis, skew, alpha) was calculated forty separate times (8 groups x 5
years, when the scale was available for all years). The intent here was to assure that conclusions
about the reliability of these scales were credible, in that they held over time as adolescents
develop and that they applied to youth of varying demographic statuses over time.
The second general purpose was to determine if reduced versions of these scales also
meet reliability requirements. This was important because self-reported measures like these are
frequently used in large, national surveys that have restrictions on space. To this end, both 5-item
and 3-item versions of every scale were assessed as described above.
Analysis Plan
All scales were assessed for mean, standard deviation, kurtosis, skew, and Cronbach’s
alpha. Kurtosis is a measure of the relative peakedness or flatness of the distribution; skew refers
to the extent to which the desirable normal distribution has been shifted to the left or the right,
resulting in a longer tail of the distribution in the direction of the skew. Both kurtosis and skew
are centered around 0, and the closer to 0 the coefficient are the better. Cutoffs for acceptability
are arbitrary. The standard set for the analyses of this study was plus or minus 2.0, a level that
would be considered to be fairly stringent. Alpha is a common measure of inter-item consistency,
For Indicators of Positive Development Conference March 12-13, 2003
7with coefficient values approaching the maximum of 1.0 indicating higher reliability. The
standard for acceptability used in this study was .70, a minimum level often invoked in studies of
this type.
In order to assure that estimates of these parameters were not unduly influenced by item
non-response, scale scores for all measures were calculated with the requirement that either 80%
(for the 5-item scales) or 67% (for the 3-item scales) of the items in every scale had a response.
This was accomplished in SPSS as follows: compute scale=mean.4(var1 to var5); compute
scale=mean.2(var1 to var3).
Sample
Data came from the NIMH-funded Ogden Youth and Family Project (OYFP), a
longitudinal study of families with adolescents in Ogden, Utah. Consistent with the aims of the
funding agency, this project included detail on adolescent mental and social problems. These
data have been widely published (e.g., Barber, 1996, 2002; Barber & Erikson, 2002). The OYFP
was designed also to assess the positive dimensions of adolescent experience. The present study
is the initial step in the analyses of these data.
The baseline sample was a random sample of fifth- and eighth-grade classrooms in the
Ogden City School District in 1994, with an oversampling of Hispanic families to match the
proportion of this, the largest ethnic minority group in the city. The overall sample consisted of
933 families with adolescent children. The sample was split approximately equally between male
and female students and grade, and was 71% White (16% Hispanic), 84% middle income, and
46% Mormon. In the first year, an extensive self-report survey of family interaction, personality,
For Indicators of Positive Development Conference March 12-13, 2003
8youth behavior, and peer, school, and neighborhood experiences was administered to the
students in classrooms. Subsequent waves of the survey were done by multiple mailings to the
student’s homes.
Both 5th and 8th grade cohorts were followed for 4 subsequent years until 1997. The
younger cohort was surveyed an additional time in 1998. The participation rate in the first year
(in-class assessment) was over 90%. No follow-up was done of absentees. Multiple mailings
following standard mail survey methodology (Dillman, 1978) were employed to maximize
response rates in the subsequent years of data collection. Response rates were 84% (780) in
1995, 78% (725) in 1996, 80% (749) in 1997, and 71% in 1998 (352; younger cohort only).
Tests revealed that respondents differed from non-respondents only in a higher percentage of
Mormons represented among the respondents.
Data from the younger cohort will be used in the analyses of the present study because
the five data points for that cohort span the transitions to both middle and high school, as well as
the years during which the bulk of pubertal development is achieved. Thus, in addition to the
across-time and across-group parameters of the analysis, it was also be possible to assess if the
reliability of these scales endures through the two major normative changes associated with
adolescent development: pubertal and school transitions.
Measures
In order to reduce the scales to 5- and 3-item versions, exploratory factor analysis with
oblimin rotation was used in conjunction with consideration of item face validity. In the listings
For Indicators of Positive Development Conference March 12-13, 2003
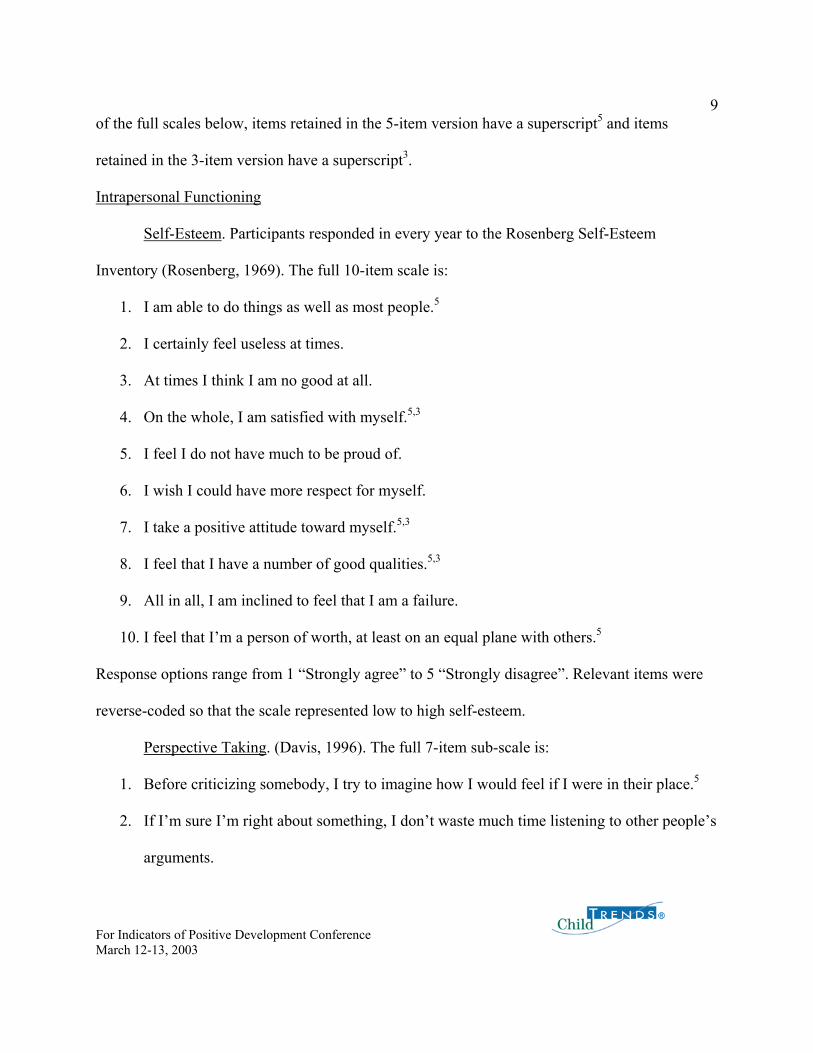
9of the full scales below, items retained in the 5-item version have a superscript5 and items
retained in the 3-item version have a superscript3.
Intrapersonal Functioning
Self-Esteem. Participants responded in every year to the Rosenberg Self-Esteem
Inventory (Rosenberg, 1969). The full 10-item scale is:
1. I am able to do things as well as most people.5
2. I certainly feel useless at times.
3. At times I think I am no good at all.
4. On the whole, I am satisfied with myself.5,3
5. I feel I do not have much to be proud of.
6. I wish I could have more respect for myself.
7. I take a positive attitude toward myself.5,3
8. I feel that I have a number of good qualities.5,3
9. All in all, I am inclined to feel that I am a failure.
10. I feel that I’m a person of worth, at least on an equal plane with others.5
Response options range from 1 “Strongly agree” to 5 “Strongly disagree”. Relevant items were
reverse-coded so that the scale represented low to high self-esteem.
Perspective Taking. (Davis, 1996). The full 7-item sub-scale is:
1. Before criticizing somebody, I try to imagine how I would feel if I were in their place.5
2. If I’m sure I’m right about something, I don’t waste much time listening to other people’s
arguments.
For Indicators of Positive Development Conference March 12-13, 2003
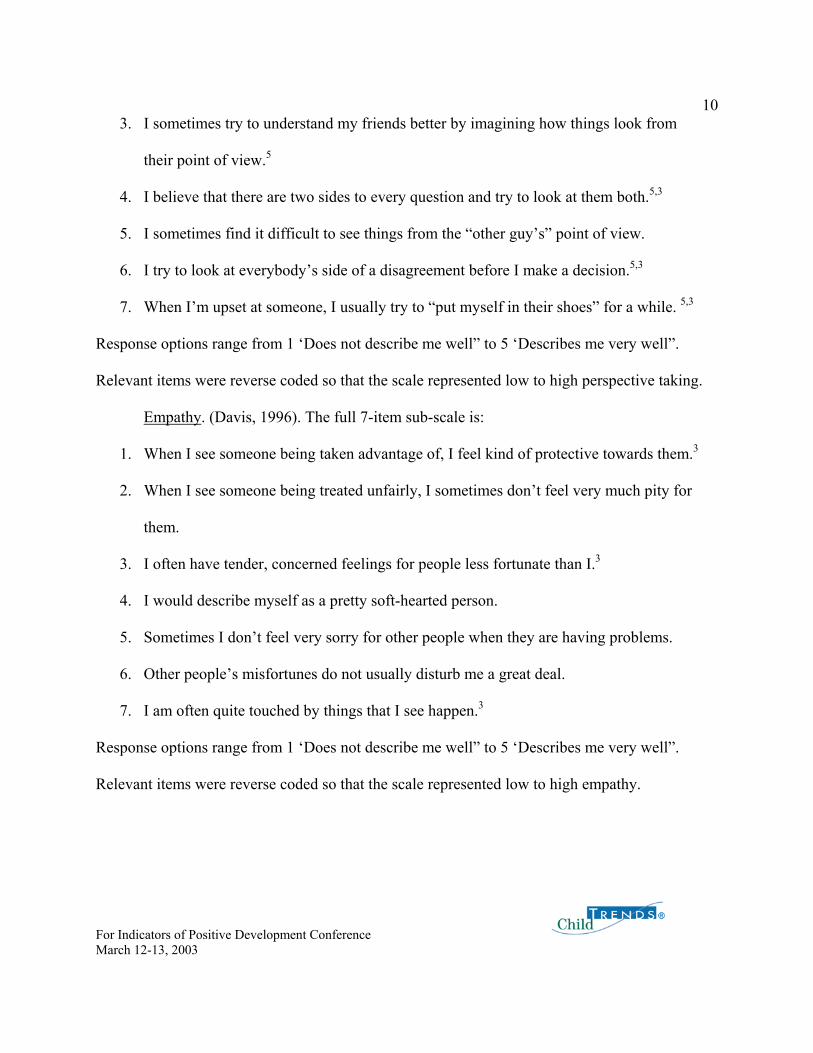
103. I sometimes try to understand my friends better by imagining how things look from
their point of view.5
4. I believe that there are two sides to every question and try to look at them both.5,3
5. I sometimes find it difficult to see things from the “other guy’s” point of view.
6. I try to look at everybody’s side of a disagreement before I make a decision.5,3
7. When I’m upset at someone, I usually try to “put myself in their shoes” for a while. 5,3
Response options range from 1 ‘Does not describe me well” to 5 ‘Describes me very well”.
Relevant items were reverse coded so that the scale represented low to high perspective taking.
Empathy. (Davis, 1996). The full 7-item sub-scale is:
1. When I see someone being taken advantage of, I feel kind of protective towards them.3
2. When I see someone being treated unfairly, I sometimes don’t feel very much pity for
them.
3. I often have tender, concerned feelings for people less fortunate than I.3
4. I would describe myself as a pretty soft-hearted person.
5. Sometimes I don’t feel very sorry for other people when they are having problems.
6. Other people’s misfortunes do not usually disturb me a great deal.
7. I am often quite touched by things that I see happen.3
Response options range from 1 ‘Does not describe me well” to 5 ‘Describes me very well”.
Relevant items were reverse coded so that the scale represented low to high empathy.
For Indicators of Positive Development Conference March 12-13, 2003
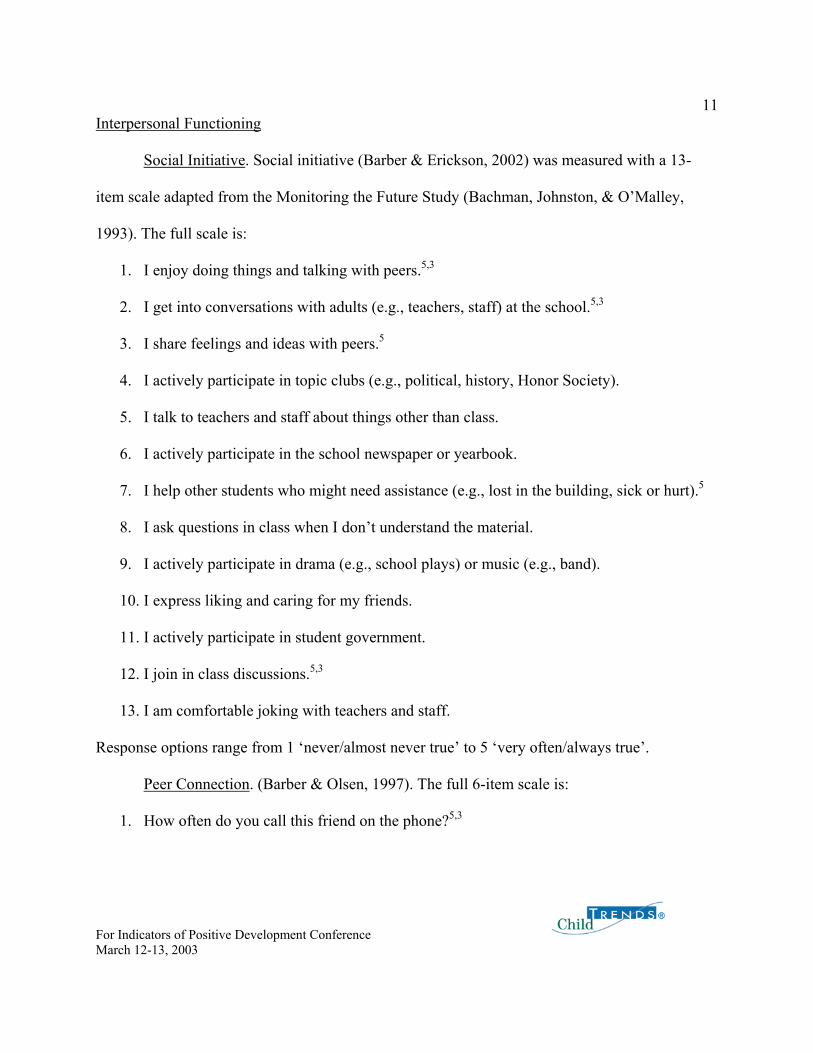
11Interpersonal Functioning
Social Initiative. Social initiative (Barber & Erickson, 2002) was measured with a 13-
item scale adapted from the Monitoring the Future Study (Bachman, Johnston, & O’Malley,
1993). The full scale is:
1. I enjoy doing things and talking with peers.5,3
2. I get into conversations with adults (e.g., teachers, staff) at the school.5,3
3. I share feelings and ideas with peers.5
4. I actively participate in topic clubs (e.g., political, history, Honor Society).
5. I talk to teachers and staff about things other than class.
6. I actively participate in the school newspaper or yearbook.
7. I help other students who might need assistance (e.g., lost in the building, sick or hurt).5
8. I ask questions in class when I don’t understand the material.
9. I actively participate in drama (e.g., school plays) or music (e.g., band).
10. I express liking and caring for my friends.
11. I actively participate in student government.
12. I join in class discussions.5,3
13. I am comfortable joking with teachers and staff.
Response options range from 1 ‘never/almost never true’ to 5 ‘very often/always true’.
Peer Connection. (Barber & Olsen, 1997). The full 6-item scale is:
1. How often do you call this friend on the phone?5,3
For Indicators of Positive Development Conference March 12-13, 2003
122. If you needed help with something, how often could you count on this friend to help
you?5
3. How often do you and this friend go over to each other’s houses?5,3
4. How often do you tell this friend things about yourself that you wouldn’t tell most kids?5
5. How often do you and this friend go places together, like a movie, skating, shopping, or a
sports event?5,3
6. When you do a good job on something, how often does this friend praise or congratulate
you?
Response options range from 0 ‘Never” to 4 ‘Every day’.
Communication with Mother. (Barnes & Olsen, 1982). The full 6-item scale is:
1. I can discuss my beliefs with my mother without feeling restrained or embarrassed.5
2. I am very satisfied with how my mother and I talk together.5,3
3. If I were in trouble, I could tell my mother.5,3
4. I am careful about what I say to my mother.
5. When I ask questions, I get honest answers from my mother.5
6. I find it easy to discuss problem with my mother.5,3
Response options range from 1 ‘Strongly agree’ to 5 ‘Strongly disagree. Relevant items were
reverse coded so that the scale assessed low to high quality communication.
Communication with Father. (Barnes & Olsen, 1982). The full 6-item scale is:
1. I can discuss my beliefs with my father without feeling restrained or embarrassed.5
2. I am very satisfied with how my father and I talk together.5,3
For Indicators of Positive Development Conference March 12-13, 2003
133. If I were in trouble, I could tell my father.5,3
4. I am careful about what I say to my father.
5. When I ask questions, I get honest answers from my father.5
6. I find it easy to discuss problem with my father.5,3
Response options range from 1 ‘Strongly agree’ to 5 ‘Strongly disagree”. Relevant items were
reverse coded so that the scale assessed low to high quality communication.
Results
Tables 1-7 record findings for mean, standard deviation, kurtosis, skew and alpha for the
5- and 3-item versions of the positive adolescent functioning scales, computed, in each case, for
the entire sample and then separately by sex, SES, ethnicity, and religious affiliation subgroups.
Therefore, there were 45 separate computations (5 yearly averages; plus 8 groups x 5 years) for
every statistic for the 5-item scales and 45 for the 3-item scales (when data were available for all
five years). Results are summarized below.
In evaluating the 45 separate coefficients for each type of statistic for each of the 5- and
3-item scales, the following standard was used to judge the psychometric adequacy of the scales:
1. The alpha value for the full sample averaged over the years of assessment must
reach or exceed .70
2. A minimum of 75% of the tests of alpha across sample sub-group and year must
reach or exceed .70
3. The kurtosis value and the skewness value for the full sample averaged over the
years of assessment must not exceed +/- 2.00.

For Indicators of Positive Development Conference March 12-13, 2003
144. A minimum of 75% of the tests of kurtosis and skewness across sample sub-
group and year must not exceed +/- 2.00.
________________________
insert Tables 1-7 about here
_________________________
Intrapersonal Functioning
Self-Esteem (Table 1) 5-item scale. The average alpha across all years and sub-groups was .83, with 100% of
the tests equal to or exceeding .70. The average kurtosis value was .66, with 98 % (39/40 tests)
of the tests equal to or less than 2.00. The average skew was .77, with 100 % of the tests equal to
or less than 2.00. Thus, the scale met the standards of psychometric adequacy.
3-item scale. The average alpha across all years and sub-groups was .80, with 90 %
(36/40 tests) of the tests equal to or exceeding .70. The average kurtosis value was .39, with 98
% (39/40 tests) of the tests equal to or less than 2.00. The average skew was .78, with 100 % of
the tests equal to or less than 2.00. Thus, the scale met the standards of psychometric adequacy.
Perspective Taking (Table 2)
Five-item scale. The average alpha across all years and sub-groups was .85, with 100 %
of the tests equal to or exceeding .70. The average kurtosis value was .36, with 100 % of the
tests equal to or less than 2.00. The average skew was .10 with 100 % of the tests equal to or less
than 2.00. Thus, the scale met the standards of psychometric adequacy.
For Indicators of Positive Development Conference March 12-13, 2003
15Three-item scale The average alpha across all years and sub-groups was .78, with 88 %
(28/32 tests; scale was not available in 1995) of the tests equal to or exceeding .70. The average
kurtosis value was .36, with 100 % of the tests equal to or less than 2.00. The average skew was
.78 with 100 % of the tests equal to or less than 2.00. Thus, the scale met the standards of
psychometric adequacy.
Empathy (Table 3)
Three-item scale. The average alpha across all years and sub-groups was .72, with 63 %
(20/32 tests; scale was not available in 1995) of the tests equal to or exceeding .70. The average
kurtosis value was .37, with 100 % of the tests equal to or less than 2.00. The average skew was
.78 with 100 % of the tests equal to or less than 2.00. The scale did not meet the standards of
psychometric adequacy because of the low percentage of acceptable alpha levels.
Interpersonal Functioning
Social Initiative (Table 4)
Five-item scale. The average alpha across all years and sub-groups was .81, with 100 %
of the tests equal to or exceeding .70. The average kurtosis value was .17, with 100 % of the
tests equal to or less than 2.00. The average skew was .42 with 100 % of the tests equal to or less
than 2.00. Thus, the scale met the standards of psychometric adequacy.
Three-item scale. The average alpha across all years and sub-groups was .72, with 75 %
(24/32 tests; scale was not available in 1994) of the tests equal to or exceeding .70. The average
kurtosis value was .35, with 100 % of the tests equal to or less than 2.00. The average skew was
For Indicators of Positive Development Conference March 12-13, 2003
16.48 with 100 % of the tests equal to or less than 2.00. Thus, the scale met the standards of
psychometric adequacy.
Peer Connection (Table 5)
Five-item scale. The average alpha across all years and sub-groups was .77, with 100 %
of the tests equal to or exceeding .70. The average kurtosis value was .30, with 100 % of the
tests equal to or less than 2.00. The average skew was .67with 100 % of the tests equal to or less
than 2.00. Thus, the scale met the standards of psychometric adequacy.
Three-item scale. The average alpha across all years and sub-groups was .75, with 88 %
(21/24 tests; scale was not available in 1994 or 1995) of the tests equal to or exceeding .70. The
average kurtosis value was .07, with 100 % of the tests equal to or less than 2.00. The average
skew was .65 with 100 % of the tests equal to or less than 2.00. Thus, the scale met the standards
of psychometric adequacy.
Communication with Mother (Table 6)
Five-item scale. The average alpha across all years and sub-groups was .90, with 100 %
of the tests equal to or exceeding .70. The average kurtosis value was 1.71, with 58% (14/24
tests; scale was not available in 1997 and 1998) of the tests equal to or less than 2.00. The
average skew was 1.12 with 100 % of the tests equal to or less than 2.00. The scale did not meet
the standards of psychometric adequacy because of the low percentage of acceptable, average
kurtosis values.
Three-item scale. The average alpha across all years and sub-groups was .86, with 96 %
(23/24 tests; scale was not available in 1997 and 1998) of the tests equal to or exceeding .70.

For Indicators of Positive Development Conference March 12-13, 2003
17The average kurtosis value was 1.47, with 79 % (19/24 tests; scale was not available in 1997
and 1998) of the tests equal to or less than 2.00. The average skew was 1.25 with 100 % of the
tests equal to or less than 2.00. Thus, the scale met the standards of psychometric adequacy.
Communication with Father (Table 7)
Five-item scale. The average alpha across all years and sub-groups was .70, with 100 %
of the tests equal to or exceeding .70. The average kurtosis value was 1.71, with 100 % of the
tests equal to or less than 2.00. The average skew was 1.12 with 100 % of the tests equal to or
less than 2.00. Thus, the scale met the standards of psychometric adequacy.
Three-item scale. The average alpha across all years and sub-groups was .70, with 100 %
of the tests equal to or exceeding .70. The average kurtosis value was .66, with 100 % of the
tests equal to or less than 2.00. The average skew was .83, with 100 % of the tests equal to or
less than 2.00. Thus, the scale met the standards of psychometric adequacy.
In sum, with only two exceptions (the 3-item empathy scale and the 5-item
communication with mother scale), both the 5- and 3-item versions of all seven measures of
positive adolescent functioning were found to have acceptable psychometric properties. Given
that the standard for acceptability used in this study can be considered demanding, these results
indicate strong support for the reliability of these positive adolescent functioning scales, whether
formed as 5- or 3-item versions.
In inspecting the relatively few cases where the psychometric properties fell below the
standard, the following trends can be identified: 1) problems with kurtosis only occurred for the
5-item communication with mother scale; 2) for poor youth, alphas dipped below the minimum

For Indicators of Positive Development Conference March 12-13, 2003
18standard of .70 (but never below .60) in at least one of the 5 years for all of the scales except
self-esteem and communication with father; and, 3) for non-white youth, alphas dipped below
the minimum standard of .70 (but never below .62) in at least one of the 5 years for all of the
scales except peer connection, communication with mother and communication with father.
Thus, there is some evidence that poor and non-white youth (not mutually exclusive groups)
perceived less consistency among the items making up several of the scales studied here than did
the other sample sub-groupings. However, this may in part be an artifact, since the samples sizes
for both of these groups were relatively much smaller than for the other groups, which may have
impacted the strength of the reliability estimates.
Discussion
This study undertook a thorough analysis of the reliability of seven existing self-report
measures of positive adolescent functioning. This was done in an effort to contribute to the
growing research movement that is attending to competence in adolescence. It did so by
providing evidence of the psychometric adequacy of theoretically-relevant variables that might
be used in future studies.
The main strength of the study was its methodology. First, measures were analyzed that
tap two major aspects of adolescent development: the self/other dynamic, whereby adolescents
simultaneously recognize self and other; and interpersonal competence, whereby adolescents
establish healthy social relationships with key others in their lives. Second, these measures were
tested in five consecutive years of self-reports from the same sample of adolescents. Beyond the
basic value of this longevity of assessment, the particular span of years included the two major
For Indicators of Positive Development Conference March 12-13, 2003
19normative transitions of adolescence, puberty and school transitions, allowing for the detection
of any change in scale adequacy during these physical and social changes.
Third, analyses were conducted separately on all major demographic subgroups of the
sample to ensure that any conclusions relative to psychometric adequacy of the scales applied
generally, at least to the sex, age, social class, ethnic, and religious affiliation groupings of the
sample employed in this study. Fourth, alternate versions of all of the seven scales were tested.
Specifically, both 5- and 3-item versions of every scale were tested, recognizing that many
research programs have limited space, and, thus, seek the fewest items necessary to adequately
tap constructs.
The findings of the study are quite straightforward. Of the thirteen scales that were tested
(two versions each of 6 scales; one version of the empathy scale), 11 had strong psychometric
properties. In other words, in every year of assessment (across pubertal development and
transitions to middle and high school) and for every subgroup of the sample (males, females,
older youth, younger youth, White, non-White, poor, not poor, Mormon, non-Mormon), these 11
measures of positive adolescent functioning (self-esteem, perspective taking, social initiative,
peer connection, communication with father) were internally consistent (Cronbach’s alpha) and
otherwise had acceptable distributional properties (skew and kurtosis). The exceptions were that
for several subgroups of the sample, the empathy scale (only a 3-item version was available) had
alphas below .70, and, again for several subgroups of the sample, the communication with
mother scale had high kurtosis coefficients.
For Indicators of Positive Development Conference March 12-13, 2003
20 Naturally, it will be important to test the same scales in different samples. Although
random, the sample employed in this study was regional (Rocky Mountain) and, therefore,
findings cannot be generalized to adolescents in other regions of the U.S. or in other cultures.
The consistency found across subgroups in this sample, however, suggests confidence that the
scales would hold up well in diverse samples. For some of the constructs, such as
communication quality with parents or social initiative, for example, it will also be useful to
employ alternate methods of assessments, such as observer, teacher, and/or parent report.
However, several of the scales index internal processes (e.g., self-esteem, perspective taking,
empathy) that are best measured from the perspective of adolescents.
Establishing the reliability of these measures is just the first step in assessing positive
adolescent functioning. A variety of tests of validity will also be required. Specifically, tests of
construct validity should be made to assure that these separate measures are related highly
enough with each other to support their common identification as measures of competence. Such
tests will also be valuable in assessing the higher order organization of these constructs.
Specifically, it will be important to see if the intrapersonal/interpersonal grouping made
heuristically in this study is warranted.
Tests of predictive validity will also be necessary, once again to provide evidence that
these scales do indeed tap competent functioning. If so, one would expect them to be consistently
related to other measures of positive experience, such as school performance, avoidance of
antisocial behavior, and positive future orientation. Similarly, it would be expected that these
measures of positive adolescent functioning would be predicted by factors known to promote

For Indicators of Positive Development Conference March 12-13, 2003
21healthy development, such as quality parenting, effective teaching, and facilitative community
contexts.
Following these validity tests, much important information is needed on positive
adolescent functioning, such as how it develops, to what extent is it constitutional versus shaped
by social experiences, how can it be maximized, to what extent does competence in adolescence
portend success or well-being in adulthood, etc. Questions such as these can best be answered
using sound and reliable instruments to assess positive adolescent functioning. The findings of
this study provide an initial, and promising, portion of that foundation.

For Indicators of Positive Development Conference March 12-13, 2003
22
References
Achenbach, T. M., & Edelbrock, C. (1987). Manual for the child behavior checklist and
revised child behavior profile. Burlington, VT: University of Vermont, Department of
Psychiatry.
Arnett, J.J. (1999). Adolescent storm and stress, reconsidered. American Psychologist,
54, 317-326.
Bachman, G. G., Johnston, L. D., & O’Malley, P. M.. (1993). Monitoring the Future: A
Continuing Study of the Lifestyles and Values of Youth 1992. Ann Arbor, MI: Inter-university
Consortium for Political and Social Research.
Barber, B. K. (Ed.) (2002). Intrusive Parenting: How Psychological Control Affects
Children and Adolescents. Washington, DC.: American Psychological Association Press.
Barber, B. K. (1996). Parental psychological control: Revisiting a neglected construct.
Child Development, 67, 3296-3319.
Barber, B. K., & Erickson, L. D. (2001). Adolescent social initiative: Antecedents in the
ecology of social connections. Journal of Adolescent Research, 16, 326-354.
Barber, B. K. and Olsen, J. (1997). Socialization in context: Connection, regulation, and
autonomy in the family, school, and neighborhood and with peers. Journal of Adolescent
Research. 12 (2), 287-315.

For Indicators of Positive Development Conference March 12-13, 2003
23Barnes, H. L., & Olson, D. H. (1982). Parent adolescent communication scale. D. H.
Olson, H. I., H. I. McCubbin, H. Barnes, A. Larsen, M. Muxen, & M. Wilson (Eds.), Family
inventories (pp. 33-48). St. Paul: Family Social Science, University of Minnesota.
Baumrind, D. (1991). The influence of parenting style on adolescent competence and
substance use. Journal of Early Adolescence, 11, 56-95.
Davis, M. H. (1996). Empathy: A social-psychological approach. Boulder, Co: Westview
Press.
Dillman, D. A. (1978). Mail and telephone surveys: The total design method. NY: John
Wiley & Sons.
Erikson, E. E. (1968). Identity, youth, and crisis. New York: Norton.
Halpern-Felsher, B. L., Millstein, S. G., & Irwin, C. E. Jr. (2002). Work Group II:
Healthy adolescent psychosocial development. Journal of Adolescent Health, 31, 6s, 201-207.
Larson, R. (2000) Toward a psychology of positive youth development. American
Psychologist, 55, 170-183.
Rosenberg, M. (1965). Society and the adolescent self-image. Princeton, N.J.: Princeton
University Press.
Steinberg, L. (1990). Autonomy, conflict, and harmony in the family relationship. In S.
S. Feldman, & G. R. Elliot (Eds.), At the threshold: The developing adolescent (pp. 255-276).
Cambridge, MA: Harvard University Press.
Yates, M., & Youniss, J. (Eds. ) (1999). Roots of civic identity: International perspectives
on community service and activism in youth. New York: Cambridge University Press.

For Indicators of Positive Development Conference March 12-13, 2003
24
Related Documents