A map says to you, 'Read me carefully, follow me closely, doubt me not.' It says, 'I am the Earth in the palm of your hand. Without me, you are alone and lost.’ Beryl Markham (West With the Night, 1946 )

Welcome message from author
This document is posted to help you gain knowledge. Please leave a comment to let me know what you think about it! Share it to your friends and learn new things together.
Transcript
A map says to you, 'Read me carefully, follow me closely, doubt me not.' It says, 'I am the Earth in the palm of your hand. Without
me, you are alone and lost.’
Beryl Markham (West With the Night, 1946 )
• The Nature of Maps
• The Geographic Grid
• The Role of Globes
• Map Essentials
• Map Scale
Students often have trouble with geographic names and terms. If you need/want to know how to pronounce something, try this link.
Audio Pronunciation Guide
The site doesn’t list everything but it does have the words with which you’re most likely to have trouble.
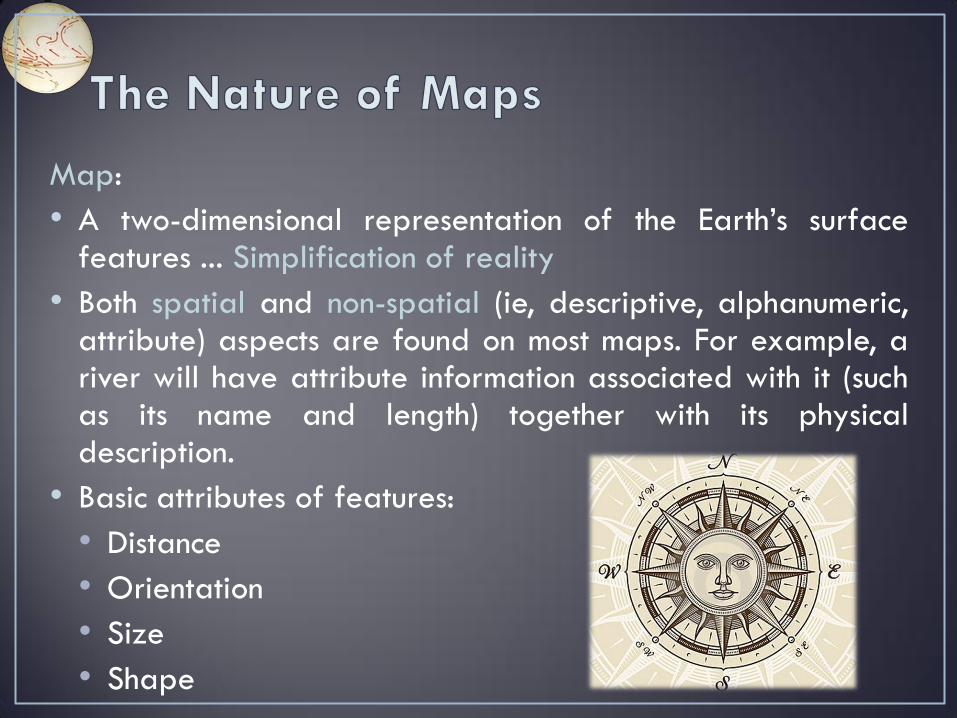
Map:
• A two-dimensional representation of the Earth’s surface features ... Simplification of reality
• Both spatial and non-spatial (ie, descriptive, alphanumeric, attribute) aspects are found on most maps. For example, a river will have attribute information associated with it (such as its name and length) together with its physical description.
• Basic attributes of features:
• Distance
• Orientation
• Size
• Shape
Map:
• A graphic representation of the geographic setting
• A representation, normally to scale and on a flat medium, of a selection of material or abstract features on or in relation to the surface of the earth or other celestial bodies
• Maps are vital tools that have been in use for thousands of years and, with evolving technology, are becoming more useful. They are a way of generalizing the surrounding world and presenting the information in an understandable fashion.
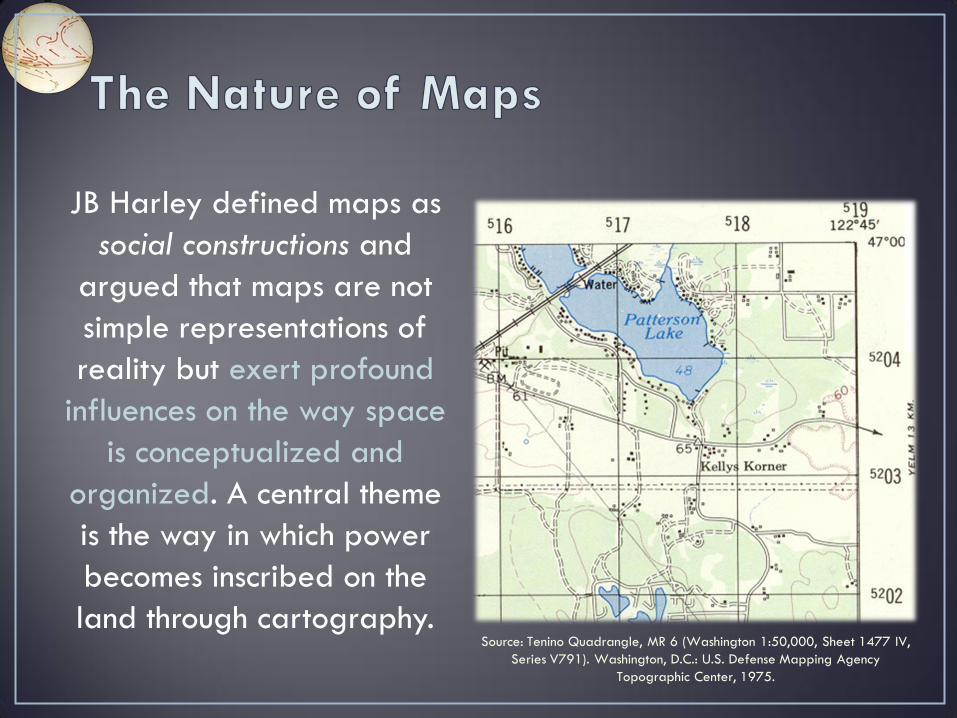
JB Harley defined maps as
social constructions and
argued that maps are not
simple representations of
reality but exert profound
influences on the way space
is conceptualized and
organized. A central theme
is the way in which power
becomes inscribed on the
land through cartography. Source: Tenino Quadrangle, MR 6 (Washington 1:50,000, Sheet 1477 IV,
Series V791). Washington, D.C.: U.S. Defense Mapping Agency
Topographic Center, 1975.
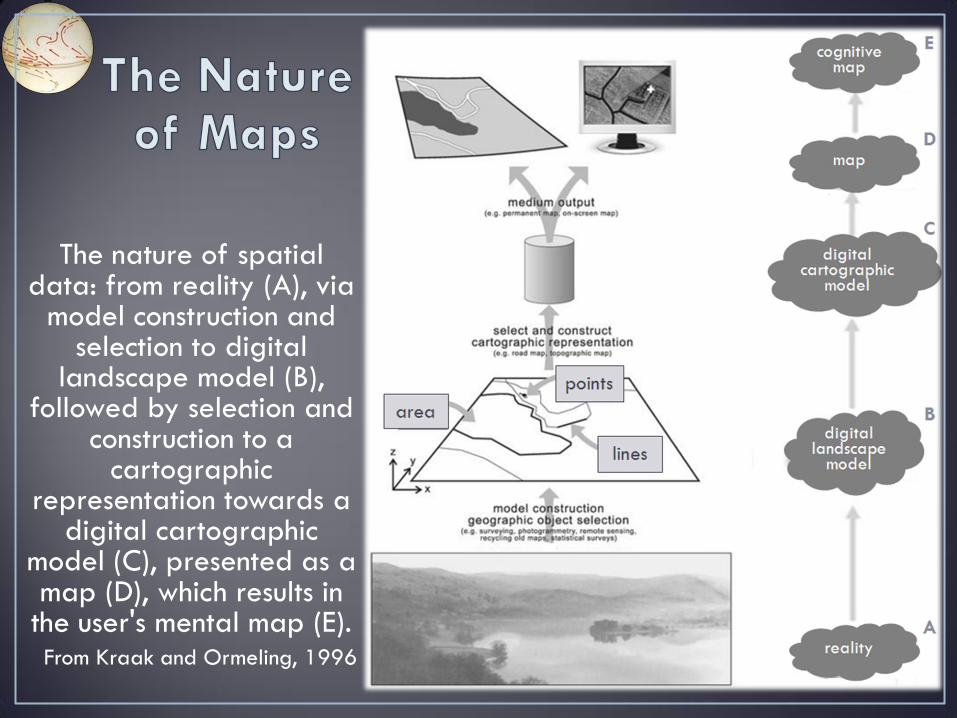
The nature of spatial data: from reality (A), via
model construction and selection to digital
landscape model (B), followed by selection and
construction to a cartographic
representation towards a digital cartographic
model (C), presented as a map (D), which results in
the user's mental map (E). From Kraak and Ormeling, 1996
Maps:
• Reduce the spatial characteristics of a large area and put it in map form to make it observable.
• Carefully designed instruments to record, calculate, display, analyze and understand the interrelation of things
• Communicate spatial information more efficiently than linear communication
• At a fundamental level, bring things into view.
• Store geographical information.
• Serve mobility and navigation needs.
• Serve analytical purposes, eg measuring and computing. Analyze complex collections of data - topography, soil, land use, direction, etc.
• Summarize statistical data to assist forecasting and spotting trends.
• Visualize the invisible.
• Stimulate spatial thinking ... Powerful tools for spatial analysis.
• Aid in understanding the world and one's place in it.
It's never been easy to create a taxonomy for maps, and clearly any single map can fall into multiple categories,
but we used to be able to define a map by:
1. scale - small-scale map, large-scale map
2. function - general reference maps, topographic maps, thematic maps, charts
3. type - chloropleth, dot density
4. medium - real maps, virtual maps, mental maps ... The first three used to adequately provide a way we might categorize types of maps but does it still work for the multitude of new forms of maps, new map-makers and new mapping techniques?
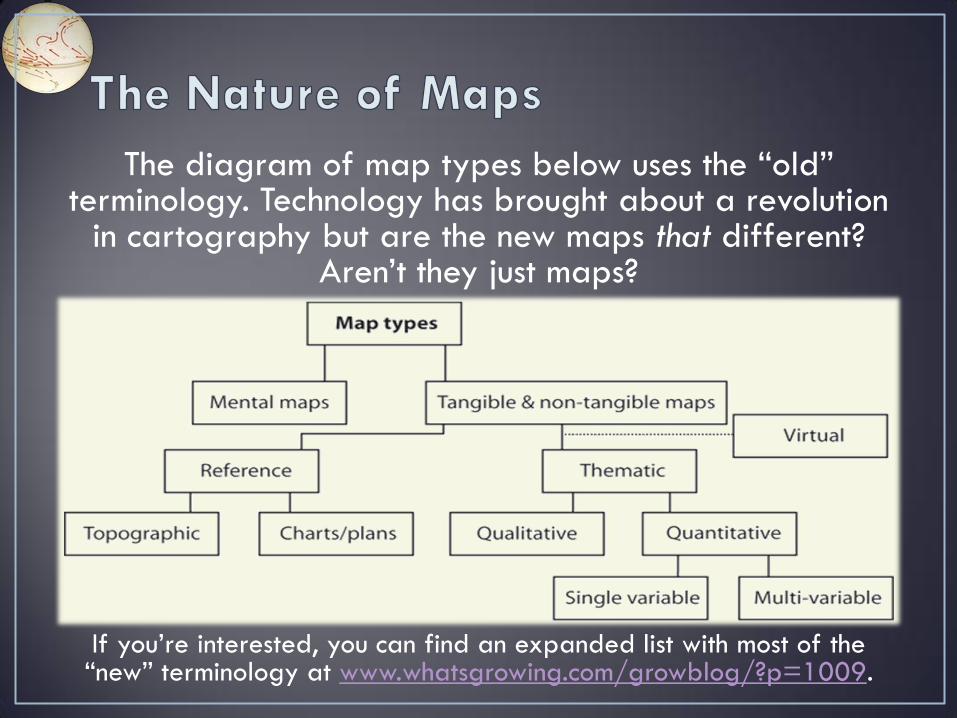
The diagram of map types below uses the “old” terminology. Technology has brought about a revolution
in cartography but are the new maps that different? Aren’t they just maps?
If you’re interested, you can find an expanded list with most of the “new” terminology at www.whatsgrowing.com/growblog/?p=1009.
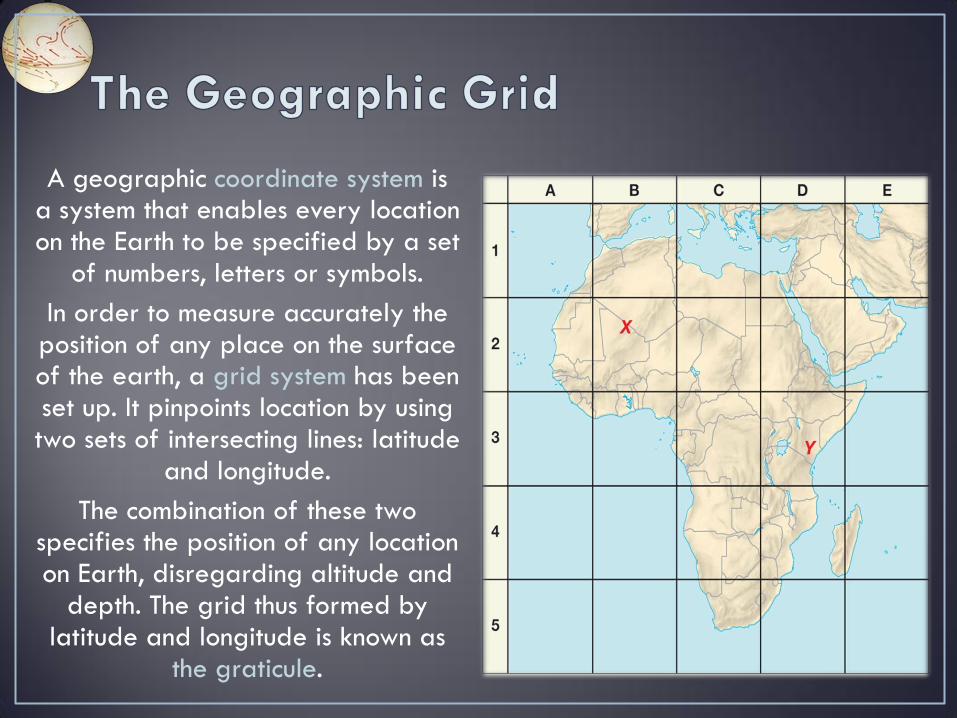
A geographic coordinate system is a system that enables every location on the Earth to be specified by a set
of numbers, letters or symbols.
In order to measure accurately the position of any place on the surface of the earth, a grid system has been set up. It pinpoints location by using two sets of intersecting lines: latitude
and longitude.
The combination of these two specifies the position of any location on Earth, disregarding altitude and
depth. The grid thus formed by latitude and longitude is known as
the graticule.
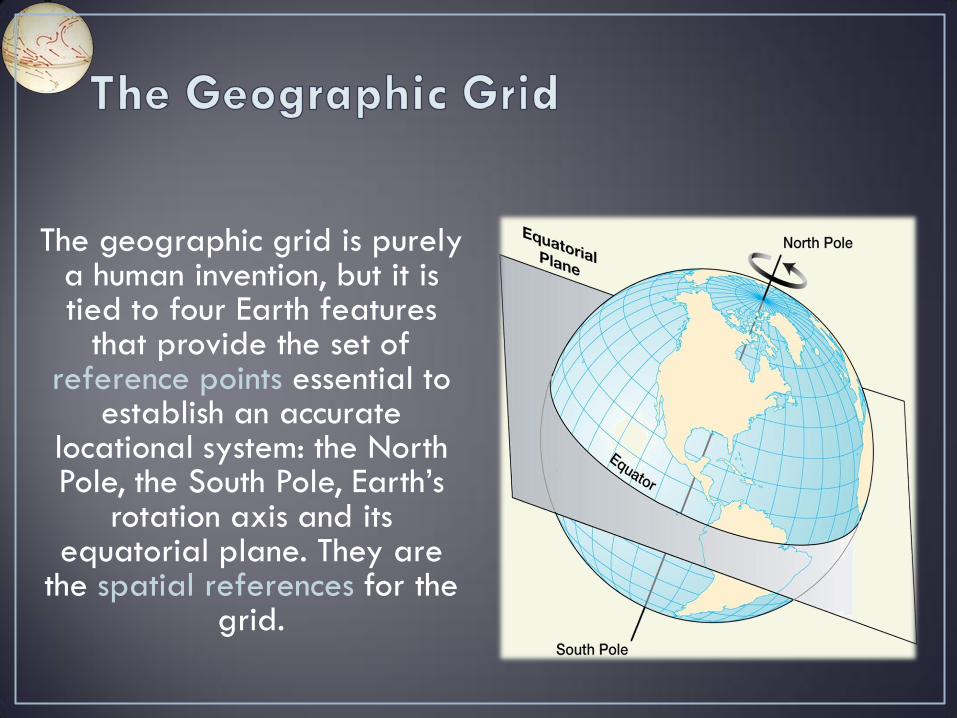
The geographic grid is purely a human invention, but it is tied to four Earth features
that provide the set of reference points essential to
establish an accurate locational system: the North Pole, the South Pole, Earth’s
rotation axis and its equatorial plane. They are
the spatial references for the grid.
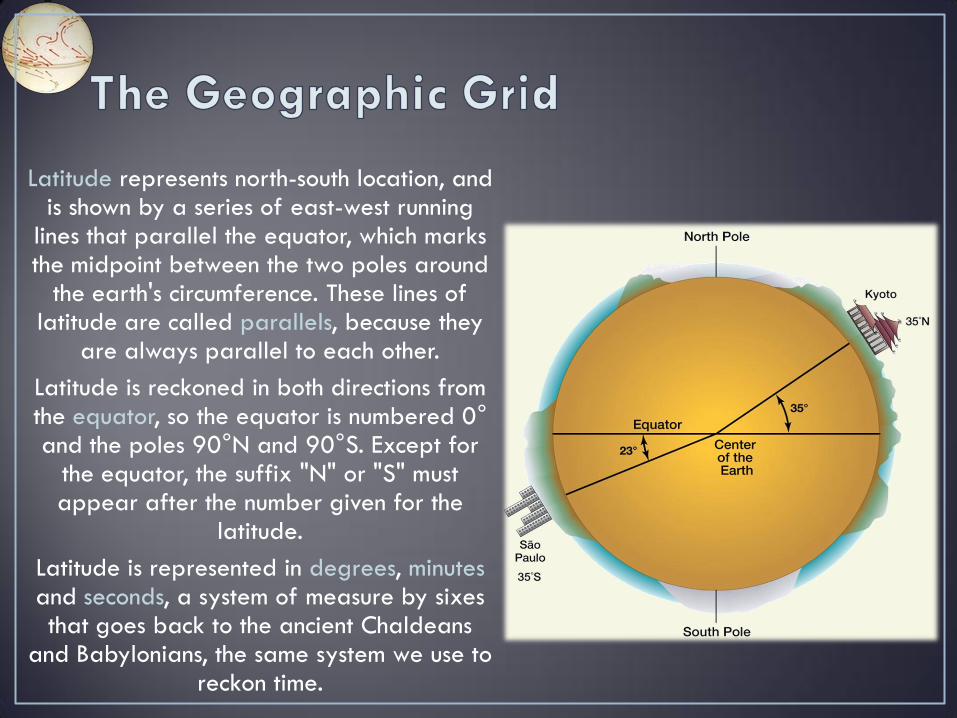
Latitude represents north-south location, and is shown by a series of east-west running
lines that parallel the equator, which marks the midpoint between the two poles around
the earth's circumference. These lines of latitude are called parallels, because they
are always parallel to each other.
Latitude is reckoned in both directions from the equator, so the equator is numbered 0° and the poles 90°N and 90°S. Except for
the equator, the suffix "N" or "S" must appear after the number given for the
latitude.
Latitude is represented in degrees, minutes and seconds, a system of measure by sixes that goes back to the ancient Chaldeans
and Babylonians, the same system we use to reckon time.
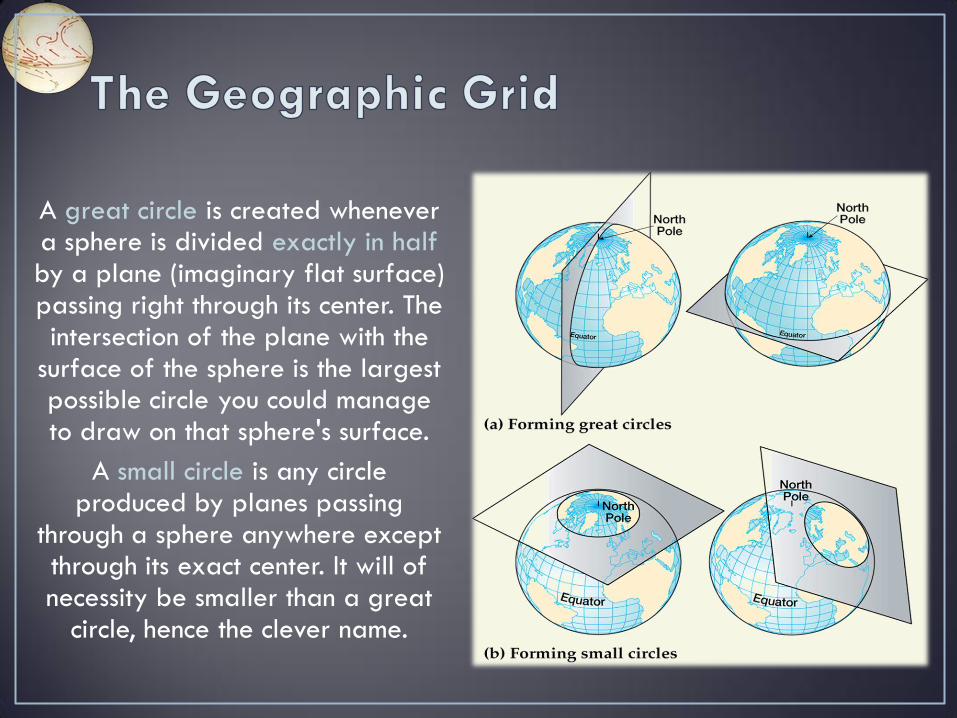
A great circle is created whenever a sphere is divided exactly in half by a plane (imaginary flat surface) passing right through its center. The intersection of the plane with the
surface of the sphere is the largest possible circle you could manage to draw on that sphere's surface.
A small circle is any circle produced by planes passing
through a sphere anywhere except through its exact center. It will of necessity be smaller than a great
circle, hence the clever name.
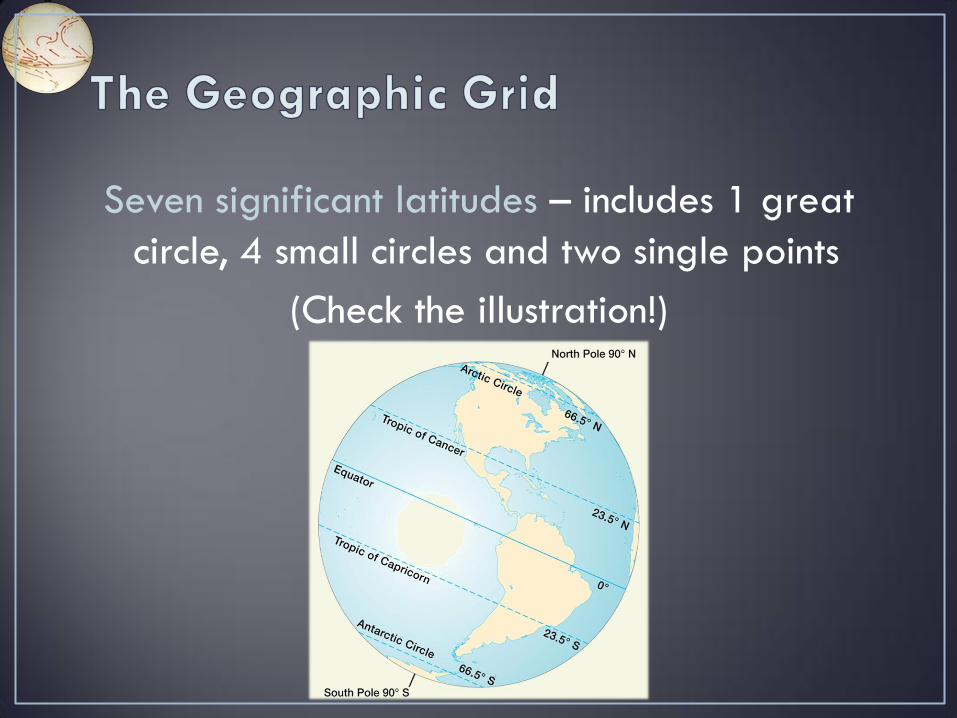
Seven significant latitudes – includes 1 great
circle, 4 small circles and two single points
(Check the illustration!)
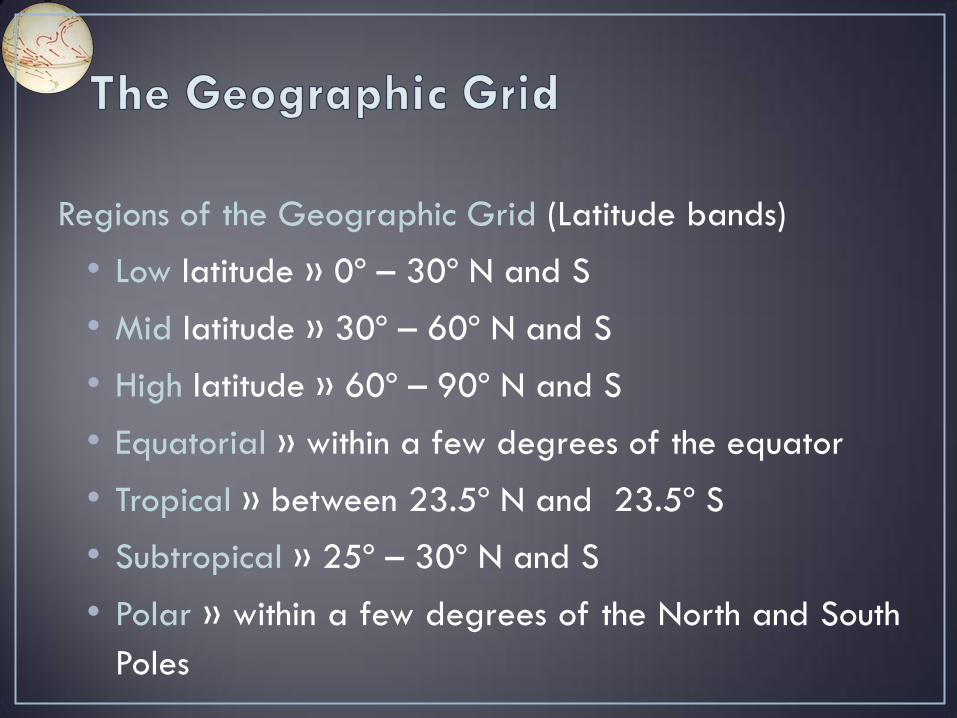
Regions of the Geographic Grid (Latitude bands)
• Low latitude » 0º – 30º N and S
• Mid latitude » 30º – 60º N and S
• High latitude » 60º – 90º N and S
• Equatorial » within a few degrees of the equator
• Tropical » between 23.5º N and 23.5º S
• Subtropical » 25º – 30º N and S
• Polar » within a few degrees of the North and South
Poles
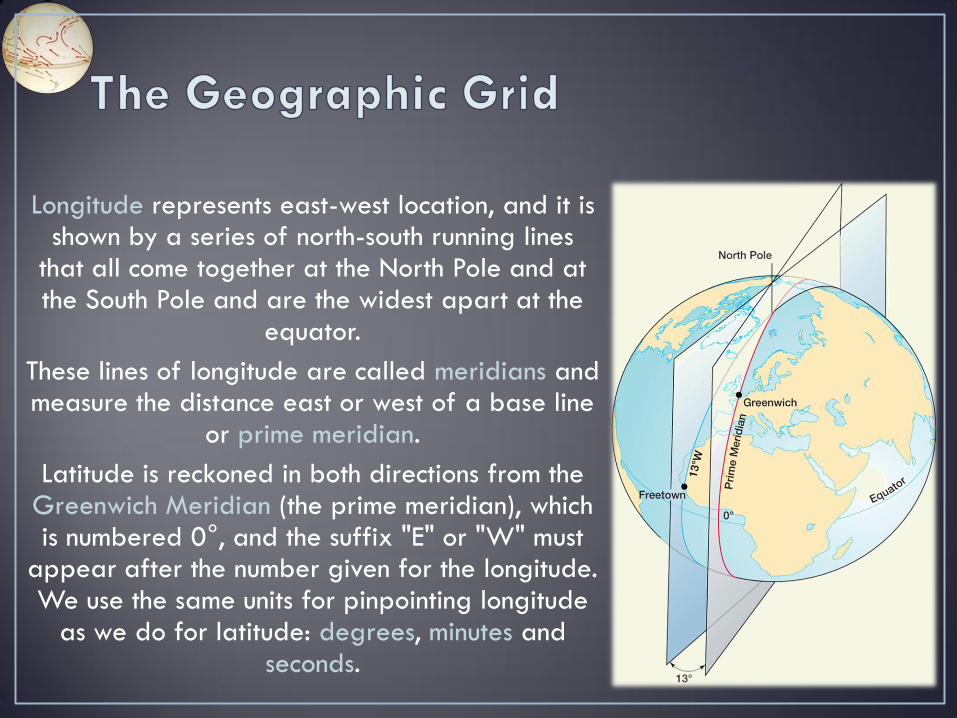
Longitude represents east-west location, and it is shown by a series of north-south running lines
that all come together at the North Pole and at the South Pole and are the widest apart at the
equator.
These lines of longitude are called meridians and measure the distance east or west of a base line
or prime meridian.
Latitude is reckoned in both directions from the Greenwich Meridian (the prime meridian), which is numbered 0°, and the suffix "E" or "W" must
appear after the number given for the longitude. We use the same units for pinpointing longitude
as we do for latitude: degrees, minutes and seconds.
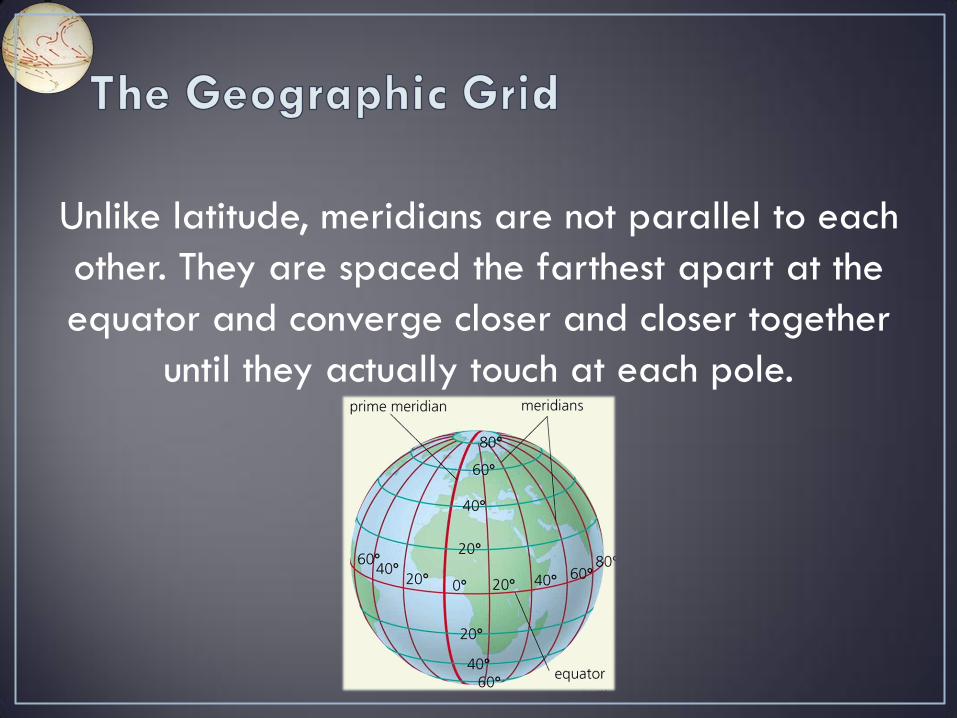
Unlike latitude, meridians are not parallel to each
other. They are spaced the farthest apart at the
equator and converge closer and closer together
until they actually touch at each pole.
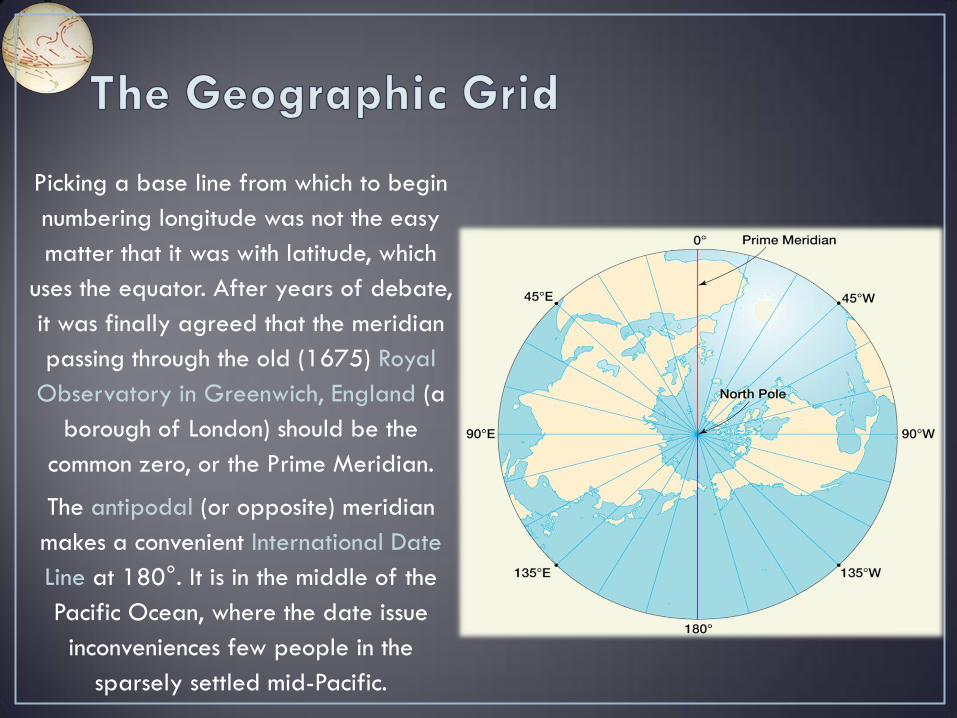
Picking a base line from which to begin
numbering longitude was not the easy
matter that it was with latitude, which
uses the equator. After years of debate,
it was finally agreed that the meridian
passing through the old (1675) Royal
Observatory in Greenwich, England (a
borough of London) should be the
common zero, or the Prime Meridian.
The antipodal (or opposite) meridian
makes a convenient International Date
Line at 180°. It is in the middle of the
Pacific Ocean, where the date issue
inconveniences few people in the
sparsely settled mid-Pacific.
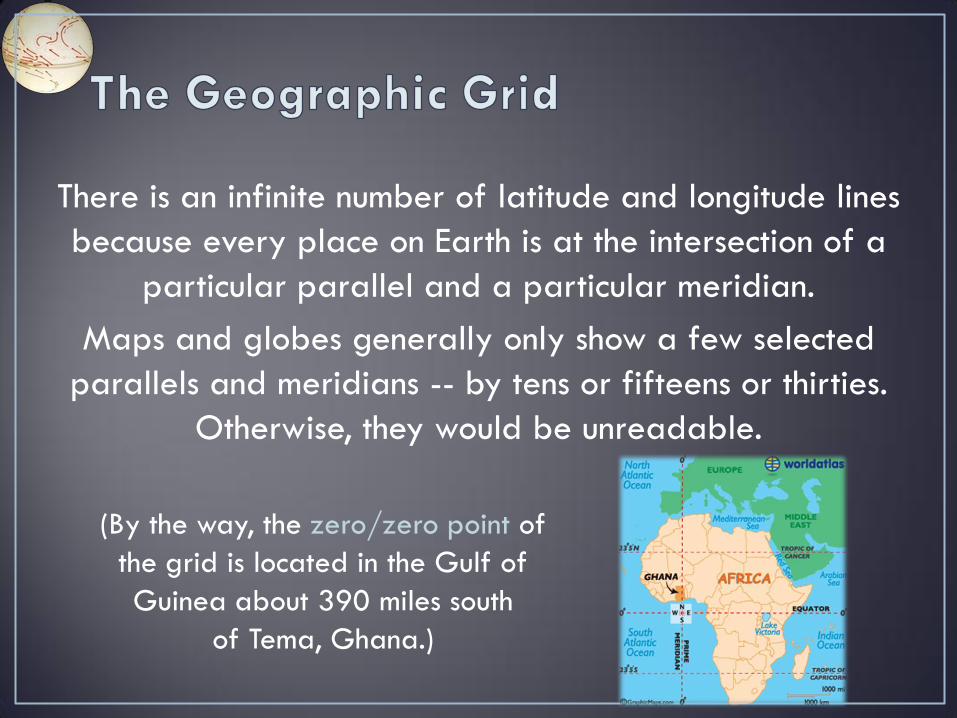
There is an infinite number of latitude and longitude lines
because every place on Earth is at the intersection of a
particular parallel and a particular meridian.
Maps and globes generally only show a few selected
parallels and meridians -- by tens or fifteens or thirties.
Otherwise, they would be unreadable.
(By the way, the zero/zero point of
the grid is located in the Gulf of
Guinea about 390 miles south
of Tema, Ghana.)
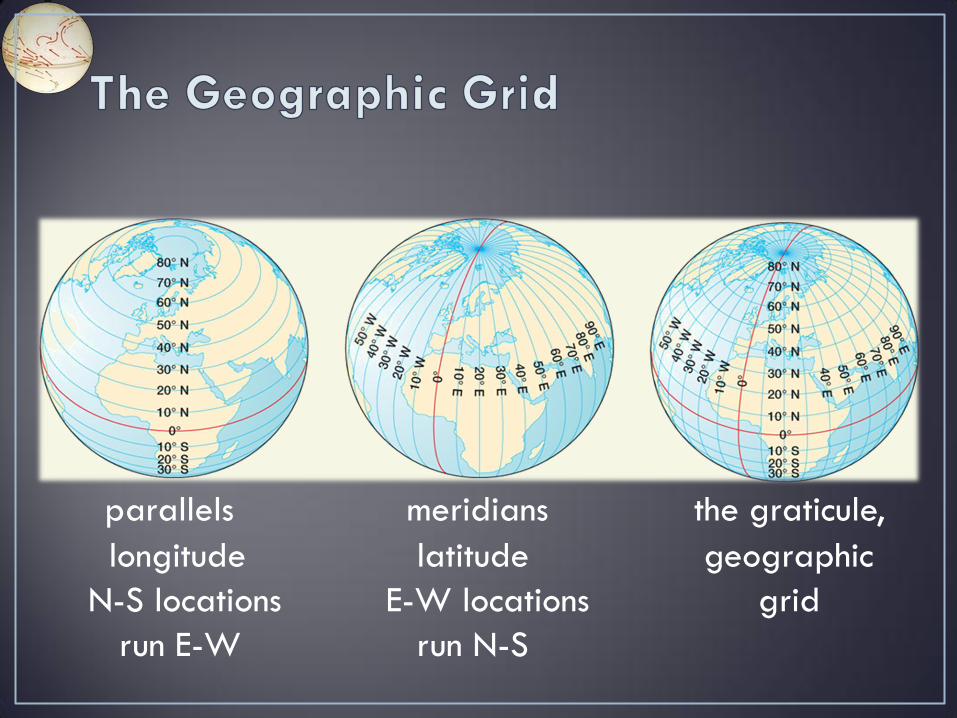
parallels meridians the graticule,
longitude latitude geographic
N-S locations E-W locations grid
run E-W run N-S
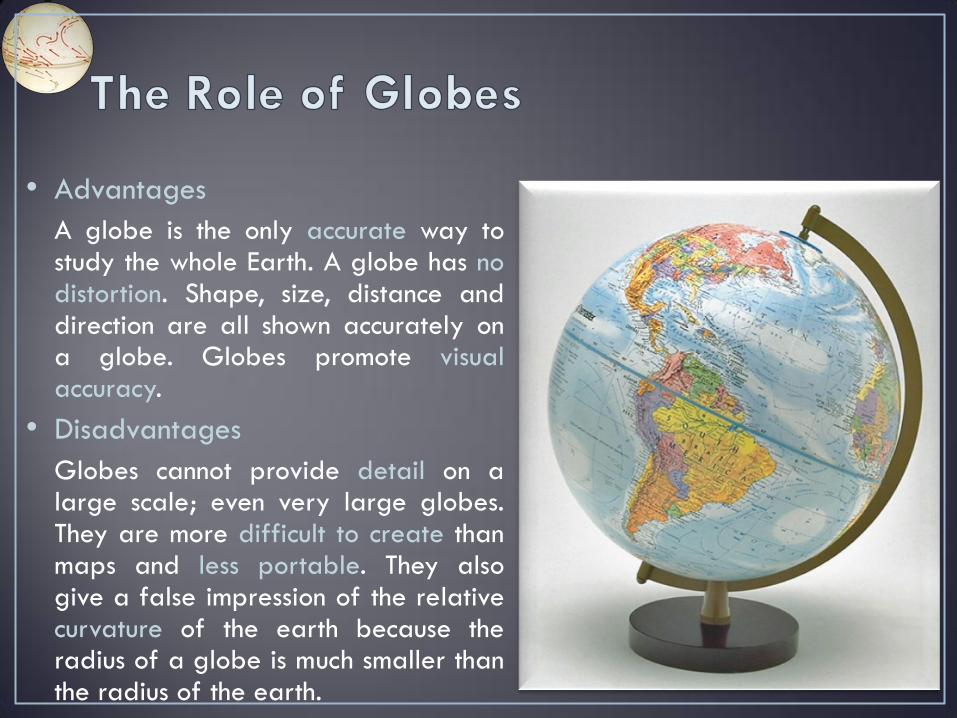
• Advantages
A globe is the only accurate way to study the whole Earth. A globe has no distortion. Shape, size, distance and direction are all shown accurately on a globe. Globes promote visual accuracy.
• Disadvantages
Globes cannot provide detail on a large scale; even very large globes. They are more difficult to create than maps and less portable. They also give a false impression of the relative curvature of the earth because the radius of a globe is much smaller than the radius of the earth.
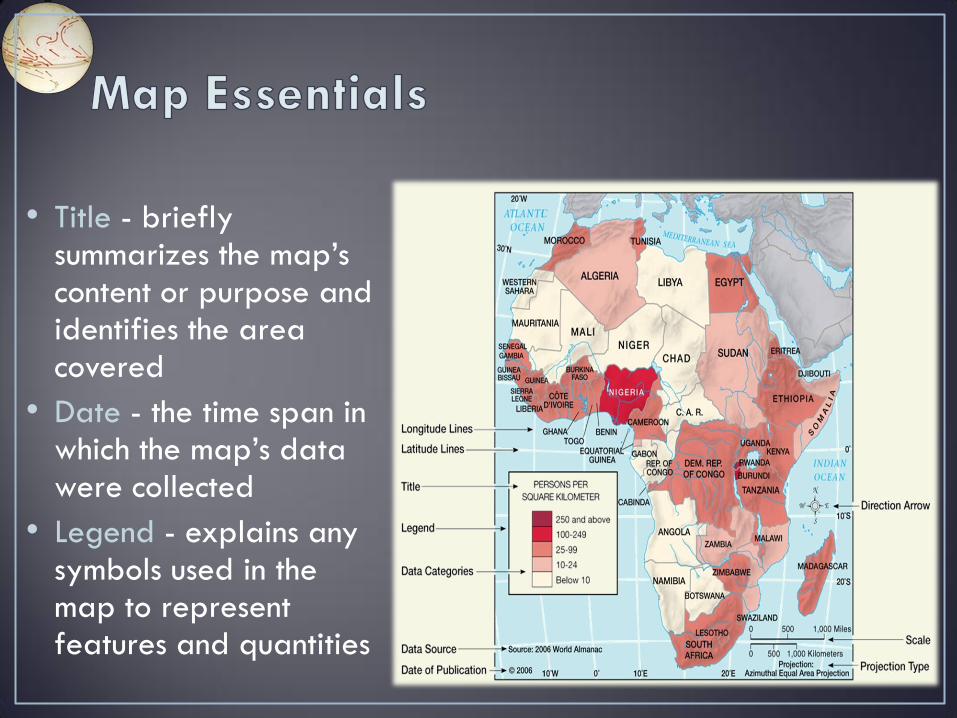
• Title - briefly summarizes the map’s content or purpose and identifies the area covered
• Date - the time span in which the map’s data were collected
• Legend - explains any symbols used in the map to represent features and quantities
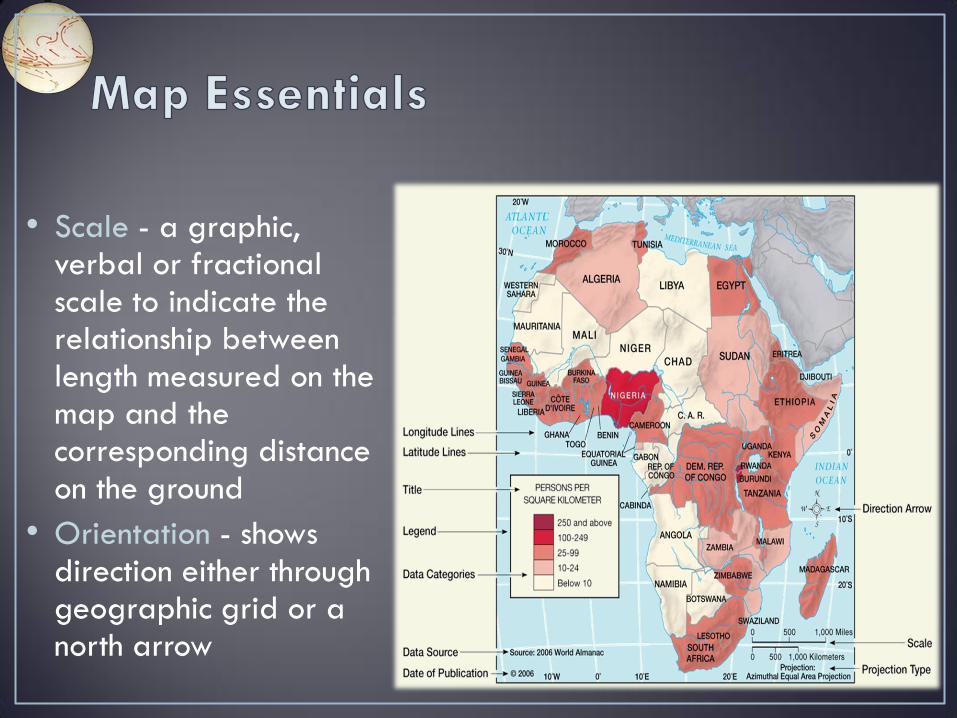
• Scale - a graphic, verbal or fractional scale to indicate the relationship between length measured on the map and the corresponding distance on the ground
• Orientation - shows direction either through geographic grid or a north arrow
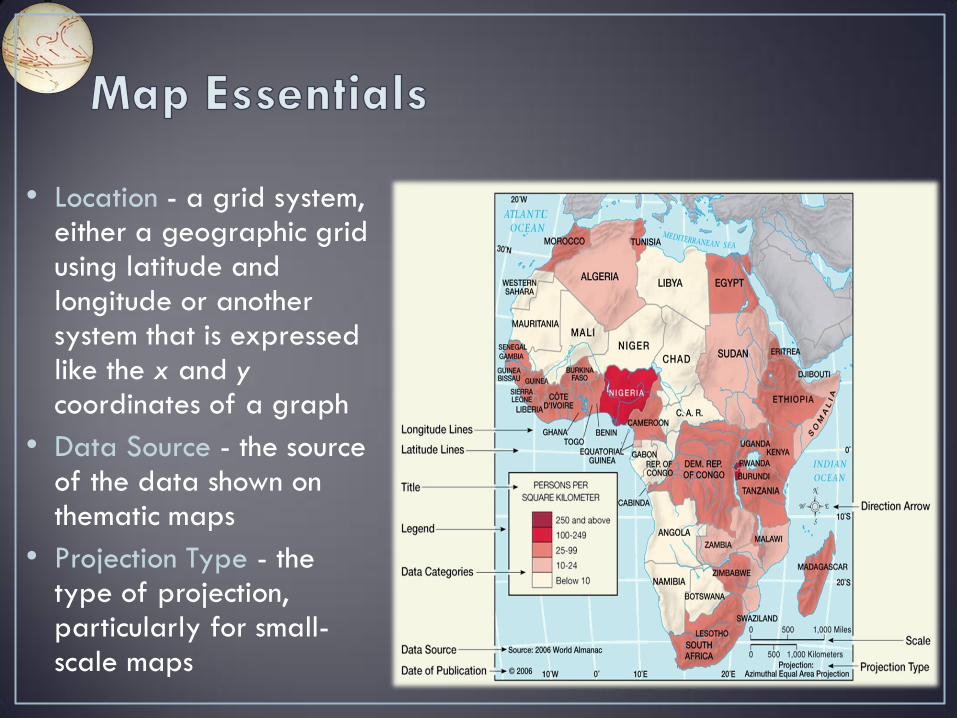
• Location - a grid system, either a geographic grid using latitude and longitude or another system that is expressed like the x and y coordinates of a graph
• Data Source - the source of the data shown on thematic maps
• Projection Type - the type of projection, particularly for small-scale maps
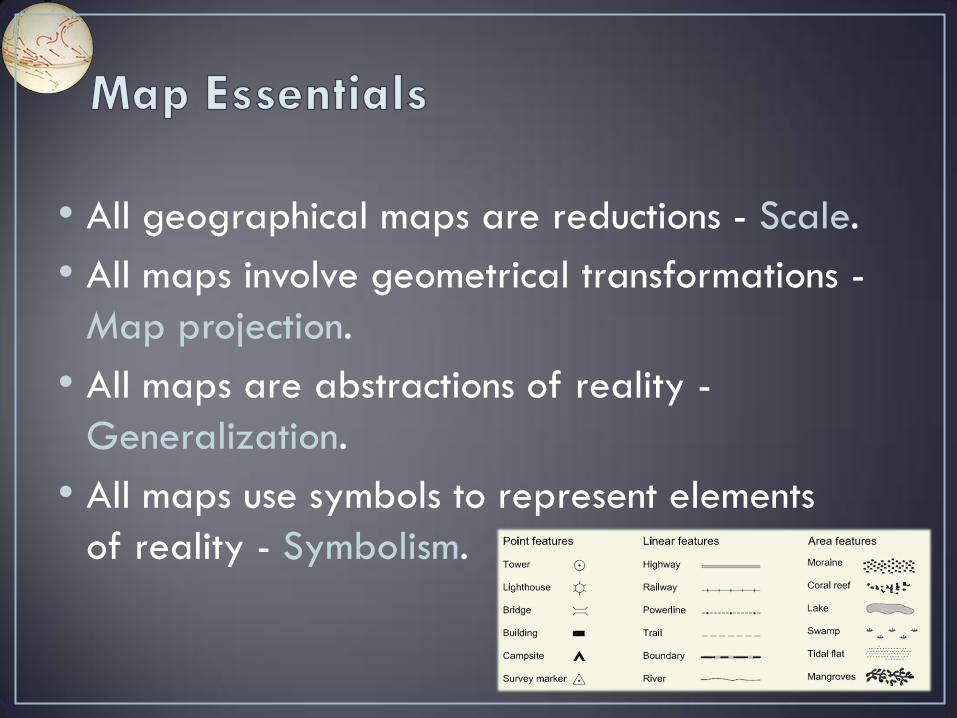
• All geographical maps are reductions - Scale.
• All maps involve geometrical transformations -
Map projection.
• All maps are abstractions of reality -
Generalization.
• All maps use symbols to represent elements
of reality - Symbolism.
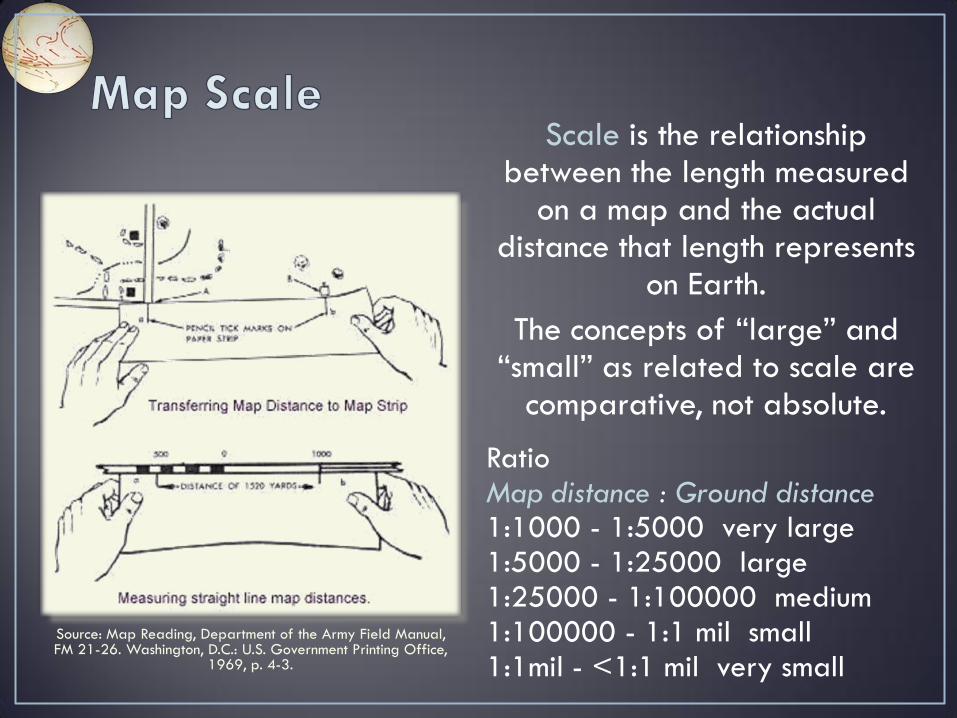
Scale is the relationship between the length measured
on a map and the actual distance that length represents
on Earth.
The concepts of “large” and “small” as related to scale are
comparative, not absolute.
Ratio Map distance : Ground distance 1:1000 - 1:5000 very large 1:5000 - 1:25000 large 1:25000 - 1:100000 medium 1:100000 - 1:1 mil small 1:1mil - <1:1 mil very small
Source: Map Reading, Department of the Army Field Manual, FM 21-26. Washington, D.C.: U.S. Government Printing Office,
1969, p. 4-3.
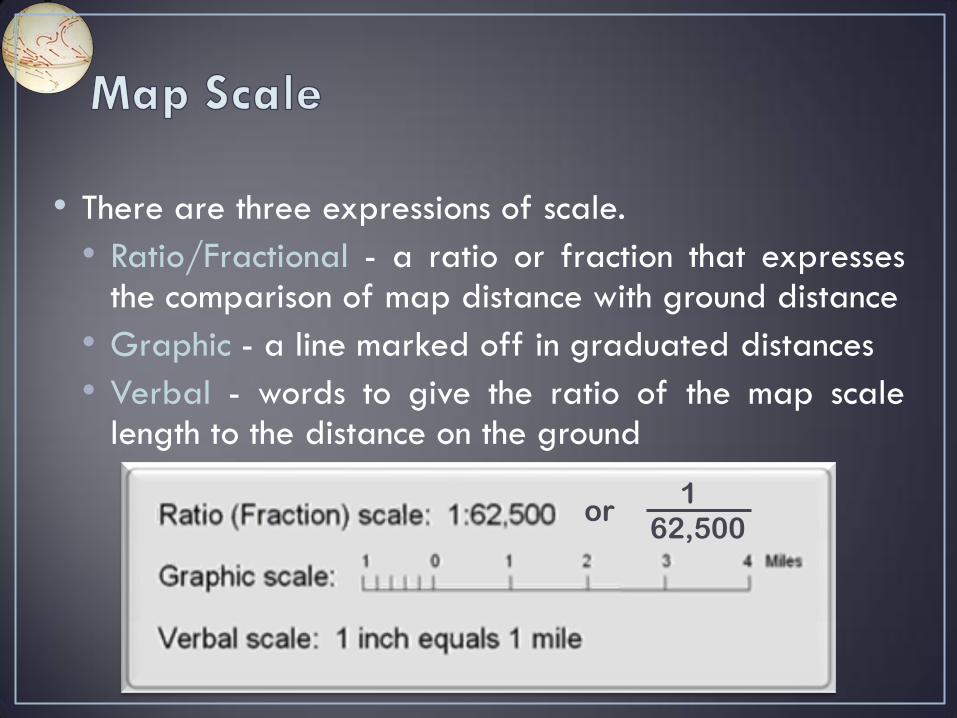
• There are three expressions of scale.
• Ratio/Fractional - a ratio or fraction that expresses the comparison of map distance with ground distance
• Graphic - a line marked off in graduated distances
• Verbal - words to give the ratio of the map scale length to the distance on the ground
1 or 62,500
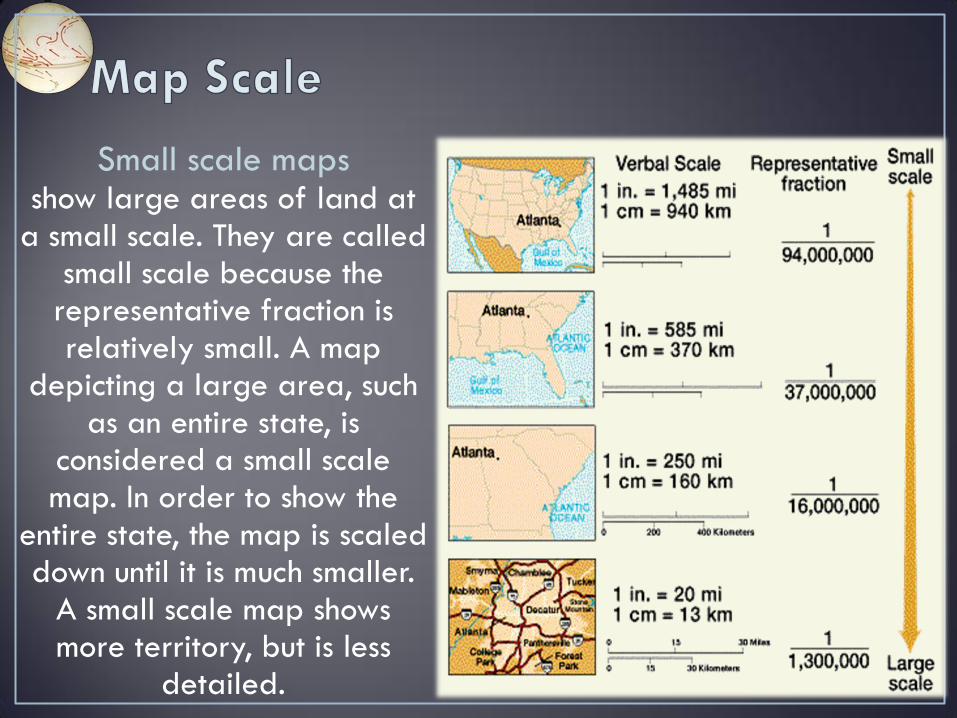
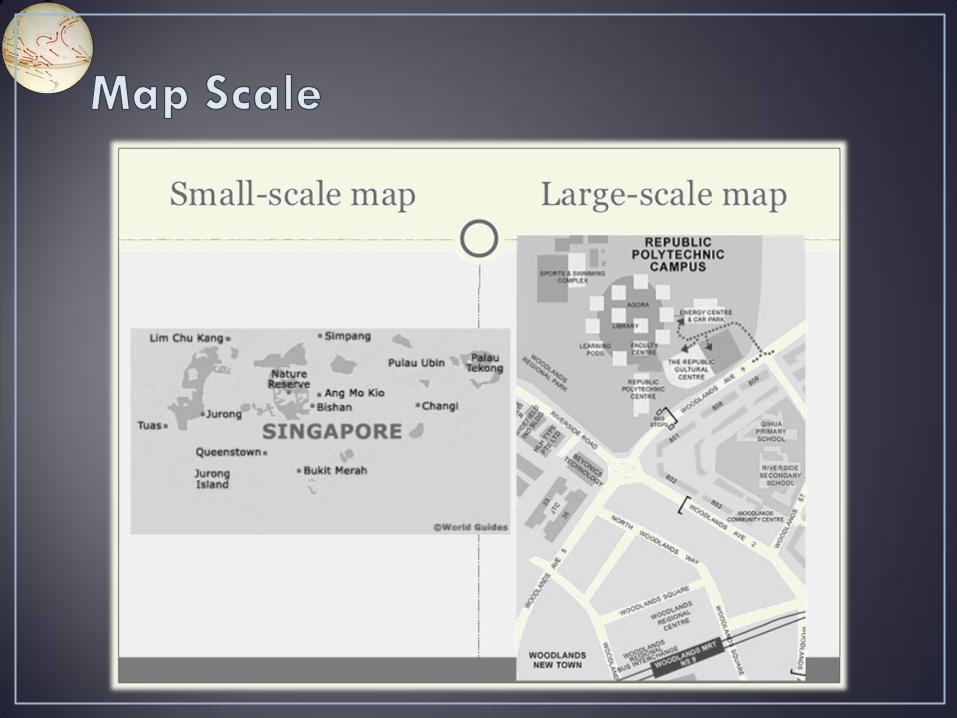
Small scale maps show large areas of land at
a small scale. They are called small scale because the
representative fraction is relatively small. A map
depicting a large area, such as an entire state, is
considered a small scale map. In order to show the
entire state, the map is scaled down until it is much smaller.
A small scale map shows more territory, but is less
detailed.
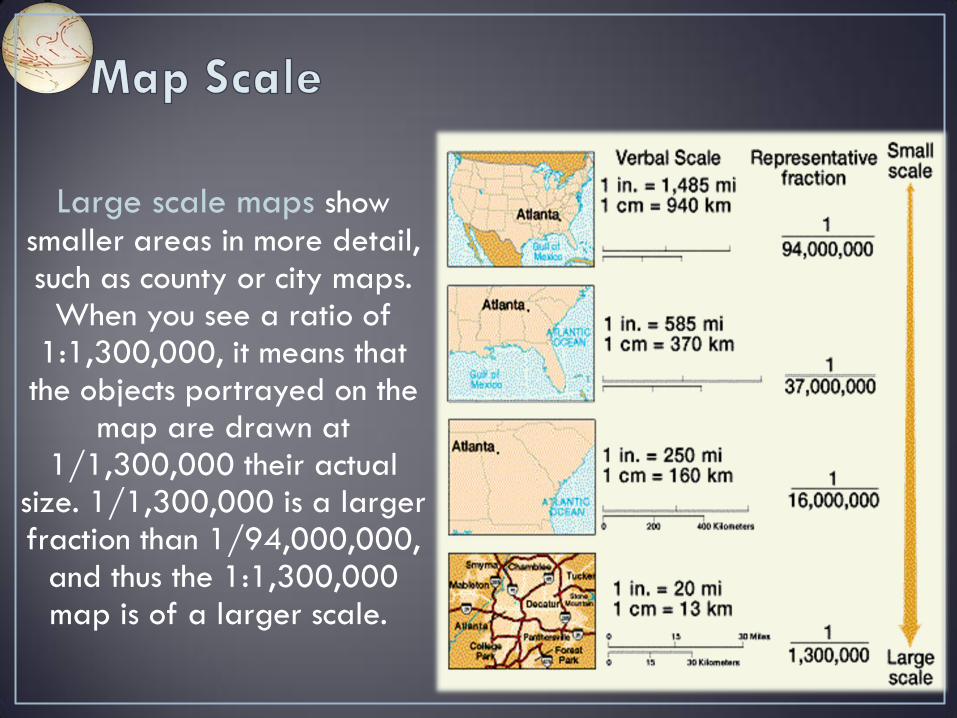
Large scale maps show
smaller areas in more detail, such as county or city maps.
When you see a ratio of 1:1,300,000, it means that
the objects portrayed on the map are drawn at
1/1,300,000 their actual size. 1/1,300,000 is a larger fraction than 1/94,000,000,
and thus the 1:1,300,000 map is of a larger scale.
Related Documents