Under supervision of Submitted by PROF: -TAMAL DUTTA CHAUDHURI SOFIAR RAHAMAN CALCUTTA BUSINESS SCHOOL

Portfoli.printout
Aug 07, 2015
Welcome message from author
This document is posted to help you gain knowledge. Please leave a comment to let me know what you think about it! Share it to your friends and learn new things together.
Transcript

Under supervision of Submitted by PROF: -TAMAL DUTTA CHAUDHURI SOFIAR RAHAMAN
CALCUTTA BUSINESS SCHOOL

Introduction
Portfolio:
The term portfolio refers to any collection of financial assets such as cash. Portfolios may be held by individual investors and/or managed by financial professionals, hedge funds, banks and other financial institutions. It is a generally accepted principle that a portfolio is designed according to the investor's risk tolerance, time frame and investment objectives.
Portfolio Management:
The art and science of making decisions about investment mix and policy, matching investments to objectives, asset allocation for individuals and institutions, and balancing risk against performance.
Portfolio management is all about strength, weaknesses, opportunities and threats in the choice of debt vs equity, domestic vs. international, growth vs safety, and many other tradeoffs encountered in the attempt to maximize return at a given appetite for risk.
History of Portfolio Management
.McFarlan is the first person who planned the approach of the portfolio management in the investment concerns.
.Later various personalities developed this portfolio management.
.Portfolio management is the responsibility of the senior member of the team in the organization .They are also called as the productive team of the company.

Objective of Portfolio Management
Security of Principle Investment Consistency of Return Capital Growth Marketability Liquidity Diversification Portfolio Favorable tax Status

COMPANY NAME
SECTOR PRODUCTS
Aurobindo pharma
Pharmaceuticals Tablets, Capsules, Syrup
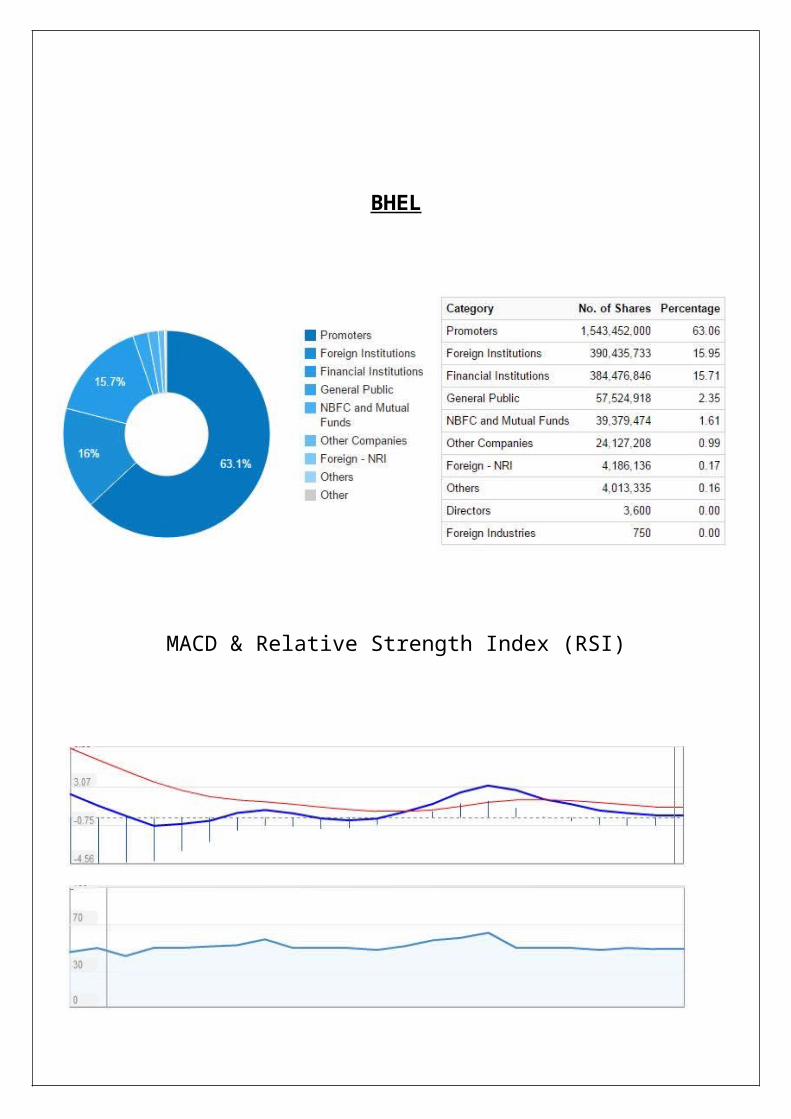
BHEL Engineering Construction, Power Plants
BIOCON Pharmaceuticals Tablets, Capsules, Syrup
BOMBAY DYING
Conglomerates Cloths
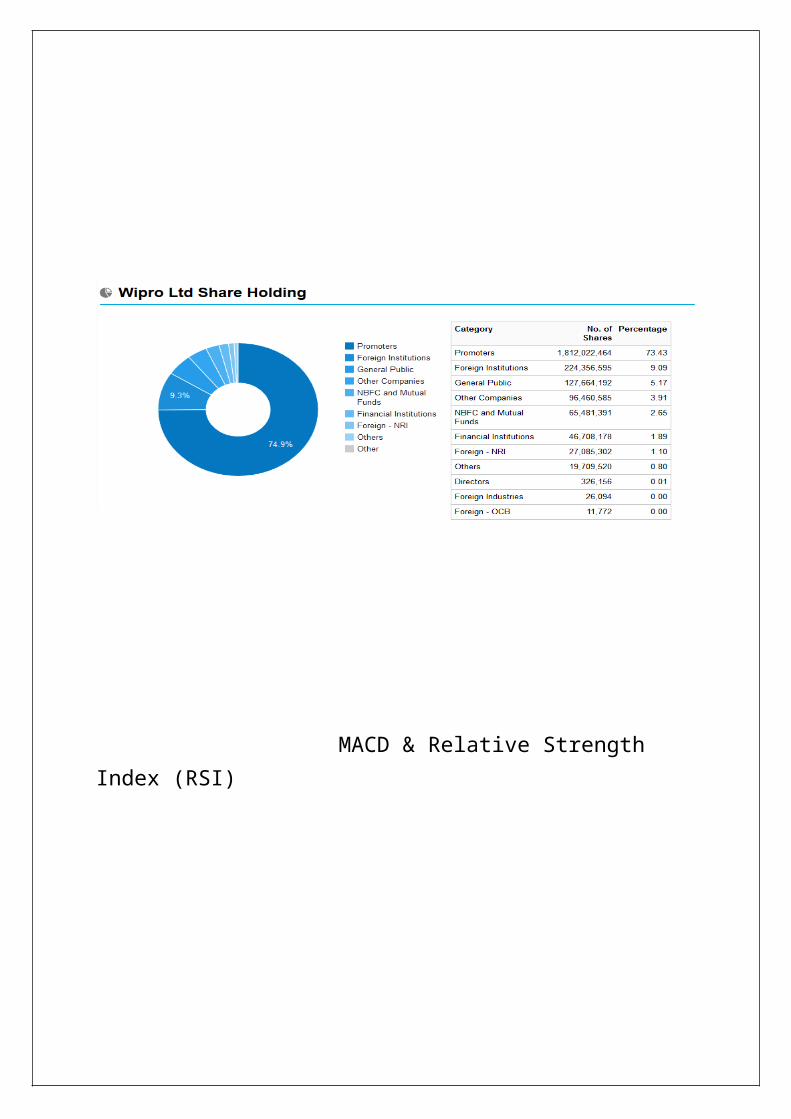
Wipro Technology Electrical
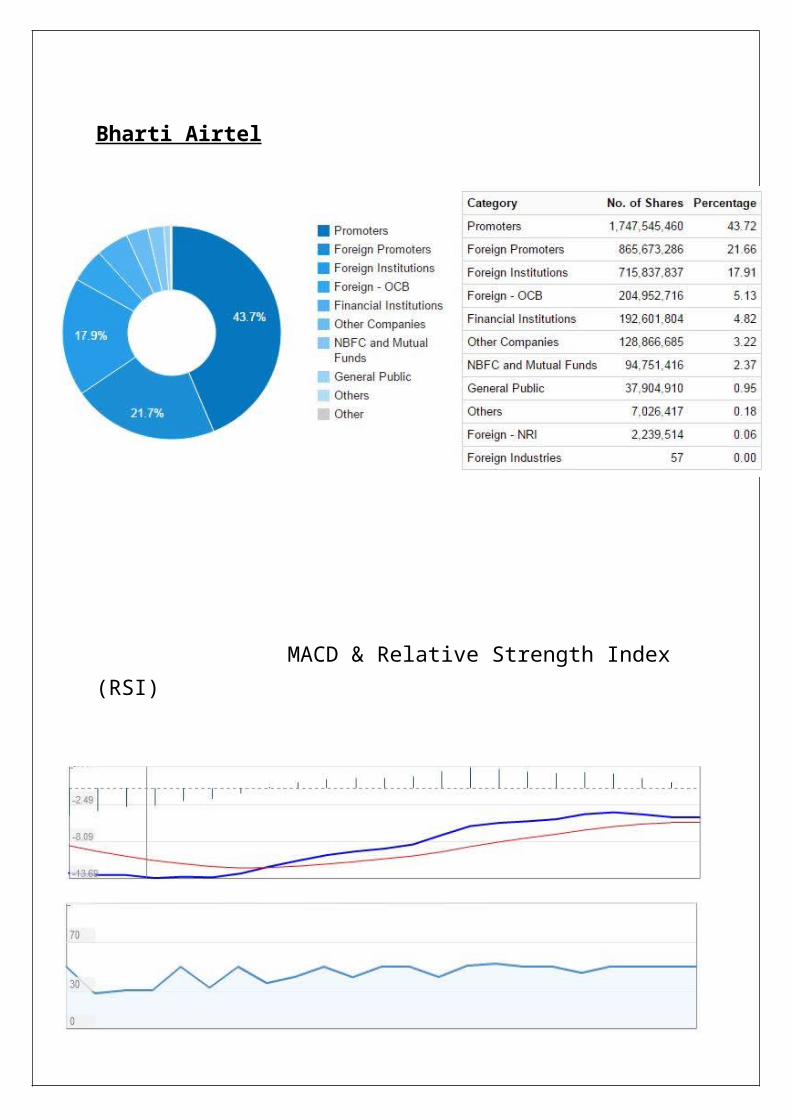
Bharti Airtel
Telecom Mobile lines, Fixed Lines, Broadband
Coal India Mining Coal
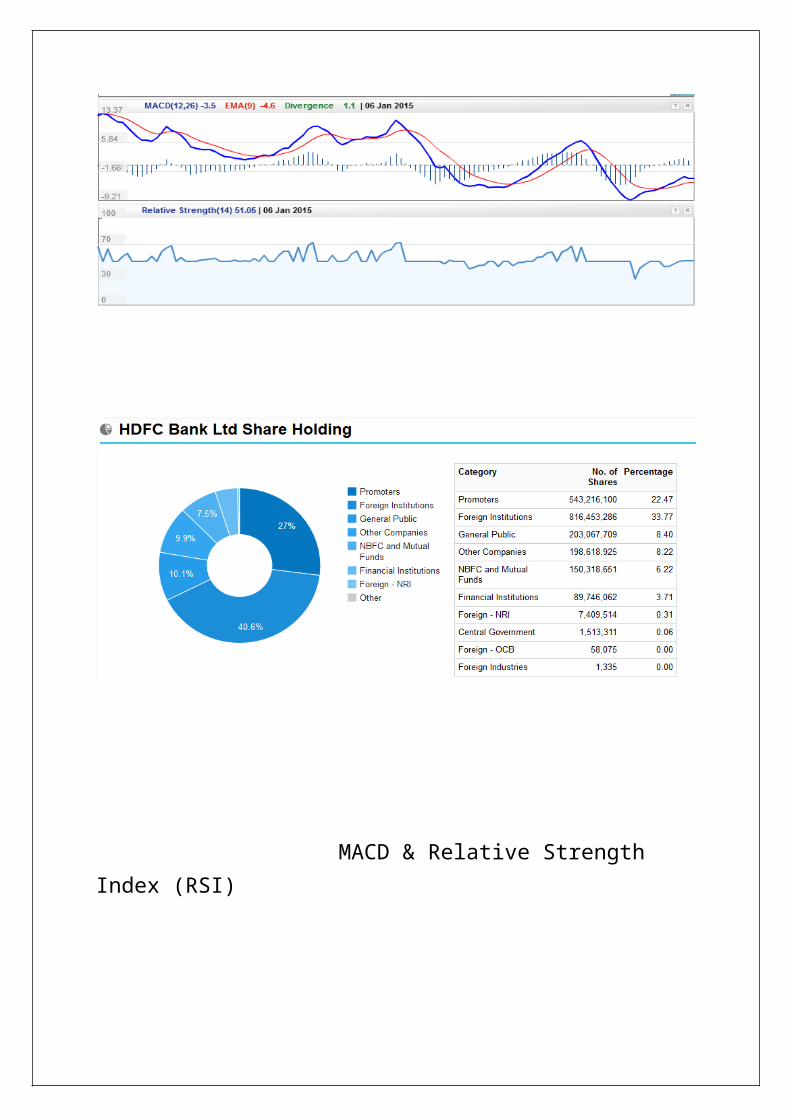
HDFC bank
Banking & Finance Financial Instruments, Deposits
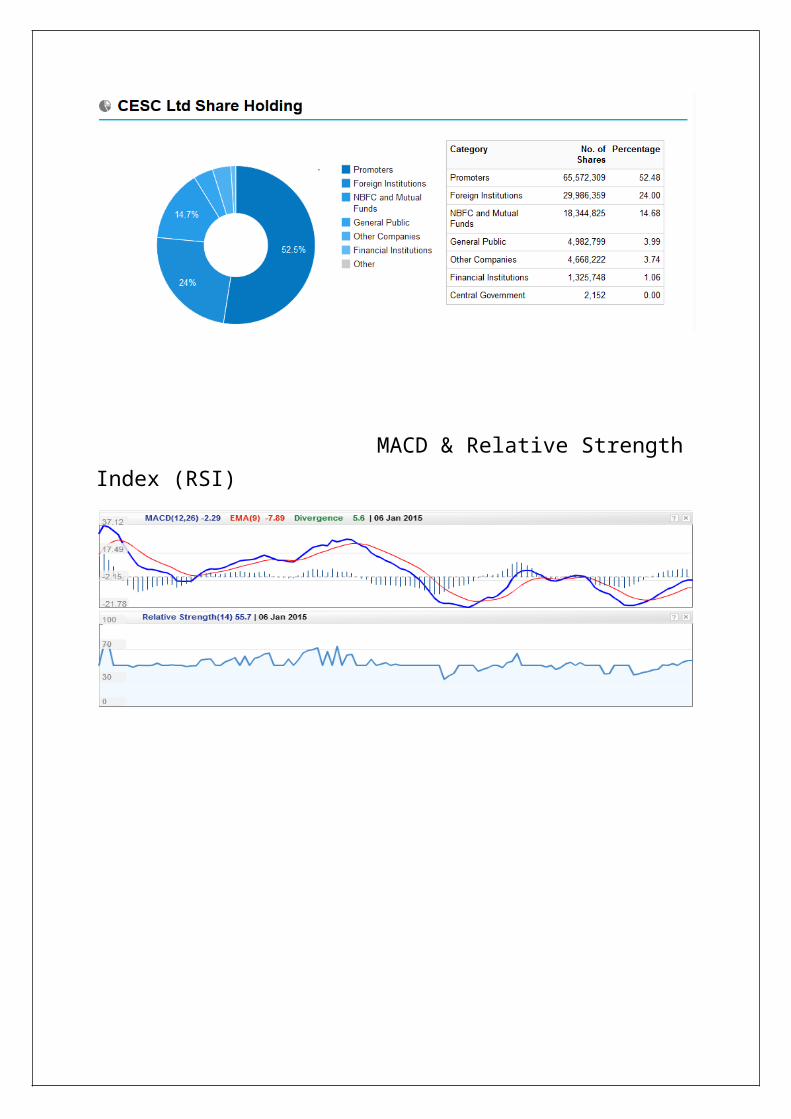
CESC Utilities Electric distribution
EMAMI Cons Non-Durable Beauty care product
TCS Technology Wireless business products
STATISTICAL TOOLS USED


P/E RATIO (PRICE TO EARNING RATIO)
According to one view, lower the P/E ratio, the better it is for investors, as there are chances of higher appreciation.
Generally, a company with a high P/E ratio is expensive when compared with a company with a low P/E ratio, since with a high P/E ratio one is paying a larger multiple against a company's earnings.
The higher the P/E, the more you are paying for an estimated stream of earnings. Investors usually are willing to pay a higher P/E for companies they judge will be growing faster than the norm even though they do not pay those earnings out in dividends but retain them to fund future growth.
Generally most I prefer those co. which have a P/E Ratio of less than 8.
P/B RATIO (PRICE-TO-BOOK RATIO)
The price-to-book ratio measures a company's market price in relation to its book value. The ratio denotes how much equity investors are paying for each dollar in net assets.
A P/B ratio of less than 1.0 can indicate that a stock is undervalued, while a ratio of greater than 1.0 may indicate that a stock is overvalued.
The price-to-book ratio indicates whether or not a company's asset value is comparable to the market price of its stock. For this reason, it can be useful for finding value stocks. It is especially useful when valuing companies that are composed of mostly liquid assets, such as finance, investment, insurance, and banking firms.
Generally most I prefer those co. which have a P/B Ratio of less than 1.
FREE FLOAT
A Free-float index reflects the market trends more rationally as it takes into consideration only those shares that are available for trading in the market.Stocks with small free float tend to be more volatile because there are only a limited number of shares that can be bought or sold in the event of major trading news. For the same reason, companies with larger free floats are generally less volatile.
Generally most I prefer those co. which have a very less Free Float or Free Float of less than 50%.
DEBT EQUITY RATIO
The debt to equity ratio is a financial, liquidity ratio that compares a company's total debt to total equity. The debt to equity ratio shows the percentage of company financing that comes from creditors and investors. A higher debt to equity ratio indicates that more creditor financing (bank loans) is used than investor financing (shareholders).
A high debt/equity ratio generally means that a company has been aggressive in financing its growth with debt. This can result in volatile earnings as a result of the additional interest expense.
Generally most I prefer those co. which have a DEBT EQUITY Ratio of less than 1.
*(There have some co. & they have a debt equity ratio of 0. Because the debt of the co. is 0. Because those co. don’t need any machinery. Mainly those co.’s are of IT sector, Banking & Finance sector because those co. don’t need any machinery.)

Bharti Airtel
MACD & Relative Strength Index (RSI)
BHEL
MACD & Relative Strength Index (RSI)
BIOCON
MACD & Relative Strength Index (RSI)
MACD & Relative Strength Index (RSI)

MACD & Relative Strength Index (RSI)
MACD & Relative Strength Index (RSI)
TRANSACTION HISTORY