Portfolio Review Portfolio 42 14 th Mar 2016 3/14/2016 © Multi-Act Equity Consultancy Pvt. Ltd. For private circulation only 1

Welcome message from author
This document is posted to help you gain knowledge. Please leave a comment to let me know what you think about it! Share it to your friends and learn new things together.
Transcript
Portfolio ReviewPortfolio 42
14th Mar 2016
3/14/2016 © Multi-Act Equity Consultancy Pvt. Ltd. For private circulation only 1
Executive Summary• 17.3% of the portfolio is invested in strong and sustainable Moat companies. Further 12.0% of the portfolio is invested in Limited Moat
companies where some of them might be cyclical or their business advantage might be temporary.
• The portfolio appears to be concentrated in Industrials and Financial sector, with higher relative exposure to Industrials and Consumer Staples as compared to CNX-500 Index.
• The portfolio is highly concentrated with 3 stocks accounting for ~47% of portfolio. There are further 20 stocks in the portfolio with less than 1% allocation. Collectively, these 20 stocks may not be in a position to contribute significantly to overall portfolio returns.
• Top holding is Larsen & Toubro Ltd, which is quoting near low end of our EBV band with a weak technical chart with neutral earnings momentum. Another large holding is ITC Ltd, which is quoting near fair value of our EBV band with neutral technical chart and neutral earnings momentum.
• 3.3% of the portfolio is quoting ‘significantly’ above our calculated valuation range with another 3.3% quoting towards high end of our valuation range.
• 4.0% of the portfolio has strong technical momentum. 66% of the Portfolio or 27 stocks has weak technical trend.
• 86% of the portfolio or 28 companies have “Neutral” earnings momentum.
• We do not have active valuation coverage of 12 stocks or 13.1% of the portfolio. Further, we have not considered 6% of the portfolio that included unlisted, untraded and a fixed income instrument in our analysis. Hence, our analysis is subject to that.
• Portfolio Diagnostic Report is done based on the current portfolio size and information available, one need to take into consideration overall investments while taking investment action.
3/14/2016 © Multi-Act Equity Consultancy Pvt. Ltd. For private circulation only 2

Portfolio Attributes
3/14/2016 © Multi-Act Equity Consultancy Pvt. Ltd. For private circulation only 3

Detailed Sub-sector Classification
High concentration in sub-sector Capital Goods-Non Electrical Equipment and Banks
Sub-Sector classifications source: Capitaline.
3/14/2016 © Multi-Act Equity Consultancy Pvt. Ltd. For private circulation only 4

Exposure vs major Indices
As compared to CNX 500, the portfolio has relatively:- Higher exposure to Industrials and Consumer Staples sector-Lower exposure to Materials and Information Technology Sector
3/14/2016 © Multi-Act Equity Consultancy Pvt. Ltd. For private circulation only 5
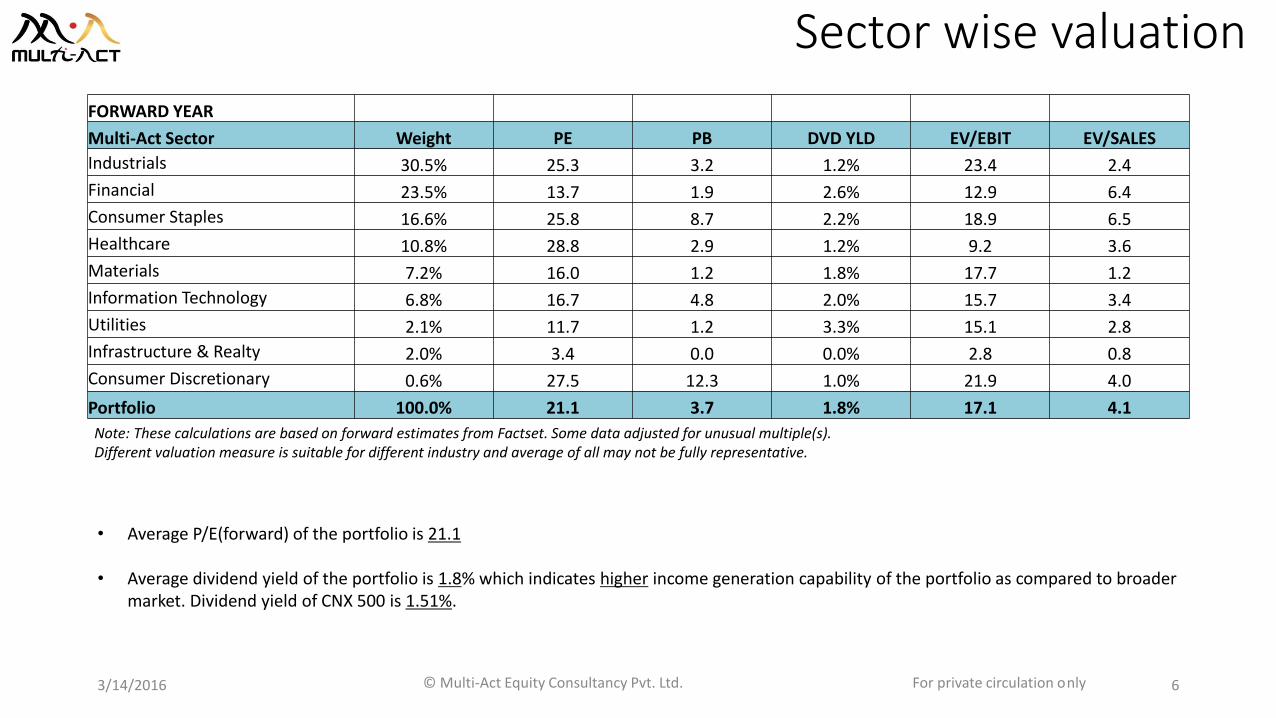
Sector wise valuation
Note: These calculations are based on forward estimates from Factset. Some data adjusted for unusual multiple(s).Different valuation measure is suitable for different industry and average of all may not be fully representative.
• Average P/E(forward) of the portfolio is 21.1
• Average dividend yield of the portfolio is 1.8% which indicates higher income generation capability of the portfolio as compared to broader market. Dividend yield of CNX 500 is 1.51%.
3/14/2016 © Multi-Act Equity Consultancy Pvt. Ltd. For private circulation only 6
FORWARD YEAR
Multi-Act Sector Weight PE PB DVD YLD EV/EBIT EV/SALES
Industrials 30.5% 25.3 3.2 1.2% 23.4 2.4
Financial 23.5% 13.7 1.9 2.6% 12.9 6.4
Consumer Staples 16.6% 25.8 8.7 2.2% 18.9 6.5
Healthcare 10.8% 28.8 2.9 1.2% 9.2 3.6
Materials 7.2% 16.0 1.2 1.8% 17.7 1.2
Information Technology 6.8% 16.7 4.8 2.0% 15.7 3.4
Utilities 2.1% 11.7 1.2 3.3% 15.1 2.8
Infrastructure & Realty 2.0% 3.4 0.0 0.0% 2.8 0.8
Consumer Discretionary 0.6% 27.5 12.3 1.0% 21.9 4.0
Portfolio 100.0% 21.1 3.7 1.8% 17.1 4.1

Market-Cap Classification
Note: Large Cap >Rs 10,000 crores; Small Cap < Rs 2,000 crores; Rest Mid cap.
Exposure to frontline Nifty stocks
No. of companies 21
Weight 77%
3/14/2016 © Multi-Act Equity Consultancy Pvt. Ltd. For private circulation only 7

Multi-Act AnalyticsBusiness Risk
3/14/2016 © Multi-Act Equity Consultancy Pvt. Ltd. For private circulation only 8

Quality of the portfolio
A or B + for good quality businesses/ B is for average quality business / B- or C are poor quality businesses.
3/14/2016 © Multi-Act Equity Consultancy Pvt. Ltd. For private circulation only 9

Presence of Competitive Advantage
Moat = Strong competitive advantage companiesLtd. Moat = Ltd. competitive advantage companiesNon-Moat = Companies with no competitive advantageRegulated Utilities = Returns are regulated by the government
Illiquid No-Moat % 0.9%
In Multi-Act’s opinion, companies that are illiquid and Non-Moat see relatively higher drawdown during market declines. Hence, lower the %, better for the portfolio when overall valuations are higher.
3/14/2016 © Multi-Act Equity Consultancy Pvt. Ltd. For private circulation only 10

Multi-Act AnalyticsValuation Risk
3/14/2016 © Multi-Act Equity Consultancy Pvt. Ltd. For private circulation only 11

Conviction on Valuation
Conviction indicates the relevance/usefulness of valuation range, given the intricacies/complexities of the business model.
3/14/2016 © Multi-Act Equity Consultancy Pvt. Ltd. For private circulation only 12

Portfolio Valuation
Using Reward to Risk (RR) offered as per Multi-Act valuation range.
3/14/2016 © Multi-Act Equity Consultancy Pvt. Ltd. For private circulation only 13

Portfolio Price to Fair valuePrice to Fair Value ratio - Lower the better.
Generally speaking, P/FV > 1.5 is expensive andP/FV < 0.67 is cheap.
• Weighted average P/FV of the portfolio is : 0.96 or fairly valued.
• 3.3% of the portfolio is quoting significantly above our calculated valuation range and caution might be warranted there.
• 3.3% of the portfolio is invested in companies which might be quoting towards the higher end of the valuation.
3/14/2016 © Multi-Act Equity Consultancy Pvt. Ltd. For private circulation only 14

Sector Price to Fair value
• Most of the sectors in the portfolio appear to be at reasonable valuation.• Consumer discretionary and Healthcare are the sectors that appear to be expensive.
(Calculations based on companies under coverage)
3/14/2016 © Multi-Act Equity Consultancy Pvt. Ltd. For private circulation only 15

Stock wise P/FV
• Of the 43 companies in the portfolio, 16 companies are quoting above their “fair value” (i.e. valuation mid-band).
Top 5 Companies Weight P / FV
Larsen & Toubro Ltd. 22.6% 0.70
ITC Limited 15.2% 0.99
State Bank of India 8.8% 0.68
Piramal Enterprises Ltd. 5.2% N.A
ICICI Bank Limited 5.1% 0.98
Note: Top 20 companies only; Black line = P/FV of 1; Dotted Red line = Portfolio P/FV
3/14/2016 © Multi-Act Equity Consultancy Pvt. Ltd. For private circulation only 16

Multi-Act AnalyticsMarket Risk
3/14/2016 © Multi-Act Equity Consultancy Pvt. Ltd. For private circulation only 17

Technical status
Indicates strength or weakness in the technical chart of the stocks.Strong is favourable momentum; Weak is unfavourable momentum
3/14/2016 © Multi-Act Equity Consultancy Pvt. Ltd. For private circulation only 18

3/14/2016 © Multi-Act Equity Consultancy Pvt. Ltd. For private circulation only 19
Earnings momentum
Indicates strength or weakness in the earnings momentum of the stocks based on observations of last 2 quarters.
Based on Sales, EBIT and PAT growth rates

Top Holdings
3/14/2016 © Multi-Act Equity Consultancy Pvt. Ltd. For private circulation only 20

Top 20 holdings
3/14/2016 © Multi-Act Equity Consultancy Pvt. Ltd. For private circulation only 21
Name % Weight CMP Price/Fair Value GRADEEarnings
Momentum Technical StatusLarsen & Toubro Ltd. 22.6% 1186 0.70 B Neutral WeakITC Limited 15.2% 321 0.99 B+ Neutral NeutralState Bank of India 8.8% 180 0.68 B Neutral WeakPiramal Enterprises Ltd. 5.2% 931 NA B Neutral WeakICICI Bank Limited 5.1% 214 0.98 B Neutral Weak
Housing Development Finance Corporation 3.4% 1159 1.25 B Positive NeutralSiemens Limited 3.3% 1034 2.07 B Neutral WeakTata Steel Limited 3.2% 294 0.63 B Neutral NeutralTata Consultancy Services Limited 3.1% 2366 0.98 B+ Positive WeakReliance Industries Limited 3.0% 1016 1.35 B Neutral StrongUnion Bank of India Limited 2.4% 124 NA B Neutral WeakSun Pharmaceutical Industries Limited 2.1% 868 1.37 B Neutral NeutralNTPC Limited 2.0% 126 0.81 B Neutral WeakDelta Corp. Ltd. (India) 1.8% 63 NA NA Neutral WeakBlue Star Limited 1.7% 334 1.52 B Neutral NeutralCipla Limited 1.6% 535 0.96 B Neutral WeakWipro Limited 1.5% 541 0.94 B Neutral NeutralSuven Life Sciences Limited 1.5% 201 NA NA Negative WeakTech Mahindra Limited 1.5% 458 1.22 B Neutral WeakHDFC Bank Limited 1.4% 1028 0.88 B Positive Neutral

Glossary• Strong Stock: As per MA, a stock is technically strong if 40 WMA is moving up at least for 3 weeks and 11 WMA is not showing contradictory signal.
• Weak stock: As per MA, a stock is technically weak if 40 WMA is going down at least for 3 weeks and 11 WMA is not showing contradictory signal.
• WMA: Weekly Moving Average.
• EBV: Estimated Business Value.
Price near EBV Low = Company is cheap based on fundamentals and pessimism or fear is the overriding factor in the market with respect to that stock.
Price near EBV High = Company is expensive based on fundamentals and optimism or greed is the overriding factor in the market with respect to that stock.
• Fair Value: Mid-Band of Multi-Act EBV Range
• RR: Upside divided by Downside; based on Current Price, EBV high and EBV low.
• MA: Multi-Act.
• Grade- (Range is A, B+, B, B- and C; A is best, C being the worst). Criteria include company’s returns, profitability, growth, cash generation, balance sheetstructure, quality of earnings, presence of competitive advantages, industry structure, corporate governance issues, etc.
• Confidence- (Ranges from 0 to 3; Higher the better)
• EV- Economic Value (Debt + Market Cap)
3/14/2016 © Multi-Act Equity Consultancy Pvt. Ltd. For private circulation only 22

• This is an Internal Document and meant for only Ltd. circulation. This document has been solely prepared for the Clients of Multi-Act Equity Consultancy Private Ltd. (MAECL) and is not meant for circulation to any third party.
• The information is prepared on the basis of publicly available information, internally developed data and other sources believed to be reliable. MAECL does not solicit any course of action based on the information provided by it and the investor is advised to exercise independent judgment and act upon the same based on its/his/her sole discretion based on their own investigations and risk-reward preferences.
• MAECL, its associates or any of their respective directors, employees, affiliates or representatives do not assume any responsibility for, or warrant the accuracy, completeness, adequacy and reliability of such information and consequently are not liable for any direct, indirect, special, incidental, consequential, punitive or exemplary damages, including lost profits arising in any way for decisions taken based on the said information.
• The Client shall at all times keep such information / data and material provided by MAECL strictly confidential and will not use, share or disclose such information to any third party. • It is stated that, as permitted by SEBI Regulations and the Company’s Employee Dealing Policy, MAECL and/or its associates, employees, affiliates and/or individuals, clients of MAECL’s
portfolio management services, thereof may have positions in securities referred to in the information provided by it and may make purchases or sale thereof while the information is in circulation.
• The contents herein – information or views – do not amount to distribution, guidelines, an offer or solicitation of any offer to buy or sell any securities or financial instruments, directly or indirectly, in the United States of America (US), in Canada, in jurisdictions where such distribution or offer is not authorized and in FATF non-compliant jurisdiction and are particularly not for US persons (being persons resident in the US, corporations, partnerships or other entities created or organized in or under the laws of the US or any person falling within the definition of the term “US person” under Regulation S promulgated under the US Securities Act of 1933, as amended) and persons of Canada.
General risk factors:• Securities investments are subject to market risks and there is no assurance or guarantee that the objective of the investments will be achieved. • As with any investment in securities, value of the Client’s investments can go up or down depending on the factors and forces affecting the capital market. MAECL is neither responsible
nor liable for any losses resulting from such factors. • The information on investments is subject to external risks such as war, natural calamities, and policy changes of local / international markets which affect stock markets.• MAECL has renewed SEBI PMS registration effective October 14, 2014 and has commenced its portfolio management activities with effect from January 2011. However MAECL has
more than 10 years of experience in managing its own funds invested
Disclaimer
3/14/2016 © Multi-Act Equity Consultancy Pvt. Ltd. For private circulation only 23
Related Documents