PORTFOLIO AND PORTFOLIO AND SELECT SELECT COMMITTEES ON COMMITTEES ON FINANCE FINANCE June 2006

PORTFOLIO AND SELECT COMMITTEES ON FINANCE June 2006.
Dec 29, 2015
Welcome message from author
This document is posted to help you gain knowledge. Please leave a comment to let me know what you think about it! Share it to your friends and learn new things together.
Transcript

PORTFOLIO AND PORTFOLIO AND SELECT SELECT
COMMITTEES ON COMMITTEES ON FINANCEFINANCE
PORTFOLIO AND PORTFOLIO AND SELECT SELECT
COMMITTEES ON COMMITTEES ON FINANCEFINANCE
June 2006

RECENT RECENT ECONOMIC ECONOMIC
DEVELOPMENTSDEVELOPMENTSInternational International
EconomyEconomy
RECENT RECENT ECONOMIC ECONOMIC
DEVELOPMENTSDEVELOPMENTSInternational International
EconomyEconomy
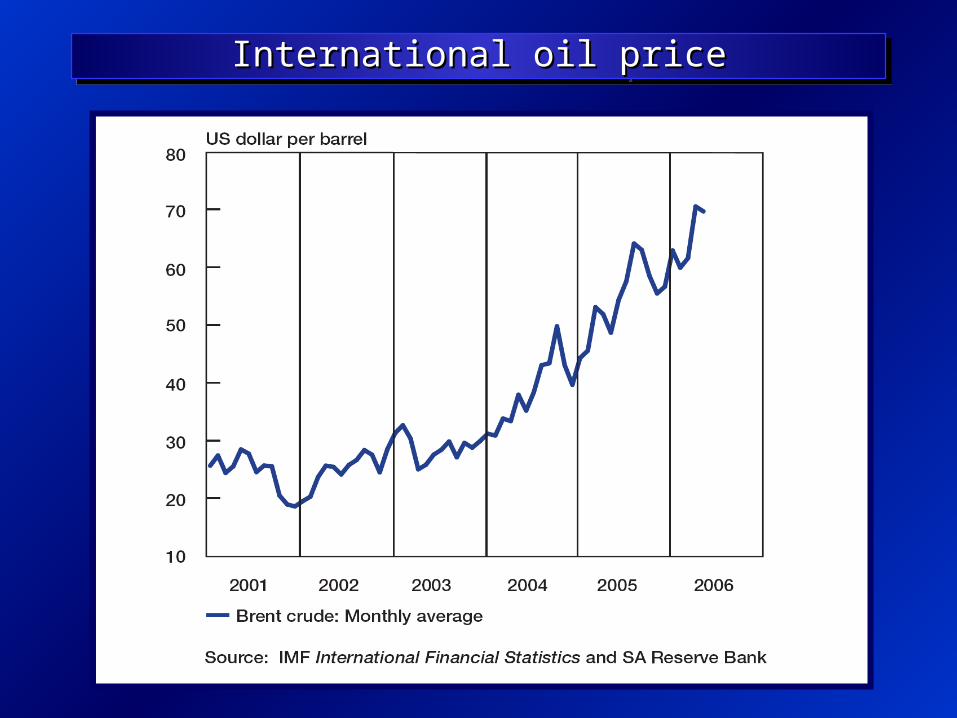
International oil priceInternational oil priceInternational oil priceInternational oil price

OECD leading indicator and industrial production
OECD leading indicator and industrial production
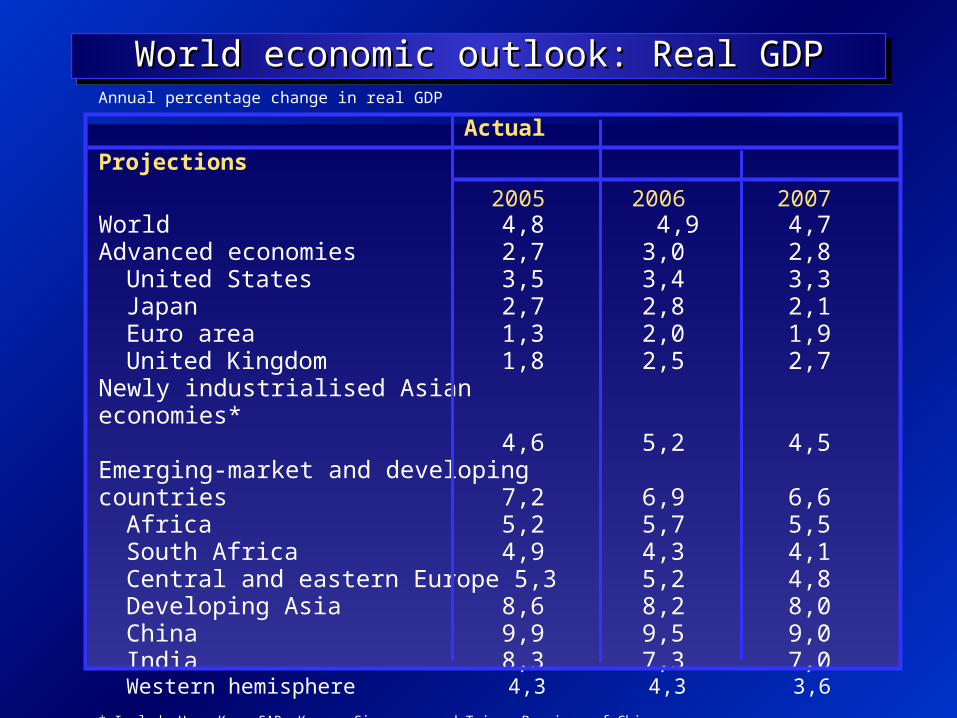
World economic outlook: Real GDPWorld economic outlook: Real GDPWorld economic outlook: Real GDPWorld economic outlook: Real GDPAnnual percentage change in real GDP
Actual Projections
2005 2006 2007World 4,8 4,9 4,7Advanced economies 2,7 3,0 2,8
United States 3,5 3,4 3,3Japan 2,7 2,8 2,1Euro area 1,3 2,0 1,9United Kingdom 1,8 2,5 2,7
Newly industrialised Asianeconomies*
4,6 5,2 4,5Emerging-market and developingcountries 7,2 6,9 6,6
Africa 5,2 5,7 5,5South Africa 4,9 4,3 4,1Central and eastern Europe 5,3 5,2 4,8Developing Asia 8,6 8,2 8,0China 9,9 9,5 9,0India 8,3 7,3 7,0Western hemisphere 4,3 4,3 3,6
* Include Hong Kong SAR, Korea, Singapore and Taiwan Province of ChinaSource: IMF World Economic Outlook, April 2006
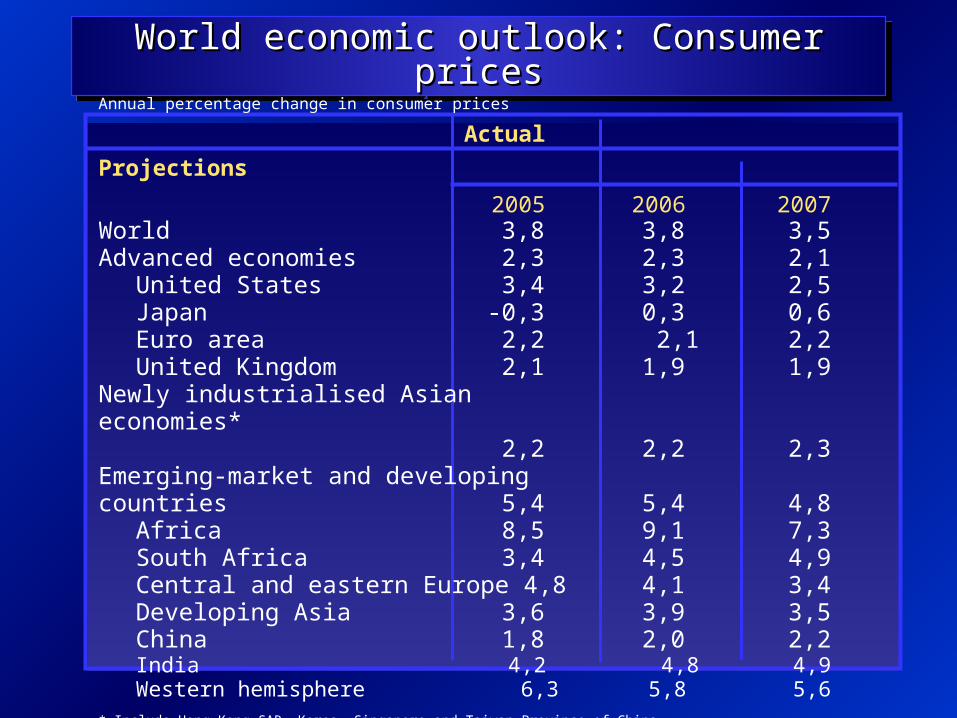
World economic outlook: Consumer pricesWorld economic outlook: Consumer pricesWorld economic outlook: Consumer pricesWorld economic outlook: Consumer pricesAnnual percentage change in consumer prices
Actual Projections
2005 2006 2007World 3,8 3,8 3,5Advanced economies 2,3 2,3 2,1
United States 3,4 3,2 2,5Japan -0,3 0,3 0,6Euro area 2,2 2,1 2,2United Kingdom 2,1 1,9 1,9
Newly industrialised Asianeconomies*
2,2 2,2 2,3Emerging-market and developingcountries 5,4 5,4 4,8
Africa 8,5 9,1 7,3South Africa 3,4 4,5 4,9Central and eastern Europe 4,8 4,1 3,4Developing Asia 3,6 3,9 3,5China 1,8 2,0 2,2India 4,2 4,8 4,9Western hemisphere 6,3 5,8 5,6
* Include Hong Kong SAR, Korea, Singapore and Taiwan Province of ChinaSource: IMF World Economic Outlook, April 200

Key central bank interest ratesKey central bank interest ratesKey central bank interest ratesKey central bank interest rates
Per centCountries 1 January 2005 13 June 2006 Latest change
(Percentage points)
United States 2,25 5,00 10 May 2006 (+0,25)Japan 0,00 0,00 19 Mar 2001 (-0,15)Euro area 2,00 2,75 8 Jun 2006 (+0,25)United Kingdom 4,75 4,50 4 Aug 2005 (-0,25)
Canada 2,50 4,25 24 May 2006 (+0,25)Denmark 2,00 2,50 3 Mar 2006 (+0,25)Sweden 2,00 2,00 23 Feb 2006 (+0,25)Switzerland 0,25 – 1,25 0,75 – 1,75 16 Mar 2006 (+0,25)
Australia 5,25 5,75 2 May 2006 (+0,25)New Zealand 6,50 7,25 8 Dec 2005 (+0,25)Israel 3,70 5,25 1 May 2006 (+0,25)
China 5,58 5,85 28 Apr 2006 (+0,27)Hong Kong 3,75 6,50 11 May 2006 (+0,25)India 4,75 5,75 8 Jun 2006 (+0,25)Malaysia* 2,70 3,50 26 Apr 2006 (+0,25)
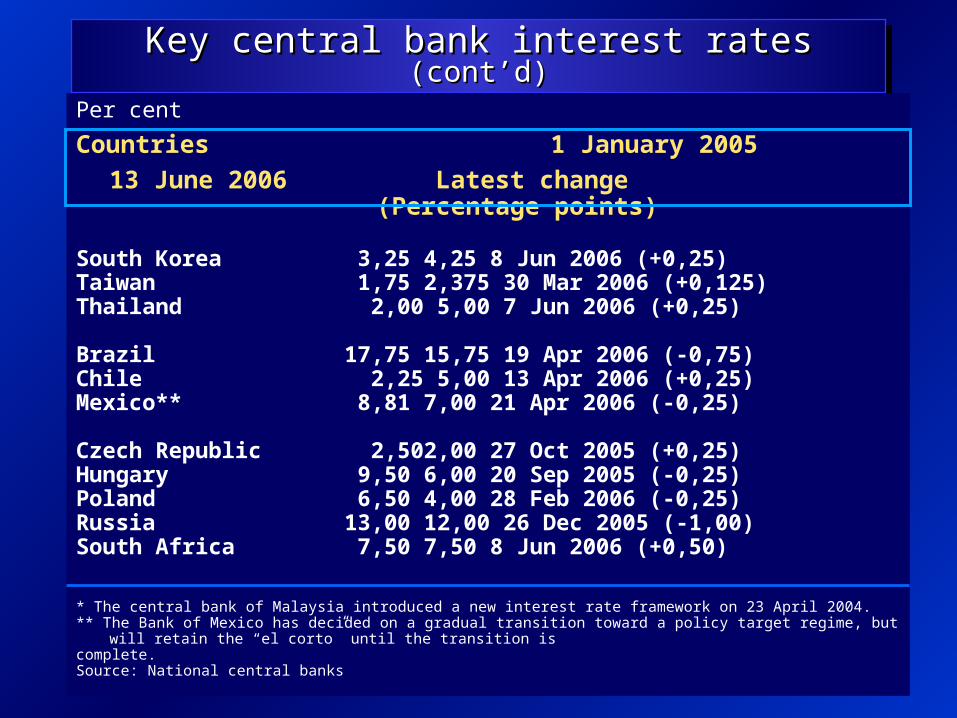
Key central bank interest rates Key central bank interest rates (cont’d)(cont’d)Key central bank interest rates Key central bank interest rates (cont’d)(cont’d)
Per cent
Countries 1 January 2005 13 June 2006 Latest change (Percentage
points)
South Korea 3,25 4,25 8 Jun 2006 (+0,25)Taiwan 1,75 2,375 30 Mar 2006 (+0,125)Thailand 2,00 5,00 7 Jun 2006 (+0,25)
Brazil 17,75 15,75 19 Apr 2006 (-0,75)Chile 2,25 5,00 13 Apr 2006 (+0,25)Mexico** 8,81 7,00 21 Apr 2006 (-0,25)
Czech Republic 2,50 2,00 27 Oct 2005 (+0,25)Hungary 9,50 6,00 20 Sep 2005 (-0,25)Poland 6,50 4,00 28 Feb 2006 (-0,25)Russia 13,00 12,00 26 Dec 2005 (-1,00)South Africa 7,50 7,50 8 Jun 2006 (+0,50)
* The central bank of Malaysia introduced a new interest rate framework on 23 April 2004.** The Bank of Mexico has decided on a gradual transition toward a policy target regime, but will retain the “el corto” until the transition iscomplete.Source: National central banks
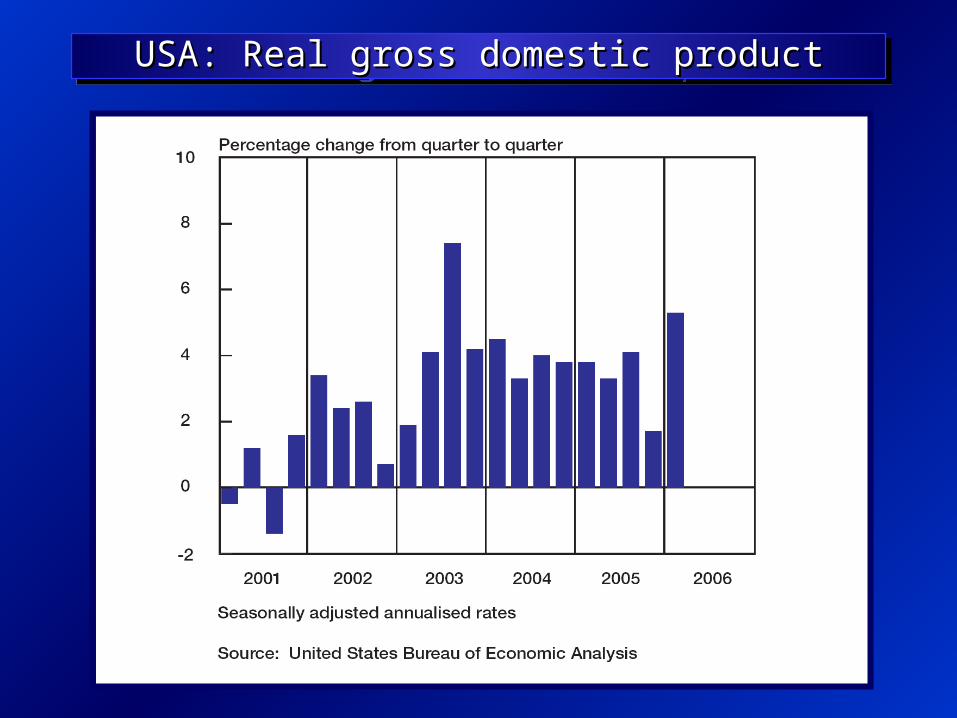
USA: Real gross domestic productUSA: Real gross domestic productUSA: Real gross domestic productUSA: Real gross domestic product
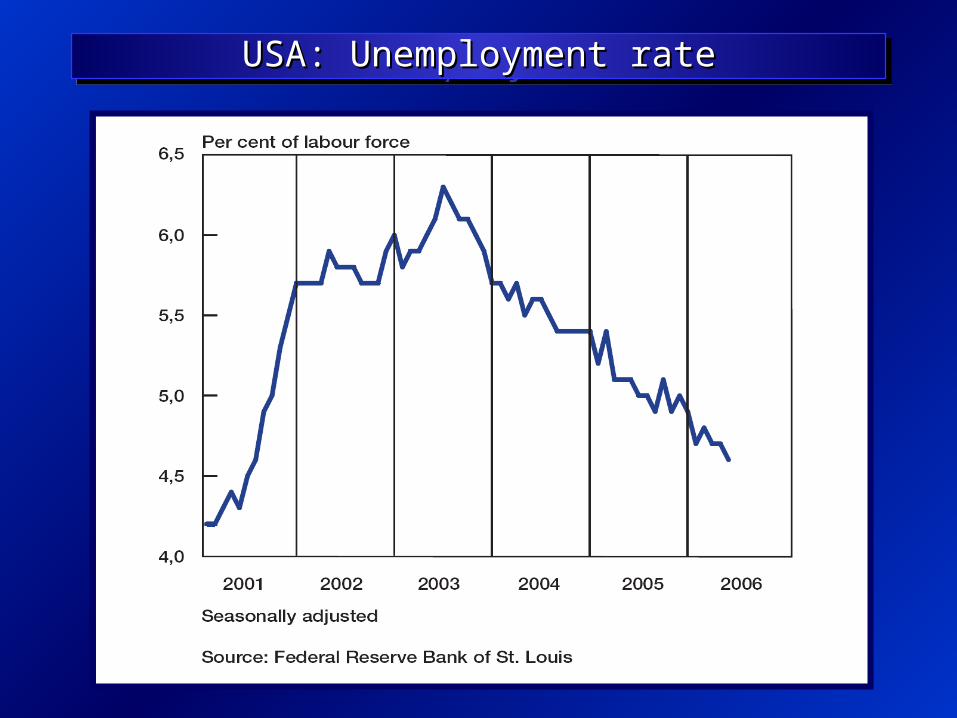
USA: Unemployment rateUSA: Unemployment rateUSA: Unemployment rateUSA: Unemployment rate
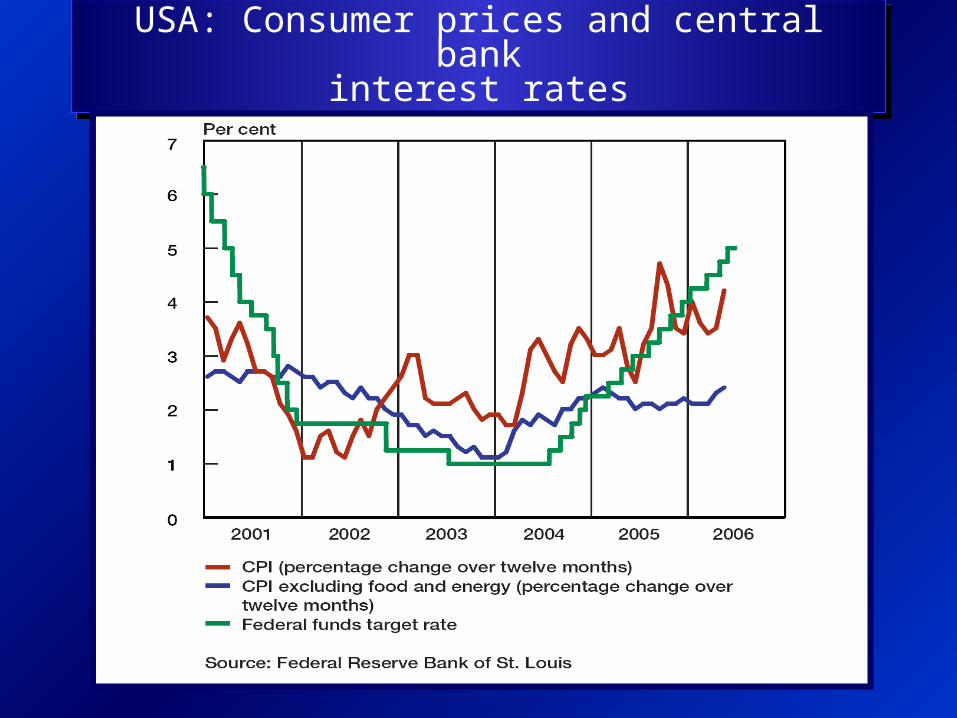
USA: Consumer prices and central bankinterest rates
USA: Consumer prices and central bankinterest rates
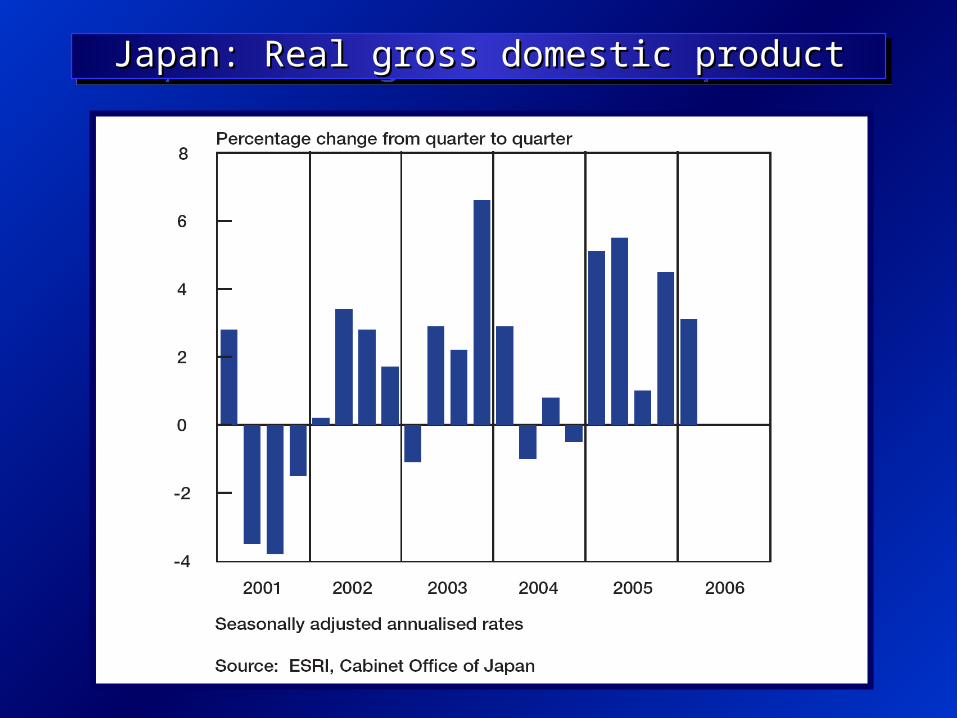
Japan: Real gross domestic productJapan: Real gross domestic productJapan: Real gross domestic productJapan: Real gross domestic product
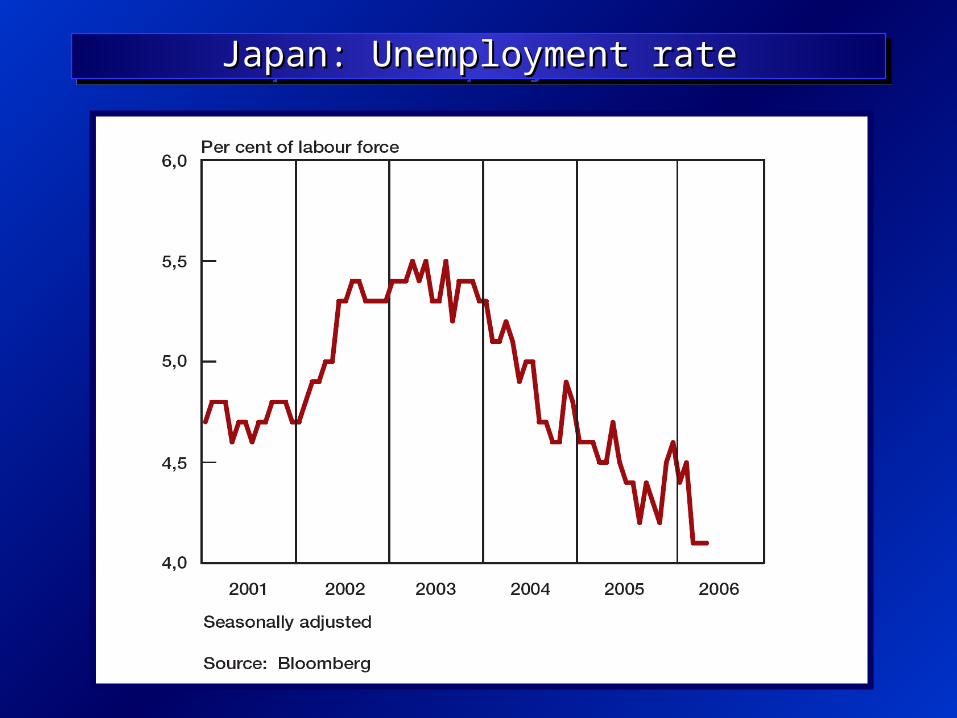
Japan: Unemployment rateJapan: Unemployment rateJapan: Unemployment rateJapan: Unemployment rate

Japan: Consumer pricesJapan: Consumer pricesJapan: Consumer pricesJapan: Consumer prices
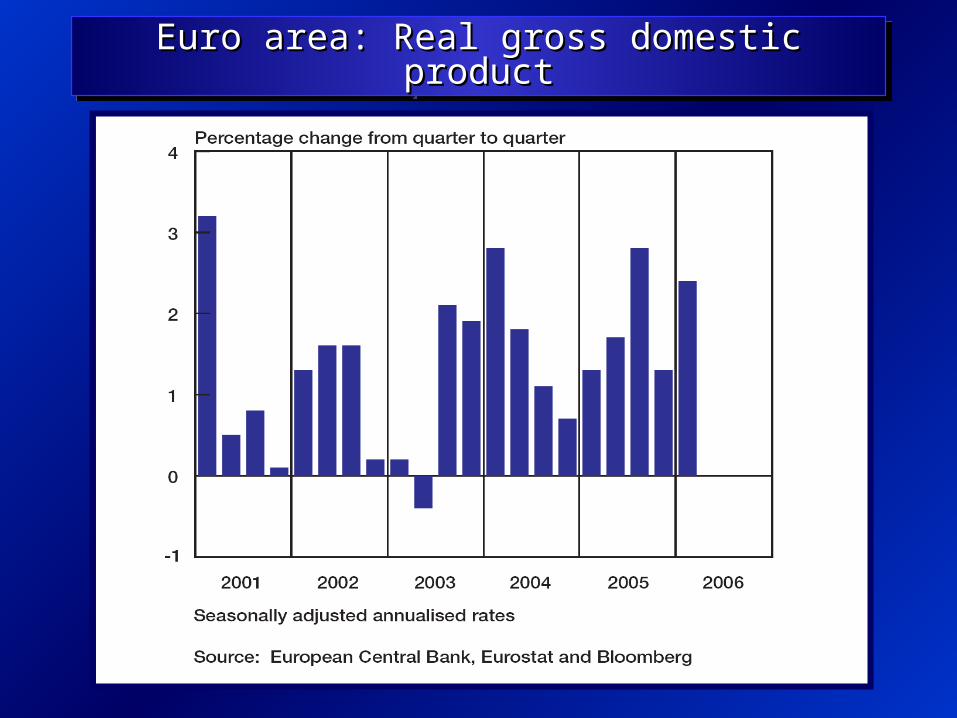
Euro area: Real gross domestic productEuro area: Real gross domestic productEuro area: Real gross domestic productEuro area: Real gross domestic product

Euro area: Unemployment rateEuro area: Unemployment rateEuro area: Unemployment rateEuro area: Unemployment rate

Euro area: Consumer prices and central Euro area: Consumer prices and central bank interest ratebank interest rate
Euro area: Consumer prices and central Euro area: Consumer prices and central bank interest ratebank interest rate
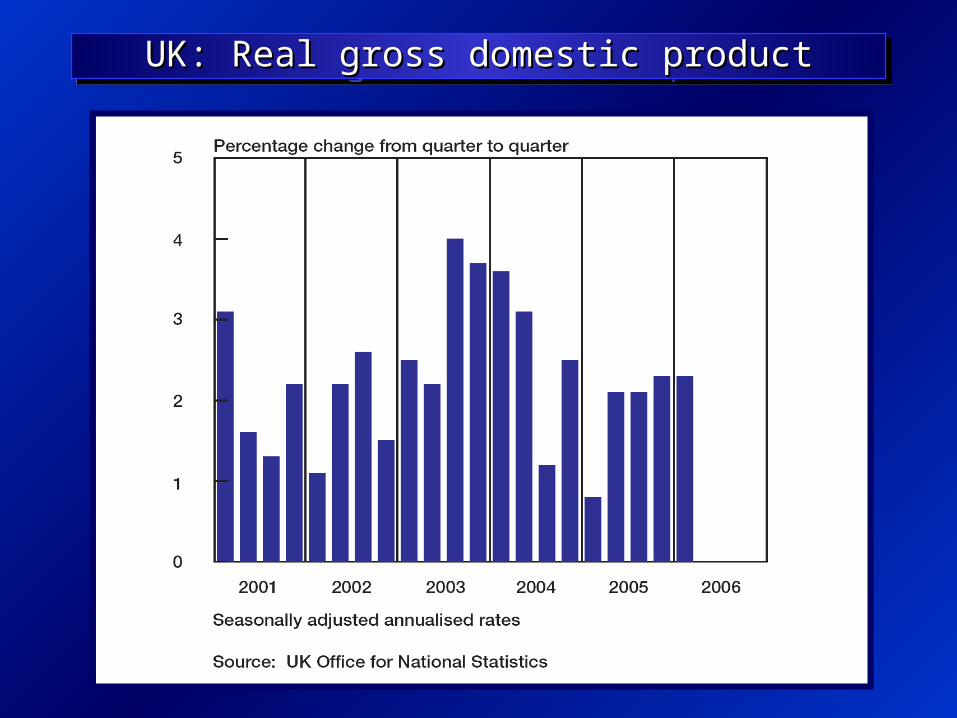
UK: Real gross domestic productUK: Real gross domestic productUK: Real gross domestic productUK: Real gross domestic product

UK: UnemploymentUK: UnemploymentUK: UnemploymentUK: Unemployment

UK: Consumer prices and central bankUK: Consumer prices and central bankinterest rateinterest rate
UK: Consumer prices and central bankUK: Consumer prices and central bankinterest rateinterest rate
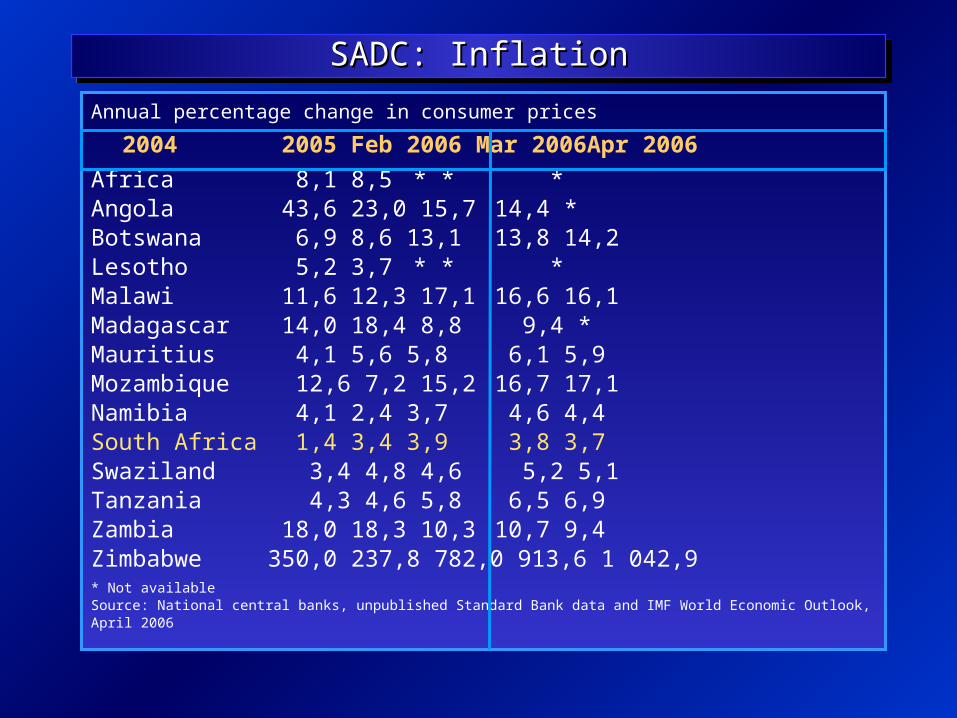
SADC: InflationSADC: InflationSADC: InflationSADC: Inflation
Annual percentage change in consumer prices
2004 2005 Feb 2006 Mar 2006 Apr 2006
Africa 8,1 8,5 * * *Angola 43,6 23,0 15,7 14,4 *Botswana 6,9 8,6 13,1 13,8 14,2Lesotho 5,2 3,7 * * *Malawi 11,6 12,3 17,1 16,6 16,1Madagascar 14,0 18,4 8,8 9,4 *Mauritius 4,1 5,6 5,8 6,1 5,9Mozambique 12,6 7,2 15,2 16,7 17,1Namibia 4,1 2,4 3,7 4,6 4,4South Africa 1,4 3,4 3,9 3,8 3,7Swaziland 3,4 4,8 4,6 5,2 5,1Tanzania 4,3 4,6 5,8 6,5 6,9Zambia 18,0 18,3 10,3 10,7 9,4Zimbabwe 350,0 237,8 782,0 913,6 1 042,9* Not availableSource: National central banks, unpublished Standard Bank data and IMF World Economic Outlook,April 2006

RECENT RECENT ECONOMIC ECONOMIC
DEVELOPMENTDEVELOPMENTSS
National National EconomyEconomy
RECENT RECENT ECONOMIC ECONOMIC
DEVELOPMENTDEVELOPMENTSS
National National EconomyEconomy
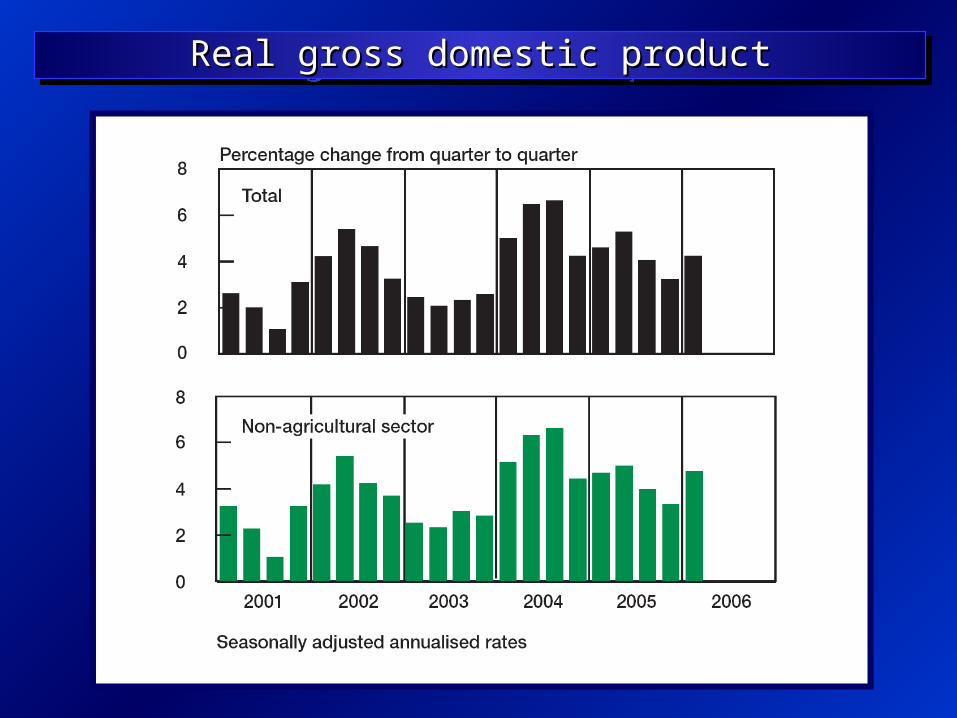
Real gross domestic productReal gross domestic productReal gross domestic productReal gross domestic product
6-year upswing

Real gross domestic product by sectorReal gross domestic product by sectorReal gross domestic product by sectorReal gross domestic product by sector
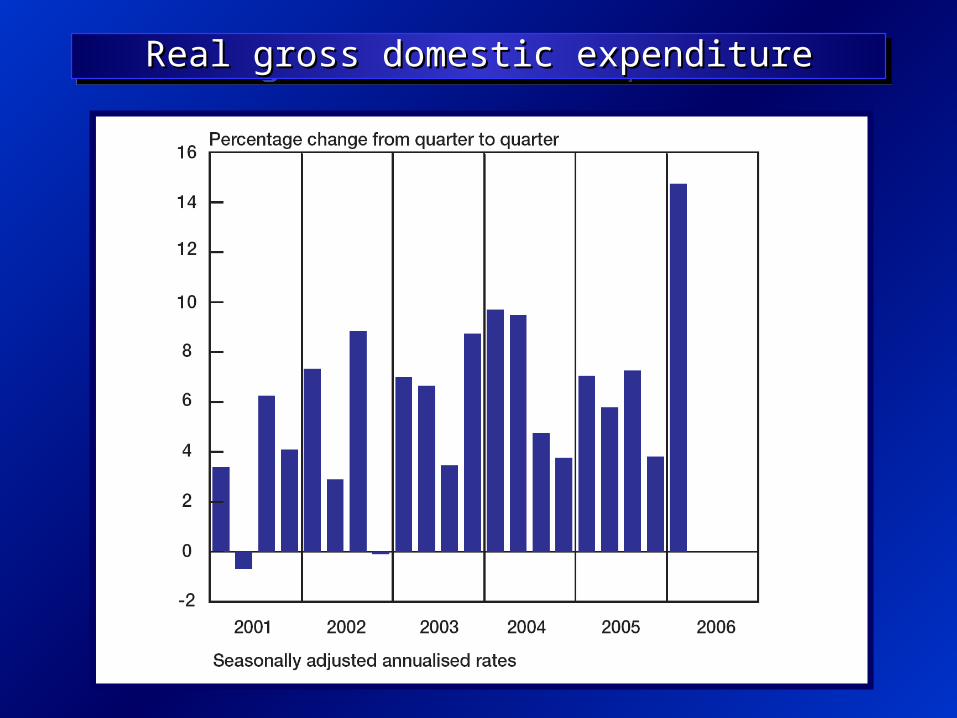
Real gross domestic expenditureReal gross domestic expenditureReal gross domestic expenditureReal gross domestic expenditure
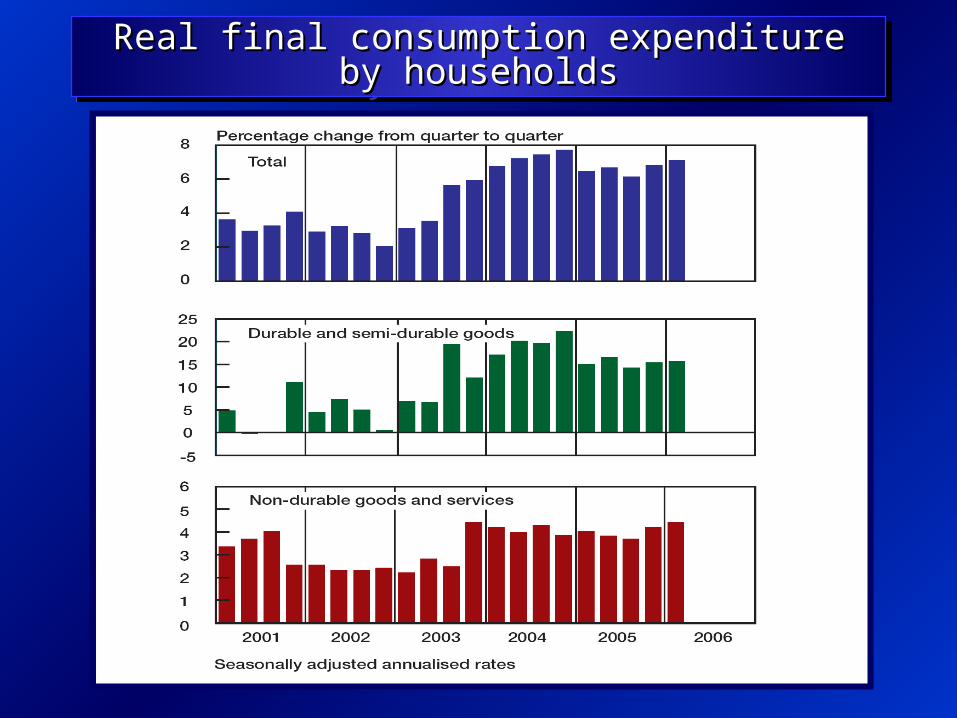
Real final consumption expenditureReal final consumption expenditureby householdsby households
Real final consumption expenditureReal final consumption expenditureby householdsby households
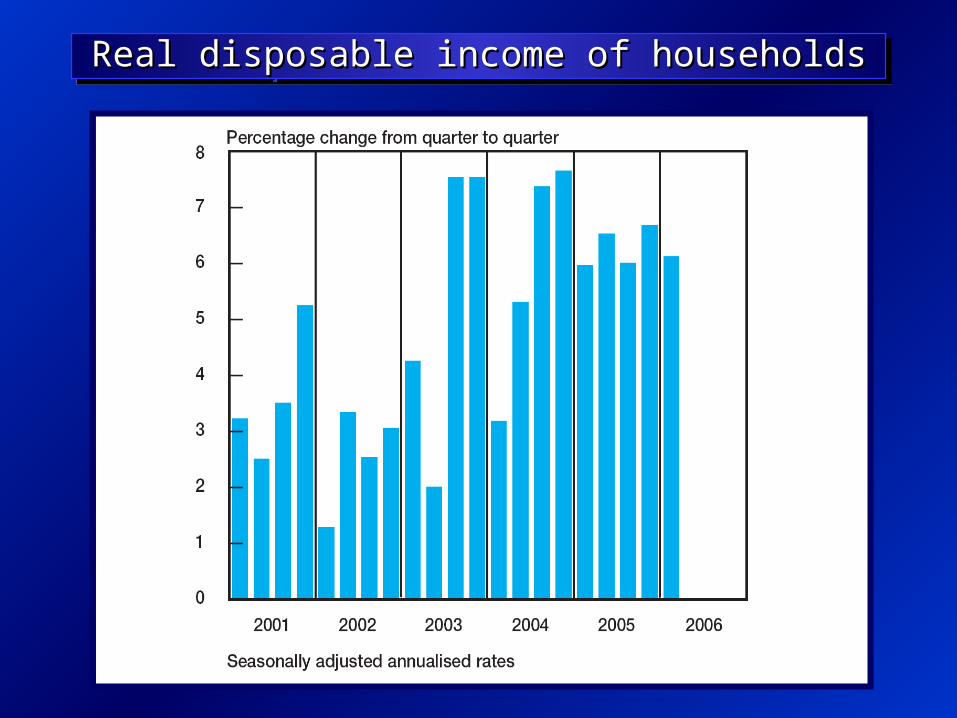
Real disposable income of householdsReal disposable income of householdsReal disposable income of householdsReal disposable income of households
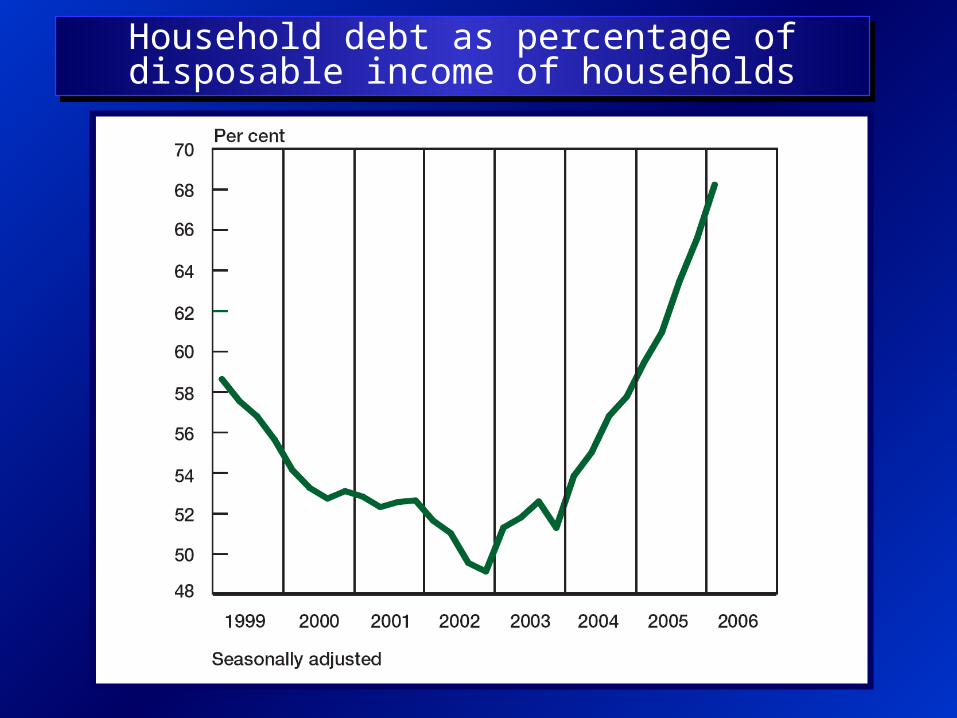
Household debt as percentage of disposable income of households
Household debt as percentage of disposable income of households
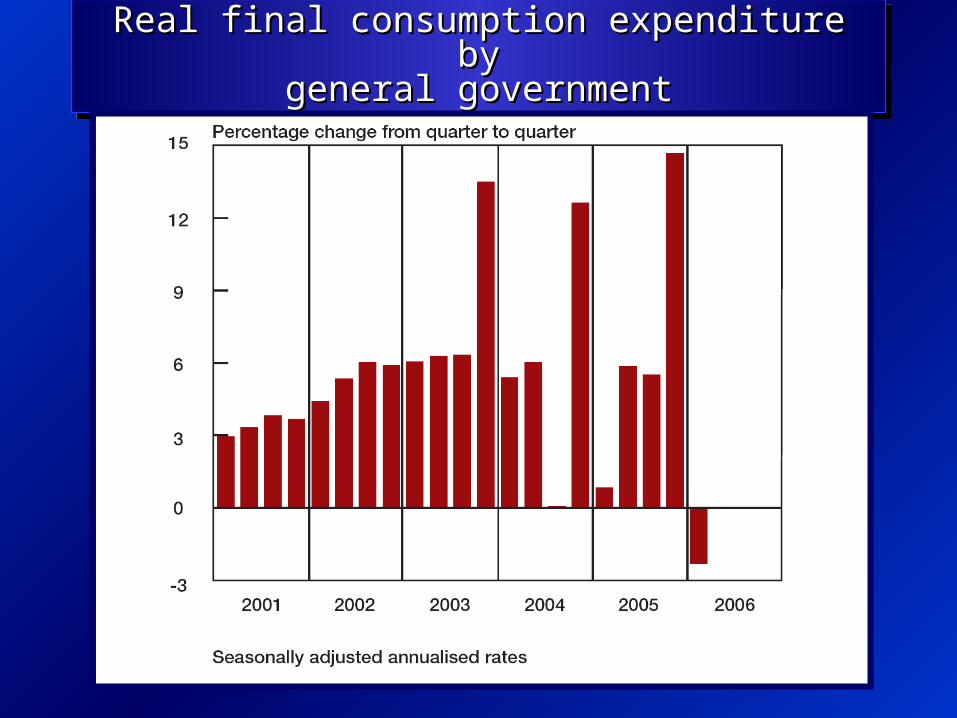
Real final consumption expenditure byReal final consumption expenditure bygeneral governmentgeneral government
Real final consumption expenditure byReal final consumption expenditure bygeneral governmentgeneral government

Real gross fixed capital formationReal gross fixed capital formationReal gross fixed capital formationReal gross fixed capital formation
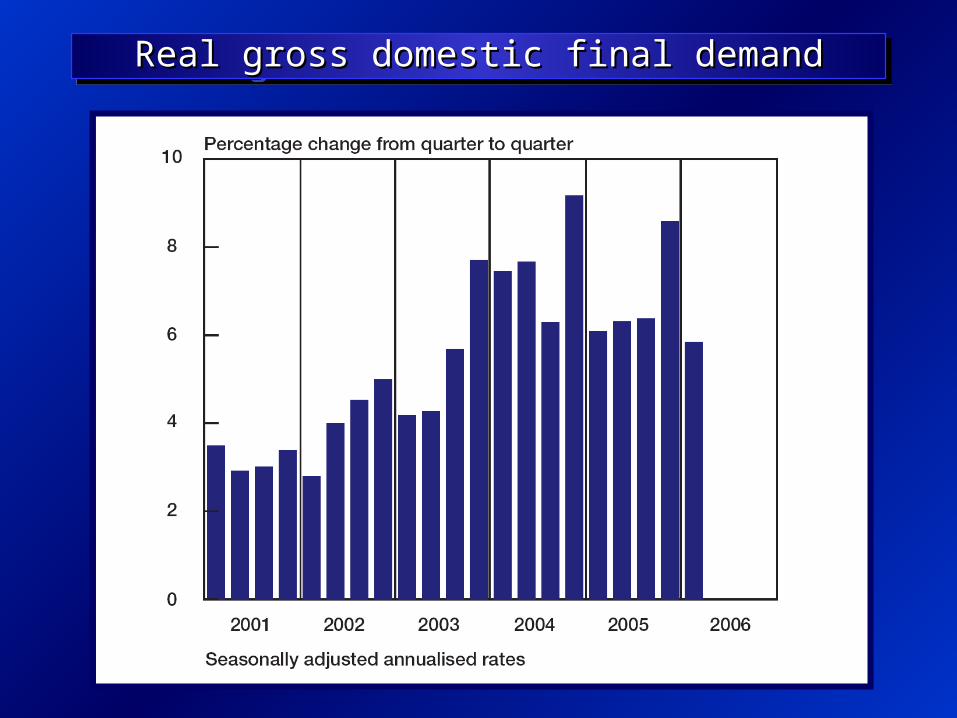
Real gross domestic final demandReal gross domestic final demandReal gross domestic final demandReal gross domestic final demand

Change in inventoriesChange in inventoriesChange in inventoriesChange in inventories
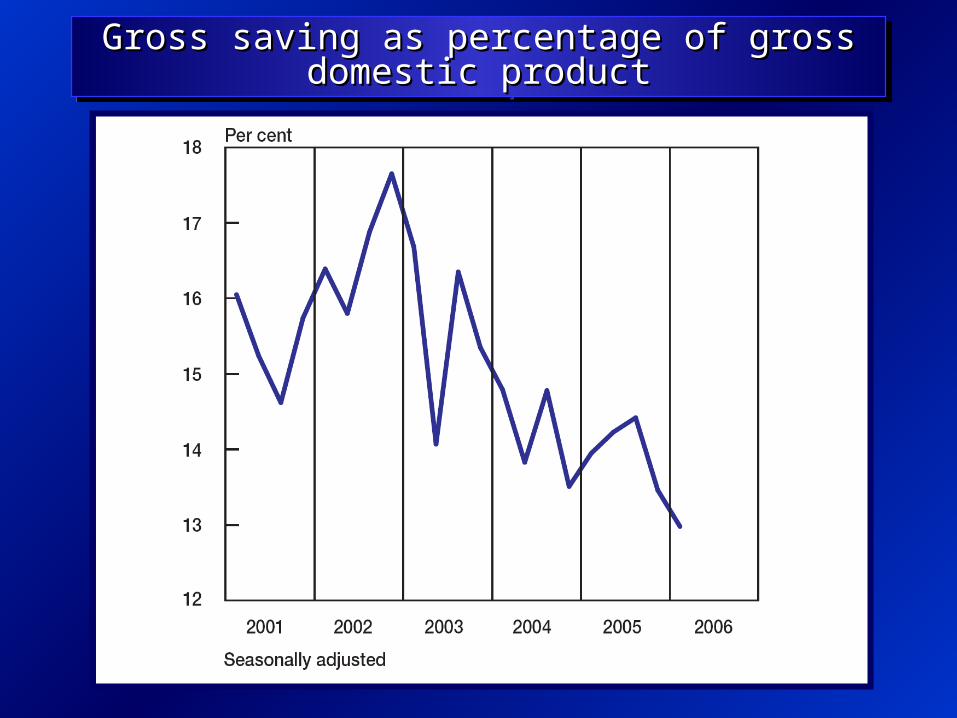
Gross saving as percentage of grossGross saving as percentage of grossdomestic productdomestic product
Gross saving as percentage of grossGross saving as percentage of grossdomestic productdomestic product
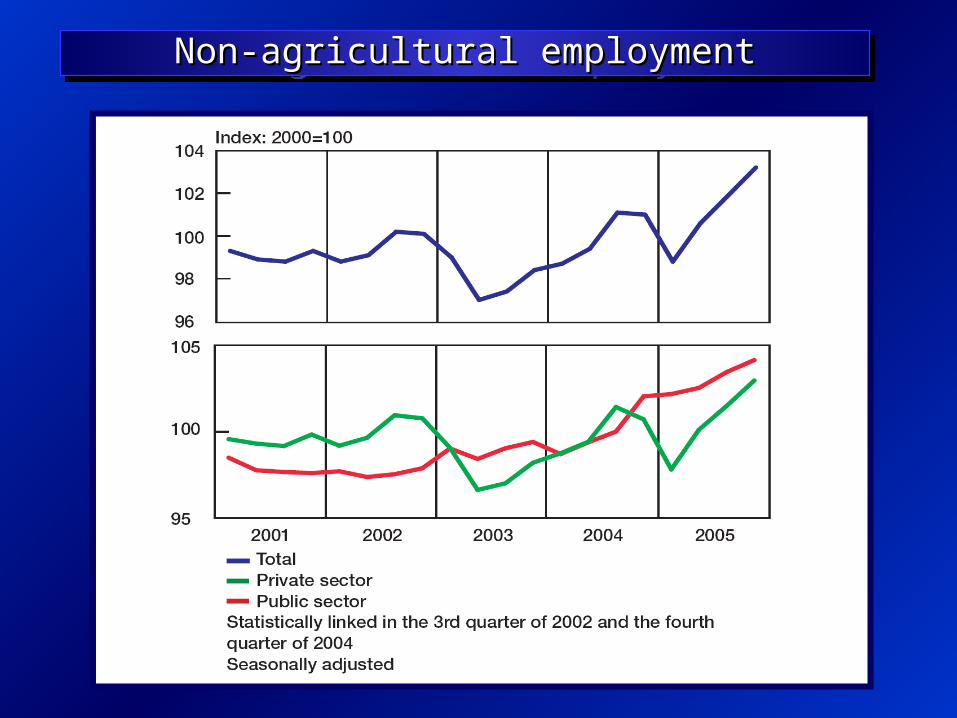
Non-agricultural employmentNon-agricultural employmentNon-agricultural employmentNon-agricultural employment
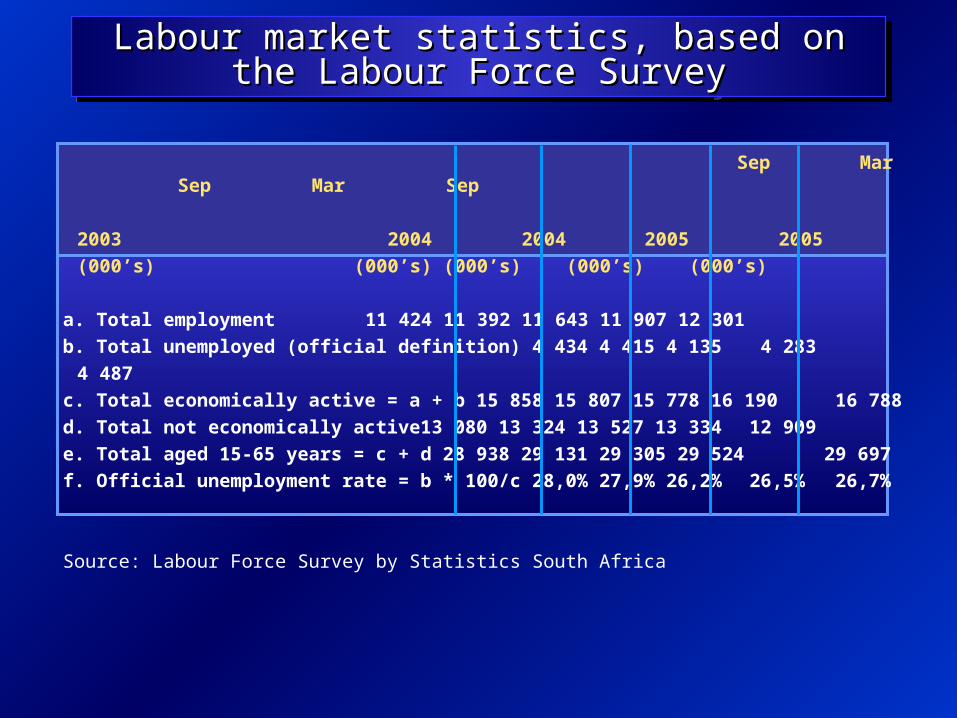
Sep Mar Sep Mar Sep
2003 2004 2004 2005 2005
(000’s) (000’s) (000’s) (000’s) (000’s)
a. Total employment 11 424 11 392 11 643 11 907 12 301
b. Total unemployed (official definition) 4 434 4 415 4 135 4 283 4 487
c. Total economically active = a + b 15 858 15 807 15 778 16 190 16 788
d. Total not economically active 13 080 13 324 13 527 13 334 12 909
e. Total aged 15-65 years = c + d 28 938 29 131 29 305 29 524 29 697
f. Official unemployment rate = b * 100/c 28,0% 27,9% 26,2% 26,5% 26,7%
Source: Labour Force Survey by Statistics South Africa
Labour market statistics, based on the Labour Labour market statistics, based on the Labour Force SurveyForce Survey
Labour market statistics, based on the Labour Labour market statistics, based on the Labour Force SurveyForce Survey

Non-agricultural nominal remunerationNon-agricultural nominal remunerationper workerper worker
Non-agricultural nominal remunerationNon-agricultural nominal remunerationper workerper worker

Non-agricultural labour productivityNon-agricultural labour productivityNon-agricultural labour productivityNon-agricultural labour productivity
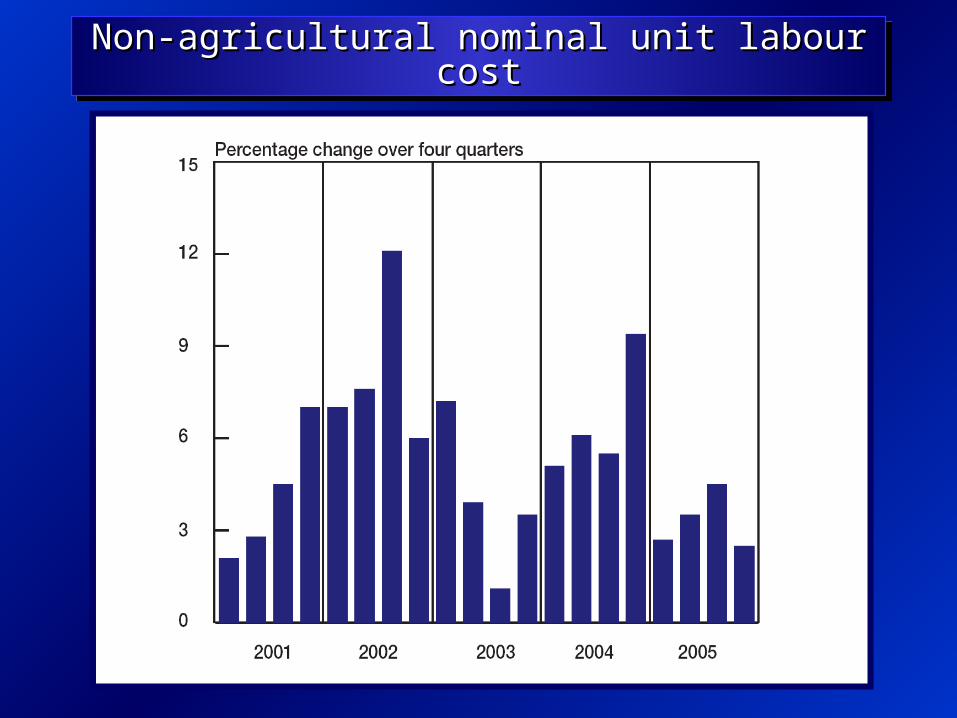
Non-agricultural nominal unit labour costNon-agricultural nominal unit labour costNon-agricultural nominal unit labour costNon-agricultural nominal unit labour cost

Nominal unit labour cost in manufacturingNominal unit labour cost in manufacturingNominal unit labour cost in manufacturingNominal unit labour cost in manufacturing

Headline inflation and CPIXHeadline inflation and CPIXHeadline inflation and CPIXHeadline inflation and CPIX

All-goods production pricesAll-goods production pricesAll-goods production pricesAll-goods production prices

Balance of payments: Current accountBalance of payments: Current account
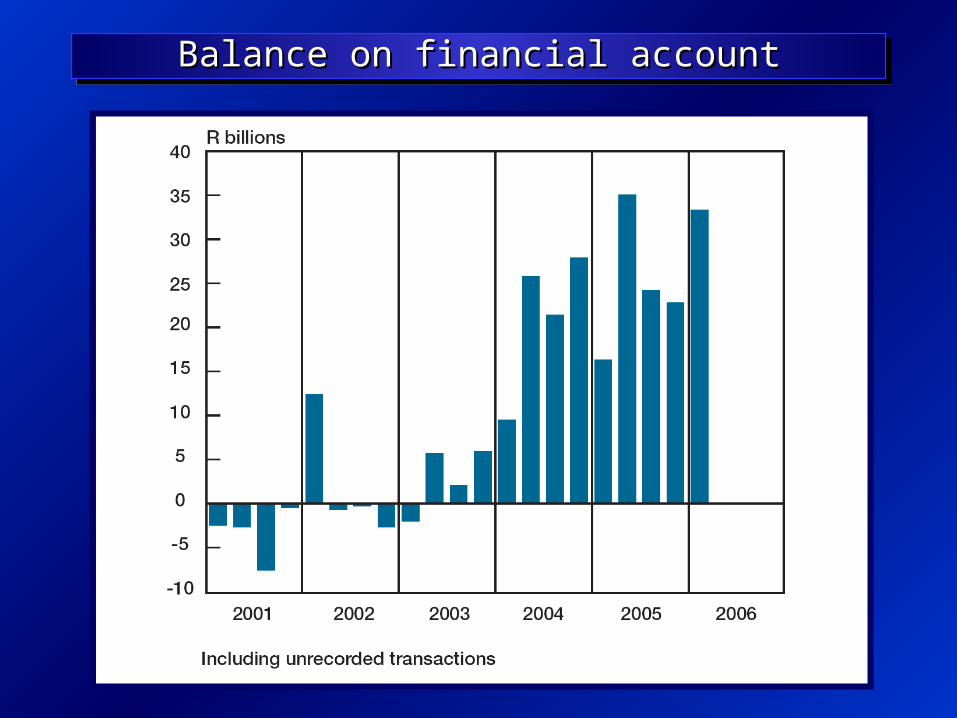
Balance on financial accountBalance on financial accountBalance on financial accountBalance on financial account
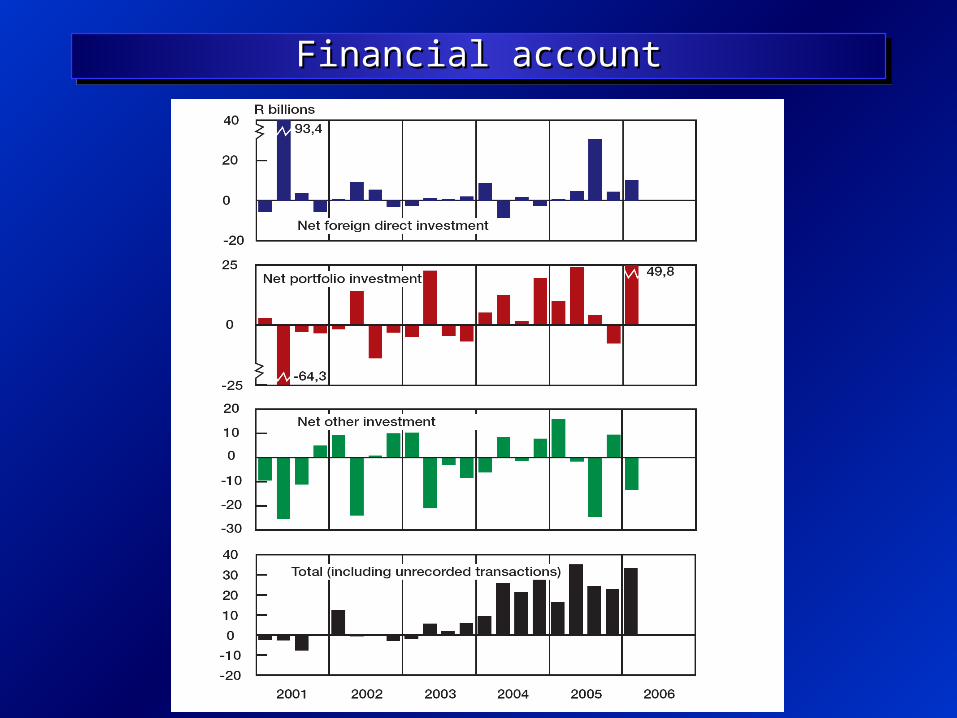
Financial accountFinancial accountFinancial accountFinancial account
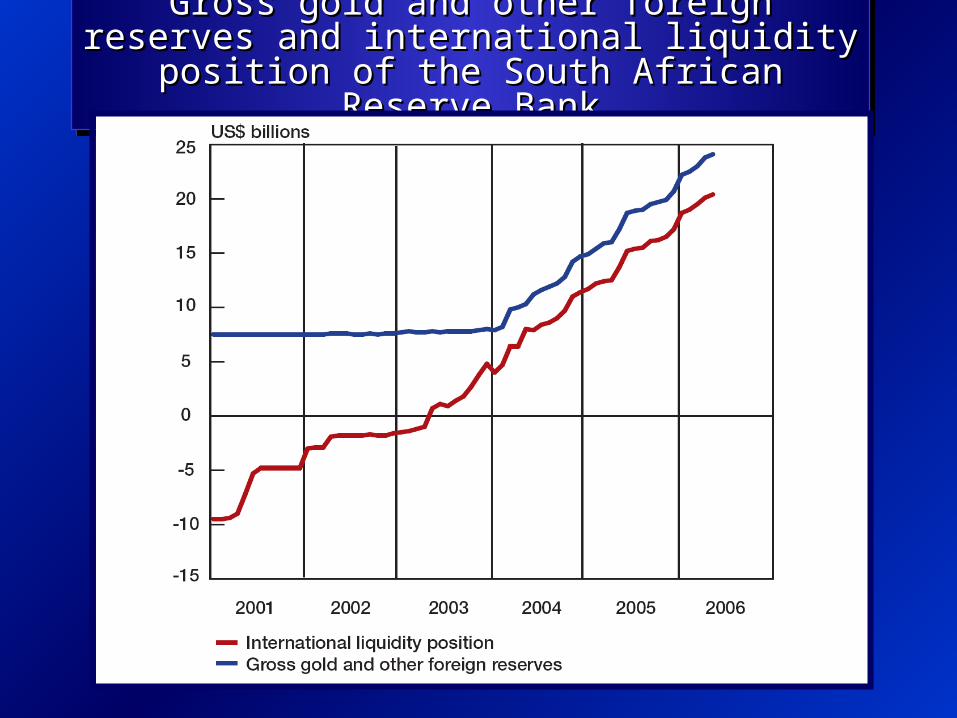
Gross gold and other foreign reserves and international Gross gold and other foreign reserves and international liquidity position of the South African Reserve Bankliquidity position of the South African Reserve Bank
Gross gold and other foreign reserves and international Gross gold and other foreign reserves and international liquidity position of the South African Reserve Bankliquidity position of the South African Reserve Bank
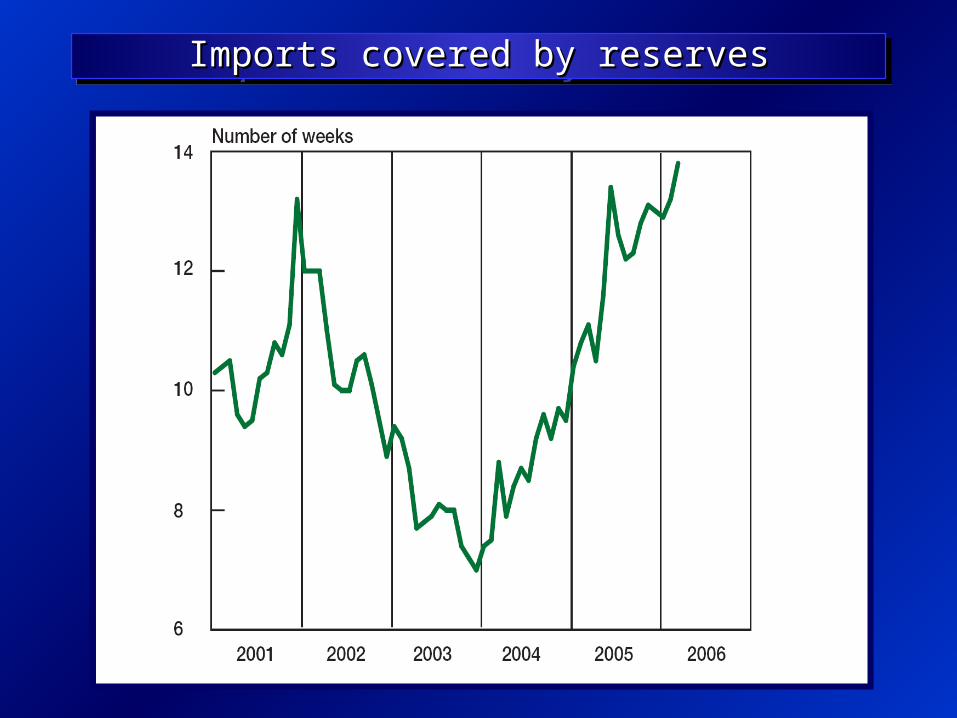
Imports covered by reservesImports covered by reservesImports covered by reservesImports covered by reserves

Average net daily turnover in the SouthAverage net daily turnover in the SouthAfrican foreign exchange marketAfrican foreign exchange market
Average net daily turnover in the SouthAverage net daily turnover in the SouthAfrican foreign exchange marketAfrican foreign exchange market

Exchange rates of the randExchange rates of the randExchange rates of the randExchange rates of the rand

Growth in M3Growth in M3Growth in M3Growth in M3

Total loans and advances extended toTotal loans and advances extended toprivate sectorprivate sector
Total loans and advances extended toTotal loans and advances extended toprivate sectorprivate sector

Money-market interest ratesMoney-market interest ratesMoney-market interest ratesMoney-market interest rates

Yield on long-term government bondsYield on long-term government bondsYield on long-term government bondsYield on long-term government bonds
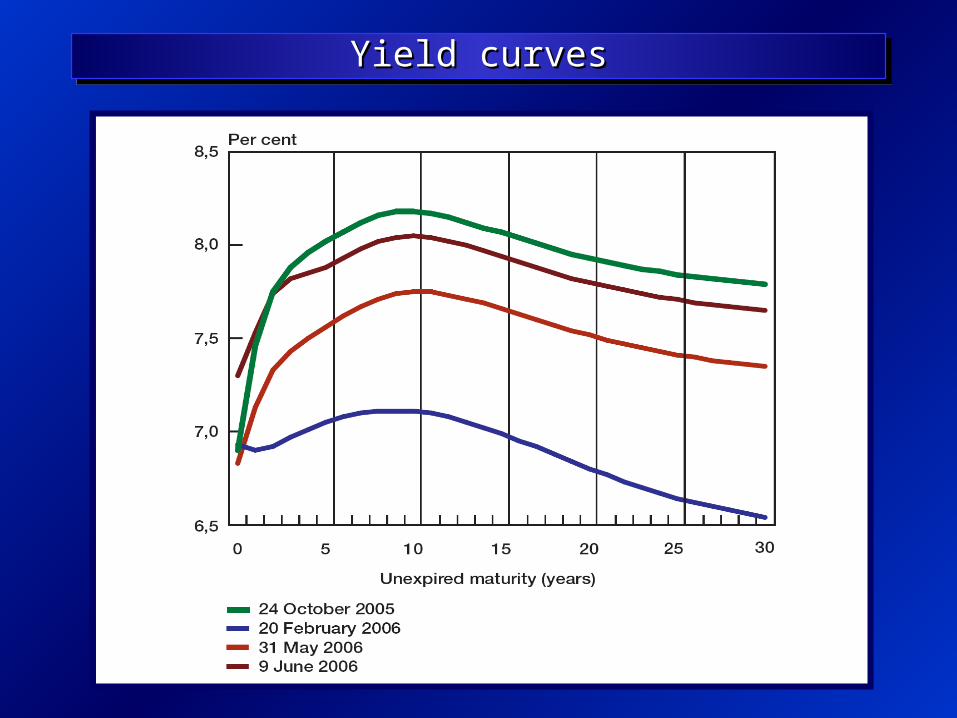
Yield curvesYield curvesYield curvesYield curves
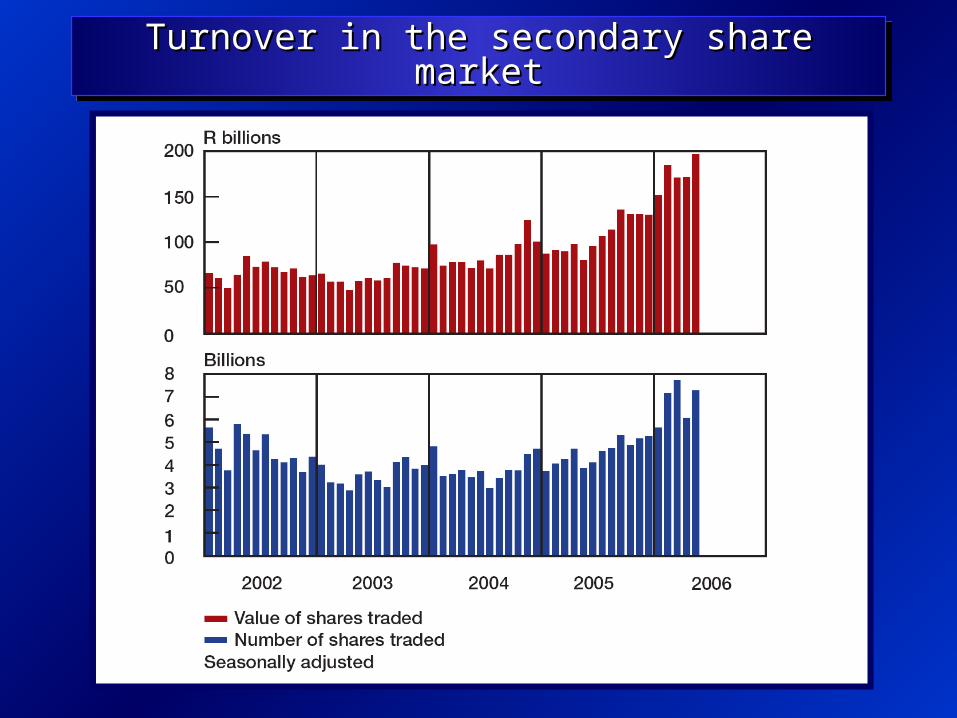
Turnover in the secondary share marketTurnover in the secondary share marketTurnover in the secondary share marketTurnover in the secondary share market
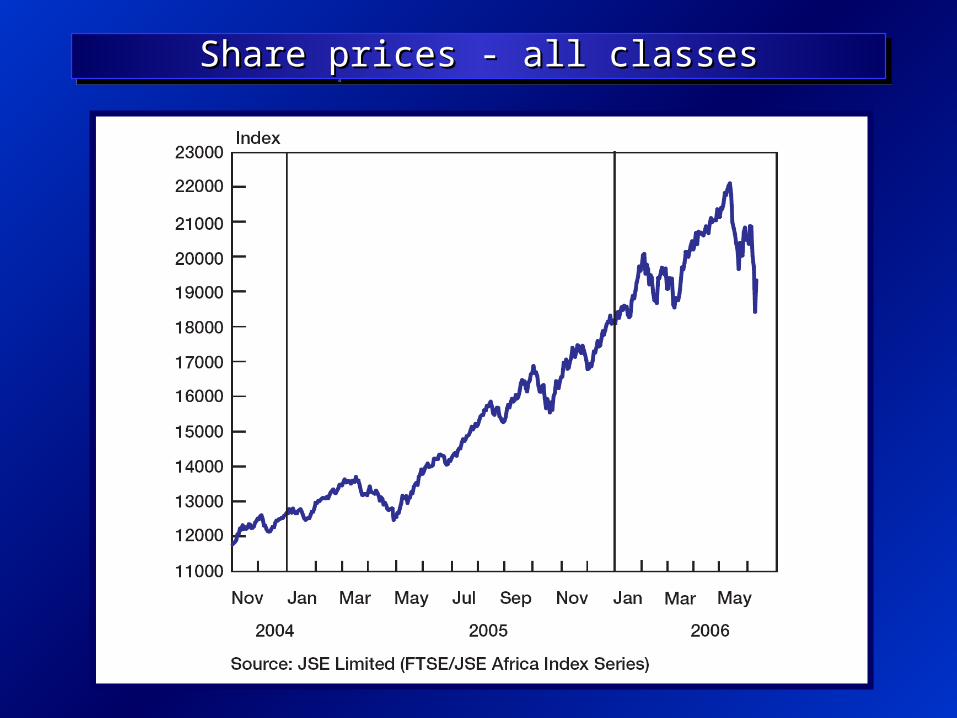
Share prices - all classesShare prices - all classesShare prices - all classesShare prices - all classes
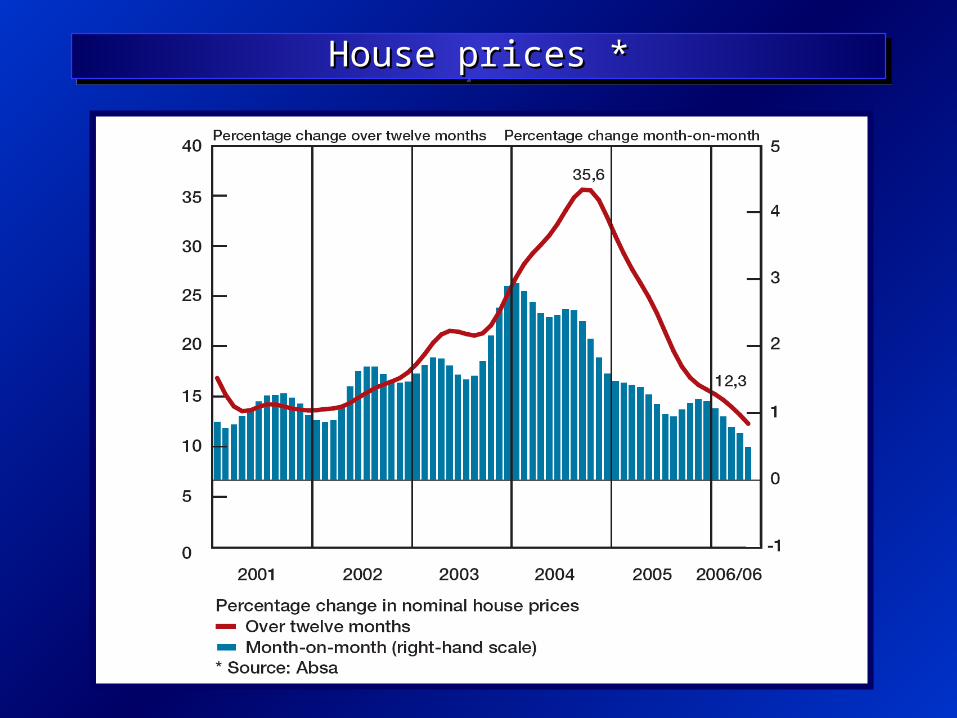
House prices *House prices *House prices *House prices *
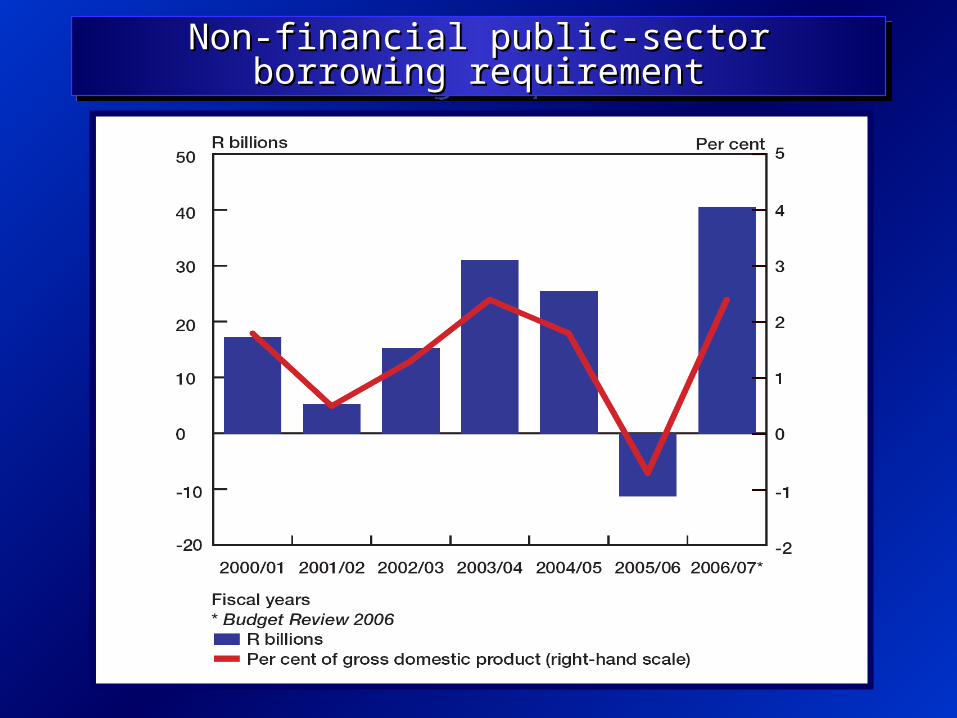
Non-financial public-sector borrowing requirementNon-financial public-sector borrowing requirementNon-financial public-sector borrowing requirementNon-financial public-sector borrowing requirement

Related Documents


