Portable Microfluidic Integrated Plasmonic Platform for Pathogen Detection Onur Tokel 1 *, Umit Hakan Yildiz 2 *, Fatih Inci 2 , Naside Gozde Durmus 3,4 , Okan Oner Ekiz 5 , Burak Turker 5 , Can Cetin 1 , Shruthi Rao 1 , Kaushik Sridhar 1 , Nalini Natarajan 1 , Hadi Shafiee 1 , Aykutlu Dana 5 & Utkan Demirci 1,2 1 Demirci Bio-Acoustic-MEMS in Medicine (BAMM) Laboratory, Center for Biomedical Engineering, Department of Medicine, Brigham and Women’s Hospital, Harvard Medical School, Boston, MA, USA, 2 Demirci Bio-Acoustic-MEMS in Medicine (BAMM) Laboratory, Stanford University School of Medicine, Canary Center at Stanford for Cancer Early Detection, Palo Alto, CA, USA, 3 Department of Biochemistry, Stanford School of Medicine, Stanford, CA, USA, 4 Stanford Genome Technology Center, Stanford University, Palo Alto, CA, USA, 5 UNAM Institute of Materials Science and Nanotechnology, Bilkent University, 06800 Ankara, Turkey. Timely detection of infectious agents is critical in early diagnosis and treatment of infectious diseases. Conventional pathogen detection methods, such as enzyme linked immunosorbent assay (ELISA), culturing or polymerase chain reaction (PCR) require long assay times, and complex and expensive instruments, which are not adaptable to point-of-care (POC) needs at resource-constrained as well as primary care settings. Therefore, there is an unmet need to develop simple, rapid, and accurate methods for detection of pathogens at the POC. Here, we present a portable, multiplex, inexpensive microfluidic-integrated surface plasmon resonance (SPR) platform that detects and quantifies bacteria, i.e., Escherichia coli (E. coli) and Staphylococcus aureus (S. aureus) rapidly. The platform presented reliable capture and detection of E. coli at concentrations ranging from ,10 5 to 3.2 3 10 7 CFUs/mL in phosphate buffered saline (PBS) and peritoneal dialysis (PD) fluid. The multiplexing and specificity capability of the platform was also tested with S. aureus samples. The presented platform technology could potentially be applicable to capture and detect other pathogens at the POC and primary care settings. E merging micro- and nano-scale bioengineering and biomedical technologies have provided broad applica- tions (e.g., medical diagnostics and biosensors) in health sciences. Developing such platforms that are affordable and rapid for infectious diseases is one of the top priorities for improving human health at the point-of-care (POC) settings 1–4 . Currently, the standard testing for pathogen detection and quantification are based on cell culture methods, which take 48 to 72 hours 5–7 . Other detection methods such as polymerase chain reaction (PCR) and enzyme linked immunosorbent assay (ELISA), have been widely used to detect and quantify pathogens with high sensitivity and specificity 8 . However, they require expensive equipment and well-trained operators. Additionally, these assays are technically complex and need labor-intensive processing steps. Thus, rapid and inexpensive diagnostic methods are needed that will eliminate peripheral instrumentation and allow to deploy them to the POC. With the ongoing miniaturization in electronics, emerging technologies could allow portable instruments and minimize the need for bulky laboratory infrastructure at the POC and primary care settings 9 . Such self-contained and robust diagnostic devices could also lead to developing strategies for disease monitoring and management 10 . Microfluidics, being at the convergence of micro/nanoscale engineering, materials science, and biology enables medical solutions for infectious disease diagnostics and monitoring 11 . Microfluidic technologies have been used to manipulate microliter sample volumes and minimize reagent costs in several applications including cryobio- logy, genetic and proteomic analysis controlling cancer microenvironment, and cell capture and cell release studies 11–17 . In particular, analysis of bioagents (e.g., pathogens and infectious agents) is possible with microfluidic technologies. For instance, capture and detection of intact viruses on microchips have been demonstrated 18 . Microfluidic based diagnostic technologies have various characteristics, such as inexpensive fabrication, adapt- ability and rapid results 19–21 . Integrating microfluidic platforms with optical imaging systems combines the advantages of lab-chip platforms with the benefits of optical technologies 22,23 . In particular, photonics and OPEN SUBJECT AREAS: NANOBIOTECHNOLOGY HEALTH CARE BIOTECHNOLOGY Received 4 November 2013 Accepted 26 January 2015 Published 24 March 2015 Correspondence and requests for materials should be addressed to U.D. (utkan@stanford. edu) or A.D. (aykutlu@ fen.bilkent.edu.tr) * These authors contributed equally to this work. SCIENTIFIC REPORTS | 5 : 9152 | DOI: 10.1038/srep09152 1

Welcome message from author
This document is posted to help you gain knowledge. Please leave a comment to let me know what you think about it! Share it to your friends and learn new things together.
Transcript
Portable Microfluidic IntegratedPlasmonic Platform for PathogenDetectionOnur Tokel1*, Umit Hakan Yildiz2*, Fatih Inci2, Naside Gozde Durmus3,4, Okan Oner Ekiz5, Burak Turker5,Can Cetin1, Shruthi Rao1, Kaushik Sridhar1, Nalini Natarajan1, Hadi Shafiee1, Aykutlu Dana5
& Utkan Demirci1,2
1Demirci Bio-Acoustic-MEMS in Medicine (BAMM) Laboratory, Center for Biomedical Engineering, Department of Medicine, Brighamand Women’s Hospital, Harvard Medical School, Boston, MA, USA, 2Demirci Bio-Acoustic-MEMS in Medicine (BAMM) Laboratory,Stanford University School of Medicine, Canary Center at Stanford for Cancer Early Detection, Palo Alto, CA, USA, 3Department ofBiochemistry, Stanford School of Medicine, Stanford, CA, USA, 4Stanford Genome Technology Center, Stanford University, Palo Alto,CA, USA, 5UNAM Institute of Materials Science and Nanotechnology, Bilkent University, 06800 Ankara, Turkey.
Timely detection of infectious agents is critical in early diagnosis and treatment of infectious diseases.Conventional pathogen detection methods, such as enzyme linked immunosorbent assay (ELISA), culturingor polymerase chain reaction (PCR) require long assay times, and complex and expensive instruments,which are not adaptable to point-of-care (POC) needs at resource-constrained as well as primary caresettings. Therefore, there is an unmet need to develop simple, rapid, and accurate methods for detection ofpathogens at the POC. Here, we present a portable, multiplex, inexpensive microfluidic-integrated surfaceplasmon resonance (SPR) platform that detects and quantifies bacteria, i.e., Escherichia coli (E. coli) andStaphylococcus aureus (S. aureus) rapidly. The platform presented reliable capture and detection of E. coli atconcentrations ranging from ,105 to 3.2 3 107 CFUs/mL in phosphate buffered saline (PBS) and peritonealdialysis (PD) fluid. The multiplexing and specificity capability of the platform was also tested with S. aureussamples. The presented platform technology could potentially be applicable to capture and detect otherpathogens at the POC and primary care settings.
Emerging micro- and nano-scale bioengineering and biomedical technologies have provided broad applica-tions (e.g., medical diagnostics and biosensors) in health sciences. Developing such platforms that areaffordable and rapid for infectious diseases is one of the top priorities for improving human health at
the point-of-care (POC) settings1–4. Currently, the standard testing for pathogen detection and quantification arebased on cell culture methods, which take 48 to 72 hours5–7. Other detection methods such as polymerase chainreaction (PCR) and enzyme linked immunosorbent assay (ELISA), have been widely used to detect and quantifypathogens with high sensitivity and specificity8. However, they require expensive equipment and well-trainedoperators. Additionally, these assays are technically complex and need labor-intensive processing steps. Thus,rapid and inexpensive diagnostic methods are needed that will eliminate peripheral instrumentation and allow todeploy them to the POC. With the ongoing miniaturization in electronics, emerging technologies could allowportable instruments and minimize the need for bulky laboratory infrastructure at the POC and primary caresettings9. Such self-contained and robust diagnostic devices could also lead to developing strategies for diseasemonitoring and management10.
Microfluidics, being at the convergence of micro/nanoscale engineering, materials science, and biology enablesmedical solutions for infectious disease diagnostics and monitoring11. Microfluidic technologies have been usedto manipulate microliter sample volumes and minimize reagent costs in several applications including cryobio-logy, genetic and proteomic analysis controlling cancer microenvironment, and cell capture and cell releasestudies11–17. In particular, analysis of bioagents (e.g., pathogens and infectious agents) is possible with microfluidictechnologies. For instance, capture and detection of intact viruses on microchips have been demonstrated18.Microfluidic based diagnostic technologies have various characteristics, such as inexpensive fabrication, adapt-ability and rapid results19–21. Integrating microfluidic platforms with optical imaging systems combines theadvantages of lab-chip platforms with the benefits of optical technologies22,23. In particular, photonics and
OPEN
SUBJECT AREAS:NANOBIOTECHNOLOGY
HEALTH CARE
BIOTECHNOLOGY
Received4 November 2013
Accepted26 January 2015
Published24 March 2015
Correspondence andrequests for materials
should be addressed toU.D. ([email protected]) or A.D. (aykutlu@
fen.bilkent.edu.tr)
* These authorscontributed equally to
this work.
SCIENTIFIC REPORTS | 5 : 9152 | DOI: 10.1038/srep09152 1

plasmonics, e.g., surface plasmon resonance (SPR), localized surfaceplasmon resonance (LSPR) and nanostructured photonic crystals,being at the intersection of nanotechnology and optics, can be usedfor developing reliable, accurate, easy-to-use biosensor plat-forms24–28. Plasmonic lab-chip devices could be constructed asaffordable platforms by utilizing single-use, disposable microchipsfor POC testing. In addition, disease specificity could be attained byusing various surface functionalization techniques. In plasmonicsensor technologies, for instance SPR platforms, a biomolecularrecognition element is immobilized on metal surfaces (e.g., gold,silver) for efficient, specific and selective capture of bioagents. Thelimit of detection of SPR-based detection systems are affected byfactors including the target immobilization method (by affectingthe affinity), sample volume and transport properties (by affectingthe probability of capturing the target), the refractive index of thetarget, and practical device parameters25,29,30. Microfluidics helps tohandle small sample volumes that affects overall sensor performanceand capture kinetics31.
Here, we present such a microfluidic-based SPR technology. Wevalidated this portable platform with Escherichia coli (E. coli) andStaphylococcus aureus (S. aureus) spiked samples as a model patho-gen detection system. Disposable microfluidic chips with gold coatedsurfaces were functionalized with antibodies for efficient, selectiveand specific capture of E. coli and S. aureus. We quantified the cap-tured E. coli with brightfield and fluorescence imaging, and analyzedthe capture distribution spatially along the microchannels. Limit ofdetection of the platform was evaluated, and standard curves weregenerated for E. coli spiked in phosphate buffered saline (PBS) andperitoneal dialysis (PD) fluid. Multiplexing and selectivity capabilitywas also assessed with S. aureus spiked in PBS samples.
MethodsDesign and fabrication of microfluidic chips. The microfluidic chip designcomprises a single microchannel with an inlet and an outlet port. The microchip withdimensions 31 mm 3 57 mm 3 7 mm was constructed as a cartridge for theplatform. Two PMMA (poly methyl methacrylate) (3.0 mm thick; McMaster Carr,Atlanta, GA) layers were assembled using a layer of double sided adhesive (DSA,50 mm thick; iTapestore, Scotch Plains, NJ). A second DSA layer (50 mm thick) and agold coated substrate formed the microchannel. The microchannel (12 mm 3 7 mm3 50 mm) was located in the center of the microchip. The PMMA-DSA-PMMA-DSA-gold chip was assembled as a single use, disposable microchip (Figure 1 and S1).To fabricate the chip, the PMMA and DSA were cut using a laser cutter (VersaLaserTM, Scottsdale, AZ). The two PMMA layers were assembled with a layer of DSA.Two openings were cut on the PMMA layer (0.7 mm diameter) that formed the inletand outlet ports. The distance between these ports was 9 mm. The port openings withdiameters of 1.4 mm in DSA allowed fluid transfer without interruption. A secondDSA layer formed a microchannel in the center of the microchip with a channelvolume of 4 mL. The design of the microchannel included sharp-edged ends. Finally, agold chip of dimensions 1.4 cm 3 1.4 cm was mounted onto the microchip. Themicrochip design allows future extension of functionality, for instance byincorporating a filter to isolate cells, such as white or red blood cells as shown before32.
Design and fabrication of gold coated glass surfaces. To realize disposablemicrofluidic chips, glass wafers (Borofloat, Double Side Polished, diameter 5
100 mm, t 5 0.5 mm) were purchased from University Wafer, Boston, MA (Item517), and were cleaned with acetone and isopropyl alcohol on the spinner cleaninginstrument (Headway PWM-32 Spinner). Then, the wafers were loaded on thesample holders of an electron beam depositor (Denton E-beam Evaporator) for metaldeposition. The system was operated at 1027 Torr, and the wafers were deposited with5 nm of titanium, followed by a 50 nm deposition of gold on a single side.Subsequently, the metal coated wafers were spin coated with a , 0.5 mm layer ofS1805 photoresist (Shipley 1800-series photoresist) to protect the surface of the goldlayer from environmental effects. The spinner was run at 4000 rpm for 40 seconds,and later, baked at 115uC on a hot-plate for 2 minutes. The wafers were cut in 1.4 cm3 1.4 cm square chips using a mechanical dicer (DISCO DAD321 Dicing Saw) andstored after cleaning with distilled water. Before microfluidic chip fabrication, thegold chips were cleaned with solvents to remove any organic residues from thefabrication process. In a solvent bench, chips were placed in an acetone bath and
Figure 1 | Portable plasmonic platform for pathogen detection and quantification. (a) The surface activated disposable microfluidic chips were
mounted on the top side of the device. The microchip with the inlet and outlet ports, and the 50 nm thick gold coated glass substrate along with the
disposable microchip is shown below. (b) The electronic setup of the device is represented from bottom. A light emitting diode illuminates a cylindrical
lens, which collimates the light onto a rectangular prism. The reflected light is captured by a CMOS sensor, and the image is transferred to a portable
computer using the control circuitry. The microfluidic chip is placed on the rectangular prism, with an refractive index matching oil in between. (c)
Schematics of the microfluidic integrated SPR platform. The gold surfaces were modified with several activators (i.e., 11-Mercaptoundeconoic Acid
(MUA), N - (3 - Dimethylaminopropyl) – N9 -ethylcarbodiimide Hydrochloride (EDC), N-Hydroxysuccinimide (NHS) and with anti-
Lipopolysaccharide (LPS) antibody to capture the E. coli. The bacteria are captured by the antibodies in the microchannel, and the capture event induces a
change in the local refractive index. This change provides a signature on the reflected light, which is captured by the sensor and transferred to a computer
for analysis.
www.nature.com/scientificreports
SCIENTIFIC REPORTS | 5 : 9152 | DOI: 10.1038/srep09152 2

sonicated for 5 minutes. Then, they were transferred to a methanol bath andsonicated for 5 minutes again. Finally, chips were transferred to an isopropanol bathand gently shaken for final cleaning. The gold chips were then dried with nitrogen gasto be used in the fabrication of the microfluidic chips.
E. coli culture and quantification. To analyze and visualize the bacteria distributionon the microchip, a green fluorescent protein expressing plasmid, pRSET/EmGFP(Invitrogen, V353-20), was transferred into the competent E. coli strain BL21 StarTM
(Invitrogen, C6000-03). According to the manufacturer’s instructions, the pRSET/EmGFP plasmid, which confers ampicillin resistance, was incubated at 42uC for 30seconds with the competent cells. Cells were allowed to cool down on ice for2 minutes. 250 mL of Super Optimal broth with catabolite repression medium(Sigma-Aldrich, S1797) was added to be incubated for an hour at 37uC, while shakingat 250 rpm. Subsequently, the genetically modified bacteria were spread onto LuriaBertani (LB) agar plates, which contained 100 mg/mL of ampicillin. The plates wereincubated at 37uC for 16 hours, and cells were allowed to grow. When coloniesappeared, an individually isolated colony was inoculated in a 30 mL of LB broth,containing 100 mg/mL ampicillin. Then, E. coli culture was incubated for 16 hours ina 250 rpm rotating incubator at 37uC and aliquoted for later use as a standard stock.
The E. coli stock concentration was quantified by diluting the stock solution nine-fold in PBS and spreading the dilution onto LB-ampicillin plates to be incubated at37uC overnight. Finally, individual E. coli colonies were counted, and the concen-tration of the stock solution was calculated as 109 CFUs/mL. By diluting the stockconcentration into PBS, the concentrations in the experiments were obtained.
For peritoneal dialysis (PD) fluid experiments, E. coli was spiked in a commercialdialysate, received from Chronic Ambulatory Peritoneal Dialysis (CAPD) Unit fromFaulkners Hospital (Baxter Inc., 5B9766). Sample concentrations ranging from 105 to3 3 107 CFUs/mL were prepared by serial dilution in PD fluid.
S. aureus culture and quantification. S. aureus (ATCC #25923, American TypeCulture Collection, Mannassas, VA) cells were hydrated and streaked for isolation ona Luria Bertani agar (LA) plate. Following growth, a single isolated colony wasselected and inoculated in 3 mL of Luria bertani (LB) media. The bacteria culture wasgrown on an incubator shaker for 18 hours at 37uC, 250 rpm until it reached thestationary phase. Quantification of S. aureus stock concentration was done bydiluting the overnight cultures nine-fold in PBS. Diluted cultures were streaked ontoLB Agar plates, incubated at 37uC overnight and individual S. aureus colonies werecounted after overnight incubation. The concentration of stock cultures wascalculated as 109 CFUs/mL. For validation experiments, the overnight cultures werediluted at a ratio of 1510 in LB media.
Portable biosensor operating principle and fabrication. The SPR platform wascustom-made for microfluidic integration (Figure 1a, b). The design of the system wasbased on Kretschmann configuration, which uses prism coupling to satisfymomentum conservation for plasmon excitation by an external light source33
(Figure 1c). A collimated point source light emitting diode (LED) output (l 5
705 nm) was focused with a cylindrical lens (f 5 15 mm) and passed through a glassprism (N-BK7, n 5 1.51) to illuminate the surface of the microchip. The rectangularprism was positioned on a stage, which was practical for inserting microfluidic chipsand the prism. Reflected light was captured by a CMOS sensor (500 3 582), whichwas placed such that the normal of the sensor surface was parallel to the monitoredlight direction. The light source, CMOS sensor, and the associated optical andelectrical components were packaged in a portable box with dimensions of 13.5 cm 3
10 cm 3 5.2 cm (length 3 width 3 height) (Figure 1a, b). The total weight of thepackaged system was 0.85 kg (1.87 lbs). The disposable microfluidic chips were thenplaced on the prism with a thin layer of index matching liquid (n 5 1.5000 6 0.0002,Series A, Cargille Labs, NJ) and fixed in place (Figure 1a). The index matching liquidwas used for providing lossless optical transmission between the prism and the glasssubstrate on the microchip. A custom-designed software was used to monitor theresonance angle changes. The software captured the image frames from the sensor,calculated the resonance angle in real time, and then, plotted the resonance curve andthe sensogram (resonance angle as a function of time) as a readout for kineticmeasurements.
Calibration. To calibrate the sensor, fluids (i.e., distilled water PBS and ethanol (200proof)) with known refractive indices were used as reference samples, and theirplasmon resonance curves were measured in microfluidic channels. Then, theinstrument parameters were matched to these experimental curves to extract devicefitting parameters. In the Kretschmann configuration, the surface plasmon mode’swave vector, ksp, is described by ksp~v=c
ffiffiffiffiffiffiffiffiffiffiffiffiffiffiffiffiffiffiffiffiffiffiffiffiffiffie1e2=(e1ze2)
p, where v is the angular
frequency of the incoming light, c is the speed of light, e1 and e2 are the dielectricpermittivity of the gold and biosensor medium34. The resonance condition occurswhen the surface plasmon mode wave vector is equal to the incident light’s wavevector in the plane of the interface, i.e., ksp 5 v/c (n Sinh) where n is the refractiveindex of the prism and h is the incidence angle of the light35. The calibration procedureallowed an active operating range of 67 to 73 degrees for the resonance angle and thesmallest angle shift the device showed sensitivity was 0.002u. All calibrationmeasurements and validation experiments were performed at room temperature.
Functionalization of microchannels for label-free E. coli and S. aureus capture anddetection. The surface modification for E. coli and S. aureus detection was performedon the 50 nm gold coated glass wafers. The gold surfaces were first submerged in
acetone bath at 56uC to clean any organic residues from the nanofabrication and chipdicing. The gold chips were incubated with 10 mM of 11-Mercaptoundecanoicacid(MUA) (450561 Aldrich – Sigma Aldrich) dissolved in ethanol overnight, and thus,self-assembled monolayer with carboxyl groups was generated onto the surface. AfterMUA modification, microfluidic channels were constructed. Then, a 100 mL of, 151mixture of 100 mM N- (3 - Dimethylaminopropyl) – N9 -ethylcarbodiimideHydrochloride (EDC, 03450 Fluka – Sigma Aldrich) in 10 mL MES (M3671 Sigma –Sigma Aldrich) buffer (9,76 mg/mL in dH2O) and 50 mM of N-Hydroxysuccinimide(NHS, 130672 Aldrich – Sigma Aldrich) in 10 mL of MES buffer, was loaded withpipettes to microchips through the inlet port and incubated for 30 minutes. EDCreacts with carboxyl groups for the formation of amine reactive intermediate that isstabilized by the addition of NHS. The final chemical product is a succinimide groupthat reacts with amine groups of organic compounds (e.g., proteins). The surfaceswere then washed with 100 mL of distilled water and 300 mL of PBS. This step wasfollowed by introducing 100 mL of Protein G (0.1 mg/mL) (21193 – ThermoScientific) dissolved in PBS for the immobilization of antibodies with their favorableorientations, and Protein G was incubated at 4uC for an hour. The surfaces were thenwashed with 300 mL of PBS. 100 mL of anti-lipopolysaccharide (LPS) antibody(ab35654 – Abcam) (5 mg/mL) solution in PBS was incubated for 30 minutes, andthus, antibodies were immobilized on the Protein G coated layer to capture GFP-expressing E. coli. For S. aureus experiments, 100 mL of anti-lipotheichoic acid (anti-LTA) antibody (MA1-7401 – Thermo Scientific) (5 mg/mL) solution in PBS wasincubated on Protein G-coated surfaces for 30 minutes. After another wash with300 mL of PBS, various concentrations of E. coli ranging from 3.2 3 105 to 3.2 3
107 CFUs/mL in PBS were passed through the chip at 5 mL/min rate for detection. InPD fluid experiments, 105 to 3.2 3 107 CFUs/mL of E. coli spiked in PD fluid werepassed through the chip at 5 mL/min rate for detection. In S. aureus experiments, 5 3
106 CFUs/mL were tested for multiplexing and selectivity of the platform.
Statistical Analysis. To evaluate each SPR angle shift, we facilitated one-way analysisof variance (ANOVA) with Tukey’s posthoc test followed with Bonferroni’s MultipleComparison Test for equal variances for multiple comparisons with statisticalsignificance threshold set at 0.05 (p , 0.05). Error bars in the plots representedstandard error of the mean (SEM). All statistical analyses was performed usingGraphPad Prism 5 software (GraphPad Software, Inc., La Jolla, CA).
Results and DiscussionE. coli capture and quantification in the microchannels. To captureE. coli on microfluidic chips, we utilized a Protein G-based surfacechemistry that allows to immobilize antibodies in a favorableorientation18. It was previously shown that anti-LPS presentedhighest capture efficiency among a set of antibodies (antiflagellin,anti-LPS and CD14) for on-chip E. coli capture when Protein Gbased surface chemistry was performed6. We adapted the surfacechemistry for gold-coated substrates, to target E. coli capture on amicrofluidic chip. The captured bacteria counts between the inletand outlet ports were evaluated, for chip characterization as well asfor the limit of detection measurements. To quantify the number ofbacteria captured on gold surfaces, a 75 mL of 106 CFUs/mL E. coliwas passed through surface functionalized microchips (Figure 2a) at a5 mL/minute flow rate using a syringe pump. The GFP-expressing E.coli was fluorescence imaged under 103 magnification (Figure 2b). Toevaluate the capture specificity, brigthfield images and fluorescenceimages at 1003 magnification of the same spot were compared(Figure 2c, d).
We first addressed two considerations, i.e., autofluorescence andclustering, which could potentially result in erroneous estimates ofbacterial counts. Autofluorescence may interfere with the samplesunder study and could potentially result in erroneous estimates ofbacterial counts. To confirm that the fluorescence spots in the imageswere coming from the bacteria (not from autofluorescence of otherparticles), we gathered bright field images of 16 locations (99 mm 3
66 mm) on a chip at 1003 magnification and compared the mor-phology of E. coli observed in these images with green spots observedin the corresponding fluorescence images under 1003 magnifica-tion. These images showed no autofluorescence effects (Figure 2c, d).Additionally, clustering of bacteria could also potentially result inunder-quantifying the bacteria on the sample surface. Therefore, werequired that each observed point with fluorescence under the 103
magnification images should be associated with a single bacteria andnot resulting from the clustering of E. coli. To confirm these observa-tions, we took a fluorescence image under 103 magnification and 25
www.nature.com/scientificreports
SCIENTIFIC REPORTS | 5 : 9152 | DOI: 10.1038/srep09152 3

fluorescence images with 1003 magnification uniformly samplingthe 103 image area. Using the twenty-five 1003 images, we esti-mated a total of 82 E. coli on the imaged surface under 103 mag-nification. In comparison, 78 fluorescing points were counted in the103 image. We concluded that clustering did not also play a signifi-cant role in the 103 image E. coli counts. Therefore, in the consec-utive capture distribution analysis and limit of detection experiments,fluorescent images with 103 magnification are utilized for bacterialcounts.
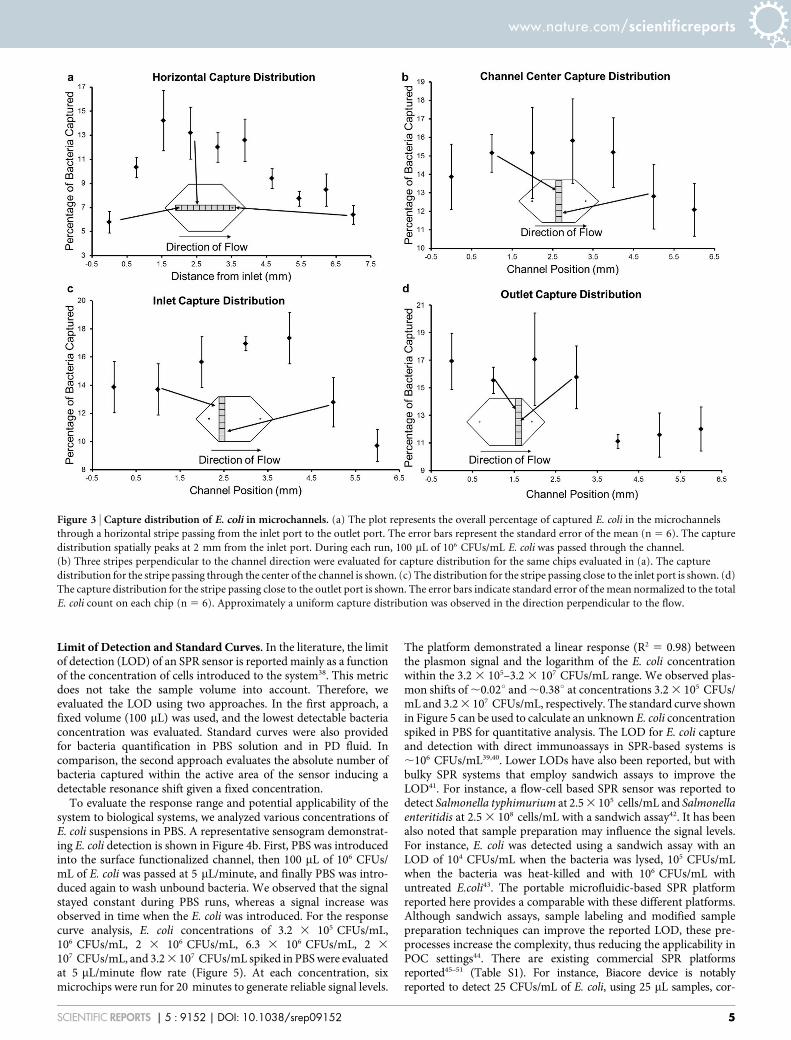
Capture Distribution Experiments. To evaluate the capturedistribution of bacteria, six microchips were tested with 100 mL of106 CFUs/mL E. coli spiked in PBS. The cell capture distributionalong the microchannels were evaluated by identifying onelongitudinal region passing through the inlet and outlet ports andthree additional regions that are perpendicular to the flow directionin the microchannel. The captured E. coli were then manuallyquantified using fluorescence images taken under 103 magnif-ication. The longitudinal region passing through the ports andcenter of the microchannel was evaluated with 10 images(0.987 mm 3 0.658 mm) under 103 magnification (Figure 3a).The evaluated region covered the distance between the inlet andoutlet ports. The maximum capture of E. coli was observed at 2–3 mm away from the inlet port and was consistent with previousmicrofluidic experiments on glass substrates36. The three regionsperpendicular to the flow direction were also evaluated with fluore-scence images under 103 magnification. One region perpendicularto the flow and passing through 1 mm to the right of the inlet, asecond one passing through 1 mm to the left of the outlet and a thirdone passing through the center of the chip were evaluated with 7images (0.987 mm 3 0.658 mm) each (Figure 3b, c, and d). Thecapture distribution showed a slight peak around the center ofthese regions but in general a uniform distribution was observed inthe direction perpendicular to the flow.
SPR angle and kinetic measurements. The field of view of the sensorcorresponded to an area of 1 cm 3 0.5 cm on the gold chip surface(Figure S2). The resonance angle was defined as the angle at whichthere was maximum light coupling to the plasmon modes37. Theresonance condition was satisfied at angles corresponding to aband which was observed as a dark shadow on the camera (FigureS2a). The custom-developed software averaged the pixel intensitiesin a selected viewing area and converted the mean intensity asa function of distance to mean intensity as a function of theincidence angle. The minimum point of this band was calculatedin real time and the SPR sensogram was generated, allowed theprobing of surface events. A two inlet microchip was prepared forevaluating the rise time (i.e., time to increase from 10% to 90% of theresonance angle difference between the water and PBS signals) of theplatform. Distilled water and PBS were alternately applied by syringepumps at 5 mL/min flow rate, and the switching of liquids wasevaluated. The rise time of the switching was observed as 8seconds (Figure S2b, S2c).
For kinetic measurements and the evaluation of surface functio-nalization protocol, described in the Materials section(Functionalization of microchannels for label-free E. coli and S. aur-eus capture and detection section), the microchip surfaces were acti-vated using syringe pumps at 5 mL/min flow rate, while they weremounted on the SPR platform. During the washout steps with PBS,we observed the signal stayed constant. Each modification step in thesurface functionalization increased the resonance angle by changingthe refractive index near the gold surface (Figure 4a). Protein G andanti-LPS binding were observed rapidly as well as other surfaceevents at the interface (Figure 4a). Subsequently, this protocol wasmodified to be applied with pipettes, allowing for multiple microchippreparation in a parallel manner and used in the E. coli capture anddetection experiments with the SPR platform. A representative res-onance shift in the SPR curve upon capture and detection of bacteriais illustrated in Figure 4c.
Figure 2 | Microfluidic chip and fluorescent images of E. coli taken under 103 and 1003 magnifications in microchannels. (a) Microfluidic chip and
the geometry of the channel formed by the 50 mm thick double sided adhesive tape. (b) Captured GFP-expressing E. coli on the gold surface was
fluorescently imaged at 103 magnification in the centre of the microchip. 75 mL of 106 CFUs/mL E. coli in PBS was run through the chip. The 103
fluorescence image was taken in the centre of the microchannel and was used to count the green fluorescing spots to give a count of 78. (c) Captured GFP-
expressing E. coli was fluorescently imaged at 1003 magnification. Bacteria are indicated with white circles. (d) Bright-field image at 1003 magnification
shows the morphology of bacteria, indicated with white circles, for the same image shown in (c).
www.nature.com/scientificreports
SCIENTIFIC REPORTS | 5 : 9152 | DOI: 10.1038/srep09152 4
Limit of Detection and Standard Curves. In the literature, the limitof detection (LOD) of an SPR sensor is reported mainly as a functionof the concentration of cells introduced to the system38. This metricdoes not take the sample volume into account. Therefore, weevaluated the LOD using two approaches. In the first approach, afixed volume (100 mL) was used, and the lowest detectable bacteriaconcentration was evaluated. Standard curves were also providedfor bacteria quantification in PBS solution and in PD fluid. Incomparison, the second approach evaluates the absolute number ofbacteria captured within the active area of the sensor inducing adetectable resonance shift given a fixed concentration.
To evaluate the response range and potential applicability of thesystem to biological systems, we analyzed various concentrations ofE. coli suspensions in PBS. A representative sensogram demonstrat-ing E. coli detection is shown in Figure 4b. First, PBS was introducedinto the surface functionalized channel, then 100 mL of 106 CFUs/mL of E. coli was passed at 5 mL/minute, and finally PBS was intro-duced again to wash unbound bacteria. We observed that the signalstayed constant during PBS runs, whereas a signal increase wasobserved in time when the E. coli was introduced. For the responsecurve analysis, E. coli concentrations of 3.2 3 105 CFUs/mL,106 CFUs/mL, 2 3 106 CFUs/mL, 6.3 3 106 CFUs/mL, 2 3
107 CFUs/mL, and 3.2 3 107 CFUs/mL spiked in PBS were evaluatedat 5 mL/minute flow rate (Figure 5). At each concentration, sixmicrochips were run for 20 minutes to generate reliable signal levels.
The platform demonstrated a linear response (R2 5 0.98) betweenthe plasmon signal and the logarithm of the E. coli concentrationwithin the 3.2 3 105–3.2 3 107 CFUs/mL range. We observed plas-mon shifts of ,0.02u and ,0.38u at concentrations 3.2 3 105 CFUs/mL and 3.2 3 107 CFUs/mL, respectively. The standard curve shownin Figure 5 can be used to calculate an unknown E. coli concentrationspiked in PBS for quantitative analysis. The LOD for E. coli captureand detection with direct immunoassays in SPR-based systems is,106 CFUs/mL39,40. Lower LODs have also been reported, but withbulky SPR systems that employ sandwich assays to improve theLOD41. For instance, a flow-cell based SPR sensor was reported todetect Salmonella typhimurium at 2.5 3 105 cells/mL and Salmonellaenteritidis at 2.5 3 108 cells/mL with a sandwich assay42. It has beenalso noted that sample preparation may influence the signal levels.For instance, E. coli was detected using a sandwich assay with anLOD of 104 CFUs/mL when the bacteria was lysed, 105 CFUs/mLwhen the bacteria was heat-killed and with 106 CFUs/mL withuntreated E.coli43. The portable microfluidic-based SPR platformreported here provides a comparable with these different platforms.Although sandwich assays, sample labeling and modified samplepreparation techniques can improve the reported LOD, these pre-processes increase the complexity, thus reducing the applicability inPOC settings44. There are existing commercial SPR platformsreported45–51 (Table S1). For instance, Biacore device is notablyreported to detect 25 CFUs/mL of E. coli, using 25 mL samples, cor-
Figure 3 | Capture distribution of E. coli in microchannels. (a) The plot represents the overall percentage of captured E. coli in the microchannels
through a horizontal stripe passing from the inlet port to the outlet port. The error bars represent the standard error of the mean (n 5 6). The capture
distribution spatially peaks at 2 mm from the inlet port. During each run, 100 mL of 106 CFUs/mL E. coli was passed through the channel.
(b) Three stripes perpendicular to the channel direction were evaluated for capture distribution for the same chips evaluated in (a). The capture
distribution for the stripe passing through the center of the channel is shown. (c) The distribution for the stripe passing close to the inlet port is shown. (d)
The capture distribution for the stripe passing close to the outlet port is shown. The error bars indicate standard error of the mean normalized to the total
E. coli count on each chip (n 5 6). Approximately a uniform capture distribution was observed in the direction perpendicular to the flow.
www.nature.com/scientificreports
SCIENTIFIC REPORTS | 5 : 9152 | DOI: 10.1038/srep09152 5

responding to an absolute value of 0.62 CFU/mL of E.coli (less than1 CFU) in the total evaluated sample volume. This performance isreached at the expense of portability, since the Biacore laboratoryequipment weighing 50 kg is not suitable for POC applications44,52.In comparison, this work reports a portable device (0.85 kg) suitablefor POC applications, with a favorable LOD in comparison to themean of the values given in Table S1. The platform reported hererequires lower sample volume, as well as provides significant advan-tages using disposable chips and portable reader for POC applications.
As an example of a biologically relevant fluid, we evaluated thedetection of E. coli samples spiked in PD fluid at the concentrationrange of 105 CFUs/mL to 3.2 3 107 CFUs/mL (Figure 6). The plat-form performed well in comparison to the PBS experiments, with anR2 value of 0.98 for the linear fit. At the highest concentration of 3.2 3
107 CFUs/mL we observed a signal of ,0.11 degrees in comparisonto the ,0.38 degrees of PBS experiments given in Figure 5. Weobserved the slope of the linear fit was slightly smaller. PBS andPD fluid have different chemical and optical properties (e.g., refract-
ive index, pH), which may contribute to the resonance angle shiftsobserved in experiments at the same E. coli concentrations. Duringthe PD fluid experiments the experimental parameters (i.e., surfacefunctionalization, chip design) were kept the same as in the PBSexperiments, however a different batch of gold coated chips wereused, which may also have contributed to the difference in theobserved signal levels.
In the second LOD approach, we evaluated the absolute number ofcells that the system is sensitive to, which was defined as the absoluteLOD. Multiple sample volumes between 20 mL and 100 mL wereevaluated to characterize the experimental detection limitation ofthe system. The active area on the gold chip surface (5.3 3
106 mm2) inducing this signal was selected (Figure S2) and fluor-escence images at 103 magnification were collected after separatingthe gold substrates from the microchips. For each chip, nine imageswere acquired under 103 magnification, and the GFP-expressingbacteria were counted inducing the signal. From an engineeringpoint-of-view, we performed experiments at increasing sample
Figure 4 | Evaluation of the platform. (a) Real time monitoring of the surface chemistry steps with respect to surface plasmon resonance angle
change. The modification of the gold surfaces with crosslinkers is followed by Protein G and antibody immobilization on the surface. The signal remains
constant during the wash-out steps with PBS. (b) Representative detection curve of E. coli. First PBS was introduced into the channel, then 100 mL of
106 CFUs/mL E. coli was passed at 5 mL/minute, and finally PBS was introduced again. (c) Representative plot of plasmon resonance shifts after the
application of E. coli to the biosensing platform. The arrow indicates the plasmonic shift due to the detection of GFP-expressing E. coli, when 106
CFUs/mL E. coli was applied. The minimum point of the curves are the surface plasmon resonance angles. (d) Limit of detection evaluation from a 20 mL
sample is shown. Protein G and anti-Lipopolysaccharide (LPS)-based surface chemistry optimized for off-device activation was used to capture and
detect 106 CFUs/mL E. coli in PBS. 20 mL of E. coli was passed through the channel and ,0.002u plasmon shift was observed. The 103 fluorescence images
were used to count the green fluorescing spots, and we observed E. coli count of 32 6 1.6 (n 5 6, error is given in standard error of the mean). The red curve
shows a smoothed sensogram to show the limit of detection signal.
www.nature.com/scientificreports
SCIENTIFIC REPORTS | 5 : 9152 | DOI: 10.1038/srep09152 6

volumes to evaluate detection limitations. Specifically, 106 CFUs/mLof E. coli in 20 mL PBS solution were applied to five chips for 4 min-utes, and the sensor recorded a ,0.002u shift in the resonance anglewhen chips were run at 5 mL/min (Figure 4d). The ,0.002u shift wasfound to result from 32 6 1.6 CFUs/mL of E. coli (n 5 5, and error isgiven in standard error of the mean). The instrument resolution(,0.002u) reported in the calibration section is commensurate withthe experimentally measured limitation (,0.002u) at 20 mL (seeCalibration section under Materials and Methods). Further,106 CFUs/mL of E. coli spiked in 30 mL PBS solution were appliedto three other chips for 6 minutes, and a 0.004u shift response wasobserved. Nine images at 103 magnification were used to count thebacteria, and it was found that the ,0.004u plasmon shift was
induced by 55 6 2.1 CFUs/mL of E. coli captured within the activearea (Figure S3). Here, a higher number of chips were run at increas-ing volumes, and the system responses were evaluated. We carefullycharacterized the platform and chose the most robust and reliableoperating conditions. By considering platform performance andclinical applicability, 100 mL sample volume was used in our experi-ments with E. coli. Since the measured signal levels in Figures 4, 5 and6 were on the order of 0.1u–0.3u for E. coli, and are two orders ofmagnitude higher than the experimental instrument resolution(,0.002u), the chosen volume of 100 mL regularly provided reliableand robust conditions. The LOD can potentially be improved byincorporating on-chip or off-chip microfluidic functional elementsto increase the capture efficiency. A good example of this would beutilizing the same fluid volume multiple times to increase the cap-tured bacteria.
Specificity and Multiplexing. The specificity and selectivity of theproposed platform was evaluated with three sets of experiments. Thefirst experiment was conducted by eluting E. coli over anti-LTAantibody-modified microfluidic chips. We observed that E. colibinding is minimum since anti-LTA antibody is specific for Gram1 bacteria, which exhibited no affinity to E. coli (Figure 7a). As aresult, there was minimal cross-reactivity (nonspecific binding)observed against E. coli on anti-LTA antibody-modified surfaces(Dh 5 0.01u) (Figure 7a). The second experiment was designed byelution of S. aureus over anti-LTA modified surface. Figure 7b showsthe typical binding curve of S. aureus on anti-LTA-modified surface,which yielded 0.057u shift in SPR angle. Further, as a third experiment(negative control), we examined a mixture of S. aureus and E. coli onanti-LTA antibody-modified surfaces (Figure 7c). Statistical analysisdemonstrated that there is no significant difference between the resultsobtained from S. aureus and mixture cases (n 5 3, p . 0.05)(Figure 7d). Since E. coli has no significant interactions to the anti-LTA antibody-modified surface (Figure 7a), the SPR angle shiftoriginated due to S. aureus binding to the surfaces, confirmingselective capture of S. aureus from the mixture. Additionally, theSPR angle change in E. coli experiments on the anti-LTA antibody-modified surfaces were observed to be statistically different than S.aureus and mixture experiments (n 5 3, p , 0.05). Thus, wedemonstrated the specificity, selectivity and multiplexing capabilityof our platform.
The development of POC platforms is crucial both for field-baseddiagnostics and personalized medicine applications53,54. However,requirements for the portability of POC instruments hinder thetransition of these devices to diagnostic and monitoring applicationsat the bed-side, primary care and resource-constrained settings. Thepresented platform incorporates a hand-held optical reader, whichutilizes disposable microchips adaptable to portable and versatilePOC applications. The system operates with small sample volumes(100 mL), gives results within 20 minutes, and was made from inex-pensive equipment. The portability of the device (0.85 kg) allowssimple transportation without compromising sensitivity. The micro-chips can be disposed of without raising any contamination issues.The chip fabrication and surface activation procedures are highthroughput, and the whole process can be automated in the future.Further, plasmonic-based technologies are label-free and detect thetarget directly with less complicated protocols compared to fluor-escent techniques55. Plasmonics allow detection of ultralow concen-trations of bioagents24,56,57. Therefore, merging microfluidics withplasmonic based technologies is enabling new operating modalities.For instance, recent developments in SPR imaging (SPRi) allowedhigh throughput on-chip sensors58 and on-chip immunoassays59.LSPR based platforms are also merging with microfluidics60. Develop-ment of such novel plasmonic-based microfluidic sensors will poten-tially contribute to infectious disease diagnosis and monitoring both atthe POC and primary care settings.
Figure 5 | Validation with E. coli in PBS. The concentrations of 3.2 3
105 CFUs/mL, 106 CFUs/mL, 2 3 106 CFUs/mL, 6.3 3 106 CFUs/mL, 2 3
107 CFUs/mL, and 3.2 3 107 CFUs/mL were evaluated. At each
concentration, 6 microchips were evaluated at 5 mL/minute for
20 minutes. The linear curve shows the least squares fit with R2 5 0.98 (n 5
6, error bars represent standard error of the mean).
Figure 6 | Validation with E. coli spiked in peritoneal dialysis (PD) fluid.The concentration range of 105 CFUs/mL to 3.2 3 107 CFUs/mL was
evaluated. At each concentration, 6 microchips were evaluated at 5 mL/
minute for 20 minutes. The linear curve shows the least squares fit with R2
5 0.98 (n 5 6, error bars represent standard error of the mean).
www.nature.com/scientificreports
SCIENTIFIC REPORTS | 5 : 9152 | DOI: 10.1038/srep09152 7

ConclusionsWe have developed a portable, label-free pathogen detection plat-form that merged microfluidic and SPR technologies on a singleplatform and demonstrated detection and quantification of bacterialpathogens. Using a plasmonic-based microchip sensitive pathogendetection is attained, which can potentially be used for POC applica-tions. We further evaluated the response of the platform with detec-tion of E. coli-spiked in PBS and PD fluid. The demonstrated systemcan potentially be generalized to other pathogens or for immuno-diagnostics, given that there are well-defined biomarkers for thetargeted applications. For instance, the presented platform is poten-tially applicable to other bacterial and viral diseases such as influenza,hepatitis, AIDS, and tuberculosis. Therefore, with the use of dispos-able, easy-to-fabricate and sensitive plasmonic surfaces with a spe-cific surface chemistry on a label-free microfluidic platform, weaddress some of the major problems of current biosensing tools atthe POC (i.e., portability, cost, small sample size and practical opera-tion requirements).
1. Lee, W. G., Kim, Y. G., Chung, B. G., Demirci, U. & Khademhosseini, A. Nano/Microfluidics for diagnosis of infectious diseases in developing countries. Adv.Drug Deliv. Rev. 62, 449–457; DOI:10.1016/j.addr.2009.11.016 (2010).
2. Wang, S. Q., Inci, F., De Libero, G., Singhal, A. & Demirci, U. Point-of-care assaysfor tuberculosis: Role of nanotechnology/microfluidics. Biotechnol. Adv. 31,438–449; DOI:10.1016/j.biotechadv.2013.01.006 (2013).
3. Mani, V. et al. Emerging technologies for monitoring drug-resistant tuberculosisat the point-of-care. Adv. Drug Deliv. Rev. 78, 105–117; DOI:10.1016/j.addr.2014.05.015 (2014).
4. Lissandrello, C. et al. Nanomechanical motion of Escherichia coli adhered to asurface. Appl. Phys. Lett. 105, 113701-1-113701-5; DOI:10.1063/1.4895132 (2014).
5. Sanderson, M. W., Sreerama, S. & Nagaraja, T. G. Sensitivity of direct plating fordetection of high levels of E-Coli O1575H7 in bovine fecal samples. Curr.Microbiol. 55, 158–161; DOI:10.1007/s00284-007-0083-4 (2007).
6. Wang, S. et al. Portable microfluidic chip for detection of Escherichia coli inproduce and blood. Int. J. Nanomedicine 7, 2591–2600; DOI:10.2147/IJN.S29629(2012).
7. Durmus, N. et al. Fructose-enhanced reduction of bacterial growth on nanoroughsurfaces. Int. J. Nanomedicine 7, 537–545; DOI:10.2147/IJN.S27957 (2012).
8. Jordan, J. A. & Durso, M. B. Real-time polymerase chain reaction for detectingbacterial DNA directly from blood of neonates being evaluated for sepsis. J. Mol.Diagn. 7, 575–581; DOI:10.1016/S1525-1578(10)60590-9 (2005).
9. Chin, C. D., Linder, V. & Sia, S. K. Lab-on-a-chip devices for global health: Paststudies and future opportunities. Lab. Chip 7, 41–57; DOI:10.1039/b611455e(2007).
10. Yager, P. et al. Microfluidic diagnostic technologies for global public health.Nature 442, 412–418; DOI:10.1038/nature05064 (2006).
11. Tasoglu, S., Gurkan, U. A., Wang, S. & Demirci, U. Manipulating biological agentsand cells in micro-scale volumes for applications in medicine. Chem. Soc. Rev. 42,5788–5808; DOI:10.1039/c3cs60042d (2013).
12. Cheng, X. H. et al. A microchip approach for practical label-free CD41 T-cellcounting of HIV-infected subjects in resource-poor settings. Jaids. 45, 257–261;DOI:10.1097/QAI.0b013e3180500303 (2007).
13. Yi, C., Li, C.-W., Ji, S. & Yang, M. Microfluidics technology for manipulation andanalysis of biological cells. Anal. Chim. Acta. 560, 1–23; DOI:10.1016/j.aca.2005.12.037 (2006).
Figure 7 | Specificity, selectivity and multiplexing of the SPR platform. SPR chips were decorated with anti-LTA antibodies, which are only specific to S.
aureus (Gram 1 bacteria). (a) E. coli spiked in PBS (5 3 106 CFUs/mL) were applied onto anti-LTA antibody modified surfaces. (b) S. aureus spiked
in PBS (5 3 106 CFUs/mL) were applied onto anti-LTA antibody modified surfaces. (c) For specificity and selectivity experiments, S. aureus and E. coli
were mixed in PBS at the concentrations reported above. The mixture was then applied onto anti-LTA antibody modified surfaces. (d) Changes in SPR
angle were recorded for each case. For statistical analysis, one-way analysis of variance (ANOVA) with Tukey’s posthoc test was performed with
Bonferroni’s Multiple Comparison Test for equal variances for multiple comparisons. Statistical significance threshold was set at 0.05 (n 5 3, p , 0.05),
and brackets represented statistical significant differences between groups. Error bars represented mean 6 standard errors of the mean (SEM).
www.nature.com/scientificreports
SCIENTIFIC REPORTS | 5 : 9152 | DOI: 10.1038/srep09152 8

14. Song, Y. S. et al. Microfluidics for cryopreservation. Lab. Chip 9, 1874–1881;DOI:10.1039/b823062e (2009).
15. Rizvi, I. et al. Flow induces epithelial-mesenchymal transition, cellularheterogeneity and biomarker modulation in 3D ovarian cancer nodules. Proc.Natl. Acad. Sci. USA 110, E1974–E1983; DOI:10.1073/pnas.1216989110 (2013).
16. Meyvantsson, I. & Beebe, D. J. Cell Culture Models in Microfluidic Systems. Annu.Rev. Anal. Chem. 1, 423–449; DOI:10.1146/annurev.anchem.1.031207.113042(2008).
17. White, A. K. et al. High-throughput microfluidic single-cell RT-qPCR. Proc. Natl.Acad. Sci. USA 108, 13999–14004; DOI:10.1073/pnas.1019446108 (2011).
18. Wang, S. Q. et al. Efficient on-chip isolation of HIV subtypes. Lab. Chip 12,1508–1515; DOI:10.1039/c2lc20706k (2012).
19. Mark, D., Haeberle, S., Roth, G., von Stetten, F. & Zengerle, R. Microfluidic lab-on-a-chip platforms: requirements, characteristics and applications. Chem. Soc. Rev.39, 1153–1182; DOI:10.1039/b820557b (2010).
20. Kim, Y. G., Moon, S., Kuritzkes, D. R. & Demirci, U. Quantum dot-based HIVcapture and imaging in a microfluidic channel. Biosens. Bioelectron. 25, 253–258;DOI:10.1016/j.bios.2009.06.023 (2009).
21. Shafiee, H. et al. Acute On-Chip HIV Detection Through Label-Free ElectricalSensing of Viral Nano-Lysate. Small 9, 2553–63; DOI:10.1002/smll.201202195(2013).
22. Gurkan, U. A. et al. Miniaturized lensless imaging systems for cell andmicroorganism visualization in point-of-care testing. Biotechnol. J. 6, 138–149;DOI:10.1002/biot.201000427 (2011).
23. Myers, F. B. & Lee, L. P. Innovations in optical microfluidic technologies for point-of-care diagnostics. Lab. Chip 8, 2015–2031; DOI:10.1039/b812343h (2008).
24. Inci, F. et al. Nanoplasmonic Quantitative Detection of Intact Viruses fromUnprocessed Whole Blood. ACS Nano 7, 4733–4745; DOI:10.1021/nn3036232(2013).
25. Kim, J. Joining plasmonics with microfluidics: from convenience to inevitability.Lab. Chip 12, 3611–3623; DOI:10.1039/c2lc40498b (2012).
26. Yanik, A. A. et al. An Optofluidic Nanoplasmonic Biosensor for Direct Detectionof Live Viruses from Biological Media. Nano Lett. 10, 4962–4969; DOI:10.1021/nl103025u (2010).
27. Sevimli, S., Inci, F., Zareie, H. M. & Bulmus, V. Well-Defined CholesterolPolymers with pH-Controlled Membrane Switching Activity. Biomacromol. 13,3064–3075; DOI:10.1021/bm300846e (2012).
28. Shafiee, H. et al. Nanostructured Optical Photonic Crystal Biosensor for HIVViral Load Measurement. Sci. Rep. 4, 4116; DOI:10.1038/srep04116 (2014).
29. Brolo, A. G. Plasmonics for future biosensors. Nat. Photonics 6, 709–713;DOI:10.1038/nphoton.2012.266 (2012).
30. Piliarik, M. & Homola, J. Surface plasmon resonance (SPR) sensors: approachingtheir limits? Opt. Express. 17, 16505–16517; DOI:10.1364/OE.17.016505 (2009).
31. Arlett, J. L., Myers, E. B. & Roukes, M. L. Comparative advantages of mechanicalbiosensors. Nat. Nanotechnol. 6, 203–215; DOI:10.1038/nnano.2011.44 (2011).
32. Wang, S. Q. et al. Simple filter microchip for rapid separation of plasma andviruses from whole blood. Int. J. Nanomedicine 7, 5019–5028; DOI:10.2147/ijn.s32579 (2012).
33. Kretschmann, E. & Raether, H. Radiative decay of non radiative surface plasmonsexcited by light. Z. Naturforsch. 23a, 2135–2136 (1968).
34. Turker, B. et al. Grating coupler integrated photodiodes for plasmon resonancebased sensing. Lab. Chip 11, 282–287; DOI:10.1039/c0lc00081g (2011).
35. Homola, J. Springer Series on Chemical Sensors and Biosensors, Homola, J. (ed.),Vol. 4 (Springer Berlin Heidelberg, 2006).
36. Moon, S. et al. Integrating microfluidics and lensless imaging for point-of-caretesting. Biosens. Bioelectron. 24, 3208–3214; DOI:10.1016/j.bios.2009.03.037 (2009).
37. Homola, J., Yee, S. S. & Gauglitz, G. Surface plasmon resonance sensors: review.Sensors Actuat. B-Chem. 54, 3–15; DOI:10.1016/s0925-4005(98)00321-9 (1999).
38. Homola, J. Surface Plasmon Resonance Sensors for Detection of Chemical andBiological Species. Chem. Rev. 108, 462–493; DOI:10.1021/cr068107d (2008).
39. Puttharugsa, C. et al. Development of surface plasmon resonance imaging fordetection of Acidovorax avenae subsp citrulli (Aac) using specific monoclonalantibody. Biosens. Bioelectron. 26, 2341–2346; DOI:10.1016/j.bios.2010.10.007(2011).
40. Abdulhalim, I., Zourob, M. & Lakhtakia, A. Surface Plasmon Resonance forBiosensing: A Mini-Review. Electromagnetics 28, 214–242; DOI:10.1080/02726340801921650 (2008).
41. Tawil, N., Sacher, E., Mandeville, R. & Meunier, M. Surface plasmon resonancedetection of E. coli and methicillin-resistant S. aureus using bacteriophages.Biosens. Bioelectron. 37, 24–29; DOI:10.1016/j.bios.2012.04.048 (2012).
42. Barlen, B., Mazumdar, S. D., Lezrich, O., Kampfer, P. & Keusgen, M. Detection ofsalmonella by surface plasmon resonance. Sensors 7, 1427–1446; DOI:10.3390/s7081427 (2007).
43. Taylor, A. D., Yu, Q., Chen, S., Homola, J. & Jiang, S. Comparison of E. coliO1575H7 preparation methods used for detection with surface plasmonresonance sensor. Sensors. Actuat. B-Chem. 107, 202–208; DOI:10.1016/j.snb.2004.11.097 (2005).
44. Tokel, O., Inci, F. & Demirci, U. Advances in Plasmonic Technologies for Point ofCare Applications. Chem. Rev. 114, 5728–5752; DOI:10.1021/cr4000623 (2014).
45. Waswa, J., Irudayaraj, J. & DebRoy, C. Direct detection of E. Coli O1575H7 inselected food systems by a surface plasmon resonance biosensor. LWT - Food Sci.Technol. 40, 187–192; DOI:10.1016/j.lwt.2005.11.001 (2007).
46. Subramanian, A., Irudayaraj, J. & Ryan, T. A mixed self-assembled monolayer-based surface plasmon immunosensor for detection of E. coli O1575H7. Biosens.Bioelectron. 21, 998–1006; DOI:10.1016/j.bios.2005.03.007 (2006).
47. Waswa, J. W., Debroy, C. & Irudayaraj, J. Rapid detection of SalmonellaEnterritidis and Escherichia Coli using surface plasmon resonance biosensor.J. Food Process. Eng. 29, 373–385; DOI:10.1111/j.1745-4530.2006.00071.x (2006).
48. Dudak, F. C. & Boyacı, I.. H. Development of an immunosensor based on surface
plasmon resonance for enumeration of Escherichia coli in water samples. FoodRes. Int. 40, 803–807; DOI:10.1016/j.foodres.2007.01.011 (2007).
49. Taylor, A. D. et al. Quantitative and simultaneous detection of four foodbornebacterial pathogens with a multi-channel SPR sensor. Biosens. Bioelectron. 22,752–758; DOI:10.1016/j.bios.2006.03.012 (2006).
50. Oh, B. K., Kim, Y. K., Bae, Y. M., Lee, W. H. & Choi, J. W. Detection of Escherichiacoli O1575H7 using immunosensor based on surface plasmon resonance.J. Microbiol. Biotechn. 12, 780–786 (2002).
51. Maalouf, R. et al. Label-Free Detection of Bacteria by Electrochemical ImpedanceSpectroscopy: Comparison to Surface Plasmon Resonance. Anal. Chem. 79,4879–4886; DOI:10.1021/ac070085n (2007).
52. Biacore 3000 GoldSeal. http://www.gelifesciences.com/webapp/wcs/stores/servlet/productById/en/GELifeSciences/28961825, (Accessed, 11th November 2014).
53. Laursen, L. Point-of-care tests poised to alter course of HIV treatment. Nat. Med.18, 1156–1156; DOI:10.1038/nm0812-1156 (2012).
54. Gallegos, D. et al. Label-free biodetection using a smartphone. Lab. Chip 13,2124–2132; DOI:10.1039/c3lc40991k (2013).
55. Mayer, K. M. & Hafner, J. H. Localized Surface Plasmon Resonance Sensors.Chem. Rev. 111, 3828–3857; DOI:10.1021/cr100313v (2011).
56. Brolo, A. G. Plasmonics for future biosensors. Nat. Photonics 6, 709–713;DOI:10.1038/nphoton.2012.266 (2012).
57. Anker, J. N. et al. Biosensing with plasmonic nanosensors. Nat. Mater. 7, 442–453;DOI:10.1038/nmat2162 (2008).
58. Lee, K.-H., Su, Y.-D., Chen, S.-J., Tseng, F.-G. & Lee, G.-B. Microfluidic systemsintegrated with two-dimensional surface plasmon resonance phase imagingsystems for microarray immunoassay. Biosens. Bioelectron. 23, 466–472;DOI:10.1016/j.bios.2007.05.007 (2007).
59. Luo, Y., Yu, F. & Zare, R. N. Microfluidic device for immunoassays based onsurface plasmon resonance imaging. Lab. Chip 8, 694–700; DOI:10.1039/b800606g (2008).
60. Huang, C. et al. Localized surface plasmon resonance biosensor integrated withmicrofluidic chip. Biomed. Microdevices 11, 893–901; DOI:10.1007/s10544-009-9306-8 (2009).
AcknowledgmentsThis work was supported by the National Institute of Health under NIH award numbersR01AI093282, R01AI081534, R21AI087107, and NIH U54EB15408, NIH F32AI102590.We thank Brigham and Women’s Hospital (BWH) Biomedical Research InstituteTranslatable Technologies & Care Innovation Award. We also thank Albert Wang and NickPetrusev for helpful discussions. The gold coated chips were fabricated using facilities at theCenter for Nanoscale Systems (CNS), a member of the National NanotechnologyInfrastructure Network (NNIN).
Author contributionsO.T., A.D. and U.D. developed the idea; A.D. and U.D. collaborated on the paper; O.T., A.D.and U.D. designed the experimental approach; O.T., U.H.Y., F.I., N.G.D., O.O.E., B.T., C.C.,S.R., K.S., N.N. and H.S. performed the experiments; O.T., U.H.Y., F.I. and U.D. analyzedthe data; O.T., U.H.Y., F.I., A.D. and U.D. wrote the manuscript. All authors reviewed themanuscript.
Additional informationSupplementary information accompanies this paper at http://www.nature.com/scientificreports
Competing financial interests: Yes, there is a potential competing financial interest. Dr. U.Demirci is a founder of, and has an equity interest in: (i) DxNow Inc., a company that isdeveloping microfluidic and imaging technologies for point-of-care diagnostic solutions,and (ii) Koek Biotech, a company that is developing microfluidic IVF technologies forclinical solutions. Dr. U. Demirci’s interests were viewed and managed by the Brigham andWomen’s Hospital and Partners HealthCare in accordance with their conflict-of-interestpolicies.
How to cite this article: Tokel, O. et al. Portable Microfluidic Integrated PlasmonicPlatform for Pathogen Detection. Sci. Rep. 5, 9152; DOI:10.1038/srep09152 (2015).
This work is licensed under a Creative Commons Attribution 4.0 InternationalLicense. The images or other third party material in this article are included in thearticle’s Creative Commons license, unless indicated otherwise in the credit line; ifthe material is not included under the Creative Commons license, users will needto obtain permission from the license holder in order to reproduce the material. Toview a copy of this license, visit http://creativecommons.org/licenses/by/4.0/
www.nature.com/scientificreports
SCIENTIFIC REPORTS | 5 : 9152 | DOI: 10.1038/srep09152 9
Related Documents