STATE OF COLORADO PORTABLE ANALYZER MONITORING PROTOCOL Determination of Nitrogen Oxides, Carbon Monoxide and Oxygen Emissions from Natural Gas-Fired Reciprocating Engines, Combustion Turbines, Boilers, and Process Heaters Using Portable Analyzers Version - March 2006

Welcome message from author
This document is posted to help you gain knowledge. Please leave a comment to let me know what you think about it! Share it to your friends and learn new things together.
Transcript

STATE OF COLORADO PORTABLE ANALYZER MONITORING PROTOCOL
Determination of Nitrogen Oxides, Carbon Monoxide and Oxygen Emissions from Natural Gas-Fired Reciprocating Engines, Combustion Turbines,
Boilers, and Process Heaters Using Portable Analyzers
Version - March 2006

Version - March 2006
TABLE OF CONTENTS 1. APPLICABILITY AND PRINCIPLE...............................................................................Page 4 1.1 Background……………………………………………………………………...Page 4
1.2 Applicability ........................................................................................................Page 4 1.3 Principle ...............................................................................................................Page 4
2. RANGE AND SENSITIVITY...........................................................................................Page 4
2.1 Analytical Range..................................................................................................Page 4 3. DEFINITIONS...................................................................................................................Page 5
3.1 Measurement System...........................................................................................Page 5 3.2 Nominal Range ....................................................................................................Page 6 3.3 Span Gas ..............................................................................................................Page 6 3.4 Zero Calibration Error .........................................................................................Page 6 3.5 Span Calibration Error .........................................................................................Page 6 3.6 Response Time.....................................................................................................Page 6 3.7 Interference Check...............................................................................................Page 6 3.8 Linearity Check....................................................................................................Page 7 3.9 Stability Check.....................................................................................................Page 7 3.10 Stability Time ....................................................................................................Page 7 3.11 Initial NO Cell Temperature ..............................................................................Page 7 3.12 Test.....................................................................................................................Page 7
4. MEASUREMENT SYSTEM PERFORMANCE SPECIFICATIONS .............................Page 7
4.1 Zero Calibration Error .........................................................................................Page 7 4.2 Span Calibration Error .........................................................................................Page 7 4.3 Interference Response..........................................................................................Page 7 4.4 Linearity...............................................................................................................Page 8 4.5 Stability Check Response ....................................................................................Page 8 4.6 CO Measurement, H2 Compensation...................................................................Page 8
5. APPARATUS AND REAGENTS.....................................................................................Page 8
5.1 Measurement System...........................................................................................Page 8 5.2 Calibration Gases ...............................................................................................Page 10
6. MEASUREMENT SYSTEM PERFORMANCE CHECK PROCEDURES ..................Page 11
6.1 Calibration Gas Concentration Certification .....................................................Page 11 6.2 Linearity Check..................................................................................................Page 11 6.3 Interference Check.............................................................................................Page 12 6.4 Stability Check...................................................................................................Page 12
Version - March 2006
7. EMISSION TEST PROCEDURE ...................................................................................Page 13 7.1 Selection of Sampling Site and Sampling Points...............................................Page 13 7.2 Warm Up Period ................................................................................................Page 14 7.3 Pretest Calibration Error Check.........................................................................Page 14 7.4 NO Cell Temperature Monitoring .....................................................................Page 15 7.5 Sample Collection..............................................................................................Page 16 7.6 Post Test Calibration Error Check .....................................................................Page 16 7.7 Interference Check.............................................................................................Page 16 7.8 Re-Zero ..............................................................................................................Page 17
8. DATA COLLECTION ....................................................................................................Page 18
8.1 Linearity Check Data .........................................................................................Page 18 8.2 Stability Check Data ..........................................................................................Page 18 8.3 Pretest Calibration Error Check Data ................................................................Page 18 8.4 Test Data ............................................................................................................Page 19 8.5 Post Test Calibration Error Check Data ............................................................Page 19 8.6 Corrected Test Results .......................................................................................Page 19
9. CALIBRATION CORRECTIONS..................................................................................Page 20
9.1 Emission Data Corrections ................................................................................Page 20 10. EMISSION CALCULATIONS .....................................................................................Page 20
10.1 Emission Calculations for Reciprocating Engines and Combustion Turbines Page 20 10.2 Emission Calculations for Heaters/Boilers ......................................................Page 22
11. REPORTING REQUIREMENTS AND RECORD KEEPING REQUIREMENTS.....Page 24 LINEARITY CHECK DATA SHEET ..........................................................................Appendix A STABILITY CHECK DATA SHEET........................................................................... Appendix B CALIBRATION ERROR CHECK DATA SHEET ...................................................... Appendix C

Version - March 2006 Page 4
1. APPLICABILITY AND PRINCIPLE
1.1 Background. This protocol is based on the Gas Research Institute Method GRI-96/0008,
EMC Conditional Test Method (CTM-030). The original version of this method can be found on
the EPA Website at: http://www.epa.gov/ttn/emc/ctm.html. The State of Colorado adopted this
method into the State of Colorado Portable Analyzer Monitoring Protocol to ensure quality data
is captured while performing periodic monitoring.
1.2 Applicability. This method is applicable for the determination of nitrogen oxides (NO and
NO2), carbon monoxide (CO), and oxygen (O2) concentrations of controlled and uncontrolled
emissions from natural gas-fired reciprocating engines, combustion turbines, boilers, and process
heaters using portable analyzers with electrochemical cells. The use of reference method
equivalent analyzers is acceptable provided the appropriate reference method procedures in 40
CFR 60, Appendix A are used. Due to the inherent cross sensitivities of the electrochemical
cells, this method is not applicable to other pollutants.
1.3 Principle. A gas sample is continuously extracted from a stack and conveyed to a portable
analyzer for determination of NO, NO2, CO, and O2 gas concentrations using electrochemical
cells. Analyzer design specifications, performance specifications, and test procedures are
provided to ensure reliable data. Additions to or modifications of vendor-supplied analyzers
(e.g. heated sample line, flow meters, etc.) may be required to meet the design specifications of
this test method.
2. RANGE AND SENSITIVITY
2.1 Analytical Range. The analytical range for each gas component is determined by the
electrochemical cell design. A portion of the analytical range is selected to be the nominal range
by choosing a span gas concentration near the flue gas concentrations or permitted emission
level in accordance with Sections 2.1.1, 2.1.2 and 2.1.3.
Version - March 2006 Page 5
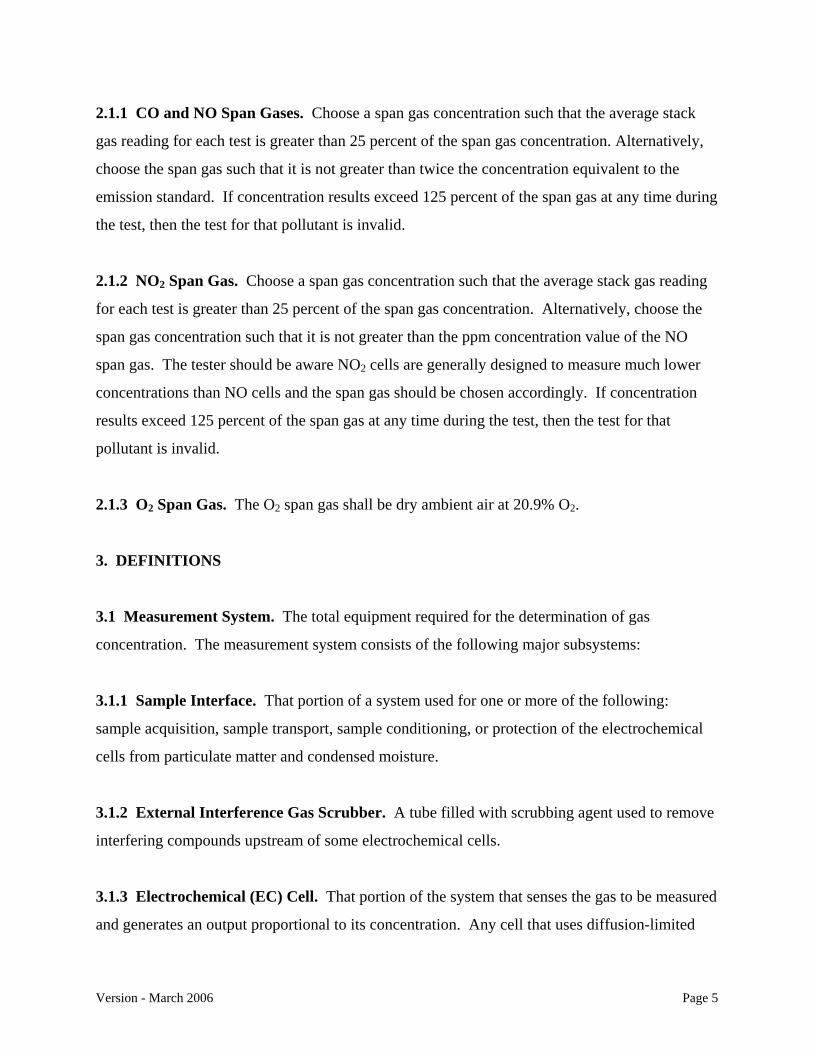
2.1.1 CO and NO Span Gases. Choose a span gas concentration such that the average stack
gas reading for each test is greater than 25 percent of the span gas concentration. Alternatively,
choose the span gas such that it is not greater than twice the concentration equivalent to the
emission standard. If concentration results exceed 125 percent of the span gas at any time during
the test, then the test for that pollutant is invalid.
2.1.2 NO2 Span Gas. Choose a span gas concentration such that the average stack gas reading
for each test is greater than 25 percent of the span gas concentration. Alternatively, choose the
span gas concentration such that it is not greater than the ppm concentration value of the NO
span gas. The tester should be aware NO2 cells are generally designed to measure much lower
concentrations than NO cells and the span gas should be chosen accordingly. If concentration
results exceed 125 percent of the span gas at any time during the test, then the test for that
pollutant is invalid.
2.1.3 O2 Span Gas. The O2 span gas shall be dry ambient air at 20.9% O2.
3. DEFINITIONS
3.1 Measurement System. The total equipment required for the determination of gas
concentration. The measurement system consists of the following major subsystems:
3.1.1 Sample Interface. That portion of a system used for one or more of the following:
sample acquisition, sample transport, sample conditioning, or protection of the electrochemical
cells from particulate matter and condensed moisture.
3.1.2 External Interference Gas Scrubber. A tube filled with scrubbing agent used to remove
interfering compounds upstream of some electrochemical cells.
3.1.3 Electrochemical (EC) Cell. That portion of the system that senses the gas to be measured
and generates an output proportional to its concentration. Any cell that uses diffusion-limited

Version - March 2006 Page 6
oxidation and reduction reactions to produce an electrical potential between a sensing electrode
and a counter electrode.
3.1.4 Data Recorder. It is recommended that the analyzers be equipped with a strip chart
recorder, computer, or digital recorder for recording measurement data. However, the operator
may record the test results manually in accordance with the requirements of Section 7.5.
3.2 Nominal Range. The range of concentrations over which each cell is operated (25 to 125
percent of span gas value). Several nominal ranges may be used for any given cell as long as the
linearity and stability check results remain within specification.
3.3 Span Gas. The high level concentration gas chosen for each nominal range.
3.4 Zero Calibration Error. The absolute value of the difference, expressed as a percent of the
span gas, between the gas concentration exhibited by the gas analyzer when a zero level
calibration gas is introduced to the analyzer and the known concentration of the zero level
calibration gas.
3.5 Span Calibration Error. The absolute value of the difference, expressed as a percent of
the span gas, between the gas concentration exhibited by the gas analyzer when a span gas is
introduced to the analyzer and the known concentration of the span gas.
3.6 Response Time. The amount of time required for the measurement system to display 95
percent of a step change in the NO or CO gas concentration on the data recorder (90 percent of a
step change for NO2).
3.7 Interference Check. A method of quantifying analytical interferences from components in
the stack gas other than the analyte.

Version - March 2006 Page 7
3.8 Linearity Check. A method of demonstrating the ability of a gas analyzer to respond
consistently over a range of gas concentrations.
3.9 Stability Check. A method of demonstrating an electrochemical cell operated over a given
nominal range provides a stable response and is not significantly affected by prolonged exposure
to the analyte.
3.10 Stability Time. As determined during the stability check; the elapsed time from the start
of the gas injection until a stable reading has been achieved.
3.11 Initial NO Cell Temperature. The temperature of the NO cell during the pretest
calibration error check. Since the NO cell can experience significant zero drift with cell
temperature changes in some situations, the cell temperature must be monitored if the analyzer
does not display negative concentration results. Alternatively, manufacturer’s documentation
may be submitted showing the analyzer incorporates a NO cell temperature control and
temperature exceedance warning system.
3.12 Test. The collection of emissions data from a source for an equal amount of time at each
sample point and for a minimum of 21 minutes total.
4. MEASUREMENT SYSTEM PERFORMANCE SPECIFICATIONS
4.1 Zero Calibration Error. Less than or equal to ±3 percent of the span gas value for NO,
NO2, and CO channels and less than or equal to ±0.3 percent O2 for the O2 channel.
4.2 Span Calibration Error. Less than or equal to ±5 percent of the span gas value for NO,
NO2, and CO channels and less than or equal to ±0.5 percent O2 for the O2 channel.
4.3 Interference Response. The CO and NO interference responses must be less than or equal
to 5 percent as calculated in accordance with Section 7.7.
Version - March 2006 Page 8
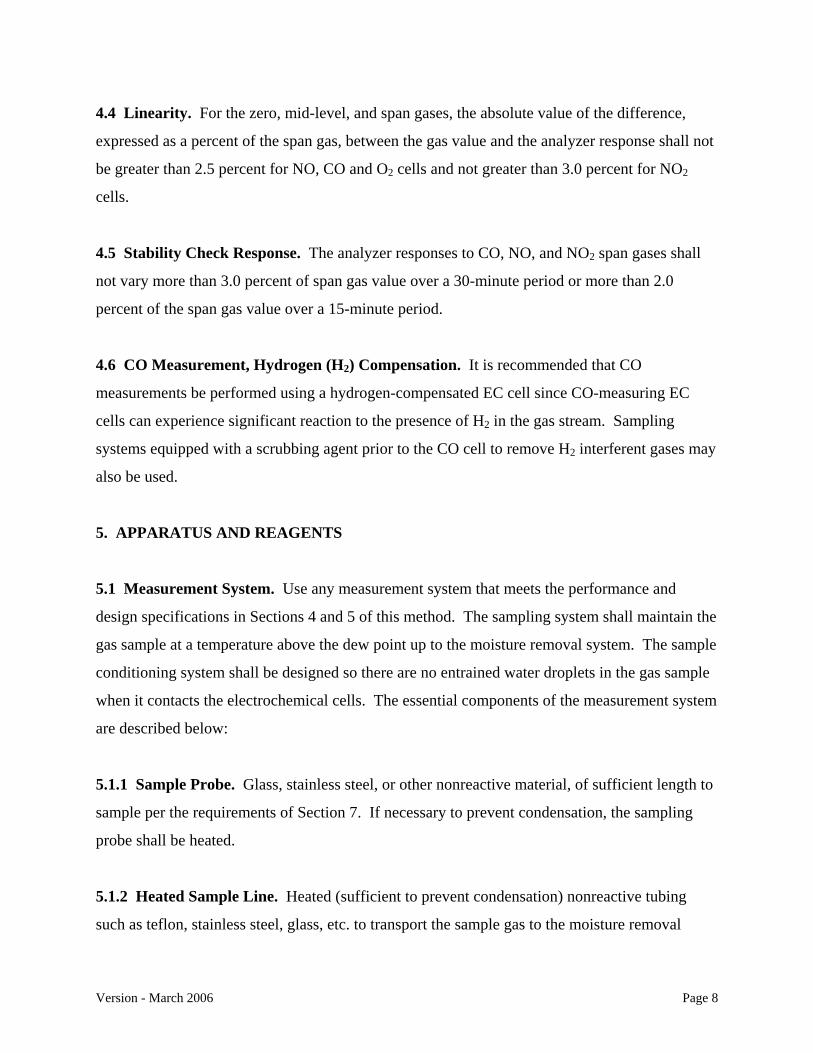
4.4 Linearity. For the zero, mid-level, and span gases, the absolute value of the difference,
expressed as a percent of the span gas, between the gas value and the analyzer response shall not
be greater than 2.5 percent for NO, CO and O2 cells and not greater than 3.0 percent for NO2
cells.
4.5 Stability Check Response. The analyzer responses to CO, NO, and NO2 span gases shall
not vary more than 3.0 percent of span gas value over a 30-minute period or more than 2.0
percent of the span gas value over a 15-minute period.
4.6 CO Measurement, Hydrogen (H2) Compensation. It is recommended that CO
measurements be performed using a hydrogen-compensated EC cell since CO-measuring EC
cells can experience significant reaction to the presence of H2 in the gas stream. Sampling
systems equipped with a scrubbing agent prior to the CO cell to remove H2 interferent gases may
also be used.
5. APPARATUS AND REAGENTS
5.1 Measurement System. Use any measurement system that meets the performance and
design specifications in Sections 4 and 5 of this method. The sampling system shall maintain the
gas sample at a temperature above the dew point up to the moisture removal system. The sample
conditioning system shall be designed so there are no entrained water droplets in the gas sample
when it contacts the electrochemical cells. The essential components of the measurement system
are described below:
5.1.1 Sample Probe. Glass, stainless steel, or other nonreactive material, of sufficient length to
sample per the requirements of Section 7. If necessary to prevent condensation, the sampling
probe shall be heated.
5.1.2 Heated Sample Line. Heated (sufficient to prevent condensation) nonreactive tubing
such as teflon, stainless steel, glass, etc. to transport the sample gas to the moisture removal

Version - March 2006 Page 9
system. (Includes any particulate filters prior to the moisture removal system.)
5.1.3 Sample Transport Lines. Nonreactive tubing such as teflon, stainless steel, glass, etc. to
transport the sample from the moisture removal system to the sample pump, sample flow rate
control, and electrochemical cells.
5.1.4 Calibration Assembly. A tee fitting to attach to the probe tip or where the probe attaches
to the sample line for introducing calibration gases at ambient pressure during the calibration
error checks. The vented end of the tee should have a flow indicator to ensure sufficient
calibration gas flow. Alternatively, use any other method that introduces calibration gases at the
probe at atmospheric pressure.
5.1.5 Moisture Removal System. A chilled condenser or similar device (e.g., permeation
dryer) to remove condensate continuously from the sample gas while maintaining minimal
contact between the condensate and the sample gas.
5.1.6 Particulate Filter. Filters at the probe or the inlet or outlet of the moisture removal
system and inlet of the analyzer may be used to prevent accumulation of particulate material in
the measurement system and extend the useful life of the components. All filters shall be
fabricated of materials that are nonreactive to the gas being sampled.
5.1.7 Sample Pump. A leak-free pump to pull the sample gas through the system at a flow rate
sufficient to minimize the response time of the measurement system. The pump may be
constructed of any material that is nonreactive to the gas being sampled.
5.1.8 Sample Flow Rate Control. A sample flow rate control valve and rotameter, or
equivalent, to maintain a constant sampling rate within 10 percent during sampling and
calibration error checks. The components shall be fabricated of materials that are nonreactive to
the gas being sampled.

Version - March 2006 Page 10
5.1.9 Gas Analyzer. A device containing electrochemical cells to determine the NO, NO2, CO,
and O2 concentrations in the sample gas stream and, if necessary, to correct for interference
effects. The analyzer shall meet the applicable performance specifications of Section 4. A
means of controlling the analyzer flow rate and a device for determining proper sample flow rate
(e.g., precision rotameter, pressure gauge downstream of all flow controls, etc.) shall be provided
at the analyzer. (Note: Housing the analyzer in a clean, thermally-stable, vibration-free
environment will minimize drift in the analyzer calibration, but this is not a requirement of the
method.)
5.1.10 Data Recorder. A strip chart recorder, computer, or digital recorder, for recording data.
The data recorder resolution (i.e., readability) shall be at least 1 ppm for CO, NO, and NO2; 0.1
percent O2 for O2; and one degree (C or F) for temperature.
5.1.11 External Interference Gas Scrubber. Used by some analyzers to remove interfering
compounds upstream of a CO electrochemical cell. The scrubbing agent should be visible and
should have a means of determining when the agent is exhausted (e.g., color indication).
5.1.12 NO Cell Temperature Indicator. A thermocouple, thermistor, or other device must be
used to monitor the temperature of the NO electrochemical cell. The temperature may be
monitored at the surface of the cell, within the cell or in the cell compartment. Alternatively,
manufacturer’s documentation may be submitted showing the analyzer incorporates a NO cell
temperature control and temperature exceedance warning system.
5.1.13 Dilution Systems. The use of dilution systems will be allowed with prior approval of the
Air Pollution Control Division.
5.2 Calibration Gases. The CO, NO, and NO2 calibration gases for the gas analyzer shall be
CO in nitrogen or CO in nitrogen and O2, NO in nitrogen, and NO2 in air or nitrogen. The mid-
level O2 gas shall be O2 in nitrogen.

Version - March 2006 Page 11
5.2.1 Span Gases. Used for calibration error, linearity, and interference checks of each nominal
range of each cell. Select concentrations according to procedures in Section 2.1. Clean dry air
may be used as the span gas for the O2 cell as specified in Section 2.1.3.
5.2.2 Mid-Level Gases. Select concentrations that are 40-60 percent of the span gas
concentrations.
5.2.3 Zero Gas. Concentration of less than 0.25 percent of the span gas for each component.
Ambient air may be used in a well ventilated area for the CO, NO, and NO2 zero gases.
6. MEASUREMENT SYSTEM PERFORMANCE CHECK PROCEDURES. Perform the
following procedures before the measurement of emissions under Section 7.
6.1 Calibration Gas Concentration Certification. For the mid-level and span cylinder gases,
use calibration gases certified according to EPA Protocol 1 procedures. Calibration gases must
meet the criteria under 40 CFR 60, Appendix F, Section 5.1.2 (3). Expired Protocol 1 gases may
be recertified using the applicable reference methods.
6.2 Linearity Check. Conduct the following procedure once for each nominal range to be used
on each electrochemical cell (NO, NO2, CO, and O2). After a linearity check is completed, it
remains valid for five consecutive calendar days. After the five calendar day period has elapsed,
the linearity check must be performed again. Additionally, perform the linearity check again if
the cell is replaced. (If the stack NO2 concentration is less than 5% of the stack NO
concentration as determined using the emission test procedures under Section 7, the NO2
linearity check is not required. However, the NO2 cell shall be calibrated in accordance with the
manufacturer’s instructions, the pretest calibration error check and post test calibration error
check shall be conducted in accordance with Section 7, and the test results shall be added to the
NO test values to obtain a total NOX concentration.)
6.2.1 Linearity Check Gases. For each cell obtain the following gases: zero (0-0.25 percent of
Version - March 2006 Page 12
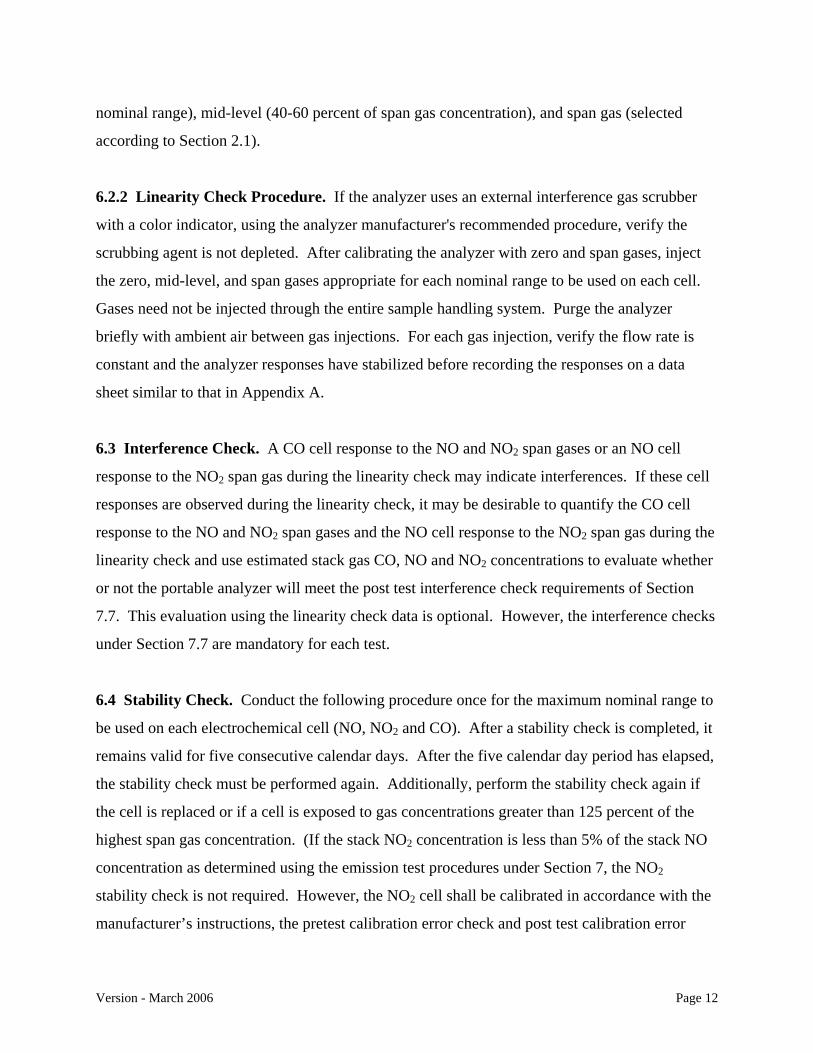
nominal range), mid-level (40-60 percent of span gas concentration), and span gas (selected
according to Section 2.1).
6.2.2 Linearity Check Procedure. If the analyzer uses an external interference gas scrubber
with a color indicator, using the analyzer manufacturer's recommended procedure, verify the
scrubbing agent is not depleted. After calibrating the analyzer with zero and span gases, inject
the zero, mid-level, and span gases appropriate for each nominal range to be used on each cell.
Gases need not be injected through the entire sample handling system. Purge the analyzer
briefly with ambient air between gas injections. For each gas injection, verify the flow rate is
constant and the analyzer responses have stabilized before recording the responses on a data
sheet similar to that in Appendix A.
6.3 Interference Check. A CO cell response to the NO and NO2 span gases or an NO cell
response to the NO2 span gas during the linearity check may indicate interferences. If these cell
responses are observed during the linearity check, it may be desirable to quantify the CO cell
response to the NO and NO2 span gases and the NO cell response to the NO2 span gas during the
linearity check and use estimated stack gas CO, NO and NO2 concentrations to evaluate whether
or not the portable analyzer will meet the post test interference check requirements of Section
7.7. This evaluation using the linearity check data is optional. However, the interference checks
under Section 7.7 are mandatory for each test.
6.4 Stability Check. Conduct the following procedure once for the maximum nominal range to
be used on each electrochemical cell (NO, NO2 and CO). After a stability check is completed, it
remains valid for five consecutive calendar days. After the five calendar day period has elapsed,
the stability check must be performed again. Additionally, perform the stability check again if
the cell is replaced or if a cell is exposed to gas concentrations greater than 125 percent of the
highest span gas concentration. (If the stack NO2 concentration is less than 5% of the stack NO
concentration as determined using the emission test procedures under Section 7, the NO2
stability check is not required. However, the NO2 cell shall be calibrated in accordance with the
manufacturer’s instructions, the pretest calibration error check and post test calibration error
Version - March 2006 Page 13
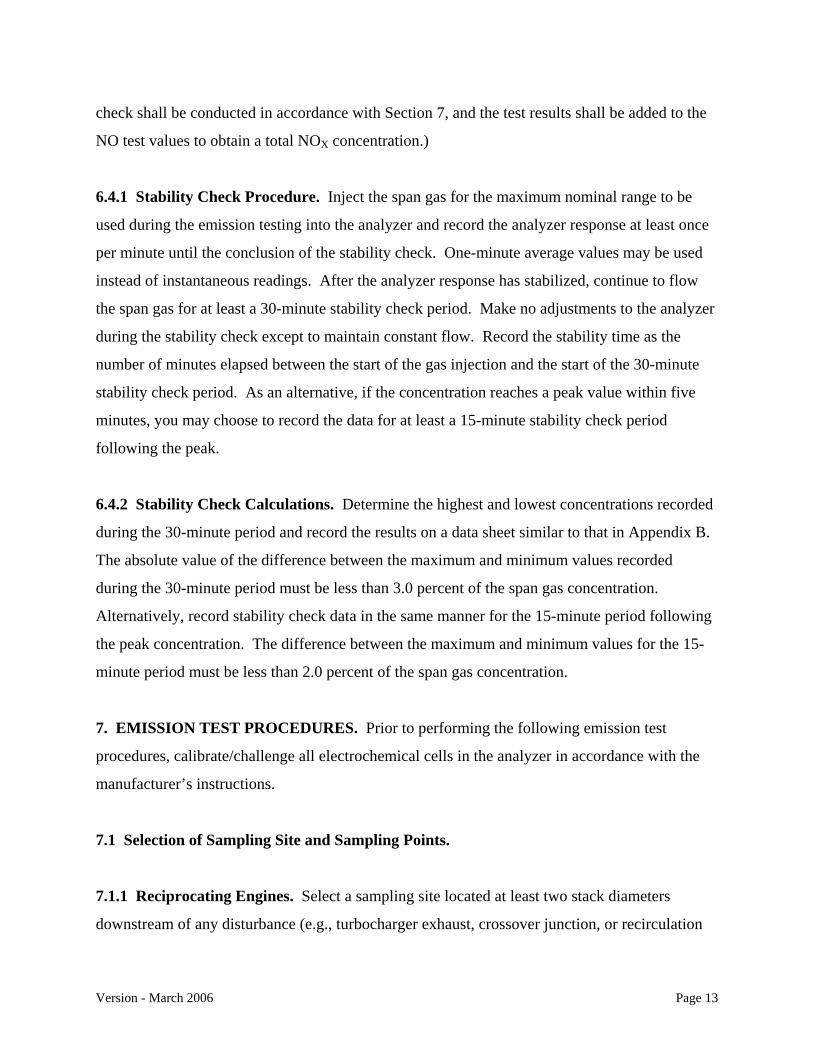
check shall be conducted in accordance with Section 7, and the test results shall be added to the
NO test values to obtain a total NOX concentration.)
6.4.1 Stability Check Procedure. Inject the span gas for the maximum nominal range to be
used during the emission testing into the analyzer and record the analyzer response at least once
per minute until the conclusion of the stability check. One-minute average values may be used
instead of instantaneous readings. After the analyzer response has stabilized, continue to flow
the span gas for at least a 30-minute stability check period. Make no adjustments to the analyzer
during the stability check except to maintain constant flow. Record the stability time as the
number of minutes elapsed between the start of the gas injection and the start of the 30-minute
stability check period. As an alternative, if the concentration reaches a peak value within five
minutes, you may choose to record the data for at least a 15-minute stability check period
following the peak.
6.4.2 Stability Check Calculations. Determine the highest and lowest concentrations recorded
during the 30-minute period and record the results on a data sheet similar to that in Appendix B.
The absolute value of the difference between the maximum and minimum values recorded
during the 30-minute period must be less than 3.0 percent of the span gas concentration.
Alternatively, record stability check data in the same manner for the 15-minute period following
the peak concentration. The difference between the maximum and minimum values for the 15-
minute period must be less than 2.0 percent of the span gas concentration.
7. EMISSION TEST PROCEDURES. Prior to performing the following emission test
procedures, calibrate/challenge all electrochemical cells in the analyzer in accordance with the
manufacturer’s instructions.
7.1 Selection of Sampling Site and Sampling Points.
7.1.1 Reciprocating Engines. Select a sampling site located at least two stack diameters
downstream of any disturbance (e.g., turbocharger exhaust, crossover junction, or recirculation

Version - March 2006 Page 14
take-offs) and one half stack diameter upstream of the gas discharge to the atmosphere or any
disturbance. Use a sampling location at a single point near the center of the duct.
7.1.2 Combustion Turbines. Select a sampling site and sample points according to the
procedures in 40 CFR 60, Appendix A, Method 20. Alternatively, the tester may choose an
alternative sampling location and/or sample from a single point in the center of the duct if
previous test data demonstrate the stack gas concentrations of CO, NOX, and O2 do not vary
significantly across the duct diameter.
7.1.3 Boilers/Process Heaters. Select a sampling site located at least two stack diameters
downstream of any disturbance and one half stack diameter upstream of the gas discharge to the
atmosphere or any disturbance. Use a sampling location at a single point near the center of the
duct.
7.2 Warm Up Period. Assemble the sampling system and allow the analyzer and sample
interface to warm up and adjust to ambient temperature at the location where the stack
measurements will take place.
7.3 Pretest Calibration Error Check. Conduct a zero and span calibration error check before
testing each new source. Conduct the calibration error check near the sampling location just
prior to the start of an emissions test. Keep the analyzer in the same location until the post test
calibration error check is conducted.
7.3.1 Scrubber Inspection. For analyzers that use an external interference gas scrubber tube,
inspect the condition of the scrubbing agent and ensure it will not be exhausted during sampling.
If scrubbing agents are recommended by the manufacturer, they should be in place during all
sampling, calibration and performance checks.
7.3.2 Zero and Span Procedures. Inject the zero and span gases using the calibration
assembly. Ensure the calibration gases flow through all parts of the sample interface. During

Version - March 2006 Page 15
this check, make no adjustments to the system except those necessary to achieve the correct
calibration gas flow rate at the analyzer. Set the analyzer flow rate to the value recommended by
the analyzer manufacturer. Allow each reading to stabilize before recording the result on a data
sheet similar to that in Appendix C. The time allowed for the span gas to stabilize shall be no
less than the stability time noted during the stability check. After achieving a stable response,
disconnect the gas and briefly purge with ambient air.
7.3.3 Response Time Determination. Determine the NO and CO response times by observing
the time required to respond to 95 percent of a step change in the analyzer response for both the
zero and span gases. Note the longer of the two times as the response time. For the NO2 span
gas record the time required to respond to 90 percent of a step change.
7.3.4 Failed Pretest Calibration Error Check. If the zero and span calibration error check
results are not within the specifications in Section 4, take corrective action and repeat the
calibration error check until acceptable performance is achieved.
7.4 NO Cell Temperature Monitoring. Record the initial NO cell temperature during the
pretest calibration error check on a data sheet similar to that in Appendix C and monitor and
record the temperature regularly (at least once each 7 minutes) during the sample collection
period. If at any time during sampling, the NO cell temperature is 85 degrees F or greater and
has increased or decreased by more than 5 degrees F since the pretest calibration, stop sampling
immediately and conduct a post test calibration error check per Section 7.6, re-zero the analyzer,
and then conduct another pretest calibration error check per Section 7.3 before continuing. (It is
recommended that testing be discontinued if the NO cell exceeds 85 degrees F since the design
characteristics of the NO cell indicate a significant measurement error can occur as the
temperature of the NO cell increases above this temperature. From a review of available data,
these errors appear to result in a positive bias of the test results.)
Alternatively, manufacturer’s documentation may be submitted showing the analyzer is
configured with an automatic temperature control system to maintain the cell temperature below
Version - March 2006 Page 16
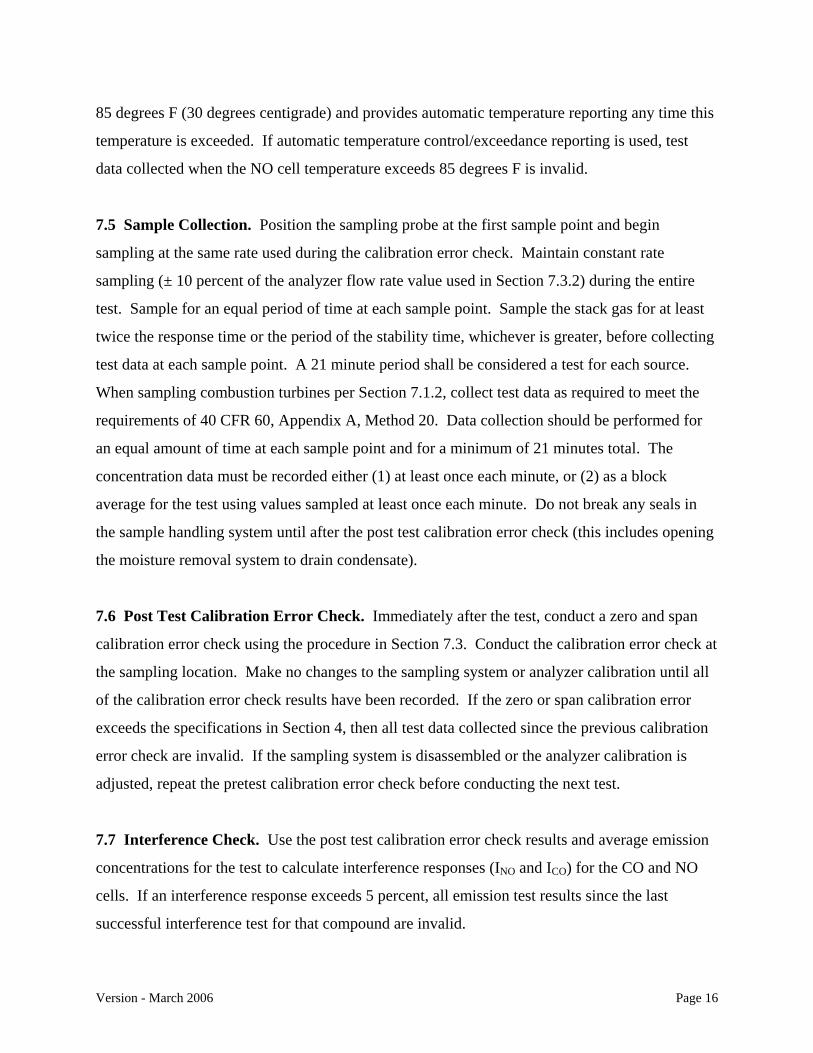
85 degrees F (30 degrees centigrade) and provides automatic temperature reporting any time this
temperature is exceeded. If automatic temperature control/exceedance reporting is used, test
data collected when the NO cell temperature exceeds 85 degrees F is invalid.
7.5 Sample Collection. Position the sampling probe at the first sample point and begin
sampling at the same rate used during the calibration error check. Maintain constant rate
sampling (± 10 percent of the analyzer flow rate value used in Section 7.3.2) during the entire
test. Sample for an equal period of time at each sample point. Sample the stack gas for at least
twice the response time or the period of the stability time, whichever is greater, before collecting
test data at each sample point. A 21 minute period shall be considered a test for each source.
When sampling combustion turbines per Section 7.1.2, collect test data as required to meet the
requirements of 40 CFR 60, Appendix A, Method 20. Data collection should be performed for
an equal amount of time at each sample point and for a minimum of 21 minutes total. The
concentration data must be recorded either (1) at least once each minute, or (2) as a block
average for the test using values sampled at least once each minute. Do not break any seals in
the sample handling system until after the post test calibration error check (this includes opening
the moisture removal system to drain condensate).
7.6 Post Test Calibration Error Check. Immediately after the test, conduct a zero and span
calibration error check using the procedure in Section 7.3. Conduct the calibration error check at
the sampling location. Make no changes to the sampling system or analyzer calibration until all
of the calibration error check results have been recorded. If the zero or span calibration error
exceeds the specifications in Section 4, then all test data collected since the previous calibration
error check are invalid. If the sampling system is disassembled or the analyzer calibration is
adjusted, repeat the pretest calibration error check before conducting the next test.
7.7 Interference Check. Use the post test calibration error check results and average emission
concentrations for the test to calculate interference responses (INO and ICO) for the CO and NO
cells. If an interference response exceeds 5 percent, all emission test results since the last
successful interference test for that compound are invalid.

Version - March 2006 Page 17
7.7.1 CO Interference Response.
where: ICO = CO interference response (percent)
RCO-NO = CO response to NO span gas (ppm CO)
CNOG = concentration of NO span gas (ppm NO)
CNOS = concentration of NO in stack gas (ppm NO)
CCOS = concentration of CO in stack gas (ppm CO)
RCO-NO2 = CO response to NO2 span gas (ppm CO)
CNO2G = concentration of NO2 span gas (ppm NO2)
CNO2S = concentration of NO2 in stack gas (ppm NO2)
7.7.2 NO Interference Response.
where: INO = NO interference response (percent)
RNO-NO2 = NO response to NO2 span gas (ppm NO)
CNO2G = concentration of NO2 span gas (ppm NO2)
CNO2S = concentration of NO2 in stack gas (ppm NO2)
CNOxS = concentration of NOX in stack gas (ppm NOX)
7.8 Re-Zero. At least once every three hours, recalibrate the analyzer at the zero level
according to the manufacturer’s instructions and conduct a pretest calibration error check before
resuming sampling. If the analyzer is capable of reporting negative concentration data (at least 5
percent of the span gas below zero), then the tester is not required to re-zero the analyzer.
)]x100CC)(
CR(+)
CC)(
CR[(=I
SNO
GNO
NO-CONOS
NOG
NO-COCO
2
2
2
COSCOS
)x100CC)(
CR(=I
SNO
SNO
GNO
NO-NONO
X
2
2
2
Version - March 2006 Page 18
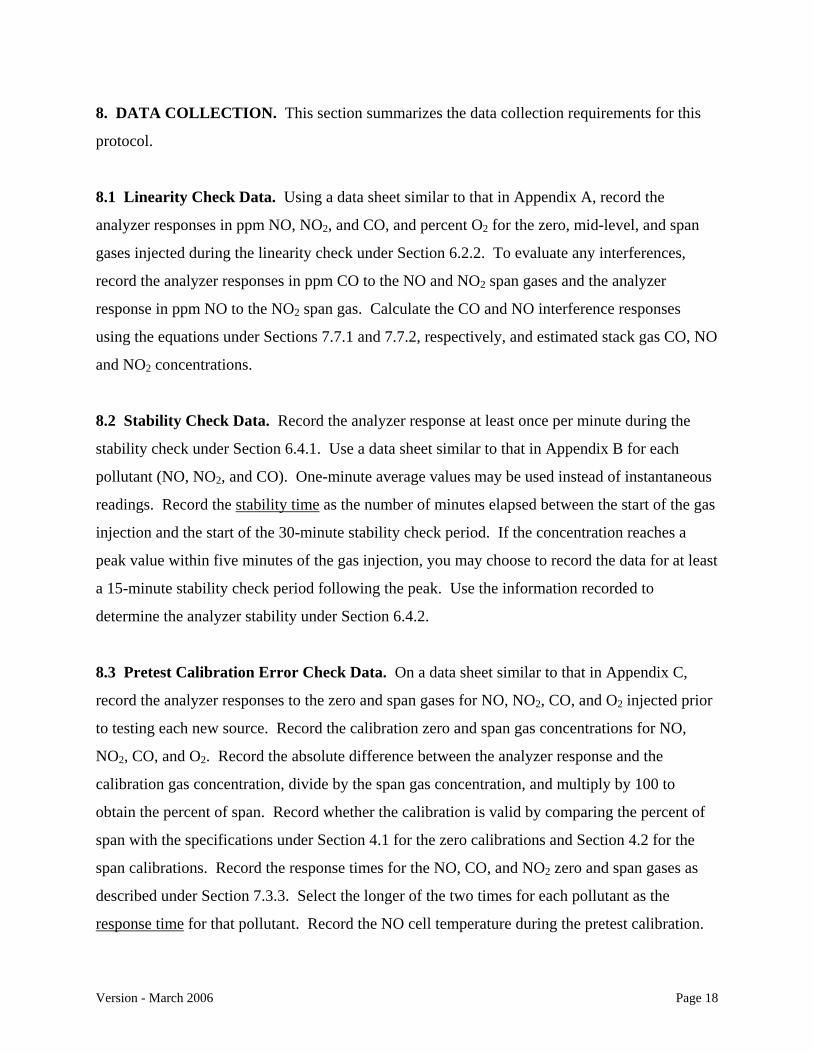
8. DATA COLLECTION. This section summarizes the data collection requirements for this
protocol.
8.1 Linearity Check Data. Using a data sheet similar to that in Appendix A, record the
analyzer responses in ppm NO, NO2, and CO, and percent O2 for the zero, mid-level, and span
gases injected during the linearity check under Section 6.2.2. To evaluate any interferences,
record the analyzer responses in ppm CO to the NO and NO2 span gases and the analyzer
response in ppm NO to the NO2 span gas. Calculate the CO and NO interference responses
using the equations under Sections 7.7.1 and 7.7.2, respectively, and estimated stack gas CO, NO
and NO2 concentrations.
8.2 Stability Check Data. Record the analyzer response at least once per minute during the
stability check under Section 6.4.1. Use a data sheet similar to that in Appendix B for each
pollutant (NO, NO2, and CO). One-minute average values may be used instead of instantaneous
readings. Record the stability time as the number of minutes elapsed between the start of the gas
injection and the start of the 30-minute stability check period. If the concentration reaches a
peak value within five minutes of the gas injection, you may choose to record the data for at least
a 15-minute stability check period following the peak. Use the information recorded to
determine the analyzer stability under Section 6.4.2.
8.3 Pretest Calibration Error Check Data. On a data sheet similar to that in Appendix C,
record the analyzer responses to the zero and span gases for NO, NO2, CO, and O2 injected prior
to testing each new source. Record the calibration zero and span gas concentrations for NO,
NO2, CO, and O2. Record the absolute difference between the analyzer response and the
calibration gas concentration, divide by the span gas concentration, and multiply by 100 to
obtain the percent of span. Record whether the calibration is valid by comparing the percent of
span with the specifications under Section 4.1 for the zero calibrations and Section 4.2 for the
span calibrations. Record the response times for the NO, CO, and NO2 zero and span gases as
described under Section 7.3.3. Select the longer of the two times for each pollutant as the
response time for that pollutant. Record the NO cell temperature during the pretest calibration.
Version - March 2006 Page 19
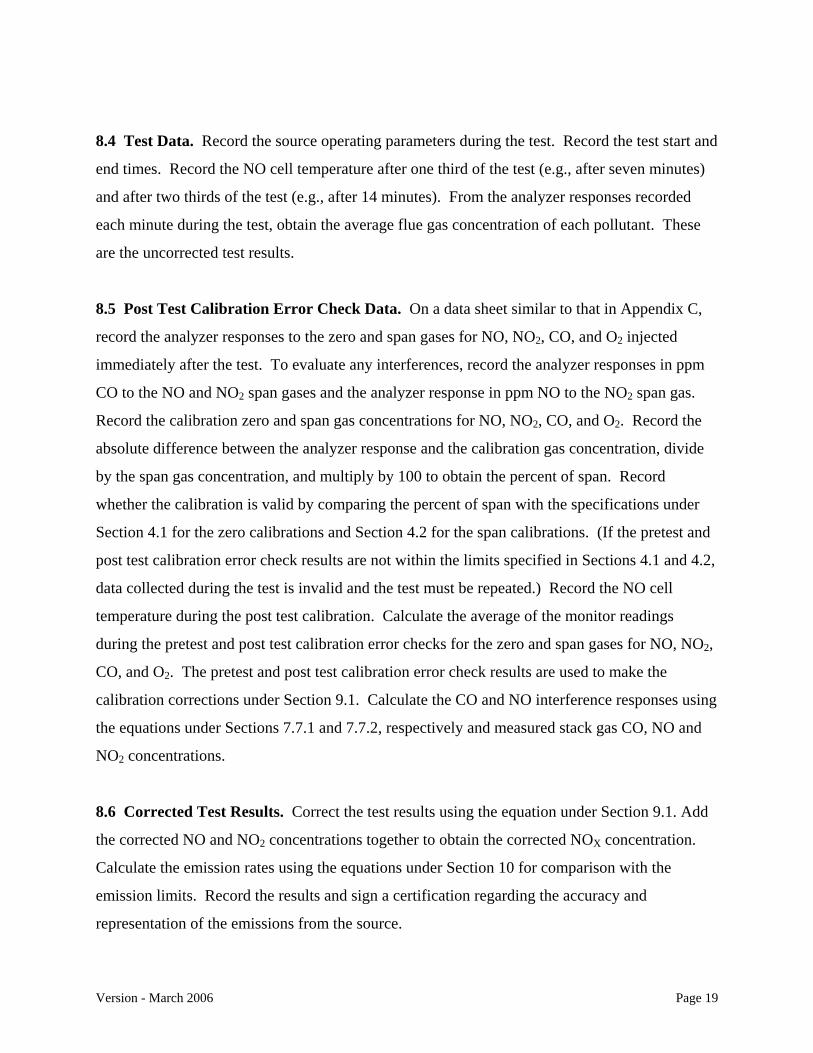
8.4 Test Data. Record the source operating parameters during the test. Record the test start and
end times. Record the NO cell temperature after one third of the test (e.g., after seven minutes)
and after two thirds of the test (e.g., after 14 minutes). From the analyzer responses recorded
each minute during the test, obtain the average flue gas concentration of each pollutant. These
are the uncorrected test results.
8.5 Post Test Calibration Error Check Data. On a data sheet similar to that in Appendix C,
record the analyzer responses to the zero and span gases for NO, NO2, CO, and O2 injected
immediately after the test. To evaluate any interferences, record the analyzer responses in ppm
CO to the NO and NO2 span gases and the analyzer response in ppm NO to the NO2 span gas.
Record the calibration zero and span gas concentrations for NO, NO2, CO, and O2. Record the
absolute difference between the analyzer response and the calibration gas concentration, divide
by the span gas concentration, and multiply by 100 to obtain the percent of span. Record
whether the calibration is valid by comparing the percent of span with the specifications under
Section 4.1 for the zero calibrations and Section 4.2 for the span calibrations. (If the pretest and
post test calibration error check results are not within the limits specified in Sections 4.1 and 4.2,
data collected during the test is invalid and the test must be repeated.) Record the NO cell
temperature during the post test calibration. Calculate the average of the monitor readings
during the pretest and post test calibration error checks for the zero and span gases for NO, NO2,
CO, and O2. The pretest and post test calibration error check results are used to make the
calibration corrections under Section 9.1. Calculate the CO and NO interference responses using
the equations under Sections 7.7.1 and 7.7.2, respectively and measured stack gas CO, NO and
NO2 concentrations.
8.6 Corrected Test Results. Correct the test results using the equation under Section 9.1. Add
the corrected NO and NO2 concentrations together to obtain the corrected NOX concentration.
Calculate the emission rates using the equations under Section 10 for comparison with the
emission limits. Record the results and sign a certification regarding the accuracy and
representation of the emissions from the source.

Version - March 2006 Page 20
9. CALIBRATION CORRECTIONS
9.1 Emission Data Corrections. Emissions data shall be corrected for a test using the
following equation. (Note: If the pretest and post test calibration error check results are not
within the limits specified in Sections 4.1 and 4.2, the test results are invalid and the test must be
repeated.)
where: CCorrected = corrected flue gas concentration (ppm) CR = flue gas concentration indicated by gas analyzer (ppm) Co = average of pretest and post test analyzer readings during the zero checks (ppm) CM = average of pretest and post test analyzer readings during the span checks (ppm) CMA = actual concentration of span gas (ppm)
10. EMISSION CALCULATIONS 10.1 Emission Calculations for Reciprocating Engines and Combustion Turbines.
Emissions shall be calculated and reported in units of the allowable emission limit as specified in
the permit. The allowable may be stated in pounds per hour (lb/hr) or tons per year (ton/yr), or
both. EPA Reference Method 19 shall be used as the basis for calculating the emissions. As an
alternative, EPA Reference Methods 1-4 may be used to obtain a stack volumetric flow rate.
10.1.1 Reciprocating Engines and Combustion Turbines Equipped with Fuel Meters. EPA
Reference Method 19 and heat input per hour (MMBtu/hr) shall be used to calculate a pound per
hour emission rate. A ton per year emission rate shall be calculated by multiplying the pound
per hour emission rate by 8760 hours, divided by 2000 pounds per ton. If the hours of operation
of the unit are limited by a permit limit, the tons per year shall be calculated using the number of
hours the unit is limited to. Heat input per hour shall be based on the average hourly fuel usage
rate during the test and the higher heating value of the fuel consumed. The emission rates shall
be calculated using the following equations.
C-CC)C-C(=C
OM
MAORCorrected

Version - March 2006 Page 21
Note 1 - Use 8710 dscf/MMBtu unless calculated based on actual fuel gas composition and higher heating value of
the fuel.
Note 2 - Heat input per hour (MMBtu/hr) shall be based on the average hourly fuel usage during the test and
the higher heating value of the fuel consumed.
If the combustion turbine horsepower cannot be calculated during the testing, the emissions shall
be reported in terms of concentration (ppm by volume, dry basis) corrected to 15 percent O2.
Compliance with the concentrations corrected to 15 percent O2 as submitted in the air quality
permit application and/or set as an allowable in the permit will demonstrate compliance with the
gm/hp-hr allowable. Use the following equations to correct the concentrations to 15 percent O2.
)Hour Per Input )(Heat%O-20.9
20.9)(Factor )(F10)(7.27xCO (ppm=CO lb/hr 2 Note
corrected21 Note
8-corrected
)HourPer Input )(Heat%O-20.9
20.9)(Factor )(F10)(1.19xNO (ppm=NOlb/hr 2 Notecorrected2
1 Note7-
XX corrected
tonlbyearhourshrCOlb =yrCOton
/2000)/8760)(/(/
tonlbyearhourshrNOxlb =yrNOxton
/2000)/8760)(/(/
)%O - 20.9
5.9( CO ppm = CO ppmcorrected2
correctedO 15% @ 2
)%O - 20.9
5.9( NO ppm = NO ppmcorrected2
XX correctedO2 15% @

Version - March 2006 Page 22
10.1.2 Reciprocating Engines Not Equipped with Fuel Meters. If reciprocating engines are
not equipped with fuel flow meters during the test, emissions shall be calculated using the
default specific fuel consumption factors, based on the higher heating value of the fuel, of 9,400
Btu/hp-hr for 4-cycle engines (controlled and uncontrolled) and 2-cycle lean burn engines and
11,000 Btu/hp-hr for 2-cycle uncontrolled (non-lean burn) engines. The following equations
shall be used to calculate emissions.
Note 1 - Use 8710 dscf/MMBtu unless calculated based on actual fuel gas composition and higher heating value of
the fuel.
Note 2 - Default Specific Fuel Consumption (Btu/hp-hr) shall be as defined above for the particular type of engine tested.
10.2 Emission Calculations for Heaters/Boilers. For heaters and boilers, pound per million
Btu (lb/MMBtu) emission rates shall be calculated based on EPA Reference Method 19. The
pound per million Btu emission rates shall be converted to pound per hour emission rates using
heat input per hour (MMBtu/hr). The heat input per hour shall be calculated using the average
hourly fuel usage rate during test and the higher heating value of the fuel consumed or the
permitted maximum heat input per hour for the boiler or heater. If a fuel meter is used to obtain
)%O-20.9
20.9)(Factor )(F10)(1.19xNO (ppm=NO lb/MMBtucorrected2
1 Note7-
XX corrected
)%O-20.9
20.9)(Factor )(F10)(7.27xCO (ppm=COlb/MMBtu
corrected21 Note
8-corrected
)Input )(HeatNO(lb/MMBtu =NO lb/hr 2 NoteXX
)Input CO)(Heat(lb/MMBtu =CO lb/hr 2Note
tonlbyearhourshrNOxlb =yrNOxton
/2000)/8760)(/(/
tonlbyearhourshrCOlb =yrCOton
/2000)/8760)(/(/

Version - March 2006 Page 23
heat input per hour data, the fuel meter shall be maintained and calibrated according to the
manufacturer’s recommendations. Records of all maintenance and calibrations shall be kept for
five years. As an alternative, EPA Reference Methods 1-4 may be used to obtain a stack
volumetric flow rate. The following equations shall be used to calculate emission rates.
Note 1 - Use 8710 dscf/MMBtu unless calculated based on actual fuel gas composition and the higher heating
value of the fuel. Note 2 - Heat input shall be based on the average hourly fuel usage rate during the test and the higher heating
value of the fuel consumed if the boiler/heater is equipped with a fuel meter or the permitted maximum
heat input if a fuel meter is not available.
11. REPORTING REQUIREMENTS AND RECORD KEEPING REQUIREMENTS
)%O-20.9
20.9)(Factor )(F10)(7.27xCO (ppm=COlb/MMBtu
corrected21 Note
8-corrected
)Input )(HeatNO(lb/MMBtu =NO lb/hr 2 NoteXX
)Input CO)(Heat(lb/MMBtu =CO lb/hr 2Note
)%O-20.9
20.9)(Factor )(F10)(1.19xNO (ppm=NOlb/MMBtu
corrected21 Note
7-XX corrected
tonlbyearhourshrCOlb =yrCOton
/2000)/8760)(/(/
tonlbyearhourshrNOxlb =yrNOxton
/2000)/8760)(/(/
Version - March 2006 Page 24
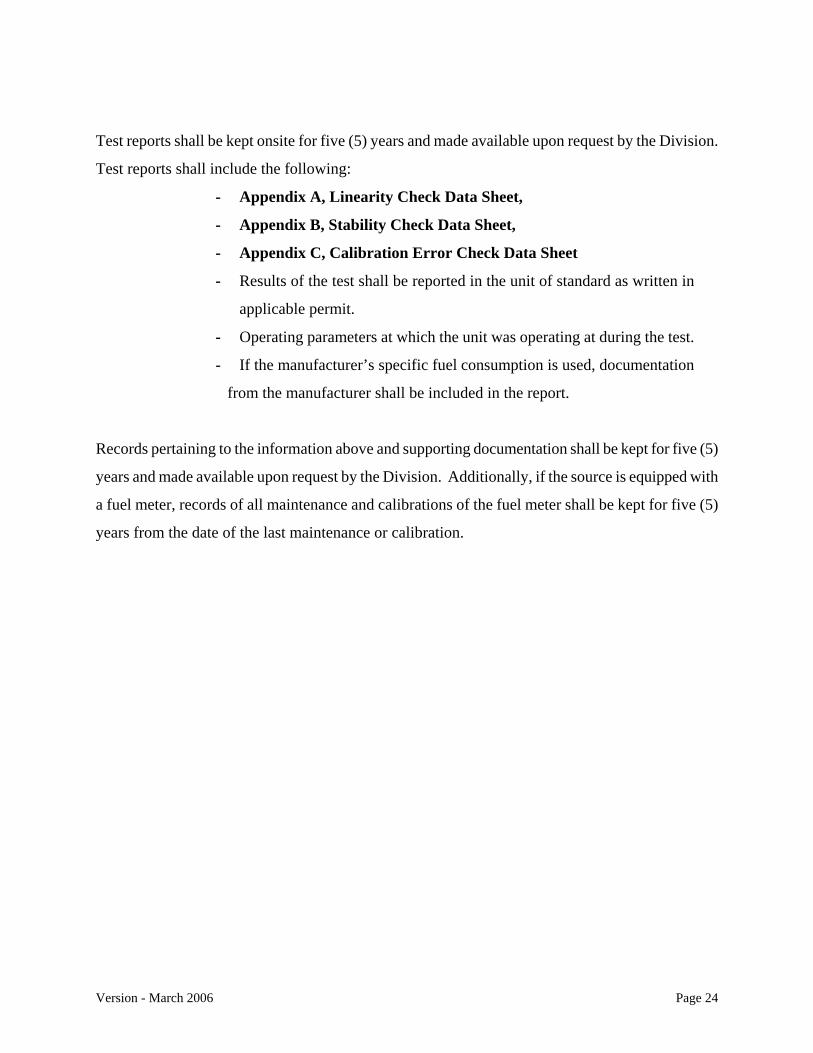
Test reports shall be kept onsite for five (5) years and made available upon request by the Division.
Test reports shall include the following:
- Appendix A, Linearity Check Data Sheet,
- Appendix B, Stability Check Data Sheet,
- Appendix C, Calibration Error Check Data Sheet
- Results of the test shall be reported in the unit of standard as written in
applicable permit.
- Operating parameters at which the unit was operating at during the test.
- If the manufacturer’s specific fuel consumption is used, documentation
from the manufacturer shall be included in the report.
Records pertaining to the information above and supporting documentation shall be kept for five (5)
years and made available upon request by the Division. Additionally, if the source is equipped with
a fuel meter, records of all maintenance and calibrations of the fuel meter shall be kept for five (5)
years from the date of the last maintenance or calibration.
Version - March 2006
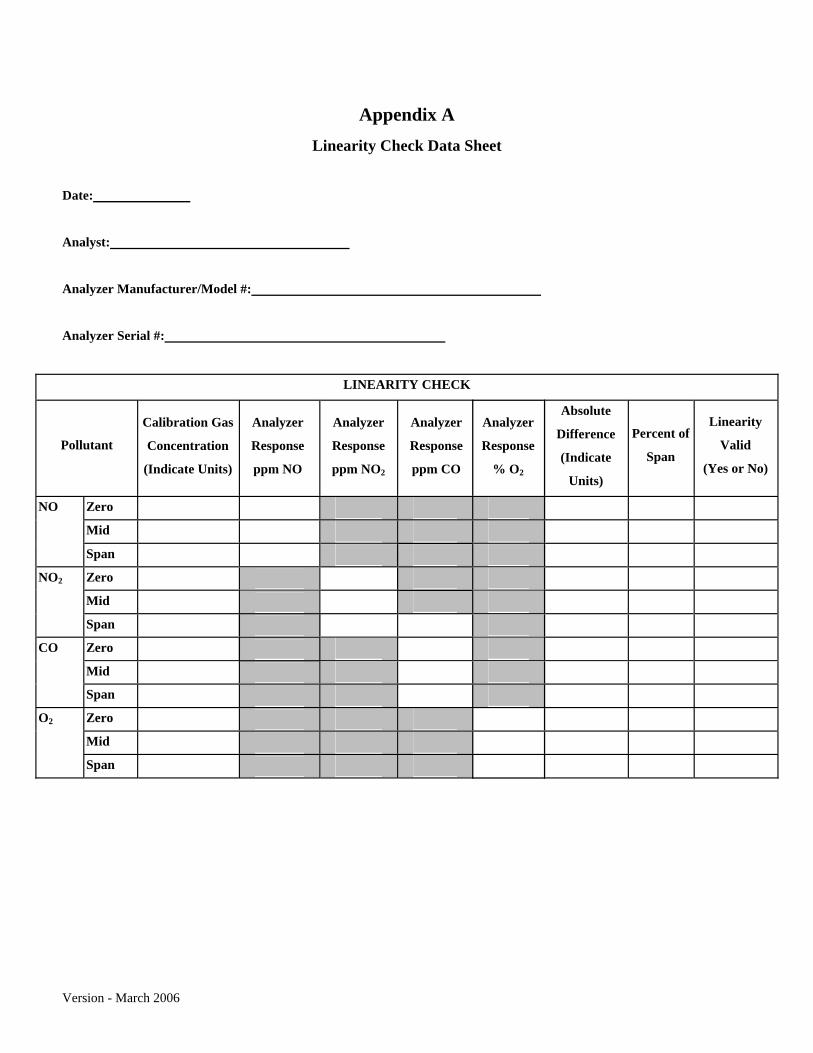
Appendix A Linearity Check Data Sheet
Date:
Analyst:
Analyzer Manufacturer/Model #:
Analyzer Serial #:
LINEARITY CHECK
Pollutant
Calibration Gas
Concentration
(Indicate Units)
Analyzer
Response
ppm NO
Analyzer
Response
ppm NO2
Analyzer
Response
ppm CO
Analyzer
Response
% O2
Absolute
Difference
(Indicate
Units)
Percent of
Span
Linearity
Valid
(Yes or No)
Zero
Mid
NO
Span
Zero
Mid
NO2
Span
Zero
Mid
CO
Span
Zero
Mid
O2
Span

Version - March 2006
Appendix B Stability Check Data Sheet
Date: Analyst: Analyzer Manufacturer/Model #: Analyzer Serial #: Pollutant: NO, NO2, CO (Circle One) Span Gas Concentration (ppm):
STABILITY CHECK
Elapsed Time
(Minutes)
Analyzer Response
Elapsed
Time (Continued)
Analyzer Response
Elapsed
Time (Continued)
Analyzer Response
1
17
33
2
18
34
3
19
35
4
20
36
5
21
37
6
22
38
7
23
39
8
24
40
9
25
41
10
26
42
11
27
43
12
28
44
13
29
45
14
30
46
15
31
47
16
32
48
For 30-minute Stability Check Period:
Maximum Concentration (ppm):
Minimum Concentration (ppm):
For 15-minute Stability Check Period:
Maximum Concentration (ppm):
Minimum Concentration (ppm):
Maximum Deviation = 100*(Max. Conc. - Min. Conc.)/Span Gas Conc. =
percent
Stability Time (minutes):
Version - March 2006
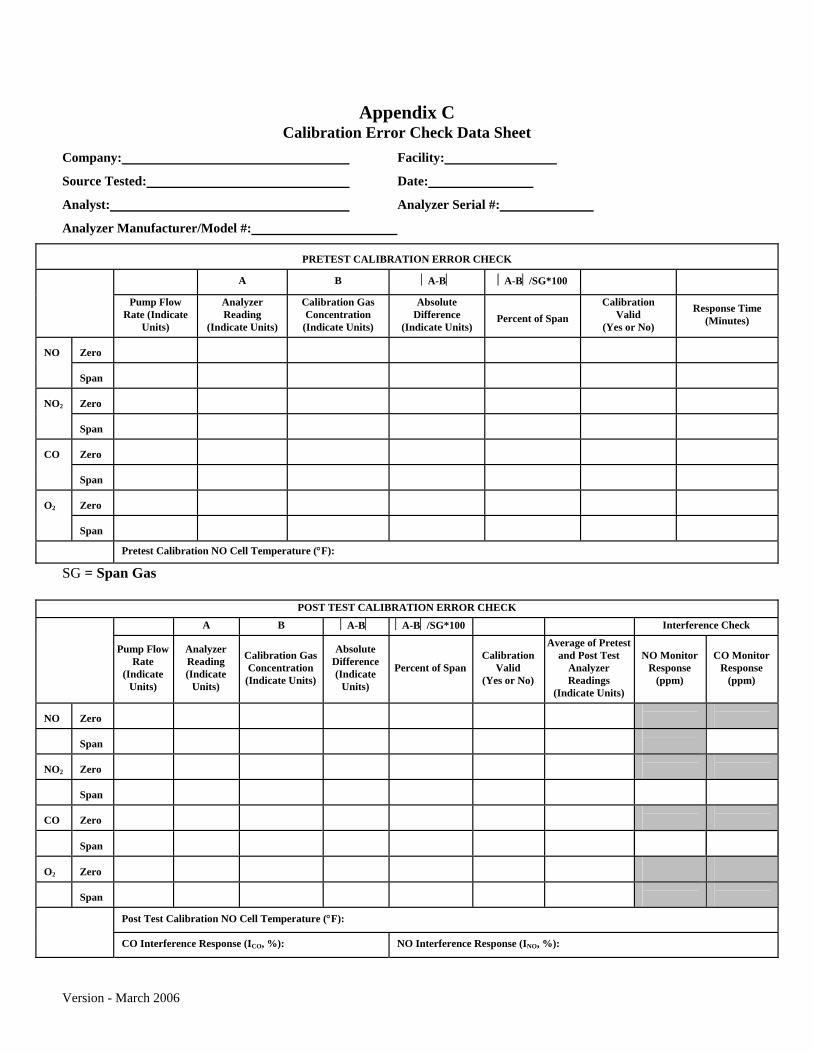
Appendix C
Calibration Error Check Data Sheet
Company: Facility:
Source Tested: Date:
Analyst: Analyzer Serial #:
Analyzer Manufacturer/Model #:
PRETEST CALIBRATION ERROR CHECK
A B ⏐A-B⏐ ⏐A-B⏐/SG*100
Pump Flow Rate (Indicate
Units)
Analyzer Reading
(Indicate Units)
Calibration Gas Concentration
(Indicate Units)
Absolute Difference
(Indicate Units)
Percent of Span
Calibration Valid
(Yes or No)
Response Time (Minutes)
Zero
NO
Span
Zero
NO2
Span
Zero
CO
Span
Zero
O2
Span
Pretest Calibration NO Cell Temperature (°F): SG = Span Gas
POST TEST CALIBRATION ERROR CHECK
A B ⏐A-B⏐ ⏐A-B⏐/SG*100 Interference Check
Pump Flow Rate
(Indicate Units)
Analyzer Reading (Indicate
Units)
Calibration Gas Concentration
(Indicate Units)
Absolute Difference (Indicate
Units)
Percent of Span Calibration
Valid (Yes or No)
Average of Pretest and Post Test
Analyzer Readings
(Indicate Units)
NO Monitor Response
(ppm)
CO Monitor Response
(ppm)
NO
Zero
Span
NO2
Zero
Span
CO
Zero
Span
O2
Zero
Span
Post Test Calibration NO Cell Temperature (°F):
CO Interference Response (ICO, %): NO Interference Response (INO, %):

Version - March 2006
SG = Span Gas
Related Documents