Alinta Energy Port Augusta Solar Thermal Generation Feasibility Study Stage 1 - Pre-feasibility Study Options Study Report 1 July 2014

Welcome message from author
This document is posted to help you gain knowledge. Please leave a comment to let me know what you think about it! Share it to your friends and learn new things together.
Transcript

Alinta Energy
Port Augusta Solar Thermal GenerationFeasibility StudyStage 1 - Pre-feasibility Study
Options Study Report1 July 2014
Document information
Client: Alinta EnergyTitle: Port Augusta Solar Thermal GenerationFeasibility StudyStage 1 - Pre-feasibility StudySubtitle: Options Study ReportDocument No: 2263503A-POW-RPT-001 RevDDate: 1 July 2014
Rev Date Details
A 11/04/2014 Draft for client review
B 22/05/2014 Final draft
C 29/05/2014 Final report
D 01/07/2014 Final Report - Public Issue
Author, Reviewer and Approver details
Prepared by: Simon Mason Date: 01/07/2014 Signature:
Reviewed by: Peter Cameron Date: 22/05/2014 Signature:
Approved by: Allan Curtis Date: 22/05/2014 Signature:
Distribution
Alinta Energy, Parsons Brinckerhoff file, Parsons Brinckerhoff Library
©Parsons Brinckerhoff Australia Pty Limited 2014
Copyright in the drawings, information and data recorded in this document (the information) is the property of ParsonsBrinckerhoff. This document and the information are solely for the use of the authorised recipient and this documentmay not be used, copied or reproduced in whole or part for any purpose other than that for which it was supplied byParsons Brinckerhoff. Parsons Brinckerhoff makes no representation, undertakes no duty and accepts noresponsibility to any third party who may use or rely upon this document or the information.
Document owner
Parsons Brinckerhoff Australia Pty LimitedABN 80 078 004 798Level 4 Northbank Plaza69 Ann StreetBrisbane QLD 4000GPO Box 2907Brisbane QLD 4001AustraliaTel: +61 7 3854 6200Fax: +61 7 3854 6500Email: [email protected] to ISO 9001, ISO 14001, AS/NZS 4801A GRI Rating: Sustainability Report 2011
Parsons Brinckerhoff | 2263503A-POW-RPT-001 RevD i
Alinta Energy Port Augusta Solar Thermal GenerationFeasibility StudyStage 1 - Pre-feasibility Study - Options Study Report
ContentsPage number
Abbreviations v
Executive summary vii
1. Introduction 1
1.1 Background 1
1.2 Scope 1
1.3 Sources of information 1
1.4 Disclaimers and limitations 2
1.4.1 Reliance of data 21.4.2 Limitations 2
2. Solar thermal technologies 3
2.1 General 3
2.2 Heat transfer fluid 4
2.2.1 Molten salt 42.2.2 Synthetic oil 52.2.3 Direct steam 5
2.3 Thermal energy storage 5
2.4 Parabolic trough 6
2.5 Linear Fresnel 8
2.6 Power tower 10
2.7 Solar hybridisation 11
2.7.1 Hybrid plant operation 122.7.2 Hybrid system piping 12
3. Solar resource assessment 14
3.1 Background 14
3.2 Typical meteorological year datasets 14
3.3 Solar resource at Port Augusta 15
3.3.1 Bureau of Meteorology 153.3.2 The Australian Climatic Data Bank 163.3.3 SOLEMI 163.3.4 Meteonorm 173.3.5 NASA 173.3.6 3TIER 173.3.7 Solar resource data for feasibility study 18
Parsons Brinckerhoff | 2263503A-POW-RPT-001 RevD ii
Alinta Energy Port Augusta Solar Thermal GenerationFeasibility StudyStage 1 - Pre-feasibility Study - Options Study Report
Contents (Continued)
Page number
4. Cost of electricity production 20
4.1 Levelised cost of energy 20
4.1.1 Assumptions 20
4.2 Time of day pricing 21
5. Cost estimates 24
5.1 Capital costs 24
5.1.1 NREL 245.1.2 Capital cost estimates for pre-feasibility study 24
5.2 Hybridisation costs 26
5.3 O&M costs 26
6. Plant integration assessment 28
6.1 Existing assets 28
6.2 Potential for solar hybrid conversion 28
6.2.1 Playford B Power Station 286.2.2 Northern Power Station 29
7. Solar technology modelling 32
7.1 Location and solar resource 32
7.2 Optimisation process 32
7.3 Standalone plant design optimisation 33
7.3.1 Parabolic trough 347.3.2 Power tower 357.3.3 Linear Fresnel 377.3.4 Standalone plant sensitivity analysis 37
7.4 Hybrid plant design optimisation at NPS 37
7.4.1 Parallel hybridisation 387.4.2 Solar boost 42
8. Evaluation 45
8.1 Modelling results 45
8.1.1 Standalone plant modelling results 458.1.2 Hybrid plant modelling results 46
8.2 Multi-criteria analysis 47
9. Conclusion 51

Parsons Brinckerhoff | 2263503A-POW-RPT-001 RevD iii
Alinta Energy Port Augusta Solar Thermal GenerationFeasibility StudyStage 1 - Pre-feasibility Study - Options Study Report
Contents (Continued)
Page number
10. References 53
List of tablesPage number
Table 2.1 Parabolic trough technical data 7Table 2.2 Linear Fresnel technical data 10Table 2.3 Power tower technical data 11Table 3.1 Hourly-mean DNI values from 3TIER TMY dataset (W/m2) 19Table 4.1 Key financial assumptions for LCOE calculation 21Table 4.2 Weekday TOD periods for South Australia (2013) 22Table 4.3 Weekend TOD periods for South Australia (2013) 22Table 4.4 TOD price factors for South Australia (2013) 23Table 5.1 Summary of NREL CAPEX costing parameters (USD) 24Table 5.2 Cost localisation factors 25Table 5.3 Capital cost assumptions for standalone plant (all values in 2013 AUD) 25Table 5.4 Capital cost assumptions for hybrid plants (all values in 2013 USD) 26Table 6.1 Key parameters for Playford B and Northern Power Stations 28Table 6.2 Comparison of a power tower hybrid plant at PPS and NPS 29Table 7.1 Modelling inputs – location and solar resource 32Table 7.2 Modelling inputs for standalone plants 33Table 7.3 Northern Power Station thermodynamic model validation 38Table 7.4 Solar field sizing parameters for parallel hybridised systems 38Table 7.5 Modelled system outputs for parallel hybrid systems 39Table 7.6 Solar field sizing parameters for solar boost hybrid systems 42Table 7.7 Modelled outputs for solar boost hybrid systems 42Table 8.1 Modelling outputs for optimum standalone plant configurations 45Table 8.2 Modelling outputs for optimum hybrid plant configurations 46Table 8.3 MCA criteria and weightings 49Table 9.1 Modelling results 51Table 9.2 MCA results summary 52
List of figuresPage number
Figure 2.1 CSP technologies (clockwise from upper left): parabolic trough, linear Fresnel andpower tower 4
Figure 2.2 Typical molten salt storage diagram 6Figure 2.3 Typical parabolic trough diagram 7Figure 2.4 Linear Fresnel primary reflector (1) and receiver (2) assembly 9Figure 3.1 Average daily DNI for South Australia 15Figure 3.2 Minimum, average and maximum DNI representative years by month (BOM) 16Figure 3.3 Average DNI by month (NASA SSE) 17
Parsons Brinckerhoff | 2263503A-POW-RPT-001 RevD iv
Alinta Energy Port Augusta Solar Thermal GenerationFeasibility StudyStage 1 - Pre-feasibility Study - Options Study Report
Contents (Continued)
Page number
Figure 3.4 Average DNI by month (3TIER TMY) 18Figure 6.1 Cycle diagram for Northern Power Station 31Figure 7.1 Variation in LCOE for parabolic trough standalone plant with solar multiple and
thermal energy storage 34Figure 7.2 Variation in required bid price and LCOE for parabolic trough standalone plant
configurations 35Figure 7.3 Variation in LCOE for power tower standalone plant with solar multiple and
thermal energy storage 36Figure 7.4 Variation in required bid price for power tower standalone plant configurations 36Figure 7.5 Variation in LCOE for linear Fresnel standalone plants with respect to solar multiple 37Figure 7.6 Variation in LCOE for parallel hybrid (power tower) plants with respect to solar
multiple 40Figure 7.7 Cycle diagram for a parallel hybrid power tower at Northern Power Station 41Figure 7.8 Cycle diagram for solar boost hybrid system at Northern Power Station 43Figure 7.9 Variation in LCOE for solar boost hybrid plants with respect to solar multiple 44Figure 8.1 Annual (first-year) generation profile for each standalone CSP technology 46Figure 8.2 Annual (first-year) thermal energy output profile for hybrid plants 47Figure 8.3 Overview of weighted MCA scores 50
List of appendicesAppendix A Standalone plant cost estimatesAppendix B Hybrid plant cost estimatesAppendix C Multi-criteria analysis worksheetsAppendix D List of operating CSP plantsAppendix E Standalone plant sensitivity analysis

Parsons Brinckerhoff | 2263503A-POW-RPT-001 RevD v
Alinta Energy Port Augusta Solar Thermal GenerationFeasibility StudyStage 1 - Pre-feasibility Study - Options Study Report
AbbreviationsAEMO Australian Energy Market Operator
BOP Balance of Plant
BOM Bureau of Meteorology
CAPEX Capital Expenditure
CEPCI Chemical Engineering Plant Cost Index
CSP Concentrated Solar Power
DHI Diffuse Horizontal Irradiance
DNI Direct Normal Irradiance
DSCR Debt-Service Coverage Ratio
EPC Engineering, Procurement and Construction
GHI Global Horizontal Irradiance
GMT Greenwich Mean Time
HHV Higher Heating Value
HP High Pressure
HTF Heat Transfer Fluid
IP Intermediate Pressure
IRR Internal Rate of Return
LCOE Levelised Cost of Energy
LRMC Long Run Marginal Costs
MCA Multi-Criteria Analysis
NASA National Aeronautics and Space Administration
NEM National Electricity Market
NPS Northern Power Station
NPV Net Present Value
NREL National Renewable Energy Laboratory
OPEX Operating Expenditure
Parsons Brinckerhoff | 2263503A-POW-RPT-001 RevD vi
Alinta Energy Port Augusta Solar Thermal GenerationFeasibility StudyStage 1 - Pre-feasibility Study - Options Study Report
PPA Power Purchase Agreement
PPS Playford Power Station
PV Photo-Voltaic
REC Renewable Energy Certificate
RMY Reference Meteorological Year
RRP Regional Reference Price
SAM System Advisor Model
SEGS Solar Energy Generating Systems
SM Solar Multiple
SSE Surface Meteorology and Solar Energy
TES Thermal Energy Storage
TLCC Total Life Cycle Costs
TMY Typical Meteorological Year
TOD Time of Day
Parsons Brinckerhoff | 2263503A-POW-RPT-001 RevD vii
Alinta Energy Port Augusta Solar Thermal GenerationFeasibility StudyStage 1 - Pre-feasibility Study - Options Study Report
Executive summaryAlinta Energy (Alinta) has commissioned Parsons Brinckerhoff to undertake a pre-feasibility study assessingthe technology options for concentrating solar power (CSP) electricity generation at or nearby the existingPort Augusta Power Stations. This document presents an options study of the possible CSP technologies,their potential for hybridisation with the existing Port Augusta Power Stations, and a ±30 % estimate ofcapital and operating costs for each option.
Parsons Brinckerhoff found that a 50 MW1 standalone solar thermal generation plant in the vicinity of thePort Augusta Power Stations using commercially available technology is technically feasible. In addition, itwas found that a solar thermal hybrid station supplying steam to Northern Power Station is technicallyfeasible using a number of different CSP technologies.
While there are a number of different CSP technologies under development, three have emerged whichattract the bulk of the industry interest, these being parabolic trough, power tower and linear Fresnelcollectors. All three of these technologies were assessed for use at Port Augusta, and found to be technicallyappropriate. All use large arrays of mirrors that track and concentrate solar irradiation to produce steamwhich is used to either supplement an existing turbine or fully supply a conventional steam turbine generatorset to generate electricity.
Thermal energy storage using molten salt was assessed for use in conjunction with the parabolic trough andpower tower standalone plant CSP technologies. As a linear Fresnel plant produces steam directly (i.e.without the use of an intermediate heat transfer fluid), energy storage is complex and not currently availablefor this technology. The cost of adding thermal energy storage is strongly influenced by the operatingtemperature range of the molten salt system. This leads to thermal energy storage being far more attractivefor use with a power tower plant than a parabolic trough due to its ~ 170 ˚C higher operating temperature.
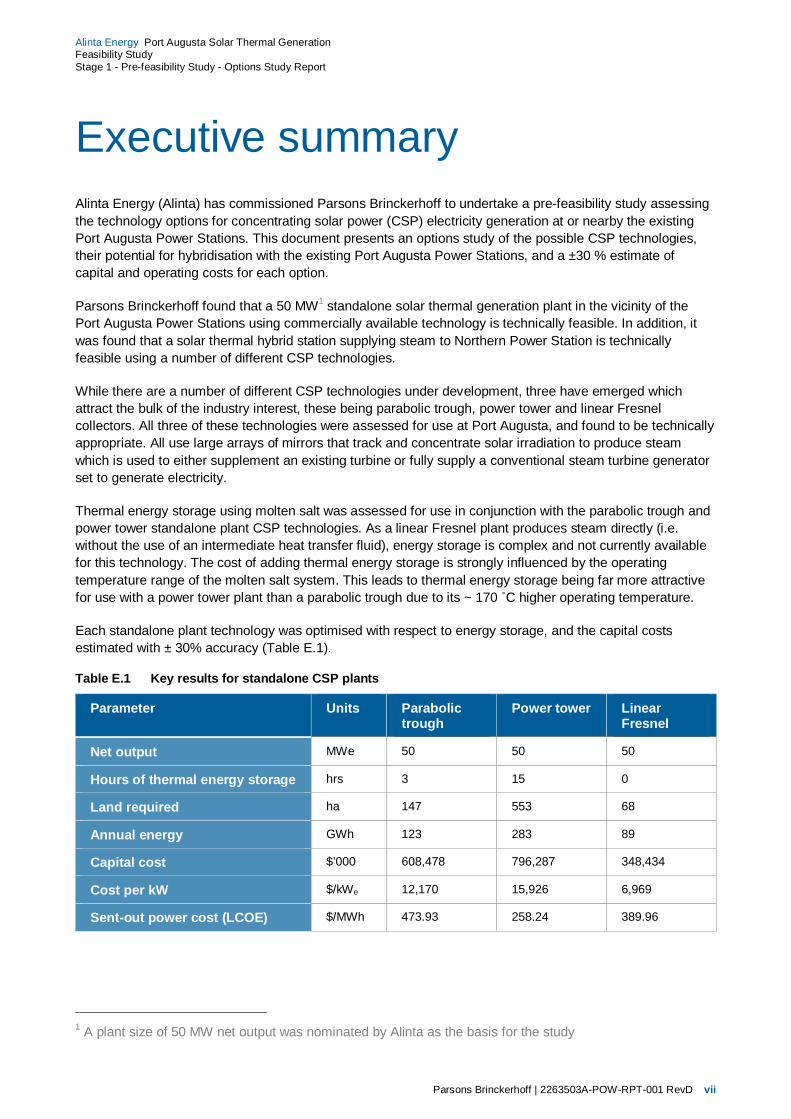
Each standalone plant technology was optimised with respect to energy storage, and the capital costsestimated with ± 30% accuracy (Table E.1).
Table E.1 Key results for standalone CSP plants
Parameter Units Parabolictrough
Power tower LinearFresnel
Net output MWe 50 50 50
Hours of thermal energy storage hrs 3 15 0
Land required ha 147 553 68
Annual energy GWh 123 283 89
Capital cost $’000 608,478 796,287 348,434
Cost per kW $/kWe 12,170 15,926 6,969
Sent-out power cost (LCOE) $/MWh 473.93 258.24 389.96
1 A plant size of 50 MW net output was nominated by Alinta as the basis for the study

Parsons Brinckerhoff | 2263503A-POW-RPT-001 RevD viii
Alinta Energy Port Augusta Solar Thermal GenerationFeasibility StudyStage 1 - Pre-feasibility Study - Options Study Report
In addition to standalone plants, several CSP hybrid plant configurations with Northern Power Station werealso evaluated (Table E.2). Playford B was not considered a suitable candidate for hybridisation, due to itspoor efficiency, current condition and uncertain remaining life.
Table E.2 Key results for hybrid CSP plants
Parameter Units Power tower Parabolictrough
Linear Fresnel
Net output2 MW 50 283 28
Land required ha 245 54 36
Annual energy GWh 100 46 47
Capital cost $’000 275,389 162,816 130,133
Cost per kW $/kWe 5,513 5,820 4,651
Sent-out power cost (LCOE) $/MWh 314.60 412.12 323.10
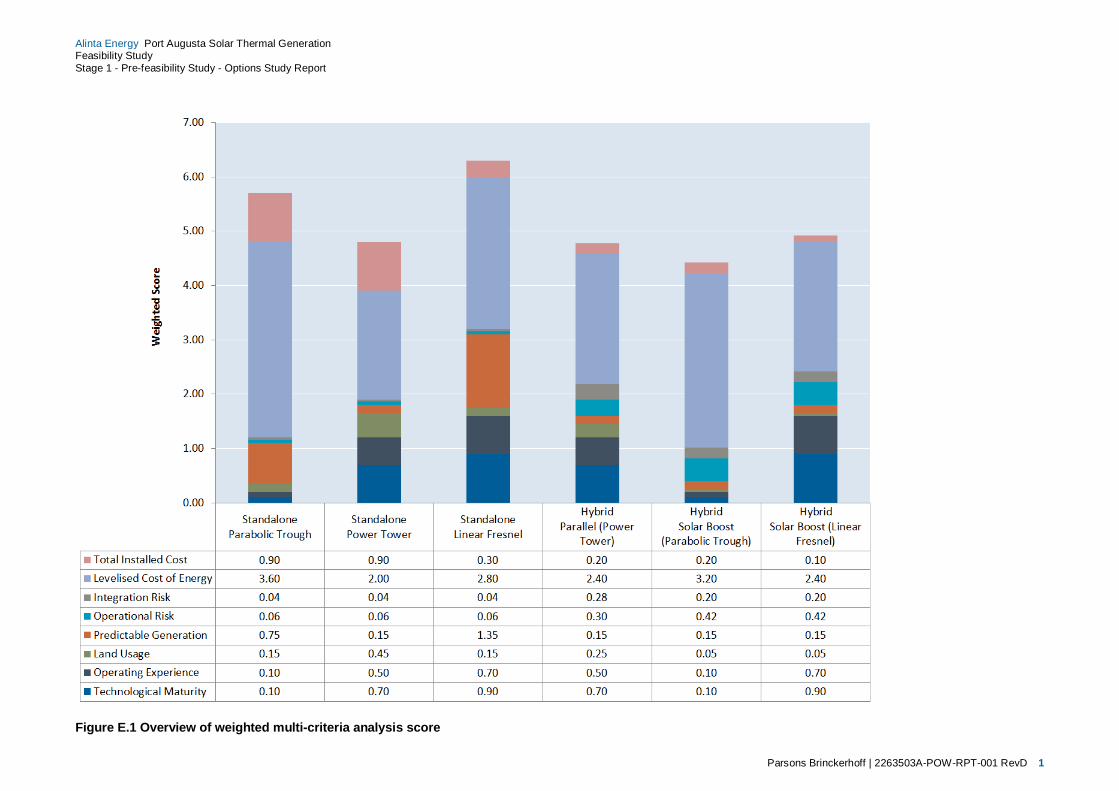
Each of the CSP plant options assessed was evaluated using a multi-criteria analysis, which includedquantitative and qualitative assessments of the plant against a number of weighted technical and financialcriteria. The results of the multi-criteria analysis are given in Figure E.1 (lower score is better).
2 Electricity generated from NPS attributable to steam raised in the solar field3 Parabolic trough and linear Fresnel hybrid plant outputs are limited due to steam cycle conditions at NPS
Parsons Brinckerhoff | 2263503A-POW-RPT-001 RevD 1
Alinta Energy Port Augusta Solar Thermal GenerationFeasibility StudyStage 1 - Pre-feasibility Study - Options Study Report
Figure E.1 Overview of weighted multi-criteria analysis score

Parsons Brinckerhoff | 2263503A-POW-RPT-001 RevD 1
Alinta Energy Port Augusta Solar Thermal GenerationFeasibility StudyStage 1 - Pre-feasibility Study - Options Study Report
1. Introduction1.1 BackgroundAlinta Energy (Alinta) is undertaking the Port Augusta Solar Thermal Generation Feasibility Study to assessthe potential for implementation of solar thermal power generation, including hybridised and stand-aloneoptions, at the Port Augusta Power Stations (Northern Power Stations 1 and 2, and Playford B PowerStation).
Alinta has engaged Parsons Brinckerhoff to complete Stage 1 (pre-feasibility) of this Study, which consists ofthe following:
n Project definition report: This report contains the detailed project definition, information on the scope ofwork to be undertaken and assumptions underpinning the project. This report has already beencompleted by Alinta (Alinta Energy, 2013).
n Options study report: The options study (this report) will identify and compare technologies and estimatethe capital and operating costs of the various options.
n Siting study report: The siting study (refer Parsons Brinckerhoff report 2263503A-POW-RPT-002) willcontain detailed technical information and nominate the preferred site for Stage 2 (full feasibility study).
n Balance of study report: The balance of study report will contain a solar resource study, scoping of theinitial network connection and a refinement of the CAPEX and OPEX estimates for the preferredtechnology.
1.2 ScopeThe Parsons Brinckerhoff scope of work for this report is as follows:
n Identify and compare possible solar generation technologies (including hybrid systems with existingAlinta power generation assets).
n Conduct a review of the available solar resource data and choose the most appropriate data to use forthis evaluation.
n Estimate capital and operating costs for each CSP technology.
n Estimate energy production from each option based on the chosen solar insolation data.
n Evaluate possible energy storage options and capacity.
n Calculate levelised cost of energy (LCOE) for each option.
n Optimise each plant design in terms of solar field size and energy storage for each option to minimisethe LCOE.
n Rank all options using a multi-criteria analysis and identify a preferred option to be taken forward intothe Stage 2 study.
1.3 Sources of informationThis report has been prepared with information from a variety of sources, which have been detailed inSection 9.

Parsons Brinckerhoff | 2263503A-POW-RPT-001 RevD 2
Alinta Energy Port Augusta Solar Thermal GenerationFeasibility StudyStage 1 - Pre-feasibility Study - Options Study Report
This list is not intended to be exhaustive. Where Parsons Brinckerhoff has relied on other sources ofinformation in preparing this report, they have been detailed in the body of the report.
1.4 Disclaimers and limitationsThe report has been prepared with due skill and care in accordance with the scope of work/services set outin the Contract or as otherwise agreed, between Parsons Brinckerhoff and Alinta.
1.4.1 Reliance of data
In completing this study, Parsons Brinckerhoff has relied upon data, surveys, analyses, designs, plans andother information provided by Alinta and other individuals and organisations, most of whom are referred to inthis report (the data).
Except as otherwise stated in the study, Parsons Brinckerhoff has not verified the accuracy or completenessof the data. To the extent that the statements, opinions, facts, information, conclusions and/orrecommendations in this report (conclusions) are based in whole or part on the data, those conclusions arecontingent upon the accuracy and completeness of the data.
Parsons Brinckerhoff will not be liable in relation to incorrect conclusions should any data, information orcondition be incorrect, or have been concealed, withheld, misrepresented or otherwise not fully disclosed toParsons Brinckerhoff by Alinta, consultants acting for Alinta, or any other third parties on which ParsonsBrinckerhoff has reasonably relied upon in completing this study.
1.4.2 Limitations
This report has been prepared for the exclusive benefit of Alinta and no other party. Parsons Brinckerhoffassumes no responsibility, and will not be liable to any other person, or organisation for, or in relation to, anymatter dealt with in this report, or for any loss or damage suffered by any other person or organisation arisingfrom matters dealt with or conclusions expressed in this report (including without limitation matters arisingfrom any negligent act or omission of Parsons Brinckerhoff or for any loss or damage suffered by any otherparty relying upon the matters dealt with or conclusions expressed in the report). Other parties should notrely upon the report or the accuracy or completeness of any conclusions and should make their own inquiresand obtain independent advice in relation to such matters.
To the best of Parsons Brinckerhoff’s knowledge, the facts and matters described in this report reasonablyrepresent the conditions at the time of submission of the report. However, the passage of time, themanifestation of latent conditions or the impact of future events (including a change in applicable law) mayresult in a variation to the conditions.
Parsons Brinckerhoff will not be liable to update or revise the report to take into account any events oremergent circumstances or facts occurring or becoming apparent after the submission date of this report.
Parsons Brinckerhoff | 2263503A-POW-RPT-001 RevD 3
Alinta Energy Port Augusta Solar Thermal GenerationFeasibility StudyStage 1 - Pre-feasibility Study - Options Study Report
2. Solar thermal technologies2.1 GeneralSolar thermal technologies are concerned with the conversion of sunlight energy into heat energy. Solarthermal installations may be either low temperature (such as those used for water heating), or hightemperature systems that concentrate the solar radiation to produce temperatures suitable for the productionof steam for power generation. These high temperature systems are referred to as concentrating solar power(CSP) systems and use mirrors to direct and concentrate sunlight onto receivers that collect the solar energyand transfer it to a heat transfer fluid (HTF). Electricity is generated when this energy is expanded through atraditional steam turbine. Current CSP technologies in commercial use are:
n Parabolic trough: trough-shaped mirror reflectors direct and concentrate sunlight onto thermally efficientreceiver tubes placed in the trough’s focal line. A HTF is circulated through the receiver tubes andpumped through a series of heat exchangers to produce steam (Section 2.4).
n Linear Fresnel: long mirror reflectors, arranged to simulate a Fresnel optical concentrating system,direct and concentrate sunlight onto long thermally efficient receiver tubes which commonly producesteam directly (Section 2.5).
n Power tower: an array of heliostats direct and concentrate sunlight onto a single point receiver mountedon an elevated tower structure. Direct steam production or heating of a heat transfer fluid occurs in thereceiver (Section 2.6). In those systems using a HTF other than water, steam is generated from the HTFin a series of heat exchangers.
n Paraboloidal dish: dish shaped mirrors with a two-axis solar tracking system focuses sunlight onto asingle point. Steam is generated in a small boiler located at the dish focal point. At this stage thistechnology is not commercially available for power generation at the scale considered here, and will notbe evaluated further in this report.
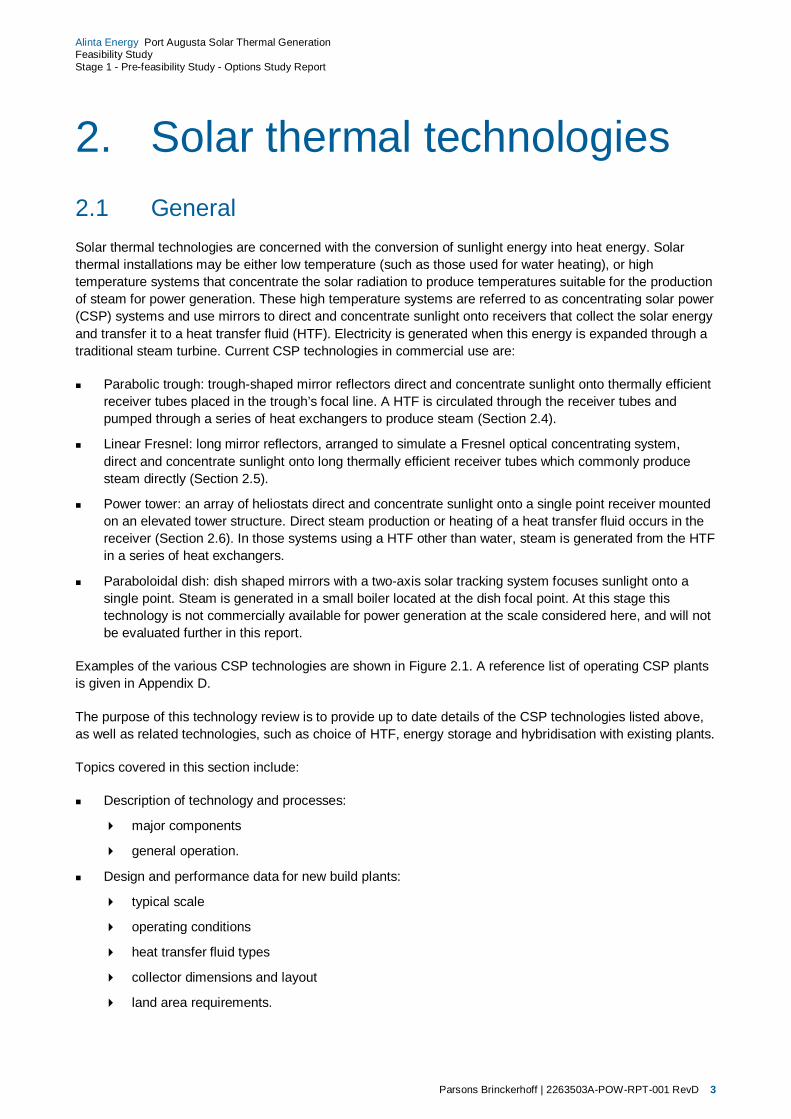
Examples of the various CSP technologies are shown in Figure 2.1. A reference list of operating CSP plantsis given in Appendix D.
The purpose of this technology review is to provide up to date details of the CSP technologies listed above,as well as related technologies, such as choice of HTF, energy storage and hybridisation with existing plants.
Topics covered in this section include:
n Description of technology and processes:
4 major components
4 general operation.
n Design and performance data for new build plants:
4 typical scale
4 operating conditions
4 heat transfer fluid types
4 collector dimensions and layout
4 land area requirements.
Parsons Brinckerhoff | 2263503A-POW-RPT-001 RevD 4
Alinta Energy Port Augusta Solar Thermal GenerationFeasibility StudyStage 1 - Pre-feasibility Study - Options Study Report
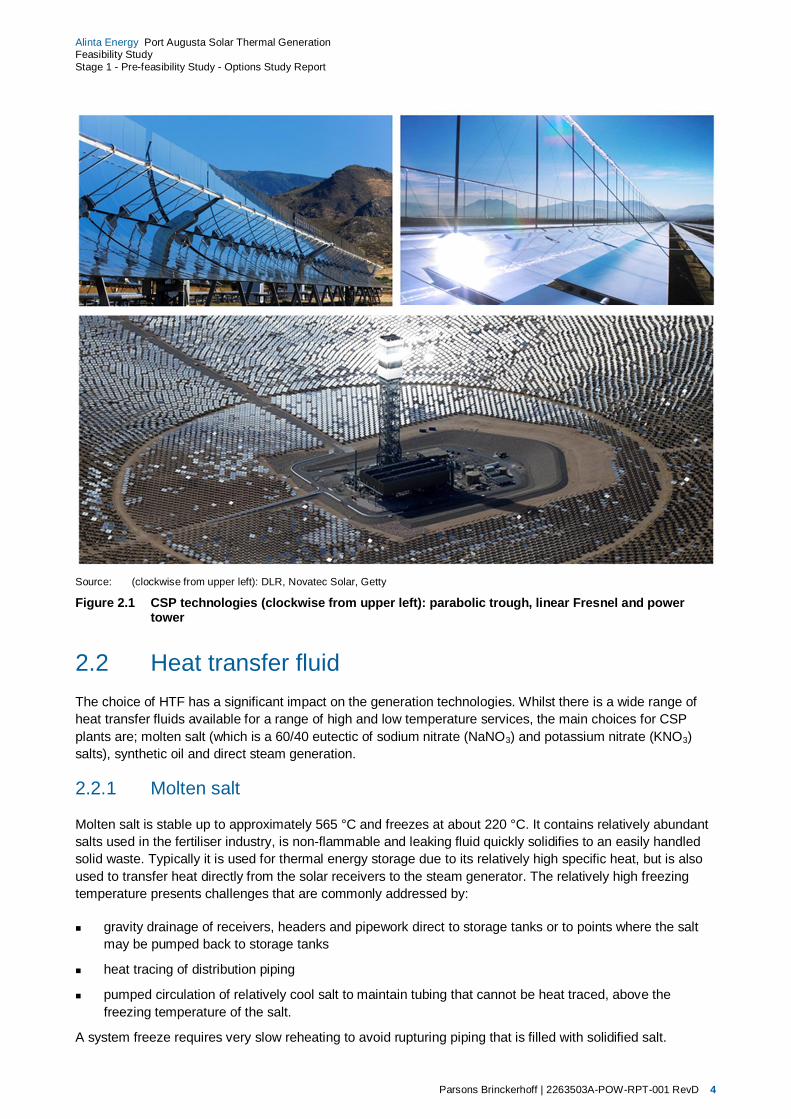
Source: (clockwise from upper left): DLR, Novatec Solar, Getty
Figure 2.1 CSP technologies (clockwise from upper left): parabolic trough, linear Fresnel and powertower
2.2 Heat transfer fluidThe choice of HTF has a significant impact on the generation technologies. Whilst there is a wide range ofheat transfer fluids available for a range of high and low temperature services, the main choices for CSPplants are; molten salt (which is a 60/40 eutectic of sodium nitrate (NaNO3) and potassium nitrate (KNO3)salts), synthetic oil and direct steam generation.
2.2.1 Molten salt
Molten salt is stable up to approximately 565 °C and freezes at about 220 °C. It contains relatively abundantsalts used in the fertiliser industry, is non-flammable and leaking fluid quickly solidifies to an easily handledsolid waste. Typically it is used for thermal energy storage due to its relatively high specific heat, but is alsoused to transfer heat directly from the solar receivers to the steam generator. The relatively high freezingtemperature presents challenges that are commonly addressed by:
n gravity drainage of receivers, headers and pipework direct to storage tanks or to points where the saltmay be pumped back to storage tanks
n heat tracing of distribution piping
n pumped circulation of relatively cool salt to maintain tubing that cannot be heat traced, above thefreezing temperature of the salt.
A system freeze requires very slow reheating to avoid rupturing piping that is filled with solidified salt.
Parsons Brinckerhoff | 2263503A-POW-RPT-001 RevD 5
Alinta Energy Port Augusta Solar Thermal GenerationFeasibility StudyStage 1 - Pre-feasibility Study - Options Study Report
2.2.2 Synthetic oil
Synthetic oils are widely used for heat transfer in processing and manufacturing industries. The mostcommonly used synthetic oil is a eutectic mixture of biphenyl and diphenyl oxides. These synthetic oils arenormally used at temperatures up to 393 °C and are subject to oxidation which is reduced by maintaining theoil under a pressurised nitrogen blanket. Despite these measures, the oil must be replaced on a regularbasis as the thermal properties degrade over time.
A significant issue with oil as a HTF is its flammability and there have been several major fires with industrialthermal oil systems. Most of these fires can be attributed to leaks and poor plant housekeeping.
2.2.3 Direct steam
Direct steam avoids the need for heat exchangers to generate steam but the field piping and receiversnecessarily operate at high pressures. Direct steam solutions may pose limits on the cycle pressures andtemperatures achievable and may make reheating in the solar field impractical.
While technically possible, there are no known operating direct steam systems with thermal storage.
2.3 Thermal energy storageThermal energy storage (TES) is a major technology development path for CSP plants. Without energystorage, solar thermal power is limited to the time that the sun is shining and production is interrupted bysolar transients. Energy storage has the potential to extend generation beyond sunshine hours and therebycan increase the plant capacity factor. An important consideration for CSP systems with energy storage isthe necessity of installing additional solar collector capacity to maintain rated generation whilesimultaneously charging the thermal storage system.
Almost all thermal storage systems utilise a two tank system using molten salt either directly or indirectlyheated by the solar field. Hot molten salt heated by the solar field (or via heat exchangers by the HTF) is sentto the hot tank where it is held until needed to produce steam out of sunshine hours. The hot salt passesthrough the steam heat exchangers and then passes to a cold storage tank. A typical configuration is shownin Figure 2.2.
Direct molten salt power towers would typically operate with hot and cold tank temperatures of 565 °C and290 °C respectively while parabolic troughs are limited by the operating temperatures in the field to hot andcold tank temperatures of 390 °C and 290 °C. Consequently, parabolic trough systems require very largetanks compared to power tower systems for the same total energy storage.

Parsons Brinckerhoff | 2263503A-POW-RPT-001 RevD 6
Alinta Energy Port Augusta Solar Thermal GenerationFeasibility StudyStage 1 - Pre-feasibility Study - Options Study Report
Source: SolarReserve
Figure 2.2 Typical molten salt storage diagram
2.4 Parabolic troughParabolic trough systems have been in commercial operation since 1984 when the first of the Solar EnergyGenerating System (SEGS) plants situated in the Mojave Desert, California was commissioned. Parabolictrough systems currently generate approximately 90% of all energy produced through CSP plants. Parabolictroughs are the most established and proven CSP technology on a large-scale commercial basis. Theseplants commonly use synthetic oil as the HTF.
A typical parabolic trough system comprises the following major elements:
n rows of parabolic reflectors laid on the north-south axis and parallel to each other
n one-axis tracking system for each row of reflectors which tracks the sun from east to west
n absorber tubes surrounded by vacuum sealed glass envelopes suspended at the focal point of thereflectors
n heat transfer fluid which circulates through the absorber tubes and carries the solar heat to a steamgenerator
n typical power block components as would be found in a steam power plant (if operating as a standaloneplant).
A diagram of a typical parabolic trough plant is shown in Figure 2.3.
Parsons Brinckerhoff | 2263503A-POW-RPT-001 RevD 7
Alinta Energy Port Augusta Solar Thermal GenerationFeasibility StudyStage 1 - Pre-feasibility Study - Options Study Report
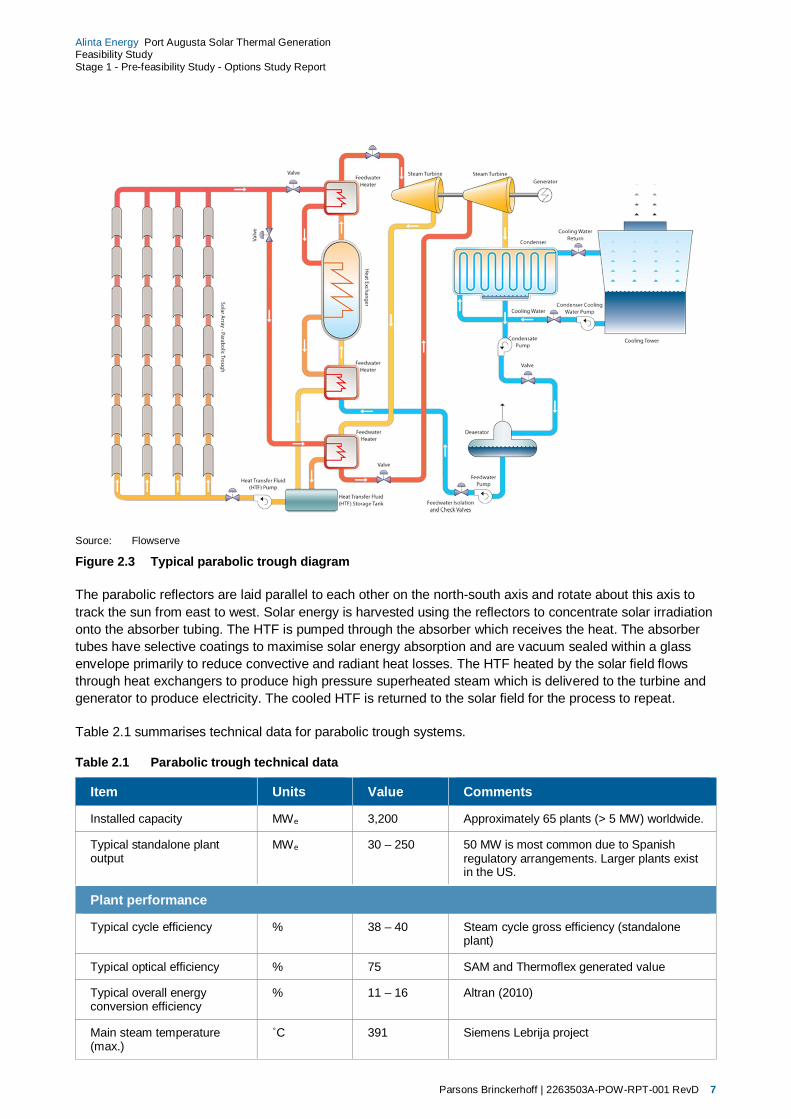
Source: Flowserve
Figure 2.3 Typical parabolic trough diagram
The parabolic reflectors are laid parallel to each other on the north-south axis and rotate about this axis totrack the sun from east to west. Solar energy is harvested using the reflectors to concentrate solar irradiationonto the absorber tubing. The HTF is pumped through the absorber which receives the heat. The absorbertubes have selective coatings to maximise solar energy absorption and are vacuum sealed within a glassenvelope primarily to reduce convective and radiant heat losses. The HTF heated by the solar field flowsthrough heat exchangers to produce high pressure superheated steam which is delivered to the turbine andgenerator to produce electricity. The cooled HTF is returned to the solar field for the process to repeat.
Table 2.1 summarises technical data for parabolic trough systems.
Table 2.1 Parabolic trough technical data
Item Units Value Comments
Installed capacity MWe 3,200 Approximately 65 plants (> 5 MW) worldwide.
Typical standalone plantoutput
MWe 30 – 250 50 MW is most common due to Spanishregulatory arrangements. Larger plants existin the US.
Plant performance
Typical cycle efficiency % 38 – 40 Steam cycle gross efficiency (standaloneplant)
Typical optical efficiency % 75 SAM and Thermoflex generated value
Typical overall energyconversion efficiency
% 11 – 16 Altran (2010)
Main steam temperature(max.)
˚C 391 Siemens Lebrija project

Parsons Brinckerhoff | 2263503A-POW-RPT-001 RevD 8
Alinta Energy Port Augusta Solar Thermal GenerationFeasibility StudyStage 1 - Pre-feasibility Study - Options Study Report
Item Units Value Comments
Main steam pressure (max.) bar 104 Siemens Lebrija project
HTF type – Synthetic oil Diphenyl/biphenyl oxide
Collector module length m 300 e.g. Siemens 6
Collector aperture width m 5.75 e.g. Siemens 6
Collector spacing m 17 e.g. Siemens 6
Aperture / land use ratio – 0.28 Parsons Brinckerhoff estimate
Land use ha/MWth 0.74 SAM generated value
Limiting factors
Synthetic oil maximumtemperature
˚C 395 Current HTF properties limit steam cycleconditions
Land use Has a higher land use per MW than linearFresnel.
No direct steam generation Requires a steam generator (intermediateheat exchanger).
2.5 Linear FresnelAll linear Fresnel systems currently in operation are either small scale test plants or are hybridised systemsattached to existing steam power stations (all less than 10 MW). The only exception is a standalone 30 MWplant in Spain commissioned in 2012.
Linear Fresnel systems utilise the following components:
n long, slender mirrors (primary reflectors) that are flat or have a shallow curvature
n one-axis tracking system for each mirror line which follows the sun from east to west
n an absorber surrounded by a secondary stage reflector (some manufacturers only) which is suspendedabove each set of primary reflectors
n HTF which circulates through the absorber tubes and carries the solar heat to a steam generator
n typical power block components as would be found in a steam power plant (if operating as a standaloneplant).
Parsons Brinckerhoff | 2263503A-POW-RPT-001 RevD 9
Alinta Energy Port Augusta Solar Thermal GenerationFeasibility StudyStage 1 - Pre-feasibility Study - Options Study Report
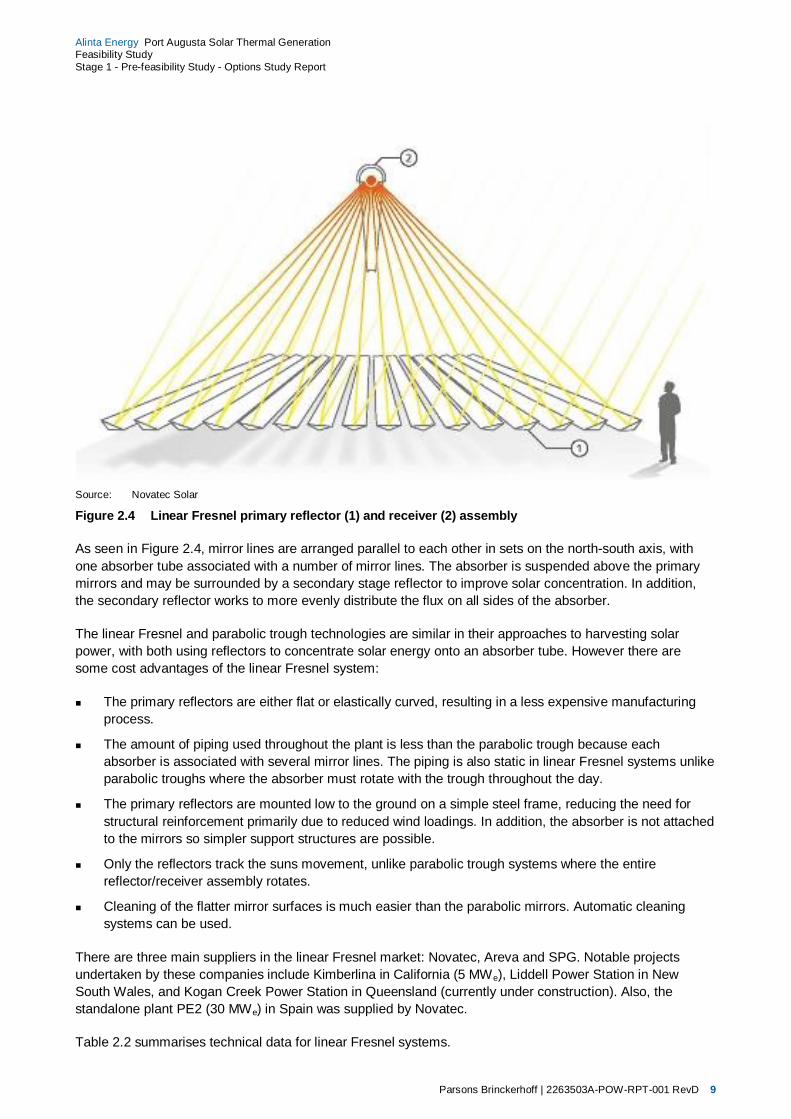
Source: Novatec Solar
Figure 2.4 Linear Fresnel primary reflector (1) and receiver (2) assembly
As seen in Figure 2.4, mirror lines are arranged parallel to each other in sets on the north-south axis, withone absorber tube associated with a number of mirror lines. The absorber is suspended above the primarymirrors and may be surrounded by a secondary stage reflector to improve solar concentration. In addition,the secondary reflector works to more evenly distribute the flux on all sides of the absorber.
The linear Fresnel and parabolic trough technologies are similar in their approaches to harvesting solarpower, with both using reflectors to concentrate solar energy onto an absorber tube. However there aresome cost advantages of the linear Fresnel system:
n The primary reflectors are either flat or elastically curved, resulting in a less expensive manufacturingprocess.
n The amount of piping used throughout the plant is less than the parabolic trough because eachabsorber is associated with several mirror lines. The piping is also static in linear Fresnel systems unlikeparabolic troughs where the absorber must rotate with the trough throughout the day.
n The primary reflectors are mounted low to the ground on a simple steel frame, reducing the need forstructural reinforcement primarily due to reduced wind loadings. In addition, the absorber is not attachedto the mirrors so simpler support structures are possible.
n Only the reflectors track the suns movement, unlike parabolic trough systems where the entirereflector/receiver assembly rotates.
n Cleaning of the flatter mirror surfaces is much easier than the parabolic mirrors. Automatic cleaningsystems can be used.
There are three main suppliers in the linear Fresnel market: Novatec, Areva and SPG. Notable projectsundertaken by these companies include Kimberlina in California (5 MWe), Liddell Power Station in NewSouth Wales, and Kogan Creek Power Station in Queensland (currently under construction). Also, thestandalone plant PE2 (30 MWe) in Spain was supplied by Novatec.
Table 2.2 summarises technical data for linear Fresnel systems.

Parsons Brinckerhoff | 2263503A-POW-RPT-001 RevD 10
Alinta Energy Port Augusta Solar Thermal GenerationFeasibility StudyStage 1 - Pre-feasibility Study - Options Study Report
Table 2.2 Linear Fresnel technical data
Item Units Value Comments
Installed capacity MWe 40
Committed capacity MWe 166 Capacity currently under contract or underconstruction
Typical standalone plantoutput
MWe < 30 30 MW (Novatec PE2)
Plant performance
Typical optical efficiency(max.)
% 67 Novatec Solar
Typical overall energyconversion efficiency
% 10 – 15 Parsons Brinckerhoff assumption
Main steam temperature(max.)
˚C 500 Novatec Solar
Main steam pressure (max.) bar 180
HTF type - Steam
Collector module length m 225 – 985 Based on typical collector modules fromNovatec Solar
Collector module width m 16 – 29 Based on typical collector modules fromNovatec Solar and Areva
Collector aperture width m 11.5 – 22.5 Based on typical collector modules fromNovatec Solar and Areva
Collector spacing m > 3
Aperture/land use ratio - 0.6 Typical
Land use ha/MWth 0.26 SAM generated value
Limiting factors
Reheat steam Difficult to implement reheat with direct steamgeneration, due to large specific volumes attypical reheat conditions.
2.6 Power towerPower tower CSP plants use a ground-based field of mirrors (heliostats) to focus direct solar irradiation ontoa receiver mounted at the top of a central tower where the light is captured and converted into heat. Thesolar field consists of a large number of computer-controlled heliostats that track the sun individually on twoaxes. Typical suppliers of this technology include Brightsource, Solar Reserve, Abengoa, eSolar and NEM.
The central tower receiver is a key component for the plant, and many research projects have been carriedout to maximize the thermal efficiency. Currently, two main kinds of receivers are being used; cavityreceivers, which are restricted to relatively small plants, and cylindrical external receivers, such as thoseused at the Gemasolar, Ivanpah and Crescent Dunes plants. The receivers undergo high thermal stressesand this is mitigated in molten salt installations by using thin walled, nickel based alloy tubes. For directsteam applications, careful control of the heat flux distribution across the receiver is required.
Field configuration, heliostat size and tower height are optimised by the technology providers but, as yet,there is no consistent view on where the optimum solution resides. Some proponents offer very tall tower
Parsons Brinckerhoff | 2263503A-POW-RPT-001 RevD 11
Alinta Energy Port Augusta Solar Thermal GenerationFeasibility StudyStage 1 - Pre-feasibility Study - Options Study Report
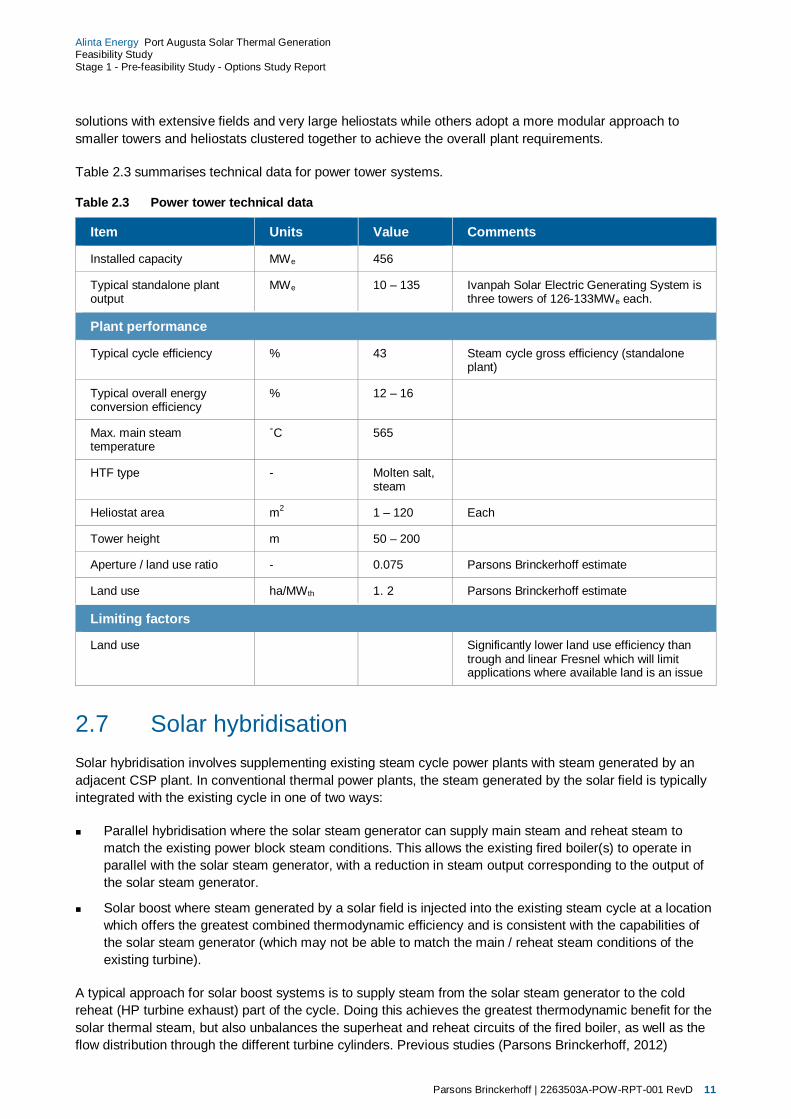
solutions with extensive fields and very large heliostats while others adopt a more modular approach tosmaller towers and heliostats clustered together to achieve the overall plant requirements.
Table 2.3 summarises technical data for power tower systems.
Table 2.3 Power tower technical data
Item Units Value Comments
Installed capacity MWe 456
Typical standalone plantoutput
MWe 10 – 135 Ivanpah Solar Electric Generating System isthree towers of 126-133MWe each.
Plant performance
Typical cycle efficiency % 43 Steam cycle gross efficiency (standaloneplant)
Typical overall energyconversion efficiency
% 12 – 16
Max. main steamtemperature
˚C 565
HTF type - Molten salt,steam
Heliostat area m2 1 – 120 Each
Tower height m 50 – 200
Aperture / land use ratio - 0.075 Parsons Brinckerhoff estimate
Land use ha/MWth 1. 2 Parsons Brinckerhoff estimate
Limiting factors
Land use Significantly lower land use efficiency thantrough and linear Fresnel which will limitapplications where available land is an issue
2.7 Solar hybridisationSolar hybridisation involves supplementing existing steam cycle power plants with steam generated by anadjacent CSP plant. In conventional thermal power plants, the steam generated by the solar field is typicallyintegrated with the existing cycle in one of two ways:
n Parallel hybridisation where the solar steam generator can supply main steam and reheat steam tomatch the existing power block steam conditions. This allows the existing fired boiler(s) to operate inparallel with the solar steam generator, with a reduction in steam output corresponding to the output ofthe solar steam generator.
n Solar boost where steam generated by a solar field is injected into the existing steam cycle at a locationwhich offers the greatest combined thermodynamic efficiency and is consistent with the capabilities ofthe solar steam generator (which may not be able to match the main / reheat steam conditions of theexisting turbine).
A typical approach for solar boost systems is to supply steam from the solar steam generator to the coldreheat (HP turbine exhaust) part of the cycle. Doing this achieves the greatest thermodynamic benefit for thesolar thermal steam, but also unbalances the superheat and reheat circuits of the fired boiler, as well as theflow distribution through the different turbine cylinders. Previous studies (Parsons Brinckerhoff, 2012)

Parsons Brinckerhoff | 2263503A-POW-RPT-001 RevD 12
Alinta Energy Port Augusta Solar Thermal GenerationFeasibility StudyStage 1 - Pre-feasibility Study - Options Study Report
indicate that up to approximately 8% of a traditional coal-fired plant’s output can be supplied by a solar boostinto the cold reheat line.
Hybridised systems paired with a once-through fired boiler should allow for a ‘clean-steam’ generator (i.e.heat exchanger) to avoid issues with iron contamination of the boiler water. The thermal cycling associatedwith the daily start/stop operation of a solar field may lead to high levels of iron transport in the solar fieldsteam cycle, which can lead to iron deposition on the steam turbine blading. Unlike a steam drum-type boiler,a once-through boiler has no method of protecting the steam turbine from iron accumulation in the cycle.
There are several benefits for using a solar thermal hybridised system as opposed to a standalone CSPplant:
n It allows the plant to generate electricity continuously, even through periods of inadequate solarirradiation and overnight.
n It is possible to achieve greater solar to electric conversion efficiency, due to the greater efficiency oflarge-scale steam turbines such as those typically found in modern thermal power station.
n Lower capital cost per unit of solar generation than a standalone solar thermal plant.
n Potential to lower the operational carbon intensity of an existing fossil-fuel generation plant.
Solar hybrid plants currently exist in Australia and overseas. The two main solar hybrid plants in Australia areat Kogan Creek, where a 44 MWe linear Fresnel plant is now under construction, and at Liddell, where,following installation of a linear Fresnel demonstration plant of around 1 MW th, a second phase has beenadded and operational since October 2012, producing 9.3 MW th (3 MWe).
2.7.1 Hybrid plant operation
The admission of steam into the turbine bleed line would be controlled by a differential pressure regulator.Once the steam generator pressure exceeds the bleed line pressure and the steam temperature is within theoperating permissive, then the control valve would open to maintain a set differential pressure.
In this operating mode, there would be no control of the heat input from the field. Clean steam pressurecontrol is effectively maintained by the differential pressure control valve. If the steam generator pressure islower than the injection point pressure then the valve will be closed and the generator pressure will rise untilsuch time as steam can be delivered to the injection point. If the injection point is unable to accept the flowof steam from the generator then the field temperature will go high which would generate a control action todefocus mirrors and hence reduce the heat input.
Starting of the solar system will require a warm through and draining of the steam lines along with someventing. The vent line should be connected to the existing turbine bypass connection on the condenserwhile drains should be connected to the condenser hotwell.
2.7.2 Hybrid system piping
The design and operation of a hybrid system is significantly influenced by the selection of HTF. For powertower systems, this may be direct steam or molten salt, for parabolic trough systems, it would be syntheticoil, while linear Fresnel systems would use direct steam.
2.7.2.1 Synthetic oil and molten salt
Synthetic oil and molten salt systems are comparatively simple single phase systems which pose few issueswith transferring the HTF fluid over significant distances. For molten salt, there is an additional need to heattrace the lines as well as a need to maintain a low flow of molten salt through the lines when there is no solar

Parsons Brinckerhoff | 2263503A-POW-RPT-001 RevD 13
Alinta Energy Port Augusta Solar Thermal GenerationFeasibility StudyStage 1 - Pre-feasibility Study - Options Study Report
input. The limit on the feasible distance to transfer molten salt (from solar field to power block) is driven byCAPEX (piping cost) and OPEX (increased pumping and heat tracing loads).
2.7.2.2 Direct steam
Delivering steam over large distances to the power block creates more challenges in heating up of the linesas well as condensate drainage. It is preferable that the direct steam system uses only welded connectionsto mitigate the risk of air in-leakage if pressures fall below ambient overnight. If this cannot be achieved thena small low pressure bleed from the power block can be used to maintain system pressures.
Lengthy steam lines require multiple line traps for draining and rather than losing this condensate, directacting pumping traps may be used to return condensate to the clean steam generator condensate handlingpumps. The condensate would then be returned by pumps to the solar field steam drum.
Daily warming through of the steam line will produce significant amounts of condensate and while the linetraps will remove much of this condensate, an in-line separator should be installed prior to the steamgenerator to protect the heat exchanger against excessive slugs of condensate. The condensate from theheat exchanger should have a steam trap installed to eliminate any air in the system. This system allows thewarming up of steam and condensate lines was well as the clean steam generator without draining orventing to atmosphere.
Parsons Brinckerhoff | 2263503A-POW-RPT-001 RevD 14
Alinta Energy Port Augusta Solar Thermal GenerationFeasibility StudyStage 1 - Pre-feasibility Study - Options Study Report
3. Solar resource assessment3.1 BackgroundThe amount of solar radiation incident on the surface of the earth at any given location represents afundamental driver for solar thermal projects representing the energy available for conversion to electricity.This is referred to generally as the ‘solar resource’. The accurate long term quantification of solar resourceby estimation or, direct or derived measurement is pivotal to the development of solar thermal projects.
The total quantity of solar radiation received at any point on the earth can be measured and expressed as acombination of the following:
n Global horizontal irradiance (GHI) is the total quantity of solar radiation per unit area that is interceptedby a flat, horizontal surface. This is composed of both direct radiation (radiation directly emitted from thesun) and diffuse radiation (radiation that has been scattered by the atmosphere and reflected from theearth) and is of particular interest to photovoltaic (PV) solar generation systems.
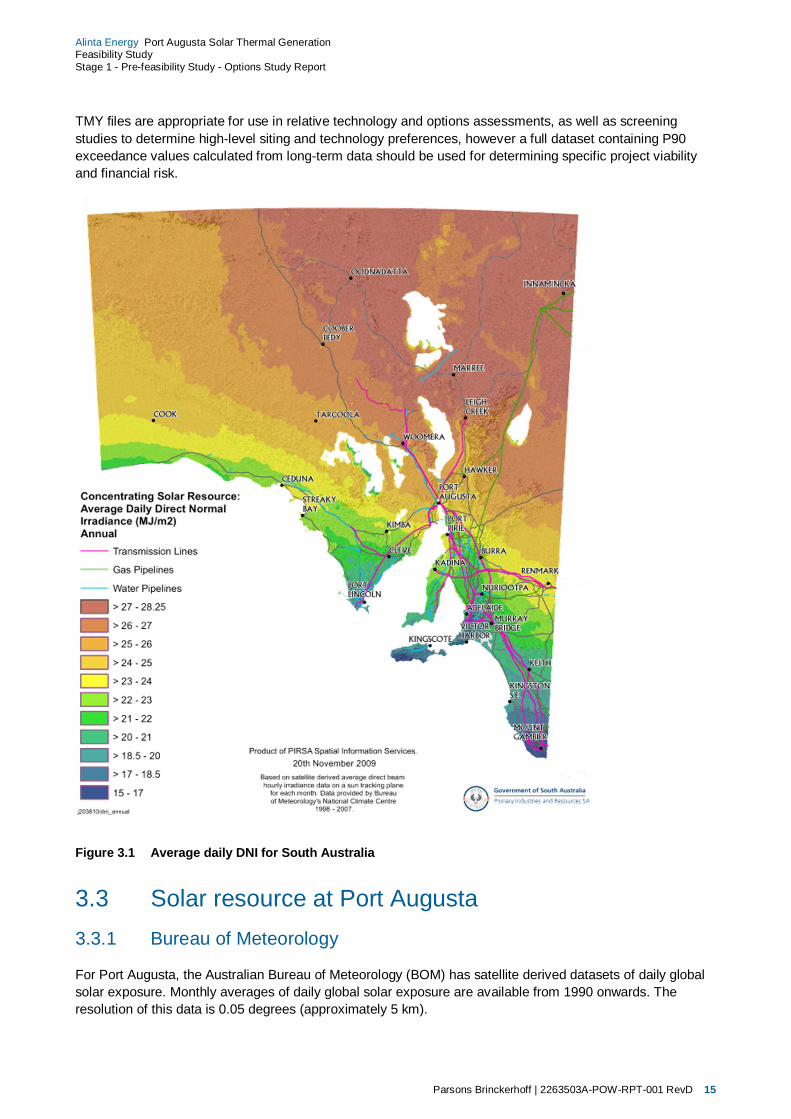
n Direct normal irradiance (DNI) is the quantity of direct solar radiation per unit area that is intercepted bya flat surface that is at all times pointed directly at the sun. This is of particular interest to solarinstallations that actively track the location of the sun, such as concentrating solar thermal installations.An overview of the average daily DNI available in South Australia is given in Figure 3.1.
n Diffuse horizontal irradiance (DHI) is the quantity of diffuse solar radiation per unit area that isintercepted by a flat, horizontal surface that does not directly track the sun’s position. This is radiationthat has been scattered by passing through the atmosphere.
In addition to the available solar resource, the prevailing meteorological conditions impact the performance ofa solar thermal power plant in two areas:
n Solar field heat loss which is a function of incoming solar energy, dry bulb temperature and wind speed.
n Steam cycle performance which is a function of wet bulb temperature (for evaporative cooled plants).
It is therefore necessary to capture the effects of these meteorological elements in addition to the availablesolar energy when modelling the performance of a solar thermal power plant. Time-series datasets of solarirradiance are commonly accompanied with the corresponding time-series of meteorological conditions.
3.2 Typical meteorological year datasetsA typical meteorological year dataset (TMY) is a commonly used method of providing a solar resourcedataset that represents a 1-year, hourly record of typical solar irradiance and associated meteorologicalinformation. They are not designed to provide a record of meteorological extremes, but do contain the naturaldiurnal and seasonal variations for a single year. A TMY dataset is compiled from 12 typical meteorologicalmonths which are concatenated without major modification from the available data history to form the singleyear dataset.
Whilst TMY datasets are used to provide a good estimate of the average solar resource available at aparticular site, they contain no information on the year-to-year variability of the solar resource and excludeatypical low solar years from the data pool. The U.S. National Renewable Energy Laboratory User Manualfor TMY3 data states that “The TMY should not be used to predict weather for a particular period of time, noris it an appropriate basis for evaluating real-time energy production or efficiencies for building designapplications or solar conversions systems.” (Wilcox & Marion, 2008).
Parsons Brinckerhoff | 2263503A-POW-RPT-001 RevD 15
Alinta Energy Port Augusta Solar Thermal GenerationFeasibility StudyStage 1 - Pre-feasibility Study - Options Study Report
TMY files are appropriate for use in relative technology and options assessments, as well as screeningstudies to determine high-level siting and technology preferences, however a full dataset containing P90exceedance values calculated from long-term data should be used for determining specific project viabilityand financial risk.
Figure 3.1 Average daily DNI for South Australia
3.3 Solar resource at Port Augusta3.3.1 Bureau of Meteorology
For Port Augusta, the Australian Bureau of Meteorology (BOM) has satellite derived datasets of daily globalsolar exposure. Monthly averages of daily global solar exposure are available from 1990 onwards. Theresolution of this data is 0.05 degrees (approximately 5 km).

Parsons Brinckerhoff | 2263503A-POW-RPT-001 RevD 16
Alinta Energy Port Augusta Solar Thermal GenerationFeasibility StudyStage 1 - Pre-feasibility Study - Options Study Report
Direct measured data for a range of solar parameters is available at select BOM stations only; in one minuteintervals. The closest station to Port Augusta with this data available is Adelaide, which has data for theyears 1995 to 1997, and 2003 to 2012. There is also a ground measurement station in Woomera, but thisonly has one-minute data for April 2012 to June 2013.
3.3.1.1 Australian Solar Thermal Energy Association
In 2013, the Australian Solar Thermal Energy Association (AUSTELA) undertook a review of the availableBOM satellite derived DNI data for a number of potential CSP sites in Australia, including Port Augusta (ITPower (Australia) Pty Ltd, 2013). The aim of this review was to identify the years which provided the mostcomplete data for each site and best represented the minimum, average and maximum years of solarinsolation at each site. The average monthly DNI for the years chosen for Port Augusta are summarised inFigure 3.2.
Figure 3.2 Minimum, average and maximum DNI representative years by month (BOM)
3.3.2 The Australian Climatic Data Bank
The Australian Climatic Data Bank provides hourly meteorological and solar energy data for a number ofsites around Australia, for the years 1967 to 2004, as well as a reference meteorological year (RMY) file.The nearest available station for this data to Port Augusta is the BOM site in Woomera.
3.3.3 SOLEMI
SOLEMI (Solar Energy Mining) is a satellite-derived solar radiation dataset provided by the DLR (DeutschesZentrum für Luft- und Raumfahrt), Germany’s aerospace research centre. The data available is provided asan hourly time-series covering the last 10 years with a special resolution of approximately 0.025 degrees (2.5km), however the satellite coverage for this service does not include South Australia.
Parsons Brinckerhoff | 2263503A-POW-RPT-001 RevD 17
Alinta Energy Port Augusta Solar Thermal GenerationFeasibility StudyStage 1 - Pre-feasibility Study - Options Study Report
3.3.4 Meteonorm
Meteonorm provide a commercial solar radiation and meteorological data software package and database.The dataset is a combination of measured data from ground-based weather stations, with interpolated dataprovided where there is insufficient coverage of weather station data available. The software calculateshourly time-series data from monthly values using a stochastic model. The data available for Port Augusta isinterpolated only, as the nearest ground measurement location is Adelaide.
3.3.5 NASA
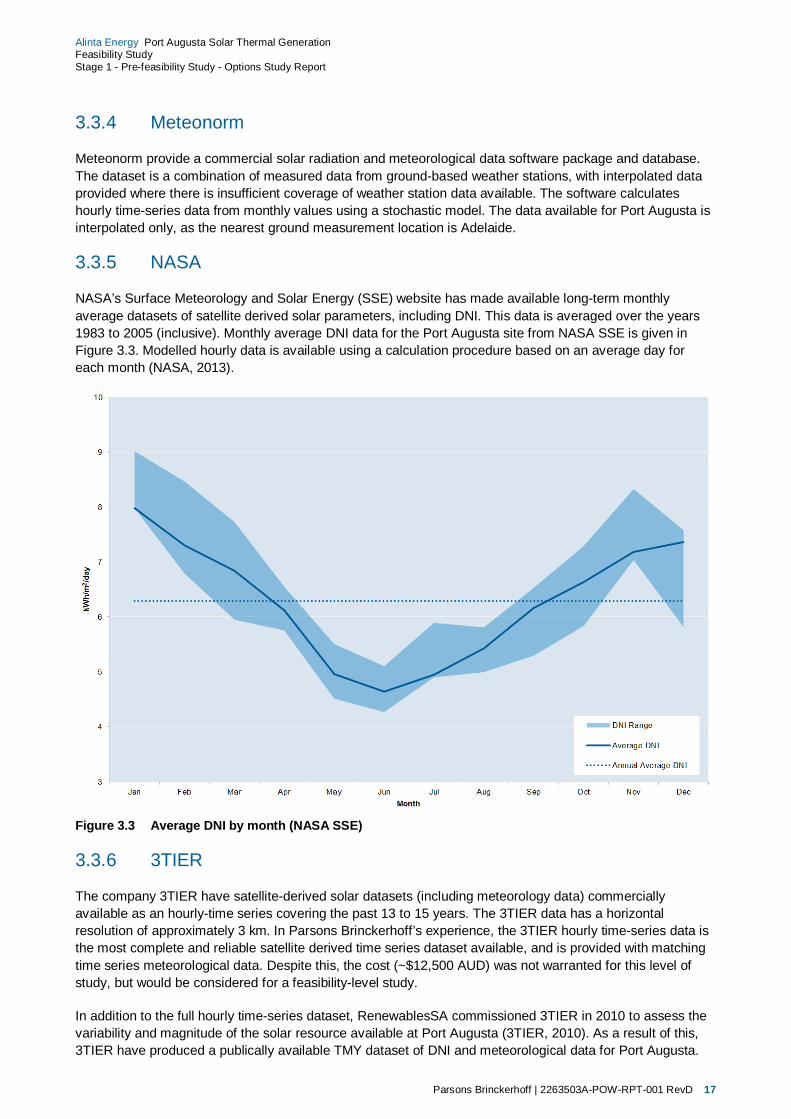
NASA’s Surface Meteorology and Solar Energy (SSE) website has made available long-term monthlyaverage datasets of satellite derived solar parameters, including DNI. This data is averaged over the years1983 to 2005 (inclusive). Monthly average DNI data for the Port Augusta site from NASA SSE is given inFigure 3.3. Modelled hourly data is available using a calculation procedure based on an average day foreach month (NASA, 2013).
Figure 3.3 Average DNI by month (NASA SSE)
3.3.6 3TIER
The company 3TIER have satellite-derived solar datasets (including meteorology data) commerciallyavailable as an hourly-time series covering the past 13 to 15 years. The 3TIER data has a horizontalresolution of approximately 3 km. In Parsons Brinckerhoff’s experience, the 3TIER hourly time-series data isthe most complete and reliable satellite derived time series dataset available, and is provided with matchingtime series meteorological data. Despite this, the cost (~$12,500 AUD) was not warranted for this level ofstudy, but would be considered for a feasibility-level study.
In addition to the full hourly time-series dataset, RenewablesSA commissioned 3TIER in 2010 to assess thevariability and magnitude of the solar resource available at Port Augusta (3TIER, 2010). As a result of this,3TIER have produced a publically available TMY dataset of DNI and meteorological data for Port Augusta.

Parsons Brinckerhoff | 2263503A-POW-RPT-001 RevD 18
Alinta Energy Port Augusta Solar Thermal GenerationFeasibility StudyStage 1 - Pre-feasibility Study - Options Study Report
The monthly average DNI values from the 3TIER DNI dataset are shown in Figure 3.4.
Figure 3.4 Average DNI by month (3TIER TMY)
For the purposes of this pre-feasibility options study, this 3TIER TMY dataset is considered to be the mostcomprehensive publically available data, and was used for modelling of solar thermal plant energy output. Itshould be noted that no ground-measured data was available to 3TIER when developing this TMY dataset,therefore all solar irradiance data is processed satellite output and modelled output only. 3TIER has quoted astandard error of 16% on this publically available DNI estimate. Commercially available datasets from 3TIERhave a quoted standard error of 9% (less when calibrated against ground-measured data).
The hourly-mean DNI values are summarised in Table 3.1 below.
3.3.7 Solar resource data for feasibility study
Parsons Brinckerhoff understands that Alinta are intending to install a meteorological weather station withappropriate instruments for measuring DNI and global solar irradiation at an appropriate location at PortAugusta in early 2014. Once a minimum of 12 months of data has been collected, this will be verified againsthourly time-series satellite projections over the same period (such as the commercially available 3TIERdataset). This verified data will be used to generate real probability-based datasets (P50 and P90) for use inStage 2 of this study.

Parsons Brinckerhoff | 2263503A-POW-RPT-001 RevD 19
Alinta Energy Port Augusta Solar Thermal GenerationFeasibility StudyStage 1 - Pre-feasibility Study - Options Study Report
Table 3.1 Hourly-mean DNI values from 3TIER TMY dataset (W/m2)
HourMonth
Jan Feb Mar Apr May Jun Jul Aug Sep Oct Nov Dec
1 0 0 0 0 0 0 0 0 0 0 0 0
2 0 0 0 0 0 0 0 0 0 0 0 0
3 0 0 0 0 0 0 0 0 0 0 0 0
4 0 0 0 0 0 0 0 0 0 0 0 0
5 0 0 0 0 0 0 0 0 0 0 0 0
6 0 0 0 0 0 0 0 0 0 0 2 4
7 98 23 1 0 0 0 0 0 3 76 147 157
8 347 232 161 69 21 1 2 45 148 327 366 374
9 514 434 403 317 225 129 166 303 385 486 494 494
10 621 551 541 478 437 342 387 483 508 571 561 583
11 665 601 607 566 549 479 501 574 575 621 609 628
12 701 649 620 595 594 537 557 582 606 637 641 651
13 728 670 628 594 601 562 578 574 621 644 643 643
14 720 670 646 590 586 551 564 576 623 657 638 641
15 691 659 642 595 547 516 526 565 612 633 618 640
16 661 615 620 561 497 470 497 552 569 583 587 609
17 633 557 573 467 378 333 393 487 484 514 522 564
18 544 454 426 236 127 84 141 250 290 384 407 468
19 368 259 157 20 0 0 0 12 46 132 193 284
20 107 38 2 0 0 0 0 0 0 0 11 64
21 0 0 0 0 0 0 0 0 0 0 0 0
22 0 0 0 0 0 0 0 0 0 0 0 0
23 0 0 0 0 0 0 0 0 0 0 0 0
24 0 0 0 0 0 0 0 0 0 0 0 0
Parsons Brinckerhoff | 2263503A-POW-RPT-001 RevD 20
Alinta Energy Port Augusta Solar Thermal GenerationFeasibility StudyStage 1 - Pre-feasibility Study - Options Study Report
4. Cost of electricity production4.1 Levelised cost of energyThe most frequently used metric to evaluate the economic performance of power generation plant is thelevelised cost of energy (LCOE). It is defined as the constant price per unit of energy generated over theanalysis period which equals the total life cycle cost (TLCC) when discounted back to the base year (Short,et al., 1995). It is also (by definition) the average constant electricity price needed for a project net presentvalue (NPV) of zero, when performing a discounted cash flow analysis.
This metric allows alternative technologies to be compared when different scales of operation, differentinvestment and operating time periods, or both, exist.
The TLCC for a project is the present value of project costs over its life. This includes installation, operationand maintenance, financial costs and fees, and taxes, and also account for incentives and salvage value.
The TLCC can be calculated as:
= (1 + )
Where:
= present value of the TLCC= cost in period= analysis period= annual discount rate
Once the project TLCC has been calculated, the LCOE can then be calculated as:
=∑ (1 + )
Where:
= levelised cost of energy= energy output (or saved)in year
The LCOE can be calculated in either real (inflation independent) or nominal terms. A nominal LCOErepresents a hypothetic income that declines in real value year-by-year, whereas a real LCOE has aconstant dollar, inflation-adjusted value. For the purposes of this study, the real LCOE value will used as thebasis for comparing technology options in this report.
4.1.1 Assumptions
The global assumptions used for the calculation of LCOE for each of the CSP technologies are detailed inTable 4.1.

Parsons Brinckerhoff | 2263503A-POW-RPT-001 RevD 21
Alinta Energy Port Augusta Solar Thermal GenerationFeasibility StudyStage 1 - Pre-feasibility Study - Options Study Report
Table 4.1 Key financial assumptions for LCOE calculation
Parameter Units Value Comments
IRR target
Minimum required IRR % 10 From Flinders Solar Thermal Concept Studyreport.
PPA escalation rate % 3 Parsons Brinckerhoff assumption.
Loan parameters
Debt fraction % 50 Parsons Brinckerhoff assumption.
Loan term (hybrid with NPS) years 13 Two years less than analysis period, asspecified by Alinta.
Loan term (standalone plant) years 23 Two years less than analysis period, asspecified by Alinta.
Loan rate % p.a. 7.5 Parsons Brinckerhoff assumption.
Analysis parameters
Analysis period (hybrid withNPS)
years 15 Remaining life of Northern Power Station, asspecified by Alinta.
Analysis period (standaloneplant)
years 25 As specified by Alinta.
Inflation rate % p.a. 2.5 Parsons Brinckerhoff assumption.
Nominal discount rate % p.a. 10 Same as IRR.
Tax and insurance rates
Federal income tax rate % p.a. 30 Assumed company tax rate.
Insurance rate % 0.5 Of installed cost.
Incentives
Production based incentive(federal)
$/kWh 0.04 Assumed 40 $/MWh REC, increasing at 2%p.a. for the life of the project.
Depreciation
Federal depreciation - Diminishingvalue
Specified by Alinta.
Salvage
Net salvage value % 5 Of installed cost.
4.2 Time of day pricingThe calculated LCOE value for each of the modelled options is given in units of cost ($) per unit of energyoutput (MWh). As such, the benefit of being able to generate electricity during times of high electricity poolprice is not realised (as would be possible with a CSP plant with a thermal energy storage system). Tocapture the variable value of electricity sold into the National Electricity Market (NEM), and in lieu of actualforecast generation profiles from Alinta, a simplified dispatch pricing model was created.
To determine approximate time of day (TOD) pricing factors, a modified version of the methodology outlinedin A Summary and Comparison of the Time of Delivery Factors Developed by the California Investor-Owned

Parsons Brinckerhoff | 2263503A-POW-RPT-001 RevD 22
Alinta Energy Port Augusta Solar Thermal GenerationFeasibility StudyStage 1 - Pre-feasibility Study - Options Study Report
Utilities for Use in Renewable Portfolio Standard Solicitations was used (Energy and EnvironmentalEconomics Inc., 2006). The methodology used is as follows:
n The Regional Reference Price (RRP) and total system demand for the South Australian electricitymarket was sourced from the AEMO website archives in half-hourly increments for the period 1 January2013 to 1 January 2014.
n Broad TOD periods were defined to approximate the various peak, semi-peak and off-peak periodsthroughout the year, with Period 1 representing low-demand periods, and Period 4 representing periodsof highest demand (Table 4.2 and Table 4.3).
n A TOD factor is calculated for each period by dividing the average TOD period price by the averageannual price ($72 per MWh). The weighted average of the TOD factors over the course of a year mustaverage 1.0.
These TOD factors are used in Section 7 to determine the ‘bid price’ for different technologies and plantconfigurations. This is equal to the calculated LCOE multiplied by the relevant TOD factor and electricitygenerated for each individual hour of the year, averaged over the whole year.
Table 4.2 Weekday TOD periods for South Australia (2013)
MonthHour
1 2 3 4 5 6 7 8 9 10 11 12 13 14 15 16 17 18 19 20 21 22 23 24Jan 3 2 3 4 3
Feb 3 2 3 4 3
Mar 3 2 3 4 3
Apr 3 2 1 2 3
May 3 2 1 2 3
Jun 3 2 1 2 3 4 3
Jul 3 2 1 2 3 4 3
Aug 3 2 1 2 3 4 3
Sep 3 2 1 2 3
Oct 3 2 1 2 3
Nov 3 2 1 2 3
Dec 3 2 1 2 3
Table 4.3 Weekend TOD periods for South Australia (2013)
MonthHour
1 2 3 4 5 6 7 8 9 10 11 12 13 14 15 16 17 18 19 20 21 22 23 24Jan 3 2 3
Feb 3 2 3 4 3
Mar 3 2 1 2 3
Apr 3 2 1 1 2 3 2
May 3 2 1 1 2 3 2
Jun 3 2 1 2 3
Jul 3 2 1 2 3
Aug 3 2 1 2 3
Sep 3 2 1 2
Oct 3 2 1 2
Nov 3 2 1 2
Dec 3 2 1 2
The time of day factors used for revenue modelling are given in Table 4.4.

Parsons Brinckerhoff | 2263503A-POW-RPT-001 RevD 23
Alinta Energy Port Augusta Solar Thermal GenerationFeasibility StudyStage 1 - Pre-feasibility Study - Options Study Report
Table 4.4 TOD price factors for South Australia (2013)
Time of day Average RRP TOD factor
Period 1 50.79 $/MWh 0.71
Period 2 55.14 $/MWh 0.77
Period 3 80.00 $/MWh 1.11
Period 4 91.36 $/MWh 1.27
Parsons Brinckerhoff | 2263503A-POW-RPT-001 RevD 24
Alinta Energy Port Augusta Solar Thermal GenerationFeasibility StudyStage 1 - Pre-feasibility Study - Options Study Report
5. Cost estimates5.1 Capital costs5.1.1 NREL
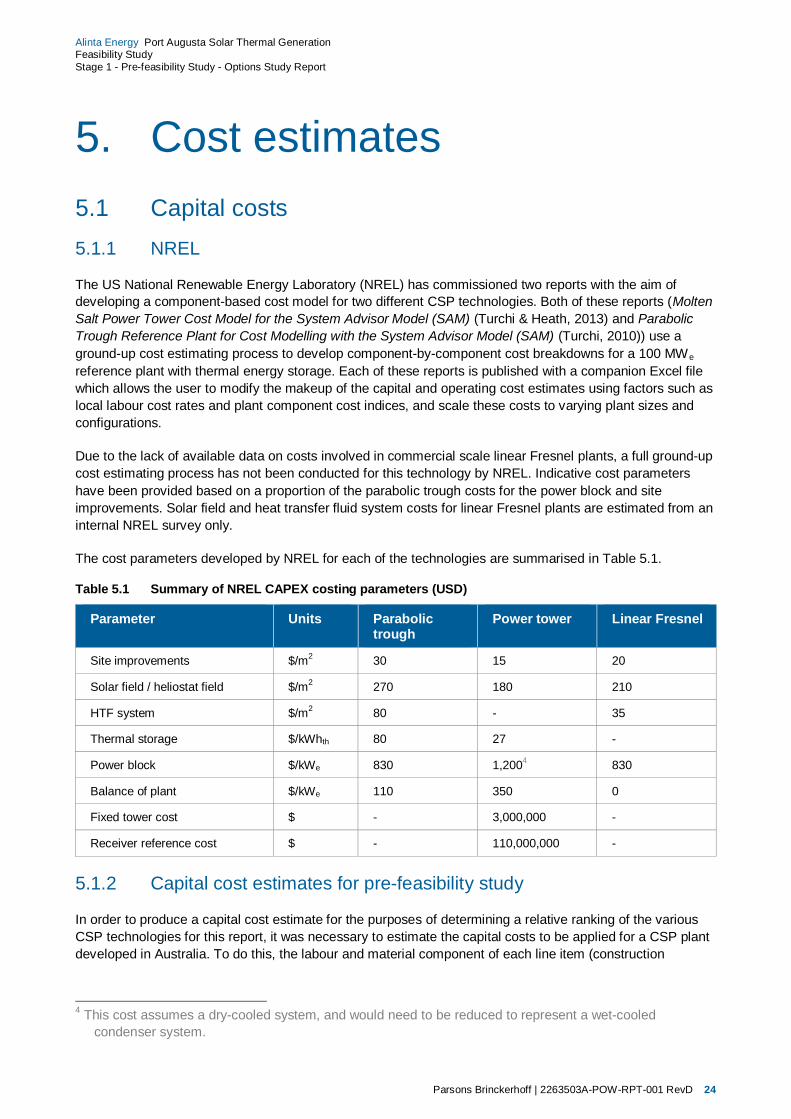
The US National Renewable Energy Laboratory (NREL) has commissioned two reports with the aim ofdeveloping a component-based cost model for two different CSP technologies. Both of these reports (MoltenSalt Power Tower Cost Model for the System Advisor Model (SAM) (Turchi & Heath, 2013) and ParabolicTrough Reference Plant for Cost Modelling with the System Advisor Model (SAM) (Turchi, 2010)) use aground-up cost estimating process to develop component-by-component cost breakdowns for a 100 MWe
reference plant with thermal energy storage. Each of these reports is published with a companion Excel filewhich allows the user to modify the makeup of the capital and operating cost estimates using factors such aslocal labour cost rates and plant component cost indices, and scale these costs to varying plant sizes andconfigurations.
Due to the lack of available data on costs involved in commercial scale linear Fresnel plants, a full ground-upcost estimating process has not been conducted for this technology by NREL. Indicative cost parametershave been provided based on a proportion of the parabolic trough costs for the power block and siteimprovements. Solar field and heat transfer fluid system costs for linear Fresnel plants are estimated from aninternal NREL survey only.
The cost parameters developed by NREL for each of the technologies are summarised in Table 5.1.
Table 5.1 Summary of NREL CAPEX costing parameters (USD)
Parameter Units Parabolictrough
Power tower Linear Fresnel
Site improvements $/m2 30 15 20
Solar field / heliostat field $/m2 270 180 210
HTF system $/m2 80 - 35
Thermal storage $/kWhth 80 27 -
Power block $/kWe 830 1,2004 830
Balance of plant $/kWe 110 350 0
Fixed tower cost $ - 3,000,000 -
Receiver reference cost $ - 110,000,000 -
5.1.2 Capital cost estimates for pre-feasibility study
In order to produce a capital cost estimate for the purposes of determining a relative ranking of the variousCSP technologies for this report, it was necessary to estimate the capital costs to be applied for a CSP plantdeveloped in Australia. To do this, the labour and material component of each line item (construction
4 This cost assumes a dry-cooled system, and would need to be reduced to represent a wet-cooledcondenser system.
Parsons Brinckerhoff | 2263503A-POW-RPT-001 RevD 25
Alinta Energy Port Augusta Solar Thermal GenerationFeasibility StudyStage 1 - Pre-feasibility Study - Options Study Report
activity/equipment item/subcontract) from the NREL-developed cost breakdown were separately scaled by arelevant exponent and sizing parameter (i.e. solar field aperture, power block output, land area).
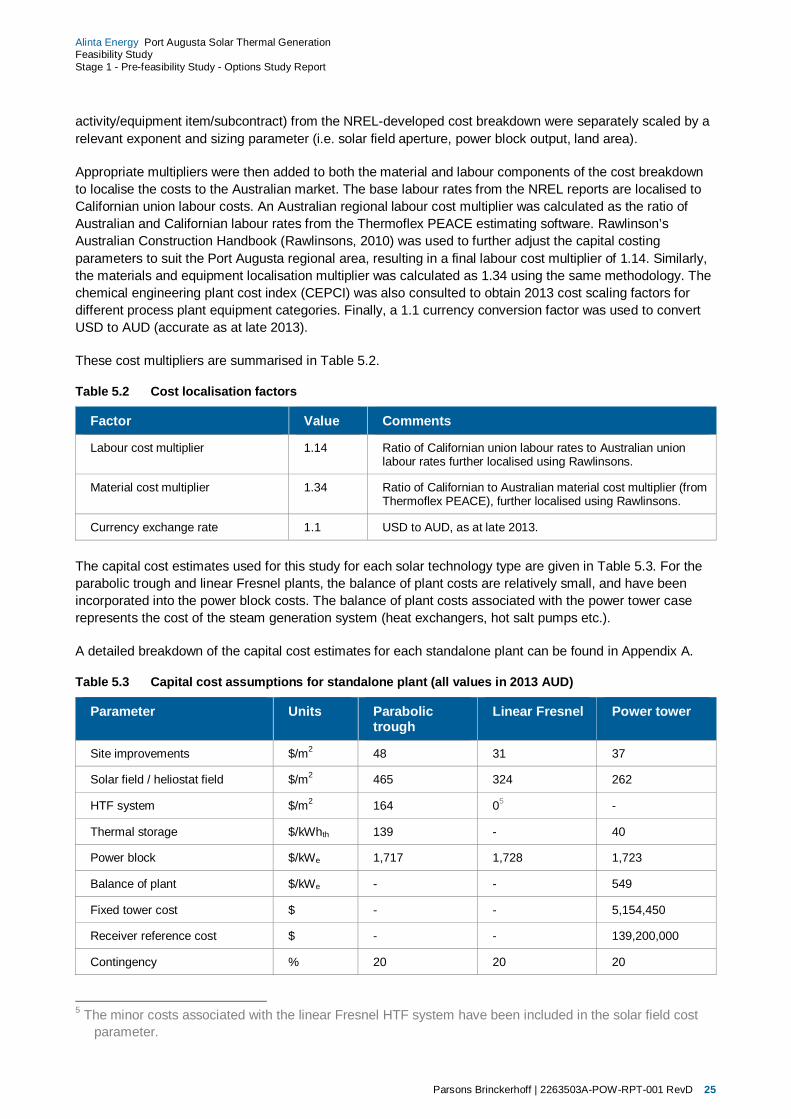
Appropriate multipliers were then added to both the material and labour components of the cost breakdownto localise the costs to the Australian market. The base labour rates from the NREL reports are localised toCalifornian union labour costs. An Australian regional labour cost multiplier was calculated as the ratio ofAustralian and Californian labour rates from the Thermoflex PEACE estimating software. Rawlinson’sAustralian Construction Handbook (Rawlinsons, 2010) was used to further adjust the capital costingparameters to suit the Port Augusta regional area, resulting in a final labour cost multiplier of 1.14. Similarly,the materials and equipment localisation multiplier was calculated as 1.34 using the same methodology. Thechemical engineering plant cost index (CEPCI) was also consulted to obtain 2013 cost scaling factors fordifferent process plant equipment categories. Finally, a 1.1 currency conversion factor was used to convertUSD to AUD (accurate as at late 2013).
These cost multipliers are summarised in Table 5.2.
Table 5.2 Cost localisation factors
Factor Value Comments
Labour cost multiplier 1.14 Ratio of Californian union labour rates to Australian unionlabour rates further localised using Rawlinsons.
Material cost multiplier 1.34 Ratio of Californian to Australian material cost multiplier (fromThermoflex PEACE), further localised using Rawlinsons.
Currency exchange rate 1.1 USD to AUD, as at late 2013.
The capital cost estimates used for this study for each solar technology type are given in Table 5.3. For theparabolic trough and linear Fresnel plants, the balance of plant costs are relatively small, and have beenincorporated into the power block costs. The balance of plant costs associated with the power tower caserepresents the cost of the steam generation system (heat exchangers, hot salt pumps etc.).
A detailed breakdown of the capital cost estimates for each standalone plant can be found in Appendix A.
Table 5.3 Capital cost assumptions for standalone plant (all values in 2013 AUD)
Parameter Units Parabolictrough
Linear Fresnel Power tower
Site improvements $/m2 48 31 37
Solar field / heliostat field $/m2 465 324 262
HTF system $/m2 164 05 -
Thermal storage $/kWhth 139 - 40
Power block $/kWe 1,717 1,728 1,723
Balance of plant $/kWe - - 549
Fixed tower cost $ - - 5,154,450
Receiver reference cost $ - - 139,200,000
Contingency % 20 20 20
5 The minor costs associated with the linear Fresnel HTF system have been included in the solar field costparameter.
Parsons Brinckerhoff | 2263503A-POW-RPT-001 RevD 26
Alinta Energy Port Augusta Solar Thermal GenerationFeasibility StudyStage 1 - Pre-feasibility Study - Options Study Report
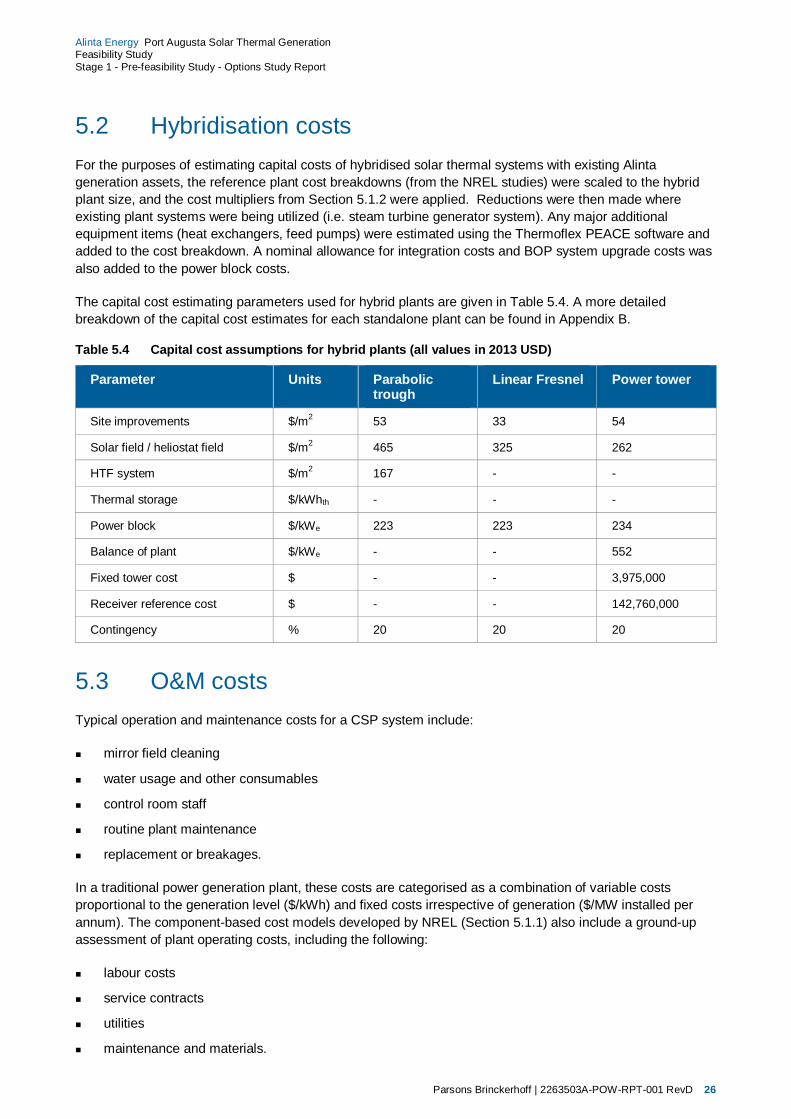
5.2 Hybridisation costsFor the purposes of estimating capital costs of hybridised solar thermal systems with existing Alintageneration assets, the reference plant cost breakdowns (from the NREL studies) were scaled to the hybridplant size, and the cost multipliers from Section 5.1.2 were applied. Reductions were then made whereexisting plant systems were being utilized (i.e. steam turbine generator system). Any major additionalequipment items (heat exchangers, feed pumps) were estimated using the Thermoflex PEACE software andadded to the cost breakdown. A nominal allowance for integration costs and BOP system upgrade costs wasalso added to the power block costs.
The capital cost estimating parameters used for hybrid plants are given in Table 5.4. A more detailedbreakdown of the capital cost estimates for each standalone plant can be found in Appendix B.
Table 5.4 Capital cost assumptions for hybrid plants (all values in 2013 USD)
Parameter Units Parabolictrough
Linear Fresnel Power tower
Site improvements $/m2 53 33 54
Solar field / heliostat field $/m2 465 325 262
HTF system $/m2 167 - -
Thermal storage $/kWhth - - -
Power block $/kWe 223 223 234
Balance of plant $/kWe - - 552
Fixed tower cost $ - - 3,975,000
Receiver reference cost $ - - 142,760,000
Contingency % 20 20 20
5.3 O&M costsTypical operation and maintenance costs for a CSP system include:
n mirror field cleaning
n water usage and other consumables
n control room staff
n routine plant maintenance
n replacement or breakages.
In a traditional power generation plant, these costs are categorised as a combination of variable costsproportional to the generation level ($/kWh) and fixed costs irrespective of generation ($/MW installed perannum). The component-based cost models developed by NREL (Section 5.1.1) also include a ground-upassessment of plant operating costs, including the following:
n labour costs
n service contracts
n utilities
n maintenance and materials.

Parsons Brinckerhoff | 2263503A-POW-RPT-001 RevD 27
Alinta Energy Port Augusta Solar Thermal GenerationFeasibility StudyStage 1 - Pre-feasibility Study - Options Study Report
For the purposes of this study, the NREL OPEX estimates were scaled from their reference plant to the plantsize under investigation, and multiplied by the the local labour cost multiplier developed in Section 5.1.2.These costs are given in more detail in Appendix A and Appendix B.

Parsons Brinckerhoff | 2263503A-POW-RPT-001 RevD 28
Alinta Energy Port Augusta Solar Thermal GenerationFeasibility StudyStage 1 - Pre-feasibility Study - Options Study Report
6. Plant integration assessment6.1 Existing assetsAlinta Energy currently own and operate the Port Augusta Power Stations, which consists of both NorthernPower Station (NPS) and Playford B Power Station (PPS). Northern consists of two unitised 270 MW coal-fired boilers, while Playford B comprises six ranged coal-fired boilers and four ranged 60 MW steam turbines.Key data on the two power stations is summarised in Table 6.1. Both power stations are supplied with browncoal from Leigh Creek mine via rail line.
Table 6.1 Key parameters for Playford B and Northern Power Stations
Parameter Playford B Northern
Capacity 240 MW (4 x 60 MW) 540 MW (2 x 270 MW)
Commissioning year 1963 1985
Steam conditions 485 ˚C / 62 bar 535 ˚C / 163 bar
Reheat conditions N/A 535 ˚C / 35 bar
Turbine heat rate (gross) 10,656 kJ/kWh 7,906 kJ/kWh
Boiler efficiency 81.1 % 82.6 %
Steam cycle efficiency (gross) 34.4 % 45.8 %
Overall plant efficiency (net) 25.7 % 37.6 %
Emissions intensity 1.5 tCO2/MWh 1.1 tCO2/MWh
Cooling water system Sea-water Sea-water
6.2 Potential for solar hybrid conversion6.2.1 Playford B Power Station
As of late 2013, Playford B Power Station is not an active generator in the NEM, and is being put into drystorage. It is currently only available to generate with a recall time of 90 days. In addition to this, Unit 2 iscurrently out of service and the total available capacity registered with AEMO is only 180 MW (AEMO, 2013).
Due to its age, modest steam conditions and lack of reheat circuit; PPS has a relatively low steam cycleefficiency of 34.4%. Converting one of the turbine units at PPS to solar hybrid operation would entail havingto accept the limitations of the existing steam cycle efficiency with very little opportunity to make significantimprovements. The comparatively low efficiency means that the solar field investment would need to besubstantially larger than for the potential hybridisation at NPS, for the same output. This larger investmentneeds to be amortised over the life of the generating plant which is highly uncertain and entails significantrisk.
In addition to the above, despite some previous partial refurbishment work, much of the Playford plant is ofuncertain condition and a significant plant assessment study would be required to evaluate what upgradeswould be required to extend the plant life a further 15 years. It is likely that, at a minimum, feed heaters andcondensers would need to be re-tubed along with upgrading of turbine and generator controls. Even with

Parsons Brinckerhoff | 2263503A-POW-RPT-001 RevD 29
Alinta Energy Port Augusta Solar Thermal GenerationFeasibility StudyStage 1 - Pre-feasibility Study - Options Study Report
such an upgrade there would still be a relatively high risk of failure in the future and OEM support for theequipment would be very difficult.
To quantify the magnitude of the capital cost difference between hybrid plants at both Playford B andNorthern, a power tower plant was modelled in SAM to generate steam for injection into the HP turbines atboth plants (Table 6.2). A nominal gross output of 60 MWe was chosen to fully utilise one of the turbine-generators at PPS. It was found that to achieve the same gross output, the power tower at PPS wouldrequire a 45% greater total aperture area and would have a 27% greater installed capital cost. Thisassessment also excludes any cost associated with further plant life extension upgrades at PPS, which arelikely to be substantial.
Table 6.2 Comparison of a power tower hybrid plant at PPS and NPS
Parameter Units Playford B Northern
Power block
Gross output MWe 60 60
Steam cycle efficiency % 34.4 45.8
Design thermal power MW th 175 131.3
Steam temperature ˚C 485 535
Steam pressure bar 62 163
Heliostat field
Solar multiple - 1.4 1.4
Total reflective area m2 504,546 348,503
Total land area ha 600 307
Capital costs
Tower cost $‘000 11,560 11,527
Receiver cost $‘000 56,405 47,335
Heliostat field cost $‘000 132,190 91,310
Total installed cost $‘000 370,986 292,060
6.2.2 Northern Power Station
Compared with Playford, Northern Power Station has a more modern design, with unitised sub-critical once-through boilers and single reheat turbines. As a result of this the steam cycle efficiency is approximately45.8%. The steam cycle diagram for NPS is shown in Figure 6.1.
In the early 2000’s, NPS underwent an LP turbine upgrade to achieve a nominal output of 272 MW. Thismeans that the 280 MVA rating on the generator and HV equipment has nearly been reached, and no furtherincrease in generation is possible without a significant upgrade to this equipment.
It is understood that the Leigh Creek coal mine, which is the sole coal source for NPS, has an estimated endof life of 2032. As a result of this, any potential hybrid solar thermal plant supplementing NPS would have anoperational life of approximately 15 years.
Given the limitations in possible maximum steam temperature and pressure for each of the different solartechnologies, there are limits on which hybridisation arrangements can be achieved.
Parsons Brinckerhoff | 2263503A-POW-RPT-001 RevD 30
Alinta Energy Port Augusta Solar Thermal GenerationFeasibility StudyStage 1 - Pre-feasibility Study - Options Study Report
6.2.2.1 Parallel hybridisation
Parallel hybridisation is the use of a power tower CSP plant to generate superheated steam at conditionsmatching both the HP and IP turbine inlet conditions at NPS. This allows for the solar field to operate inparallel with the existing coal-fired boiler, with a higher level of penetration than the solar boost option.Parabolic trough and linear Fresnel plants were not considered due to their inability to generate steam at theNPS steam conditions.
This hybridisation option may potentially lend itself to continued use after the operational life of NPS hasbeen reached. As the power tower and steam generator would be designed for modern steam turbine inletconditions, it may be possible to install a new 50 MW power block (steam turbine, generator, condenser andfeedheating system) to replace the NPS asset. This plant would not have the required solar multiple to allowfor any thermal energy storage, and would be operating only as a non-scheduled generator, unless anotherfast starting steam generator was installed (such as a gas-fired boiler).
6.2.2.2 Solar boost
Solar boost uses either a parabolic trough or a linear Fresnel CSP plant to generate enough superheatedsteam to replace the extraction steam to the final HP heater (cold reheat conditions). This option has a muchlower possible penetration (due to risks in unbalanced superheat/reheat steam flows through the existingboiler), but also has a much lower land area requirement than parallel hybrid options. An additionaladvantage is that it is less invasive to the existing boiler, which no boiler proper or boiler external pipingmodifications required.
Due to the relatively large HTF mass flow rate required in a parabolic trough system utilising synthetic oil,integration piping costs will be significantly greater than for a linear Fresnel system with direct steamgeneration.

Parsons Brinckerhoff | 2263503A-POW-RPT-001 RevD 31
Alinta Energy Port Augusta Solar Thermal GenerationFeasibility StudyStage 1 - Pre-feasibility Study - Options Study Report
Figure 6.1 Cycle diagram for Northern Power Station
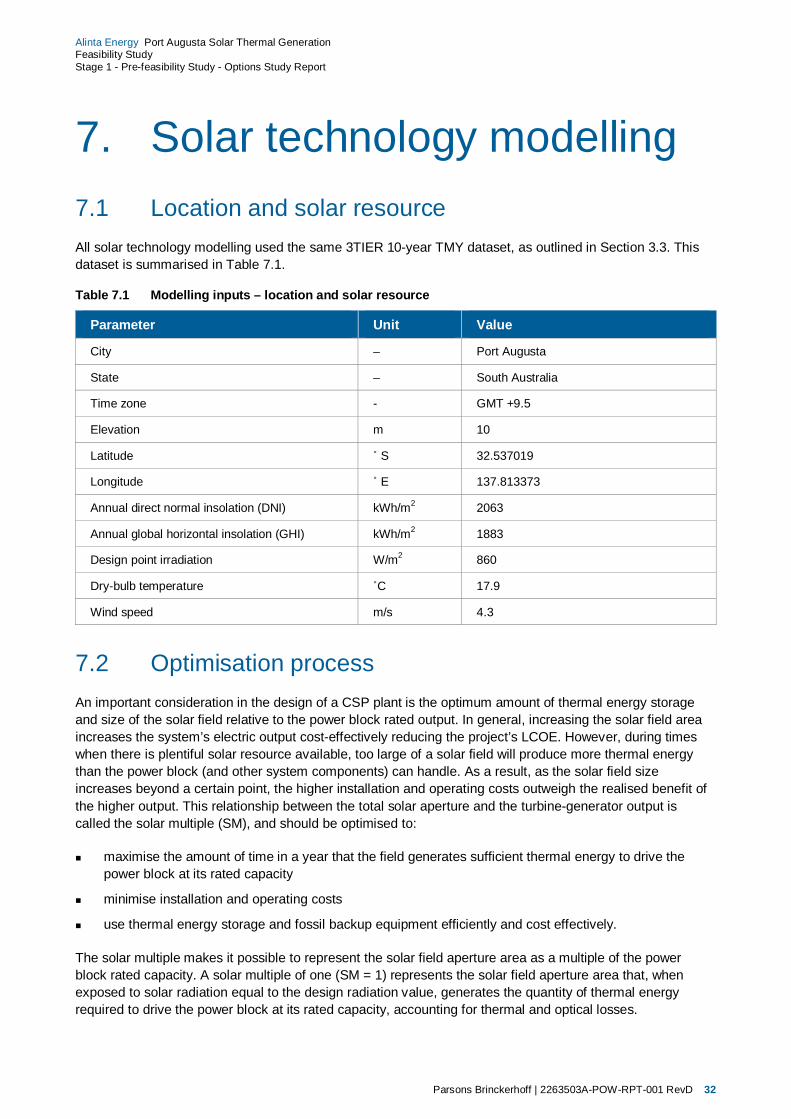
Parsons Brinckerhoff | 2263503A-POW-RPT-001 RevD 32
Alinta Energy Port Augusta Solar Thermal GenerationFeasibility StudyStage 1 - Pre-feasibility Study - Options Study Report
7. Solar technology modelling7.1 Location and solar resourceAll solar technology modelling used the same 3TIER 10-year TMY dataset, as outlined in Section 3.3. Thisdataset is summarised in Table 7.1.
Table 7.1 Modelling inputs – location and solar resource
Parameter Unit Value
City – Port Augusta
State – South Australia
Time zone - GMT +9.5
Elevation m 10
Latitude ˚ S 32.537019
Longitude ˚ E 137.813373
Annual direct normal insolation (DNI) kWh/m2 2063
Annual global horizontal insolation (GHI) kWh/m2 1883
Design point irradiation W/m2 860
Dry-bulb temperature ˚C 17.9
Wind speed m/s 4.3
7.2 Optimisation processAn important consideration in the design of a CSP plant is the optimum amount of thermal energy storageand size of the solar field relative to the power block rated output. In general, increasing the solar field areaincreases the system’s electric output cost-effectively reducing the project’s LCOE. However, during timeswhen there is plentiful solar resource available, too large of a solar field will produce more thermal energythan the power block (and other system components) can handle. As a result, as the solar field sizeincreases beyond a certain point, the higher installation and operating costs outweigh the realised benefit ofthe higher output. This relationship between the total solar aperture and the turbine-generator output iscalled the solar multiple (SM), and should be optimised to:
n maximise the amount of time in a year that the field generates sufficient thermal energy to drive thepower block at its rated capacity
n minimise installation and operating costs
n use thermal energy storage and fossil backup equipment efficiently and cost effectively.
The solar multiple makes it possible to represent the solar field aperture area as a multiple of the powerblock rated capacity. A solar multiple of one (SM = 1) represents the solar field aperture area that, whenexposed to solar radiation equal to the design radiation value, generates the quantity of thermal energyrequired to drive the power block at its rated capacity, accounting for thermal and optical losses.
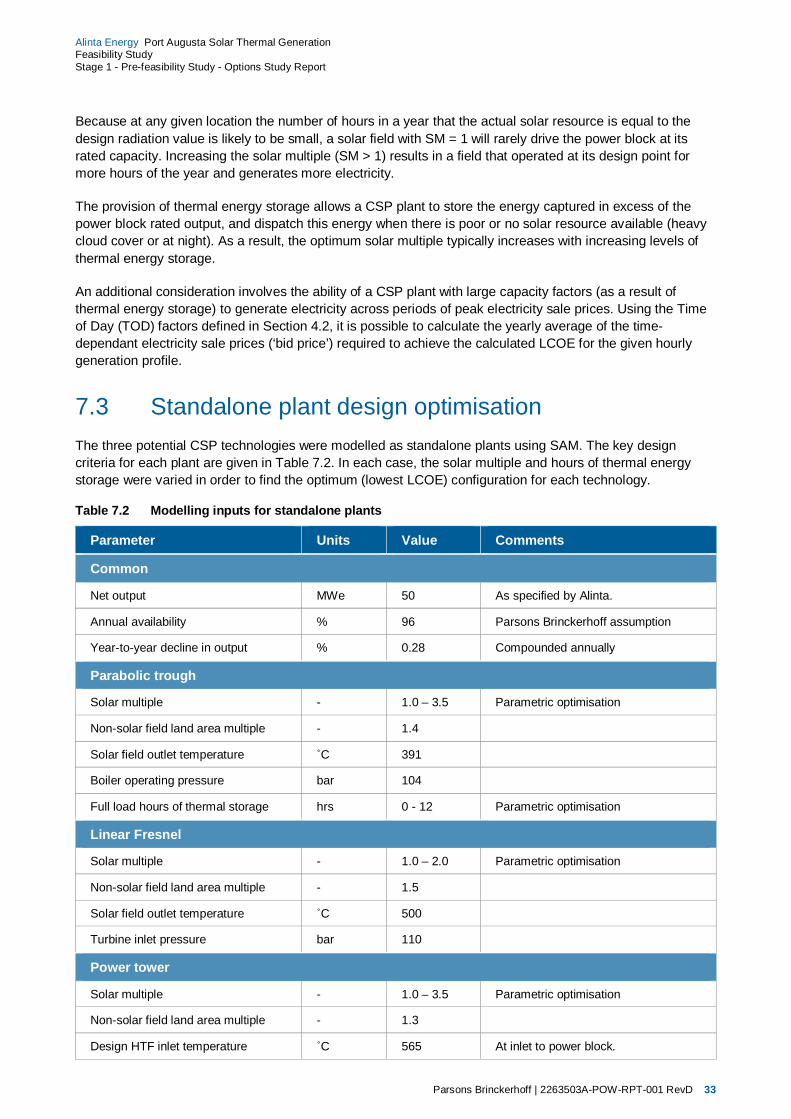
Parsons Brinckerhoff | 2263503A-POW-RPT-001 RevD 33
Alinta Energy Port Augusta Solar Thermal GenerationFeasibility StudyStage 1 - Pre-feasibility Study - Options Study Report
Because at any given location the number of hours in a year that the actual solar resource is equal to thedesign radiation value is likely to be small, a solar field with SM = 1 will rarely drive the power block at itsrated capacity. Increasing the solar multiple (SM > 1) results in a field that operated at its design point formore hours of the year and generates more electricity.
The provision of thermal energy storage allows a CSP plant to store the energy captured in excess of thepower block rated output, and dispatch this energy when there is poor or no solar resource available (heavycloud cover or at night). As a result, the optimum solar multiple typically increases with increasing levels ofthermal energy storage.
An additional consideration involves the ability of a CSP plant with large capacity factors (as a result ofthermal energy storage) to generate electricity across periods of peak electricity sale prices. Using the Timeof Day (TOD) factors defined in Section 4.2, it is possible to calculate the yearly average of the time-dependant electricity sale prices (‘bid price’) required to achieve the calculated LCOE for the given hourlygeneration profile.
7.3 Standalone plant design optimisationThe three potential CSP technologies were modelled as standalone plants using SAM. The key designcriteria for each plant are given in Table 7.2. In each case, the solar multiple and hours of thermal energystorage were varied in order to find the optimum (lowest LCOE) configuration for each technology.
Table 7.2 Modelling inputs for standalone plants
Parameter Units Value Comments
Common
Net output MWe 50 As specified by Alinta.
Annual availability % 96 Parsons Brinckerhoff assumption
Year-to-year decline in output % 0.28 Compounded annually
Parabolic trough
Solar multiple - 1.0 – 3.5 Parametric optimisation
Non-solar field land area multiple - 1.4
Solar field outlet temperature ˚C 391
Boiler operating pressure bar 104
Full load hours of thermal storage hrs 0 - 12 Parametric optimisation
Linear Fresnel
Solar multiple - 1.0 – 2.0 Parametric optimisation
Non-solar field land area multiple - 1.5
Solar field outlet temperature ˚C 500
Turbine inlet pressure bar 110
Power tower
Solar multiple - 1.0 – 3.5 Parametric optimisation
Non-solar field land area multiple - 1.3
Design HTF inlet temperature ˚C 565 At inlet to power block.
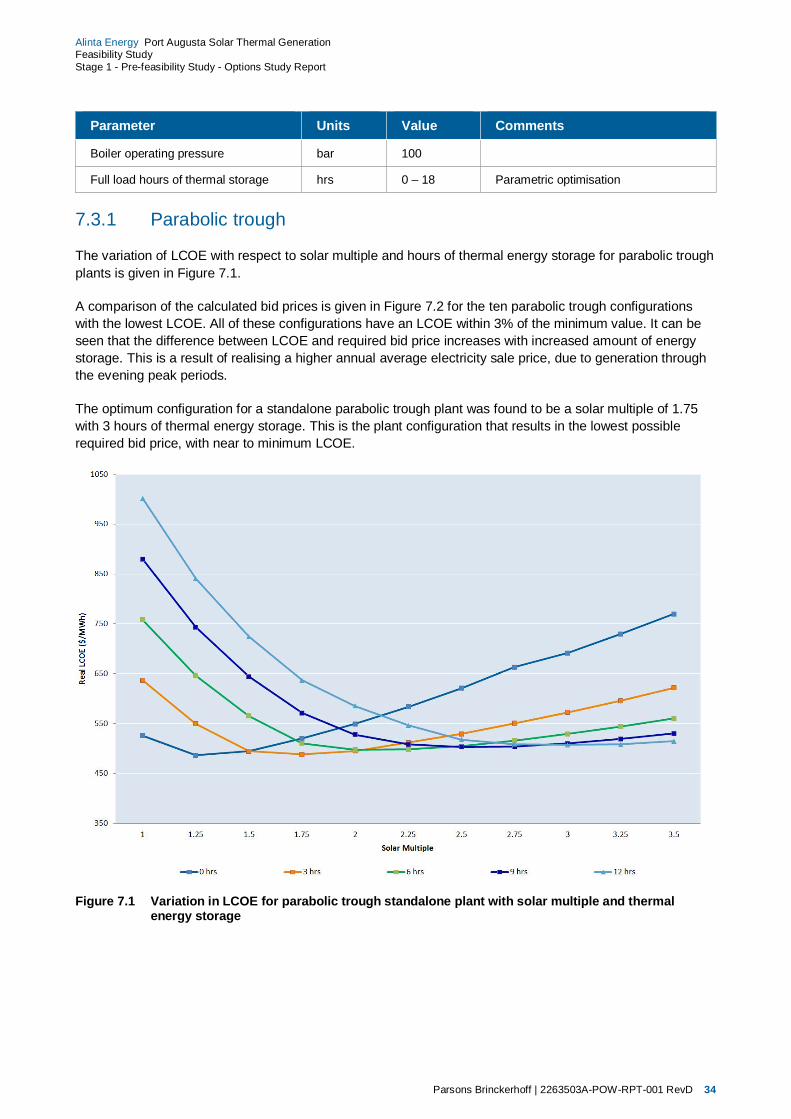
Parsons Brinckerhoff | 2263503A-POW-RPT-001 RevD 34
Alinta Energy Port Augusta Solar Thermal GenerationFeasibility StudyStage 1 - Pre-feasibility Study - Options Study Report
Parameter Units Value Comments
Boiler operating pressure bar 100
Full load hours of thermal storage hrs 0 – 18 Parametric optimisation
7.3.1 Parabolic trough
The variation of LCOE with respect to solar multiple and hours of thermal energy storage for parabolic troughplants is given in Figure 7.1.
A comparison of the calculated bid prices is given in Figure 7.2 for the ten parabolic trough configurationswith the lowest LCOE. All of these configurations have an LCOE within 3% of the minimum value. It can beseen that the difference between LCOE and required bid price increases with increased amount of energystorage. This is a result of realising a higher annual average electricity sale price, due to generation throughthe evening peak periods.
The optimum configuration for a standalone parabolic trough plant was found to be a solar multiple of 1.75with 3 hours of thermal energy storage. This is the plant configuration that results in the lowest possiblerequired bid price, with near to minimum LCOE.
Figure 7.1 Variation in LCOE for parabolic trough standalone plant with solar multiple and thermalenergy storage

Parsons Brinckerhoff | 2263503A-POW-RPT-001 RevD 35
Alinta Energy Port Augusta Solar Thermal GenerationFeasibility StudyStage 1 - Pre-feasibility Study - Options Study Report
Figure 7.2 Variation in required bid price and LCOE for parabolic trough standalone plant configurations
7.3.2 Power tower
The variation of LCOE with respect to solar multiple and hours of thermal energy storage for power towerplants is given in Figure 7.3. Similarly to the parabolic trough results, there are multiple plant configurationswhich result in a very similar LCOE value. Due to the significantly cheaper cost of molten salt storage for apower tower system (relative to a parabolic trough system), it is cost effective to provide much higher levelsof storage, which need a correspondingly large solar multiple. Although it is possible to evaluate power towerplants with solar multiples greater than 3.5, this was determined to be a realistic upper limit at which theminimal incremental gains in LCOE are more than offset by the increase in capital cost.
A comparison of the calculated bid prices is given in Figure 7.4 for the ten power tower configurations withthe lowest LCOE.
The optimum configuration for a standalone power tower plant was determined to be a solar multiple of 3.5,with 15 hours of thermal energy storage. This is the plant configuration that results in the lowest possiblerequired bid price and LCOE.
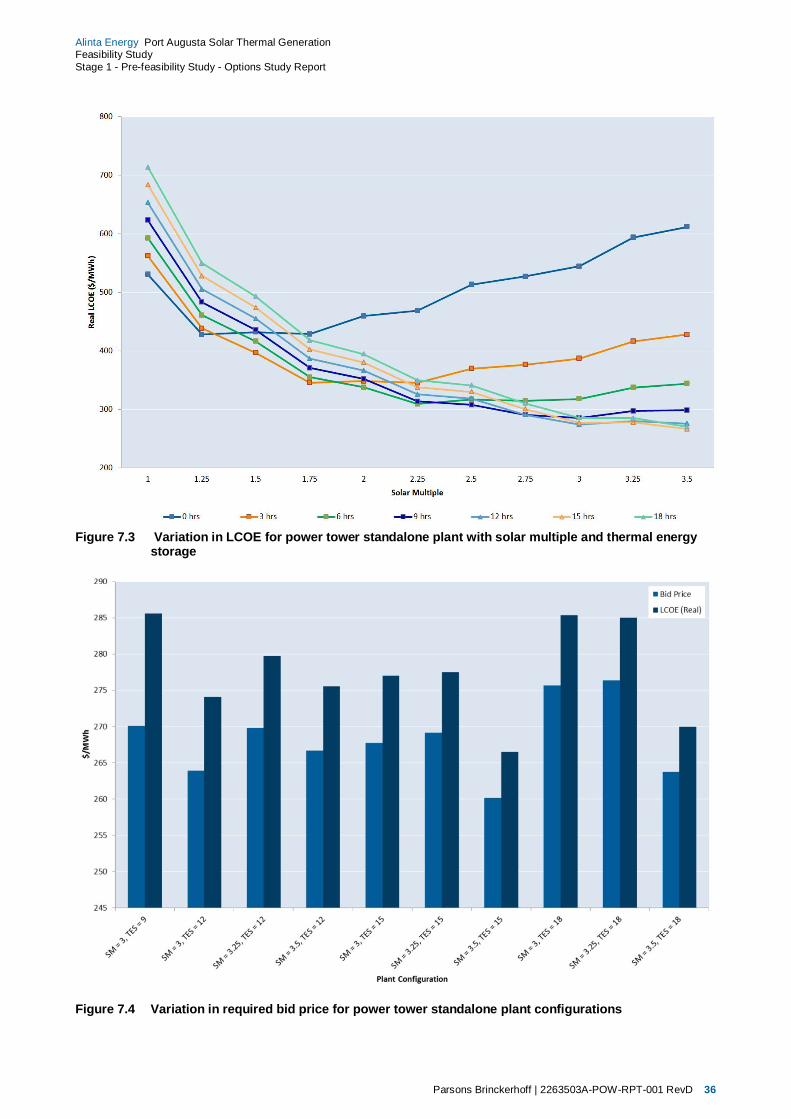
Parsons Brinckerhoff | 2263503A-POW-RPT-001 RevD 36
Alinta Energy Port Augusta Solar Thermal GenerationFeasibility StudyStage 1 - Pre-feasibility Study - Options Study Report
Figure 7.3 Variation in LCOE for power tower standalone plant with solar multiple and thermal energystorage
Figure 7.4 Variation in required bid price for power tower standalone plant configurations

Parsons Brinckerhoff | 2263503A-POW-RPT-001 RevD 37
Alinta Energy Port Augusta Solar Thermal GenerationFeasibility StudyStage 1 - Pre-feasibility Study - Options Study Report
7.3.3 Linear Fresnel
As linear Fresnel systems use direct steam as the heat transfer fluid, there are no known installations wherelinear Fresnel solar fields are provided with thermal energy storage. The variation in LCOE was investigatedwith respect to solar multiple only, and results are given in Figure 7.5. As there is no energy storage to allowdispatch during periods of high electricity prices, the required bid price follows the calculated LCOE closely.
The optimum solar multiple for a linear Fresnel standalone plant at this location was determined to be 1.6.Although this does not represent the absolute minimum LCOE value, further increasing the solar multiplebeyond this point delivers diminishing returns for increasing capital expenditure.
Figure 7.5 Variation in LCOE for linear Fresnel standalone plants with respect to solar multiple
7.3.4 Standalone plant sensitivity analysis
For each of the optimised standalone plant configurations, a sensitivity analysis was conducted to determinethe impact on total project installed cost and LCOE by varying solar multiple. To determine this sensitivity,the optimum (lowest LCOE) hours of thermal energy storage was determined for each solar multiple, acrossthe range given in Table 7.2. The total installed capital cost was then calculated for each configuration, withthe results presented in Appendix E.
7.4 Hybrid plant design optimisation at NPSIn order to evaluate the effect of introducing a hybrid solar thermal steam generator on the existing steamcycle at NPS, a thermodynamic model of the existing system was created using Thermoflex. The key cycleconditions are given in Table 7.3 and were validated against the conditions in the provided reference heatbalance diagram. Auxiliary power loads for the site have been fixed at 7.7% of generator gross output, basedon technical design information and performance data provided by Alinta.

Parsons Brinckerhoff | 2263503A-POW-RPT-001 RevD 38
Alinta Energy Port Augusta Solar Thermal GenerationFeasibility StudyStage 1 - Pre-feasibility Study - Options Study Report
Table 7.3 Northern Power Station thermodynamic model validation
Parameter Units Reference heatbalance6
Modelled value Difference (%)
Generator output (gross) kW 257,4707 260,126 1.03
Generator output (net) kW N/A 240,096 N/A
Main steam flow kg/h 741,480 741,600 0.02
Main steam enthalpy kJ/kg 3,393.1 3,393.0 0.00
Hot reheat steam flow kg/h 640,500 656,640 2.52
Hot reheat steam enthalpy kJ/kg 3,529.6 3,529.0 -0.02
Cold reheat steam enthalpy kJ/kg 3,051.6 3,051.0 -0.02
Feedwater flow kg/h 745,640 741,600 -0.54
Feedwater enthalpy kJ/kg 1,066.8 1,063.0 -0.36
7.4.1 Parallel hybridisation
For the parallel hybridisation option a single molten-salt power tower was modelled, with two steamgeneration passes using heat exchangers, one each in parallel with the existing evaporator/superheater andreheater passes of the coal-fired boiler. The proposed parallel hybrid system with a power tower solar field isshown in Figure 7.7. Whilst this study assumes all steam generated by the solar steam generator is injectedto a single unit at NPS, it would be possible to split this across both units (25 MWe equivalent each) ifdesired.
The limitation to the level of penetration using this hybridisation method is the turn-down ability of the existingcoal-fired boiler. For this study, the power tower solar field was sized to give the thermal equivalent of50 MWe generated, as per the limitation given by Alinta for the standalone plant evaluation. The ratio ofsuperheat to reheat steam flow was maintained to minimise boiler imbalance and reheat temperature controlissues.
The thermodynamic modelling inputs for the parallel hybridised system are given in Table 7.4.
Table 7.4 Solar field sizing parameters for parallel hybridised systems
Parameter Units Value Comments
Evaporator / superheater
Steam flow kg/h 144,000 Required main steam flow for 50 MWe equivalent
Feedwater temperature ˚C 245 Boiler feedwater temperature
Steam outlet temperature ˚C 535 Main steam temperature
Steam outlet pressure bar 163 Main steam pressure
Reheater
6 MHI Drawing No. C05-1006 “Heat Rate Guarantee 257,470 kW Heat Balance”7 It is understood that NPS has recently undergone a turbine upgrade resulting in a rerating of the units to
270 MW each, however the heat balance diagram provided to Parsons Brinckerhoff for modellingpurposes still reported 250 MW nominal capacity. This discrepancy is not expected to have a materialdifference on the findings of this report.

Parsons Brinckerhoff | 2263503A-POW-RPT-001 RevD 39
Alinta Energy Port Augusta Solar Thermal GenerationFeasibility StudyStage 1 - Pre-feasibility Study - Options Study Report
Parameter Units Value Comments
Steam flow kg/h 122,400 Required reheat steam flow for 50 MWeequivalent
Steam inlet temperature ˚C 325 Cold reheat temperature
Steam outlet temperature ˚C 535 Reheat steam temperature
Steam outlet pressure bar 35 Reheat steam pressure
As the existing plant at NPS is constrained by the available generator and transformer capacity, the steamthroughput of the existing coal-fired boiler was reduced to 80% of its nominal load to maintain the samegross generation with the solar boost input added. The modelled outputs of the parallel hybrid system aregiven in Table 7.5.
The plant size was optimized by varying the solar multiple between 1.0 and 2.0 (Figure 7.6), with the lowestLCOE resulting from a solar multiple of 1.4. The step-change in LCOE found between solar multiples of 1.4and 1.5 is a result of a step-change in optimum tower height (100m to 116m). In the standalone plantmodelling, the influence of tower height on total project cost was masked by the larger heliostat field andadditional power block costs. The tower cost has a much bigger influence on the hybrid plant modelling.
Table 7.5 Modelled system outputs for parallel hybrid systems
Parameter Units Base case Modelledparallel hybrid
Difference (%)
Generator output (gross) kW 260,060 259,776 -0.11
Gross electric efficiency (HHV) % 37.88 39.29 3.72
Steam flows
Fired boiler superheater steamflow
kg/h 741,600 593,280 -20.00
Fired boiler reheater steamflow
kg/h 656,280 530,280 -19.20
Power tower superheatersteam flow
kg/h 0 144,000 N/A
Power tower reheater steamflow
kg/h 0 122,400 N/A
Heat input
Coal boiler heat transfer –evaporator/superheater pass
kWth 479,888 384,154 -19.95
Coal boiler heat transfer –reheat pass
kWth 87,221 71,357 -18.19
Power tower heat transfer –evaporator/superheater pass
kWth 0 93,256 N/A
Power tower heat transfer –reheater pass
kWth 0 16,474 N/A
Total coal heat input (HHV) kWth 686,574 551,466 -19.68
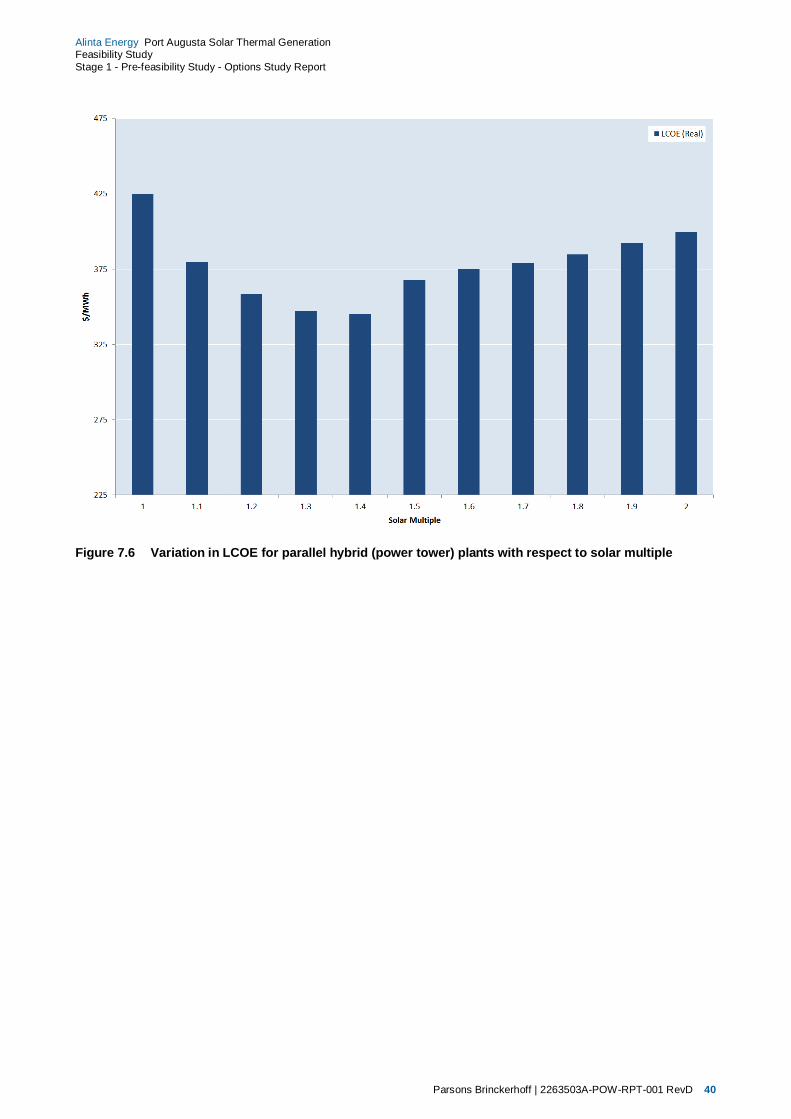
Parsons Brinckerhoff | 2263503A-POW-RPT-001 RevD 40
Alinta Energy Port Augusta Solar Thermal GenerationFeasibility StudyStage 1 - Pre-feasibility Study - Options Study Report
Figure 7.6 Variation in LCOE for parallel hybrid (power tower) plants with respect to solar multiple
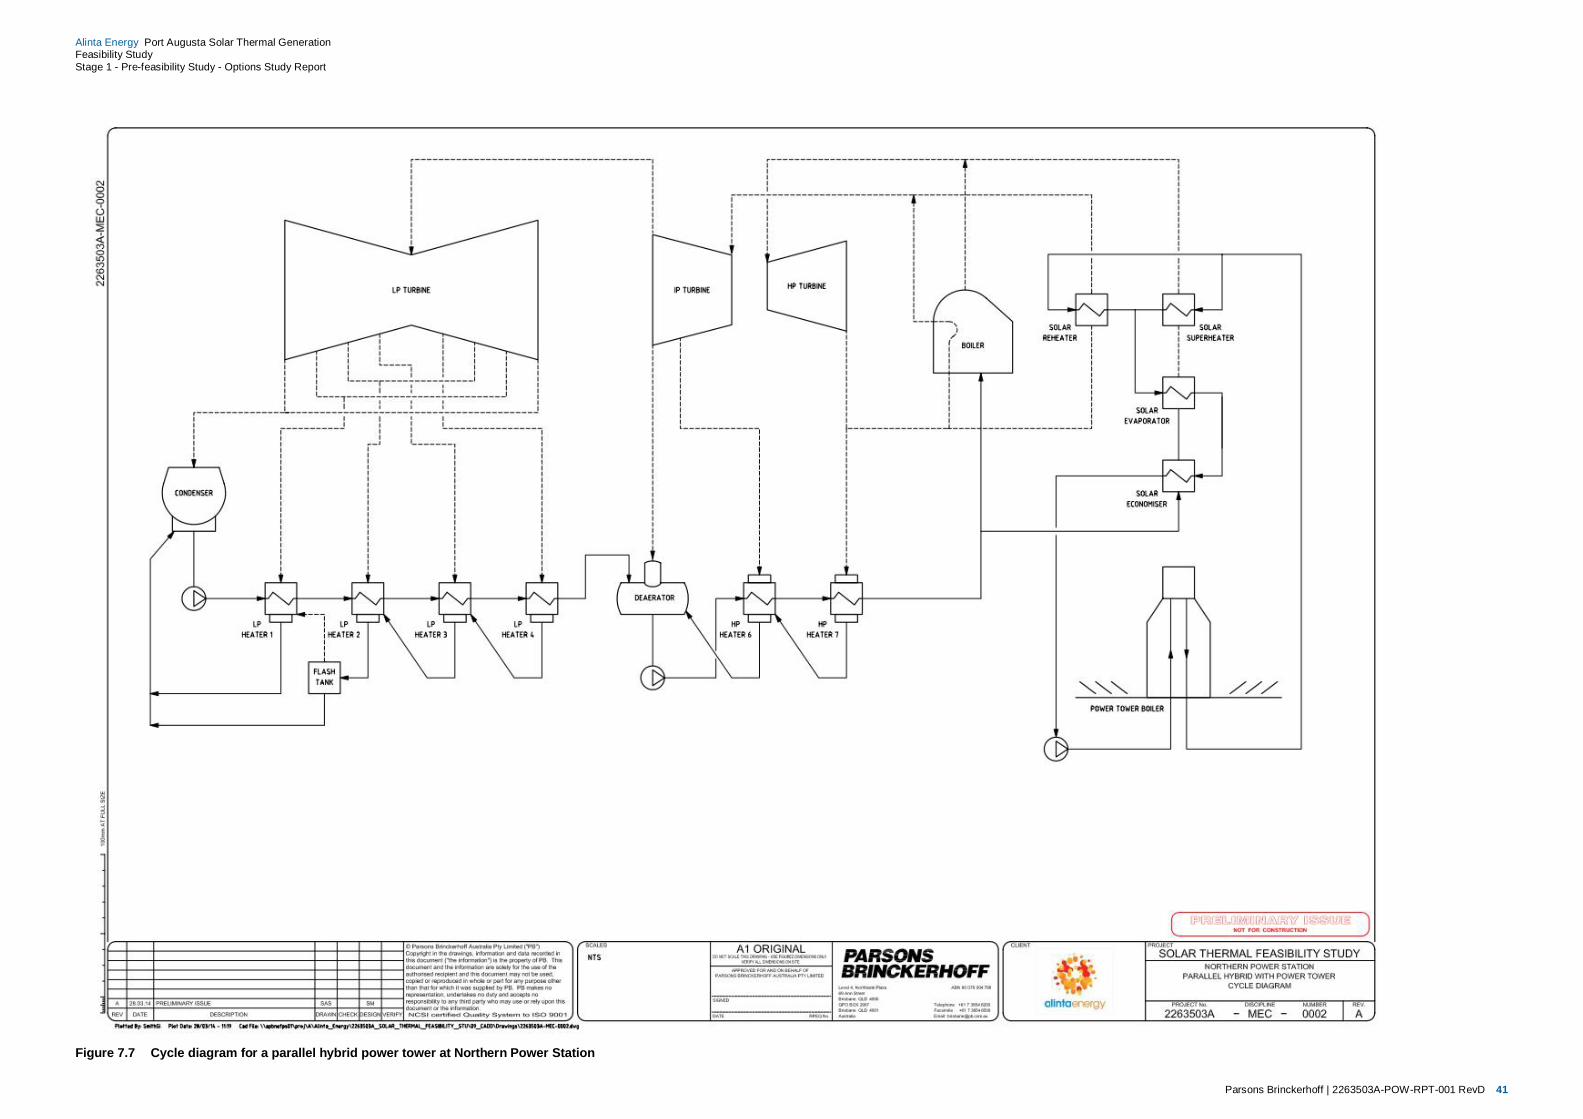
Parsons Brinckerhoff | 2263503A-POW-RPT-001 RevD 41
Alinta Energy Port Augusta Solar Thermal GenerationFeasibility StudyStage 1 - Pre-feasibility Study - Options Study Report
Figure 7.7 Cycle diagram for a parallel hybrid power tower at Northern Power Station

Parsons Brinckerhoff | 2263503A-POW-RPT-001 RevD 42
Alinta Energy Port Augusta Solar Thermal GenerationFeasibility StudyStage 1 - Pre-feasibility Study - Options Study Report
7.4.2 Solar boost
The solar boost option was modelled using both parabolic trough and linear Fresnel CSP technologies togenerate superheated steam at 340 ˚C and 40 bar for injection into the NPS cold reheat line. The solar fieldwas sized to generate 18 kg/s of steam at these conditions, which is sufficient to displace the extractionsteam flow to the final feedwater heater. This provides for a 7.3% solar penetration of the existing cycle.Parsons Brinckerhoff has experience that suggests that solar boost systems are limited to approximately 8%penetration before the superheater and reheater paths in the existing boiler become unbalanced. It may bepossible to increase the penetration level at NPS by providing additional steam to the boiler reheat circuit,however further investigation of the boiler design and operation would be required.
The modelling inputs for solar boost systems are given in Table 7.6.
Table 7.6 Solar field sizing parameters for solar boost hybrid systems
Parameter Units Value Comments
Steam flow kg/h 128,376 HP heater 7 bled steam flow for both units
Feedwater temperature ˚C 165 Deaerator discharge temperature
Steam outlet temperature ˚C 340 Cold reheat steam temperature
Steam outlet pressure bar 40 HP heater 7 bled steam pressure plus 7.5%margin (pressure losses)
As with the parallel hybrid system in Section 7.4.1, the steam throughput of the existing coal-fired boiler wasreduced to maintain the same gross generation with the solar boost input added. The modelled outputs ofthe solar boost Thermoflex model are presented in Table 7.7. The proposed solar boost arrangement withNorthern Power Station is shown in Figure 7.8.
Table 7.7 Modelled outputs for solar boost hybrid systems
Parameter Units Base case Modelledsolar boost
Difference (%)
Generator output (gross) kW 260,126 260,359 0.09
Gross electric efficiency (HHV) % 37.88 37.56 -0.84
Steam flows
Superheater steam flow kg/h 741,600 700,560 -5.53
Reheater steam flow kg/h 656,640 679,680 3.51
Solar boiler steam flow kg/h 0 64,188 N/A
Heat input
Coal boiler heat transfer –evaporator/superheater pass
kWth 479,888 451,093 -6.00
Coal boiler heat transfer –reheat pass
kWth 87,272 86,679 -0.68
Solar boiler heat transfer kWth 0 42,209 N/A
Total coal heat input (HHV) kWth 686,639 651,055 -5.18
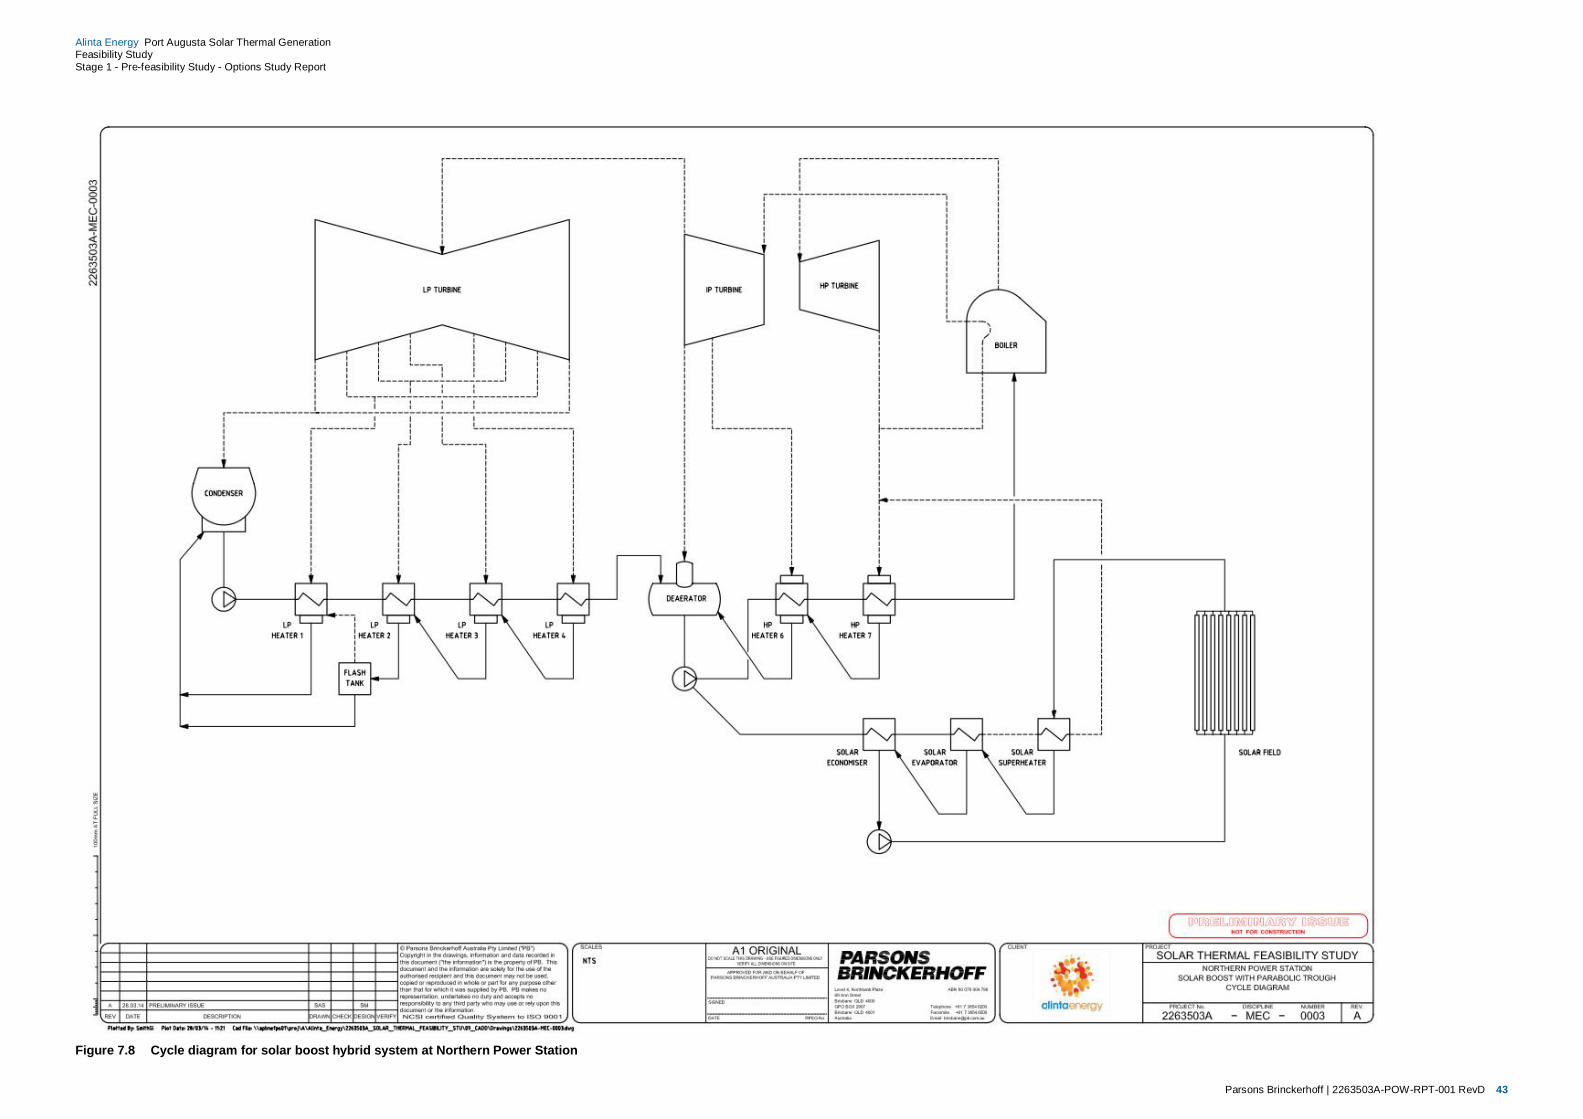
Parsons Brinckerhoff | 2263503A-POW-RPT-001 RevD 43
Alinta Energy Port Augusta Solar Thermal GenerationFeasibility StudyStage 1 - Pre-feasibility Study - Options Study Report
Figure 7.8 Cycle diagram for solar boost hybrid system at Northern Power Station
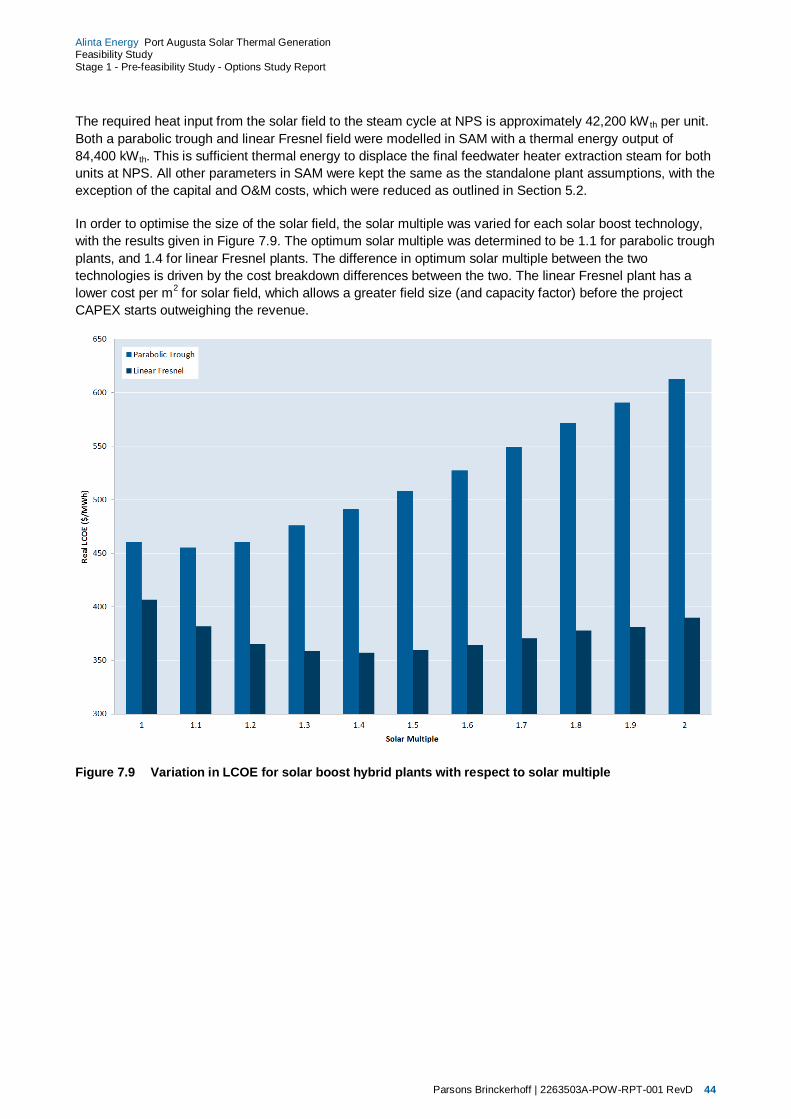
Parsons Brinckerhoff | 2263503A-POW-RPT-001 RevD 44
Alinta Energy Port Augusta Solar Thermal GenerationFeasibility StudyStage 1 - Pre-feasibility Study - Options Study Report
The required heat input from the solar field to the steam cycle at NPS is approximately 42,200 kW th per unit.Both a parabolic trough and linear Fresnel field were modelled in SAM with a thermal energy output of84,400 kWth. This is sufficient thermal energy to displace the final feedwater heater extraction steam for bothunits at NPS. All other parameters in SAM were kept the same as the standalone plant assumptions, with theexception of the capital and O&M costs, which were reduced as outlined in Section 5.2.
In order to optimise the size of the solar field, the solar multiple was varied for each solar boost technology,with the results given in Figure 7.9. The optimum solar multiple was determined to be 1.1 for parabolic troughplants, and 1.4 for linear Fresnel plants. The difference in optimum solar multiple between the twotechnologies is driven by the cost breakdown differences between the two. The linear Fresnel plant has alower cost per m2 for solar field, which allows a greater field size (and capacity factor) before the projectCAPEX starts outweighing the revenue.
Figure 7.9 Variation in LCOE for solar boost hybrid plants with respect to solar multiple

Parsons Brinckerhoff | 2263503A-POW-RPT-001 RevD 45
Alinta Energy Port Augusta Solar Thermal GenerationFeasibility StudyStage 1 - Pre-feasibility Study - Options Study Report
8. Evaluation8.1 Modelling results8.1.1 Standalone plant modelling results
Key output parameters for each of the solar thermal technologies in their optimum configuration arepresented in Table 8.1. First-year generation profiles for each plant are given in Figure 8.1.
Table 8.1 Modelling outputs for optimum standalone plant configurations
Parameter Units Parabolictrough
Power tower Linear Fresnel
Generator output (net) MWe 50 50 50
Solar multiple - 1.75 3.5 1.6
Thermal energy storage hrs 3 15 0
Annual energy production MWh 123,145 282,581 89,248
Capacity factor % 28.4 64.7 20.4
Aperture area m2 405,480 879,094 427,315
Land required ha 147 553 68
Water consumption for mirrorwashing (annual)
m3 17,882 38,768 1,025
Total direct cost $’000 515,659 713,519 292,310
Total installed cost $’000 608,478 796,287 348,434
Total installed cost percapacity
$/kWe 12,170 15,926 6,969
LCOE (real) $/MWh 473.93 258.24 389.96

Parsons Brinckerhoff | 2263503A-POW-RPT-001 RevD 46
Alinta Energy Port Augusta Solar Thermal GenerationFeasibility StudyStage 1 - Pre-feasibility Study - Options Study Report
Figure 8.1 Annual (first-year) generation profile for each standalone CSP technology
8.1.2 Hybrid plant modelling results
Key output parameters for each of the solar thermal technologies in their optimum configuration arepresented in Table 8.2. First-year thermal output profiles for each plant are given in Figure 8.2 (Nb: this chartonly shows thermal energy provided to the NPS steam cycle from the solar field).
Table 8.2 Modelling outputs for optimum hybrid plant configurations
Parameter Units Parallelhybridisation(power tower)
Solar boost(parabolictrough)
Solar boost(linear Fresnel)
Solar multiple - 1.4 1.1 1.4
Annual energy production8 MWh 99,858 45,990 46,740
Annual coal burn displaced9 tonnes 28,840 13,280 13,500
Aperture area m2 330,755 148,240 221,875
Land required ha 245 54 36
Water consumption for mirrorwashing (annual)
m3 14,586 6,537 533
Total direct cost $’000 244,573 129,734 103,198
8 Electricity generated from NPS attributable to steam raised in the solar field9 Assuming a calorific value of Leigh Creek coal of 15.2 MJ/kg (HHV)

Parsons Brinckerhoff | 2263503A-POW-RPT-001 RevD 47
Alinta Energy Port Augusta Solar Thermal GenerationFeasibility StudyStage 1 - Pre-feasibility Study - Options Study Report
Parameter Units Parallelhybridisation(power tower)
Solar boost(parabolictrough)
Solar boost(linear Fresnel)
Total installed cost $’000 275,389 162,816 130,133
Total installed cost percapacity
$/kWe 5,513 5,820 4,651
LCOE (real) $/MWh 314.60 412.12 323.10
Figure 8.2 Annual (first-year) thermal energy output profile for hybrid plants
8.2 Multi-criteria analysisA multi-criteria analysis (MCA) was conducted on the six CSP plant options identified in this report (threestandalone plants and three hybrid plant configurations). An MCA combines a quantitative and qualitativeassessment of the critical decision-making factors for each plant configuration which may not be captured bysolely conducting the LCOE analysis.
The MCA was used to evaluate a number of technical and commercial factors, and then provide a relativeranking of the merit of each proposed plant. This ranking was achieved by the following means:
n Each of the plant configurations was assigned a score against each criteria based on a range of one tonine (with one representing an excellent outcome and nine representing a very poor outcome).
n Criteria weightings were allocated to each assessment criterion to indicate its importance relative to theother criteria. With respect to this process, we note that:
4 initial weightings were assigned to criteria by the Parsons Brinckerhoff project team based on thecriterions perceived importance to Alinta

Parsons Brinckerhoff | 2263503A-POW-RPT-001 RevD 48
Alinta Energy Port Augusta Solar Thermal GenerationFeasibility StudyStage 1 - Pre-feasibility Study - Options Study Report
4 these criteria weightings were then commented on by Alinta personnel and subsequently adjustedto reach the final importance weightings.
n The weighted MCA score for each criterion was determined by multiplying the score by the weighting.
n An MCA rank determined by the sum of the scores was awarded to each opportunity.
Table 8.3 provides an outline of the criteria implemented.
An overview of the weighted MCA scores (lower is better) is given in Figure 8.3, with the full scoringworksheet given in Appendix C.
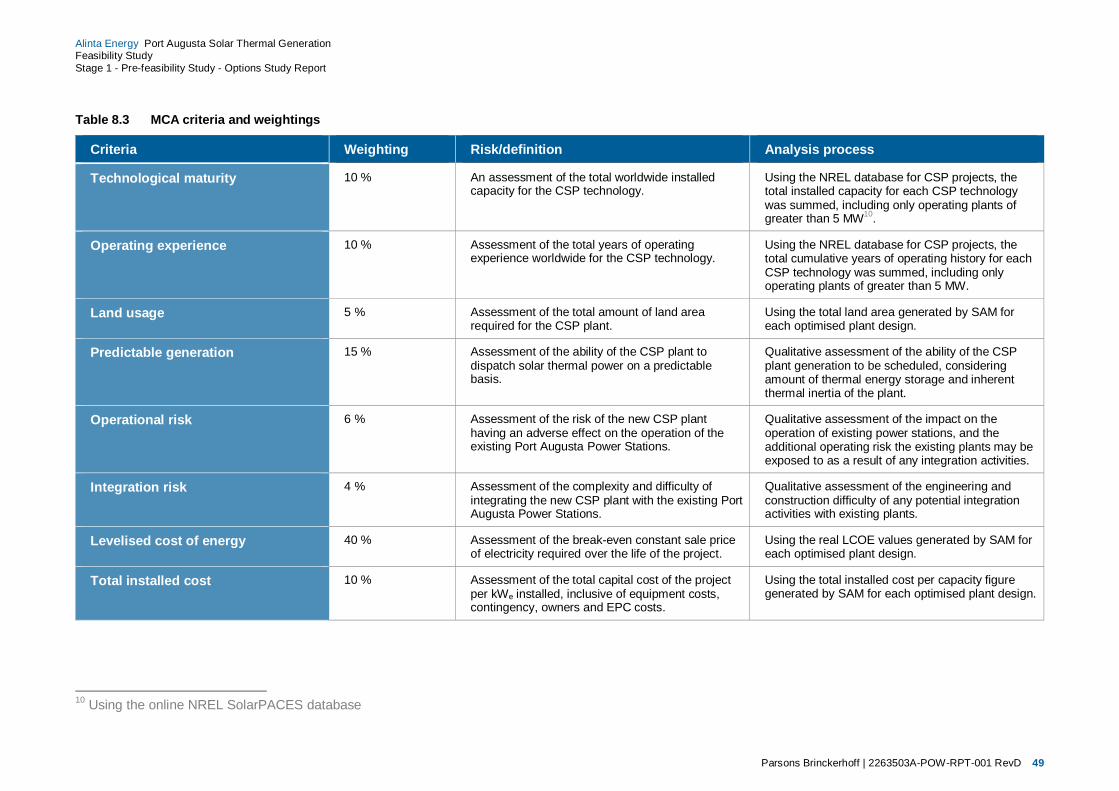
Parsons Brinckerhoff | 2263503A-POW-RPT-001 RevD 49
Alinta Energy Port Augusta Solar Thermal GenerationFeasibility StudyStage 1 - Pre-feasibility Study - Options Study Report
Table 8.3 MCA criteria and weightings
Criteria Weighting Risk/definition Analysis process
Technological maturity 10 % An assessment of the total worldwide installedcapacity for the CSP technology.
Using the NREL database for CSP projects, thetotal installed capacity for each CSP technologywas summed, including only operating plants ofgreater than 5 MW10.
Operating experience 10 % Assessment of the total years of operatingexperience worldwide for the CSP technology.
Using the NREL database for CSP projects, thetotal cumulative years of operating history for eachCSP technology was summed, including onlyoperating plants of greater than 5 MW.
Land usage 5 % Assessment of the total amount of land arearequired for the CSP plant.
Using the total land area generated by SAM foreach optimised plant design.
Predictable generation 15 % Assessment of the ability of the CSP plant todispatch solar thermal power on a predictablebasis.
Qualitative assessment of the ability of the CSPplant generation to be scheduled, consideringamount of thermal energy storage and inherentthermal inertia of the plant.
Operational risk 6 % Assessment of the risk of the new CSP planthaving an adverse effect on the operation of theexisting Port Augusta Power Stations.
Qualitative assessment of the impact on theoperation of existing power stations, and theadditional operating risk the existing plants may beexposed to as a result of any integration activities.
Integration risk 4 % Assessment of the complexity and difficulty ofintegrating the new CSP plant with the existing PortAugusta Power Stations.
Qualitative assessment of the engineering andconstruction difficulty of any potential integrationactivities with existing plants.
Levelised cost of energy 40 % Assessment of the break-even constant sale priceof electricity required over the life of the project.
Using the real LCOE values generated by SAM foreach optimised plant design.
Total installed cost 10 % Assessment of the total capital cost of the projectper kWe installed, inclusive of equipment costs,contingency, owners and EPC costs.
Using the total installed cost per capacity figuregenerated by SAM for each optimised plant design.
10 Using the online NREL SolarPACES database
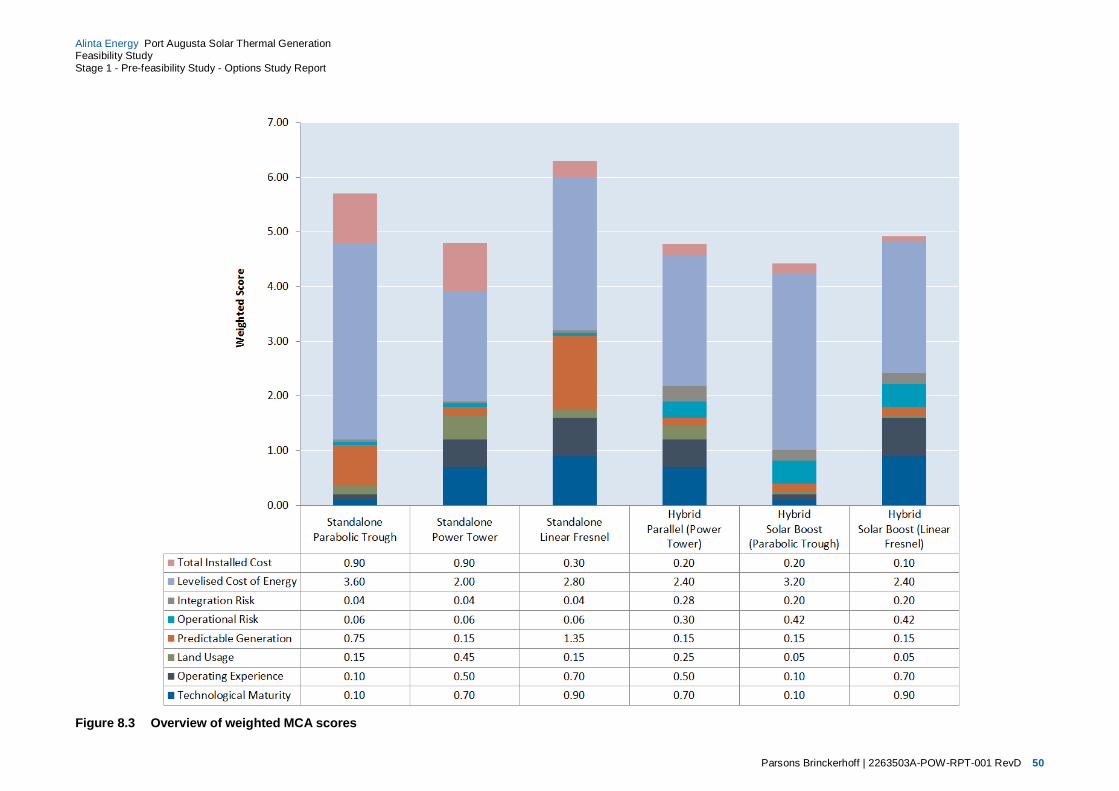
Parsons Brinckerhoff | 2263503A-POW-RPT-001 RevD 50
Alinta Energy Port Augusta Solar Thermal GenerationFeasibility StudyStage 1 - Pre-feasibility Study - Options Study Report
Figure 8.3 Overview of weighted MCA scores

Parsons Brinckerhoff | 2263503A-POW-RPT-001 RevD 51
Alinta Energy Port Augusta Solar Thermal GenerationFeasibility StudyStage 1 - Pre-feasibility Study - Options Study Report
9. ConclusionAlinta Energy is undertaking the Port Augusta Solar Thermal Generation Feasibility Study to assess thepotential for implementation of solar thermal power generation, including hybridised and stand-alone optionsat the Port Augusta Power Stations in South Australia.
This report has conducted a review of available concentrating solar thermal technologies, and found thatthere are three technologies that are technically feasible for a large scale (50 MW) generation plant(parabolic trough, power tower and linear Fresnel). Each of these technologies is capable of generating heatat the temperatures needed for generating electricity in conventional steam turbines. For the parabolic troughand power tower options, thermal energy storage using molten salt is also a technically feasible option toincrease the plant capacity factor.
It was also determined that it would be technically feasible to integrate any of these three technologies intothe existing steam cycle at Northern Power Station. The adjacent Playford B Power Station was notconsidered a suitable candidate for hybridisation, due to its poor efficiency, current condition and uncertainremaining life.
In order to estimate the energy yield from a CSP plant at Port Augusta, a review of the available solarresource data was undertaken. A number of datasets were reviewed, and a publicly available dataset from3TIER was determined to be the most suitable for the purposes of this pre-feasibility study. ParsonsBrinckerhoff understands that Alinta are proceeding with the installation of a ground-based meteorologicalweather station at Port Augusta, which will be used to calibrate satellite-derived data (such as that availablefrom 3TIER) to generate real probability-based datasets for use in the next stage of this study.
Cost estimates were developed for each of the three technologies by scaling complete plant costbreakdowns developed by NREL by appropriate plant sizing parameters (solar field area, power block outputetc.) and applying a set of escalation and localisation factors. The cost estimates for hybrid plants were thendeveloped by reviewing the standalone plant detailed cost breakdowns and making reductions whereexisting plant systems (i.e. steam turbine generator system) were being utilised.
Using the 3TIER solar resource dataset and the plant cost estimates, the three standalone CSP plants andthree hybrid CSP plants were modelled using the System Advisor Model software package. The plantconfigurations in terms of solar field area and amount of thermal energy storage were optimised to providethe lowest Levelised Cost of Electricity over the life of the project. The results of this optimisation process foreach technology are presented in Table 9.1.
Table 9.1 Modelling results
Parameter Units Parabolictrough
Power tower Linear Fresnel
Standalone plants
Solar multiple - 1.75 3.5 1.6
Thermal energy storage hrs 3 15 0
Annual energy production MWh 123,145 282,581 89,248
Capacity factor % 28.4 64.7 20.4
Aperture area m2 405,480 879,094 427,315
Land required ha 147 553 68
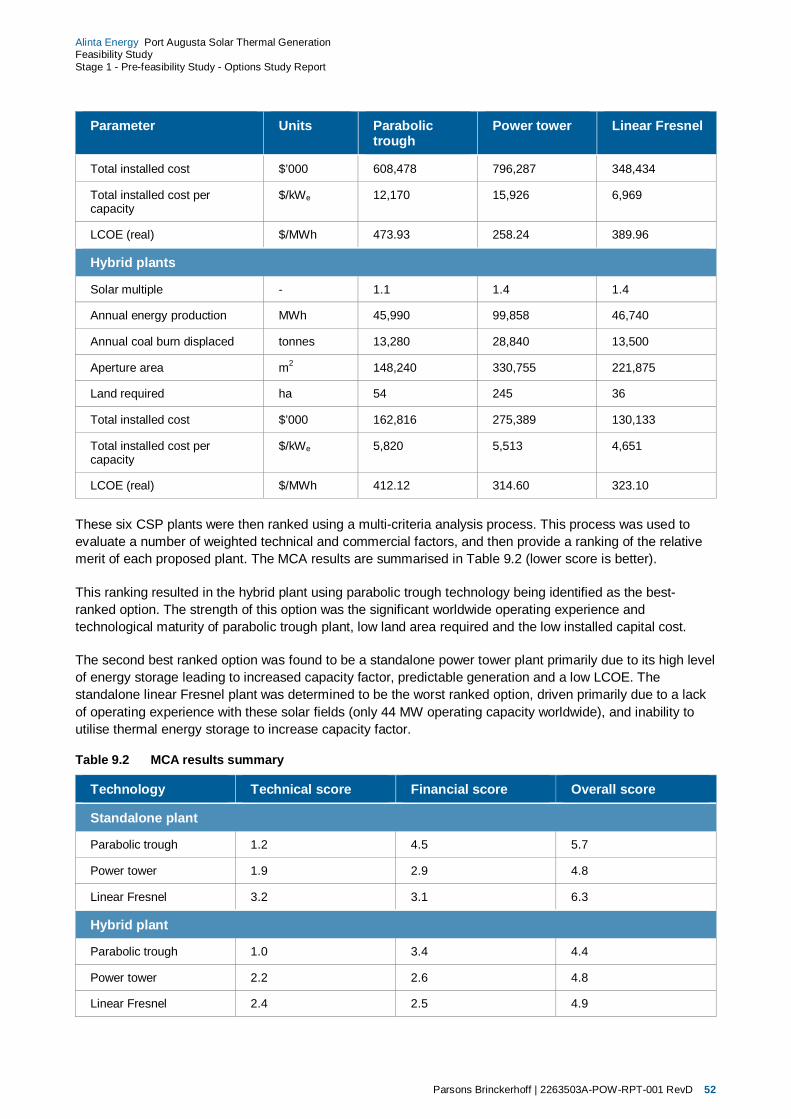
Parsons Brinckerhoff | 2263503A-POW-RPT-001 RevD 52
Alinta Energy Port Augusta Solar Thermal GenerationFeasibility StudyStage 1 - Pre-feasibility Study - Options Study Report
Parameter Units Parabolictrough
Power tower Linear Fresnel
Total installed cost $’000 608,478 796,287 348,434
Total installed cost percapacity
$/kWe 12,170 15,926 6,969
LCOE (real) $/MWh 473.93 258.24 389.96
Hybrid plants
Solar multiple - 1.1 1.4 1.4
Annual energy production MWh 45,990 99,858 46,740
Annual coal burn displaced tonnes 13,280 28,840 13,500
Aperture area m2 148,240 330,755 221,875
Land required ha 54 245 36
Total installed cost $’000 162,816 275,389 130,133
Total installed cost percapacity
$/kWe 5,820 5,513 4,651
LCOE (real) $/MWh 412.12 314.60 323.10
These six CSP plants were then ranked using a multi-criteria analysis process. This process was used toevaluate a number of weighted technical and commercial factors, and then provide a ranking of the relativemerit of each proposed plant. The MCA results are summarised in Table 9.2 (lower score is better).
This ranking resulted in the hybrid plant using parabolic trough technology being identified as the best-ranked option. The strength of this option was the significant worldwide operating experience andtechnological maturity of parabolic trough plant, low land area required and the low installed capital cost.
The second best ranked option was found to be a standalone power tower plant primarily due to its high levelof energy storage leading to increased capacity factor, predictable generation and a low LCOE. Thestandalone linear Fresnel plant was determined to be the worst ranked option, driven primarily due to a lackof operating experience with these solar fields (only 44 MW operating capacity worldwide), and inability toutilise thermal energy storage to increase capacity factor.
Table 9.2 MCA results summary
Technology Technical score Financial score Overall score
Standalone plant
Parabolic trough 1.2 4.5 5.7
Power tower 1.9 2.9 4.8
Linear Fresnel 3.2 3.1 6.3
Hybrid plant
Parabolic trough 1.0 3.4 4.4
Power tower 2.2 2.6 4.8
Linear Fresnel 2.4 2.5 4.9
Parsons Brinckerhoff | 2263503A-POW-RPT-001 RevD 53
Alinta Energy Port Augusta Solar Thermal GenerationFeasibility StudyStage 1 - Pre-feasibility Study - Options Study Report
10. References3TIER, 2010. Analysis of 10-year Record: Port Augusta, South Australia, s.l.: RenewablesSA.
AEMO, 2013. South Australian Historical Market Information Report, s.l.: AEMO.
Alinta Energy, 2013. Port Augusta Solar Thermal Generation Feasibility Study Project Definition Report, s.l.:Alinta Energy.
Energy and Environmental Economics Inc., 2006. A Summary and Comparison of the Time of DeliveryFactors Developed by the California Investor-Owned Utilities for Use in Renewable Portfolio StandardSolicitations, San Francisco, CA: California Energy Commission.
IT Power (Australia) Pty Ltd, 2012. Realising the Potential of Concentrating Solar Power in Australia, s.l.:Australian Solar Institute.
IT Power (Australia) Pty Ltd, 2013. Australian Companion Guide to SAM for Concentration Solar Power, s.l.:Australian Solar Thermal Energy Association (Austela).
NASA, 2013. Surface meteorology and Solar Energy (SSE) Release 6.0 Methodology, Version 3.1.1, s.l.:s.n.
Parsons Brinckerhoff, 2012. Flinders Solar Thermal Concept Study, Brisbane: s.n.
Parsons Brinckerhoff, 2012. Solar Integration Study (Confidential Client), Brisbane: s.n.
Rawlinsons, 2010. Australian Construction Handbook. Perth: Rawlinsons Publishing.
Short, W., Packey, D. J. & Holt, T., 1995. A Manual for the Economic Evaluation of Energy Efficiency andRenewable Energy Technologies, Golden, Colorado: National Renewable Energy Laboratory.
Turchi, C., 2010. Parabolic Trough Reference Plant for Cost Modelling with the Solar Advisor Model (SAM),Golden, Colarado: National Renewable Energy Laboratory.
Turchi, C. S. & Heath, G. A., 2013. Molten Salt Power Tower Cost Model for the System Advisor Model(SAM), Golden, Colarado: National Renewable Energy Laboratory.
Wilcox, S. & Marion, W., 2008. Users Manual for TMY3 Data Sets, s.l.: National Renewable EnergyLaboratory.

Appendix AStandalone plant cost estimates

Parsons Brinckerhoff | 2263503A-POW-RPT-001 RevD A-1
Alinta Energy Port Augusta Solar Thermal GenerationFeasibility StudyStage 1 - Pre-feasibility Study - Options Study Report
A1. Standalone plant costestimates
A1.1 Plant informationTable A–1: Summary of key plant parameters used to scale costs from reference plant costs
Parameter Units Reference plant Project plant
Parabolic trough
Design gross output MWe 110 55
Solar field aperture area m2 854,000 405,480
Land area ha 375 147
Thermal storage capacity MWhth 1,750 437
Annual net energygeneration
MWh 361,000 123,145
Power tower
Design gross output MWe 115 57
Solar field aperture area m2 1,289,000 879,094
Land area ha 412 553
Tower height m 203 166.67
Receiver design thermalpower
MW th 910 464
Receiver area m2 1,571 849
Thermal storage capacity MWhth 2,790 1,988
Annual net energygeneration
MWh 590,000 277,808
Linear Fresnel
Design gross output MWe 110 53.18
Solar field aperture area m2 854,000 427,315
Land area ha 375 68
Annual net energygeneration
MWh 361,000 89,248

Alinta Energy Port Augusta Solar Thermal GenerationFeasibility StudyStage 1 - Pre-feasibility Study - Options Study Report
A1.2 Parabolic trough costs
Totals Rate Units Totals Rate UnitsDirect Capital Cost Summary Site Improvements 23,495,000$ 28$ per m2 19,576,677$ 48$ per m2
Solar Field 251,758,000$ 295$ per m2 188,671,429$ 465$ per m2
HTF System 77,214,000$ 90$ per m2 66,358,206$ 164$ per m2
Thermal Energy Storage 142,470,000$ 81$ per kWhth 60,932,013$ 139$ per kWhth
Power Plant 104,045,000$ 946$ per kWe 94,416,146$ 1,717$ per kWe
Contingency 59,898,000$ 10% 85,990,894$ 20%
Total Direct Costs 658,880,000$ 515,945,364$
Indirect Capital Cost SummaryEPC Costs 97,514,000$ 14.80% of direct costs 78,498,856$ 15.20% of direct costs
Project, Land, Misc. 16,589,000$ 2.52% of direct costs 14,350,599$ 2.80% of direct costs
Total Installed Cost 772,983,000$ 608,794,820$
O&M SummaryFixed Annual Cost -$ -$
Fixed Cost by Capacity 69$ per kW-yr 97$ per kW-yr
Variable Cost by Generation 2.37$ per MWh 3.47$ per MWh
Estimated O&M labor force 47 33
Reference plant Project plantCost component
Parsons Brinckerhoff | 2263503A-POW-RPT-001 RevD A-2
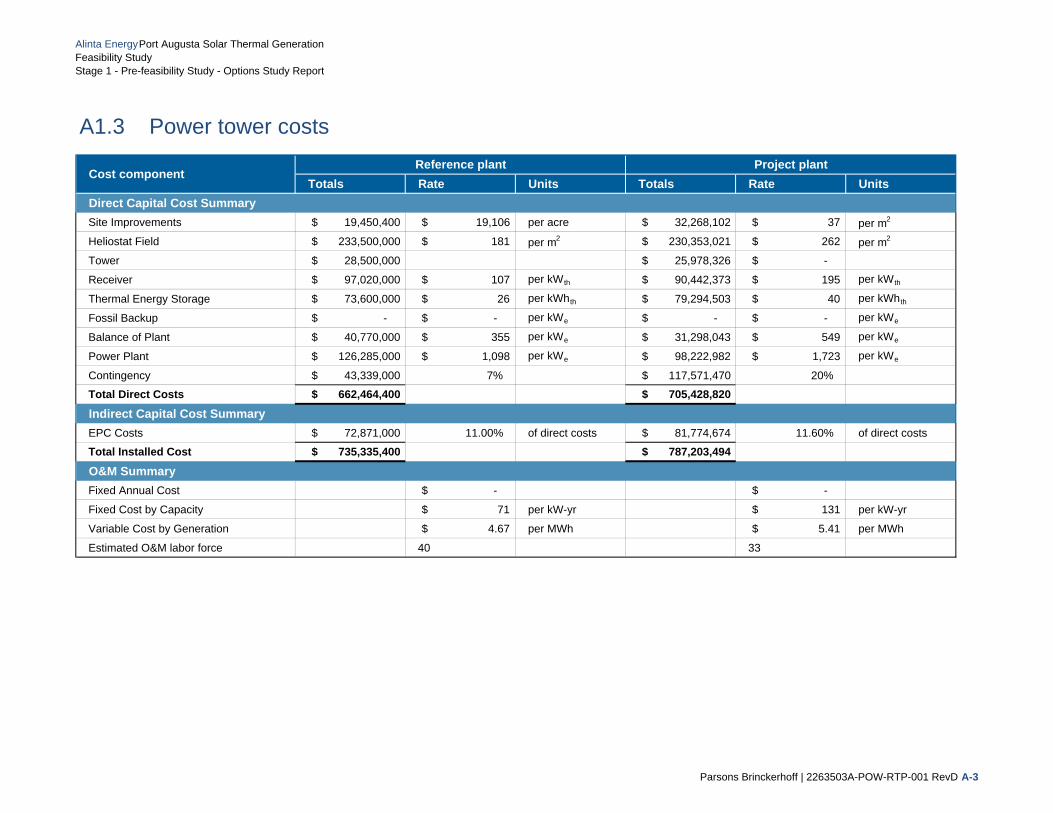
Alinta Energy Port Augusta Solar Thermal GenerationFeasibility Study Stage 1 - Pre-feasibility Study - Options Study Report
A1.3 Power tower costs
Totals Rate Units Totals Rate UnitsDirect Capital Cost Summary Site Improvements 19,450,400$ 19,106$ per acre 32,268,102$ 37$ per m2
Heliostat Field 233,500,000$ 181$ per m2 230,353,021$ 262$ per m2
Tower 28,500,000$ 25,978,326$ -$
Receiver 97,020,000$ 107$ per kWth 90,442,373$ 195$ per kWth
Thermal Energy Storage 73,600,000$ 26$ per kWhth 79,294,503$ 40$ per kWhth
Fossil Backup -$ -$ per kWe -$ -$ per kWe
Balance of Plant 40,770,000$ 355$ per kWe 31,298,043$ 549$ per kWe
Power Plant 126,285,000$ 1,098$ per kWe 98,222,982$ 1,723$ per kWe
Contingency 43,339,000$ 7% 117,571,470$ 20%
Total Direct Costs 662,464,400$ 705,428,820$
Indirect Capital Cost SummaryEPC Costs 72,871,000$ 11.00% of direct costs 81,774,674$ 11.60% of direct costs
Total Installed Cost 735,335,400$ 787,203,494$
O&M SummaryFixed Annual Cost -$ -$
Fixed Cost by Capacity 71$ per kW-yr 131$ per kW-yr
Variable Cost by Generation 4.67$ per MWh 5.41$ per MWh
Estimated O&M labor force 40 33
Cost componentReference plant Project plant
Parsons Brinckerhoff | 2263503A-POW-RTP-001 RevD A-3
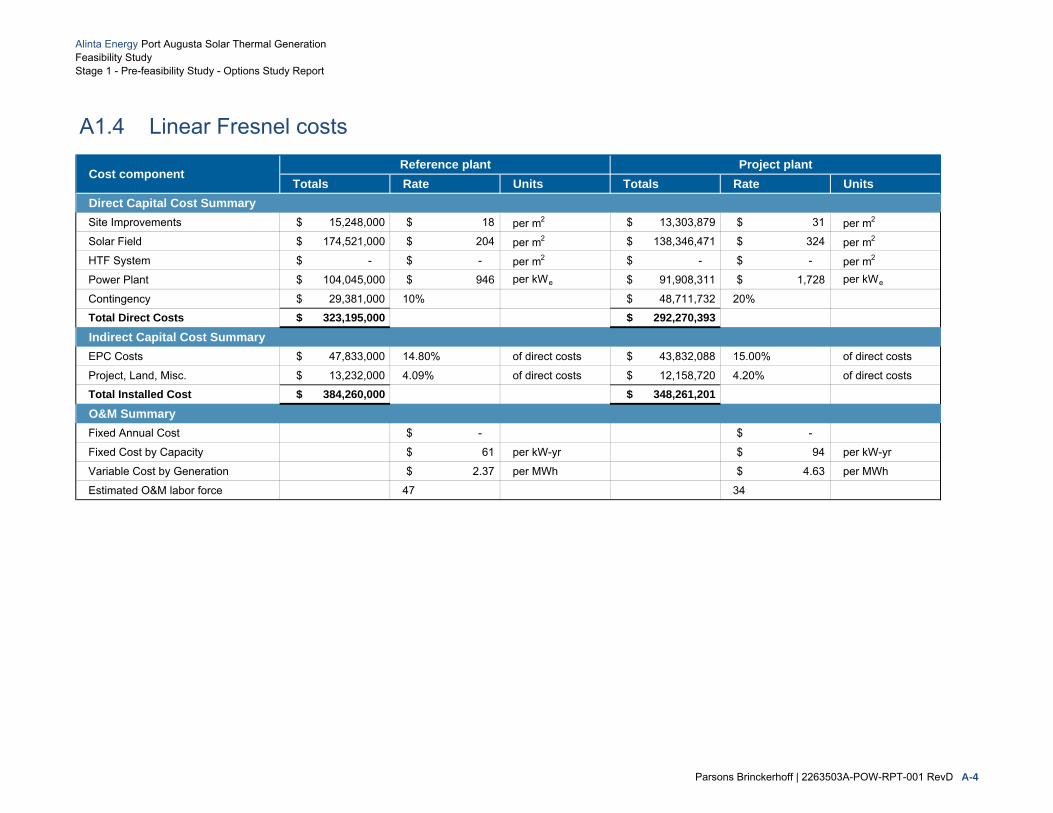
Alinta Energy Port Augusta Solar Thermal GenerationFeasibility StudyStage 1 - Pre-feasibility Study - Options Study Report
A1.4 Linear Fresnel costs
Totals Rate Units Totals Rate UnitsDirect Capital Cost Summary Site Improvements 15,248,000$ 18$ per m2 13,303,879$ 31$ per m2
Solar Field 174,521,000$ 204$ per m2 138,346,471$ 324$ per m2
HTF System -$ -$ per m2 -$ -$ per m2
Power Plant 104,045,000$ 946$ per kWe 91,908,311$ 1,728$ per kWe
Contingency 29,381,000$ 10% 48,711,732$ 20%
Total Direct Costs 323,195,000$ 292,270,393$
Indirect Capital Cost SummaryEPC Costs 47,833,000$ 14.80% of direct costs 43,832,088$ 15.00% of direct costs
Project, Land, Misc. 13,232,000$ 4.09% of direct costs 12,158,720$ 4.20% of direct costs
Total Installed Cost 384,260,000$ 348,261,201$
O&M SummaryFixed Annual Cost -$ -$
Fixed Cost by Capacity 61$ per kW-yr 94$ per kW-yr
Variable Cost by Generation 2.37$ per MWh 4.63$ per MWh
Estimated O&M labor force 47 34
Reference plant Project plantCost component
Parsons Brinckerhoff | 2263503A-POW-RPT-001 RevD A-4
Appendix BHybrid plant cost estimates

Parsons Brinckerhoff | 2263503A-POW-RPT-001 RevD B-1
Alinta Energy Port Augusta Solar Thermal GenerationFeasibility StudyStage 1 - Pre-feasibility Study - Options Study Report
B1. Hybrid plant cost estimatesB1.1 Plant informationTable B–1: Summary of key plant parameters used to scale costs from reference plant costs
Parameter Units Reference plant Project plant
Parabolic trough
Design gross output MWe 110 29.45
Solar field aperture area m2 854,000 148,240
Land area ha 375 46
Thermal storage capacity MWhth 1,750 0
Annual net energygeneration
MWh 361,000 45,990
Power tower
Design gross output MWe 115 55.5
Solar field aperture area m2 1,289,000 330,755
Land area ha 412 245
Tower height m 203 100
Receiver design thermalpower
MW th 910 170
Receiver area m2 1,571 287
Thermal storage capacity MWhth 2,790 0
Annual net energygeneration
MWh 590,000 99,858
Linear Fresnel
Design gross output MWe 110 29.45
Solar field aperture area m2 854,000 221,875
Land area ha 375 36
Annual net energygeneration
MWh 361,000 46,740
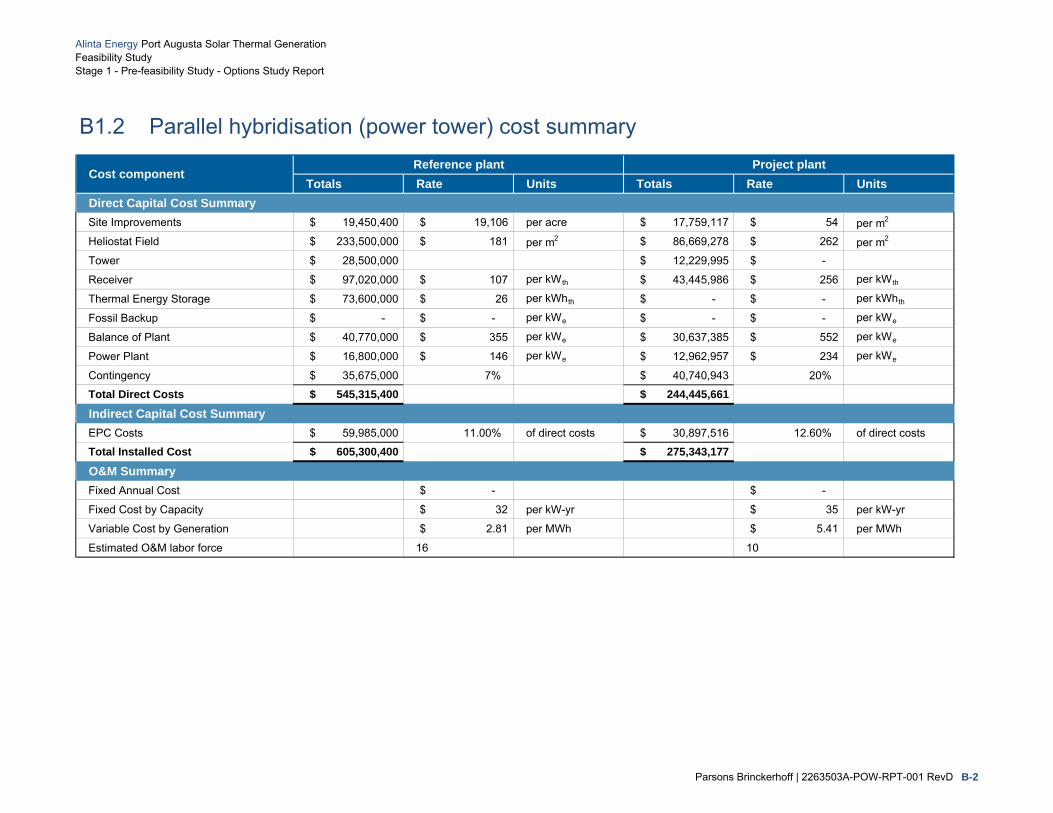
Alinta Energy Port Augusta Solar Thermal GenerationFeasibility StudyStage 1 - Pre-feasibility Study - Options Study Report
B1.2 Parallel hybridisation (power tower) cost summary
Totals Rate Units Totals Rate UnitsDirect Capital Cost Summary Site Improvements 19,450,400$ 19,106$ per acre 17,759,117$ 54$ per m2
Heliostat Field 233,500,000$ 181$ per m2 86,669,278$ 262$ per m2
Tower 28,500,000$ 12,229,995$ -$
Receiver 97,020,000$ 107$ per kWth 43,445,986$ 256$ per kWth
Thermal Energy Storage 73,600,000$ 26$ per kWhth -$ -$ per kWhth
Fossil Backup -$ -$ per kWe -$ -$ per kWe
Balance of Plant 40,770,000$ 355$ per kWe 30,637,385$ 552$ per kWe
Power Plant 16,800,000$ 146$ per kWe 12,962,957$ 234$ per kWe
Contingency 35,675,000$ 7% 40,740,943$ 20%
Total Direct Costs 545,315,400$ 244,445,661$
Indirect Capital Cost SummaryEPC Costs 59,985,000$ 11.00% of direct costs 30,897,516$ 12.60% of direct costs
Total Installed Cost 605,300,400$ 275,343,177$
O&M SummaryFixed Annual Cost -$ -$
Fixed Cost by Capacity 32$ per kW-yr 35$ per kW-yr
Variable Cost by Generation 2.81$ per MWh 5.41$ per MWh
Estimated O&M labor force 16 10
Cost componentReference plant Project plant
Parsons Brinckerhoff | 2263503A-POW-RPT-001 RevD B-2
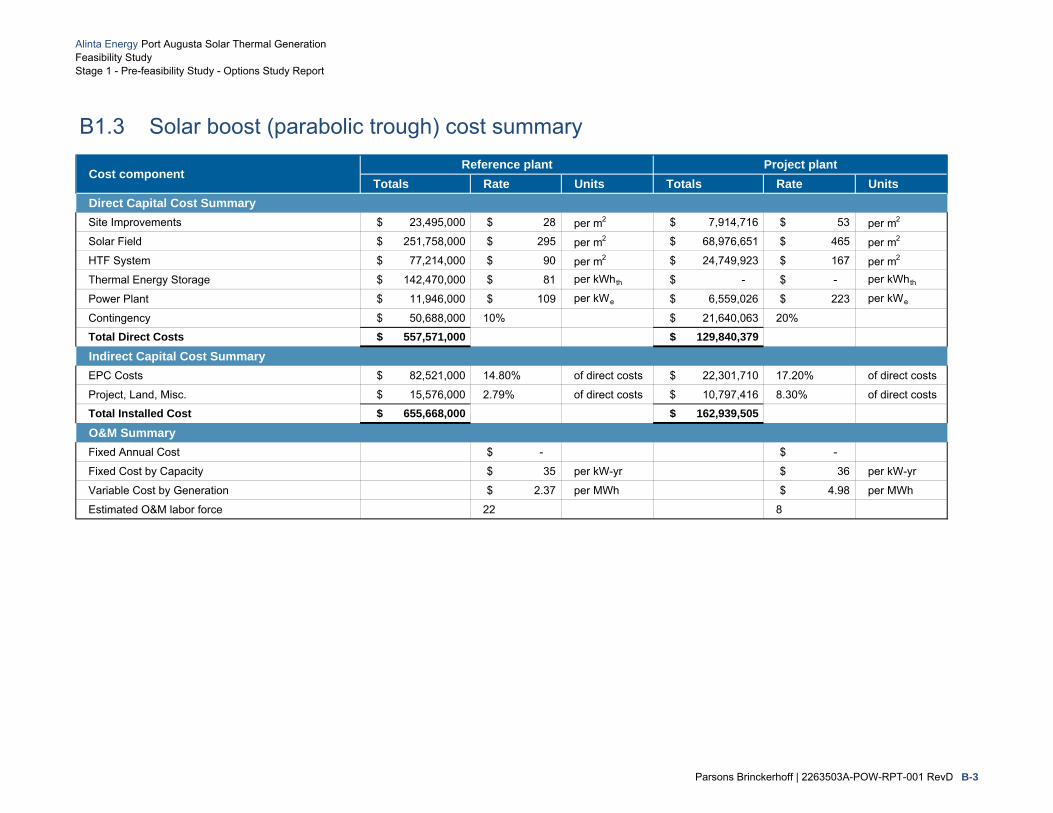
Alinta Energy Port Augusta Solar Thermal GenerationFeasibility StudyStage 1 - Pre-feasibility Study - Options Study Report
B1.3 Solar boost (parabolic trough) cost summary
Totals Rate Units Totals Rate UnitsDirect Capital Cost Summary Site Improvements 23,495,000$ 28$ per m2 7,914,716$ 53$ per m2
Solar Field 251,758,000$ 295$ per m2 68,976,651$ 465$ per m2
HTF System 77,214,000$ 90$ per m2 24,749,923$ 167$ per m2
Thermal Energy Storage 142,470,000$ 81$ per kWhth -$ -$ per kWhth
Power Plant 11,946,000$ 109$ per kWe 6,559,026$ 223$ per kWe
Contingency 50,688,000$ 10% 21,640,063$ 20%
Total Direct Costs 557,571,000$ 129,840,379$
Indirect Capital Cost SummaryEPC Costs 82,521,000$ 14.80% of direct costs 22,301,710$ 17.20% of direct costs
Project, Land, Misc. 15,576,000$ 2.79% of direct costs 10,797,416$ 8.30% of direct costs
Total Installed Cost 655,668,000$ 162,939,505$
O&M SummaryFixed Annual Cost -$ -$
Fixed Cost by Capacity 35$ per kW-yr 36$ per kW-yr
Variable Cost by Generation 2.37$ per MWh 4.98$ per MWh
Estimated O&M labor force 22 8
Reference plant Project plantCost component
Parsons Brinckerhoff | 2263503A-POW-RPT-001 RevD B-3
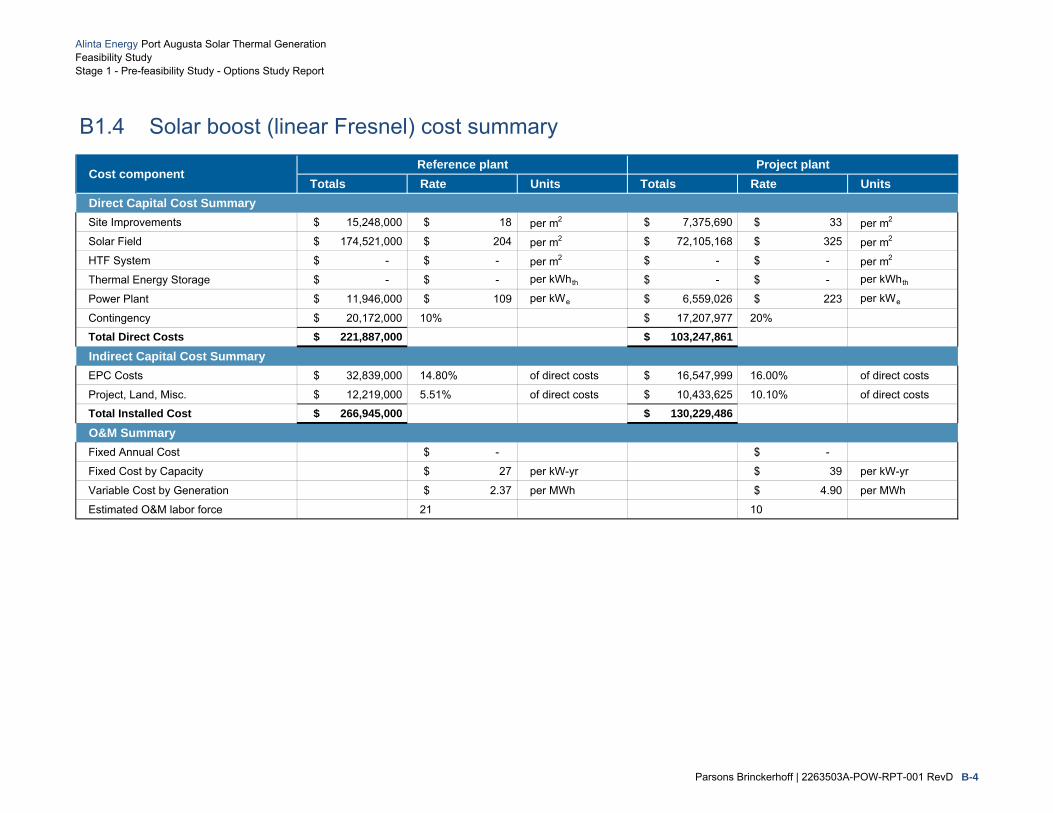
Alinta Energy Port Augusta Solar Thermal GenerationFeasibility StudyStage 1 - Pre-feasibility Study - Options Study Report
B1.4 Solar boost (linear Fresnel) cost summary
Totals Rate Units Totals Rate UnitsDirect Capital Cost Summary Site Improvements 15,248,000$ 18$ per m2 7,375,690$ 33$ per m2
Solar Field 174,521,000$ 204$ per m2 72,105,168$ 325$ per m2
HTF System -$ -$ per m2 -$ -$ per m2
Thermal Energy Storage -$ -$ per kWhth -$ -$ per kWhth
Power Plant 11,946,000$ 109$ per kWe 6,559,026$ 223$ per kWe
Contingency 20,172,000$ 10% 17,207,977$ 20%
Total Direct Costs 221,887,000$ 103,247,861$
Indirect Capital Cost SummaryEPC Costs 32,839,000$ 14.80% of direct costs 16,547,999$ 16.00% of direct costs
Project, Land, Misc. 12,219,000$ 5.51% of direct costs 10,433,625$ 10.10% of direct costs
Total Installed Cost 266,945,000$ 130,229,486$
O&M SummaryFixed Annual Cost -$ -$
Fixed Cost by Capacity 27$ per kW-yr 39$ per kW-yr
Variable Cost by Generation 2.37$ per MWh 4.90$ per MWh
Estimated O&M labor force 21 10
Reference plant Project plantCost component
Parsons Brinckerhoff | 2263503A-POW-RPT-001 RevD B-4

Appendix CMulti-criteria analysis worksheets
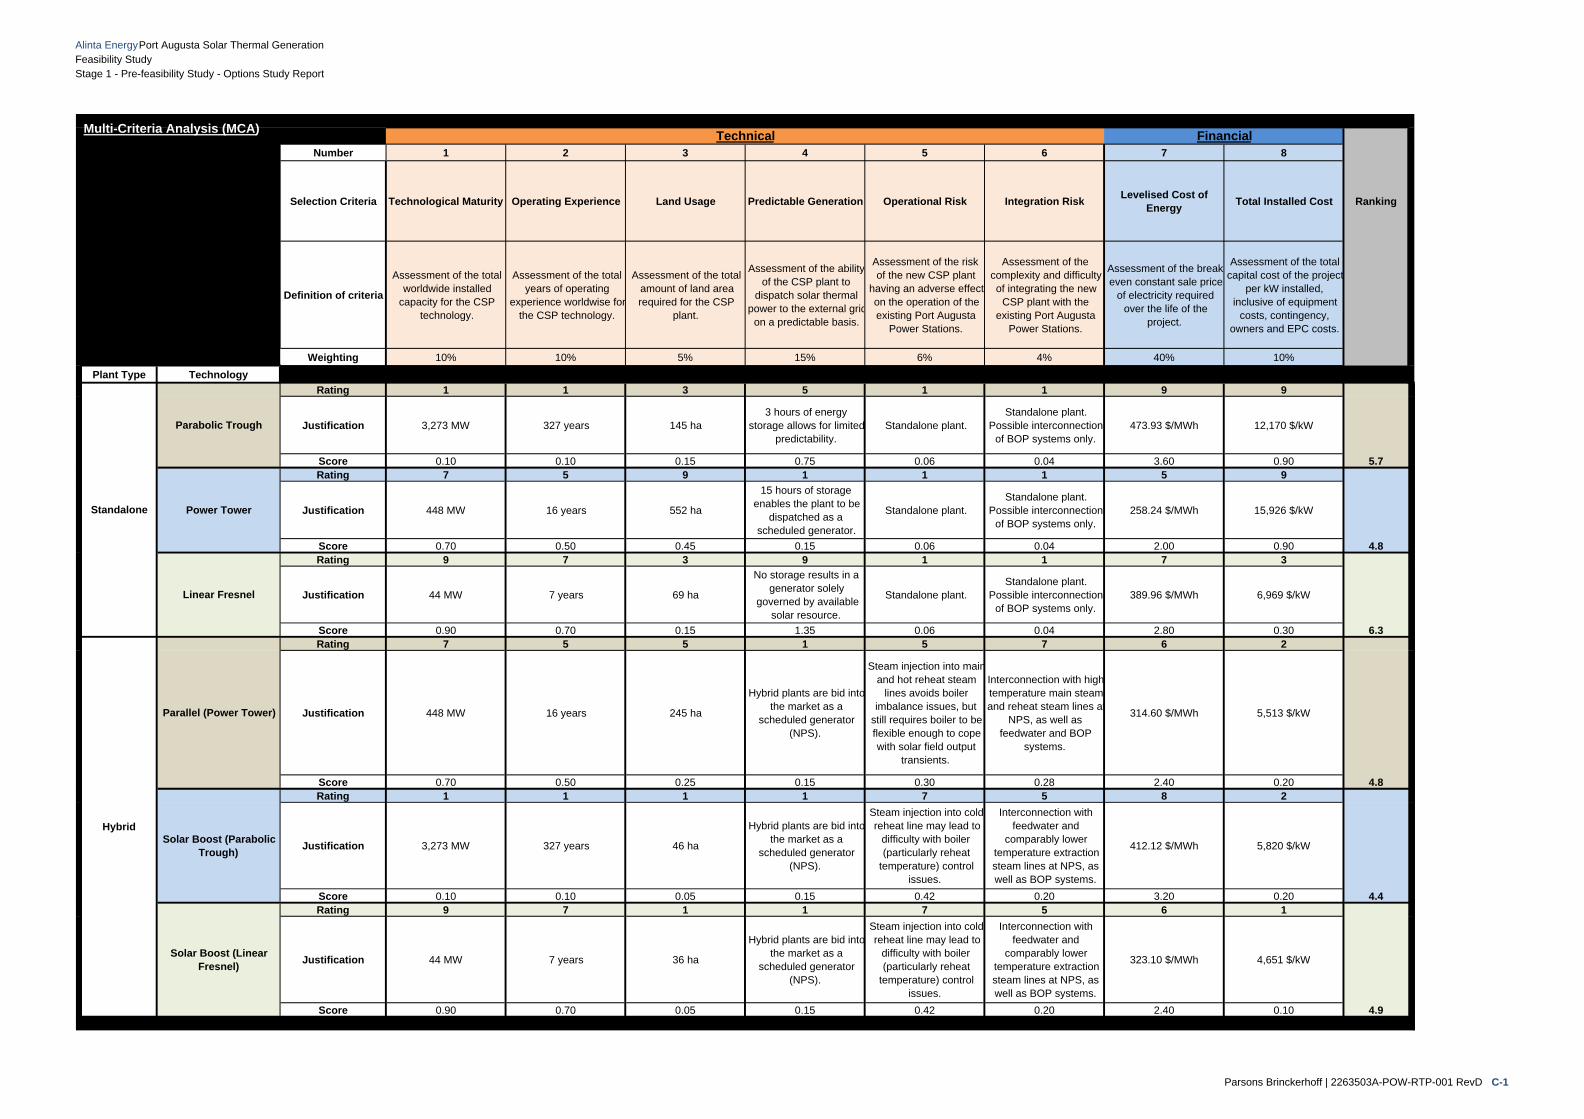
Alinta Energy Port Augusta Solar Thermal GenerationFeasibility Study Stage 1 - Pre-feasibility Study - Options Study Report
Number 1 2 3 4 5 6 7 8
Selection Criteria Technological Maturity Operating Experience Land Usage Predictable Generation Operational Risk Integration Risk Levelised Cost of Energy Total Installed Cost Ranking
Definition of criteria
Assessment of the total worldwide installed
capacity for the CSP technology.
Assessment of the total years of operating
experience worldwise for the CSP technology.
Assessment of the total amount of land area required for the CSP
plant.
Assessment of the abilityof the CSP plant to
dispatch solar thermal power to the external grid
on a predictable basis.
Assessment of the risk of the new CSP plant
having an adverse effect on the operation of the existing Port Augusta
Power Stations.
Assessment of the complexity and difficulty of integrating the new
CSP plant with the existing Port Augusta
Power Stations.
Assessment of the breakeven constant sale price
of electricity required over the life of the
project.
Assessment of the total capital cost of the project
per kW installed, inclusive of equipment
costs, contingency, owners and EPC costs.
Weighting 10% 10% 5% 15% 6% 4% 40% 10%Plant Type Technology
Rating 1 1 3 5 1 1 9 9
Justification 3,273 MW 327 years 145 ha3 hours of energy
storage allows for limited predictability.
Standalone plant.Standalone plant.
Possible interconnection of BOP systems only.
473.93 $/MWh 12,170 $/kW
Score 0.10 0.10 0.15 0.75 0.06 0.04 3.60 0.90 5.7Rating 7 5 9 1 1 1 5 9
Justification 448 MW 16 years 552 ha
15 hours of storage enables the plant to be
dispatched as a scheduled generator.
Standalone plant.Standalone plant.
Possible interconnection of BOP systems only.
258.24 $/MWh 15,926 $/kW
Score 0.70 0.50 0.45 0.15 0.06 0.04 2.00 0.90 4.8Rating 9 7 3 9 1 1 7 3
Justification 44 MW 7 years 69 ha
No storage results in a generator solely
governed by available solar resource.
Standalone plant.Standalone plant.
Possible interconnection of BOP systems only.
389.96 $/MWh 6,969 $/kW
Score 0.90 0.70 0.15 1.35 0.06 0.04 2.80 0.30 6.3Rating 7 5 5 1 5 7 6 2
Justification 448 MW 16 years 245 ha
Hybrid plants are bid into the market as a
scheduled generator (NPS).
Steam injection into mainand hot reheat steam
lines avoids boiler imbalance issues, but
still requires boiler to be flexible enough to cope with solar field output
transients.
Interconnection with high temperature main steam and reheat steam lines at
NPS, as well as feedwater and BOP
systems.
314.60 $/MWh 5,513 $/kW
Score 0.70 0.50 0.25 0.15 0.30 0.28 2.40 0.20 4.8Rating 1 1 1 1 7 5 8 2
Justification 3,273 MW 327 years 46 ha
Hybrid plants are bid into the market as a
scheduled generator (NPS).
Steam injection into cold reheat line may lead to
difficulty with boiler (particularly reheat
temperature) control issues.
Interconnection with feedwater and
comparably lower temperature extraction steam lines at NPS, as well as BOP systems.
412.12 $/MWh 5,820 $/kW
Score 0.10 0.10 0.05 0.15 0.42 0.20 3.20 0.20 4.4Rating 9 7 1 1 7 5 6 1
Justification 44 MW 7 years 36 ha
Hybrid plants are bid into the market as a
scheduled generator (NPS).
Steam injection into cold reheat line may lead to
difficulty with boiler (particularly reheat
temperature) control issues.
Interconnection with feedwater and
comparably lower temperature extraction steam lines at NPS, as well as BOP systems.
323.10 $/MWh 4,651 $/kW
Score 0.90 0.70 0.05 0.15 0.42 0.20 2.40 0.10 4.9
Financial
Standalone
Parabolic Trough
Power Tower
Linear Fresnel
Multi-Criteria Analysis (MCA)
Hybrid
Parallel (Power Tower)
Solar Boost (Parabolic Trough)
Solar Boost (Linear Fresnel)
Technical
Parsons Brinckerhoff | 2263503A-POW-RTP-001 RevD C-1
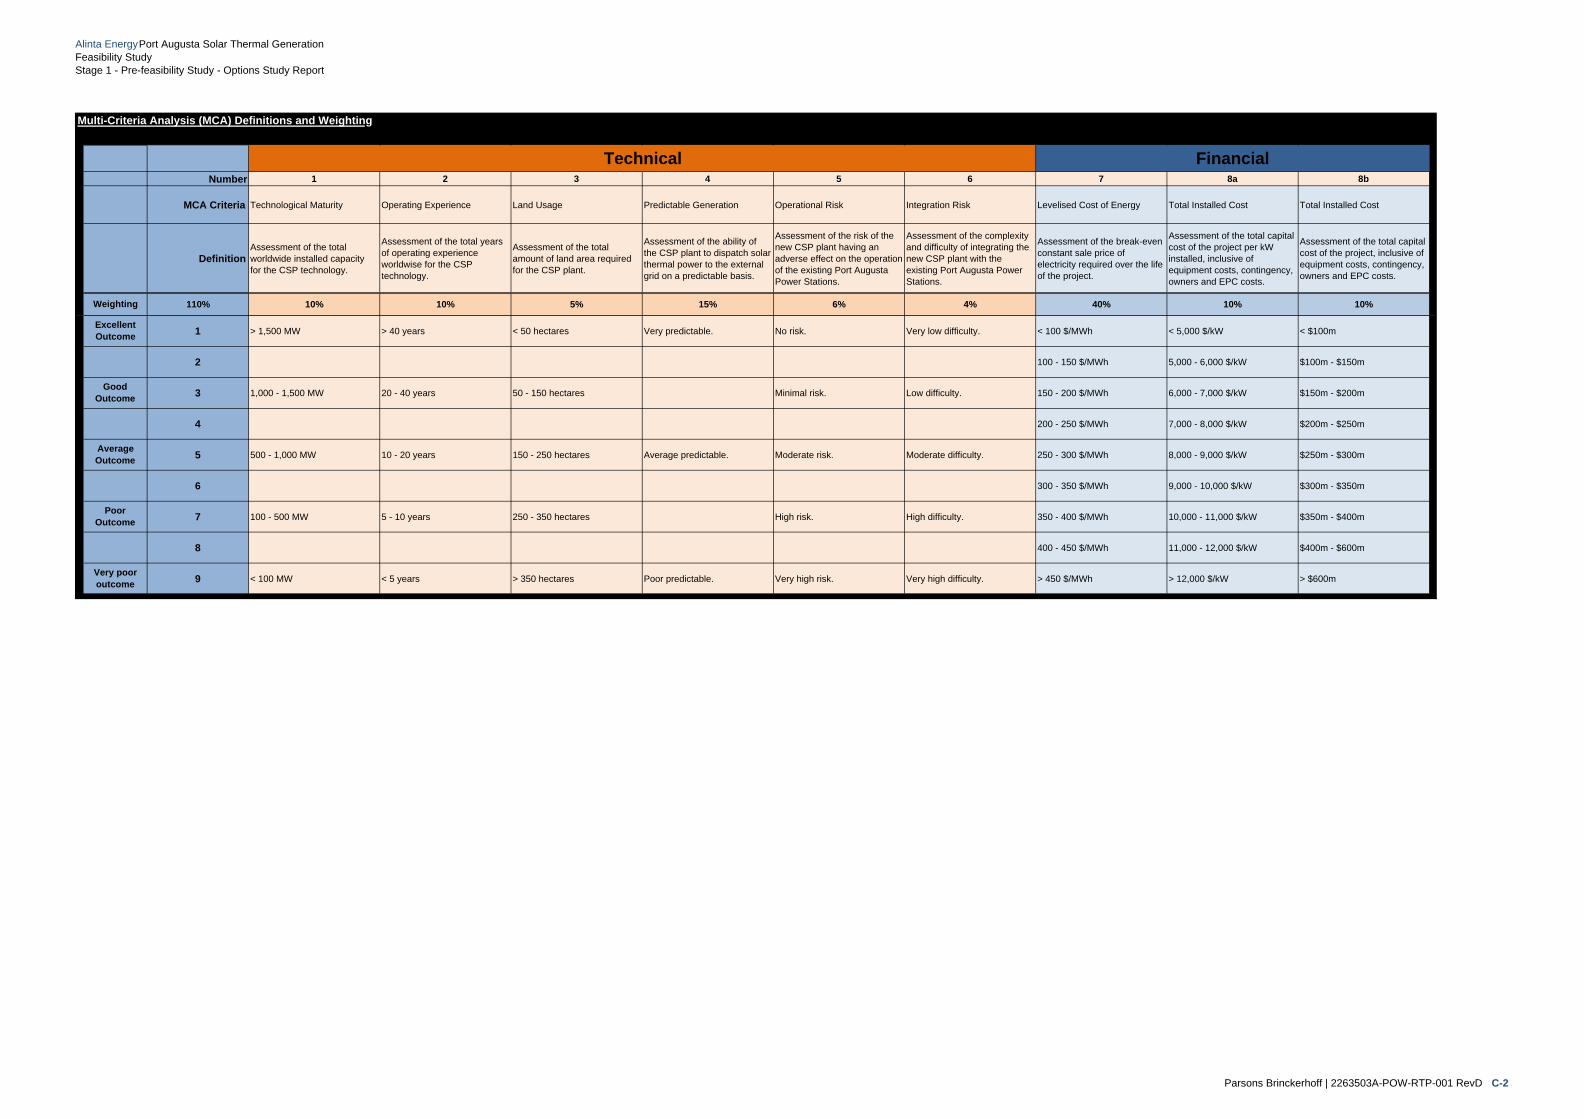
Alinta Energy Port Augusta Solar Thermal GenerationFeasibility Study Stage 1 - Pre-feasibility Study - Options Study Report
Multi-Criteria Analysis (MCA) Definitions and Weighting
Number 1 2 3 4 5 6 7 8a 8b
MCA Criteria Technological Maturity Operating Experience Land Usage Predictable Generation Operational Risk Integration Risk Levelised Cost of Energy Total Installed Cost Total Installed Cost
Definition Assessment of the total worldwide installed capacity for the CSP technology.
Assessment of the total years of operating experience worldwise for the CSP technology.
Assessment of the total amount of land area required for the CSP plant.
Assessment of the ability of the CSP plant to dispatch solar thermal power to the external grid on a predictable basis.
Assessment of the risk of the new CSP plant having an adverse effect on the operation of the existing Port Augusta Power Stations.
Assessment of the complexity and difficulty of integrating the new CSP plant with the existing Port Augusta Power Stations.
Assessment of the break-even constant sale price of electricity required over the life of the project.
Assessment of the total capital cost of the project per kW installed, inclusive of equipment costs, contingency, owners and EPC costs.
Assessment of the total capital cost of the project, inclusive of equipment costs, contingency, owners and EPC costs.
110% 10% 10% 5% 15% 6% 4% 40% 10% 10%
1 > 1,500 MW > 40 years < 50 hectares Very predictable. No risk. Very low difficulty. < 100 $/MWh < 5,000 $/kW < $100m
2 100 - 150 $/MWh 5,000 - 6,000 $/kW $100m - $150m
3 1,000 - 1,500 MW 20 - 40 years 50 - 150 hectares Minimal risk. Low difficulty. 150 - 200 $/MWh 6,000 - 7,000 $/kW $150m - $200m
4 200 - 250 $/MWh 7,000 - 8,000 $/kW $200m - $250m
5 500 - 1,000 MW 10 - 20 years 150 - 250 hectares Average predictable. Moderate risk. Moderate difficulty. 250 - 300 $/MWh 8,000 - 9,000 $/kW $250m - $300m
6 300 - 350 $/MWh 9,000 - 10,000 $/kW $300m - $350m
7 100 - 500 MW 5 - 10 years 250 - 350 hectares High risk. High difficulty. 350 - 400 $/MWh 10,000 - 11,000 $/kW $350m - $400m
8 400 - 450 $/MWh 11,000 - 12,000 $/kW $400m - $600m
9 < 100 MW < 5 years > 350 hectares Poor predictable. Very high risk. Very high difficulty. > 450 $/MWh > 12,000 $/kW > $600mVery poor outcome
Technical Financial
Excellent Outcome
Good Outcome
Average Outcome
Poor Outcome
Weighting
Parsons Brinckerhoff | 2263503A-POW-RTP-001 RevD C-2

Appendix DList of operating CSP plants

Alinta Energy Port Augusta Solar Thermal GenerationFeasibility StudyStage 1 - Pre-feasibility Study - Options Study Report
D1. List of operational CSP plantsName Country Location Owner Technology Capacity
(Net)Capacity (Gross) Start Year
ACME Solar Tower India Bikaner (Rajasthan) ACME Group Power Tower 2.5 2.5 2011
Andasol-1 Spain Aldiere (Granada) ACS/Cobra Group Parabolic Trough 49.9 50 2008
Andasol-2 Spain Aldeire y La Calahorre (Granada) ACS/Cobra Group Parabolic Trough 49.9 50 2009
Andasol-3 Spain Aldeire (Granada) Ferrostall/Solar Millennium/RWE/Rhein E./SWM Parabolic Trough 50 50 2011
Archimede Italy Priolo Gargallo ENEL Parabolic Trough 4.72 5 2010
Arcosol 50 Spain San José del Valle (Cádiz) Torresol Parabolic Trough 49.9 49.9 2011
Arenales Spain Morón de la Frontera (Sevilla) RREF/OHL Parabolic Trough 50 50 2013
Aste 1A Spain Alcázar de San Juan (Ciudad Real) Elecnor/Aries/ABM AMRO Parabolic Trough 50 50 2012
Aste 1B Spain Alcázar de San Juan (Ciudad Real) Elecnor/Aries/ABM AMRO Parabolic Trough 50 50 2012
Astexol II Spain Olivenza (Badajoz) Elecnor/Aries/ABM AMRO Parabolic Trough 50 50 2012
Augustin Fresnel 1 France Targassonne (Pyreneans) Solar Euromed Linear Fresnel Reflector 0.25 0.25 2012
Borges Termosolar Spain Les Borges Blanques (Lleida) Abantia/Comsa EMTE Parabolic Trough 22.5 25 2012
Casablanca Spain Talarrubias (Badajoz) ACS/Cobra Group Parabolic Trough 50 50 2013
Dehan Power Plant China Beijing Institute of Electrical Engineering of Chinese Academy of Sciences Power Tower 1 1 2012
Enerstar (Villena) Spain Villena (Alicante) FCC Energy Parabolic Trough 50 50 2013
Extresol-1 Spain Torre de Miguel Sesmero (Badajoz) ACS/Cobra Group Parabolic Trough 50 50 2010
Extresol-2 Spain Torre de Miguel Sesmero (Badajoz) ACS/Cobra Group Parabolic Trough 49.9 49.9 2010
Extresol-3 Spain Torre de Miguel Sesmero (Badajoz) ACS/Cobra Group Parabolic Trough 50 50 2012
Gemasolar Spain Fuentes de Andalucía (Andalucía (Sevilla)) MASDAR/Sener Power Tower 19.9 19.9 2011
Godawari Solar Project India Nokh (Rajhastan) Godawari Green Energy Ltd Parabolic Trough 50 50 2013
Guzmán Spain Palma del Río (Córdoba) FCC Energy/Mitsui Parabolic Trough 50 50 2012
Helioenergy 1 Spain Écija (Sevilla) Abengoa Solar/EON Parabolic Trough 50 50 2011
Helioenergy 2 Spain Écija (Sevilla) Abengoa Solar/EON Parabolic Trough 50 50 2012
Helios I Spain Puerto Lápice (Ciudad Real)Caja Castilla La Mancha Coporación, Fundo de Capital de Risco Energias Renováveis-Caixa Capital, HYPERION, Hypesol Energy Holding
Parabolic Trough 50 50 2012
Helios II Spain Puerto Lápice (Ciudad Real)Caja Castilla La Mancha Coporación, Fundo de Capital de Risco Energias Renováveis-Caixa Capital, HYPERION, Hypesol Energy Holding
Parabolic Trough 50 50 2012
Holaniky at Keahole Point United States Keahole Point, Hawaii Keahole Solar Power LLC Parabolic Trough 2 2 2009
Ibersol Ciudad Real (Puertollano) Spain Puertollano (Castilla-La Mancha) IBERCAM/IDAE Parabolic Trough 50 50 2009
ISCC Ain Beni Mathar Morocco Ain Beni Mathar ONE Parabolic Trough 20 20 2010
ISCC Hassi R'mel Algeria Hassi R'mel Sontrach Parabolic Trough 25 25 2011
ISCC Kuraymat Egypt Kuraymat NREA Parabolic Trough 20 20 2011
Ivanpah Solar Electric Generating System United States Primm, NV, California NRG Energy, Brightsource Energy, Google Power Tower 377 392 2013
Parsons Brinckerhoff | 2263503A-POW-RPT-001 RevD D-1

Alinta Energy Port Augusta Solar Thermal GenerationFeasibility StudyStage 1 - Pre-feasibility Study - Options Study Report
Name Country Location Owner Technology Capacity (Net)
Capacity (Gross) Start Year
Jülich Solar Tower Germany Jülich (Rhineland) DLR Power Tower 1.5 1.5 2008
Kimberlina Solar Thermal Power Plant United States Bakersfield, California Ausra Linear Fresnel Reflector 5 5 2008
La Africana Spain Posadas (Córdoba) Ortiz/TSK/Magtel Parabolic Trough 50 50 2012
La Dehesa Spain La Garrovilla (Badajoz) Renovables SAMCA Parabolic Trough 49.9 49.9 2011
La Florida Spain Badajoz (Badajoz) Renovables SAMCA Parabolic Trough 50 50 2010
La Risca Spain Alvarado (Badajoz) Acciona Energía Parabolic Trough 50 50 2009
Lake Cargelligo Australia Lake Cargelligo (New South Wales) Graphite Energy Power Tower 3 3 2011
Lebrija 1 Spain Lebrija (Sevilla) Solel Solar Systems, LTD/Valoriza Energia Parabolic Trough 50 50 2011
Liddell Power Station Australia Liddell (New South Wales) Macquarie Generation Linear Fresnel Reflector 9 9 2012
Majadas I Spain Majadas de Tiétar (Cáceres) Acciona Energía Parabolic Trough 50 50 2010
Manchasol-1 Spain Alcazar de San Juan (Ciduad Real) ACS/Cobra Group Parabolic Trough 49.9 49.9 2011
Manchasol-2 Spain Alcazar de San Juan (Ciduad Real) ACS/Cobra Group Parabolic Trough 50 50 2011
Martin Next Generation Solar Energy Center United States Indiantown, Florida (South Florida) Florida Power & Light Co. Parabolic Trough 75 75 2010
Morón Spain Morón de la Frontera (Seville) Ibereólica Solar Parabolic Trough 50 50 2012
National Solar Thermal Power Facility India Gurgaon IIT Bombay Parabolic Trough 1 1 2012
Nevada Solar One United States Boulder City, Nevada Acciona Energía Parabolic Trough 72 75 2007
Olivenza 1 Spain Olivenza (Badajoz) Ibereólica Solar Parabolic Trough 50 50 2012
Orellana Spain Orellana (Badajoz) Acciona Parabolic Trough 50 50 2012
Palma del Río I Spain Palma del Río (Córdoba) Acciona Energía Parabolic Trough 50 50 2011
Palma del Río II Spain Palma del Río (Córdoba) Acciona Energía Parabolic Trough 50 50 2010
Planta Solar 10 Spain Sevilla (Sanlúca la Mayor) Abengoa Solar Power Tower 11 11.02 2007
Planta Solar 20 Spain Sevilla (Sanlúca la Mayor) Abengoa Solar Power Tower 20 20 2009
Puerto Errado 1 Spain Calasparra (Murcia) Novatec Solar España Linear Fresnel Reflector 1.4 1.4 2009
Puerto Errado 2 Spain Calasparra (Murcia) Elektra Baselland, Industrielle Werke Basel, Novatec Biosol AG
Linear Fresnel Reflector 30 30 2012
Saguaro Power Plant United States Red Rock, Arizona (Southwest USA) Arizona Public Service Parabolic Trough 1 1.16 2006
Shams 1 United Arab Emirates
Madinat Zayed Abengoa Solar, Masdar, Total Parabolic Trough 100 100 2013
Sierra SunTower United States Lancaster, California eSolar Power Tower 5 5 2009
Solaben 1 Spain Logrosán (Cáceres) Abengoa Parabolic Trough 50 50 2013
Solaben 2 Spain Logrosán (Cáceres) Abengoa, ITOCHU Parabolic Trough 50 50 2012
Solaben 3 Spain Logrosán (Cáceres) Abengoa, ITOCHU Parabolic Trough 50 50 2012
Solaben 6 Spain Logrosán (Cáceres) Abengoa Parabolic Trough 50 50 2013
Solacor 1 Spain El Carpio (Córdoba) Abengoa Solar, JGC Parabolic Trough 50 50 2012
Solarcor 2 Spain El Carpio (Córdoba) Abengoa Solar, JGC Parabolic Trough 50 50 2012
Solana Generating Station United States Pheonix, Arizona (Gila Bend) Abengoa Solar Liberty Interactive Corporation Parabolic Trough 250 280 2013
Parsons Brinckerhoff | 2263503A-POW-RPT-001 RevD D-2

Alinta Energy Port Augusta Solar Thermal GenerationFeasibility StudyStage 1 - Pre-feasibility Study - Options Study Report
Name Country Location Owner Technology Capacity (Net)
Capacity (Gross) Start Year
Solar Electric Generating Station I United States Daggett, California (Mojave Desert) Cogentrix Parabolic Trough 13.8 13.8 1984
Solar Electric Generating Station II United States Daggett, California (Mojave Desert) Cogentrix Parabolic Trough 30 33 1985
Solar Electric Generating Station III United States Kramer Junction, California (Mojave Desert) NextEra Parabolic Trough 30 33 1985
Solar Electric Generating Station IV United States Kramer Junction, California (Mojave Desert) NextEra Parabolic Trough 30 33 1989
Solar Electric Generating Station V United States Kramer Junction, California (Mojave Desert) NextEra Parabolic Trough 30 33 1989
Solar Electric Generating Station VI United States Kramer Junction, California (Mojave Desert) NextEra Parabolic Trough 30 35 1989
Solar Electric Generating Station VII United States Kramer Junction, California (Mojave Desert) NextEra Parabolic Trough 30 35 1989
Solar Electric Generating Station VIII United States Harper Dry Lake, California (Mojave Desert) NextEra Parabolic Trough 80 89 1989
Solar Electric Generating Station IX United States Harper Dry Lake, California (Mojave Desert) NextEra Parabolic Trough 80 89 1990
Solnova 1 Spain Sevilla (Sanlúca la Mayor) Abengoa Solar Parabolic Trough 50 50 2009
Solnova 3 Spain Sevilla (Sanlúca la Mayor) Abengoa Solar Parabolic Trough 50 50 2009
Solnova 4 Spain Sevilla (Sanlúca la Mayor) Abengoa Solar Parabolic Trough 50 50 2009
Termesol 50 Spain San José del Valle (Cádiz) Torresol Parabolic Trough 49.9 49.9 2011
Termosol 1 Spain Navalvillar de Pela (Badajoz) NextEra, FPL Parabolic Trough 50 50 2013
Termosol 2 Spain Navalvillar de Pela (Badajoz) NextEra, FPL Parabolic Trough 50 50 2013
Thai Solar Energy 1 Thailand Huai Kachao (Kanchanaburi Province) Thai Solar Energy Co. Ltd. Parabolic Trough 5 5 2012
Parsons Brinckerhoff | 2263503A-POW-RPT-001 RevD D-3

Appendix EStandalone plant sensitivity analysis

Alinta Energy Port Augusta Solar Thermal GenerationFeasibility StudyStage 1 - Pre-feasibility Study - Options Study Report
Parsons Brinckerhoff | 2263503A-POW-RPT-001 RevD E-1
E1.1 Parabolic trough
Figure C1.1 Variation in total installed cost and LCOE with solar multiple for parabolic trough plant
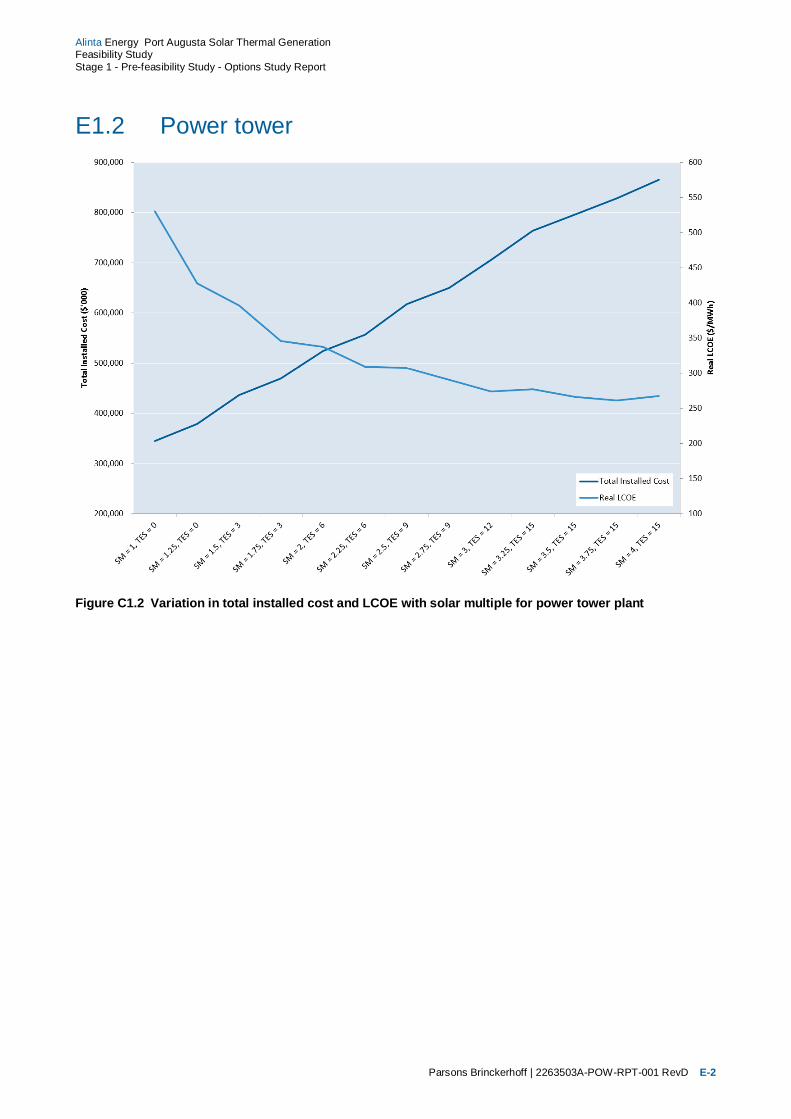
Alinta Energy Port Augusta Solar Thermal GenerationFeasibility StudyStage 1 - Pre-feasibility Study - Options Study Report
Parsons Brinckerhoff | 2263503A-POW-RPT-001 RevD E-2
E1.2 Power tower
Figure C1.2 Variation in total installed cost and LCOE with solar multiple for power tower plant
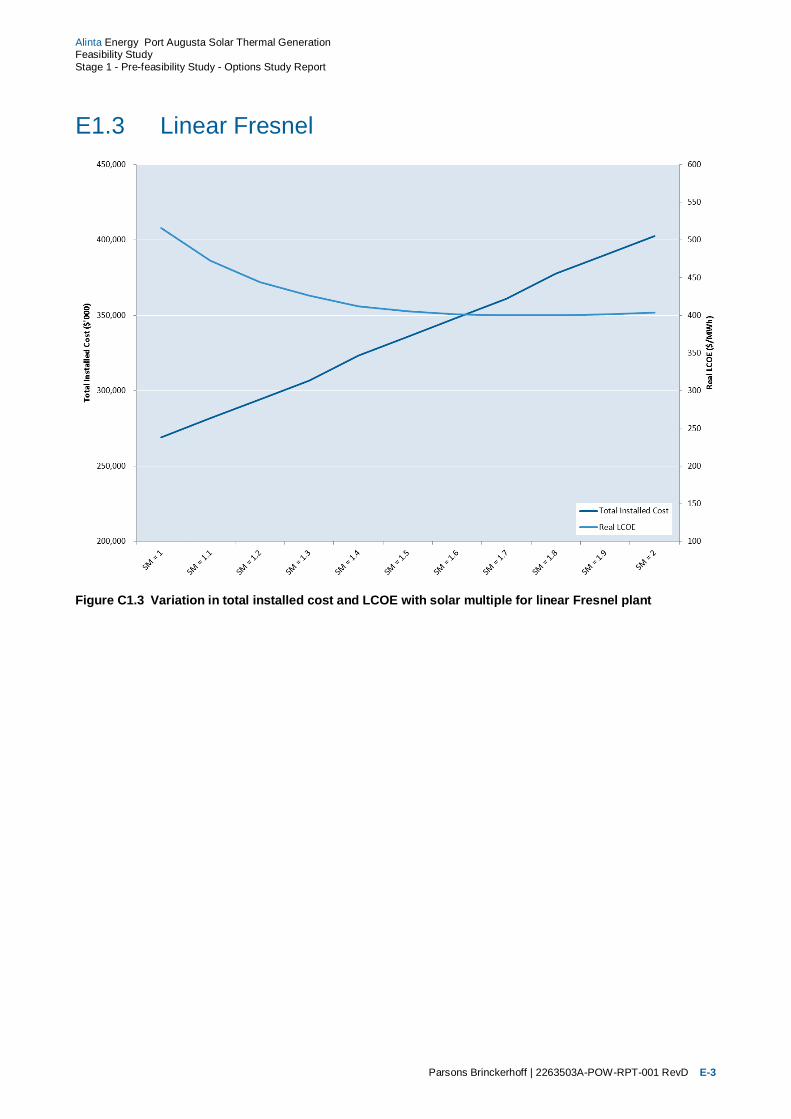
Alinta Energy Port Augusta Solar Thermal GenerationFeasibility StudyStage 1 - Pre-feasibility Study - Options Study Report
Parsons Brinckerhoff | 2263503A-POW-RPT-001 RevD E-3
E1.3 Linear Fresnel
Figure C1.3 Variation in total installed cost and LCOE with solar multiple for linear Fresnel plant

Parsons Brinckerhoff | 2263503A-POW-RPT-001 RevD E-4
Alinta Energy Port Augusta Solar Thermal GenerationFeasibility StudyStage 1 - Pre-feasibility Study - Options Study Report
Figure C1.4 <Caption text>
Related Documents