Characterization of gas transport in low-permeability media: two-phase flow analysis of an in-situ experiment Pierre Gerard 1 , Jean-Pol Radu 2 , Rémi de La Vaissière 3 , Jean Talandier 3 , Robert Charlier 2 and Frédéric Collin 2 1 Université libre de Bruxelles (ULB), Department BATir, Av. F. Roosevelt 50, 1050 Bruxelles, Belgium; email: [email protected] 2 Université de Liège (ULg), Department ArGEnCo, Liège, Belgium; email: [email protected] 3 Agence nationale pour la gestion des déchets radioactifs (ANDRA), Chatenay- Malabry, France. ABSTRACT This paper describes a field-scale experiment on gas transport mechanisms performed at the Andra Underground Research Laboratory in a clay rock. The experimental layout consists of two parallel boreholes that are equipped with multiple packer completions delimiting three intervals each and which monitor continuously the pore pressure evolution of the clay rock. Nitrogen gas is injected in the middle test interval of one of the boreholes at increasing constant rates. The experimental data collected so far are presented along with their interpretation by means of 1D and 3D numerical modeling of the boundary value problem. The numerical results show that a predictive model as two-phase flow approach is able to reproduce experimental observations in large scale system, as far as the injection flow rate and the gas pressures remain moderate. Moreover permeability is not modified by gas injection, which indicates that the rock mass is not damaged by the gas pressure increase during the test. INTRODUCTION Understanding the fate and impact of gas produced by corrosion of metals, decomposition of some wastes, radioactive decay of waste, and the radiolysis of water within a repository, is of significant importance in the performance assessment and for the long-term prediction of repository evolution (Ortiz et al., 1997; Horseman et al., 1999). To address these issues, the French national waste management Agency (Andra) has directed a field scale experiment examining the mechanisms controlling gas entry and gas migration in the Callovo-Oxfordian (COx) claystone, the proposed host rock for the French repository. This experiment, called PGZ1, studies the migration of nitrogen in the host rock. This paper describes a modeling of this large- scale test using a predictive two-phase flow model. An iterative modeling process will show step-by-step how an accurate description of each component of the experiment system allows a satisfactory reproduction and the understanding of the experimental data. For instance, the initial degree of saturation in the injection 1524 Poromechanics V © ASCE 2013 Poromechanics V Downloaded from ascelibrary.org by Universite De Liege on 07/16/13. Copyright ASCE. For personal use only; all rights reserved.

Welcome message from author
This document is posted to help you gain knowledge. Please leave a comment to let me know what you think about it! Share it to your friends and learn new things together.
Transcript
Characterization of gas transport in low-permeability media: two-phase flow analysis of an in-situ experiment
Pierre Gerard1, Jean-Pol Radu2, Rémi de La Vaissière3, Jean Talandier3, Robert
Charlier2 and Frédéric Collin2
1Université libre de Bruxelles (ULB), Department BATir, Av. F. Roosevelt 50, 1050 Bruxelles, Belgium; email: [email protected] 2Université de Liège (ULg), Department ArGEnCo, Liège, Belgium; email: [email protected] 3Agence nationale pour la gestion des déchets radioactifs (ANDRA), Chatenay-Malabry, France.
ABSTRACT
This paper describes a field-scale experiment on gas transport mechanisms performed at the Andra Underground Research Laboratory in a clay rock. The experimental layout consists of two parallel boreholes that are equipped with multiple packer completions delimiting three intervals each and which monitor continuously the pore pressure evolution of the clay rock. Nitrogen gas is injected in the middle test interval of one of the boreholes at increasing constant rates. The experimental data collected so far are presented along with their interpretation by means of 1D and 3D numerical modeling of the boundary value problem. The numerical results show that a predictive model as two-phase flow approach is able to reproduce experimental observations in large scale system, as far as the injection flow rate and the gas pressures remain moderate. Moreover permeability is not modified by gas injection, which indicates that the rock mass is not damaged by the gas pressure increase during the test. INTRODUCTION
Understanding the fate and impact of gas produced by corrosion of metals, decomposition of some wastes, radioactive decay of waste, and the radiolysis of water within a repository, is of significant importance in the performance assessment and for the long-term prediction of repository evolution (Ortiz et al., 1997; Horseman et al., 1999). To address these issues, the French national waste management Agency (Andra) has directed a field scale experiment examining the mechanisms controlling gas entry and gas migration in the Callovo-Oxfordian (COx) claystone, the proposed host rock for the French repository. This experiment, called PGZ1, studies the migration of nitrogen in the host rock. This paper describes a modeling of this large-scale test using a predictive two-phase flow model. An iterative modeling process will show step-by-step how an accurate description of each component of the experiment system allows a satisfactory reproduction and the understanding of the experimental data. For instance, the initial degree of saturation in the injection
1524Poromechanics V © ASCE 2013
Poromechanics V
Dow
nloa
ded
from
asc
elib
rary
.org
by
Uni
vers
ite D
e L
iege
on
07/1
6/13
. Cop
yrig
ht A
SCE
. For
per
sona
l use
onl
y; a
ll ri
ghts
res
erve
d.
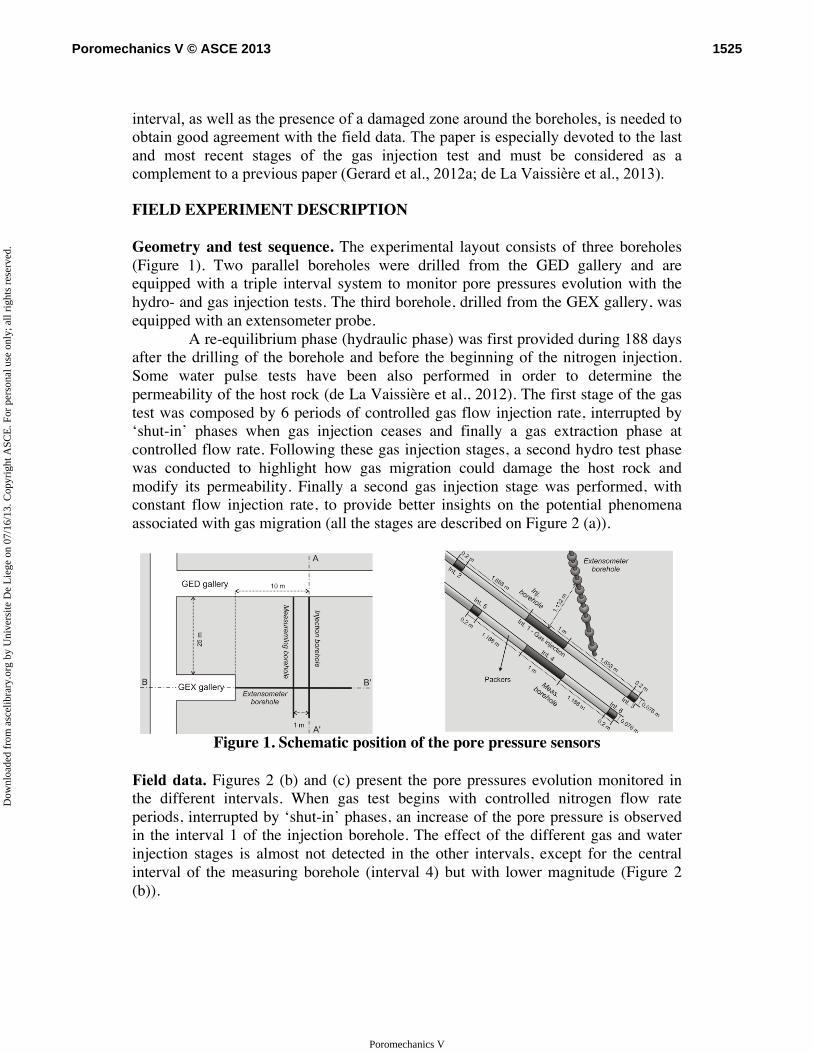
interval, as well as the presence of a damaged zone around the boreholes, is needed to obtain good agreement with the field data. The paper is especially devoted to the last and most recent stages of the gas injection test and must be considered as a complement to a previous paper (Gerard et al., 2012a; de La Vaissière et al., 2013). FIELD EXPERIMENT DESCRIPTION Geometry and test sequence. The experimental layout consists of three boreholes (Figure 1). Two parallel boreholes were drilled from the GED gallery and are equipped with a triple interval system to monitor pore pressures evolution with the hydro- and gas injection tests. The third borehole, drilled from the GEX gallery, was equipped with an extensometer probe.
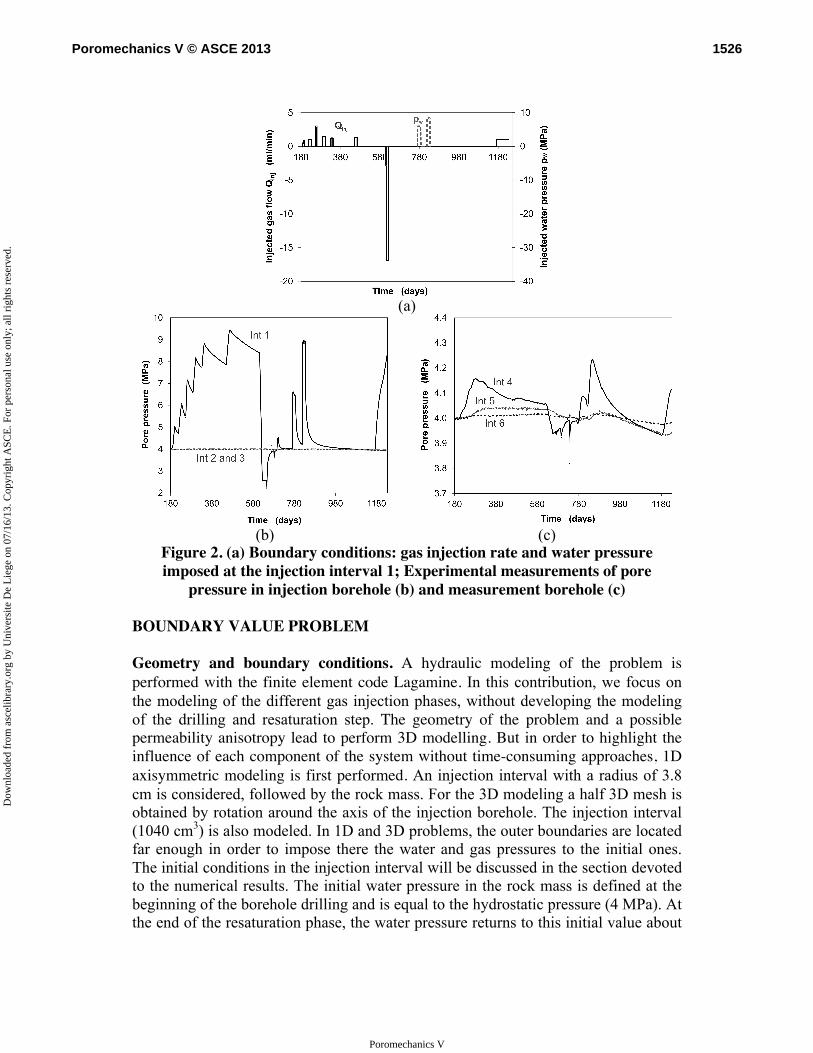
A re-equilibrium phase (hydraulic phase) was first provided during 188 days after the drilling of the borehole and before the beginning of the nitrogen injection. Some water pulse tests have been also performed in order to determine the permeability of the host rock (de La Vaissière et al., 2012). The first stage of the gas test was composed by 6 periods of controlled gas flow injection rate, interrupted by ‘shut-in’ phases when gas injection ceases and finally a gas extraction phase at controlled flow rate. Following these gas injection stages, a second hydro test phase was conducted to highlight how gas migration could damage the host rock and modify its permeability. Finally a second gas injection stage was performed, with constant flow injection rate, to provide better insights on the potential phenomena associated with gas migration (all the stages are described on Figure 2 (a)).
Figure 1. Schematic position of the pore pressure sensors
Field data. Figures 2 (b) and (c) present the pore pressures evolution monitored in the different intervals. When gas test begins with controlled nitrogen flow rate periods, interrupted by ‘shut-in’ phases, an increase of the pore pressure is observed in the interval 1 of the injection borehole. The effect of the different gas and water injection stages is almost not detected in the other intervals, except for the central interval of the measuring borehole (interval 4) but with lower magnitude (Figure 2 (b)).
1525Poromechanics V © ASCE 2013
Poromechanics V
Dow
nloa
ded
from
asc
elib
rary
.org
by
Uni
vers
ite D
e L
iege
on
07/1
6/13
. Cop
yrig
ht A
SCE
. For
per
sona
l use
onl
y; a
ll ri
ghts
res
erve
d.
(a)
(b) (c)
Figure 2. (a) Boundary conditions: gas injection rate and water pressure imposed at the injection interval 1; Experimental measurements of pore
pressure in injection borehole (b) and measurement borehole (c) BOUNDARY VALUE PROBLEM Geometry and boundary conditions. A hydraulic modeling of the problem is performed with the finite element code Lagamine. In this contribution, we focus on the modeling of the different gas injection phases, without developing the modeling of the drilling and resaturation step. The geometry of the problem and a possible permeability anisotropy lead to perform 3D modelling. But in order to highlight the influence of each component of the system without time-consuming approaches, 1D axisymmetric modeling is first performed. An injection interval with a radius of 3.8 cm is considered, followed by the rock mass. For the 3D modeling a half 3D mesh is obtained by rotation around the axis of the injection borehole. The injection interval (1040 cm3) is also modeled. In 1D and 3D problems, the outer boundaries are located far enough in order to impose there the water and gas pressures to the initial ones. The initial conditions in the injection interval will be discussed in the section devoted to the numerical results. The initial water pressure in the rock mass is defined at the beginning of the borehole drilling and is equal to the hydrostatic pressure (4 MPa). At the end of the resaturation phase, the water pressure returns to this initial value about
1526Poromechanics V © ASCE 2013
Poromechanics V
Dow
nloa
ded
from
asc
elib
rary
.org
by
Uni
vers
ite D
e L
iege
on
07/1
6/13
. Cop
yrig
ht A
SCE
. For
per
sona
l use
onl
y; a
ll ri
ghts
res
erve
d.
4 MPa and the rock mass is saturated. The gas injection is modeled by imposing at one lateral face of the injection interval the experimental gas flow (Figure 2 (a)). Two-phase flow model. To reproduce water and gas transfers in partially saturated porous media, two-phase flow model is used (Charlier et al., 2013). This model deals with a liquid phase, composed of liquid water and dissolved gas and a gaseous phase, which is an ideal mixture of dry gas and water vapour. It takes into account the advection of each phase using the generalised Darcy’s law and the diffusion of the components within each phase (Fick’s law). The retention curve and the water relative permeability curve are given by the van Genuchten’s expression type. The gas relative permeability curve is a Parker’s relationship:
( )21, ,1 1dry
g g r w r wK K S Sλλ= − −
with Kg the gas permeability, drygK the gas permeability in dried conditions, Sr,w the
degree of saturation and λ a parameter. Hydraulic parameters for COx are given in Table 1 and correspond to
classical value for this host rock (Charlier et al., 2013). Table 1 : Hydraulic parameters for COx
satwK Water permeability in saturated conditions (m²) 4 10-20 drygK Gas permeability in dried conditions (m²) 4 10-18 φ Porosity (-) 0.18 Pr van Genuchten air entry pressure (MPa) 15 n van Genuchten parameter of retention curve (-) 1.49 m van Genuchten parameter of water permeability curve (-) 0.55 λ Parker parameter (-) 1.6
The injection interval is modelled by considering an equivalent porous
media, with high permeability, porosity equal to 1 and a low air entry pressure. No water and gas relative permeability curves are defined for this component. NUMERICAL RESULTS
In this section, we focus mainly on the comparison between experimental data and numerical predictions in interval 1, where the measurements are the most representative of the experiment response. First 1D hydraulic modeling is considered, whilst an extension to 3D results is presented at the end of the section. First gas injection phases. The modeling of the first gas injection phase is considered to highlight the influence of each component of the borehole/test interval system, their initial conditions (e.g. fluid saturation) and the two-phase flow characteristics of the host rock. Uncertainties remained indeed on the exact saturation of the injection interval at the beginning of the gas injection. Whilst a total extraction of the water filling the interval was initially expected, it would seem that a volume of residual water has not been totally extracted before the nitrogen injection (de La
1527Poromechanics V © ASCE 2013
Poromechanics V
Dow
nloa
ded
from
asc
elib
rary
.org
by
Uni
vers
ite D
e L
iege
on
07/1
6/13
. Cop
yrig
ht A
SCE
. For
per
sona
l use
onl
y; a
ll ri
ghts
res
erve
d.
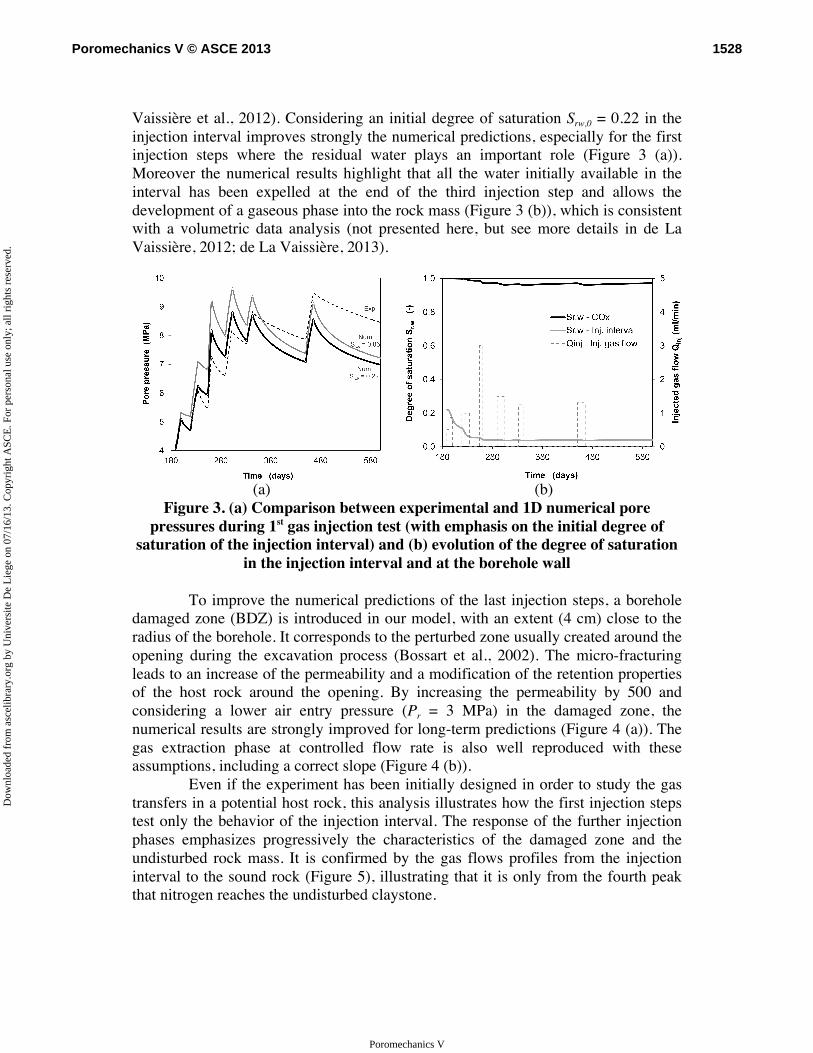
Vaissière et al., 2012). Considering an initial degree of saturation Srw,0 = 0.22 in the injection interval improves strongly the numerical predictions, especially for the first injection steps where the residual water plays an important role (Figure 3 (a)). Moreover the numerical results highlight that all the water initially available in the interval has been expelled at the end of the third injection step and allows the development of a gaseous phase into the rock mass (Figure 3 (b)), which is consistent with a volumetric data analysis (not presented here, but see more details in de La Vaissière, 2012; de La Vaissière, 2013).
(a) (b)
Figure 3. (a) Comparison between experimental and 1D numerical pore pressures during 1st gas injection test (with emphasis on the initial degree of
saturation of the injection interval) and (b) evolution of the degree of saturation in the injection interval and at the borehole wall
To improve the numerical predictions of the last injection steps, a borehole
damaged zone (BDZ) is introduced in our model, with an extent (4 cm) close to the radius of the borehole. It corresponds to the perturbed zone usually created around the opening during the excavation process (Bossart et al., 2002). The micro-fracturing leads to an increase of the permeability and a modification of the retention properties of the host rock around the opening. By increasing the permeability by 500 and considering a lower air entry pressure (Pr = 3 MPa) in the damaged zone, the numerical results are strongly improved for long-term predictions (Figure 4 (a)). The gas extraction phase at controlled flow rate is also well reproduced with these assumptions, including a correct slope (Figure 4 (b)).
Even if the experiment has been initially designed in order to study the gas transfers in a potential host rock, this analysis illustrates how the first injection steps test only the behavior of the injection interval. The response of the further injection phases emphasizes progressively the characteristics of the damaged zone and the undisturbed rock mass. It is confirmed by the gas flows profiles from the injection interval to the sound rock (Figure 5), illustrating that it is only from the fourth peak that nitrogen reaches the undisturbed claystone.
1528Poromechanics V © ASCE 2013
Poromechanics V
Dow
nloa
ded
from
asc
elib
rary
.org
by
Uni
vers
ite D
e L
iege
on
07/1
6/13
. Cop
yrig
ht A
SCE
. For
per
sona
l use
onl
y; a
ll ri
ghts
res
erve
d.
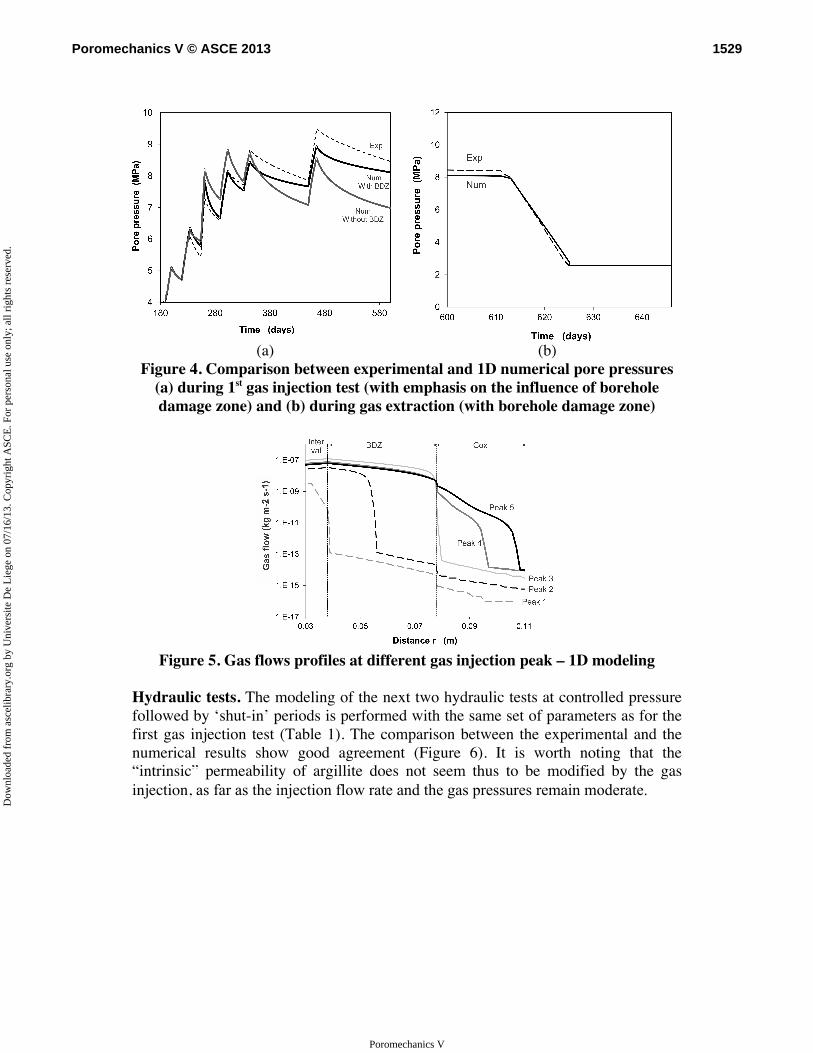
(a) (b)
Figure 4. Comparison between experimental and 1D numerical pore pressures (a) during 1st gas injection test (with emphasis on the influence of borehole damage zone) and (b) during gas extraction (with borehole damage zone)
Figure 5. Gas flows profiles at different gas injection peak – 1D modeling
Hydraulic tests. The modeling of the next two hydraulic tests at controlled pressure followed by ‘shut-in’ periods is performed with the same set of parameters as for the first gas injection test (Table 1). The comparison between the experimental and the numerical results show good agreement (Figure 6). It is worth noting that the “intrinsic” permeability of argillite does not seem thus to be modified by the gas injection, as far as the injection flow rate and the gas pressures remain moderate.
1529Poromechanics V © ASCE 2013
Poromechanics V
Dow
nloa
ded
from
asc
elib
rary
.org
by
Uni
vers
ite D
e L
iege
on
07/1
6/13
. Cop
yrig
ht A
SCE
. For
per
sona
l use
onl
y; a
ll ri
ghts
res
erve
d.

Figure 6. Comparison between experimental and 1D numerical pore pressures
during hydraulic tests Second gas injection phases. Finally a second gas injection test is performed, by imposing a constant flow rate. The numerical predictions obtained with the same set of parameters and geometry as previously reproduce well the kinetics of the gas migration (Figure 7 (a)). The change in concavity in the pore pressure curve observed experimentally is also obtained numerically. It corresponds to the expulsion by the nitrogen of all the water available in the interval and coming from the hydraulic test (Figure 7 (b)). This modeling shows once again how the coupling between the liquid and gaseous phases in a chamber influence the fluid transfers in a low permeability medium. It is worth noting that the injection interval is not initially saturated, because a volume of water (674 cm³) has been manually extracted before the second gas injection. This step is modeled by imposing the corresponding degree of saturation in the interval (Srw,0 = 0.35) before the gas injection test.
(a) (b)
Figure 7. (a) Comparison between experimental and 1D numerical pore pressures and (b) evolution of degree of saturation in the injection interval and
at the borehole wall during second gas injection test
1530Poromechanics V © ASCE 2013
Poromechanics V
Dow
nloa
ded
from
asc
elib
rary
.org
by
Uni
vers
ite D
e L
iege
on
07/1
6/13
. Cop
yrig
ht A
SCE
. For
per
sona
l use
onl
y; a
ll ri
ghts
res
erve
d.
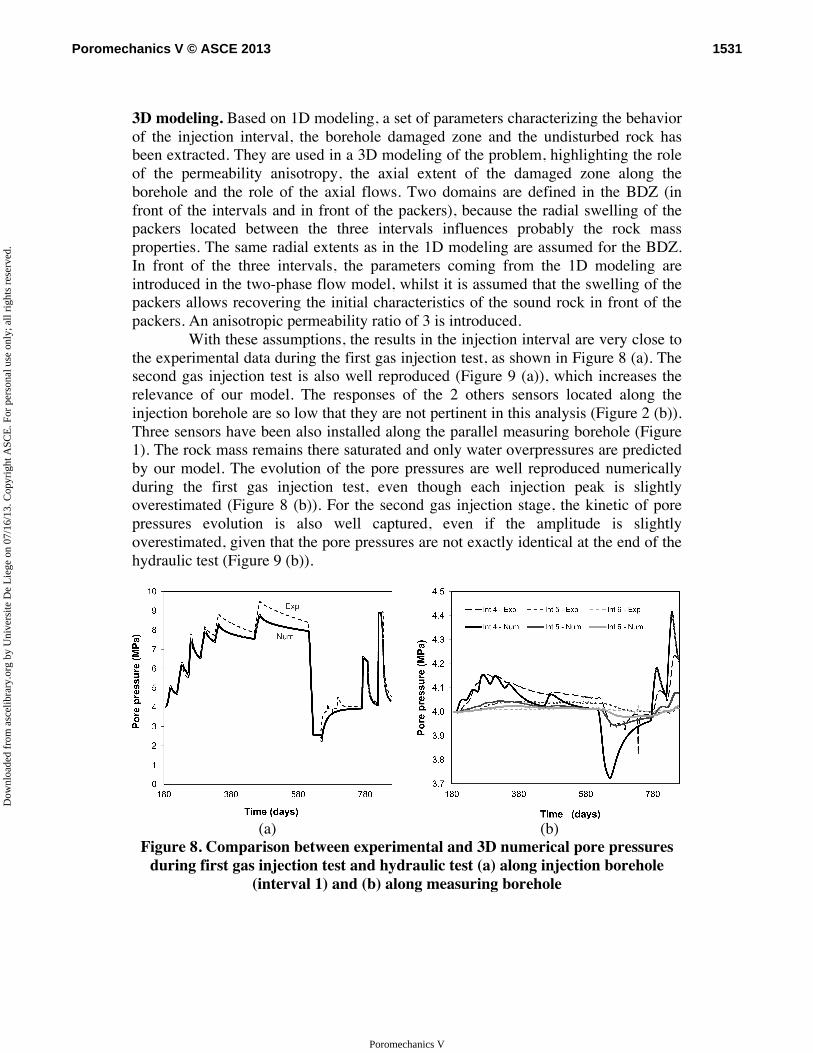
3D modeling. Based on 1D modeling, a set of parameters characterizing the behavior of the injection interval, the borehole damaged zone and the undisturbed rock has been extracted. They are used in a 3D modeling of the problem, highlighting the role of the permeability anisotropy, the axial extent of the damaged zone along the borehole and the role of the axial flows. Two domains are defined in the BDZ (in front of the intervals and in front of the packers), because the radial swelling of the packers located between the three intervals influences probably the rock mass properties. The same radial extents as in the 1D modeling are assumed for the BDZ. In front of the three intervals, the parameters coming from the 1D modeling are introduced in the two-phase flow model, whilst it is assumed that the swelling of the packers allows recovering the initial characteristics of the sound rock in front of the packers. An anisotropic permeability ratio of 3 is introduced.
With these assumptions, the results in the injection interval are very close to the experimental data during the first gas injection test, as shown in Figure 8 (a). The second gas injection test is also well reproduced (Figure 9 (a)), which increases the relevance of our model. The responses of the 2 others sensors located along the injection borehole are so low that they are not pertinent in this analysis (Figure 2 (b)). Three sensors have been also installed along the parallel measuring borehole (Figure 1). The rock mass remains there saturated and only water overpressures are predicted by our model. The evolution of the pore pressures are well reproduced numerically during the first gas injection test, even though each injection peak is slightly overestimated (Figure 8 (b)). For the second gas injection stage, the kinetic of pore pressures evolution is also well captured, even if the amplitude is slightly overestimated, given that the pore pressures are not exactly identical at the end of the hydraulic test (Figure 9 (b)).
(a) (b)
Figure 8. Comparison between experimental and 3D numerical pore pressures during first gas injection test and hydraulic test (a) along injection borehole
(interval 1) and (b) along measuring borehole
1531Poromechanics V © ASCE 2013
Poromechanics V
Dow
nloa
ded
from
asc
elib
rary
.org
by
Uni
vers
ite D
e L
iege
on
07/1
6/13
. Cop
yrig
ht A
SCE
. For
per
sona
l use
onl
y; a
ll ri
ghts
res
erve
d.
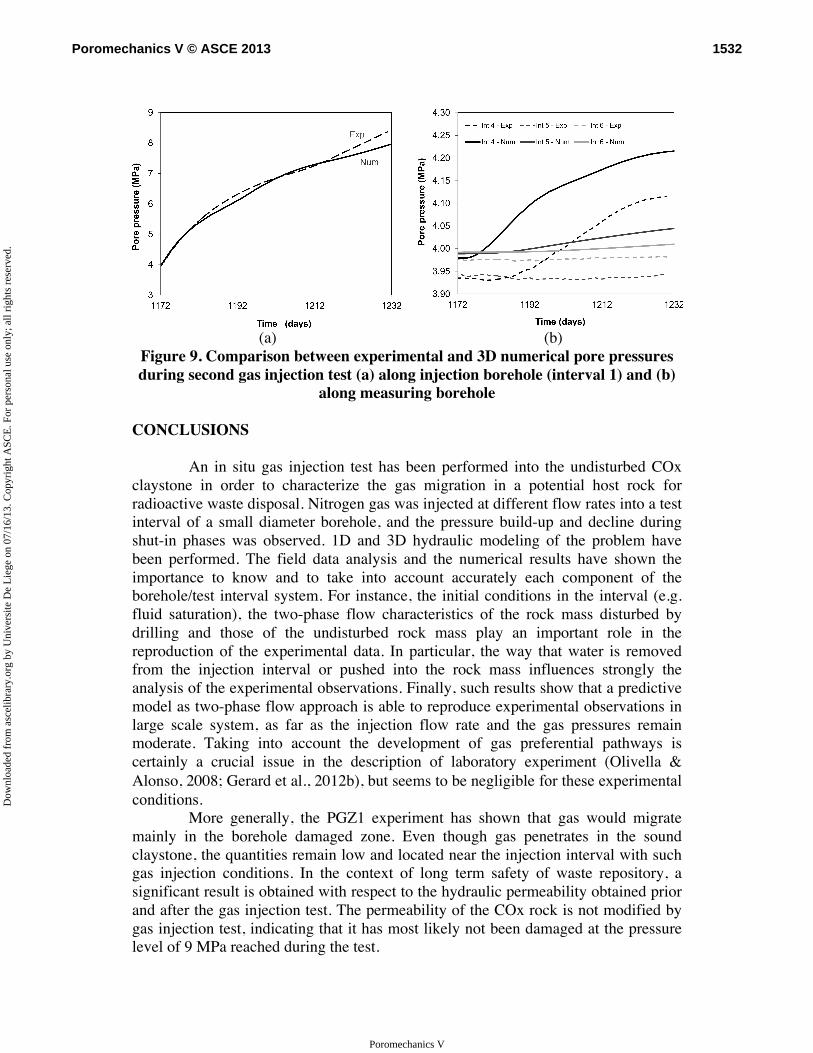
(a) (b)
Figure 9. Comparison between experimental and 3D numerical pore pressures during second gas injection test (a) along injection borehole (interval 1) and (b)
along measuring borehole CONCLUSIONS
An in situ gas injection test has been performed into the undisturbed COx claystone in order to characterize the gas migration in a potential host rock for radioactive waste disposal. Nitrogen gas was injected at different flow rates into a test interval of a small diameter borehole, and the pressure build-up and decline during shut-in phases was observed. 1D and 3D hydraulic modeling of the problem have been performed. The field data analysis and the numerical results have shown the importance to know and to take into account accurately each component of the borehole/test interval system. For instance, the initial conditions in the interval (e.g. fluid saturation), the two-phase flow characteristics of the rock mass disturbed by drilling and those of the undisturbed rock mass play an important role in the reproduction of the experimental data. In particular, the way that water is removed from the injection interval or pushed into the rock mass influences strongly the analysis of the experimental observations. Finally, such results show that a predictive model as two-phase flow approach is able to reproduce experimental observations in large scale system, as far as the injection flow rate and the gas pressures remain moderate. Taking into account the development of gas preferential pathways is certainly a crucial issue in the description of laboratory experiment (Olivella & Alonso, 2008; Gerard et al., 2012b), but seems to be negligible for these experimental conditions.
More generally, the PGZ1 experiment has shown that gas would migrate mainly in the borehole damaged zone. Even though gas penetrates in the sound claystone, the quantities remain low and located near the injection interval with such gas injection conditions. In the context of long term safety of waste repository, a significant result is obtained with respect to the hydraulic permeability obtained prior and after the gas injection test. The permeability of the COx rock is not modified by gas injection test, indicating that it has most likely not been damaged at the pressure level of 9 MPa reached during the test.
1532Poromechanics V © ASCE 2013
Poromechanics V
Dow
nloa
ded
from
asc
elib
rary
.org
by
Uni
vers
ite D
e L
iege
on
07/1
6/13
. Cop
yrig
ht A
SCE
. For
per
sona
l use
onl
y; a
ll ri
ghts
res
erve
d.
REFERENCES Bossart, P., Meier, P.M., Moeri, A., Trick, T., and Mayor, J.C. (2002). “Geological
and hydraulic characterisation of the excavation disturbed zone in the Opalinus Clay of the Mont Terri Rock Laboratory.”, Engineering Geology, 66, 19–38.
Charlier, R., Collin, F., Pardoen, B., Talandier, J., Radu, J.-P., and Gerard, P. (2013). “An unsaturated hydro-mechanical modelling of two in-situ experiments in Callovo-Oxfordian argillite.”, Engineering Geology, submitted.
de La Vaissière, R., Gerard, P., Radu, J.-P., Charlier, R., Collin, F., Granet, S., Piedevache, M., Helmlinger, B., Croisé, J., Lavanchy, J.-M., Senger, R., and Talandier, J. (2013). “Gas injection test in the Callovo-Oxfordian claystone : data analysis and numerical modelling.”, Geological Society Special Publication, submitted.
de La Vaissière, R., and Talandier, J. (2012) “Gas entry pressure in Callovo-Oxfordian claystone : in-situ experiment PGZ1.”, Proceedings of Transfert 2012, In Skoczylas F., Davy C.A., Agostini F., Burlion F. (Eds.), pp. 360-368.
Gerard, P., Radu, J.-P., Talandier, J., de La Vaissière, R., Charlier, R., and Collin, F. (2012 a). « Gas migration through clay barriers in the context of radioactive waste disposal: numerical modelling of an in-situ gas injection test.” Geomechanics in CO2 storage facilities. In G. Pijaudier-Cabot & J.-M. Pereira (Eds.), Wiley, pp. 21-42.
Gerard, P., Harrington, J., Charlier, R., and Collin, F. (2012b). “Hydro-mechanical modelling of the development of preferential gas pathways in claystone.”, Unsaturated soils: research and applications. In Mancuso C., Jommi C., D’Onza F. (Eds.), Springer, volume 2, pp. 175-180.
Horseman, S.T., Harrington, J.F., and Sellin, P., (1999). “Gas migration in clay barriers.”, Engineering Geology, 54, 139–149.
Olivella, S., and Alonso, E.E. (2008). “Gas flow through clay barriers.”, Géotechnique, 58, n°3, 157-168.
Ortiz, L., Volcharet, G., De Canniere, P., Aertsens, M., Horseman, S.T., Harrington, J.F., Impey, M., and Einchcomb, S. (1997). “MEGAS – modelling and experiments on gas migration in repository host-rocks.”, In: Proc. EU PEGASUS Meeting. Nuclear Science and Technology Series, EUR16746 EN, Luxembourg, pp. 127–147.
1533Poromechanics V © ASCE 2013
Poromechanics V
Dow
nloa
ded
from
asc
elib
rary
.org
by
Uni
vers
ite D
e L
iege
on
07/1
6/13
. Cop
yrig
ht A
SCE
. For
per
sona
l use
onl
y; a
ll ri
ghts
res
erve
d.
Related Documents


![Sport [broj 1524, 21.9.2010]](https://static.cupdf.com/doc/110x72/577d36241a28ab3a6b92496e/sport-broj-1524-2192010.jpg)