Pore size dependence of self-assembled type photonic crystal on dye-sensitized solar cells efficiency utilising Chlorine e6 George Kato • Chie Nishiyama • Takashi Yabuta • Masahiro Miyauchi • Takuya Hashimoto • Toshihiro Isobe • Akira Nakajima • Sachiko Matsushita Published online: 3 December 2013 Ó The Author(s) 2013. This article is published with open access at Springerlink.com Abstract There are few reports on photoelectric con- version efficiency using naturally-occurring dyes for dye- sensitized solar cells (DSSC). This is because the matching with an excited electronic level of naturally-occurring dye to the conduction band of semiconductor is problematic; the excited electrons are easily relaxed to the steady state with fluorescence or heat emission. We examined the fluorescence inhibition effect of a self-assembled photonic crystal using Chlorine e6 dye. Chlorine e6 is derived from chlorophyll and has a long excited electron lifetime. We prepared TiO 2 inverse opals with various particle sizes by liquid phase deposition and described their effect on DSSCs with regard to structural, optical and electrochem- ical properties. In addition, we explored the implications of fluorescence lifetime measurements relative to the photonic band diagram and the amount of adsorbed dye. Although the main factor affecting the external photoelectric con- version efficiency was the diffusion resistance of the electrolyte and the contact resistance between TiO 2 inter- faces, the possibility that the dye fluorescence lifetime, i.e. the photonic band structure, can affect the internal quantum efficiency per one dye molecule was also investigated. Keywords Graetzel cell Inverse-opal Colloidal crystal Self-assembly Self-organize 1 Introduction The dye-sensitized solar cell (DSSC), first reported in 1991 [1–3], has attracted considerable attention; particularly its potential use as a next-generation solar cell. Extensive fundamental and experimental research has been conducted on DSSCs. Overall conversion efficiencies higher than 12 % have been recently reported [4]. The dye might be the most important factor in achieving higher conversion efficiency. The development of effective dyes with higher light-harvesting efficiency, particularly those that work at longer wavelengths, is being actively explored [5]. Near IR absorbing dyes leading to efficiencies of more than 5 % have been demonstrated in dye-sensi- tized solar cells [6]. However, reported dyes with high photon-to-electron conversion efficiencies are difficult to synthesise and expensive. Here we investigate how similar high-conversion efficiencies can be obtained using a nat- urally-occurring dye. Electron transfer in DSSCs can be summarized as follows. The incident light at photon energy hm 1 excites the dye mol- ecule. A large part of the excited electrons relaxes to a lower energy state and then, a certain fraction is injected into the TiO 2 conduction band [7]. This results in the extraction of photocurrent from the electrode. Another fraction directly relaxes to the ground state with thermal emission and/or photon emission at photon energy hm 2 , resulting in the reduction of photon-to-electron conversion efficiency. Electronic supplementary material The online version of this article (doi:10.1007/s10934-013-9761-8) contains supplementary material, which is available to authorized users. G. Kato T. Yabuta M. Miyauchi T. Isobe A. Nakajima S. Matsushita Department of Metallurgy and Ceramics Science, Graduate School of Science and Technology, Tokyo Institute of Technology, 2-12-1, Ookayama, Meguro-ku, Tokyo 152-8552, Japan G. Kato C. Nishiyama T. Yabuta T. Hashimoto S. Matsushita (&) Division of Optical and Electronic Sciences, Nihon University, 3-25-40 Sakurajosui, Setagaya-ku, Tokyo 156-8550, Japan e-mail: [email protected] 123 J Porous Mater (2014) 21:165–176 DOI 10.1007/s10934-013-9761-8

Welcome message from author
This document is posted to help you gain knowledge. Please leave a comment to let me know what you think about it! Share it to your friends and learn new things together.
Transcript

Pore size dependence of self-assembled type photonic crystalon dye-sensitized solar cells efficiency utilising Chlorine e6
George Kato • Chie Nishiyama • Takashi Yabuta •
Masahiro Miyauchi • Takuya Hashimoto •
Toshihiro Isobe • Akira Nakajima • Sachiko Matsushita
Published online: 3 December 2013
� The Author(s) 2013. This article is published with open access at Springerlink.com
Abstract There are few reports on photoelectric con-
version efficiency using naturally-occurring dyes for dye-
sensitized solar cells (DSSC). This is because the matching
with an excited electronic level of naturally-occurring dye
to the conduction band of semiconductor is problematic;
the excited electrons are easily relaxed to the steady state
with fluorescence or heat emission. We examined the
fluorescence inhibition effect of a self-assembled photonic
crystal using Chlorine e6 dye. Chlorine e6 is derived from
chlorophyll and has a long excited electron lifetime. We
prepared TiO2 inverse opals with various particle sizes by
liquid phase deposition and described their effect on
DSSCs with regard to structural, optical and electrochem-
ical properties. In addition, we explored the implications of
fluorescence lifetime measurements relative to the photonic
band diagram and the amount of adsorbed dye. Although
the main factor affecting the external photoelectric con-
version efficiency was the diffusion resistance of the
electrolyte and the contact resistance between TiO2 inter-
faces, the possibility that the dye fluorescence lifetime, i.e.
the photonic band structure, can affect the internal quantum
efficiency per one dye molecule was also investigated.
Keywords Graetzel cell � Inverse-opal � Colloidal
crystal � Self-assembly � Self-organize
1 Introduction
The dye-sensitized solar cell (DSSC), first reported in 1991
[1–3], has attracted considerable attention; particularly its
potential use as a next-generation solar cell. Extensive
fundamental and experimental research has been conducted
on DSSCs. Overall conversion efficiencies higher than
12 % have been recently reported [4].
The dye might be the most important factor in achieving
higher conversion efficiency. The development of effective
dyes with higher light-harvesting efficiency, particularly
those that work at longer wavelengths, is being actively
explored [5]. Near IR absorbing dyes leading to efficiencies
of more than 5 % have been demonstrated in dye-sensi-
tized solar cells [6]. However, reported dyes with high
photon-to-electron conversion efficiencies are difficult to
synthesise and expensive. Here we investigate how similar
high-conversion efficiencies can be obtained using a nat-
urally-occurring dye.
Electron transfer in DSSCs can be summarized as follows.
The incident light at photon energy hm1 excites the dye mol-
ecule. A large part of the excited electrons relaxes to a lower
energy state and then, a certain fraction is injected into the
TiO2 conduction band [7]. This results in the extraction of
photocurrent from the electrode. Another fraction directly
relaxes to the ground state with thermal emission and/or
photon emission at photon energy hm2, resulting in the
reduction of photon-to-electron conversion efficiency.
Electronic supplementary material The online version of thisarticle (doi:10.1007/s10934-013-9761-8) contains supplementarymaterial, which is available to authorized users.
G. Kato � T. Yabuta � M. Miyauchi � T. Isobe � A. Nakajima �S. Matsushita
Department of Metallurgy and Ceramics Science, Graduate
School of Science and Technology, Tokyo Institute of
Technology, 2-12-1, Ookayama, Meguro-ku, Tokyo 152-8552,
Japan
G. Kato � C. Nishiyama � T. Yabuta � T. Hashimoto �S. Matsushita (&)
Division of Optical and Electronic Sciences, Nihon University,
3-25-40 Sakurajosui, Setagaya-ku, Tokyo 156-8550, Japan
e-mail: [email protected]
123
J Porous Mater (2014) 21:165–176
DOI 10.1007/s10934-013-9761-8

Characteristically, these emissions are large for naturally-
occurring dyes. This study attempts to introduce a photonic
crystal structure to inhibit the emissions from the dye at hm2 to
enhance electron injection efficiency using Chlorine e6, a dye
derived from chlorophyll that shows a long excited electron
lifetime (the charge injection rate constant was reported as
2.2 9 109 s-1) [8, 9] and thus is considered as an appropriate
dye to examine the photonic crystal’s effect.
A photonic crystal is being recognised as a promising
device for incident light harvesting in DSSC research.
Mallouk et al. reported a 26 % improvement of light har-
vesting efficiency at 400–750 nm by combining a self-
assembled photonic crystal (TiO2 inverse opal) with
DSSCs [10]. They reported that an increase in incident
light path length generated by Bragg diffraction and defect
scattering in the inverse opal layer resulted in the
enhancement of the visible wavelength [11, 12].
In 2006, Miguez et al. theoretically discussed the light
harvesting effect of TiO2 inverse opals in DSSCs [13, 14].
They demonstrated that the light harvesting was the result of
the optical absorption amplification effect of slow photon
resonant modes partially confined within the absorbing part of
the cell due to the mirror behaviour of the colloidal superlat-
tice. The effects of these defects are not discussed in this paper.
In 2010, Tao et al. described the use of a double-inverse
opal as a novel optical element, which was expected to
have a light scattering effect and a broader reflection
region, and presented a theoretical analysis of the effi-
ciency enhancement of designed DSSC [15]. A distinct
increment of approximately 80 % of photocurrent effi-
ciency compared with a standard inverse opal layer was
expected.
Not only the optical effects of TiO2 inverse opals [16–
19] but also the enhancement of efficient electron and
electrolyte transportation generated in the inverse opals has
been recently reported [20, 21].
In 2005, the authors reported the increase of the photon-
to-electron conversion efficiency per 1 mol of dye with an
inverse opal using Chlorine e6 [22, 23]. Even though the
inverse opal did not exhibit a full photonic bandgap, an
increase in the spontaneous emission decay time of the dye
was confirmed by time-resolved emission profiles. The
authors discussed the influence of the inverse opal on the
inhibition of spontaneous emissions from the dye and the
possibility of the inhibition of the recombination of elec-
trons and holes in the dye [23]. However, the discussion
did not include electrochemical impedance results and the
discussion was obviously insufficient.
As described above, various enhancement factors of
TiO2 inverse opals in DSSCs have been reported. However,
to the authors’ knowledge, no report has comprehensively
examined the optical effect and the electron and electrolyte
transportation effects taking the photonic band diagram
into consideration. Thus, we could not discuss the effect of
the change in the excited electron lifetime of the dye on
photon-to-electron conversion efficiency. Because the
quality of the inverse opal is critical to the efficiency of
DSSCs, as reported by Mallouk et al., a comprehensive
examination of the same electrode is required to clarify the
role of the inverse opal.
This paper presents a comprehensive examination of
inverse opals of various pore sizes (202, 356, 457 and
731 nm diameter) using structural analysis, transmission
and scattering reflection UV/Vis spectroscopy and photo-
voltaic, electrochemical impedance and fluorescence life-
time measurements. The paper also includes a discussion of
photonic band simulation using Chlorine e6. Each analyt-
ical parameter is explored from the viewpoint of pore-size
dependence. The effects of the inverse opals are summa-
rized and a tentative analysis of the effect of fluorescence
lifetime is presented.
2 Experimental
2.1 Preparation
All experiments were performed in an open air environ-
ment. Unless otherwise stated, all reagents were purchased
from Waco Pure Chemical Industries, Ltd.
2.1.1 Preparation of polystyrene opals
Indium thin oxide (ITO) substrates (10X/h, 2 cm 9 3 cm,
thickness 2,000 ± 200 A, Geomatec Co.) were cleaned by
sonication for 20 min in pure water, and subsequently for
20 min in ethanol. Then, the ITO substrates were rinsed with
pure water and air dried. Polystyrene opals of each size were
prepared by an evaporation-driven self-assembly method.
The details of this method have been previously reported [24,
25]. Polystyrene particle suspensions (of diameters 202, 356,
457 and 731 nm with 2.62, 2.6, 2.5 and 2.63 % solids in
water, respectively, Polysciences, Inc.) were sonicated for
5 min. The polystyrene particle suspensions were injected in
a glass cell and coated onto the ITO substrate. The opals were
kept at 60 �C for 30 min. The ITO substrate was set on an x-
stage and moved at a constant speed of 2 lm/s (USJ Co.).
The polystyrene opals were dried at 60 �C for 30 min. The
polystyrene opals composed of 202, 356, 457 and 731-nm
diameter particles have been referred as PS202, PS356,
PS457 and PS731, respectively.
2.1.2 Preparation of TiO2 inverse opal electrodes
The authors had assessed the structural analysis, photo-
voltaic characteristics and electrochemical impedance
166 J Porous Mater (2014) 21:165–176
123

measurements of the normal and inverse opal dye-sensi-
tized electrodes prepared by three different methods:
electrophoretic deposition, TiCl4 coating and liquid-phase
deposition (LPD) [26]. The electrode prepared by LPD
exhibited the least internal resistance and highest photon-
to-electron conversion efficiency among the three methods.
Therefore, in this study, TiO2 inverse opals were synthes-
ised by LPD. The samples were immersed in a solution of
0.15 % titanium isopropoxide ([(CH3)2ChO]4Ti, 95.0 %)
and nitric acid in ethanol (Junsei Chemical Co., Ltd.) for
5 min at room temperature. The samples were dried and
immersed in a solution of 0.1 M of ammonium hexafluo-
rotitanate ((NH4)2TiF6) and 0.2 M of boric acid in pure
water for 20 min at 60 �C. The pH of the solution was
adjusted to 3.0 using hydrochloric acid. The samples were
rinsed in pure water and dried for several hours. The
samples were heated in air at 0.55 �C/min to 500 �C for
30 min and cooled to room temperature. The inverse opals
prepared using PS202, PS356, PS457 and PS731 have been
referred as IO202, IO356, IO457 and IO731, respectively.
An ITO substrate without opal structure was also processed
by LPD for use as a reference electrode (referred as TiO2-
coated ITO).
2.1.3 Electrode assembly
TiO2 inverse opal electrodes thus prepared were heated to
200 �C for 10 min using a hot plate (HP-400A, Azuwan
Co). The electrodes were immersed in a 0.3-mM solution
of Chlorine e6 trisodium salt (Fig. 1, Tama Biochemical
Co.)/chenodeoxycholic acid methanol solution at 40 �C for
24 h. After sensitization, the active area of the TiO2 inverse
opals was reduced to 0.25 cm2 by scrapping away excess
material. Parafilm (0.25 cm2) was used as a spacer between
the TiO2 inverse opal electrodes and platinized ITO
(2 cm 9 3 cm). An electrolyte (0.05 M I2/0.1 M LiI/0.5 M
4-tert-Butylpyridine (Tokyo Chemical Industry Co., Ltd)/
0.6 M DMPII (1,2-dimethyl-3- propylimidazolium iodide,
Solaronix) in acetonitrile) was dropped on the active area.
The dye-sensitized electrodes and the platinized ITO sub-
strates were sandwiched with binder clips.
2.2 Material analysis
The electrodes were observed using an optical microscope
(BX60, OLYMPUS) and scanning electron microscope
(SEM, VE9800SP (Keyence Co.) and S4500 (Hitachi,
Ltd.)). The X-ray diffraction (XRD) spectra of the inverse
opals were obtained using an X-ray diffractometer (50 kV,
250 mA, RINT2500 VPC, Rigaku) equipped with a
graphite monochromator using Cu Ka line (k = 1.54 A) at
room temperature. The results were compared with the
database of the Joint Committee on Powder Diffraction
Standards [27]. The thickness of the inverse opal layers
was measured with a laser microscope (OLS4000,
OLYMPUS). Transmittance spectra were collected using
an UV/Vis spectrophotometer (UV650, Jasco). Diffuse
reflectance spectra were measured using a spectrometer
equipped with an integrating sphere attachment (ISV-722,
Jasco).
2.3 Photonic band simulation
Photonic bands were determined by photonic band calcu-
lation software (BandSOLVE, Rsoft Design Group). The
face-centred cubic (fcc) packing structures of the polysty-
rene (n = 1.55) sphere in air (n = 1.00) and the air sphere
in TiO2 (n = 2.54) were calculated. Each path of Brillouin
zone was divided by 9. A Windows computer (Dell
Dimension 8300) was used.
2.4 Photoelectrochemical analysis
2.4.1 I–V measurement
The cell was connected to a potentiostat (HSV-100, Hokuto
Denko Corporation) for I–V curve measurements. These
measurements were obtained with light (AM 1.5) from a
solar simulator (Jasco) on the ITO substrate side of the cell.
The I–V curve measurement was conducted from 0.8 to
-0.1 V (100 mV/s) and was controlled by a potentiostat.
The electrode area was 0.25 cm2.
2.4.2 Electrochemical impedance measurement
The electrochemical impedance spectroscopic (EIS) ana-
lysis was performed using a VersaSTAT 3 electrochemical
impedance system (Toyo) by applying a 10-mV amplitude
Fig. 1 Chemical structure of Chlorine e6 trisodium salt
J Porous Mater (2014) 21:165–176 167
123

signal in the frequency range of 1–10,000 Hz. In the EIS
measurements, the electrodes were same as those for the
I–V measurement.
2.4.3 Measurement of the amount of adsorbed dye
molecules
To spectrophotometrically evaluate the amount of adsorbed
dye molecules on the electrodes, the dye on a known
electrode area was detached by immersion for 5 h in a 0.1-
M NaOH H2O/EtOH (50:50) solution [14] and the
absorption intensity of the resulting dye solution was
measured using a UV/Vis spectrophotometer (JASCO,
V650). The measured intensity was converted into the
concentration of adsorbed dye molecules.
2.4.4 Incident photon-to-current conversion efficiency
(IPCE) measurement
The IPCE spectra were measured as a function of wave-
length from 400 to 800 nm using an IPCE system (SM-
250, Bunkoukeiki), particularly designed for DSSCs. The
light intensity was 5 mW/cm2.
2.4.5 Measurement of fluorescence lifetime spectra
The fluorescence lifetime on the TiO2 electrodes was
determined by transient fluorescence spectra (C7700-ABS-
N, Hamamatsu) particularly designed for DSSCs. A sample
was excited using nanosecond optical pulses (4 ns width
and 532 nm wavelength), generated using a Nd:YAG laser.
The number of scans was 3000.
3 Results and discussion
To discuss this complicated phenomena, firstly, we would
like to show our inverse opals quality in Sect. 3.1. After
showing our inverse opal’s structure, the optical measure-
ment spectra were shown in Sects. 3.2 and 3.3, and com-
pared with the calculated photonic band diagram. The solar
cell’s characteristics using these measured inverse opals
were introduced in Sects. 3.4–3.7. The fluorescence life-
time was reported in Sect. 3.8, and all results were dis-
cussed in the following Conclusion.
3.1 Quality of polystyrene opals and inverse opals
The visual images of prepared polystyrene opals are shown
in Fig. 2. Each polystyrene opal shows structural colours,
i.e. blue, green, red and white for PS202, PS356, PS457
and PS731, respectively. The white colour shown in PS731
might be caused by Mie scattering because the diameter of
PS731 is larger than the visible wavelength. The number of
layers of these opals was almost same.
The exfoliation of the opals was observed when they were
dipped in the titanium solution for LPD. In particular, PS202
and PS457 were easily exfoliated from the substrate and
formed microfibres during the subsequent drying process
[28]. The aqueous particle suspensions had minimal sur-
factant; therefore, the surfactant effect on the exfoliation
could be ignored. It is considered that the fibre structure was
formed by the shrinking of particles’ homogeneous films
such as PS202 and PS457. The improvement of the coales-
cent process would prevent the exfoliation of the opals.
A large number of cracks were generated on the surface
of PS202 and PS457 during the drying phase of the LPD
Fig. 2 Optical microscopic
images of opals fabricated from
202 nm- (a), 356 nm- (b),
457 nm- (c) and 731 nm- (d) PS
spheres. Each scale bar
indicates 5 mm
168 J Porous Mater (2014) 21:165–176
123
seeding step. The reason of these cracks might be also the
shrinking of particles’ homogeneous films.
After sintering, the samples formed inverse opal struc-
tures that reflected each original opal’s structure (Fig. 3). It
is clear that the polystyrene particles we used were dense
enough to fabricate our inverse opals. The SEM images
revealed that the diameters of TiO2 inverse opals were
10 % less than those of original opals; the diameters of
IO202, IO356, IO457 and IO731 became 180, 330, 400 and
680 nm, respectively. It is assumed that the shrinkage was
caused by the change in polystyrene particles’ volume
during calcination, as often reported [29]. The SEM images
also revealed that our inverse opals have some defects. It is
reported that, even though the opals could not avoid from
defects, the change of photon group velocity was observed
if the periods was over 10 [30].
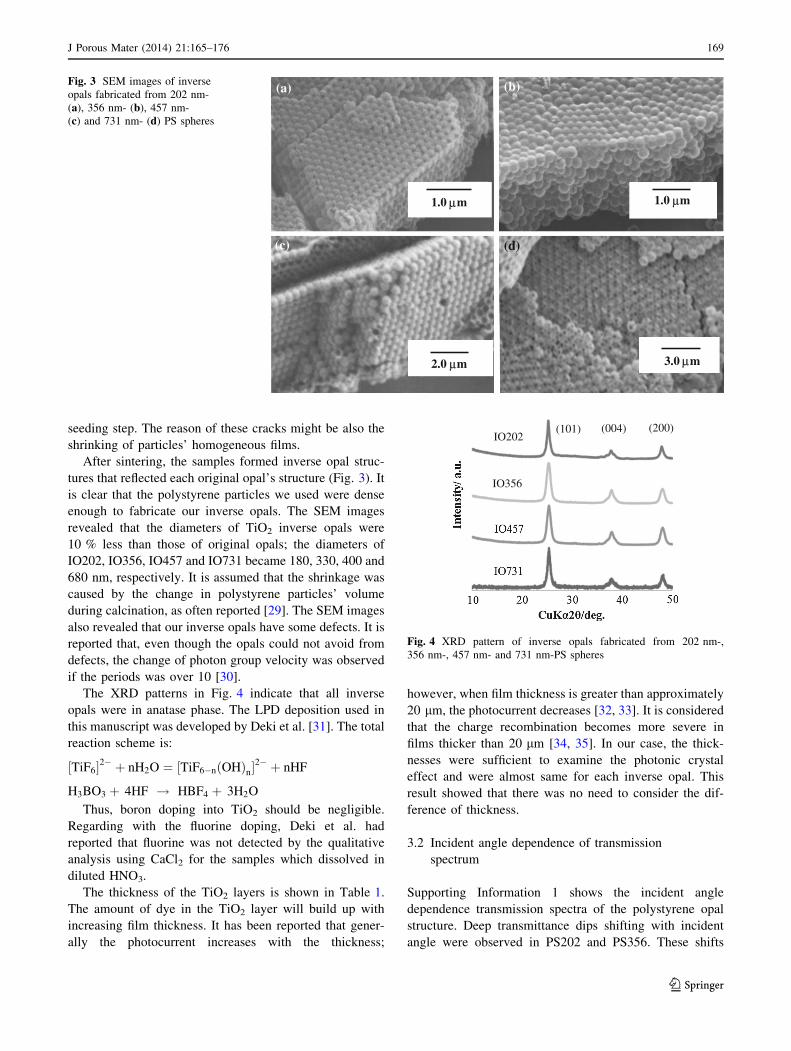
The XRD patterns in Fig. 4 indicate that all inverse
opals were in anatase phase. The LPD deposition used in
this manuscript was developed by Deki et al. [31]. The total
reaction scheme is:
½TiF6�2� þ nH2O ¼ ½TiF6�nðOHÞn�2� þ nHF
H3BO3 þ 4HF ! HBF4 þ 3H2O
Thus, boron doping into TiO2 should be negligible.
Regarding with the fluorine doping, Deki et al. had
reported that fluorine was not detected by the qualitative
analysis using CaCl2 for the samples which dissolved in
diluted HNO3.
The thickness of the TiO2 layers is shown in Table 1.
The amount of dye in the TiO2 layer will build up with
increasing film thickness. It has been reported that gener-
ally the photocurrent increases with the thickness;
however, when film thickness is greater than approximately
20 lm, the photocurrent decreases [32, 33]. It is considered
that the charge recombination becomes more severe in
films thicker than 20 lm [34, 35]. In our case, the thick-
nesses were sufficient to examine the photonic crystal
effect and were almost same for each inverse opal. This
result showed that there was no need to consider the dif-
ference of thickness.
3.2 Incident angle dependence of transmission
spectrum
Supporting Information 1 shows the incident angle
dependence transmission spectra of the polystyrene opal
structure. Deep transmittance dips shifting with incident
angle were observed in PS202 and PS356. These shifts
(c) (d)
(b)
(c) (d)
1.0 m 1.0 m
2.0 m 3.0 m
(a)
μ
μμ
μ
Fig. 3 SEM images of inverse
opals fabricated from 202 nm-
(a), 356 nm- (b), 457 nm-
(c) and 731 nm- (d) PS spheres
(200)IO202
IO356
(101) (004) (200)
Fig. 4 XRD pattern of inverse opals fabricated from 202 nm-,
356 nm-, 457 nm- and 731 nm-PS spheres
J Porous Mater (2014) 21:165–176 169
123
were caused by Bragg diffraction. The theoretical wave-
length of the first-order Bragg diffraction peak can be
simulated using the average refractive index, as shown in
Eq. (1):
kmax ¼ 2d
ffiffiffiffiffiffiffiffiffiffiffiffiffiffiffiffiffiffiffiffiffiffiffiffiffiffiffiffiffiffiffi
n2s f þ n2
vð1� f Þq
ð1Þ
where kmax is the transmittance dip wavelength, ns is the
refractive index of polystyrene (1.38), nv is the refractive
index of air (1.0), f is the filling fraction of polystyrene (ca.
0.74 for fcc packing) and d is the period of the structure
(ca. 0.81 9 particle diameter for our structure). The cal-
culated transmittance dips according to Eq. (1) were 453,
800, 1,026 and 1643 nm for PS202, PS356, PS457 and
PS731, respectively.
The experimental transmittance dip wavelengths of
PS202 and PS356 fit well with the calculated values. No
large dips were observed in the transmittance spectra of
PS457 and PS731 because the expected dips were posi-
tioned out of our evaluation range. Here we should mention
that, in PS457, the transmittance dips around 500 nm
showed incident angle dependence that is a specific char-
acteristic of Bragg diffraction. We consider that these dips
around 500 nm were due to second-order Bragg
diffraction.
The incident angle dependence of the transmission
spectra of TiO2 inverse opals is shown in Supporting
Information 2. The dips of the spectra of TiO2 inverse opals
were less sharp than those of the original opals. This lack
of sharpness may be due to periodical disorder. TiO2-
coated ITO showed no specific dips in the measurement
range (Supporting Information 2a). The observed trans-
mission dips around 500 and 550 nm for IO202 and IO356,
respectively, were shifted by the incident angles. This
result showed that these dip were caused by Bragg dif-
fraction. Similar to the transmittance spectra of PS457 and
PS731, no transmission dip were observed for IO457 and
IO731 because the expected dips were also positioned out
of our evaluation range. The transmission dips of the
inverse opals became smaller than those of the original
opals, probably because of the increase of defects created
during the LPD process.
3.3 Diffuse reflectance spectra and photonic band
diagrams
The diffuse reflectance spectra of the original opals and
unsensitised TiO2 inverse opals are shown in Fig. 5. The
diffuse reflectance spectra include the experimental
reflectance from all directions of the substrate; therefore, a
comparison with calculated photonic band diagrams is
possible. The reflectance peaks related to the periodic
structures were observed for each inverse opal structure but
were not observed for TiO2-coated ITO substrates.
As shown in Fig. 5a, sharp reflectance peaks were observed
for PS202, PS356 and PS457. In general, opals prepared under
gravity form fcc structures. The SEM images (Fig. 3) of
inverse opals suggest that our original opals were a fcc
arrangement of monodispersed polystyrene spheres with the
close-packed plane (111) oriented parallel to the underlying
glass substrate. Thus, the diffuse reflectance spectra repre-
sented all reflected light from the (111) plane, i.e. the photonic
bands along the C–L and L–X directions. The diffuse reflec-
tance peak was positioned around a quasi bandgap in the
photonic band diagram as shown in broken arrows (Fig. 5c).
The parameters for the photonic band diagram are the
refractive indices and the normalized frequency, that is
defined as (the periodicity of the structure a)/(the light
wavelength k). Thus, we can compare each structure in the
same photonic band diagram. The experimental result is in
good agreement with the calculation. The low transmittance
of PS731 in the overall wavelength measurement might be due
to Mie scattering as previously discussed in the section on the
quality of polystyrene opals and inverse opals.
As shown in Fig. 5b, the lack of sharpness of the diffuse
reflectance spectra might be due to periodical disorder, as
discussed in the previous section. Miyazaki and Ohtaka had
revealed that, even in two-dimensional colloidal crystal
composed of polyvinyltoluene particles (the refractive
index = 1.6), the spectrum for the colloidal crystal with 6
periods had well-developed dips and was similar to the
calculated result for an infinite lattice [30]. The inverse
opal has a larger photon confinement efficiency than the
opal has, and, our inverse opal showed more than 10 layers
in one domain. We believe that our comparison between
theoretically obtained photonic band diagrams and exper-
imental data give us valid knowledge. The normalized
frequency was calculated by the diameters of the air sphere
of inverse opals, i.e. smaller diameters than the original
polystyrene particle diameters, as shown in Fig. 5d. Since
our inverse opals are composed of TiO2, incident light less
than 400 nm wavelength are absorbed. Thus we could not
compare our experimental spectra with our calculated
photonic band diagram with the view point of photonic
crystal, and we decided not to show our experimental
Table 1 Thickness of the TiO2 layers
TiO2 layer Thickness/lm
TiO2-coated ITO 5.7 ± 0.3
IO202 7.1 ± 0.1
IO356 6.6 ± 0.3
IO457 6.2 ± 0.1
IO731 6.1 ± 0.1
170 J Porous Mater (2014) 21:165–176
123

spectra less than 420 nm in Fig. 5d. The diffuse reflectance
dips of IO356 and IO457 at 0.7 (showed as a translucent
square in Fig. 5d) are in good agreement with the calcu-
lated photonic bandgap at C. The reflectance peak of IO202
was at a lower frequency than those of IO356 and IO431.
This may be due to a large component of air in the structure
produced by the particle exfoliation, as previously descri-
bed in the section on polystyrene and inverse opal quality
that resulted in an average refractive index lower than the
estimated value. As a result, the reflectance peak may have
been observed on the normalized frequency lower than the
calculated value. For IO731, the observed broad peak
reflected the quasi gap near C point.
From the above results, it can be said that our inverse
opals’ periodicity was sufficient for a photonic crystal in
this observation wavelength range.
3.4 I–V measurement
The TiO2 layer has an important role as an electron trans-
portation medium [36–39]. The I–V curve of TiO2 inverse
opals with various particle diameters is shown in Fig. 6a, and
(c)
0
0.5
1
1.5
2
2.5
020406080100
Nor
mal
ized
fre
quen
cy (
a/λ)
Diffusion reflectance/ %
(a) (b)
Nor
mal
ized
fre
quen
cy (
a/λ)
0
0.5
1
1.5
2
2.5
20304050N
orm
aliz
ed f
requ
ency
(a/λ
)Diffusion reflectance/ %
15
20
25
30
35
40
45
50
400 600 800
Dif
fusi
on R
efle
ctan
ce/%
wavelength/nm
0
10
20
30
40
50
60
70
80
400 600 800
Dif
fusi
on r
efle
ctan
ce/ %
wavelength/ nm
Nor
mal
ized
fre
quen
cy (
a/λ)
(d)
Fig. 5 Diffusion reflectance
spectra (a, b), photonic band
diagrams and normalized
diffusion reflectance spectra (c,
d) of opals (a, c) and inverse
opals (b, d) fabricated from
202 nm- (grey line), 356 nm-
(grey dotted line), 457 nm-
(black line) and 731 nm- (black
dotted line) PS spheres. The
spectra of ITO and TiO2-coated
ITO (grey dashed line) are also
shown in a, b. The fcc Brillouin
zone is shown in the inset
J Porous Mater (2014) 21:165–176 171
123

the solar cell characteristics are shown in Table 2. Here
Chlorine e6 derived from chlorophyll origin dye and having
a long fluorescence lifetime was used. A photoelectric con-
version efficiency of 0.4 % has been reported for a system
that used Chlorine e6 in a DSSC cell with P25 and an iodine-
based electrolyte [40]. Photoelectric conversion efficiencies
that exceeded those reported were attained with IO356 and
IO457. Jsc became maximum in IO356 and decreased as the
particle diameter increased. The absorption wavelength
range of Chlorine e6 is 400–700 nm. The integration value of
the diffuse reflectance at this range increased as the particle
diameter increased, as shown in Fig. 5b. This larger reflec-
tion of incident light may cause the Jsc to become small. The
Jsc is also discussed in relation to the amount of dye
adsorption and an electrochemistry impedance result in the
latter sections. The relationship between Voc and the size of
pores in inverse opals was not convincing. In general, it is
supposed that Voc is dependent on the constituent materials in
a battery. As shown in Fig. 4, the inverse opals that we
produced were almost electrochemically homogeneous
anatase. The increase of F.F. was almost proportional to the
increase in the diameter of the pores in the inverse opals.
Although our results do not provide sufficient evidence to
confidently assert that the size of the pores is a determining
factor for F.F., it is supposed that F.F. will become so small
that the resistance component in a conductive substrate will
be large. In our case, the interaction of a substrate and a TiO2
inverse opal may have contributed to the improvement in the
F.F. This will be discussed in relation to the electrochemistry
impedance measurement results presented below.
3.5 Electrochemical impedance analysis
The Nyquist plots of various TiO2 inverse opals are pre-
sented in Fig. 7a. The total resistance of our system was
larger than that reported by other researchers because we
(b)
0
0.5
1
1.5
2
0 0.1 0.2 0.3 0.4 0.5 0.6 0.7Ph
oto
curr
ent d
ensi
ty /m
AVoltage (V)
(d)
IPC
E /%
Int.
IP
CE
/%
Int.
IP
CE
per
dye
/%/n
mol
(a)
(c)
Fig. 6 I–V curve (a), IPCE
spectra (b), internal IPCE
spectra (c) and normalized
internal IPCE spectra by the
amount of adsorbed dye (d) of
inverse opals fabricated from
202 nm- (grey line), 356 nm-
(grey dotted line), 457 nm-
(black line) and 731 nm-(black
dotted line) PS spheres. The
spectra of TiO2-coated ITO
(grey dashed line) are also
shown
Table 2 Photovoltaic parameters of dye-sensitized solar cells con-
taining TiO2 layers
TiO2
layer
Jsc
(mA/
cm2)
Voc
(V)
F.F. g(%)
Amount of
adsorbed dye
(nmol)
Normalized
g (%/nmol)
TiO2-
coated
ITO
0.45 0.64 0.52 0.14 2.13 0.066
IO202 0.68 0.68 0.55 0.28 4.37 0.064
IO356 1.35 0.65 0.58 0.58 5.17 0.112
IO457 1.16 0.66 0.6 0.43 6.32 0.068
IO731 0.26 0.65 0.61 0.10 4.13 0.024
172 J Porous Mater (2014) 21:165–176
123

used Chlorine e6. The results were fitted to the DSSC
circuit model and each resistance component was analysed
(Fig. 7b). The resistance component of a DSSC consists of
two or more factors such as an ITO substrate, dye, TiO2
and an electrolyte solution. The various applications of
electrochemical impedance measurements to DSSCs have
been performed and there are also numerous reports of
equivalent circuits for the separation of the resistive com-
ponent [41–43]. In this experiment, we used the equivalent
circuit reported by Eguchi et al. [44], which enables each
resistance component of DSSCs to be discussed in detail.
Five resistance components are considered. R0 is the
resistance of the ITO substrate. R1 at 104–103 Hz is the
resistance of the substrate/TiO2 interface. R2 at 103–102 Hz
is the contact resistance between TiO2 interfaces. R3 at 101
Hz is the resistance of the Pt/electrolyte interface and the
electrolyte/dye/TiO2 interface. R4 at 100 Hz is the diffusion
resistance of the electrolyte. Here we should mention that it
was not easy to separate R3 and R4 in our system.
R1 and R2 became smaller in particles with larger
diameters. This trend might be because of the wider contact
area between TiO2 and the substrate for R1 and TiO2 par-
ticles for R2 in particles with larger pore sizes. R3 and R4
became the smallest in IO356. In general, an inverse opal is
considered to stimulate the diffusion of the electrolyte
solution. In IO356, it is considered that electron injection
into titanium oxide is promoted at the TiO2/electrolyte
interface, probably because of the larger interface area, and
leads to the decline of R4 and R3. A possible reason for
large R3 and R4 in IO731 is that the thicker shell of IO731
prevents diffusion of the electrolyte inside the pores, as can
be seen from the SEM images presented in Fig. 3.
These impedance results can elucidate the general
characteristics of a solar cell in relation to pore size. It is
considered that the increase of F.F. is due to the R2 and R3
values. This is because these resistances also increased in
relation to pore size. IO356 showed the maximum Jsc in the
system because IO356 had the lowest resistance of R3 and
R4. The following sections will elaborate on these elec-
trochemical results.
3.6 Measurement of the dye adsorption amount
Table 2 shows the estimated amount of dye adsorbed on
various TiO2 layers. Because these inverse opals have
approximately the same film thickness, when particle
diameter increases, the quantity of TiO2 decreases, i.e. dye
adsorption sites should decrease. However, in our experi-
ment, IO457 showed the largest amount of adsorbed dye. The
adsorption of the dye was performed by soaking the inverse
opals in an ethanol solution overnight. It is unlikely that the
dye ethanol solution did not permeate pores larger than
180 nm. The Pore size was probably not a dependent factor.
It is more likely that the dye solution did not enter the pores
because of the thickness of the walls of inverse opals. This
conclusion is supported by the large R4 in IO731.
3.7 Incident photon-to-electron conversion efficiency
Figure 7b shows the IPCE results of various TiO2 inverse
opals. The photoelectric conversion efficiency is the lowest
in IO731 and highest in IO356. These IPCE results are
consistent with the results of the I–V measurements and
include the effect of light reflected from the surface of the
DSSC. Thus, the internal quantum efficiency was deter-
mined by the diffuse reflectance spectra (Fig. 6c).
The internal quantum efficiency at 670 nm of IO202 and
IO356 was largely declined compared with those of other
electrodes. This result confirmed that the diffuse reflec-
tance of the long wavelength region of IO202 and IO356
was low (Fig. 5). The overall trend due to changes in
R0
R1
R2
R3
R4
(b)
(a)
Fig. 7 Cole-cole plots (a) and resistance elements (b) of IO202 (grey
line, square), IO356 (grey dotted line, triangle), IO457 (black line,
diamond) and IO731 (black dotted line, circle). The spectra of TiO2-
coated ITO (grey dashed line, times symbol) are also shown. R0,
resistance at substrate; R1, resistance at substrate/TiO2 interface; R2,
resistance between TiO2 particles; R3, resistance at Pt/electrolyte
interface and electrolyte/dye/TiO2 interface; R4, diffusion resistance
of the electrolyte
J Porous Mater (2014) 21:165–176 173
123

particle size was almost same for the external quantum
efficiency.
The internal quantum efficiency per one dye molecule,
i.e. the internal quantum efficiency divided by the amount
of adsorbed dye, is shown in Fig. 6d. Unlike other IPCE
spectra (Fig. 6b, c), the particle size that indicates maxi-
mum efficiency was different with different incident
wavelengths. The absorption peaks of 400 nm in IO731,
500 nm in IO202 and IO457 and 670 nm in IO202 show
maximum efficiency. In addition, the internal quantum
efficiency of IO202 was less than TiO2-coated ITO at
wavelengths above 450 nm. As the reason of this incident
wavelength dependence of internal quantum efficiency per
one dye molecule, the scattering effect of incident light in
the inverse opal layer and/or any changes in electron
injection efficiency from the dye to titanium oxide caused
by any specific effect were conceivable.
First, we consider the scattering effect of incident light.
Mie theory [45, 46] and Anderson localisation of light [47]
can analytically describe the scattering of light by spherical
particles. Ferber et al. [48] simulated light scattering effects
in DSSC using Mie theory and the radiative transfer
equation. Effective Mie scatters are observed for particles
with sizes in the range of visible light wavelengths. In other
words, the larger scattering intensity of long wavelengths
was observed in larger particles. In our results, the internal
quantum efficiency per mole of dye with small particle size
was improved for longer incident light wavelengths, i.e. the
scattering effect of incident light was not the cause of this
incident wavelength dependence. Rayleigh scattering that
is adapted to fine particles in light scattering is also rele-
vant. It is thought that the primary particle diameter of
titanium oxide that constitutes an inverse opal did not
significantly change among our inverse opals. Therefore,
Rayleigh scattering is also not considered to be the cause of
this incident wavelength dependence. It is possible that the
electron injection efficiency from the dye to titanium oxide
was changed for any reason as discussed below.
3.8 Fluorescence lifetime measurement
To explain the incident light wavelength dependency,
fluorescence lifetime measurement was performed. The
wavelength for the measurement of fluorescence lifetime
was set to 675 nm, which is the wavelength of maximum
emission of Chlorine e6. The photocurrent was not
increased during this measurement. If the fluorescence of
the dye was influenced by a particular characteristic of the
photonic crystal, the extension of fluorescence lifetime at
675 nm should be evident. The sensitive dependencies of
the radiative lifetime of CdTe quantum dots [49] and
Rhodamine 6G [50] have already demonstrated the effect
of the quasi photonic bandgap on the spontaneous emission
in self-assembled photonic crystals. The fluorescence
decay curve is shown in Fig. 8a. The fluorescence lifetime
was divided into a short life component (s1) and longer life
component (s2). Previous research has revealed that s1
(approximately 0.4 ns) was the component injected into the
conduction band of TiO2 as electrons and s2 (3–4 ns) was
the component that relaxed to steady state in the dye [9].
Our fluorescence lifetime results are shown in Fig. 8b. s1
did not change in relation to the particle size. Because s1 had
a short lifetime of approximately 0.3 ns, it is thought that the
contribution of this external factor was small. In contrast, s2
decreased in IO356 and increased in IO457. To consider the
contribution of photonic crystals to the change in this life-
time, the emission wavelength was compared with the pho-
tonic band diagram (Fig. 4b). In our system, the normalised
frequency corresponding to the particle diameter in the first
fluorescence wavelength peak (k = 675 nm) of Chlorine e6
was approximately 0.2, 0.35, 0.55 and 0.8 for IO202, IO356,
IO457 and IO731, respectively, i.e. in IO457, the fluorescent
wavelength hits the quasi photonic band gap with a small
(a)
(b)
Fig. 8 Time-resolved emission profiles (a) and change in fluorescence
lifetime constant (b) of s1 (diamond) and s2 (square) components of
dye-sensitized electrodes fabricated from IO202 (grey line), IO356
(grey dotted line), IO457 (black line) and IO731 (black dotted line). The
spectra of TiO2-coated ITO (grey dashed line) are also shown. The error
bars show statistical standard errors
174 J Porous Mater (2014) 21:165–176
123

slope in the normalised frequency of approximately 0.5. The
state density of photon should be smaller near the band gap
[51]. The low local density of photon states is generally
causes low emission rate thus longer lifetime. It might be
possible that the increased fluorescence lifetime was due to
the photonic band. In addition, the error bars for s1 and s2 in
IO457 were larger than those for other electrodes. The
photonic band effect on a photon decreases because of the
disorder of structure periodicity. Because a self-assembled
photonic crystal includes random defects, the error bars in
IO457 might have become large because of the random
magnitude of the photonic band effects. On the other hand,
on the normalised frequency of 0.35 corresponding to IO356,
the dispersion relation showed monotone increase and the
error bars in the fluorescence lifetime is small. It is expected
that the contribution to the fluorescence lifetime by a pho-
tonic band was small. The reasons for the small s2 in IO356
are expected to be factors other than photonic band.
4 Conclusion
We expected the fluorescence inhibition effect of the dye in a
self-assembled photonic crystal. We prepared TiO2 inverse
opals of various particle sizes by LPD and explored the
effects of inverse opals on DSSCs from the perspective of
structure, optical properties, electrochemical properties and
fluorescence lifetime measurements in relation to the amount
of adsorbed dye and compared with the photonic band dia-
gram. Chlorine e6, a dye derived from chlorophyll, that has a
long excited electron lifetime was used for this purpose.
A previous study of DSSCs incorporating an inverse opal
primarily considered the harvesting effect of the incident
light [12]. Miguez et al. [13] suggested that photoelectric
conversion efficiency could be improved by utilising an
inverse opal with a particle size of approximately 200 nm.
However, we found that IO356 exhibited the highest overall
photoelectric conversion efficiency and the highest photo-
electric conversion efficiency per one dye molecule. IO356
has low resistance, particularly for the diffusion resistance of
the electrolyte and contact resistance between TiO2 inter-
faces. In addition, the higher internal quantum efficiency per
one dye molecule and the incident light wavelength depen-
dence were confirmed in IO457, in spite of the fact that the
magnitude of the electrical resistance was almost the same as
IO202. In IO457, because the extension of fluorescence
lifetime by a photonic band was evident, it is possible that the
photonic band influenced the internal quantum efficiency per
one dye molecule. Here we should mention that, the nor-
malized efficiency of IO457 was only about 60 % of that of
IO356. The effect on the photon-to-electron conversion
efficiency per one molar dye seems less than the effect of the
electric resistance in our system.
We consider that the differences between our results and
those of previous researchers are because of the use of
Chlorine e6, a naturally-occurring, chlorophyll derived dye
that is known to have a long fluorescence lifetime. In
addition, as evidenced by the excitation and fluorescence
spectra of the dye, almost all absorbed light in a wide
wavelength range was converted to a first peak emission
(Supporting Information 3). Therefore, compared with the
ruthenium dyes used by other researchers, our DSSC was
susceptible to the structure of the photonic crystal. It
should be noted that in Yu et al., the unexpectedly high
scattering efficiency of the 450-nm TiO2 spheres was
ascribed to the characteristic photonic reflection effect
originating from the sphere’s uniform size and long-range
ordering using N719 dye adsorbed on submicron-sized
monodispersed TiO2 spheres [34]. One possibility is that
more excited electrons in the dye may have enabled the
extension of the lifetime by the photonic band, which, in
turn, might move to the conduction band of titanium oxide.
As a result, the internal quantum efficiency per 1 mol of
dye may have improved. A detailed verification of this
assumption cannot be performed for a self-assembled
photonic crystal with many defects. Such verification
would require a dye sensitizing electrode with a full/com-
plete photonic bandgap [52]. In future, we will also con-
duct the electron lifetime measurements in a DSSC and
examine the results.
Acknowledgments The authors would like to thank Mr. Yohey
Shibuya, Ms. Miho Kawai, Mr. Ryota Watanabe and Mr. Nobuhisa
Hikichi for their valuable help. This work was partly supported by the
Kazuchika Okura Memorial Foundation, Murata Science Foundation,
and JSPS KAKENHI Grant Number 25420707.
Open Access This article is distributed under the terms of the
Creative Commons Attribution License which permits any use, dis-
tribution, and reproduction in any medium, provided the original
author(s) and the source are credited.
References
1. B. O’Regan, M. Gratzel, Nature 353(6346), 737–740 (1991)
2. K. Kalyanasundaram, Dye-sensitized solar cells (CRC Press,
Lausanne, 2010)
3. A. Hagfeldt, G. Boschloo, L. Sun, L. Kloo, H. Pettersson, Chem.
Rev. 110(11), 6595–6663 (2010)
4. A. Yella, H.-W. Lee, H.N. Tsao, C. Yi, A.K. Chandiran, M.K.
Nazeeruddin, E.W.-G. Diau, C.-Y. Yeh, S.M. Zakeeruddin, M.
Gratzel, Science 334(6056), 629–634 (2011)
5. Y. Liu, H. Lin, J.T. Dy, K. Tamaki, J. Nakazaki, D. Nakayama, S.
Uchida, T. Kubo, H. Segawa, Chem. Commun. 47(13), 4010–
4012 (2011)
6. Y. Hao, X. Yang, M. Zhou, J. Cong, X. Wang, A. Hagfeldt, L.
Sun, ChemSusChem 4(11), 1601–1605 (2011)
7. J.-E. Moser, W.M.F. Lenzmann, M. Graetzel, Z. Phys. Chem.
212, 85–92 (1999)
J Porous Mater (2014) 21:165–176 175
123
8. G. Calogero, G. Di Marco, S. Caramori, S. Cazzanti, R. Argazzi,
C.A. Bignozzi, Energy Environ. Sci. 2(11), 1162 (2009)
9. A. Kay, R. Humphry-Baker, M. Graetzel, J. Phys. Chem. 98(3),
952–959 (1994)
10. S. Nishimura, N. Abrams, B.A. Lewis, L.I. Halaoui, T.E. Mal-
louk, K.D. Benkstein, J. van de Lagemaat, A.J. Frank, J. Am.
Chem. Soc. 125(20), 6306–6310 (2003)
11. L.I. Halaoui, N.M. Abrams, T.E. Mallouk, J. Phys. Chem. B
109(13), 6334–6342 (2005)
12. S.-H.A. Lee, N.M. Abrams, P.G. Hoertz, G.D. Barber, L.I. Ha-
laoui, T.E. Mallouk, J. Phys. Chem. B 112, 14415–14421 (2008)
13. A. Mihi, F.J. Lopez-Alcaraz, H. Mıguez, Appl. Phys. Lett. 88,
193110 (2006)
14. A. Mihi, H. Mıguez, J. Phys. Chem. B 109(33), 15968–15976
(2005)
15. C.-A. Tao, W. Zhu, Q. An, G. Li, J. Phys. Chem. C 114(23),
10641 (2010)
16. L. Liu, S.K. Karuturi, L.T. Su, A.I.Y. Tok, Energy Environ. Sci.
4(1), 209–215 (2011)
17. S. Guldin, S. Huttner, M. Kolle, M.E. Welland, P. Muller-Bus-
chbaum, R.H. Friend, U. Steiner, N. Tetreault, Nano Lett. 10(7),
2303–2309 (2010)
18. E.S. Kwak, W. Lee, N.-G. Park, J. Kim, H. Lee, Adv. Funct.
Mater. 19(7), 1093–1099 (2009)
19. J.-H. Shin, J.H. Moon, Langmuir 27(10), 6311–6315 (2011)
20. D.-J. Yang, S.-C. Yang, J.-M. Hong, H. Lee, I.-D. Kim, J.
Electroceram. 24(3), 200–204 (2010)
21. J.T. Park, E.K. Roh, R. Patel, K.J. Son, W.-G. Koh, J.H. Kim,
Electrochim. Acta 56(1), 68–73 (2010)
22. S.I. Matsushita, N. Fukuda, M. Shimomura, Colloids Surf. A
257–258, 15–17 (2005)
23. M. Shimomura, S. Matsushita, N. Fukuda, Japan (2005)
24. S. Matsushita, S. Fujikawa, S. Onoue, T. Kunitake, M. Shi-
momura, Bull. Chem. Soc. Jpn. 80(6), 1226–1228 (2007)
25. Y. Yagi, S.I. Matsushita, D.A. Tryk, T. Koda, A. Fujishima,
Langmuir 16(3), 1180–1184 (2000)
26. S. Matsushita, C. Nishiyama, G. Kato, A. Nakajima, T. Isobe, T.
Hashimoto, J. New Mat. Electr. Syst. 14, 229 (2011)
27. A. Buffaz, E. Oikawa, T. Hashimoto, S. Matsushita, J Nanosci
Nanotecnol 9, 185–189 (2009)
28. T. Sawadaishi, M. Shimomura, Mol. Cryst. Liq. Cryst. 464,
227–231 (2007)
29. F. Sordello, V. Maurino, C. Minero, J. Mater. Chem. 21(47),
19144–19152 (2011)
30. H.T. Miyazaki, H. Miyazaki, K. Ohtaka, T. Sato, J. Appl. Phys.
87(10), 7152–7158 (2000)
31. S. Deki, Y. Aoi, O. Hiroi, A. Kajinami, Chem. Lett. 25, 433–434
(1996)
32. J.-H. Yum, E. Baranoff, F. Kessler, T. Moehl, S. Ahmad, T.
Bessho, A. Marchioro, E. Ghadiri, J.-E. Moser, C. Yi, M.K.
Nazeeruddin, M. Gratzel, Nat. Commun. 3, 631 (2012)
33. Z.-S. Wang, H. Kawauchi, T. Kashima, H. Arakawa, Coord.
Chem. Rev. 248(13–14), 1381–1389 (2004)
34. I.G. Yu, Y.J. Kim, H.J. Kim, C. Lee, W.I. Lee, J. Mater. Chem.
21(2), 532–538 (2011)
35. S. Nakade, Y. Saito, W. Kubo, T. Kitamura, Y. Wada, S. Ya-
nagida, J. Phys. Chem. B 107(33), 8607–8611 (2003)
36. G.K. Mor, K. Shankar, M. Paulose, O.K. Varghese, C.A. Grimes,
Nano Lett. 6(2), 215–218 (2005)
37. M. Law, L.E. Greene, J.C. Johnson, R. Saykally, P. Yang, Nat.
Mater. 4(6), 455–459 (2005)
38. J. Chae, M. Kang, J. Power Sour. 196(8), 4143–4151 (2011)
39. Q. Zhang, K. Park, J. Xi, D. Myers, G. Cao, Adv. Energy Mater.
1(6), 988–1001 (2011)
40. Y. Amao, J. Photochem. Photobiol. A 164(1–3), 47–51 (2004)
41. Q. Wang, J.-E. Moser, M. Gratzel, J. Phys. Chem. B 109(31),
14945–14953 (2005)
42. L. Han, N. Koide, Y. Chiba, T. Mitate, Appl. Phys. Lett. 84(13),
2433 (2004)
43. C. Longo, A.F. Nogueira, M.-A.D. Paoli, H. Cachet, J. Phys.
Chem. B 106(23), 5925–5930 (2002)
44. T. Hoshikawa, M. Yamada, R. Kikuchi, K. Eguchi, J. Electro-
chem. Soc. 152(2), E68 (2005)
45. P.W. Barber, S.C. Hill, Light Scattering by Particles: Computa-
tional Methods (World Scientific, Singapore, 1990)
46. H.C. van de Hulst, Light Scattering by Small Particles (Dover,
New York, 1981)
47. P.-E. Wolf, G. Maret, Phys. Rev. Lett. 55(24), 2696–2699 (1985)
48. J. Ferber, J. Luther, Sol. Energy Mater. Sol. Cells 54(1–4),
265–275 (1998)
49. J.-Y. Zhang, X.-Y. Wang, M. Xiao, Y.-H. Ye, Opt. Lett. 28(16),
1430–1432 (2003)
50. S. Kubo, A. Fujishima, O. Sato, H. Segawa, J. Phys. Chem. C
113(27), 11704–11711 (2009)
51. K. Inoue, M. Wada, K. Sakoda, A. Yamanaka, M. Hayashi, J.W.
Haus, Jpn. J. Appl. Phys. 33(2), L1463–L1465 (1994)
52. S. Matsushita, O. Suavet, H. Hashiba, Electrochim. Acta 55(7),
2398–2403 (2010)
176 J Porous Mater (2014) 21:165–176
123
Related Documents