Populist Budgets and Long Run Growth Felix Rioja Gerhard Glomm Andrew Young School of Policy Studies Wylie Hall Department of Economics Department of Economics Georgia State University Indiana University Atlanta, GA 30303 Bloomington, In 47405 [email protected] [email protected] April 14, 2003 Abstract Latin American economic policy in the 20 th century was often dominated by populist administrations. Populist governments typically advocate large government expenditures and large government debt. While most studies have concentrated on the short-run effects of these policies, this paper analyzes the long-run growth implications. Specifically, we analyze the growth effects of sizeable budget deficits, large government expenditures, and an allocation of expenditures skewed towards transfers. We use a version of the Diamond overlapping-generations model where individuals accumulate physical and human capital. The government provides transfers to the old, public education, infrastructure capital, and utility-enhancing public goods. We calibrate the model to the economy of Brazil. We find that reasonable reallocations from one type of expenditure to another do not have large growth effects. Openness of the economy matters for growth effects. However, when the full expenditure pattern of a non-populist country is imposed, there is growth increase of 0.30 percentage points per year. Due to the power of compounding, such increase can have sizable increases in income per capita of subsequent generations. * We are grateful to Tatsuyu Omori and Dmytro Zhosan for helpful comments and Piriya Pholpirul for research assistance.

Welcome message from author
This document is posted to help you gain knowledge. Please leave a comment to let me know what you think about it! Share it to your friends and learn new things together.
Transcript
Populist Budgets and Long Run Growth
Felix Rioja Gerhard GlommAndrew Young School of Policy Studies Wylie HallDepartment of Economics Department of EconomicsGeorgia State University Indiana UniversityAtlanta, GA 30303 Bloomington, In [email protected] [email protected]
April 14, 2003
AbstractLatin American economic policy in the 20th century was often dominated by populistadministrations. Populist governments typically advocate large government expendituresand large government debt. While most studies have concentrated on the short-run effectsof these policies, this paper analyzes the long-run growth implications. Specifically, weanalyze the growth effects of sizeable budget deficits, large government expenditures,and an allocation of expenditures skewed towards transfers. We use a version of theDiamond overlapping-generations model where individuals accumulate physical andhuman capital. The government provides transfers to the old, public education,infrastructure capital, and utility-enhancing public goods. We calibrate the model to theeconomy of Brazil. We find that reasonable reallocations from one type of expenditure toanother do not have large growth effects. Openness of the economy matters for growtheffects. However, when the full expenditure pattern of a non-populist country isimposed, there is growth increase of 0.30 percentage points per year. Due to the power ofcompounding, such increase can have sizable increases in income per capita ofsubsequent generations.
* We are grateful to Tatsuyu Omori and Dmytro Zhosan for helpful comments and Piriya Pholpirul forresearch assistance.
1
I. Introduction
Populism was a staple of Latin American economic policy in the 20th century.
Populist governments typically advocate large government expenditures whose alleged
purpose is to create employment, increase growth and redistribute wealth. Prior to the
adoption of such policies, a country will have typically experienced stagnation or
recession, which often leads to the emergence of a new, populist government. The
administrations of Allende in Chile (1970-73), Peron in Argentina (1973-76), and Garcia
in Peru (1985-90) are examples of such regimes. These populist administrations have
been short-lived, but recurrent. While initially successful in their goals, populist disregard
for economic constraints (e.g., the budget deficit, money creation, and foreign exchange
constraints) has typically led to crisis, a deep recession, and change of government.
The short run effects of populist policies have been studied in the economic
literature by Dornbusch and Edwards (1990, 1991), Sachs (1989), and Rosenstein-Rodan
(1974), among others. This literature analyses the specific policies adopted, their initial
effects, and the eventual crash. In contrast, our paper focuses on the long-run growth
effects of populist policies which have received much less attention. We concentrate
specifically on the growth effects of government expenditures, taxation, and public debt.1
The paper, however, does not focus on specific populist episodes. In the last thirty years,
several Latin American countries have had sizeable budget deficits, government
expenditures, and an allocation of expenditures skewed away from productive investment
towards transfers. Hence, we could argue that regardless of the political orientation of
various administrations, several Latin American countries have indeed had "populist"
1There are other policies associated with populism like price controls, wage increases, and inflationfinancing that we abstract from.

2
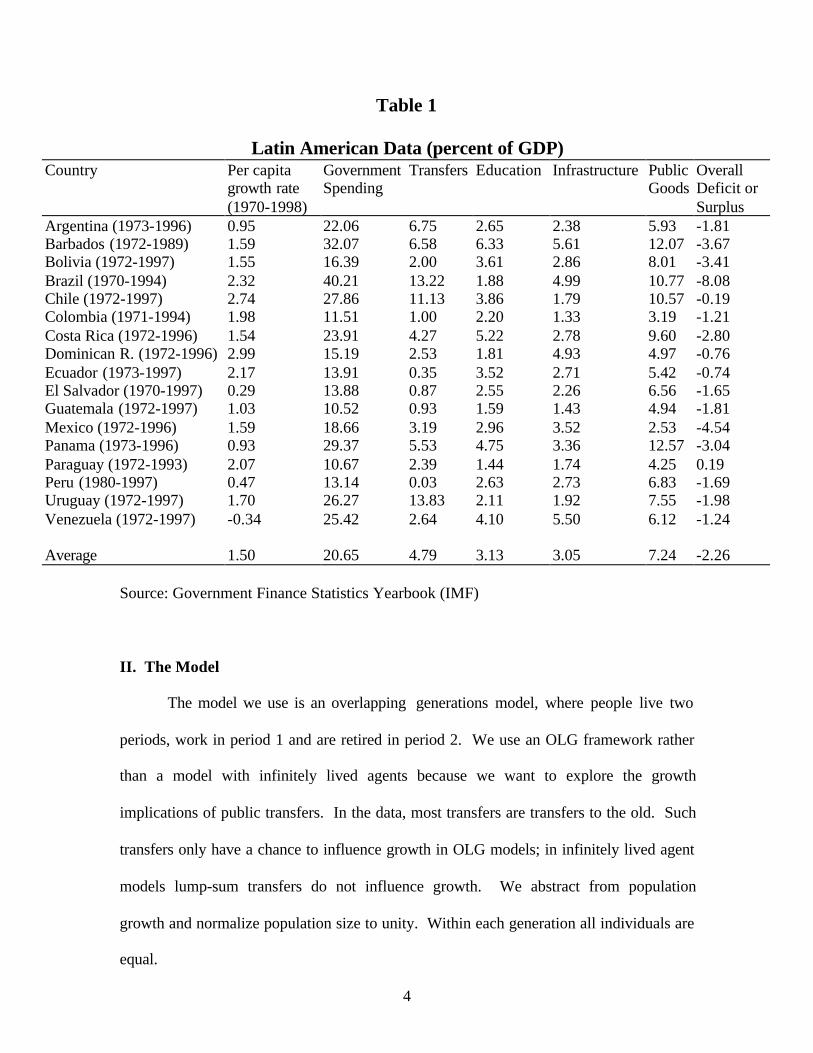
budgets and expenditures over this extended time period. Table 1 presents Latin
American data on government spending and its composition. 2 For example, between
1970 and 1994, Brazil's government spending was on average 40% of the country's gross
domestic product per year. Further, about one-third of this (13% of GDP) was spent on
social security and welfare expenditures, items which are typically emphasized by
populist governments. Brazil's overall budget deficit over the same period was a very
large 8% of GDP, more than three times the Latin American average. Other countries
with similar fiscal pattern are Argentina and Panama. We ask the questions : What is the
effect of such policies on long-run growth? How will future generations be affected?
Conversely, other countries, like the Dominican Republic, display a much
different pattern. According to Table 1, government expenditures in the Dominican
Republic were only 15% of GDP per year over the same period. The Dominican Republic
only spent about 1% of yearly GDP on social security and welfare and had a relatively
small deficit of 0.76% of GDP. Hence, not all Latin American countries have had
"populist" budgets. Other countries with non-populist policies include Colombia and
Costa Rica. Consequently another question of interest is: if Brazil had adopted instead,
for instance, Costa Rican public expenditure patterns, how would have growth been
affected?
We analyze these questions using a version of the Diamond overlapping-
generations model. The single consumption good is produced with physical capital,
human capital and infrastructure. Physical capital is accumulated in the standard way by
savings of the young. New human capital is produced with human capital of the parents
2 The data source is Government Finance Statistics Yearbook (IMF). Data on expenditures comes from"Table B. Expenditure by Function by Consolidated Central Government."

3
and a publicly provided input. In this model, there is a government that collects taxes on
labor and capital income. The tax revenue is used to fund the following public
expenditures: First, there are pure transfer payments to the old. This is like a PAYG
social security system. Second, the government finances public education expenditures,
which enhance the productivity of private inputs in education. Third, the government
funds investment in infrastructure capital such as harbors, airports, and roads. Fourth,
there are utility enhancing public expenditures such as expenditures on public parks or
housing amenities. We allow the government to issue debt.
The model is calibrated to the Brazilian economy. Within the framework of our
model, we perform a variety of policy experiments to study the growth effects of various
fiscal policies. The policy experiments we consider are of the following types. First, we
change the size of the public budget relative to GDP, leaving the composition of the
government budget constant. Second, we change the composition of the government
budget, keeping its size constant. We consider both a closed economy and a small open
economy setting. Much of the previous work on the long run effects of fiscal policies that
not only analyze taxation and government consumption, but also productive public
expenditures, has been done in the context of a closed economy (e.g., Barro (1990),
Baier and Glomm (2001), Baier, Bergstrand and Glomm (2003), Cassou and Lansing
(1998, 2001), Glomm and Ravikumar (1994, 1998), Greiner and Hanusch (1998), Fischer
and Turnovsky (1995) and Rioja (1999)). However, these Latin American countries are
best described as small open economies. We consider both cases for comparison. We find
that openness of the economy matters greatly for the growth effects of fiscal policies.
Moreover, much of the above literature uses the infinitely lived agent framework. Here
we use an OLG model where transfers (to the old) matter for growth.
4
Table 1
Latin American Data (percent of GDP)Country Per capita
growth rate(1970-1998)
GovernmentSpending
Transfers Education Infrastructure PublicGoods
OverallDeficit orSurplus
Argentina (1973-1996) 0.95 22.06 6.75 2.65 2.38 5.93 -1.81Barbados (1972-1989) 1.59 32.07 6.58 6.33 5.61 12.07 -3.67Bolivia (1972-1997) 1.55 16.39 2.00 3.61 2.86 8.01 -3.41Brazil (1970-1994) 2.32 40.21 13.22 1.88 4.99 10.77 -8.08Chile (1972-1997) 2.74 27.86 11.13 3.86 1.79 10.57 -0.19Colombia (1971-1994) 1.98 11.51 1.00 2.20 1.33 3.19 -1.21Costa Rica (1972-1996) 1.54 23.91 4.27 5.22 2.78 9.60 -2.80Dominican R. (1972-1996) 2.99 15.19 2.53 1.81 4.93 4.97 -0.76Ecuador (1973-1997) 2.17 13.91 0.35 3.52 2.71 5.42 -0.74El Salvador (1970-1997) 0.29 13.88 0.87 2.55 2.26 6.56 -1.65Guatemala (1972-1997) 1.03 10.52 0.93 1.59 1.43 4.94 -1.81Mexico (1972-1996) 1.59 18.66 3.19 2.96 3.52 2.53 -4.54Panama (1973-1996) 0.93 29.37 5.53 4.75 3.36 12.57 -3.04Paraguay (1972-1993) 2.07 10.67 2.39 1.44 1.74 4.25 0.19Peru (1980-1997) 0.47 13.14 0.03 2.63 2.73 6.83 -1.69Uruguay (1972-1997) 1.70 26.27 13.83 2.11 1.92 7.55 -1.98Venezuela (1972-1997) -0.34 25.42 2.64 4.10 5.50 6.12 -1.24
Average 1.50 20.65 4.79 3.13 3.05 7.24 -2.26
Source: Government Finance Statistics Yearbook (IMF)
II. The Model
The model we use is an overlapping generations model, where people live two
periods, work in period 1 and are retired in period 2. We use an OLG framework rather
than a model with infinitely lived agents because we want to explore the growth
implications of public transfers. In the data, most transfers are transfers to the old. Such
transfers only have a chance to influence growth in OLG models; in infinitely lived agent
models lump-sum transfers do not influence growth. We abstract from population
growth and normalize population size to unity. Within each generation all individuals are
equal.

5
Each individual’s preferences are given by
(1) 10,10,lnln 111
1 <<<<+ −++
− αββ ααααtttt PcPc .
In equation (1), tc and 1tc + are private consumption goods in periods 1 and 2
respectively and tP and 1tP+ are publicly provided goods in periods 1 and 2, respectively.
We do not insist that tP and 1tP+ are public goods, only that these goods enhance utility
and that they are publicly provided. Examples of such goods we have in mind are
national parks, national holiday celebrations and museums.
The single private consumption good in period t is produced using physical
capital tK , human capital tH , and infrastructure capital tG as inputs, according to the
Cobb-Douglas production
(2) 10,10,0,1 <<<Ψ<>= −Ψ θθθ AHKAGY tttt ,
where tY denotes output in period t.
Human capital is produced according to the Cobb-Douglas production function
(3) 10,10,0,1 <<<<>=+ ρµρµ BhBEh ttt .
According to this production function, future human capital 1th + is produced with current
human capital th and public education expenditures tE . This is a technology that has
been used by Benabou (1996), Fernandez and Rogerson (1998) and Kaganovich and
Zilcha (1999). We do require that 1<+ ρµ . In fact, in order to ensure balanced growth
in this economy, since the production function for final consumption goods exhibits
increasing returns to all augmentable factors, the production function for future human
capital must exhibit just the right degree of decreasing returns. For a similar condition
6
see Baier, Bergstrand and Glomm (2003) and Baier and Glomm (2001). In fact, all
growth models must obey a knife edge condition to ensure balanced growth.
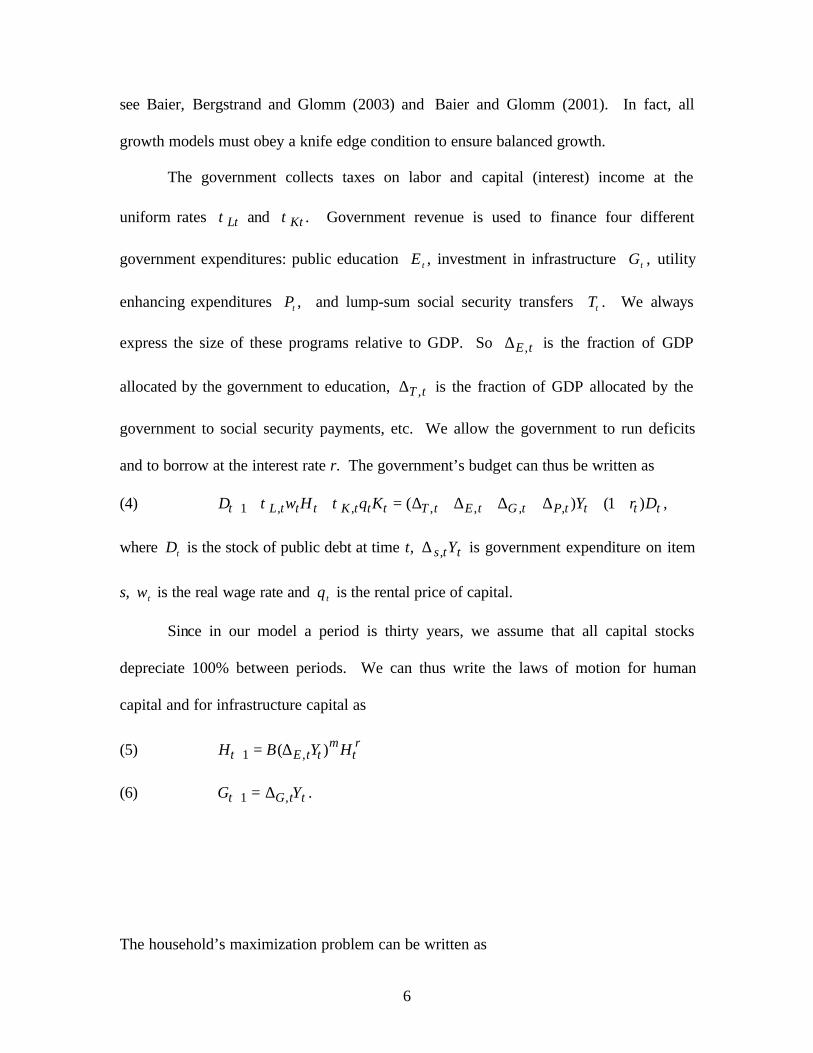
The government collects taxes on labor and capital (interest) income at the
uniform rates Ltτ and Ktτ . Government revenue is used to finance four different
government expenditures: public education tE , investment in infrastructure tG , utility
enhancing expenditures tP , and lump-sum social security transfers tT . We always
express the size of these programs relative to GDP. So tE ,∆ is the fraction of GDP
allocated by the government to education, tT ,∆ is the fraction of GDP allocated by the
government to social security payments, etc. We allow the government to run deficits
and to borrow at the interest rate r. The government’s budget can thus be written as
(4) ttttPtGtEtTtttKtttLt DrYKqHwD )1()( ,,,,,,1 ++∆+∆+∆+∆=+++ ττ ,
where tD is the stock of public debt at time t, tts Y,∆ is government expenditure on item
s, tw is the real wage rate and tq is the rental price of capital.
Since in our model a period is thirty years, we assume that all capital stocks
depreciate 100% between periods. We can thus write the laws of motion for human
capital and for infrastructure capital as
(5) ρµtttEt HYBH )( ,1 ∆=+
(6) ttGt YG ,1 ∆=+ .
The household’s maximization problem can be written as
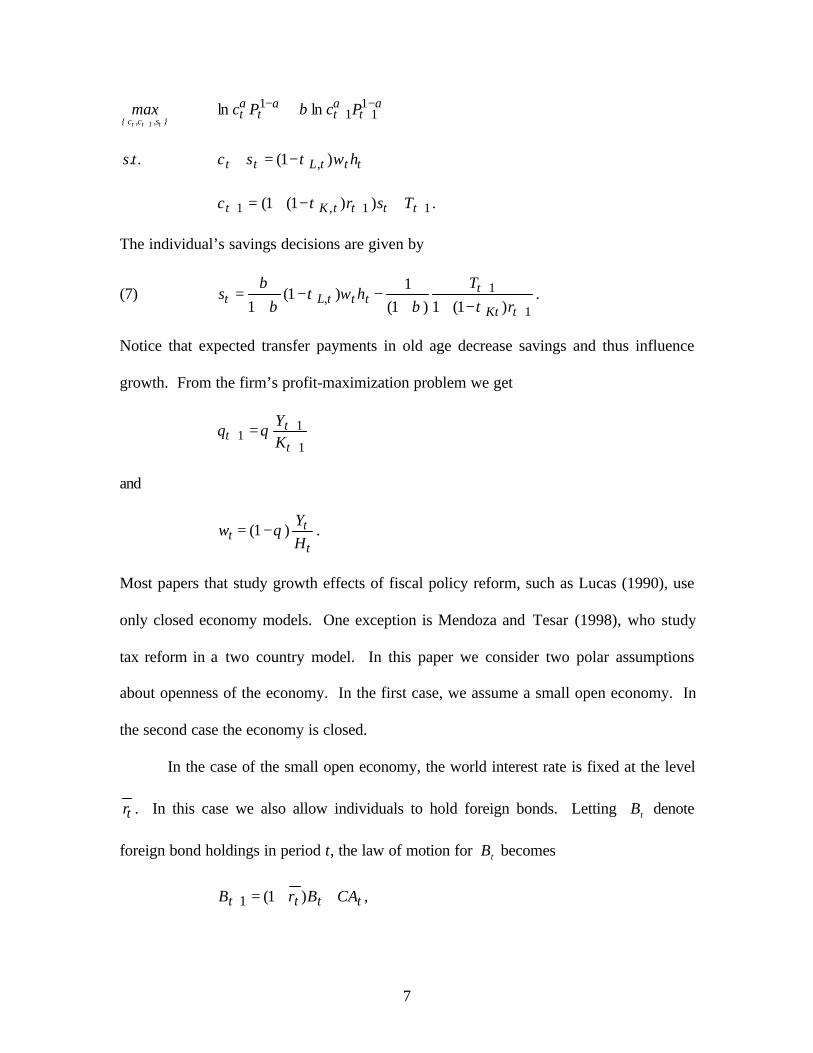
7
}s,c,c{ t1tt
max+
αααα β −++
− + 111
1 lnln tttt PcPc
.t.s tttLtt hwsc )1( ,τ−=+
11,1 ))1(1( +++ +−+= ttttKt Tsrc τ .
The individual’s savings decisions are given by
(7)1
1,
)1(1)1(
1)1(
1 +
+−++
−−+
=tKt
ttttLt r
Thws
τβτ
ββ
.
Notice that expected transfer payments in old age decrease savings and thus influence
growth. From the firm’s profit-maximization problem we get
1
11
+
++ =
t
tt K
Yq θ
and
t
tt H
Yw )1( θ−= .
Most papers that study growth effects of fiscal policy reform, such as Lucas (1990), use
only closed economy models. One exception is Mendoza and Tesar (1998), who study
tax reform in a two country model. In this paper we consider two polar assumptions
about openness of the economy. In the first case, we assume a small open economy. In
the second case the economy is closed.
In the case of the small open economy, the world interest rate is fixed at the level
tr . In this case we also allow individuals to hold foreign bonds. Letting tB denote
foreign bond holdings in period t, the law of motion for tB becomes
tttt CABrB ++=+ )1(1 ,
8
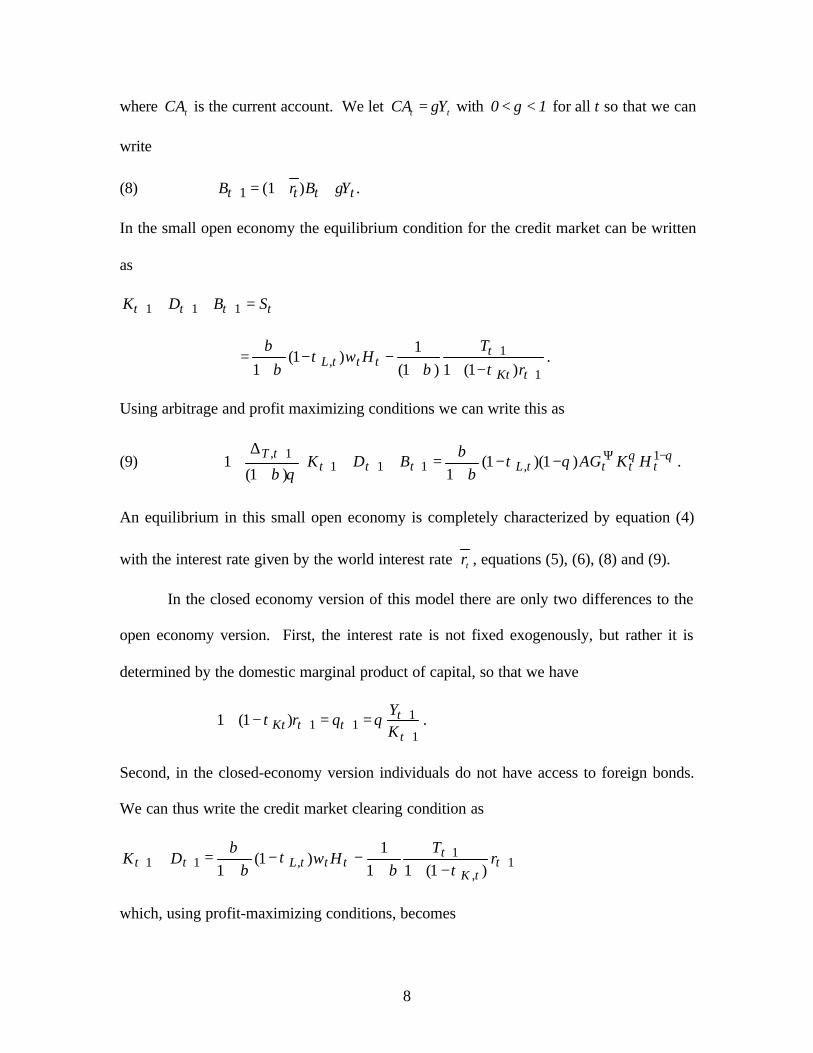
where tCA is the current account. We let tt YCA γ= with 10 << γ for all t so that we can
write
(8) tttt YBrB γ++=+ )1(1 .
In the small open economy the equilibrium condition for the credit market can be written
as
tttt SBDK =++ +++ 111
1
1,
)1(1)1(
1)1(
1 +
+−++
−−+
=tKt
ttttL r
THw
τβτ
ββ
.
Using arbitrage and profit maximizing conditions we can write this as
(9) θθθτβ
βθβ
−Ψ+++
+ −−+
=++
+
∆+ 1
,1111,
)1)(1(1)1(
1 ttttLttttT HKAGBDK .
An equilibrium in this small open economy is completely characterized by equation (4)
with the interest rate given by the world interest rate tr , equations (5), (6), (8) and (9).
In the closed economy version of this model there are only two differences to the
open economy version. First, the interest rate is not fixed exogenously, but rather it is
determined by the domestic marginal product of capital, so that we have
1
111)1(1
+
+++ ==−+
t
tttKt K
Yqr θτ .
Second, in the closed-economy version individuals do not have access to foreign bonds.
We can thus write the credit market clearing condition as
1,
1,11
)1(11
1)1(
1+
+++ −++
−−+
=+ ttK
ttttLtt r
THwDK
τβτ
ββ
which, using profit-maximizing conditions, becomes
9
(10) θθθτβ
βθβ
−Ψ++
+ −−+
=+
∆
++ 1
,111,
)1)(1(11
11 ttttLtt
tT HKAGDK .
An equilibrium for this closed economy is characterized by equations (4), (5), (6) and
(10).
III. Results for the open economy
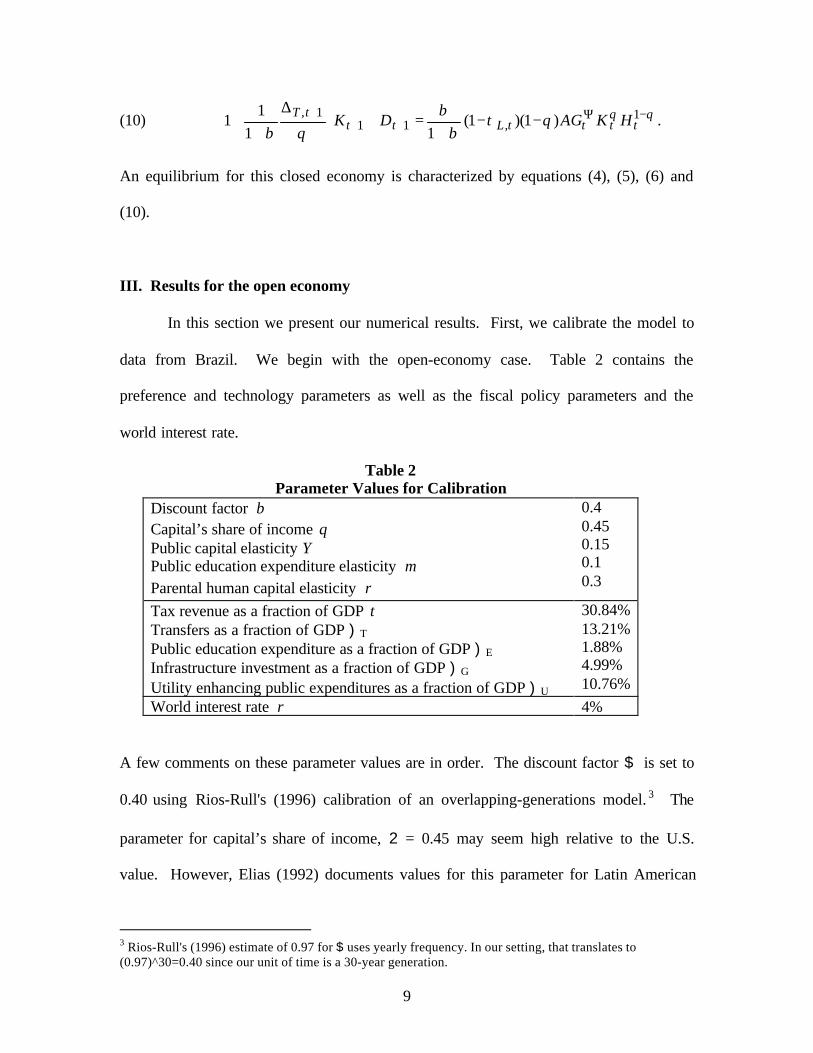
In this section we present our numerical results. First, we calibrate the model to
data from Brazil. We begin with the open-economy case. Table 2 contains the
preference and technology parameters as well as the fiscal policy parameters and the
world interest rate.
Table 2Parameter Values for Calibration
Discount factor βCapital’s share of income θPublic capital elasticity ΨPublic education expenditure elasticity µParental human capital elasticity ρ
0.40.450.150.10.3
Tax revenue as a fraction of GDP τTransfers as a fraction of GDP )T
Public education expenditure as a fraction of GDP )E
Infrastructure investment as a fraction of GDP )G
Utility enhancing public expenditures as a fraction of GDP )U
30.84%13.21%1.88%4.99%10.76%
World interest rate r 4%
A few comments on these parameter values are in order. The discount factor $ is set to
0.40 using Rios-Rull's (1996) calibration of an overlapping-generations model. 3 The
parameter for capital’s share of income, 2 = 0.45 may seem high relative to the U.S.
value. However, Elias (1992) documents values for this parameter for Latin American
3 Rios-Rull's (1996) estimate of 0.97 for $ uses yearly frequency. In our setting, that translates to(0.97)^30=0.40 since our unit of time is a 30-year generation.

10
economics around 0.50. Barro and Sala-i-Martin (1995) use a value of 0.45 for capital’s
share of income for Brazil.4 Concerning the elasticity of public capital Q, since there are
no specific estimates for these seven countries, we use an average of various estimates.
This parameter has been estimated as large as 0.20 by Fay (2001) and Canning and Fay
(1993) using large cross country data sets. Hulten (1996) estimates it around 0.10 using
data from low- and middle-income countries, including six of the seven Latin American
countries of interest. Canning and Bennathan (2000) also estimate it at about 0.10. We
take the midpoint of these estimates and set it to 0.15 in the benchmark.5
There is a myriad of estimates of education production functions for the U.S.
This literature is surveyed by Hanushek (1986,1996), Hedges and Greenwald (1996) and
Harris (2000). Estimates of the public expenditure elasticity µ lie roughly between 0.1
(Card and Krueger (1992)) and zero, which is Hanushek’s preferred estimate. Betts
(1996) documents that in the U.S. estimates of µ are higher the older the data set used;
presumably, for older data sets, average income is lower and public education
expenditures may be more effective. For this reason, we choose a value of µ which is
towards the high end of the estimated range.
Our model exhibits increasing returns to scale in the augmentable factors in the
production function for final goods and services. In order to avoid exploding growth
rates the technology to produce future human capital must exhibit just the right degree of
decreasing returns. This knife-edge requirement is similar to the one in Baier, Bergstrand
4 However, Gollin (2002) shows that for many countries, capital’s share of income is below 0.35.5 There are many estimates available for the public infrastructure elasticity for the U.S. economy. Apartfrom the initial estimates by Aschauer (1989), most more recent estimates lie between 0.2 for the timeseries estimates such as Ai and Cassou (1995) and Lynde and Richmond (1993) and values very close tozero such as the estimates from Hulten and Schwab (1991) and Holtz-Eakin (1994).

11
and Glomm (2003). The value of ρ which provides the right balance between increasing
and decreasing returns is 3.0=ρ .
The fiscal policy parameters are chosen to match averages for Brazil over the
period 1970-1994. The choice of the annual real world interest rate follows Rebelo and
Vegh (1995). Finally, the scale parameters in the two technologies A and B are chosen
so that the annual long-run growth rate of real per capita GDP matches the Brazilian
average growth rate of 2.31. We run the economy for 20 periods. By period 15 the
economy has settled down sufficiently close to a balanced growth path with a change in
the growth rate between periods being smaller than 6*10-5.
We are now in a position to carry out policy experiments. All of our policy
reforms kick in in period 15, which we will call Generation 1, and are assumed to be
permanent. The first set of experiments we consider are shifts in public funds from
transfers to education expenditures. The results of these policy reforms are summarized
in Table 3.
Table 3Shifting public funds from transfers to education
Generation -1% Benchmark +1% +2% +3% +4% +5%1 2.1498 2.3121 2.4124 2.4890 2.5529 2.6092 2.66022 2.2361 2.3121 2.3567 2.3892 2.4152 2.4372 2.45653 2.2811 2.3121 2.3301 2.3431 2.3533 2.3619 2.36944 2.2999 2.3122 2.3191 2.3243 2.3283 2.3317 2.33465 2.3074 2.3122 2.3149 2.3169 2.3185 2.3198 2.3209
In Table 3 the first row indicates the shift in public funds from transfers to public
education expenditures. The -1% in the second column means that public education
expenditures have been decreased by 1% of GDP (from 1.88% of GDP to 0.88% of GDP)
and that transfers have been increased by 1% of GDP, while in column 5, the +3%
indicates an increase in public education funding by 3% of GDP from 1.88% to 4.88% of

12
GDP, at the expense of public transfers. As is evident from Table 3, reallocating public
funds from transfers to public education increases the growth rate. This is in accord with
intuition; after all, increasing public education spending increases human capital
accumulation and hence growth, while increased transfers to the old diminish the
incentive to save/invest in physical capital (see equation (7)) and hence growth. But
these growth effects are not large. Increasing public education expenditures from 1.99%
of GDP (in the benchmark) to 6.99%, a 5% of GDP increase in funding, only increases
the annual real growth rate of GDP from 2.31% to 2.66% for generation 1. Of course the
0.35 percentage point raise in growth will get compounded over a 30 year generation.
Similarly, cutting public education expenditures by 1% of GDP from the benchmark case
decreases growth only from 2.31% to 2.15%. These relatively modest growth effects of
fairly drastic policy changes are obtained with a public education elasticity µ of 0.15,
which is most likely not too small. It is also evident from Table 3 that these growth
effects decline monotonically over time so that by generation 5 there are basically no
growth effects even of a large policy change.
In the next policy experiment, we reallocate public funds from transfers to
investment in infrastructure. The results are summarized in Table 4.
Table 4Shifting public funds from transfers to infrastructure investment
Generation -4% -3% -2% -1% Bench-mark
+1% +2% +3% +4% +5%
1 1.4101 1.7839 2.0108 2.1778 2.3121 2.4259 2.5256 2.6150 2.6967 2.77242 2.1266 2.2036 2.2503 2.2846 2.3121 2.3354 2.3559 2.3742 2.3909 2.40633 2.2591 2.2812 2.2945 2.3043 2.3121 2.3188 2.3246 2.3298 2.3346 2.33904 2.2937 2.3014 2.3060 2.3094 2.3122 2.3145 2.3165 2.3183 2.3200 2.32155 2.3052 2.3081 2.3099 2.3111 2.3122 2.3130 2.3138 2.3145 2.3151 2.3157

13
Again the growth effects of substantial reallocations of public expenditures are rather
moderate. Shifting public funds equal to 5% of GDP from transfers to infrastructure
investment and thereby doubling infrastructure investment (from 4.99% of GDP to 9.99%
of GDP) only increases the growth rate from the benchmark of 2.31% to 2.77%. For
every 1% of GDP of reallocation, there is about a 0.10 percentage point increase in the
growth rate of generation 1. Note however that reducing infrastructure by 4% in favor of
transfers does decrease growth substantially to 1.41%. But no one, to our knowledge, is
really advocating such a large drop in infrastructure investment. Again, by generation 5
the growth effects of policy reform have disappeared.
In Table 5 we show the growth effects of shifting public funds between the two
productive investments, infrastructure and education.
Table 5Shifting public funds from education to infrastructure investment
Generation -3% -2% -1% -0.5% Benchmark +0.5% +1% +1.5%1 2.0212 2.1861 2.2777 2.3023 2.3121 2.3030 2.2632 2.14682 2.3062 2.3271 2.3291 2.3234 2.3121 2.2929 2.2594 2.18833 2.3222 2.3254 2.3223 2.3183 2.3121 2.3028 2.2877 2.25704 2.3175 2.3182 2.3165 2.3147 2.3122 2.3083 2.3022 2.28995 2.3144 2.3146 2.3139 2.3132 2.3122 2.3106 2.3082 2.3034
As is evident from Table 5, deviating from the current allocation of public funds between
education and infrastructure investment decreases growth, so that the current allocation is
roughly growth maximizing. This is quite remarkable since the allocation to
infrastructure exceeds the allocation for public education by roughly 150%, while the
coefficients on both of these public inputs are very similar. The growth effects of
deviating from the status quo allocation of public education and infrastructure are rather
small. Notice also that the growth maximizing allocation between education and
infrastructure varies between the short-run and the long-run: In the short-run the growth
14
maximizing allocation is 1.88% of GDP to education and 4.99% of GDP to infrastructure,
while in the long-run, shifting resources from infrastructure to education by about 2% of
GDP is growth maximizing (see "-2%" column on Table 5). But again even in the long-
run, the growth effects of rather sizeable policy changes turn out very, very small. The
findings of a hump shape relationship between growth and the allocation between the two
types of public investment is similar to the one in Baier, Bergstrand and Glomm (2003).
IV. Results for the closed economy
In this section we present the results for the closed economy. Of course, we have
to change to calibration. We keep the preference and technology parameters the same as
in Table 1. We change the scale parameters A and B in the two technologies in order to
get growth to match Brazil’s growth rate of 2.32%. In this case we no longer fix the
(world) interest rate, but let it be determined endogenously. The policy parameters are
exactly the same as in Table 1 to match Brazil’s fiscal policy.
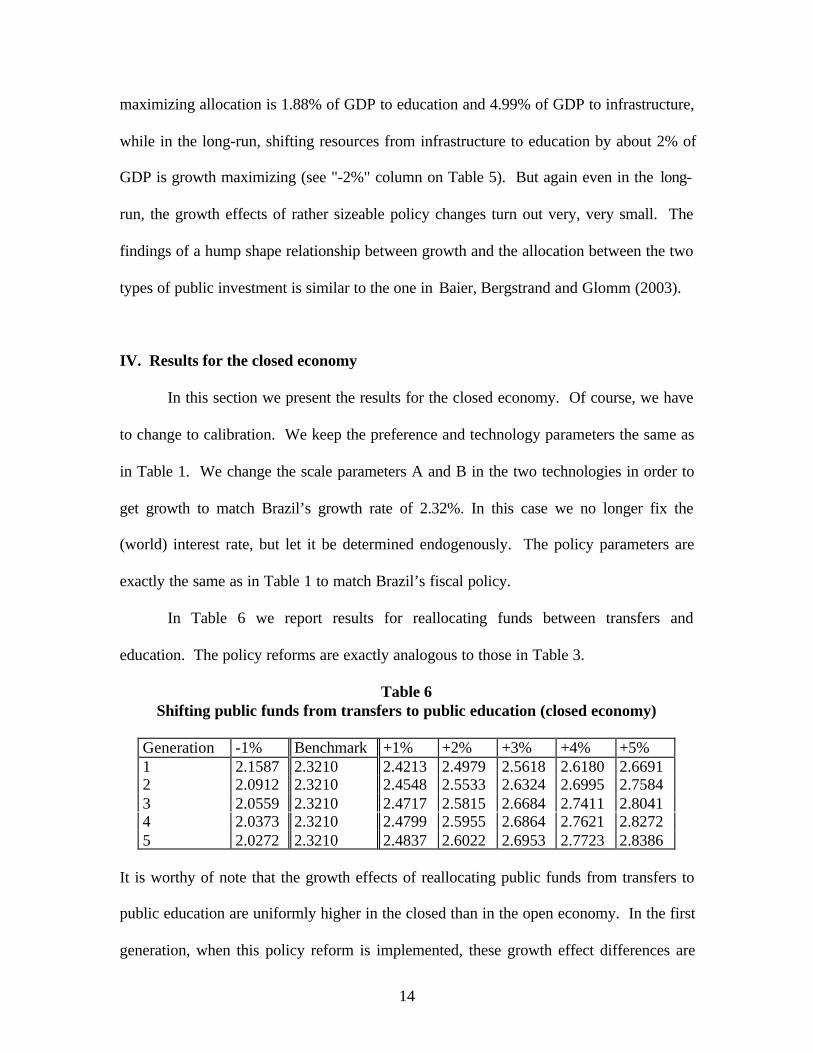
In Table 6 we report results for reallocating funds between transfers and
education. The policy reforms are exactly analogous to those in Table 3.
Table 6Shifting public funds from transfers to public education (closed economy)
Generation -1% Benchmark +1% +2% +3% +4% +5%1 2.1587 2.3210 2.4213 2.4979 2.5618 2.6180 2.66912 2.0912 2.3210 2.4548 2.5533 2.6324 2.6995 2.75843 2.0559 2.3210 2.4717 2.5815 2.6684 2.7411 2.80414 2.0373 2.3210 2.4799 2.5955 2.6864 2.7621 2.82725 2.0272 2.3210 2.4837 2.6022 2.6953 2.7723 2.8386
It is worthy of note that the growth effects of reallocating public funds from transfers to
public education are uniformly higher in the closed than in the open economy. In the first
generation, when this policy reform is implemented, these growth effect differences are

15
small. Notice, however, that in the open economy growth-rate effects fell over time,
while growth-rate effects rise over time in the closed economy. The reason for this
difference is that increased public expenditures on education raise human capital
accumulation, which in turn raises the marginal product of capital, the interest rate and
thus the incentive to invest in physical capital. In the closed economy, the interest rate is
allowed to increase over time as the stock of human capital raises due to higher public
education funding. This allows the growth rate to increase.
In the second experiment, we reallocate funds from transfers to infrastructure
investment. The results are illustrated in Table 7. Again, the growth effects of increasing
infrastructure investment at the expense of transfers has bigger growth effects than in the
open economy. As before we attribute this differential outcome to the fact that in the
closed economy the interest rate is allowed to adjust.
Table 7Shifting public funds from transfers to infrastructure (closed economy)
Generation -4% -3% -2% -1% Bench-mark
+1% +2% +3% +4% +5%
1 1.4189 1.7928 2.0196 2.1866 2.3210 2.4347 2.5344 2.6238 2.7056 2.78132 1.7284 1.9730 2.1226 2.2321 2.3210 2.3946 2.4599 2.5185 2.5719 2.62143 1.8884 2.0672 2.1755 2.2552 2.3210 2.3734 2.4208 2.4634 2.5023 2.53824 1.9702 2.1151 2.2024 2.2666 2.3210 2.3619 2.4002 2.4344 2.4658 2.49475 2.0132 2.1395 2.2159 2.2721 2.3210 2.3555 2.3890 2.4190 2.4464 2.4718
The results for reallocating public funds from education to infrastructure are
reported in Table 8.
16
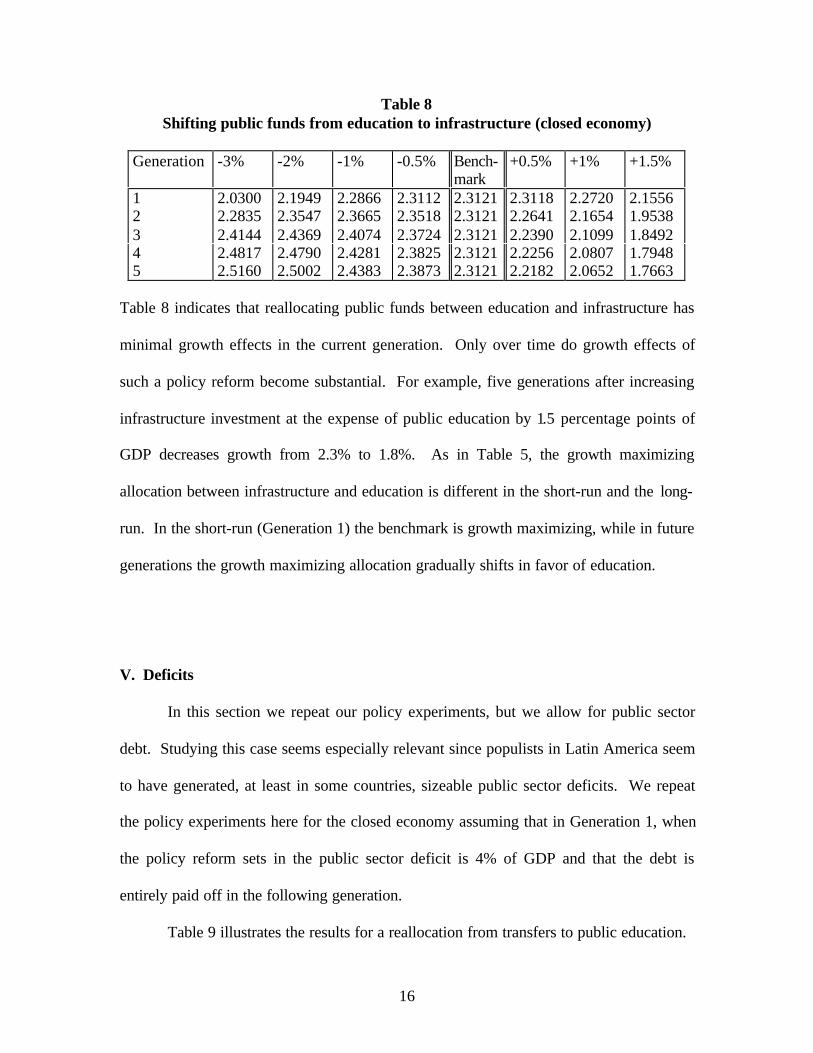
Table 8Shifting public funds from education to infrastructure (closed economy)
Generation -3% -2% -1% -0.5% Bench-mark
+0.5% +1% +1.5%
1 2.0300 2.1949 2.2866 2.3112 2.3121 2.3118 2.2720 2.15562 2.2835 2.3547 2.3665 2.3518 2.3121 2.2641 2.1654 1.95383 2.4144 2.4369 2.4074 2.3724 2.3121 2.2390 2.1099 1.84924 2.4817 2.4790 2.4281 2.3825 2.3121 2.2256 2.0807 1.79485 2.5160 2.5002 2.4383 2.3873 2.3121 2.2182 2.0652 1.7663
Table 8 indicates that reallocating public funds between education and infrastructure has
minimal growth effects in the current generation. Only over time do growth effects of
such a policy reform become substantial. For example, five generations after increasing
infrastructure investment at the expense of public education by 1.5 percentage points of
GDP decreases growth from 2.3% to 1.8%. As in Table 5, the growth maximizing
allocation between infrastructure and education is different in the short-run and the long-
run. In the short-run (Generation 1) the benchmark is growth maximizing, while in future
generations the growth maximizing allocation gradually shifts in favor of education.
V. Deficits
In this section we repeat our policy experiments, but we allow for public sector
debt. Studying this case seems especially relevant since populists in Latin America seem
to have generated, at least in some countries, sizeable public sector deficits. We repeat
the policy experiments here for the closed economy assuming that in Generation 1, when
the policy reform sets in the public sector deficit is 4% of GDP and that the debt is
entirely paid off in the following generation.
Table 9 illustrates the results for a reallocation from transfers to public education.

17
Table 9Shifting public funds from transfers to public education in the presence of public debt
Generation -1% Benchmark +1% +2% +3% +4% +5%1 2.1589 2.3212 2.4216 2.4981 2.5621 2.6183 2.66932 1.5636 1.8160 1.9752 2.0982 2.2017 2.2930 2.37593 3.1781 3.4355 3.5809 3.6831 3.7623 3.8272 3.88254 2.8922 3.1711 3.3295 3.4416 3.5188 3.6006 3.66195 2.7441 3.0339 3.1991 3.3161 3.4075 3.4828 3.5472
Comparing Tables 6 and 9 reveals that the growth rate effects of reallocating funds from
transfers to education are almost completely unaffected by the presence of the public debt
in the short-run (Generation 1). In the long-run, however, the growth effects of this
policy change are much larger. For example, raising public education expenditures by
three percentage points of GDP raises growth in Generation 5 to 3.4% when there are
deficits in Generation 1, but only 2.7% when the government budget is always balanced.6
The results from reallocating public funds from transfers to infrastructure under
four percent are very similar to the effects of reallocating from transfers to public
education: The growth effects are relatively small in the short-run and sizeable in the
long-run. Hence, we omit presenting these results for brevity.
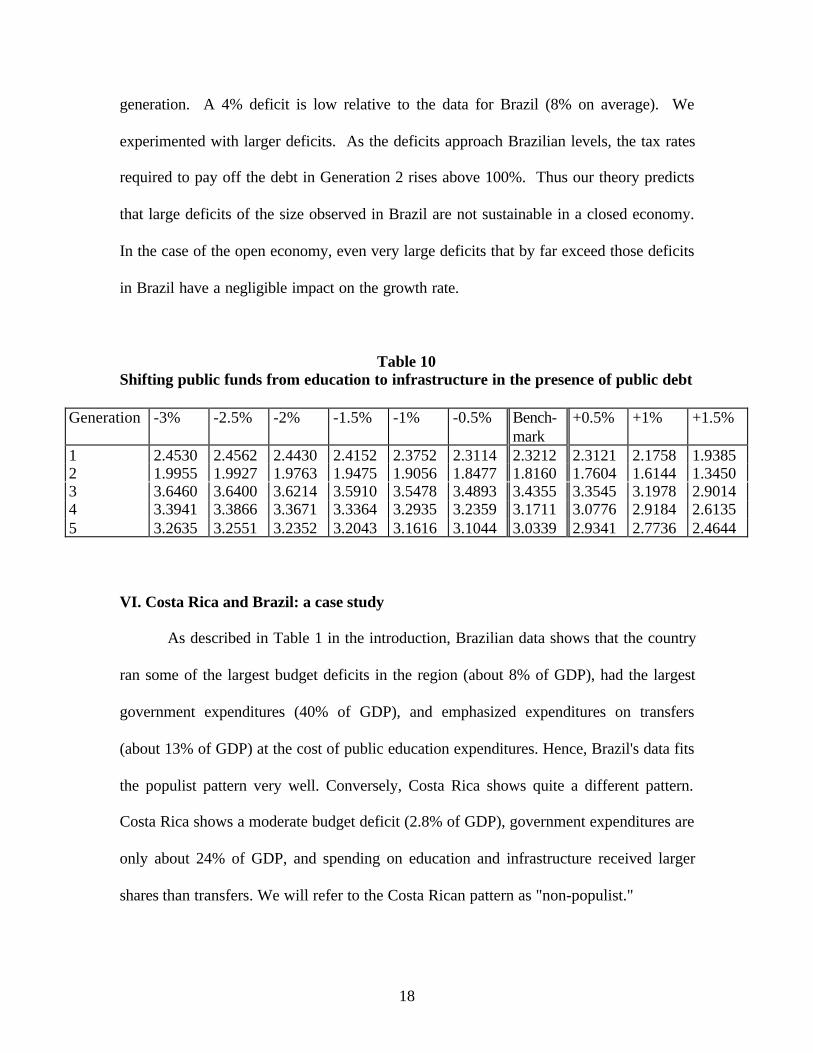
The effects of reallocating public funds from education to infrastructure are
illustrated in Table 10. In this case, the long-run the growth maximizing allocations
between public education and infrastructure are similar in the short-run and long-run.
Growth is maximized by reallocating in favor of education by 2.5 or 3 percentage points
of GDP from the benchmark.
For all the policy reforms in this section, we assumed the economy is closed and
that the deficit of 4% of GDP from Generation 5 is paid off during the following
6 In all results in Table 9, note that growth in generation 2 is much lower than in generation 1 since the debtfrom the previous period must be paid off. Once this debt is paid, however, generation 3, 4, and 5 can enjoymuch larger growth rates.
18
generation. A 4% deficit is low relative to the data for Brazil (8% on average). We
experimented with larger deficits. As the deficits approach Brazilian levels, the tax rates
required to pay off the debt in Generation 2 rises above 100%. Thus our theory predicts
that large deficits of the size observed in Brazil are not sustainable in a closed economy.
In the case of the open economy, even very large deficits that by far exceed those deficits
in Brazil have a negligible impact on the growth rate.
Table 10Shifting public funds from education to infrastructure in the presence of public debt
Generation -3% -2.5% -2% -1.5% -1% -0.5% Bench-mark
+0.5% +1% +1.5%
1 2.4530 2.4562 2.4430 2.4152 2.3752 2.3114 2.3212 2.3121 2.1758 1.93852 1.9955 1.9927 1.9763 1.9475 1.9056 1.8477 1.8160 1.7604 1.6144 1.34503 3.6460 3.6400 3.6214 3.5910 3.5478 3.4893 3.4355 3.3545 3.1978 2.90144 3.3941 3.3866 3.3671 3.3364 3.2935 3.2359 3.1711 3.0776 2.9184 2.61355 3.2635 3.2551 3.2352 3.2043 3.1616 3.1044 3.0339 2.9341 2.7736 2.4644
VI. Costa Rica and Brazil: a case study
As described in Table 1 in the introduction, Brazilian data shows that the country
ran some of the largest budget deficits in the region (about 8% of GDP), had the largest
government expenditures (40% of GDP), and emphasized expenditures on transfers
(about 13% of GDP) at the cost of public education expenditures. Hence, Brazil's data fits
the populist pattern very well. Conversely, Costa Rica shows quite a different pattern.
Costa Rica shows a moderate budget deficit (2.8% of GDP), government expenditures are
only about 24% of GDP, and spending on education and infrastructure received larger
shares than transfers. We will refer to the Costa Rican pattern as "non-populist."

19
Here we address the question: If Costa Rican fiscal patterns had been imposed in
Brazil, how would Brazilian growth performance be affected? This section analyses this
case in detail. In particular, two experiments are conducted. 1.) Imposing the Costa Rican
expenditure pattern while keeping total expenditures at Brazilian levels. 2.) Imposing
Costa Rican expenditure patterns and total expenditure level.
Results for both these specifications in the open economy case are described on
Table 11. Concerning the first experiment, the growth rate of Generation 1 under the non-
populist regime would have been 2.5976% per year rather than 2.3121% in the populist
regime. This is an increase of about 0.30 percentage points in the growth rate, which is
fairly sizable. Moreover, income per capita in Brazil would be $4,892 vs. $4,500 in
Generation 1. Differences in income per person get compounded and are even wider in
subsequent generations as Table 11 shows. By generation 5, the income difference is
over $11,000, even though growth rates in the two cases are converging.
Table 11Imposing non-populist policies
Generation Brazil Benchmark Non-populist Regime 1 Non-populist Regime 2Growth Income Growth Income Growth Income
1 2.3121 $4,500 2.5976 $4,892 2.3941 $4,6092 2.3121 $8,934 2.4475 $10,106 2.3864 $9,3523 2.3121 $17,735 2.3672 $20,388 2.3460 $18,7524 2.3121 $35,208 2.3341 $40,738 2.3259 $37,3785 2.3121 $69,896 2.3207 $81,078 2.3176 $74,323
In the second experiment, Costa Rican expenditure allocations and total
expenditures are imposed. The major difference is that total government expenditures are
almost cut in half compared to Brazil's. Nevertheless, as Table 11 shows, Brazil's growth
rate would have been higher under this "non-populist" regime. Generation 1's growth rate
is 2.3941 vs. 2.3121; this is not quite as high a change as under experiment 1). Hence,

20
even cutting total expenditures by one-half, by changing the expenditure shares to
emphasize education and public infrastructure and de-emphasize transfers, would yield
higher growth.
VII. Concluding Remarks
In this paper we have studied the impact of some populist fiscal policies on long-
run growth. The findings in this paper are: (i) In the small open economy setting,
growth effects of any single policy reform are small. (ii) Imposing an entire set of non-
populist policies can increase growth by about 0.3 percentage point per year. (iii)
Growth effects of fiscal policy reform are larger in the closed economy model than in the
open economy since the interest rate can adjust.
Running deficits influences the growth effects of reforms of other dimensions of
fiscal policy. Increasing the public debt for one generation and paying the entire debt off
in the next generation in our model has minute growth effects in the open economy
version, since the interest rate is fixed. In our calibrated closed economy version, raising
public debt to around 5% of GDP raises the interest payments for the next period to
unsustainable levels. Further investigation of the growth effects of debt in these settings
with other populist policies is left for future research with a model with more detailed
demographic structure and with more and longer data sets.
One aspect of populist policies which we have not addressed in this paper is the
government’s decision to have large, perhaps excessively large, public sector
employment. Such labor market policies, by influencing rates of return on capital, might
have sizeable growth effects as well. This is left for future research.

21
References
Ai, C. and S. Cassou, 1995, A normative analysis of public capital. Applied Economics27, 1201-1209.
Aschauer, D., 1989, Is public expenditure productive? Journal of Monetary Economics23, 177-200.
Baier, S., J. Bergstrand and G. Glomm, 2003, Can Tax Cuts and Public Investment inEducation Influence Long-run Growth? Manuscript.
Baier, S. L. and G. Glomm, 2001, Long-run growth and welfare effects of public policieswith distortionary taxation. Journal of Economic Dynamics and Control 25, 2007-2042.
Barro, R., 1990, Government spending in a simple model of endogenous growth. Journalof Political Economy 98, S103-S125.
Barro, R. and X. Sala-i-Martin, 1995, Economic Growth, Cambridge: MIT Press.
Benabou, R., 1996, Heterogeneity, Stratification, and Growth: MacroeconomicImplications of Community Structure and School Finance. American Economic Review86, 584-609.
Betts, J., 1996, Is there a link between school inputs and earnings? Fresh scrutiny of anold literature, in Burtless, G. ed. Does Money Matter? The effect of school resources onstudent achievement and adult success. Washington, D.C. Brookings Institution Press.
Canning, D., 1999, The contribution of infrastructure to aggregate output, World BankPolicy Research Paper no. 2246, Washington, DC.
___________, 1998, A database of world stocks of infrastructure, 1950-1995, WorldBank Economic Review 12, no.3. 529-547.
Canning, D. and E. Bannathan, 2000, The Social Rate of Return to InfrastructureInvestments, World Bank Development Research Group, Working Paper #2390.
Canning, D. and M. Fay, 1993, The effect of transportation networks on economicgrowth. Columbia University Working Paper.
Card, D. and A. Krueger, 1992, Does school quality matter? returns to education and thecharacteristics of public schools in the United States. Journal of Political Economy 100,1-40.
Cassou, S. and K. Lansing, 2001, Tax Reform and Public-Sector Investment in HumanCapital, Manuscript.

22
, 1998, Optimal fiscal policy, public capital, and the productivityslowdown, Journal of Economic Dynamics and Control 22, no.6, 911-935.
Demetriades, P. O. and T. P. Mamuneas, 2000, Intertemporal output and employmenteffects of public infrastructure capital: evidence from 12 OECD economies, TheEconomic Journal 110, no. 465, 687-712.
Devarajan, S., D. Xie, and H. Zou, 1998, Should public capital be subsidized orprovided? Journal of Monetary Economics 41, 319-331.
Diamond, P.A., 1965, National debt in a neoclassical growth model, American EconomicReview 55, 1126-1150.
Dornbush, Rudiger and Sebastian Edwards, eds., 1991, The Macroeconomics ofPopulism in Latin America, The University of Chicago Press: Chicago, IL.
Dornbush, Rudiger and Sebastian Edwards, 1990, The Macroeconomics ofPopulism in Latin America, Journal of Development Economics 32, 247-277.
Easterly, W. and S. Rebelo, 1993, Fiscal policy and economic growth: an empiricalinvestigation, Journal of Monetary Economics 32, 417-458.
Elias, V., 1992, Sources of growth: a study of seven Latin American economies. ICSPress, San Francisco, CA.
Fay, M., 2001, Financing the Future: Infrastructure needs in Latin America, 2000-05.Working Paper no. 2545, The World Bank.
Fernandez, R. and R. Rogerson, 1998, Public Education and Income Distribution: ADynamic Quantitative Evaluation of Education-Finance Reform, American EconomicReview.
Fischer, W. H. and S. Turnovsky, 1995, The Composition of Government Expendituresand its Consequences for Macroeconomic Performance. Journal of Economic Dynamicsand Control 19, 747-786.
Glomm, G. and B. Ravikumar, 1994, Public Investment in Infrastructure in a SimpleGrowth Model, Journal of Economic Dynamics and Control.
Glomm, G. and B. Ravikumar, 1998, Flat-Rate Taxes, Government Spending onEducation, and Growth, Review of Economic Dynamics.
Gollin, D., 2002, Getting Income Shares Right, Journal of Political Economy 110, 458-474.
Government Finance Statistics Yearbook, various issues, International Monetary Fund,Washington, DC.

23
Greiner, A. and H. Hanusch, 1998, Growth and Welfare Effects of Fiscal Policy in anEndogenous Growth Model with Public Investment. International Tax and PublicFinance 5, 249-261.
Hanushek, E., 1986, The economics of schooling: Production and efficiency in publicschools, Journal of Economic Literature 24, 1141-1177.
___________, 1996, School resources and student performance in Burtless, G. ed. DoesMoney Matter? The effect of school resources on student achievement and adult success.Washington, D.C. Brookings Institution Press.
Harris, D., 2000, Different Methods, Different Results: New Approaches to Meta-Analysis with Applications to Education in Production Functions. Manuscript.
Hedges, L. V. and R. Greenwald, 1996, Have times changed? The relationship betweenschool resources and student performance, in Burtless, G. ed. Does Money Matter? Theeffect of school resources on student achievement and adult success. Washington, D.C.Brookings Institution Press.
Holtz-Eakin, D., 1994, Public Sector Capital and the Productivity Puzzle, Review ofEconomics and Statistics 76, 12-21.
Holtz-Eakin, D. and A.E. Schwartz, 1995, Infrastructure in a structural model ofeconomic growth. Regional Science and Urban Economics 25, pp. 131-151.
Hulten, C., 1996, Infrastructure capital and economic growth: how well you use it may bemore important than how much you have. NBER Working Paper No. 5847.
Hulten, C. and R. M. Schwab, 1991, Public capital formation and the growth of regionalmanufacturing industries. National Tax Journal, 121-134.
Kaganovich, M. and I. Zilcha, 1999, Education, Social Security and Growth. Journal ofPublic Education 21, 289-309.
Lucas Jr., R. E., 1990, Supply-side economics: an analytical review. Oxford EconomicPapers 42, pp. 293-316.
Lynde, C. and J. Richmond, 1993, Public capital and total factor productivity,International Economic Review 34, 401-414.
Mendoza, E. and L. Tesar, 1998, The International Ramifications of Tax Reforms:Supply-Side Economics in a Global Economy, American Economic Review.
Rioja, Felix, 1999, Productiveness and welfare implications of public infrastructure: adynamic two-sector general equilibrium analysis. Journal of Development Economics 58,387-404.

24
Rios-Rull, J-V., 1996, Life-cycle economies and aggregate fluctuations, Review ofEconomic Studies 63, 465-489.
Rebelo, S. and C.A. Vegh, 1995, Real effects of exchange rate-based stabilization: ananalysis of competing theories. NBER Working Paper No. 5197, National Bureau ofEconomic Research.
Rosenstein-Rodan, P., 1974, Why Allende Failed. Challenge 17 (May-June): 1-14.
Sachs, Jeffrey, 1989, Social Conflict and Populist Policies in Latin America. NBERWorking Paper no. 2897. Cambridge, Mass.
Turnovsky, S., 1999, Productive Government Expenditure in a Stochastically GrowingEconomy, Macroeconomic Dynamics 3, 544-570.
_____________, 1997, Public and private capital in an endogenously growing openeconomy, in B.S. Jensen and K. Wong (eds.), Dynamics, Economic Growth, andInternational Trade, Ann Arbor: The University of Michigan Press.
Related Documents