Population Viability Analyses (PVA) Presentation 1 Lesson 7

Welcome message from author
This document is posted to help you gain knowledge. Please leave a comment to let me know what you think about it! Share it to your friends and learn new things together.
Transcript

Population Viability Analyses (PVA)
Presentation 1
Lesson 7

PVA
Most PVA’s consider internal factors (sex ratio, number of births, survival, etc) and the effect of these internal factors on population persistence
We will study the effect of external factors (habitat, disturbances) in a later class.

Ideas of population persistence
Human the hunter realized that habitat type is important for distribution and abundance of prey
Humans also understood that habitat quality is important
With the advent of agriculture and animal husbandry humans realized that sex ratios, age of individuals, and morphological characteristics were important for reproduction.

Ideas of population persistence (cont.)
Island biogeography showed us habitat quantity is fundamental to survival of a population (even with the best habitat without enough of it population would not survive)
In the 1990s we realized that habitat pattern important (metapopulation theory)
Not only must we have enough good habitat it must be arranged in an appropriate pattern
E.g.: northern spotted owl in NW US and Canada

Review of metapopulation theory
Source and sink dynamics Source = surplus individuals produced migrate
to areas available for them to live Sources have demographics that lead to
population increase Source has habitat suitable for population
increase Sink = space available for migrants

Source and sink dynamics
Studies show that small % of total population may be located in source habitat
As little as10 % of population could be source* Provided new definition for key (or critical)
habitat Key habitat= defined by habitat specific
reproductive success and survivorship not just population density
*Pulliam, H.R. 1988. Sources, sinks and population regulation. Am. Nat. 132:652-661

Northern Spotted Owl
Ccourtesy of Eric Forsman, U.S. Forest Service
NW US and B.C.
Non-migratory
Natural low population
Dense timber (old growth)
Thomas et al (1990) used PVA to devise conservation strategy
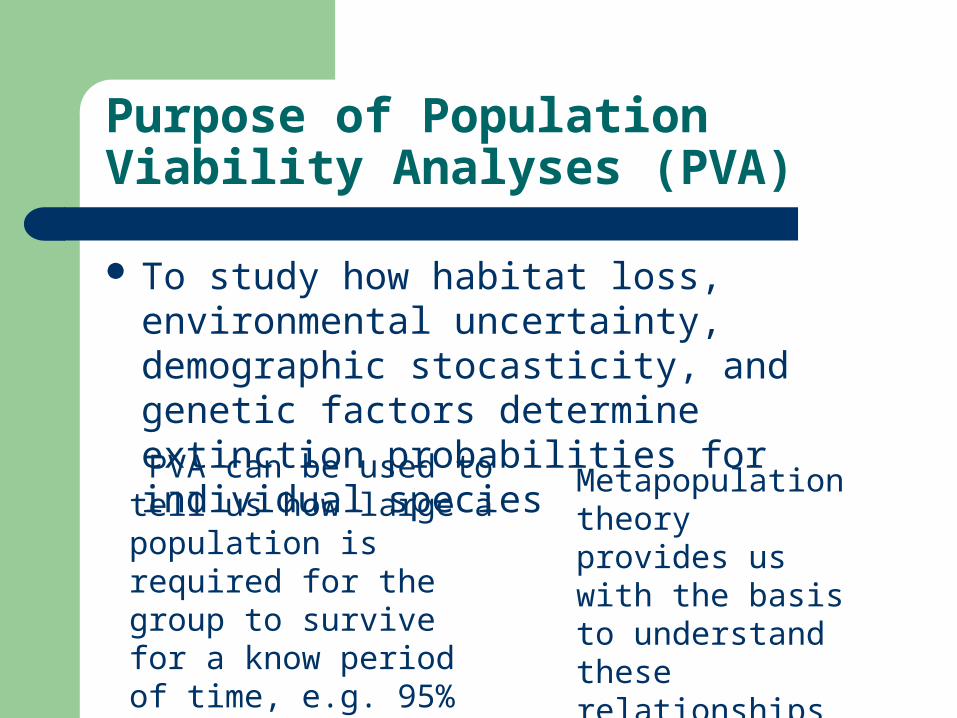
Purpose of Population Viability Analyses (PVA)
To study how habitat loss, environmental uncertainty, demographic stocasticity, and genetic factors determine extinction probabilities for individual species
Metapopulation theory provides us with the basis to understand these relationships
PVA can be used to tell us how large a population is required for the group to survive for a know period of time, e.g. 95% probability of extinction in 100 yrs.

Application of PVA
We can use PVA to model the probability of a population failing or prospering under a given set of circumstances
Can be used to set size of population required to restore SAR or maintain species of interest.
Can use to find features that make a population vulnerable

Application of PVA
This will provide us answers to management questions:– Where should we concentrate our efforts?– Increasing births?– Reducing deaths of young?– Reducing deaths of old?– Reducing deaths of males?– Reducing deaths of females?
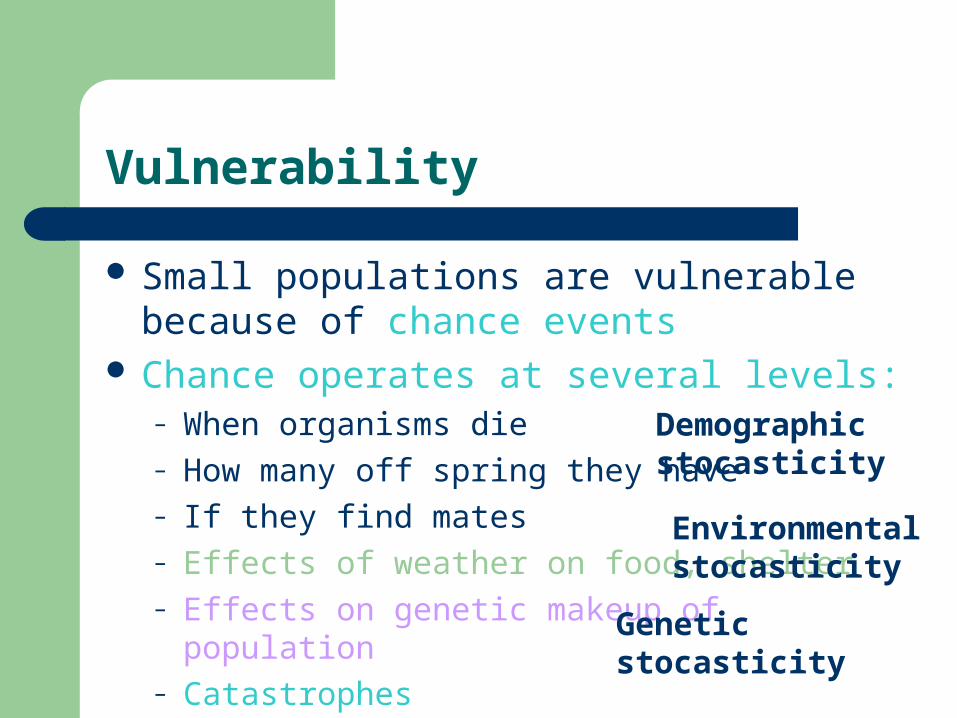
Vulnerability
Small populations are vulnerable because of chance events
Chance operates at several levels:– When organisms die– How many off spring they have– If they find mates– Effects of weather on food, shelter– Effects on genetic makeup of population– Catastrophes
Demographic stocasticity
Environmental stocasticity
Genetic stocasticity
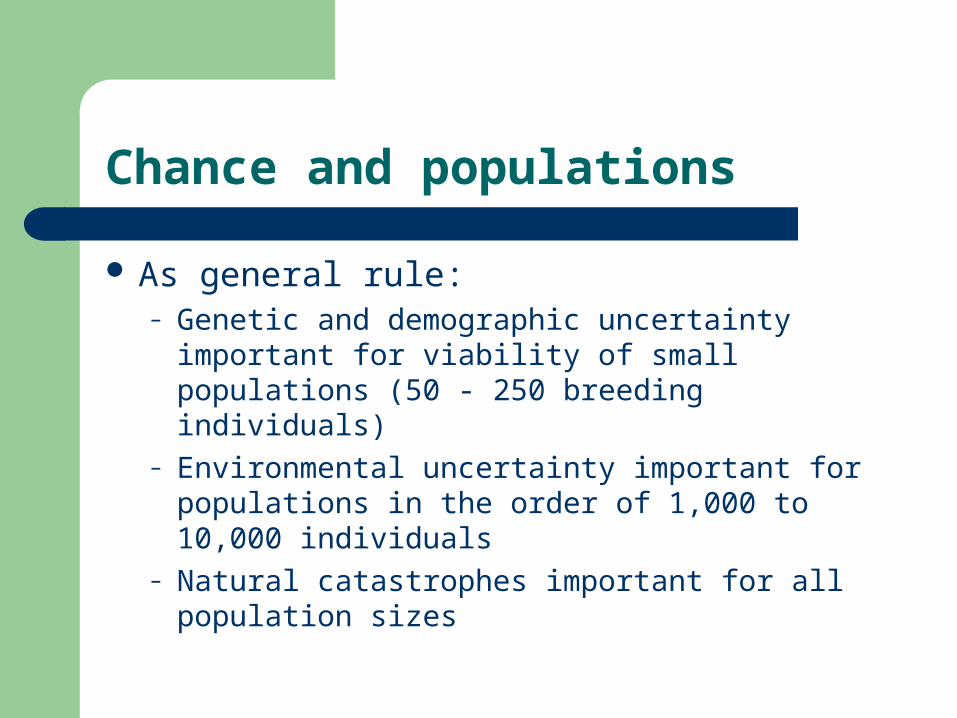
Chance and populations
As general rule:– Genetic and demographic uncertainty important for
viability of small populations (50 - 250 breeding individuals)
– Environmental uncertainty important for populations in the order of 1,000 to 10,000 individuals
– Natural catastrophes important for all population sizes

Vulnerability
Chance events become more important as population becomes smaller
Chance events can reinforce the negative effects of one another

Minimum viable population (MVP)
The smallest isolated population having a 99% chance of surviving 100 years.– Can change % and years depending on objectives– Once we have a MVP can multiply it by the home
range figures to calculate minimum area needed to support MVP

History of PVA
First used by Shaffer (1983) to study grizzly bear in Yellowstone National Park
Used detailed 12 yr data on grizzly population to construct population dynamics by tracking individual bears and incorporating effects of chance events
NPS Photo
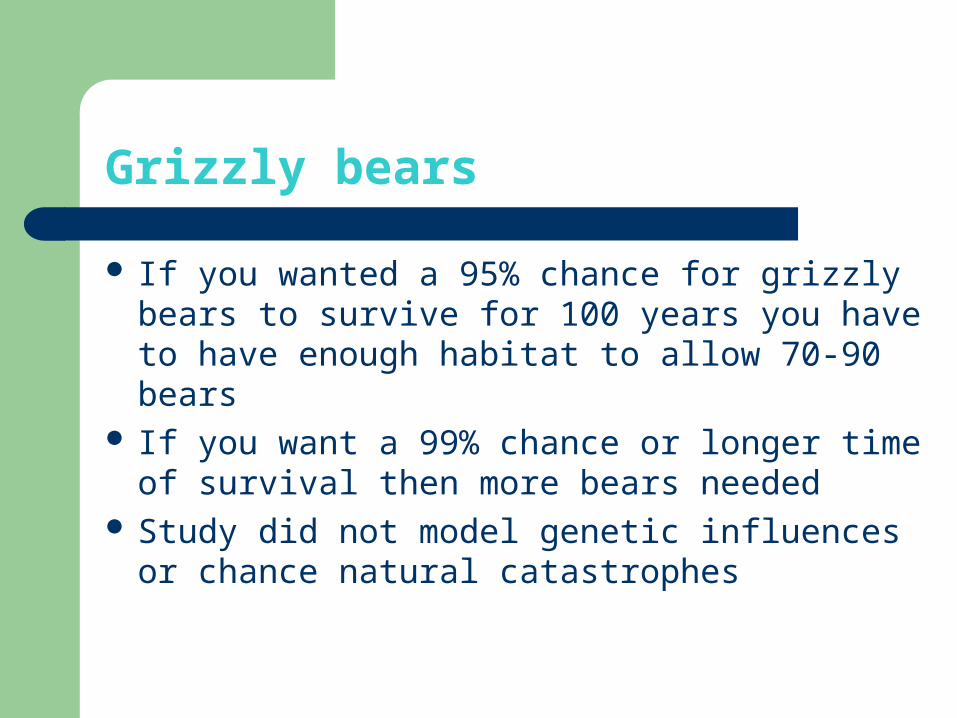
Grizzly bears
If you wanted a 95% chance for grizzly bears to survive for 100 years you have to have enough habitat to allow 70-90 bears
If you want a 99% chance or longer time of survival then more bears needed
Study did not model genetic influences or chance natural catastrophes
NPS Photo
History of PVA
Today over 30 PVA studies Theoretical basis for population viability still
developing Do not have models sophisticated enough Do not have life history description and data for
most organisms

Limits of PVA
Only as reliable as inputs! Depends on realism of model’s logic! Need lots of demographic data (not usually
available) Long term projections imply habitat stability
and all else being equal (often not the case in the real world)
Best bets for future
Cannot do PVA for all SAR Identify spp indicative of natural system
(indicator spp or keystone spp) PVA for these will provide area requirements
for others that require the same system These indicators are likely to be top carnivores:
long-lived, slow reproduction, large body

Best bets for conservation
Create multiple populations: single catastrophe cannot destroy spp
Increase size of each population so that genetic, demographic and environmental factors less threatening (very difficult to do)
PVA in harvest regulation
Elements of PVA is used to determine minimum population before harvest is sustainable.
Need information on population dynamics, life history, demographics to determine sustainable harvest levels.

PVA and large populations
Passenger Pigeon(Ectopistes migratorius)
Photo: Cornell U
Photo: NPS
Photo: NPS
Photo: NPS
What can PVA tell us about the sudden demise of large populations?
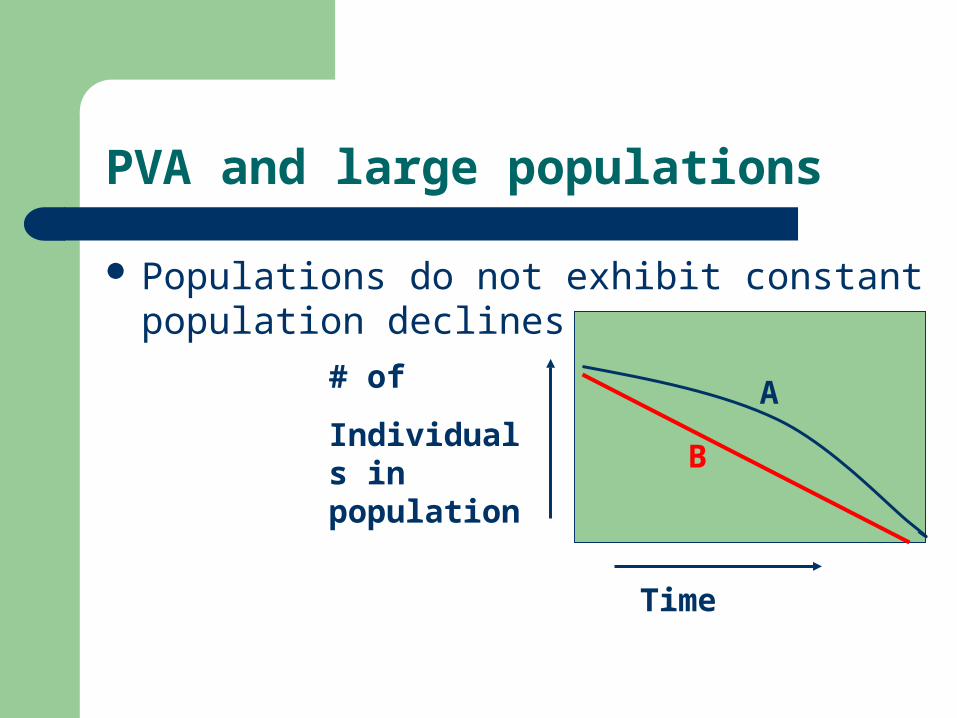
PVA and large populations
Populations do not exhibit constant population declines
# of
Individuals in population
Time
A
B
PVA and large populations
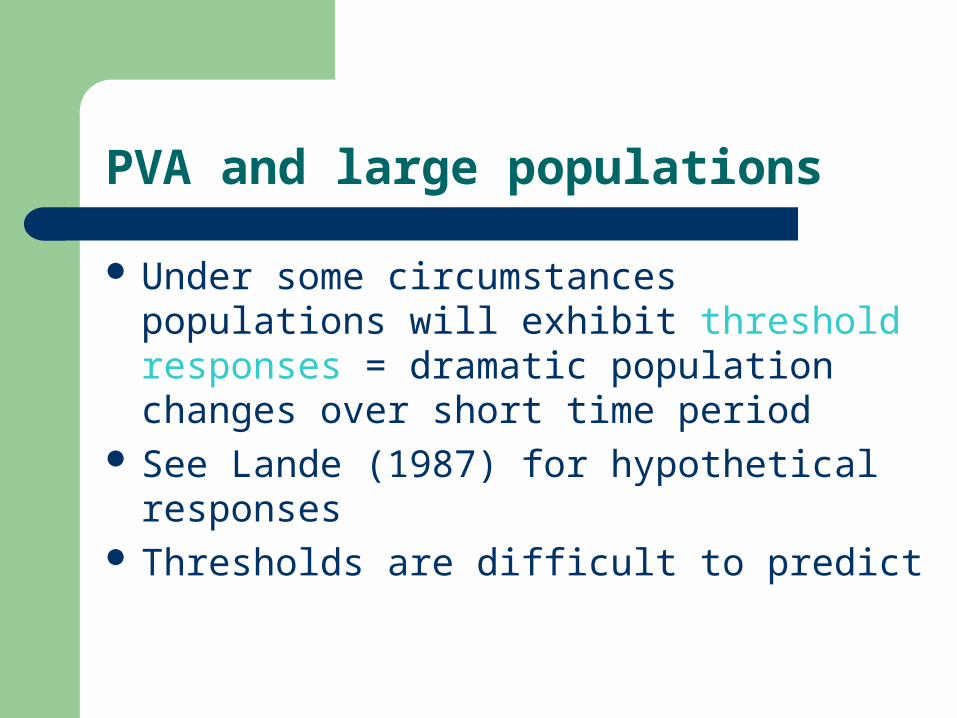
Under some circumstances populations will exhibit threshold responses = dramatic population changes over short time period
See Lande (1987) for hypothetical responses Thresholds are difficult to predict
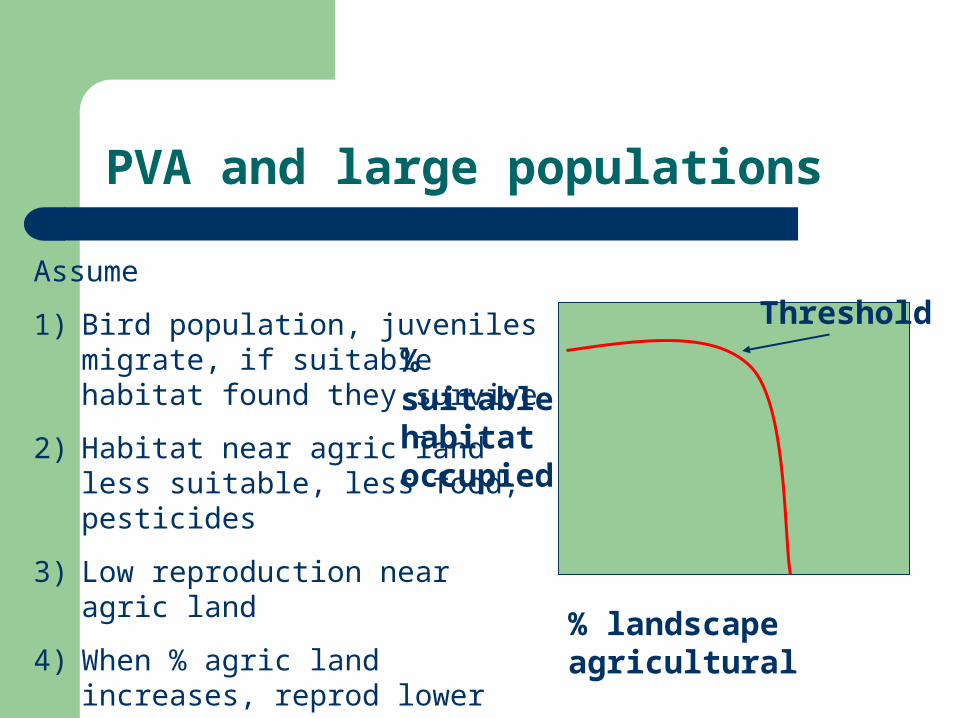
PVA and large populations
% landscape agricultural
% suitable habitat occupied
Assume
1) Bird population, juveniles migrate, if suitable habitat found they survive
2) Habitat near agric land less suitable, less food, pesticides
3) Low reproduction near agric land
4) When % agric land increases, reprod lower
5) When reprod = mortality, suitable habitat occupied declines rapidly
Threshold

Modelling populations
A simple population model
Nt+1= Nt + B - M
Nt+1 = Population tomorrow
Nt = Population today
B = Births
M = Mortality
Can put in one average value and come up with one result:
Try these values in the formula:Nt =100B=50M=30What is Nt+1?
Ans: 120

Questions?
Related Documents