Population Size, Growth, Mortality and Movement Patterns of Yellowtail Snapper (Ocyurus chrysurus) in the U.S. Virgin Islands CRP Funded Project NMF4540114 Funding : Federal=$132,850 CFMC=$20,000 STFA in-kind=$11,200

Population Size, Growth, Mortality and Movement Patterns of Yellowtail Snapper (Ocyurus chrysurus) in the U.S. Virgin Islands CRP Funded Project NMF4540114.
Dec 16, 2015
Welcome message from author
This document is posted to help you gain knowledge. Please leave a comment to let me know what you think about it! Share it to your friends and learn new things together.
Transcript

Population Size, Growth, Mortality and Movement Patterns of Yellowtail
Snapper (Ocyurus chrysurus) in the U.S. Virgin Islands
CRP Funded Project NMF4540114Funding :
Federal=$132,850CFMC=$20,000
STFA in-kind=$11,200

Pit Tags

Scanner for Port Sampling


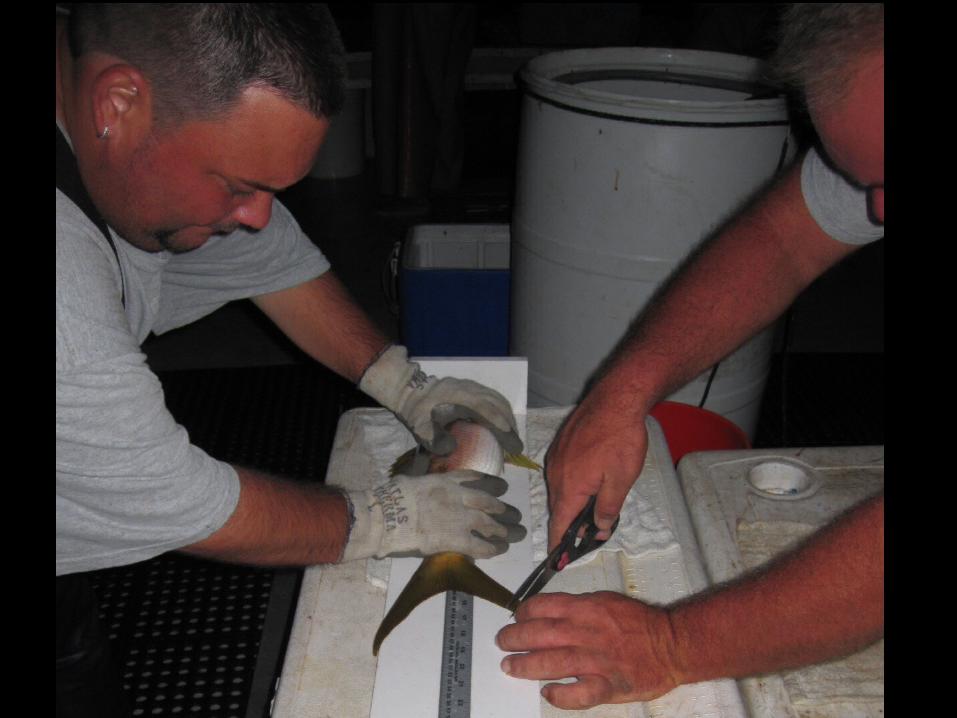


Study ResultsTagging Trips # Fish Total Lbs Average
Wt. (lbs)Hand line 48 3,959 4,767 1.20
Traps 11 118 134 1.14Total 59 4,077 4,901 1.20
Port Sampling 279 15,119 27,177 1.33Tag TypePit Tags Only 1,989
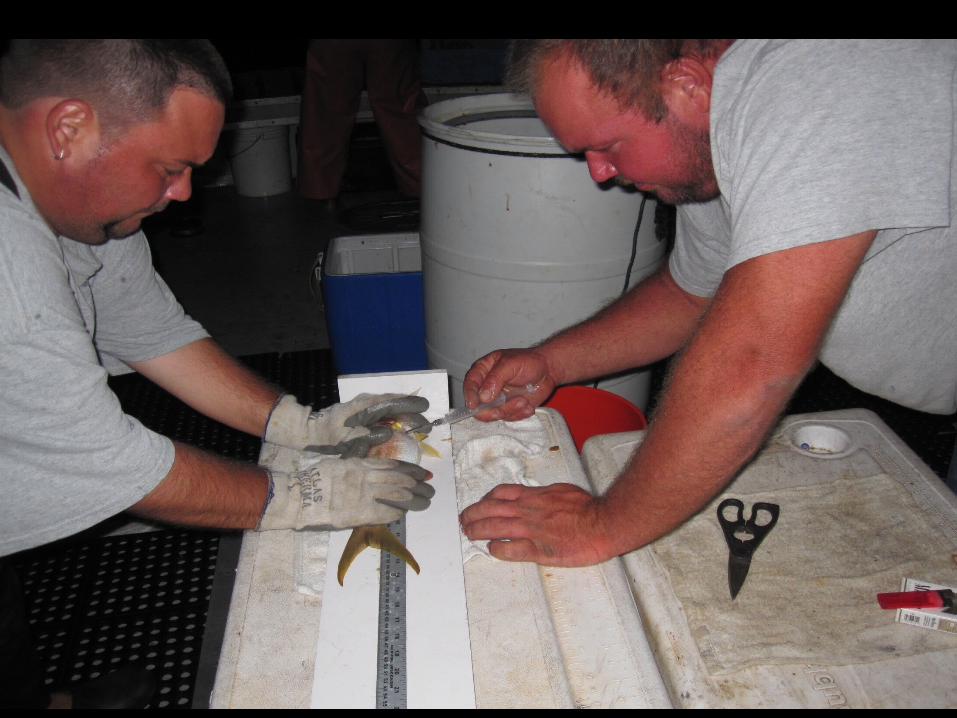
Pit Tags + Spaghetti Tags
1,346
Spaghetti Tags 742Genetic Samples 2,724

#2080555 days at large
Grew from 320 to 386 mm
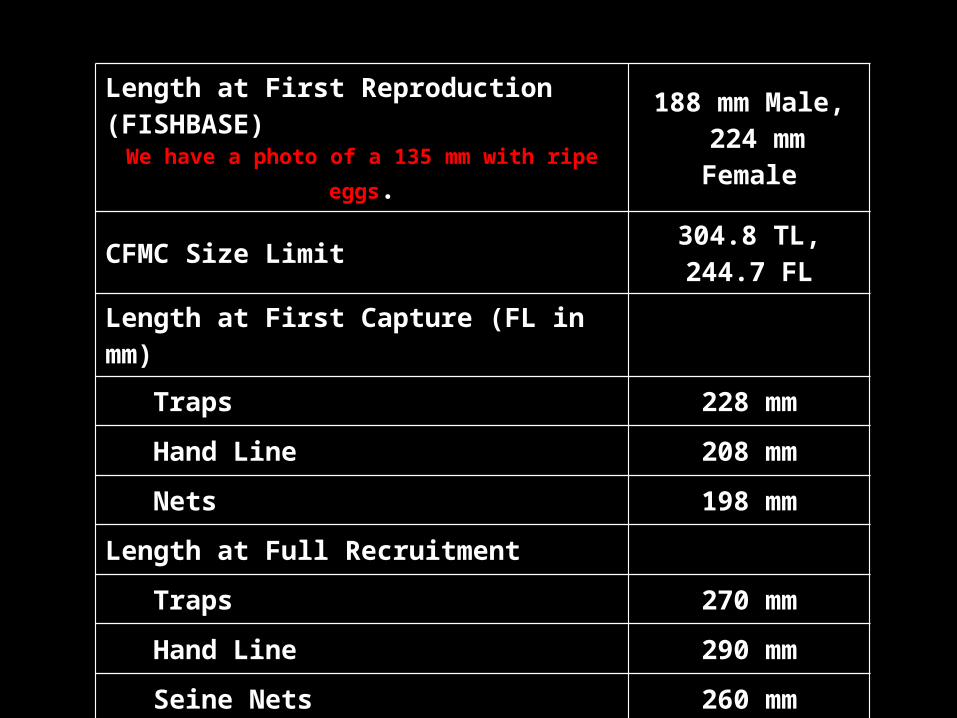
Length at First Reproduction (FISHBASE)We have a photo of a 135 mm with ripe eggs.
188 mm Male, 224 mm Female
CFMC Size Limit 304.8 TL, 244.7 FL
Length at First Capture (FL in mm)
Traps 228 mm
Hand Line 208 mm
Nets 198 mm
Length at Full Recruitment
Traps 270 mm
Hand Line 290 mm
Seine Nets 260 mm
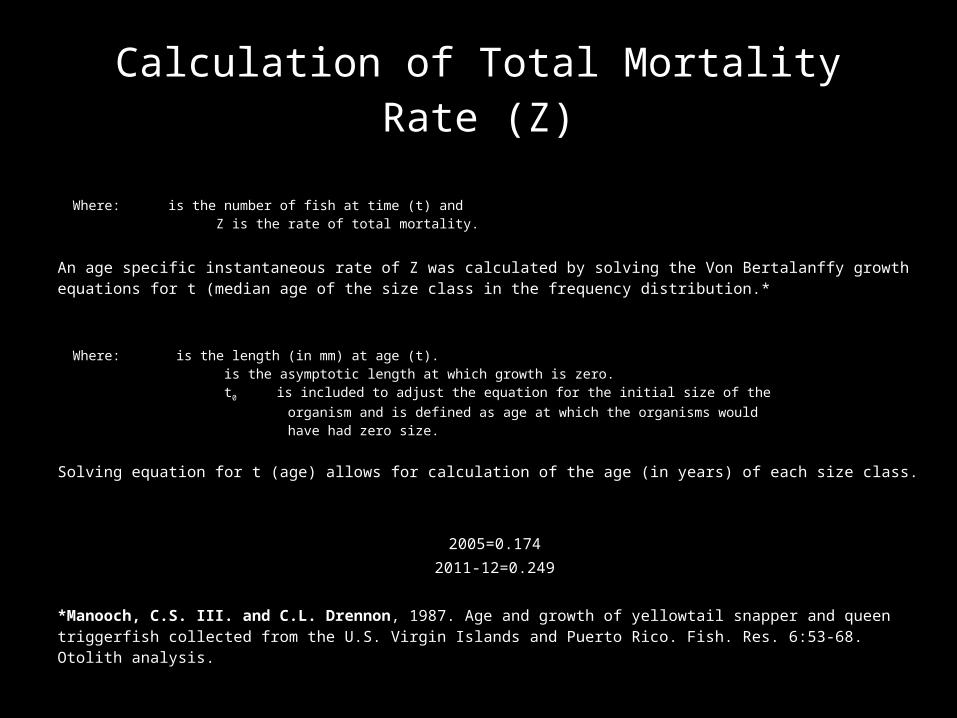
Calculation of Total Mortality Rate (Z)
Where: is the number of fish at time (t) and Z is the rate of total mortality.
An age specific instantaneous rate of Z was calculated by solving the Von Bertalanffy growth equations for t (median age of the size class in the frequency distribution.*
Where: is the length (in mm) at age (t). is the asymptotic length at which growth is zero. t0 is included to adjust the equation for the initial size of the organism and is defined as age at which the organisms would have had zero size.
Solving equation for t (age) allows for calculation of the age (in years) of each size class.
2005=0.1742011-12=0.249
*Manooch, C.S. III. and C.L. Drennon, 1987. Age and growth of yellowtail snapper and queen triggerfish collected from the U.S. Virgin Islands and Puerto Rico. Fish. Res. 6:53-68. Otolith analysis.
220240
260280
300320
340360
380400
420440
460480
500520
540560
580600
0.0%
2.0%
4.0%
6.0%
8.0%
10.0%
12.0%
14.0%
16.0%
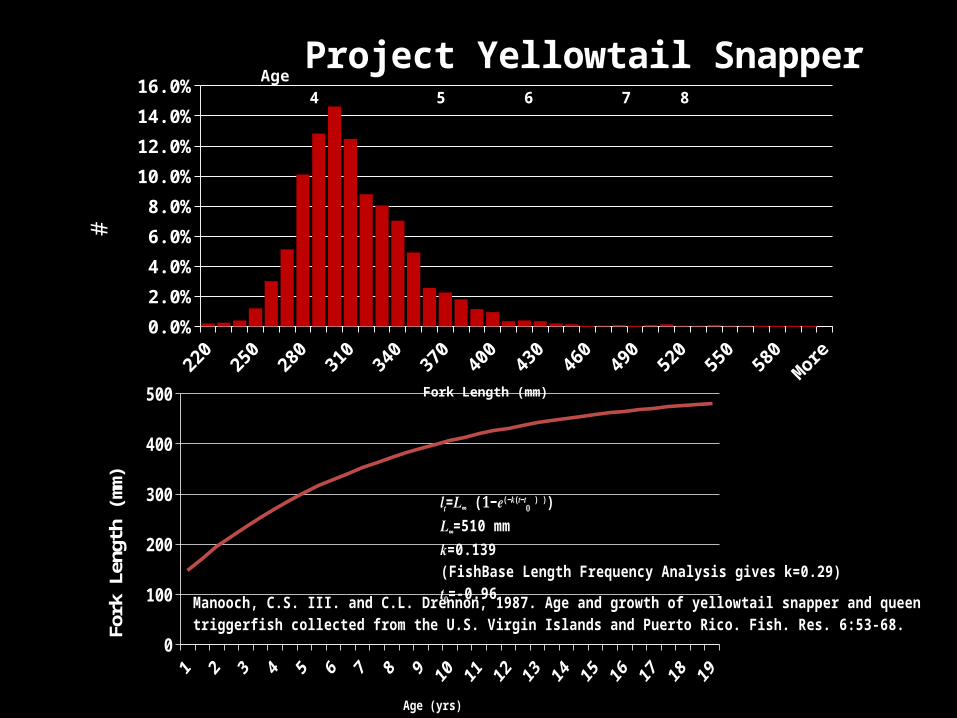
Project Yellowtail Snapper
Fork Length (mm)
#
Age 4 5 6 7 8
050
100150200250300350400450500
Age (yrs)
Fork
Len
gth
(mm
) 𝒍𝒕=𝑳∞ (𝟏−𝒆(−𝒌(𝒕−𝒕𝟎 ) ))𝑳∞=510 mm𝒌=0.139 (FishBase Length Frequency Analysis gives k=0.29)𝒕𝟎=-0.96Manooch, C.S. III. and C.L. Drennon, 1987. Age and growth of yellowtail snapper and queen triggerfish collected from the U.S. Virgin Islands and Puerto Rico. Fish. Res. 6:53-68.

Gear Selectivity
Where:S is Selectivity and and are calculated iteratively via nonlinear regression. From the non-linear model (Proc NLIN in SAS) with known values of size class and percent of the sampled population for that size class. The output was estimates of both parameters, which were then used within the selectivity equation to estimate size selectivity for each size class and particularly the size class at which selectivity peaked.

Selectivity Analysis: Fish TrapsYellowtail snapper (Ocyurus chrysurus) [Traps]
Size Class
220 230 240 250 260 270 280 290 300
Se
lectivity
0.0
0.2
0.4
0.6
0.8
1.0
1.2
ObservedPredicted

Selectivity Analysis: Hand LineYellowtail snapper (Ocyurus chrysurus) [Handline]
Size Class
200 220 240 260 280 300 320
Se
lectivity
0.0
0.2
0.4
0.6
0.8
1.0
1.2
ObservedPredicted


Survivorship at Coral World
0 1 2 3 4 5 6 7 8 9 10 11 12 13 14 15 16 17 18 19 20 21 22 23 24 25 26 27 28 29 300%
10%
20%
30%
40%
50%
60%
70%
80%
90%
100%
"3/18 All Tagged"
"5/27 Tagged"
"5/27 No Tag"
"7/27 No Tag, Octogon"
"7/27 No Tag, Quarantine"
Days
% S
urvi
vors
hip
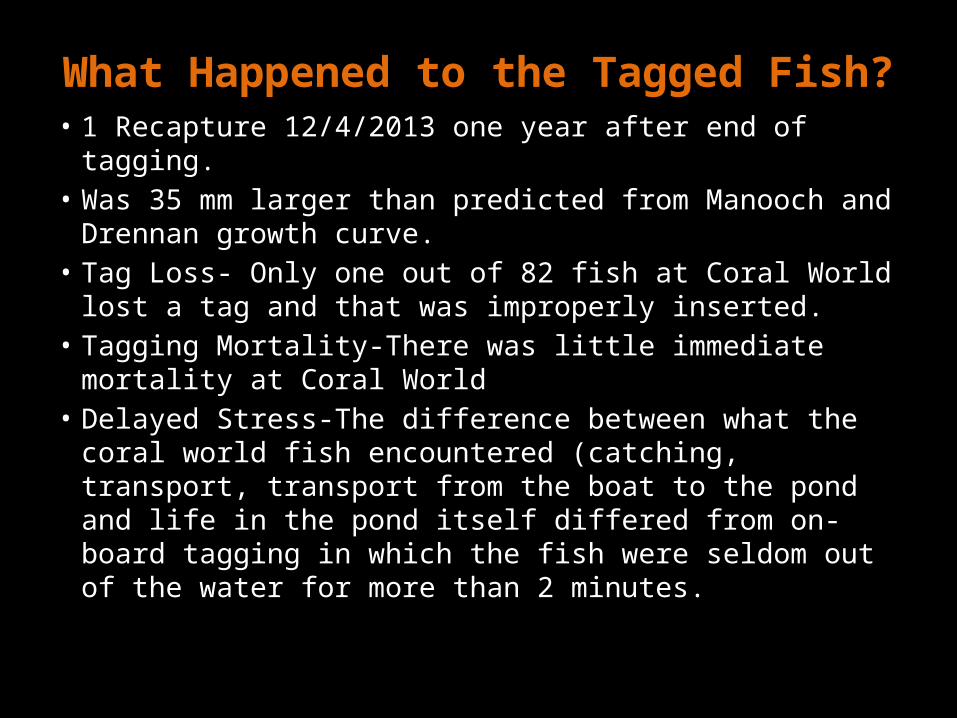
What Happened to the Tagged Fish?• 1 Recapture 12/4/2013 one year after end of tagging.• Was 35 mm larger than predicted from Manooch and
Drennan growth curve.• Tag Loss- Only one out of 82 fish at Coral World lost a tag
and that was improperly inserted.• Tagging Mortality-There was little immediate mortality at
Coral World• Delayed Stress-The difference between what the coral
world fish encountered (catching, transport, transport from the boat to the pond and life in the pond itself differed from on-board tagging in which the fish were seldom out of the water for more than 2 minutes.
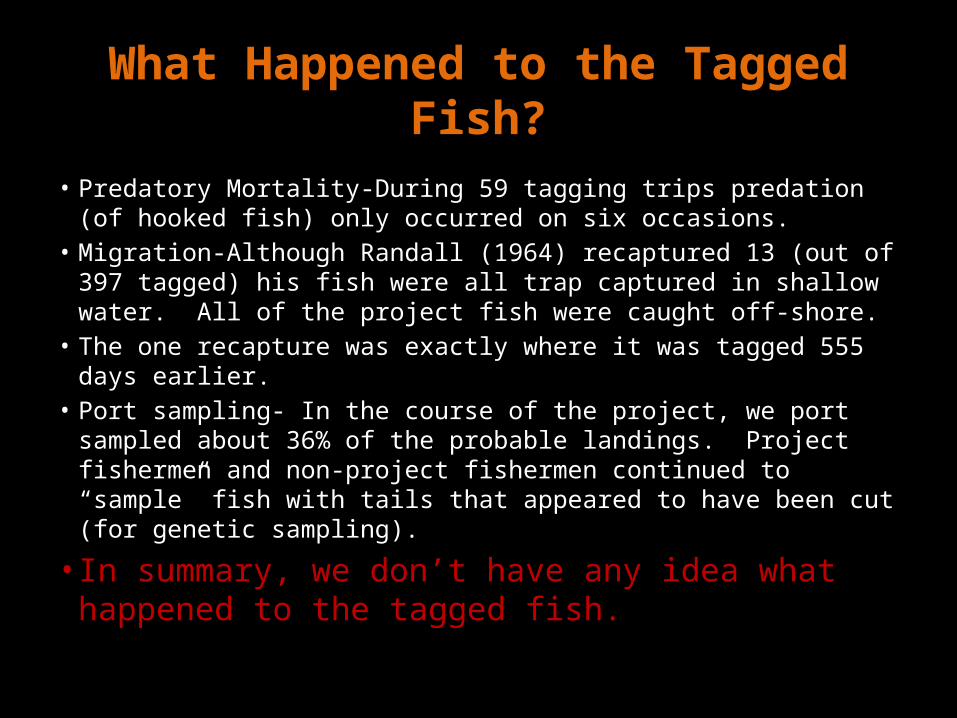
What Happened to the Tagged Fish?
• Predatory Mortality-During 59 tagging trips predation (of hooked fish) only occurred on six occasions.
• Migration-Although Randall (1964) recaptured 13 (out of 397 tagged) his fish were all trap captured in shallow water. All of the project fish were caught off-shore.
• The one recapture was exactly where it was tagged 555 days earlier.• Port sampling- In the course of the project, we port sampled about
36% of the probable landings. Project fishermen and non-project fishermen continued to “sample” fish with tails that appeared to have been cut (for genetic sampling).
• In summary, we don’t have any idea what happened to the tagged fish.

Calculation of Estimated Yellowtail Landings
• Data Sources– CCR Landings by method 1974-2012– TIP Data 1980-2012 (Length data and Species
Composition)

Finfish Landings by Method
19751978
19811984
19871990
19931996
19992002
20052008
2011
0
100,000
200,000
300,000
400,000
500,000
600,000
700,000
800,000
900,000
1,000,000St. Croix
Diving Nets Line Fishing
Traps
Tota
l Fin
fish
Land
ings
(lbs
)
19741976
19781980
19821984
19861988
19901992
19941996
19982000
20022004
20062008
20102012
0
100,000
200,000
300,000
400,000
500,000
600,000
700,000
800,000St. Thomas
Diving Nets Line Fishing
Traps
Tota
l Fin
fish
Land
ings
(lbs
)

St. Thomas Species Groups GROUPER;
14%
SNAPPER; 15%
TRIGGERFISH; 24%
SHELLFISH; 9%
SQUIRRELFISH; 1%
PORGY; 7%
PARROTFISH; 13%
GRUNT; 12%ANGELFISH, 4%
Trap Catch
GROUPER; 7%
SNAPPER; 57%
TUNA; 10%
JACK; 14%
Line Catch
SNAPPER; 39%
TUNA; 5%
JACK; 52%
Seine Net Catch
GROUPER; 15%
SNAPPER; 25%
TRIGGERFISH; 11%
PARROTFISH; 28%
JACK; 5%
GRUNT; 4% ANGELFISH; 8%
Diving Catch
GROUPER SNAPPER TRIGGERFISH DOLPHIN WAHOO TUNA BARRACUDA SHELLFISH SQUIRRELFISH PORGY PARROTFISH KING MACKEREL JACK HOGFISHGRUNT GOATFISH GAR ANGELFISH

St. Croix Species Groups
GROUPER4%
SNAPPER14%
TRIGGERFISH8%
PARROTFISH43%
GRUNT16%
Traps GROUPER6%
SNAPPER34%
DOLPHIN24%
WAHOO7%
TUNA17%
Line Fishing
SNAPPER4%
LOBSTER25%
CONCH29%
PARROTFISH31%
Diving
SNAPPER2%
PARROTFISH80%
JACK6%Nets GROUPER SNAPPER
LOBSTER CONCH
TRIGGERFISH DOLPHIN
WAHOO TUNA
BARRACUDA SHELLFISH
SQUIRRELFISH PORGY
PARROTFISH JACK
GRUNT GOATFISH
GAR ANGELFISH
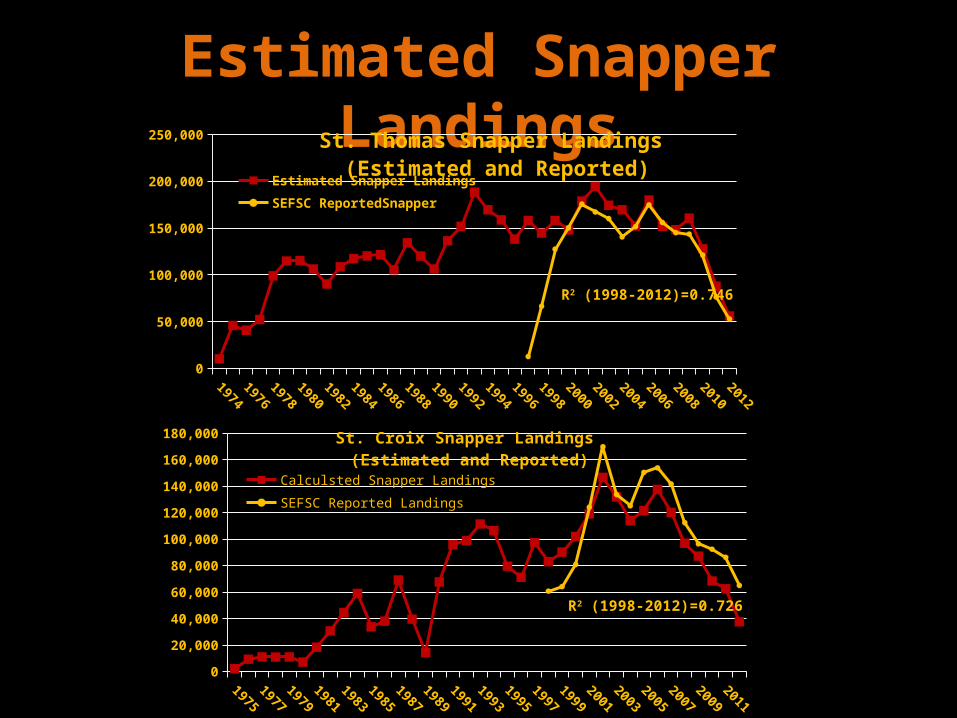
Estimated Snapper Landings
0
50,000
100,000
150,000
200,000
250,000 St. Thomas Snapper Landings (Estimated and Reported)
Estimated Snapper Landings
SEFSC ReportedSnapper
R2 (1998-2012)=0.746
19751977
19791981
19831985
19871989
19911993
19951997
19992001
20032005
20072009
2011
0
20,000
40,000
60,000
80,000
100,000
120,000
140,000
160,000
180,000 St. Croix Snapper Landings (Estimated and Reported)
Calculsted Snapper Landings
SEFSC Reported Landings
R2 (1998-2012)=0.726

St. Thomas Snapper Species(% of Total TIP Samples 1984-2012)
YELLOWTAIL SNAPPER, 98.81%
Net Caught Snapper
YELLOWTAIL SNAPPER; 94.45%
DOG SNAPPER; 2.30%
CARDINAL SNAPPER; 2.2%
YELLOWTAIL SNAPPER14%
VERMILION SNAPPER; 6.1%
MUTTON SNAPPER; 2.8%
CUBERA SNAPPER; 5.8%
SCHOOLMASTER; 4.2%SILK SNAPPER; 8.0%LANE SNAPPER; 5.1%
DOG SNAPPER; 22.7%
MAHOGANY SNAPPER; 4.3%
BLACKFIN SNAPPER; 0.2%
QUEEN SNAPPER; 6.9%
GRAY SNAPPER, 9.5%CARIBBEAN RED SNAPPER; 8.5%
Trap Caught Snapper CARDINAL SNAPPER
YELLOWTAIL SNAPPER
VERMILION SNAPPER
MUTTON SNAPPER
CUBERA SNAPPER
SCHOOLMASTER
SILK SNAPPER
LANE SNAPPER
DOG SNAPPER
MAHOGANY SNAPPER
BLACKFIN SNAPPER
QUEEN SNAPPER
GRAY SNAPPER
CARIBBEAN RED SNAPPER
Line Caught Snapper

St. Croix Snapper Species
MUTTON SNAPPER
15%
YELLOWTAIL SNAPPER
8%
BLACKFIN SNAPPER23%SILK SNAPPER
36%
VERMILION SNAPPER
4%
WENCHMAN12%
St. Croix Line Snapper Landings
MUTTON SNAPPER YELLOWTAIL SNAPPER SCHOOLMASTERDOG SNAPPER LANE SNAPPER MAHOGANY SNAPPERBLACKFIN SNAPPER CUBERA SNAPPER SILK SNAPPERVERMILION SNAPPER WENCHMAN SNAPPERS, LUTJANIDAE
MUTTON SNAPPER
14%
YELLOW-TAIL
SNAPPER43%
SCHOOLMASTER
23%
St. Croix Trap Snapper Landings
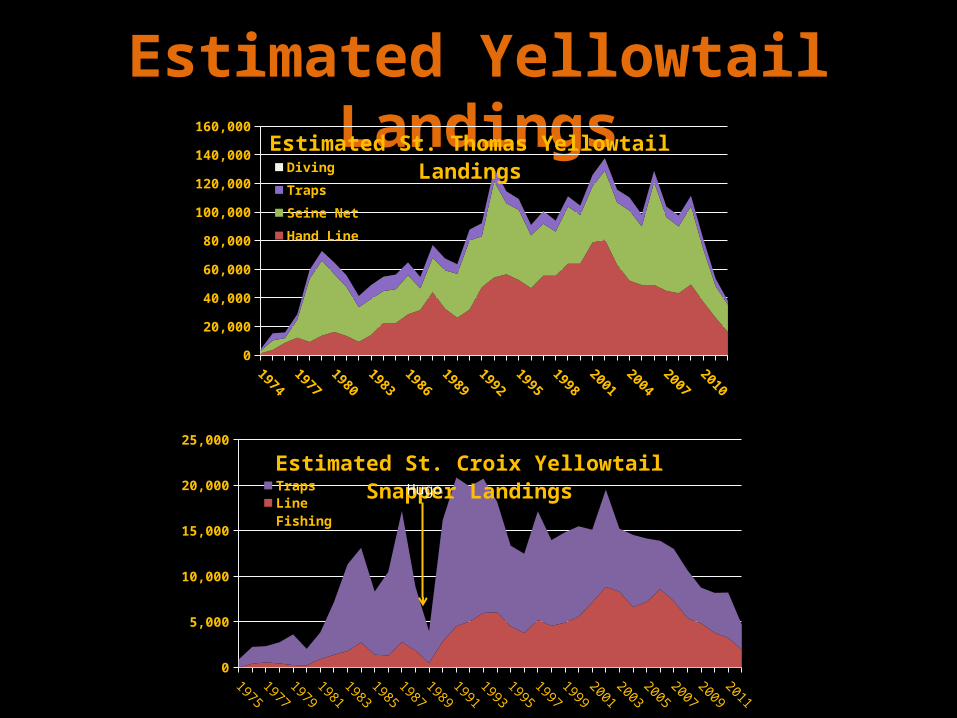
Estimated Yellowtail Landings
19741976
19781980
19821984
19861988
19901992
19941996
19982000
20022004
20062008
20102012
0
20,000
40,000
60,000
80,000
100,000
120,000
140,000
160,000Estimated St. Thomas Yellowtail LandingsDiving
Traps
Seine Net
Hand Line
19751977
19791981
19831985
19871989
19911993
19951997
19992001
20032005
20072009
2011
0
5,000
10,000
15,000
20,000
25,000
Estimated St. Croix Yellowtail Snapper LandingsTraps
Line Fishing
Hugo
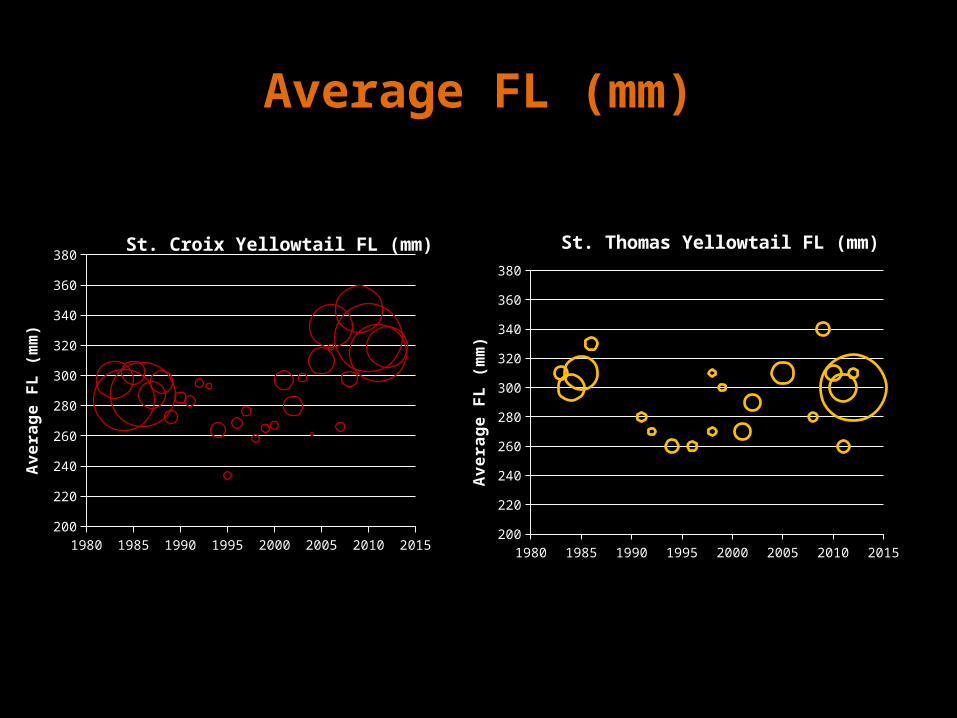
Average FL (mm)
1980 1985 1990 1995 2000 2005 2010 2015200
220
240
260
280
300
320
340
360
380St. Croix Yellowtail FL (mm)
Ave
rage
FL
(mm
)
1980 1985 1990 1995 2000 2005 2010 2015200
220
240
260
280
300
320
340
360
380
St. Thomas Yellowtail FL (mm)
Ave
rage
FL
(mm
)
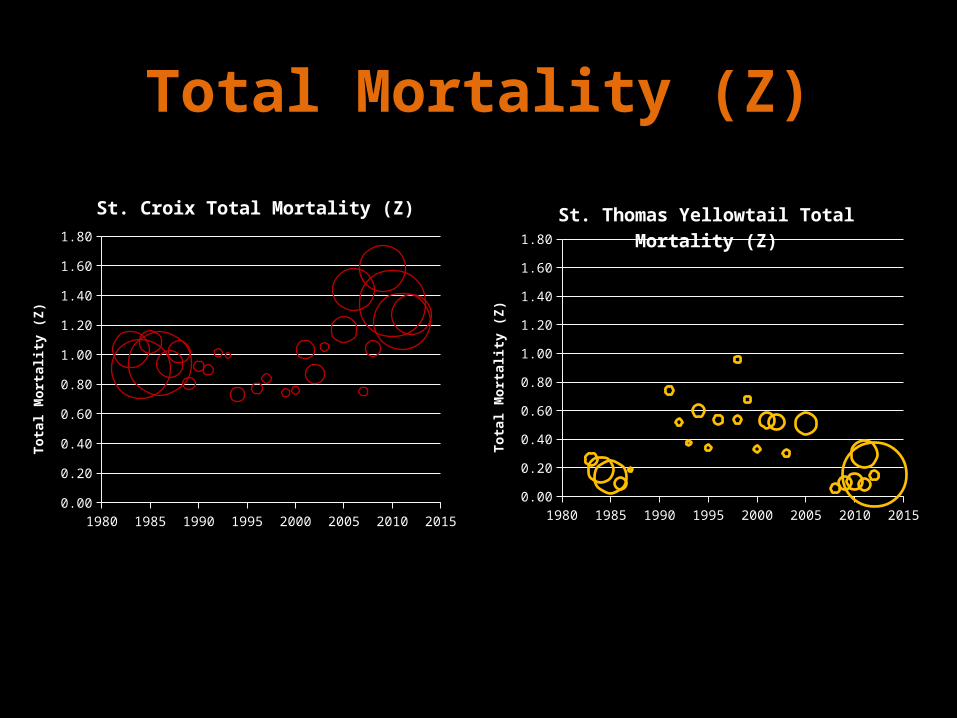
Total Mortality (Z)
1980 1985 1990 1995 2000 2005 2010 20150.00
0.20
0.40
0.60
0.80
1.00
1.20
1.40
1.60
1.80
St. Thomas Yellowtail Total Mortality (Z)
Tota
l Mor
talit
y (Z
)1980 1985 1990 1995 2000 2005 2010 2015
0.00
0.20
0.40
0.60
0.80
1.00
1.20
1.40
1.60
1.80
St. Croix Total Mortality (Z)
Tota
l Mor
talit
y (Z
)
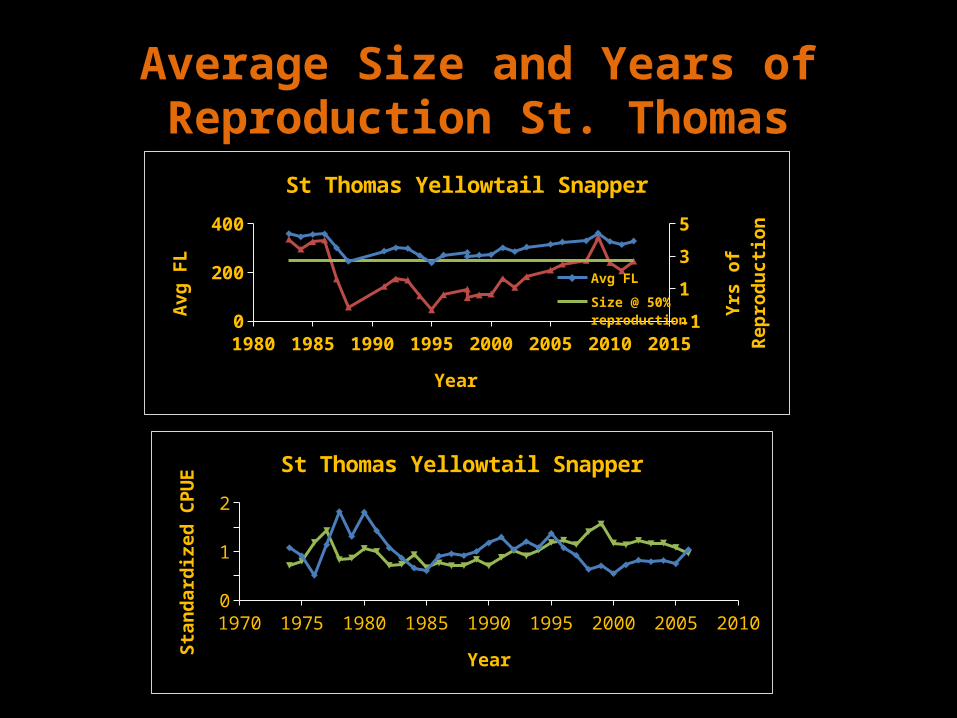
Average Size and Years of Reproduction St. Thomas
1970 1975 1980 1985 1990 1995 2000 2005 20100
0.5
1
1.5
2
St Thomas Yellowtail SnapperNetsLine
Year
Stan
dard
ized
CPU
E
1980 1985 1990 1995 2000 2005 2010 20150
100
200
300
400
-1
1
3
5
St Thomas Yellowtail Snapper
Avg FL
Size @ 50% reproduction
Yrs of reproduction
Year
Avg
FL
Yrs
of R
epro
ducti
on

Average Size and Years of Reproduction: St. Croix
1970 1975 1980 1985 1990 1995 2000 2005 20100
0.51
1.52
2.53
Line
Traps
Year
Stan
dard
ized
CPU
E
1980 1985 1990 1995 2000 2005 2010 20150
100
200
300
400
-1
1
3
5
St Croix Yellowtail Snapper
Avg FLSize @ 50% reproductionYrs of reproduction
Year
Avg
FL
Yrs
of R
epro
ducti
on

Conclusions• Fishing pressure and landings on St. Thomas are nearly 10 times
higher than on St. Croix.• Currently the average size yellowtail being harvested in St. Croix is
larger than on St. Thomas.• Total mortality (Z) as determined from catch curves is significantly
higher on St. Croix.• There are no particular trends on CPUE on either island.• There do not appear to be signs of overfishing on either island.• Average size on both islands is close to the age at which 50% of the
population become reproductive. This should be monitored in order to insure the continued health of the fishery.
• There should be more study of this species given its importance. Particularly:– Size at first reproduction– Age and Growth
Related Documents