ARCTIC VOL. 63, NO. 1 (MARCH 2010) P. 43–52 Population, Sex Ratios and Development in Greenland LAWRENCE C. HAMILTON 1 and RASMUS OLE RASMUSSEN 2 (Received 18 February 2009; accepted in revised form 22 June 2009) ABSTRACT. During the 20th century, Greenland society experienced a dramatic transformation from scattered settlements based on hunting, with mostly turf dwellings, to an urbanizing post-industrial economy. This transformation compressed socioeconomic development that took centuries to millennia elsewhere into a few generations. The incomplete demographic transition that accompanied this development broadly followed the classical pattern, but with distinctive variations relating to Greenland’s Arctic environment, sparse population, and historical interactions between two cultures: an indigenous Inuit majority and an influential Danish minority. One heritage from Danish colonial administration, and continued more recently under Greenland Home Rule, has been the maintenance of population statistics. Time series of demographic indicators, some going back into the 18th century, provide a uniquely detailed view of the rapid hunting-to-post-industrial transition. Changing sex ratios—an early excess of females, shifting more recently to an excess of males—reflect differential impacts of social, economic, and technological developments. Key words: Greenland, demography, population, sex ratio, migration, fertility, mortality, demographic transition RÉSUMÉ. Au cours du XX e siècle, la société du Groenland a connu une transformation dramatique, passant ainsi de peuplements de chasse éparpillés composés principalement d’habitations en tourbe à une économie urbanisée post-indus- trielle. Cette transformation a eu pour effet de comprimer le développement socioéconomique qui s’était échelonné sur des siècles, voire des millénaires ailleurs, en quelques générations. La transition démographique incomplète qui a accompagné ce développement a largement suivi le modèle classique, en étant toutefois assortie de variantes distinctives en ce qui a trait à l’environnement arctique du Groenland, à sa population rare et aux interactions historiques entre deux cultures : une majorité indigène inuite et une minorité danoise influente. Le maintien de statistiques sur la population découle de l’administration coloniale danoise, ce qui se continue en vertu de l’autonomie interne du Groenland. Les analyses chronologiques des indicateurs démographiques, dont certaines remontent au XVIII e siècle, fournissent une vue unique et détaillée de la transition entre les peuplements de chasse et l’économie post-industrielle, transition qui s’est faite rapidement. Les rapports hommes- femmes changeants — un ancien excédent de femmes est devenu récemment un excédent d’hommes — sont le reflet des répercussions différentes en matière de progrès sociaux, économiques et technologiques. Mots clés : Groenland, démographie, population, rapport hommes-femmes, migration, fertilité, mortalité, transition démographique Traduit pour la revue Arctic par Nicole Giguère. 1 Sociology Department, University of New Hampshire, Durham, New Hampshire 03824, USA; [email protected] 2 Nordregio — Nordic Centre for Spatial Development, Holmamiralens Väg 10, Box 1658, SE-111 86 Stockholm, Sweden; [email protected] © The Arctic Institute of North America INTRODUCTION During the 20th century, Greenland experienced a dramatic transformation from scattered settlements based on hunting, with mostly turf dwellings, to an urbanizing post-industrial economy (illustrated by identically positioned views of the main city in Figs. 1 and 2). This transformation compressed socioeconomic development that took centuries to millen- nia elsewhere into a few generations. As might be expected, demographic changes accompanied this development. Greenland experienced an incomplete demographic transi- tion, broadly following the classical pattern but with several distinctive features. Historical changes in the population structure of Greenland’s indigenous Inuit majority reflect the hazards of traditional Arctic livelihoods, technological innovations that made hunting and fishing less risky, pub- lic health programs that rapidly altered mortality and fertil- ity, shifting gender roles and gender-specific occupations, and intermarriage with the Danish minority who moved to Greenland in connection with colonial and post-colonial development. Population statistics maintained by Danish authorities—and more recently, their Home Rule succes- sors—provide a uniquely detailed window on this hunting- to-post-industrial transformation. Demographic transition theory describes an ideal pattern of change, from pre-modern states of high fertility and high mortality to post-industrial states of low fertility and low mortality (Thompson, 1929; Notestein, 1945). Historical

Welcome message from author
This document is posted to help you gain knowledge. Please leave a comment to let me know what you think about it! Share it to your friends and learn new things together.
Transcript
ARCTIC
VOL. 63, NO. 1 (MARCH 2010) P. 43–52
Population, Sex Ratios and Development in GreenlandLawRence c. HamiLton1 and RaSmuS oLe RaSmuSSen2
(Received 18 February 2009; accepted in revised form 22 June 2009)
aBStRact. During the 20th century, Greenland society experienced a dramatic transformation from scattered settlements based on hunting, with mostly turf dwellings, to an urbanizing post-industrial economy. this transformation compressed socioeconomic development that took centuries to millennia elsewhere into a few generations. the incomplete demographic transition that accompanied this development broadly followed the classical pattern, but with distinctive variations relating to Greenland’s arctic environment, sparse population, and historical interactions between two cultures: an indigenous inuit majority and an influential Danish minority. One heritage from Danish colonial administration, and continued more recently under Greenland Home Rule, has been the maintenance of population statistics. time series of demographic indicators, some going back into the 18th century, provide a uniquely detailed view of the rapid hunting-to-post-industrial transition. changing sex ratios—an early excess of females, shifting more recently to an excess of males—reflect differential impacts of social, economic, and technological developments.
Key words: Greenland, demography, population, sex ratio, migration, fertility, mortality, demographic transition
RÉSumÉ. au cours du XXe siècle, la société du Groenland a connu une transformation dramatique, passant ainsi de peuplements de chasse éparpillés composés principalement d’habitations en tourbe à une économie urbanisée post-indus-trielle. cette transformation a eu pour effet de comprimer le développement socioéconomique qui s’était échelonné sur des siècles, voire des millénaires ailleurs, en quelques générations. La transition démographique incomplète qui a accompagné ce développement a largement suivi le modèle classique, en étant toutefois assortie de variantes distinctives en ce qui a trait à l’environnement arctique du Groenland, à sa population rare et aux interactions historiques entre deux cultures : une majorité indigène inuite et une minorité danoise influente. Le maintien de statistiques sur la population découle de l’administration coloniale danoise, ce qui se continue en vertu de l’autonomie interne du Groenland. Les analyses chronologiques des indicateurs démographiques, dont certaines remontent au XViiie siècle, fournissent une vue unique et détaillée de la transition entre les peuplements de chasse et l’économie post-industrielle, transition qui s’est faite rapidement. Les rapports hommes-femmes changeants — un ancien excédent de femmes est devenu récemment un excédent d’hommes — sont le reflet des répercussions différentes en matière de progrès sociaux, économiques et technologiques.
mots clés : Groenland, démographie, population, rapport hommes-femmes, migration, fertilité, mortalité, transition démographique
traduit pour la revue Arctic par nicole Giguère.
1 Sociology Department, university of new Hampshire, Durham, new Hampshire 03824, uSa; [email protected] 2 nordregio — nordic centre for Spatial Development, Holmamiralens Väg 10, Box 1658, Se-111 86 Stockholm, Sweden; [email protected] © the arctic institute of north america
intRoDuction
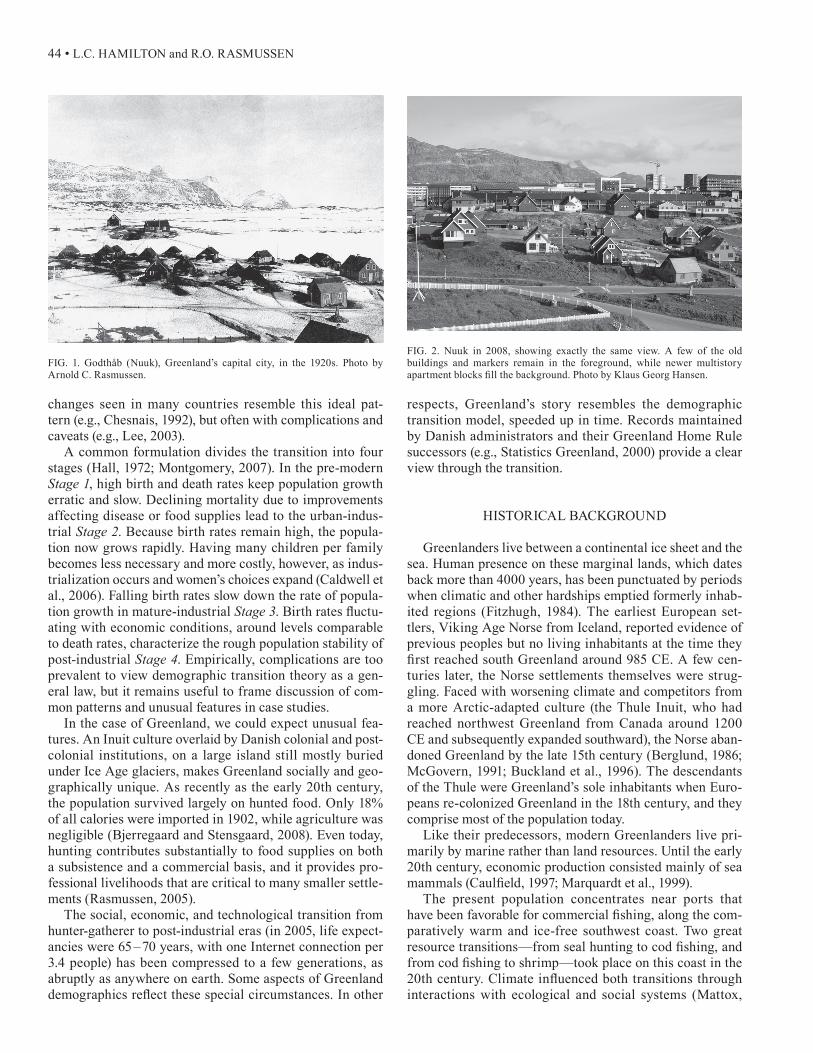
During the 20th century, Greenland experienced a dramatic transformation from scattered settlements based on hunting, with mostly turf dwellings, to an urbanizing post-industrial economy (illustrated by identically positioned views of the main city in Figs. 1 and 2). this transformation compressed socioeconomic development that took centuries to millen-nia elsewhere into a few generations. as might be expected, demographic changes accompanied this development. Greenland experienced an incomplete demographic transi-tion, broadly following the classical pattern but with several distinctive features. Historical changes in the population structure of Greenland’s indigenous Inuit majority reflect
the hazards of traditional arctic livelihoods, technological innovations that made hunting and fishing less risky, pub-lic health programs that rapidly altered mortality and fertil-ity, shifting gender roles and gender-specific occupations, and intermarriage with the Danish minority who moved to Greenland in connection with colonial and post-colonial development. Population statistics maintained by Danish authorities—and more recently, their Home Rule succes-sors—provide a uniquely detailed window on this hunting-to-post-industrial transformation.
Demographic transition theory describes an ideal pattern of change, from pre-modern states of high fertility and high mortality to post-industrial states of low fertility and low mortality (thompson, 1929; notestein, 1945). Historical
44 • L.c. HamiLton and R.o. RaSmuSSen
changes seen in many countries resemble this ideal pat-tern (e.g., chesnais, 1992), but often with complications and caveats (e.g., Lee, 2003).
a common formulation divides the transition into four stages (Hall, 1972; montgomery, 2007). in the pre-modern Stage 1, high birth and death rates keep population growth erratic and slow. Declining mortality due to improvements affecting disease or food supplies lead to the urban-indus-trial Stage 2. Because birth rates remain high, the popula-tion now grows rapidly. Having many children per family becomes less necessary and more costly, however, as indus-trialization occurs and women’s choices expand (caldwell et al., 2006). Falling birth rates slow down the rate of popula-tion growth in mature-industrial Stage 3. Birth rates fluctu-ating with economic conditions, around levels comparable to death rates, characterize the rough population stability of post-industrial Stage 4. empirically, complications are too prevalent to view demographic transition theory as a gen-eral law, but it remains useful to frame discussion of com-mon patterns and unusual features in case studies.
in the case of Greenland, we could expect unusual fea-tures. an inuit culture overlaid by Danish colonial and post-colonial institutions, on a large island still mostly buried under ice age glaciers, makes Greenland socially and geo-graphically unique. as recently as the early 20th century, the population survived largely on hunted food. only 18% of all calories were imported in 1902, while agriculture was negligible (Bjerregaard and Stensgaard, 2008). even today, hunting contributes substantially to food supplies on both a subsistence and a commercial basis, and it provides pro-fessional livelihoods that are critical to many smaller settle-ments (Rasmussen, 2005).
the social, economic, and technological transition from hunter-gatherer to post-industrial eras (in 2005, life expect-ancies were 65–70 years, with one internet connection per 3.4 people) has been compressed to a few generations, as abruptly as anywhere on earth. Some aspects of Greenland demographics reflect these special circumstances. In other
respects, Greenland’s story resembles the demographic transition model, speeded up in time. Records maintained by Danish administrators and their Greenland Home Rule successors (e.g., Statistics Greenland, 2000) provide a clear view through the transition.
HiStoRicaL BacKGRounD
Greenlanders live between a continental ice sheet and the sea. Human presence on these marginal lands, which dates back more than 4000 years, has been punctuated by periods when climatic and other hardships emptied formerly inhab-ited regions (Fitzhugh, 1984). the earliest european set-tlers, Viking age norse from iceland, reported evidence of previous peoples but no living inhabitants at the time they first reached south Greenland around 985 CE. A few cen-turies later, the norse settlements themselves were strug-gling. Faced with worsening climate and competitors from a more arctic-adapted culture (the thule inuit, who had reached northwest Greenland from canada around 1200 ce and subsequently expanded southward), the norse aban-doned Greenland by the late 15th century (Berglund, 1986; mcGovern, 1991; Buckland et al., 1996). the descendants of the thule were Greenland’s sole inhabitants when euro-peans re-colonized Greenland in the 18th century, and they comprise most of the population today.
Like their predecessors, modern Greenlanders live pri-marily by marine rather than land resources. until the early 20th century, economic production consisted mainly of sea mammals (Caulfield, 1997; Marquardt et al., 1999).
the present population concentrates near ports that have been favorable for commercial fishing, along the com-paratively warm and ice-free southwest coast. two great resource transitions—from seal hunting to cod fishing, and from cod fishing to shrimp—took place on this coast in the 20th century. Climate influenced both transitions through interactions with ecological and social systems (mattox,
FiG. 1. Godthåb (nuuk), Greenland’s capital city, in the 1920s. Photo by arnold c. Rasmussen.
FiG. 2. nuuk in 2008, showing exactly the same view. a few of the old buildings and markers remain in the foreground, while newer multistory apartment blocks fill the background. Photo by Klaus Georg Hansen.
GREENLAND DEMOGRAPHY • 45
1973; Buch and Hansen, 1988; Vilhjálmsson, 1997; Hamil-ton et al., 2000, 2003).
european explorers and whalers landed occasionally in Greenland during the 16th and 17th centuries. a Danish expedition resulted in a claim of Greenland for Denmark and the establishing of the first West Greenland settle-ment, near modern-day nuuk, in 1721. Settlements came later among the more remote populations of east Greenland (1884; 431 Greenlanders at the first headcount in 1901) and north Greenland (a mission station in 1909; 250 Greenland-ers counted in 1921). through the 19th and 20th centuries, Greenland’s development processes were dominated by shifting Danish objectives, from early colonization to colo-nialism, imperialism, modernization, and liberation. each objective left a mark on the settlement patterns (Rasmussen and Hamilton, 2001).
in 1953, Greenland’s status changed from Danish col-ony to Danish county, and in 1979, Greenland was granted the limited sovereignty of Home Rule government. Popu-lation grew slowly, from 8000 to 17 000 (nearly all Green-land-born) over the 90 years 1840–1930. after world war ii, public health improvements, including development of health infrastructure and a campaign against tuberculosis, propelled a period of faster growth. in one 20-year period, 1950 – 1970, the population doubled (24 000 to 47 000), while the proportion born in Greenland (an imperfect but administratively registered proxy for inuit) fell from 97% to 84%. This shift reflected an influx of temporary work-ers, mainly from Denmark, invited by the colonial govern-ment in order to modernize the society with new housing, infrastructure, and health services. unlike the migration-driven postwar population booms of other arctic regions, however, the overall growth in Greenland’s case owed more to natural increase than to newcomers (Bogoyavlenskiy and Siggner, 2004).
in the early years after Home Rule was established, inflows from Denmark continued, now providing civil serv-ants for the new government. as the Home Rule govern-ment assumed more responsibility, the proportion of Danes stabilized and eventually began to drop, while the Green-land-born population growth slowed but stayed positive. By 2007, the total population stood at 56 600, 89% of them born in Greenland. outmigration and a falling birth rate have halted overall growth in the last decade. net outmigration among both Greenland-born and elsewhere-born popula-tions offsets natural increase, while increasing the propor-tion that are Greenland-born among those who remain.
climate and geography constrain many activities, from farming to trade, that support modern societies elsewhere. Greenland’s present economy depends mainly on com-mercial fisheries and subsidies from Denmark. This nar-rowly based economy coexists with small-scale hunting and fishing activities that provide significant food, as well as cultural and individual identity. Hunting receives some subsidies from the state, which serve indirectly to sup-port rural life and communities. the coexistence of mod-ern and traditional livelihoods remains prominent because
modernization has been so recent and is by no means complete.
Historical analyses include marquardt’s (2002) examina-tion of Christianization and economic influences on Green-land demographics since 1700. Rasmussen (2007) describes how socioeconomic changes accompanied the shift from hunting to fishing (also see Caulfield, 1997). Interactions between national and regional levels and the local level, which tends to be the most traditional, play out in the economy (Rasmussen, 2001). a detailed survey of hunters observed that their activities vary substantially from one municipality to the next and are more important in smaller places (Rasmussen, 2005). Rasmussen and Hamilton (2001) outline the development of commercial fisheries, which redefined the main towns. Lauritzen (1989) chronicles the transition from Danish to Home Rule government. Poppel (1997) reviews how economic changes have affected the population during the Home Rule period. Full independ-ence from Denmark remains a goal for many Greenlanders, but it does not yet appear practical because export earnings provide less than half of Greenland’s gross national prod-uct. Several large resource-development plans (hydroelec-tric, aluminum, and mining) are currently under discussion, with suggestions that these might offer steps toward eco-nomic independence.
PoPuLation, BiRtHS anD DeatHS
most Greenlanders today are inuit descendants of the thule, who reached Greenland in comparatively small numbers around 1200 ce. their technology, which was well adapted to arctic environments, allowed the thule to survive chiefly through hunting of seals, supplemented by whales, a few land mammals, fish, and birds. Growth over the next six centuries was slow overall, with intervals of hard times due to the variable climate and to diseases such as smallpox and other epidemics that reduced the popula-tion from around 8000 to 6000 during the 18th century. the pre-modern Stage 1 of a demographic transition, wherein high death rates and sometimes limited fertility (see mar-quardt, 2002) permit only halting growth, describes most of this period.
Figure 3 graphs Greenland’s population beginning in 1781, five years after the Royal Greenland Trade Company (Kongelige Grønlandske Handel, or KGH) received a trade monopoly that would continue until 1950. the introduc-tion of the trade monopoly had many consequences. most immediately, it led to a more systematic flow of supplies from Denmark to Greenland, with commodities such as sugar, coffee, tobacco, and iron in the form of blades for knives and spearheads for harpoons. Later on, it would lead to a more diverse supply pattern, including guns to hunt seals for the blubber and pelts desired by the KGH.
Demographic patterns were shifting during the 19th and early 20th centuries, although not yet to the classic Stage 2. Under colonial rule, conditions became sufficiently
46 • L.c. HamiLton and R.o. RaSmuSSen
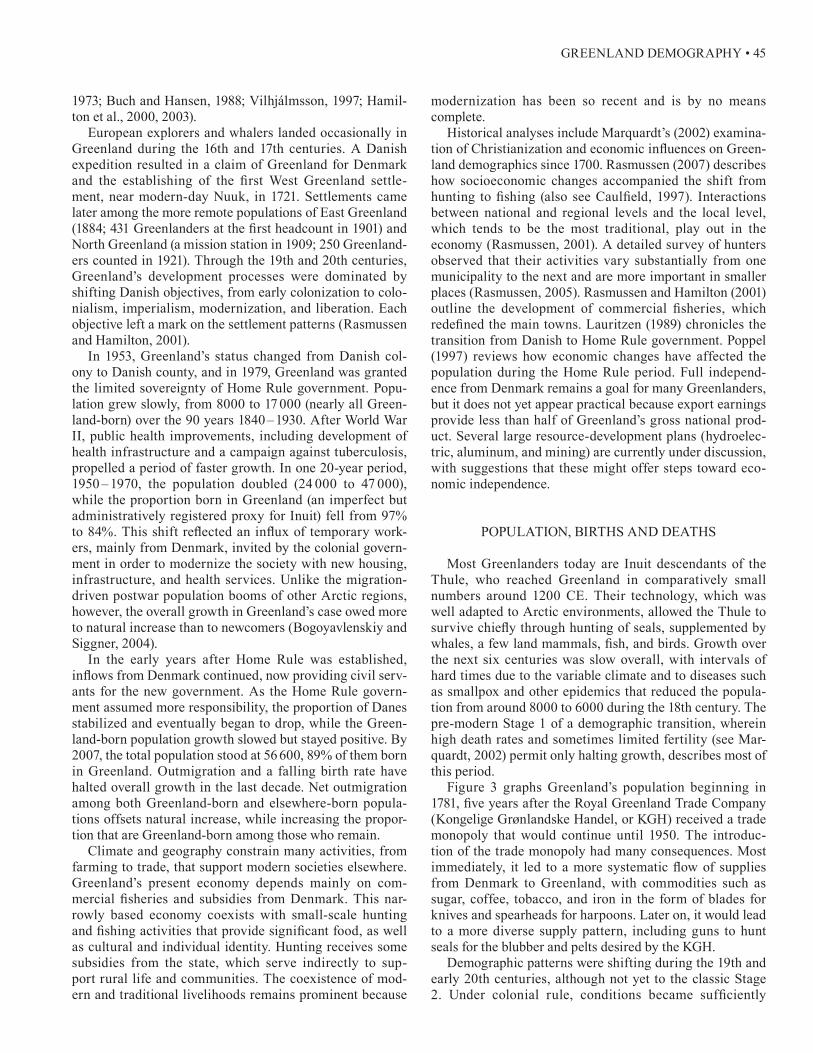
favorable for the population to double from 6000 people in 1800 to almost 12 000 by 1900. more detailed demographic data are available for the years after 1880, confirming the surplus of births over deaths. By the early 20th century, birth rates were unevenly rising while death rates fell, cre-ating a widening gap. natural increase averaged a bit more than 100 people per year, on the order of 1% of the popula-tion, over 1883–1919. Food supplies still depended largely on hunting, the dangers of which had demographic effects. Hunting grew less risky and more efficient as the KGH brought in european guns and boats.
More efficient hunting depleted seal populations around the trade stations, even as the human population increased. Health also constrained population growth: in 1925, more than half of all deaths in Greenland were caused by tuber-culosis and infectious disease (Koch et al., 2008).
warming climate in the 1920s further reduced seal hunt-ing, but also brought a new resource: cod began to appear in substantial numbers along the southwest Greenland coast (mattox, 1973; Hamilton et al., 2000). the market substitu-tion of much cheaper mineral oils for seal and whale oils drove Danish planners to consider new resources. they saw an opportunity to avert crisis and build a new economy around commercial fishing. Investments in training, ves-sels, fish-processing facilities, and transportation built com-mercial fishing into the engine for Greenland’s industrial and urban development (Rasmussen and Hamilton, 2001). in Greenland’s case, “urbanization” meant increasing the concentration of people in towns near good fishing grounds, rather than in the tiny dispersed settlements necessitated by a hunting economy.
after 1920, as Greenland reoriented towards commer-cial fishing, birth rates climbed steeply while death rates fell unevenly. Population growth took off, doubling again in
just 30 years. mean natural increase was about 275 per year from 1920 to 1949, on the order of 2%. Before world war ii, Greenland had been a closed area, inaccessible except to the colonial government and the KGH. the rationale for closure involved protection of traditional lifestyles and language (as well as trade). closure also had the effect, however, of lim-iting outside access to information about Greenlanders’ liv-ing conditions, such as poor housing, ill health, or periods of starvation. Pictures showing such conditions were taken by Danish photographer Jette Bang beginning in the 1930s and published after the war. the photographs created public demand in Denmark for modernization. the consequences included establishment of a tuberculosis treatment facility in Godthåb (the largest town and capital, later renamed to nuuk; see Figs. 1 and 2) and a steep decline in tuberculo-sis (from 719 per 100 000 in 1951–54 to 134 per 100 000 in 1955–59) due to broad intervention programs (Bjerregaard and Young, 1998; Bjerregaard, 2003; Koch et al., 2008). improved living conditions also brought health improve-ments as safer water supplies and wooden houses replaced turf huts in the settlements. crude death rates dropped below 15 per 1000 population in 1955, meeting Stockwell’s (1963) criterion for Stage 2.
the G50-plan (Grønlandskommissionen, 1950), an over-all economic development plan based primarily on local fisheries, was an important step towards modernization. First attempts aimed at development through public invest-ment in infrastructure and private investment in industry. as the attempt failed, a second plan ten years later—the G60-plan (Grønlandskommissionen, 1964)—focused instead on public investment in new production activities, followed by an attempt to concentrate the population into the larger set-tlements, partly by persuasion, partly by material incentives such as providing new houses and dwellings, or access to schools and shops. negative incentives appeared in efforts to close public facilities in smaller settlements. the ration-ale for concentration was to avoid spreading investments too thinly, but instead provide substantial funding for major improvements in larger settlements.
in this stage, population growth accelerated to more than 800 per year (reaching 4%) from 1950 to 1979. Birth rates began declining in the mid-1960s. a family planning campaign launched in the late 1960s distributed intrauter-ine devices to approximately half the female population of reproductive age (Bjerregaard and Stensgaard, 2008). abor-tion was legalized in 1975. the Greenland women’s organ-ization (De Grønlandske Kvindefoeninger), a driving force behind both changes, also helped to emphasize their volun-tary nature (Pedersen, 1989). Birth rates fell below 35 per 1000 population (Stockwell’s criterion for Stage 3) in 1969 and continued to decline through the mid-1970s. Bogoyav-lenskiy and Siggner (2004:32) describe this period as “pos-sibly the fastest and the most significant decline in fertility rate in the world.” the Greenland-born population never-theless grew rapidly, reaching 41 000 by 1980.
as death rates stopped declining, and birth rates fell steeply, natural increase cooled off to about 550 per year,
Birth rate
Death rate
Greenlandic population
010
2030
4050
Pop
ulat
ion
in 1
,000
s
010
2030
4050
Birt
hs o
r de
aths
per
1,0
00
1780 1800 1820 1840 1860 1880 1900 1920 1940 1960 1980 2000
FiG. 3. Greenland’s population, 1781–2007. Birth and death rates, smoothed by lowess regression (method described in Hamilton, 2009:233), are for “Greenlanders.” the deaths include only people born in Greenland and still living in Greenland two years later. For births, the definition is more complicated. it is possible to distinguish between persons as born “Greenlanders” with both parents born in Greenland, and others having only one parent born in Greenland.
GREENLAND DEMOGRAPHY • 47
approaching 1% over 1980 – 2006. although population growth slowed, birth rates remained well above replace-ment levels. net outmigration, principally to Denmark, pro-vides a key to the most recent demographic developments, in which population has stabilized without entering Stage 4.
aGe StRuctuRe
ideally, each stage of the demographic transition is char-acterized by a corresponding age structure. Stage 1 popu-lation pyramids should taper from bottom to top. in Stage 2, the shape resembles more a pyramid that grows steeper toward the top. Its widening base reflects larger birth cohorts due to higher birth rates, along with better infant survival.
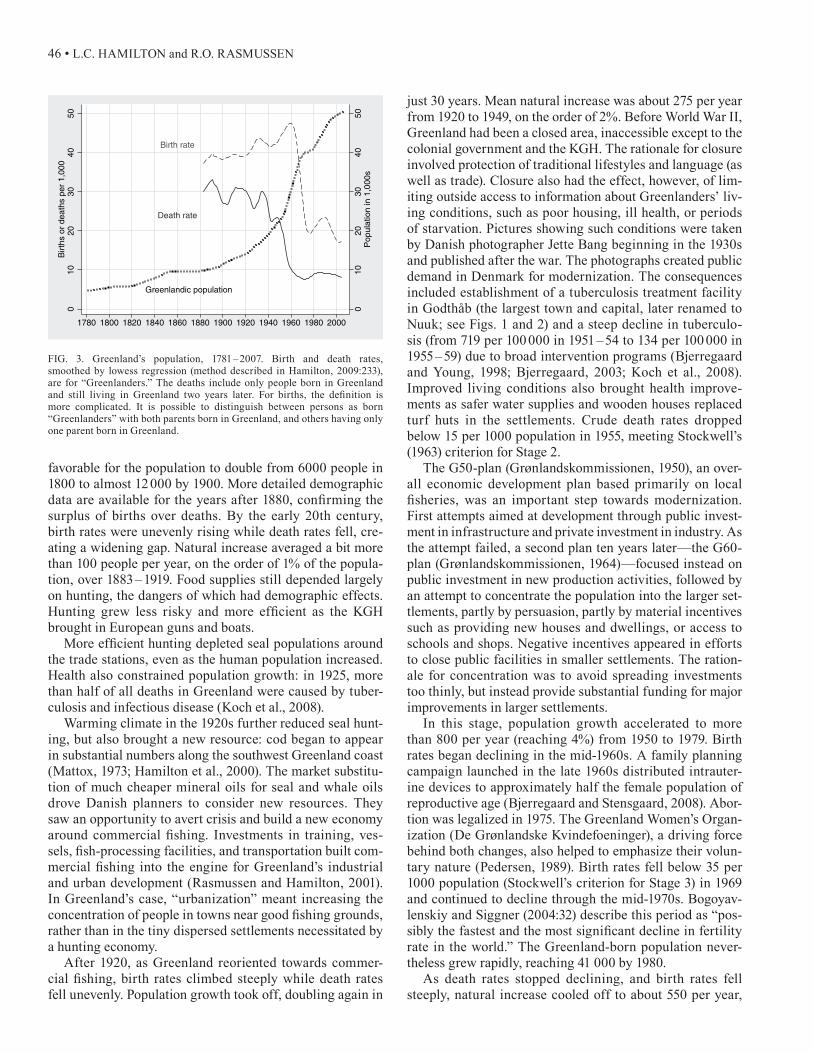
Figure 4 shows an age pyramid for the Greenland-born population of Greenland as of 2005, well into Stage 3. the shape of this pyramid reflects the historical variations in birth and death rates graphed in Figure 3. its central bulge marks a “baby boom” of adults, now ages 35–49, born dur-ing the rapid-growth years (1950s and 60s) after death rates fell. these are followed by much smaller cohorts of younger adults, marking the steep fall of birth rates after 1960. we also see an echo boom of children, born in the 1980s and 90s to adults from the first baby boom. Early teenagers (ages 10–14) are most numerous among younger cohorts. at the top of the pyramid, narrower cohorts represent survi-vors from more difficult times before World War II. Less obviously, the pyramid also shows an excess of males among young-adult and middle-aged cohorts.
Figure 5 contains small pyramids following the same conventions as Figure 4. they depict the age structure of the Greenland-born population for selected years from 1901 to 2005 (the final one being the same as Fig. 4). In early years, the shape is a tapered wedge, as expected for Stage 1. Young children form the largest cohorts, which are pro-gressively thinned out by mortality. Starting around 1930,
the base (0–4 age group) shows a discontinuous jump in width. children under age 20 comprise around half of the population from 1900 to 1930, but this rises to 55% by 1945 as more children survive and adults become the minority. Disproportionately large cohorts born in the Stage 2 years, roughly 1955 – 70, form the baby-boom bulge that persists for the rest of the century.
From 1970 on (Stage 3), birth cohorts are smaller and adults once again make up the majority—60% of the pop-ulation by 1985. Beginning around 1985, however, Green-land’s baby boomers are having many children of their own, creating an echo that continues for more than a decade until birth rates fall again. the upward jag in birth rates seen earlier in Figure 3 marks this same echo boom. By 2005, we have a two-bulge shape that is unlike the Stage 3 ideal, but similar (for different reasons) to that of other countries, including the united States. although younger cohorts are declining in size, the 2005 pyramid visualizes the growth momentum inherent in this large echo boom, just now entering childbearing years.
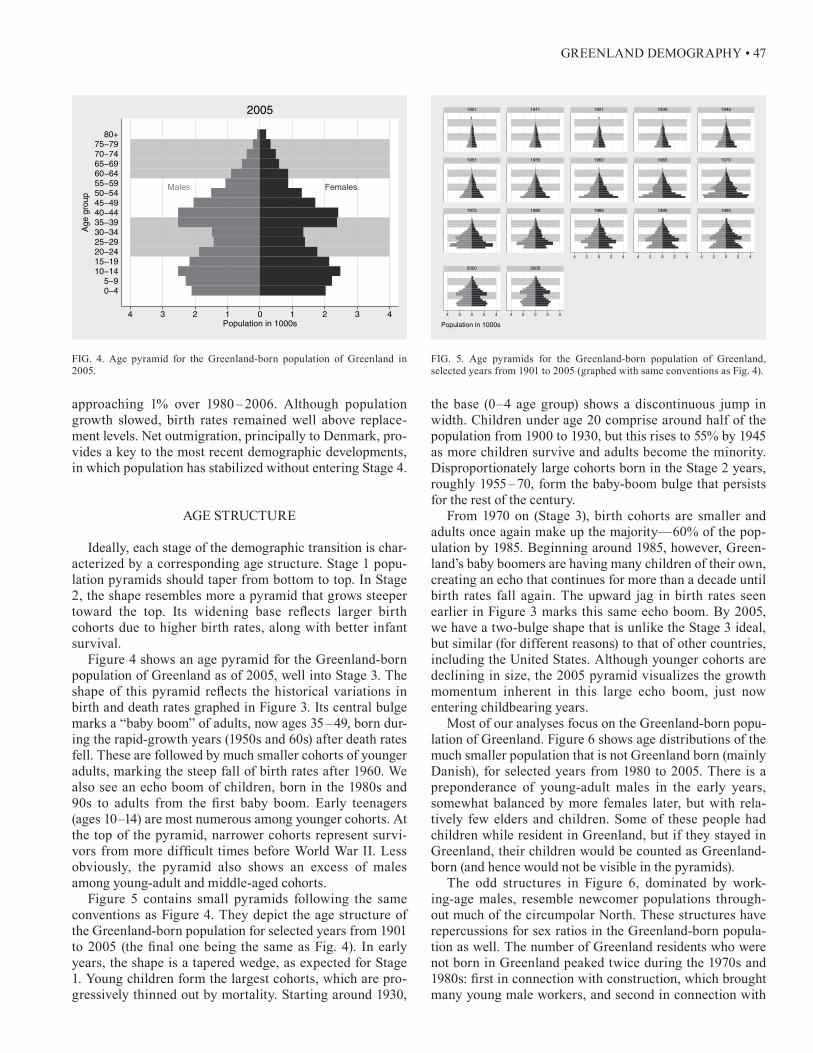
most of our analyses focus on the Greenland-born popu-lation of Greenland. Figure 6 shows age distributions of the much smaller population that is not Greenland born (mainly Danish), for selected years from 1980 to 2005. there is a preponderance of young-adult males in the early years, somewhat balanced by more females later, but with rela-tively few elders and children. Some of these people had children while resident in Greenland, but if they stayed in Greenland, their children would be counted as Greenland-born (and hence would not be visible in the pyramids).
the odd structures in Figure 6, dominated by work-ing-age males, resemble newcomer populations through-out much of the circumpolar north. these structures have repercussions for sex ratios in the Greenland-born popula-tion as well. the number of Greenland residents who were not born in Greenland peaked twice during the 1970s and 1980s: first in connection with construction, which brought many young male workers, and second in connection with
Males Females
4 3 2 1 0 1 2 3 4Population in 1000s
0−45−9
10−1415−1920−2425−2930−3435−3940−4445−4950−5455−5960−6465−6970−7475−79
80+
Age
gro
up
2005
4 2 0 2 4 4 2 0 2 4 4 2 0 2 4
4 2 0 2 4 4 2 0 2 4
1901 1911 1921 1930 1945
1951 1955 1960 1965 1970
1975 1980 1985 1990 1995
2000 2005
Population in 1000s
FiG. 4. age pyramid for the Greenland-born population of Greenland in 2005.
FiG. 5. age pyramids for the Greenland-born population of Greenland, selected years from 1901 to 2005 (graphed with same conventions as Fig. 4).
48 • L.c. HamiLton and R.o. RaSmuSSen
the transfer of administrative functions to the Home Rule Government, which required professionals with higher edu-cations, including more women.
a tRanSition in SeX RatioS
natural sex ratios at birth are around 105 males per 100 females. Because mortality is higher among males, this ratio tends to decrease with age, falling to parity and then an excess of females. Developments in Greenland, however, produced a history of sex ratios quite different from the “natural” pattern.
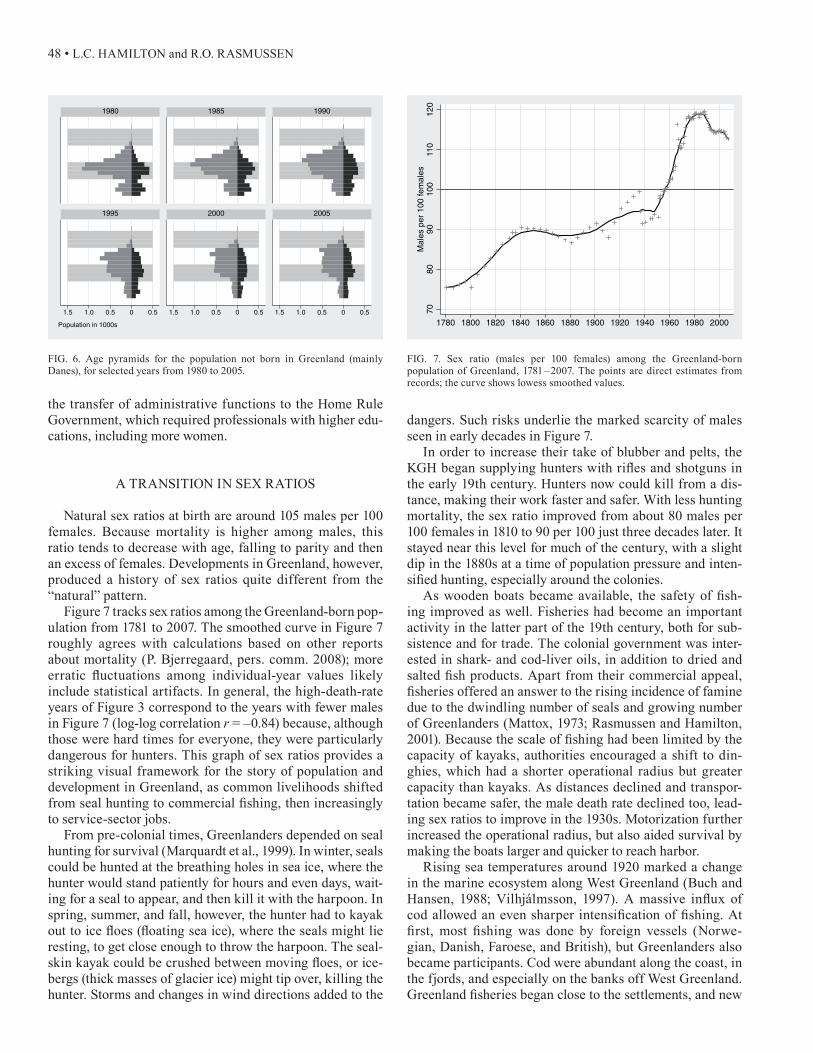
Figure 7 tracks sex ratios among the Greenland-born pop-ulation from 1781 to 2007. the smoothed curve in Figure 7 roughly agrees with calculations based on other reports about mortality (P. Bjerregaard, pers. comm. 2008); more erratic fluctuations among individual-year values likely include statistical artifacts. in general, the high-death-rate years of Figure 3 correspond to the years with fewer males in Figure 7 (log-log correlation r = –0.84) because, although those were hard times for everyone, they were particularly dangerous for hunters. this graph of sex ratios provides a striking visual framework for the story of population and development in Greenland, as common livelihoods shifted from seal hunting to commercial fishing, then increasingly to service-sector jobs.
From pre-colonial times, Greenlanders depended on seal hunting for survival (marquardt et al., 1999). in winter, seals could be hunted at the breathing holes in sea ice, where the hunter would stand patiently for hours and even days, wait-ing for a seal to appear, and then kill it with the harpoon. in spring, summer, and fall, however, the hunter had to kayak out to ice floes (floating sea ice), where the seals might lie resting, to get close enough to throw the harpoon. the seal-skin kayak could be crushed between moving floes, or ice-bergs (thick masses of glacier ice) might tip over, killing the hunter. Storms and changes in wind directions added to the
dangers. Such risks underlie the marked scarcity of males seen in early decades in Figure 7.
in order to increase their take of blubber and pelts, the KGH began supplying hunters with rifles and shotguns in the early 19th century. Hunters now could kill from a dis-tance, making their work faster and safer. with less hunting mortality, the sex ratio improved from about 80 males per 100 females in 1810 to 90 per 100 just three decades later. it stayed near this level for much of the century, with a slight dip in the 1880s at a time of population pressure and inten-sified hunting, especially around the colonies.
As wooden boats became available, the safety of fish-ing improved as well. Fisheries had become an important activity in the latter part of the 19th century, both for sub-sistence and for trade. the colonial government was inter-ested in shark- and cod-liver oils, in addition to dried and salted fish products. Apart from their commercial appeal, fisheries offered an answer to the rising incidence of famine due to the dwindling number of seals and growing number of Greenlanders (mattox, 1973; Rasmussen and Hamilton, 2001). Because the scale of fishing had been limited by the capacity of kayaks, authorities encouraged a shift to din-ghies, which had a shorter operational radius but greater capacity than kayaks. as distances declined and transpor-tation became safer, the male death rate declined too, lead-ing sex ratios to improve in the 1930s. motorization further increased the operational radius, but also aided survival by making the boats larger and quicker to reach harbor.
Rising sea temperatures around 1920 marked a change in the marine ecosystem along west Greenland (Buch and Hansen, 1988; Vilhjálmsson, 1997). A massive influx of cod allowed an even sharper intensification of fishing. At first, most fishing was done by foreign vessels (Norwe-gian, Danish, Faroese, and British), but Greenlanders also became participants. cod were abundant along the coast, in the fjords, and especially on the banks off west Greenland. Greenland fisheries began close to the settlements, and new
1.5 1.0 0.5 0 0.5 1.5 1.0 0.5 0 0.5 1.5 1.0 0.5 0 0.5
1980 1985 1990
1995 2000 2005
Population in 1000s
7080
9010
011
012
0M
ales
per
100
fem
ales
1780 1800 1820 1840 1860 1880 1900 1920 1940 1960 1980 2000
FiG. 6. age pyramids for the population not born in Greenland (mainly Danes), for selected years from 1980 to 2005.
FiG. 7. Sex ratio (males per 100 females) among the Greenland-born population of Greenland, 1781–2007. the points are direct estimates from records; the curve shows lowess smoothed values.

GREENLAND DEMOGRAPHY • 49
settlements were established near good fishing grounds. Fishing also moved out on the banks, however. as distance from shore grew, the risk of being caught in bad weather increased. this movement offshore in the late 1930s, with still-limited equipment, brought new dangers.
During world war ii, Greenland became isolated from Denmark, but outside influences came with U.S. air bases constructed at Kangerlussuaq (Søndrestrømfjord) and nar-sarsuaq. after the war, the Danish government awakened to the miserable housing and health conditions existing for many Greenlanders. Lacking a skilled workforce in Green-land, the government invited professionals from Denmark to contribute to the modernization process. workers, typi-cally young men, came and stayed for seasons or a few years. many of them married Greenlandic women, who then left Greenland when their new husbands did. Relatively few Danes decided to stay in Greenland. this dynamic, oper-ating on Greenland’s small base population, reversed the longstanding gender imbalance so that it became a place of too few Greenlandic women instead of too few men.
Female outmigration peaked in the mid-1960s, then slowed or partly reversed until the mid-1970s. as a result of the modernization process, the economy had grown dependent on fisheries, which required more fish process-ing. Filleting of cod and peeling shrimp for canning became important activities. as these activities were not considered proper work for males, they created new economic opportu-nities for women—and hence less outmigration.
During the 1970s, however, machines for shrimp peeling and new markets for shrimp in their shells, frozen at sea, reduced the demand for this female workforce (Rasmussen and Hamilton, 2001; Hamilton et al., 2003). Cod filleting work also declined as the overfished and climate-stressed stocks fell. outmigration due to marriage or the search for wider job and education choices pushed sex ratios to new heights, approaching 120 males per 100 females by the early 1980s.
as Home Rule government became established, an increasing number of jobs were taken over by Greenlanders,
now better prepared by vocational training and expanding educational opportunities. the cycling-through of male workers from outside, some of whom would have taken away Greenlandic wives, declined, so that sex ratios fell in the 1990s. Sex ratios are still high, however, and likely to remain so for years to come. there exist only a limited number of jobs appealing to women with high qualifica-tions, even in the capital city of nuuk, and until recently, hiring practices that favored males narrowed female job prospects further. the smaller settlements with more tra-ditional lifestyles connected to hunting and fishing appear still less attractive to many young women (Hamilton et al., 1996), who often perceive brighter futures in Denmark, elsewhere in europe, or in north america.
SeX, aGe, anD miGRation
Figure 8 graphs sex ratio against age group among six (approximate) Greenland birth cohorts. in the oldest age groups, differential mortality alone theoretically should result in sex ratios well below parity, as seen here in the falling curve of the 1925 – 34 birth cohort. unexpectedly high sex ratios (excess males) among young to middle-aged adults, on the other hand, characterize Greenland cohorts born from 1925 through 1964. the 1925–34, 1935–44, and 1945 – 54 cohorts exhibit peak sex ratios at progressively younger ages. This pattern mainly reflects disproportionate outmigration of women during the 1970s—coincident with the first peak of Danish workers in Greenland.
the baby boom cohort born in 1955–64 shows a different pattern, with sex ratios rising slowly through their 20s and 30s, then more steeply after age 40. this suggests that this group did not participate in the differential outmigration that characterized older cohorts in the 1970s, when most of the boomers were young. the boomers contributed more directly to the echo boom of children beginning in the mid-1980s (see Fig. 5) and to higher outmigration after 1990, as the second peak of Danish workers declined. Sex ratios ris-ing with age within both the 1955–64 and 1945–54 cohorts contrast with the declining sex ratios that differential mor-tality would predict. in Greenland, as throughout the arc-tic, contemporary mortality rates tend to be notably higher for males than for females (Bogoyavlenskiy and Siggner, 2004; also see figures on suicide in Hild and Stordahl, 2004; an alaska counterpart appears in Hamilton and Sey-frit, 1994a).
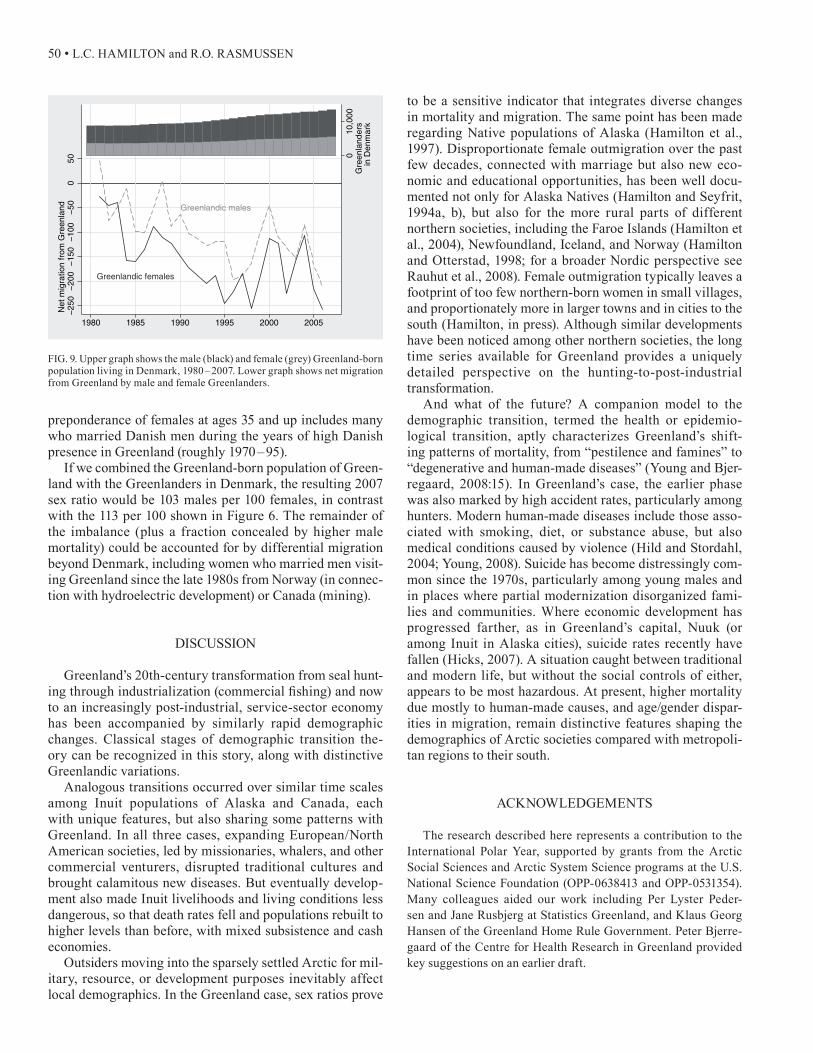
Figure 9 highlights recent temporal patterns among Greenlanders leaving Greenland from 1980 to 2007. the total Greenland-born population living in Denmark (the destination for most out-migrants) rose from 3636 males and 5094 females in 1980 to 5527 males and 7955 females in 2006—about 70 males per 100 females, within a group comparable to 26% of the Greenland-born population still in Greenland. Differential migration of females to Den-mark explains most of the modern excess of males back in Greenland. among Greenlanders living in Denmark, the
7080
9010
011
012
013
014
015
0M
ales
per
100
fem
ales
0 10 20 30 40 50 60 70Age group
1925−341935−441945−541955−641965−741975−84
Birth cohort
FiG. 8. Sex ratio vs. age group, among six Greenland birth cohorts.
50 • L.c. HamiLton and R.o. RaSmuSSen
preponderance of females at ages 35 and up includes many who married Danish men during the years of high Danish presence in Greenland (roughly 1970–95).
if we combined the Greenland-born population of Green-land with the Greenlanders in Denmark, the resulting 2007 sex ratio would be 103 males per 100 females, in contrast with the 113 per 100 shown in Figure 6. the remainder of the imbalance (plus a fraction concealed by higher male mortality) could be accounted for by differential migration beyond Denmark, including women who married men visit-ing Greenland since the late 1980s from norway (in connec-tion with hydroelectric development) or canada (mining).
DiScuSSion
Greenland’s 20th-century transformation from seal hunt-ing through industrialization (commercial fishing) and now to an increasingly post-industrial, service-sector economy has been accompanied by similarly rapid demographic changes. classical stages of demographic transition the-ory can be recognized in this story, along with distinctive Greenlandic variations.
analogous transitions occurred over similar time scales among inuit populations of alaska and canada, each with unique features, but also sharing some patterns with Greenland. in all three cases, expanding european/north american societies, led by missionaries, whalers, and other commercial venturers, disrupted traditional cultures and brought calamitous new diseases. But eventually develop-ment also made inuit livelihoods and living conditions less dangerous, so that death rates fell and populations rebuilt to higher levels than before, with mixed subsistence and cash economies.
outsiders moving into the sparsely settled arctic for mil-itary, resource, or development purposes inevitably affect local demographics. in the Greenland case, sex ratios prove
to be a sensitive indicator that integrates diverse changes in mortality and migration. the same point has been made regarding native populations of alaska (Hamilton et al., 1997). Disproportionate female outmigration over the past few decades, connected with marriage but also new eco-nomic and educational opportunities, has been well docu-mented not only for alaska natives (Hamilton and Seyfrit, 1994a, b), but also for the more rural parts of different northern societies, including the Faroe islands (Hamilton et al., 2004), newfoundland, iceland, and norway (Hamilton and otterstad, 1998; for a broader nordic perspective see Rauhut et al., 2008). Female outmigration typically leaves a footprint of too few northern-born women in small villages, and proportionately more in larger towns and in cities to the south (Hamilton, in press). although similar developments have been noticed among other northern societies, the long time series available for Greenland provides a uniquely detailed perspective on the hunting-to-post-industrial transformation.
and what of the future? a companion model to the demographic transition, termed the health or epidemio-logical transition, aptly characterizes Greenland’s shift-ing patterns of mortality, from “pestilence and famines” to “degenerative and human-made diseases” (Young and Bjer-regaard, 2008:15). in Greenland’s case, the earlier phase was also marked by high accident rates, particularly among hunters. modern human-made diseases include those asso-ciated with smoking, diet, or substance abuse, but also medical conditions caused by violence (Hild and Stordahl, 2004; Young, 2008). Suicide has become distressingly com-mon since the 1970s, particularly among young males and in places where partial modernization disorganized fami-lies and communities. where economic development has progressed farther, as in Greenland’s capital, nuuk (or among inuit in alaska cities), suicide rates recently have fallen (Hicks, 2007). a situation caught between traditional and modern life, but without the social controls of either, appears to be most hazardous. at present, higher mortality due mostly to human-made causes, and age/gender dispar-ities in migration, remain distinctive features shaping the demographics of arctic societies compared with metropoli-tan regions to their south.
acKnowLeDGementS
the research described here represents a contribution to the international Polar Year, supported by grants from the arctic Social Sciences and arctic System Science programs at the u.S. national Science Foundation (oPP-0638413 and oPP-0531354). many colleagues aided our work including Per Lyster Peder-sen and Jane Rusbjerg at Statistics Greenland, and Klaus Georg Hansen of the Greenland Home Rule Government. Peter Bjerre-gaard of the centre for Health Research in Greenland provided key suggestions on an earlier draft.
Greenlandic males
Greenlandic females
010
,000
G
reen
land
ers
in D
enm
ark
−25
0−
200
−15
0−
100
−50
050
Net
mig
ratio
n fr
om G
reen
land
1980 1985 1990 1995 2000 2005
FiG. 9. upper graph shows the male (black) and female (grey) Greenland-born population living in Denmark, 1980–2007. Lower graph shows net migration from Greenland by male and female Greenlanders.
GREENLAND DEMOGRAPHY • 51
ReFeRenceS
Berglund, J. 1986. the decline of the norse settlements in Greenland. arctic anthropology 23(1–2):109–135.
Bjerregaard, P. 2003. Sociocultural environment, lifestyle, and health in Greenland. in: Deutch, B., and Hansen, J.c., eds. amaP Greenland and the Faroe islands 1997–2001: Vol. 1: Human health. copenhagen: Danish ministry of environment. 15–19.
Bjerregaard, P., and Stensgaard, t. 2008. Greenland. in: Young, t.K., and Bjerregaard, P., eds. Health transitions in arctic populations. toronto: university of toronto Press. 23–28.
Bjerregaard P., and Young, t.K. 1998. the circumpolar inuit: Health of a population in transition. copenhagen: munksgaard.
Bogoyavlenskiy, D., and Siggner, a. 2004. arctic demography. in: arctic human development report. akureyri, iceland: Stefansson arctic institute. 27–42.
Buch, E., and Hansen, H.H. 1988. Climate and cod fishery at West Greenland. in: wyatt, t., and Larrañeta, m.G., eds. Long-term changes in marine fish populations. Vigo, Spain: Instituto investigaciones marinas. 345–364.
Buckland, P.c., amorosi, t., Barlow, L.K., Dugmore, a.J., mayewski, P.a., mcGovern, t.H., ogilvie, a.e.J., Sadler, J.P., and Skidmore, P. 1996. Bioarchaeological and climatological evidence for the fate of norse farmers in medieval Greenland. antiquity 70(267):88–96.
caldwell, J.c., caldwell, B.K., caldwell, P., mcdonald, P.F., and Schindlmayr, t. 2006. Demographic transition theory. Dordrecht, the netherlands: Springer.
Caulfield, R.A. 1997. Greenlanders, whales, and whaling: Sustainability and self-determination in the arctic. Hanover: university Press of new england.
chesnais, J.-c. 1992. the demographic transition: Stages, patterns and economic implications: a longitudinal study of 67 countries covering the period 1720–1984. translated by e. Kreager and P. Kreager. oxford: oxford university Press.
Fitzhugh, w.w. 1984. Paleo-eskimo cultures of Greenland. in: Damas, D., ed. Handbook of north american indians, Vol. 5, arctic. washington, D.c.: Smithsonian institution. 528–548.
Grønlandskommissionen. 1950. Betænkning afgivet af Grønlands-kommissionen af 1948 (G-50 report). copenhagen.
———. 1964. Betænkning fra Grønlandsudvalget af 1960 (G-60 report). copenhagen.
Hall, R.L. 1972. the demographic transition: Stage Four. current anthropology 13(2):212–215.
Hamilton, L.c. 2009. Statistics with Stata, Version 10. Belmont, california: cengage.
———. in press. Footprints: Demographic effects of outmigration. in: Huskey, L., and Southcott, c., eds. migration in the circumpolar north: issues and contexts. edmonton, alberta: canadian circumpolar institute.
Hamilton, L.c., and otterstad, o. 1998. Sex ratio and community size: notes from the northern atlantic. Population and environment 20(1):11–22.
Hamilton, L.c., and Seyfrit, c.L. 1994a. coming out of the country: community size and gender balance among alaskan natives. arctic anthropology 31(1):16–25.
———. 1994b. Female flight? Gender balance and outmigration by native alaskan villagers. arctic medical Research 53(Supplement 2):189–193.
Hamilton, L.c., Rasmussen, R.o., Flanders, n.e., and Seyfrit, c.L. 1996. outmigration and gender balance in Greenland. arctic anthropology 33(1):89–97.
Hamilton, L.c., Seyfrit, c.L., and Bellinger, c. 1997. environment and sex ratios among alaska natives: an historical perspective. Population and environment 18(3):283–299.
Hamilton, L.c., Lyster, P., and otterstad, o. 2000. Social change, ecology and climate in 20th century Greenland. climatic change 47(1/2):193–211.
Hamilton, L.c., Brown, B.c., and Rasmussen, R.o. 2003. west Greenland’s cod-to-shrimp transition: Local dimensions of climatic change. arctic 56(3):271–282.
Hamilton, L.c., colocousis, c.R., and Johansen, S.t.F. 2004. migration from resource depletion: the case of the Faroe islands. Society and natural Resources 17(5):443–453.
Hicks, J. 2007. the social determinants of elevated rates of suicide among inuit youth. indigenous affairs 4/07:30–37.
Hild, c.m., and Stordahl, V. 2004. Human health and well-being. in: arctic human development report. akureyri, iceland: Stefansson arctic institute. 155–168.
Koch, a., Bruce, m., and Homøe, P. 2008. infectious diseases. in: Young, t.K., and Bjerregaard, P., eds. Health transitions in arctic populations. toronto: university of toronto Press. 265–290.
Lauritzen, P. 1989. Highlights of an Arctic revolution: The first 120 months of Greenlandic Home Rule. Nuuk: Atuakkiorfik.
Lee, R. 2003. the demographic transition: three centuries of fundamental change. Journal of economic Perspectives 17(4):167–190.
marquardt, o. 2002. Greenland’s demography, 1700–2000: the interplay of economic activities and religion. Études/inuit/Studies 26(2):47–69.
marquardt, o., Holm, P., and Starkey, D.J., eds. 1999. From sealing to fishing: Essays on social and economic change in Greenland, 1850–1940. esbjerg, Denmark: Fiskeri-og Søfartsmuseets Forlag.
mattox, w.G. 1973. Fishing in west Greenland 1910–1966: the development of a new native industry. meddelelser om Grønland 197(1).
mcGovern, t.H. 1991. climate, correlation and causation in norse Greenland. arctic anthropology 28(2):77–100.
montgomery, K. 2007. the demographic transition. http://www.uwmc.uwc.edu/geography/Demotrans/demtran.htm.
notestein, F. 1945. Population: the long view. in: Schultz, t., ed. Food for the world. chicago: university of chicago Press. 36–58.
Pedersen, K.B. 1989. Kvinderne i Grønland: Kvindeorganiseringens betydning i den politiske debat (women in Greenland: the role of the organisation of women in Greenland in relation to the political debate). Roskilde, Denmark: institut for miljø, teknologi og Samfund, Roskilde universitetcenter.
Poppel, B. 1997. Greenland’s road to recovery and the pattern of settlement. north 8:11–18.
52 • L.c. HamiLton and R.o. RaSmuSSen
Rasmussen, R.o. 2001. Local, regional and international markets for fish in Greenland. In: Caulfield, R.A., and Kojima, M., eds. northern communities and the global economy. Proceedings of the Fifth caSS (circumpolar arctic Social Science PhD network) Field course, alaska 2000. Fairbanks: Department of alaska native and Rural Development, university of alaska Fairbanks. 75–87.
———. 2005. Socioøkonomisk analyse af Fangererhvervet i Grønland (Socioeconomic analysis of Greenland hunters). Roskilde, Denmark: nordatlantiske Regionalstudier (noRS), Roskilde universitetscenter.
———. 2007. adjustment to reality: Social responses to climate changes in Greenland. in: Ørbaek, J.B., Kallenborn, R., tombre, i., Hegseth, e.n., Falk–Petersen, S., and Hoel, a.H., eds. arctic alpine ecosystems and people in a changing environment. Berlin: Springer. 167–180.
Rasmussen, R.o., and Hamilton, L.c. 2001. the development of fisheries in Greenland, with focus on Paamiut/Frederikshåb and Sisimiut/Holsteinsborg. Roskilde, Denmark: noRS.
Rauhut, D., Rasmussen, R., Roto, J., Francke, P., and Östberg, S. 2008. the demographic challenge to the nordic countries. nordregio working Paper 2008:1. Stockholm: nordic centre for Spatial Development (nordregio).
Statistics Greenland. 2000. Greenland 2000–2001 statistical yearbook. nuuk: Greenland Home Rule Government.
Stockwell, e.G. 1963. Fertility, mortality, and economic status of underdeveloped areas. Social Forces 41(4):390–395.
thompson, w.S. 1929. Population. american Journal of Sociology 34(6):959–975.
Vilhjálmsson, H. 1997. climatic variations and some examples of their effects on the marine ecology of icelandic and Greenland waters, in particular during the present century. Journal of the marine Research institute 15(1):9–29.
Young, t.K. 2008. circumpolar health indicators: Data, sources, and maps. circumpolar Health Supplements no. 3. oulu: international association of circumpolar Health Publishers.
Young, t.K., and Bjerregaard, P., eds. 2008. Health transitions in arctic populations. toronto: university of toronto Press.
Related Documents