Population projections: Uncertainty and the user perspective Presentation to INIsPHO Seminar Newry, 2 December 2008 Tony Dignan

Population projections: Uncertainty and the user perspective Presentation to INIsPHO Seminar Newry, 2 December 2008 Tony Dignan.
Dec 29, 2015
Welcome message from author
This document is posted to help you gain knowledge. Please leave a comment to let me know what you think about it! Share it to your friends and learn new things together.
Transcript

Population projections: Uncertainty and the user
perspectivePresentation to
INIsPHO SeminarNewry, 2 December 2008
Tony Dignan

Overview
• Introduction
• Sources of uncertainty
• National projections
• Sub-national projections
• Concluding remarks

Uncertainty
• The future is inherently uncertain• That is why users look to population projections
to help in planning for the future– How many school places are required? Hospital
beds? Social and caring facilities?
• Dealing with uncertainty is also the major challenge in producing forecasts
• How to manage uncertainty in using projections?• Start by understanding the sources

Sources of uncertainty
• Assumptions– Judgements made about the future course of events– Based on what has happened in the (recent) past– Informed by expert opinion on what the future holds
• But:– Trends can change direction – turning point problem– The recent past – distinguishing cyclical events and
longer-term trends– External and/or unanticipated ‘shocks’ may occur– Changing economic circumstances

Components of change
• Deaths– The population ‘at risk’ is already born
• Fertility– Subject to choices that people make in future years– Social trends – can change
• Migration– An array of influences – economic, social, etc– Relative attractiveness of the country, region, for
which projections are being prepared– The most volatile component

Past experience
• Changing trends
• Changing economic circumstances
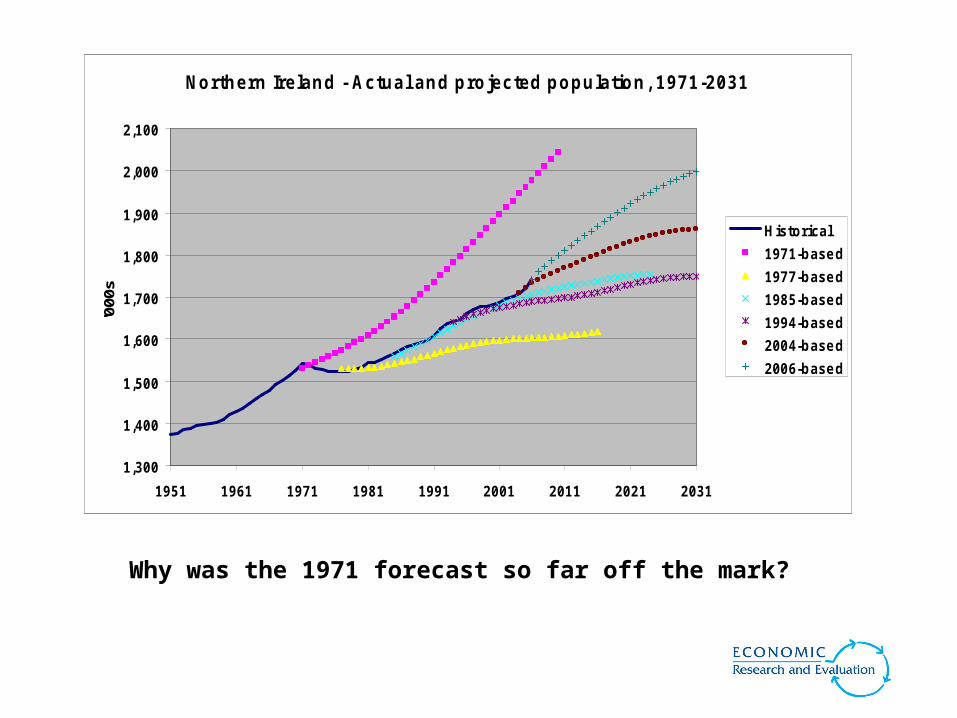
No rth ern Ire lan d - Ac tu a l an d p ro jec ted p o p u la tio n , 1971 -2031
1,300
1,400
1,500
1,600
1,700
1,800
1,900
2,000
2,100
1951 1961 1971 1981 1991 2001 2011 2021 2031
'000
s
H istorical
1971-base d
1977-base d
1985-base d
1994-base d
2004-base d
2006-base d
Why was the 1971 forecast so far off the mark?

End of the 1960s ‘baby-boom’ – sharp fall in fertility ratesSimilar experience across UK and Europe (Shaw, 2007)
T o tal fertility rate: N o rth ern Irelan d , 1971-2006
1 .5
1 .7
1 .9
2 .1
2 .3
2 .5
2 .7
2 .9
3 .1
3 .3
1971 1981 1991 2001
TF
R Actu a l
1971 Assu m ed

P opulation projections, Ireland, 1996-based
2,500
3,000
3,500
4,000
4,500
5,000
1951 1956 1961 1966 1971 1976 1981 1986 1991 1996 2001 2006 2011 2016 2021 2026 2031
'000
s
Actual
M 1F1
M 1F2
M 1F3
M 2F1
M 2F2
M 2F3
The out-turn in 2006 was in excess of each 1996-based scenario – why?

Booming economy - Net inward migration exceeded expectations
N et m igration, Ireland: Actual and assum ptions - 1996-based
-60
-40
-20
0
20
40
60
80
'000
s
Actual
M1
M2

Variations in out-turn by age group – older and younger more accurately predicted – why?
Ire land: Actua l 2006 com pared with 1996-based pro jected (M1F2)
0.0 2.0 4.0 6.0 8.0 10.0 12.0
0-14
15-24
25-44
45-64
65+
All
Ag
e g
rou
p
Per cent

Irelan d : Mig ratio n b y ag e g ro u p , 2007 - rate p er 1,000 p o p u latio n
-30
-20
-10
0
10
20
30
40
50
60
0 -14Y ears
15 -24Y ears
25 -44Y ears
45 -64Y ears
65 Y earsan d O ver
Ra
te p
er
1,0
00
Im m ig ra tio n
E m ig ra tio n
Net
Migration is strongly age-selectiveErrors in migration assumption have less effect on older age groupsOver time, will affect younger age groups

National projections – 2006-based
• Variants/scenarios– Alternative combinations of assumptions– Typically a ‘high’ and a ‘low’– NOT upper and lower ‘limits’ for a given confidence
level– Reflect producers’ uncertainties– But can also help the user manage uncertainty
• Uncertainties?– Migration is especially uncertain at this time

Northern Ireland
• Net migration– Recent inflows driven by EU Accession
countries– Principal assumption is that this will end– Revert to balance between in an out
• Variant projections– High/low, but also young/old population – Zero migration scenario not greatly different
from principal

Actu a l an d p ro jec ted n e t m ig ra tio n , NI, 1966 -2031
-30
-25
-20
-15
-10
-5
0
5
10
15
1966 1971 1976 1981 1986 1991 1996 2001 2006 2011 2016 2021 2026 2031
'000
s
Principal
H igh
Low

Prin cip al an d selected varian t p ro jectio n s, N . Irelan d , 2006-b ased
1,400
1,500
1,600
1,700
1,800
1,900
2,000
2,100
2,200
2,300
1971 1976 1981 1986 1991 1996 2001 2006 2011 2016 2021 2026 2031
'00
0s
P rincipal
H igh P op
H igh Mig
Zero M ig
Young P op
Old P op
Low Mig
Low P op

Ireland
• Net migration– M1 and M2 assume will stay strong– Recent data suggests both are too high– Also a zero net migration assumption (M0)
• Scenarios– M1 and M2 – compare with M0– Migration accounts for bulk of growth– Five years before the next projection!

N et m igration, Ireland: Actual and assum ptions - 2006-based
-60
-40
-20
0
20
40
60
80
'000
s
Actual
M1
M2
M0

P opulation projections, Ireland, 2006-based
2,500
3,000
3,500
4,000
4,500
5,000
5,500
6,000
6,500
7,000
1971 1981 1991 2001 2011 2021 2031
'000
s
Actual
M 1F1
M 1F2
M 2F1
M 2F2
M 0F1
M 0F2

Sub-national projections
• Top-down – all components by area must add to national totals
• Major strength – consistent framework• But uncertainty will be greater• Internal migration
– Net flows from one area to another– Sum to zero at national level– Additional component of change– Hence more uncertainty

Northern Ireland
• 26 Local Government Districts (LGDs)• Trends
– Internal migration - Belfast losing, surrounding areas gaining
– External migration – Distinct geographical patterns– Major gainers – LGDs in East of NI and West & South
• 2006-based Assumptions– Both trends are apparent in the sub-national
projections

NI LGDs: Migration 2006, per 1,000 population
BelfastCarrickfergus
LisburnNorth Down
NewtownabbeyCastlereagh
CraigavonAntrimDownArds
BanbridgeBallymena
LarneBallymoney
StrabaneLimavadyColeraine
MoyleDerry
DungannonCookstown
Newry & MourArmagh
FermanaghMagherafelt
OmaghNI
-10 -5 0 5 10 15 20 25 30
Per 1,000 population
ExternalInternal

BelfastCarrickfergus
LisburnNorth Down
NewtownabbeyCastlereagh
CraigavonAntrimDownArds
BanbridgeBallymena
LarneBallymoney
StrabaneLimavadyColeraine
MoyleDerry
DungannonCookstown
Newry & MourArmagh
FermanaghMagherafelt
OmaghNI
-10 -5 0 5 10 15 20 25 30
Per 1,000 population
NI LGDs: Migration assumptions, 2006-2021, annual averages

N. Ireland : Popu lation g row th by reg ion , actual and p ro jected
70
80
90
100
110
120
130
Pe
r c
en
t o
f 2
00
6
B elfas t
Res t o f G rea te rB e lfas tE as t o f NI
No rth o f NI
West & S o u tho f NI
Projections show greater divergence in growth at sub-national level than historically the case

N. Ireland: Spatial Development Strategy regions: Population shares, actual and projected
45
46
47
48
49
50
51
52
53
54
55
Per
cen
t
B M A & H inte rland
R e st of N I
Extrapolation of the most recent trends also apparent from shifts in population sharesWhat are the uncertainties around that?

Ireland
• Eight Regional Authorities
• Most recent = 2002-based
• Three scenarios for internal migration– Traditional– Recent– Medium

Ireland: R egional population shares
0
5
10
15
20
25
30
35
40
1951 1956 1961 1966 1971 1976 1981 1986 1991 1996 2001 2006
Per
cen
t D ublin
R e st of G D A
R e st of S& E
B M W
Long-term trend - Stable pattern from early-1970s to mid-1990sChange from 1996 onwards – Dublin losing share.Temporary or more permanent?

Internal m igration flow s - rates per 1,000
-15.0 -10.0 -5.0 0.0 5.0 10.0 15.0
B orde r
D ublin
M id-East
M idland
M id-We st
South-East
South-We st
We st
Per 1,000 population
2006
2002
1996
Illustrates change in the pattern of internal migrationDublin and Mid-East only ‘gainers’ in 1996Dublin the major ‘loser’ in 2002 and 2006

N et m ig ratio n b y reg io n : 2002-2006, an n u al averag es
-15
-10
-5
0
5
10
15
20
25
Pe
r 1
,00
0 p
op
ula
tio
n
In terna l
Externa l
Net
In recent years, Dublin has lost population due to internal migrationBut gained most in relative terms from external migration

D ublin's population share: Actual and projected (2002-based)
20
22
24
26
28
30
32
1951 1956 1961 1966 1971 1976 1981 1986 1991 1996 2001 2006 2011 2016 2021
Per
cen
t o
f S
tate Actual
Recent
Traditional
Medium
Which projection to use?

Concluding Remarks
• Value of projections– Consistent framework– Detail of the projections– Population by age and sex– Births, deaths, migration effects– Geographical patterns– Guide to what will happen in future IF the
assumptions hold good

Concluding remarks
• The turning point problem– Methodology based on extrapolation– Change the methodology? Forecasting
model? Whole new set of problems– Emphasises role of expert judgement
• Risk of over-reliance on the recent past– Apparent changes may be cyclical rather than
permanent– Need to have a coherent ‘story’

Concluding Remarks
• Uncertainty is inevitable– “Any set of projections will inevitably be proved wrong, to a
greater or lesser extent, as a projection of future demographic events or population structure” (Shaw, 2007)
– Some components more uncertain than others– How to manage that?– Understanding the assumptions – qualitative assessment and
indicators– Scenarios/variants will help to identify the key sources of
uncertainty– User can undertake sensitivity analysis– Some scenarios will be more useful than others, depending on
what user is seeking to achieve

Concluding Remarks
• Official projections are ‘trend-based’ • But some policies may have the effect of
changing the trends• Or be intended to change the trends e.g. spatial
development strategies• Need for policy based forecasts? But:
– Policy takes time to affect outcomes– Policy outcomes are themselves uncertain– Trend-based provides base for comparison – what
needs to be done to achieve a planned outcome?
Related Documents