Kansas Statistical Abstract 2020 Institute for Policy & Social Research ipsr.ku.edu/ksdata/ksah/ September 2021 Population Population

Welcome message from author
This document is posted to help you gain knowledge. Please leave a comment to let me know what you think about it! Share it to your friends and learn new things together.
Transcript

Kansas Statistical Abstract 2020
Institute for Policy & Social Research
ipsr.ku.edu/ksdata/ksah/
September 2021
Population
Po
pu
lati
on

Percent Population Change
less than -10.0
-10.0 - -5.0
-4.9 - 5.0
5.1 - 10.0
greater than 10.0
Source: Institute for Policy & Social Research, The University of Kansas; data from U.S. Census Bureau.
Population Change in the U.S., by County, 2000-2010
Numeric Change
Percent Change
Population Change
less than -10,000
-9,999 - -1
0 - 10,000
10,001 - 20,000
greater than 20,000

Population Growth, Kansas and the U.S. 1860-2020, Selected Years
Year Kansas U.S. Kansas U.S.
1860 107,206 31,443,321 - - 0.34 1870 364,339 39,818,449 239.8 26.6 0.92 1880 996,096 50,189,209 173.4 26.0 1.98 1890 1,428,108 62,979,766 43.4 25.5 2.27 1900 1,470,495 76,212,168 3.0 21.0 1.93 1910 1,690,949 92,228,496 15.0 21.0 1.83 1920 1,769,257 106,021,537 4.6 15.0 1.67 1930 1,880,999 123,202,624 6.3 16.2 1.53 1940 1,801,028 132,164,569 -4.3 7.3 1.36 1950 1,905,299 151,325,798 5.8 14.5 1.26 1960 2,178,611 179,323,175 14.3 18.5 1.21 1970 2,249,071 203,302,031 3.2 13.4 1.11 1980 2,364,236 226,542,199 5.1 11.4 1.04 1990 2,477,588 248,718,301 4.8 9.8 1.00 2000 2,688,824 281,424,603 8.5 13.1 0.96 2005 2,745,299 295,516,599 2.1 5.0 0.93 2006 2,762,931 298,379,912 2.8 6.0 0.93 2007 2,783,785 301,231,207 3.5 7.0 0.92 2008 2,808,076 304,093,966 4.4 8.1 0.92 2009 2,832,704 306,771,529 5.4 9.0 0.92 2010 2,853,118 308,745,538 6.1 9.7 0.92 2011 2,869,225 311,556,874 0.6 0.9 0.92 2012 2,885,257 313,830,990 1.1 1.6 0.92 2013 2,893,212 315,993,715 1.4 2.3 0.92 2014 2,900,475 318,301,008 1.7 3.1 0.91 2015 2,909,011 320,635,163 2.0 3.9 0.91 2016 2,910,844 322,941,311 2.0 4.6 0.90 2017 2,908,718 324,985,539 1.9 5.3 0.90 2018 2,911,359 326,687,501 2.0 5.8 0.89 2019 2,913,314 328,239,523 2.1 7.0 0.89 2020 2,937,880 331,449,281 3.0 7.4 0.89
1 Includes armed forces residing in the state. 2 Rate of growth from the previous Decennial Census.
Single dash (-) indicates not applicable.
Source: Institute for Policy & Social Research, The University of Kansas; data from U.S. Census Bureau.
Resident Population1
Source: U.S. Census Bureau, Statistical Abstract of the United States, various issues; Population Division, https://www.census.gov/programs-surveys/popest.html (accessed January 4, 2020); 2020 Census Apportionment, https://www.census.gov/data/tables/2020/dec/2020-apportionment-data.html (accessed April 26, 2021).
Kansas Populationas a Percentage
of U.S. Population
Decennial
Rate of Growth2
0.00
0.50
1.00
1.50
2.00
2.50
1860 1870 1880 1890 1900 1910 1920 1930 1940 1950 1960 1970 1980 1990 2000 2010 2020
Kansas Population as a Percentage of U.S. Population, 1860-2020

Age and Gender 1900 1910 1920 1930 1940 1950 1960 1970 1980 1990
TotalUnder 5 years 172,122 191,519 187,262 171,094 138,310 199,882 246,122 175,049 180,877 188,390 5-9 years 172,340 177,868 185,270 190,343 143,415 161,677 228,159 212,731 169,015 195,981 10-14 years 168,277 168,309 179,311 181,034 157,740 137,590 198,031 227,198 175,363 179,473 15-19 years 157,579 170,503 162,691 174,573 168,790 136,495 157,370 217,212 217,721 172,176 20-24 years 140,110 167,584 153,256 162,439 144,955 141,009 132,552 188,422 232,788 180,087 25-29 years 117,860 144,369 144,593 140,513 135,921 147,470 130,785 139,029 202,671 201,424 30-34 years 98,811 122,416 130,159 131,853 132,082 134,685 139,381 118,237 171,947 211,749 35-39 years 87,695 110,242 123,052 132,451 123,748 130,224 144,068 117,770 135,209 195,812 40-44 years 78,408 91,054 104,261 120,437 117,077 123,103 130,286 126,002 114,431 165,514 45-49 years 67,474 79,921 94,425 107,622 113,433 111,747 122,993 128,308 112,515 128,598 50-54 years 59,221 73,257 79,010 95,816 104,096 104,950 113,974 118,864 118,914 106,790 55-59 years 49,665 55,682 63,001 78,789 88,797 96,745 103,026 110,211 119,932 103,821 60-64 years 37,505 46,493 55,482 63,848 75,528 85,504 91,595 101,344 106,033 105,188 65-69 years 27,729 38,454 40,395 49,727 62,414 72,735 82,309 84,089 94,208 101,421 70-74 years 17,209 24,854 29,939 37,791 43,939 54,275 67,405 70,329 79,203 83,243 75 and over 15,435 24,648 34,413 41,950 50,783 67,208 90,555 111,783 132,852 157,907 Not reported 3,055 3,776 2,737 719 - - - - - -Total 1,470,495 1,690,949 1,769,257 1,880,999 1,801,028 1,905,299 2,178,611 2,246,578 2,363,679 2,477,574
MaleUnder 5 years 87,251 96,970 95,134 87,221 70,690 102,270 125,414 89,359 92,984 96,837 5-9 years 87,500 89,758 93,590 96,822 73,011 82,606 116,380 108,291 86,823 100,504 10-14 years 85,413 85,169 90,367 92,134 80,158 70,206 101,038 116,059 89,670 92,409 15-19 years 79,951 87,235 80,941 87,971 85,272 69,246 79,458 109,720 111,484 88,466 20-24 years 71,823 87,617 76,740 81,183 71,540 70,307 67,079 97,263 119,895 93,256 25-29 years 60,947 76,077 73,059 69,771 66,673 74,220 65,311 70,078 103,213 101,772 30-34 years 51,756 64,174 65,945 66,389 65,405 67,000 69,587 58,448 86,831 106,272 35-39 years 46,953 58,568 63,897 67,620 60,969 64,844 72,146 57,839 67,276 99,030 40-44 years 42,033 48,225 53,906 61,681 58,653 61,247 64,554 62,080 56,367 83,474 45-49 years 37,096 43,319 50,345 55,581 57,407 55,278 60,987 63,279 54,817 63,799 50-54 years 32,611 40,672 42,889 50,573 52,750 52,231 56,235 57,531 58,057 52,345 55-59 years 27,650 30,440 33,894 41,996 45,408 48,118 50,059 53,046 57,852 49,887 60-64 years 21,175 25,550 30,558 33,866 38,659 42,342 43,976 47,544 49,421 49,909 65-69 years 15,937 21,638 21,548 26,650 31,947 35,462 38,699 37,474 42,230 46,434 70-74 years 9,974 14,028 16,246 20,166 22,671 26,545 30,913 30,123 33,338 35,390 75 and over 8,597 13,651 18,477 21,271 25,127 31,612 39,541 43,439 46,683 54,861 Not reported 2,049 2,821 1,685 396 - - - - - -Total 768,716 885,912 909,221 961,291 906,340 953,534 1,081,377 1,101,573 1,156,941 1,214,645
Population in Kansas, by Age Group and Gender, 1900-1990
Age and Gender 1900 1910 1920 1930 1940 1950 1960 1970 1980 1990
Population in Kansas, by Age Group and Gender, 1900-1990
FemaleUnder 5 years 84,871 94,549 92,128 83,873 67,620 97,612 120,708 85,690 87,893 91,553 5-9 years 84,840 88,110 91,680 93,521 70,404 79,071 111,779 104,440 82,192 95,477 10-14 years 82,864 83,140 88,944 88,900 77,582 67,384 96,993 111,139 85,693 87,064 15-19 years 77,628 83,268 81,750 86,602 83,518 67,249 77,912 107,492 106,237 83,710 20-24 years 68,287 79,967 76,516 81,256 73,415 70,702 65,473 91,159 112,893 86,831 25-29 years 56,913 68,292 71,534 70,742 69,248 73,250 65,474 68,951 99,458 99,652 30-34 years 47,055 58,242 64,214 65,464 66,677 67,685 69,794 59,789 85,116 105,477 35-39 years 40,742 51,674 59,155 64,831 62,779 65,380 71,922 59,931 67,933 96,782 40-44 years 36,375 42,829 50,355 58,756 58,424 61,856 65,732 63,922 58,064 82,040 45-49 years 30,378 36,602 44,080 52,041 56,026 56,469 62,006 65,029 57,698 64,799 50-54 years 26,610 32,585 36,121 45,243 51,346 52,719 57,739 61,333 60,857 54,445 55-59 years 22,015 25,242 29,107 36,793 43,389 48,627 52,967 57,165 62,080 53,934 60-64 years 16,330 20,943 24,924 29,982 36,869 43,162 47,619 53,800 56,612 55,279 65-69 years 11,792 16,816 18,847 23,077 30,467 37,273 43,610 46,615 51,978 54,987 70-74 years 7,235 10,826 13,693 17,625 21,268 27,730 36,492 40,206 45,865 47,853 75 and over 6,838 10,997 15,936 20,679 25,656 35,596 51,014 68,344 86,169 103,046 Not reported 1,006 955 1,052 323 - - - - - -Total 701,779 805,037 860,036 919,708 894,688 951,765 1,097,234 1,145,005 1,206,738 1,262,929
Source: U.S. Census Bureau, 1970 Census of Population, General Population Characteristics: Kansas (PC(1)B18); 1980 Census of Population, General Population Characteristics: Kansas (PC80-1-B18); 1990 Census of Population, General Population Characteristics: Kansas (1990 CP-1-18).
Single dash (-) indicates not applicable.

Age Group Number Percent Number Percent Number Percent Number Percent Number Percent Number Percent
Under 5 years 188,708 7.0 97,012 7.3 91,696 6.7 205,492 7.2 104,888 7.4 100,604 7.05 to 9 years 195,574 7.3 100,433 7.6 95,141 7.0 202,447 7.1 103,421 7.3 99,026 6.910 to 14 years 204,018 7.6 104,981 7.9 99,037 7.3 198,884 7.0 102,156 7.2 96,728 6.715 to 19 years 210,118 7.8 108,040 8.1 102,078 7.5 203,821 7.1 105,362 7.4 98,459 6.820 to 24 years 190,167 7.1 98,767 7.4 91,400 6.7 204,454 7.2 105,450 7.5 99,004 6.925 to 29 years 172,975 6.4 89,034 6.7 83,941 6.2 197,783 6.9 101,077 7.1 96,706 6.730 to 34 years 175,878 6.5 89,610 6.7 86,268 6.3 179,937 6.3 91,335 6.5 88,602 6.235 to 39 years 207,549 7.7 103,934 7.8 103,615 7.6 172,388 6.0 87,100 6.2 85,288 5.940 to 44 years 212,802 7.9 106,394 8.0 106,408 7.8 174,285 6.1 87,760 6.2 86,525 6.045 to 49 years 192,679 7.2 96,544 7.3 96,135 7.1 201,830 7.1 100,199 7.1 101,631 7.150 to 54 years 161,468 6.0 81,121 6.1 80,347 5.9 204,434 7.2 101,040 7.1 103,394 7.255 to 59 years 121,645 4.5 59,523 4.5 62,122 4.6 182,512 6.4 90,190 6.4 92,322 6.460 to 64 years 98,608 3.7 47,566 3.6 51,042 3.8 148,735 5.2 73,498 5.2 75,237 5.265 to 69 years 90,085 3.4 41,641 3.2 48,444 3.5 107,755 3.8 51,267 3.2 56,488 3.570 to 74 years 85,831 3.2 38,309 2.9 47,522 3.5 82,634 2.9 38,113 2.7 44,521 3.175 to 79 years 75,125 2.8 31,357 2.4 43,768 3.2 69,466 2.4 30,202 2.1 39,264 2.780 to 84 years 53,418 2.0 19,596 1.5 33,822 2.5 56,943 2.0 23,029 1.6 33,914 2.485 and over 51,770 1.9 14,612 1.1 37,158 2.7 59,318 2.1 19,321 1.4 39,997 2.8Total 2,688,418 1,328,474 1,359,944 2,853,118 1,415,408 1,437,710
65 and over 356,229 13.3 145,515 11.0 210,714 15.5 376,116 13.2 161,932 11.4 214,184 14.9
Median Age (years) 35.2 33.7 36.5 36.0 34.7 37.4
Source: U.S. Census Bureau, 2000 Census, Summary File 1 (SF1); 2010 Census, Profile of General Population and Housing Characteristics: 2010 (DP-1).
Population in Kansas, by Age Group and Gender, 2000 and 2010
2000
Male Female
2010
Total Male Female Total

Race and Hispanic Origin Number Percent Number Percent Number Percent Number Percent
2,688,418 100.0 2,853,118 100.0 281,421,906 100.0 308,745,538 100.0
2,631,922 97.9 2,767,185 97.0 274,595,678 97.6 299,736,465 97.12,313,944 86.1 2,391,044 83.8 211,460,626 75.1 223,553,265 72.4
154,198 5.7 167,864 5.9 34,658,190 12.3 38,929,319 12.6 American Indian and Alaska Native 24,936 0.9 28,150 1.0 2,475,956 0.9 2,932,248 0.9
46,806 1.7 67,762 2.4 10,242,998 3.6 14,674,252 4.88,153 0.3 13,848 0.5 1,678,765 0.6 2,843,391 0.97,624 0.3 11,188 0.4 2,432,585 0.9 3,347,229 1.13,509 0.1 5,545 0.2 1,850,314 0.7 2,555,923 0.8
Japanese 1,935 0.1 1,671 0.1 796,700 0.3 763,325 0.24,529 0.2 5,234 0.2 1,076,872 0.4 1,423,784 0.5
Vietnamese 11,623 0.4 14,015 0.5 1,122,528 0.4 1,548,449 0.5 Other Asian 9,433 0.4 16,261 0.6 1,285,234 0.5 2,192,151 0.7 Native Hawaiian and Other Pacific Islander 1,313 <0.1 2,238 0.1 398,835 0.1 540,013 0.2
391 <0.1 505 <0.1 140,652 <0.1 156,146 0.1325 <0.1 571 <0.1 58,240 <0.1 88,310 <0.1255 <0.1 325 <0.1 91,029 <0.1 109,637 <0.1342 <0.1 837 <0.1 108,914 <0.1 185,920 0.1
90,725 3.4 110,127 3.9 15,359,073 5.5 19,107,368 6.256,496 2.1 85,933 3.0 6,826,228 2.4 9,009,073 2.9
Hispanic or Latino (of any race) 188,252 7.0 300,042 10.5 35,305,818 12.5 50,477,594 16.3148,270 5.5 247,297 8.7 20,640,711 7.3 31,798,258 10.3
Puerto Rican 5,237 0.2 9,247 0.3 3,406,178 1.2 4,623,716 1.5 Cuban 1,680 0.1 2,723 0.1 1,241,685 0.4 1,785,547 0.6 Other Hispanic or Latino 33,065 1.2 40,775 1.4 10,017,244 3.6 12,270,073 4.0 Not Hispanic or Latino 2,500,166 93.0 2,553,076 89.5 246,116,088 87.5 258,267,944 83.7 White Alone 2,233,997 83.1 2,230,539 78.2 194,552,774 69.1 196,817,552 63.7
Population in Kansas and the U.S., by Race and Hispanic Origin2000 and 2010
Chinese Filipino
Kansas
2010
United States
One Race Alone White
2000
Two or more races
Hispanic or Latino and Race
Total
Black or African American
Samoan Other Pacific Islander Some other race
2000 2010
Race
Source: U.S. Census Bureau, 2000 Census, Summary Tape File (STF-1A) and Profile of General Demographic Characteristics (DP-1); 2010 Census, Profile of General Population and Housing Characteristics: 2010 (DP-1).
Korean
Native Hawaiian Guamanian or Chamorro
Asian Asian Indian
Mexican

Race and Hispanic Origin NumberPercent of Total Number
Percent of Total
2,913,314 100.0 328,239,523 100.0
2,804,543 96.3 316,930,628 96.62,436,902 83.6 236,475,401 72.0
167,237 5.7 41,989,671 12.8American Indian and Alaska Native 23,860 0.8 2,847,336 0.9
Cherokee tribal grouping 4,058 0.1 289,234 0.1Chippewa tribal grouping 295 0.0 126,987 0.0Navajo tribal grouping 3,195 0.1 340,669 0.1Sioux tribal grouping 728 0.0 119,004 0.0
87,018 3.0 18,636,984 5.716,564 0.6 4,240,466 1.316,485 0.6 4,404,678 1.35,768 0.2 2,983,596 0.9
Japanese 3,638 0.1 755,672 0.24,201 0.1 1,461,843 0.4
Vietnamese 12,951 0.4 1,873,707 0.6Other Asian 27,411 0.9 2,917,022 0.9
Native Hawaiian and Other Pacific Islander 2,453 0.1 628,683 0.2503 0.0 198,734 0.1411 0.0 78,323 0.0778 0.0 112,845 0.0761 0.0 238,781 0.1
87,073 3.0 16,352,553 5.0108,771 3.7 11,308,895 3.4
Hispanic or Latino (of any race) 354,804 12.2 60,481,746 18.4279,620 9.6 37,186,361 11.3
Puerto Rican 13,329 0.5 5,828,706 1.8 Cuban 5,278 0.2 2,381,565 0.7 Other Hispanic or Latino 56,577 1.9 15,085,114 4.6 Not Hispanic or Latino 2,558,510 87.8 267,757,777 81.6 White alone 2,196,485 75.4 196,789,401 60.0
Native Hawaiian
Data based on a sample and subject to sampling variability; see source for degree of uncertainty.
Asian Indian
Mexican
Some other raceTwo or more races
Hispanic or Latino and Race
Population in Kansas and the U.S., by Race and Hispanic Origin, 2019
ChineseFilipino
One RaceWhite
Race
Black or African American
Asian
Kansas
Total Population
United States
Total population estimate is controlled.
Source: U.S. Census Bureau, American Community Survey 2019, Demographic and Housing Estimates (DP-5).
Korean
SamoanOther Pacific Islander
Guamanian or Chamorro

Category 1980 1990 2000 2010
Total Population 2,363,679 2,477,574 2,688,418 2,853,118
Households 872,239 944,726 1,037,891 1,112,096 Percent Change 19.90 8.30 9.86 7.15
Persons in Households 2,283,217 2,394,809 2,606,468 2,774,044 Persons per Household 2.62 2.53 2.51 2.49
Families 635,023 658,600 701,547 734,103 Persons per Family 3.13 3.08 3.07 3.06
Household Type 2010
Population in Households 2,606,468 2,774,044 329,296 356,792In Family Households 2,195,301 2,304,294 218,231 237,998
Householder 701,547 734,103 118,630 129,658Male 547,358 542,413 100,253 108,226Female 154,189 191,690 18,377 21,432
Spouse 567,924 568,309 85,710 92,284Parent 11,734 15,966 7,039 8,641Child 793,413 820,552 - -
Natural Born or Adopted 743,853 774,553 - -Step 49,560 45,999 - -
20102000 2000
Persons, Households, and Families in Kansas 1980-2010
Population in Kansas, by Household Type
Population 65 and OverTotal Population
Source: U.S. Census Bureau, 1980 Census of Population, General Population Characteristics: Kansas (PC80-1-B18); 1990 Census of Population, Summary Tape File 1-A (STF1-A); 2000 Census, Profile of General Demographic Characteristics (DP-1); 2010 Census, Profile of General Population and Housing Characteristics: 2010 (DP-1).
2000 and 2010
Grandchild 34,490 48,900 - -Brother or Sister 17,810 20,905 - -Other Relatives 25,966 37,134 6,101 6,630Nonrelatives 42,417 58,425 751 785
In Nonfamily Households 411,167 469,750 111,065 118,794Male Householder 155,023 180,740 25,541 32,842
Living Alone 121,668 140,529 24,177 30,624Not Living Alone 33,355 40,211 1,364 2,218
Female Householder 181,321 197,253 83,033 82,185Living Alone 158,719 168,809 81,512 79,886Not Living Alone 22,602 28,444 1,521 2,299
Nonrelatives 74,823 91,757 2,491 3,767
Population in Group Quarters 81,950 79,074 26,933 19,324Institutional 45,396 41,393 24,812 18,506Noninstitutional 36,554 37,681 2,121 818
Source: U.S. Census Bureau, 2000 Census, Summary File 1 (SF1); 2010 Census, Summary File 1 (SF1).
Single dash (-) indicates not available.

Population Summary for Congressional Districts in Kansasby Household, Family Size, Race, and Hispanic Origin, 2010
Category Kansas District 1 District 2 District 3 District 4
Total HouseholdsPopulation in Households 2,774,044 684,231 684,380 706,703 698,730Average Household Size 2.49 2.46 2.43 2.57 2.52
Total FamiliesPopulation in Families 2,245,869 548,912 540,443 584,000 575,514Average Family Size 3.06 3.02 2.98 3.13 3.10
RaceWhite Alone 2,391,044 624,835 622,205 565,228 578,776Black or African American Alone 167,864 21,060 34,006 63,467 49,331American Indian and Alaska Native Alone 28,150 4,411 12,181 3,359 8,199Asian Alone 67,762 10,286 8,788 26,766 21,922Native Hawaiian/Other Pacific Islander Alone 2,238 718 536 473 511Some Other Race Alone 110,127 34,131 12,120 34,255 29,621Two or More Races 85,933 17,837 23,436 19,739 24,921
Hispanic OriginHispanic 300,042 101,044 39,919 80,929 78,150Non-Hispanic 2,553,076 612,234 673,353 632,358 635,131
Total Population 2,853,118 713,278 713,272 713,287 713,281
Source: U.S. Census Bureau, Census 2010.
Congressional districts as determined by redistricting in 2012.
Population Summary for Congressional Districts in Kansasby Race and Hispanic Origin, 2020
Category Kansas District 1 District 2 District 3 District 4
RaceWhite Alone 2,222,462 547,738 579,561 559,069 536,094Black or African American Alone 168,809 22,408 32,879 63,470 50,052American Indian and Alaska Native Alone 30,995 5,445 12,012 4,521 9,017Asian Alone 86,273 10,850 10,054 40,811 24,558Native Hawaiian/Other Pacific Islander Alone 3,412 998 803 777 834Some Other Race Alone 145,422 45,949 17,249 44,476 37,748Two or More Races 280,507 67,385 60,449 79,162 73,511
Hispanic OriginHispanic 382,603 120,974 52,062 110,697 98,870Non-Hispanic 2,555,277 579,799 660,945 681,589 632,944
Total Population 2,937,880 700,773 713,007 792,286 731,814
Source: U.S. Census Bureau, 2020 Census.
Congressional districts as determined by redistricting in 2012.
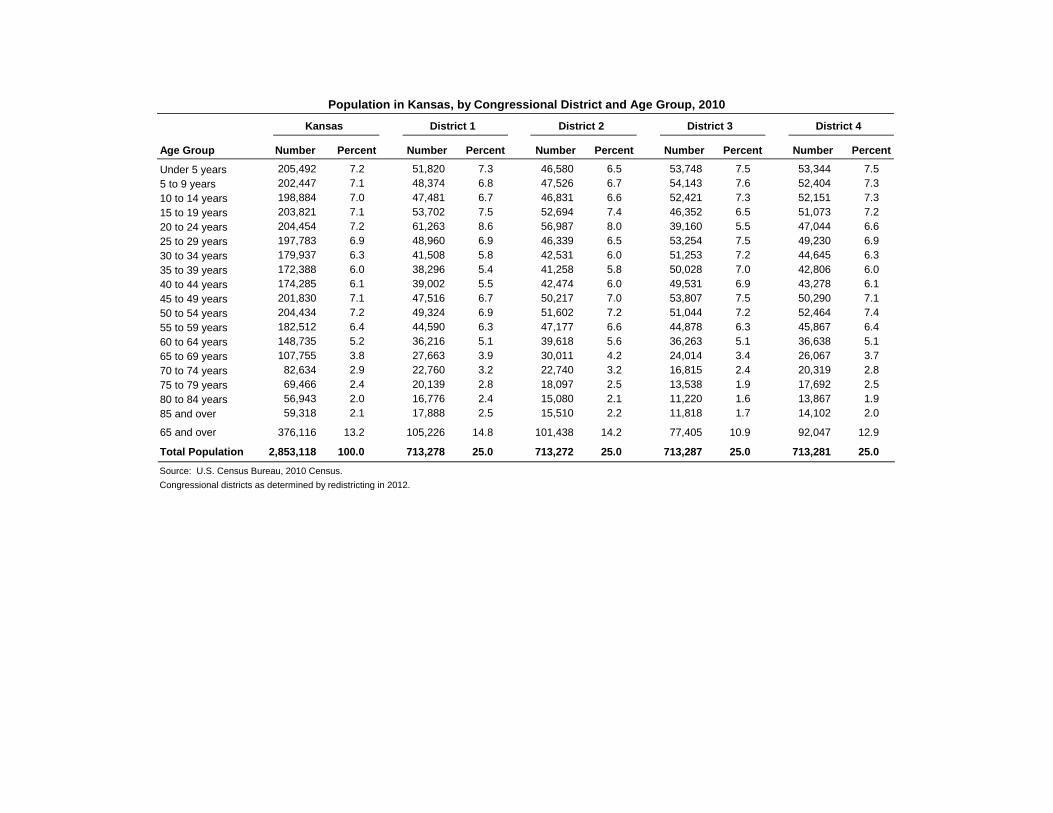
Population in Kansas, by Congressional District and Age Group, 2010
Age Group Number Percent Number Percent Number Percent Number Percent Number Percent
Under 5 years 205,492 7.2 51,820 7.3 46,580 6.5 53,748 7.5 53,344 7.5
5 to 9 years 202,447 7.1 48,374 6.8 47,526 6.7 54,143 7.6 52,404 7.3
10 to 14 years 198,884 7.0 47,481 6.7 46,831 6.6 52,421 7.3 52,151 7.3
15 to 19 years 203,821 7.1 53,702 7.5 52,694 7.4 46,352 6.5 51,073 7.2
20 to 24 years 204,454 7.2 61,263 8.6 56,987 8.0 39,160 5.5 47,044 6.6
25 to 29 years 197,783 6.9 48,960 6.9 46,339 6.5 53,254 7.5 49,230 6.9
30 to 34 years 179,937 6.3 41,508 5.8 42,531 6.0 51,253 7.2 44,645 6.3
35 to 39 years 172,388 6.0 38,296 5.4 41,258 5.8 50,028 7.0 42,806 6.0
40 to 44 years 174,285 6.1 39,002 5.5 42,474 6.0 49,531 6.9 43,278 6.1
45 to 49 years 201,830 7.1 47,516 6.7 50,217 7.0 53,807 7.5 50,290 7.1
50 to 54 years 204,434 7.2 49,324 6.9 51,602 7.2 51,044 7.2 52,464 7.4
55 to 59 years 182,512 6.4 44,590 6.3 47,177 6.6 44,878 6.3 45,867 6.4
60 to 64 years 148,735 5.2 36,216 5.1 39,618 5.6 36,263 5.1 36,638 5.1
65 to 69 years 107,755 3.8 27,663 3.9 30,011 4.2 24,014 3.4 26,067 3.7
70 to 74 years 82,634 2.9 22,760 3.2 22,740 3.2 16,815 2.4 20,319 2.8
75 to 79 years 69,466 2.4 20,139 2.8 18,097 2.5 13,538 1.9 17,692 2.5
80 to 84 years 56,943 2.0 16,776 2.4 15,080 2.1 11,220 1.6 13,867 1.9
85 and over 59,318 2.1 17,888 2.5 15,510 2.2 11,818 1.7 14,102 2.0
65 and over 376,116 13.2 105,226 14.8 101,438 14.2 77,405 10.9 92,047 12.9
Total Population 2,853,118 100.0 713,278 25.0 713,272 25.0 713,287 25.0 713,281 25.0
Source: U.S. Census Bureau, 2010 Census.
Congressional districts as determined by redistricting in 2012.
District 4 Kansas District 1 District 2 District 3

Greeley
Franklin
Phillips
Pawnee
Clay
Bourbon
RepublicDoniphan
Seward
Ford
Marshall
Woodson
Lincoln
Finney
Stanton
Sheridan
Chase
Ellis
CowleyCherokee
Reno
Wabaunsee
Comanche
Logan
Harper
Crawford
Allen
Lyon
Pottawatomie
Atchison
Norton
Thomas
Johnson
Hamilton
Osborne
Hodgeman
Trego
Cloud
Brown
Jefferson
Dickinson
Lane
Butler
Cheyenne
Wallace
Chautauqua
Kiowa
Rice
Morton
Rush
Washington Nemaha
McPherson
Ness
GrantLabette
Edwards
Linn
Morris
Rooks
Barber
Anderson
Decatur
Sherman
Gray
Barton
Clark
Saline
Harvey
Geary
Scott
Jewell
Wichita
Stevens
Graham
Kearny
Gove
Neosho
Smith
Russell
Rawlins
Shawnee
Riley
CoffeyStafford
Elk
Ottawa
Sedgwick
Greenwood
Meade
Miami
Mitchell
Marion
SumnerPratt
Douglas
Central197,567-2.88%
East Central1,093,050
7.35%
North Central58,786-6.57%
Northeast433,7104.71%
Northwest32,119-2.49%
South Central685,8492.52%
Southeast278,340-4.36%
Southwest135,811-1.75%
West Central22,648-2.43%
Population of Kansas by Region, April 1, 2020and Percent Change, 2010-2020
State: 2,937,8802.97%Source: Institute for Policy & Social Research, The University of Kansas; data from the U.S. Census Bureau.
Leavenworth
Wyandotte
Montgomery

Age Group 2014 2019 2024 2029 2034 2039 2044
0-4 years 200,607 201,424 197,344 197,865 200,716 204,026 205,2895-9 years 203,255 196,338 197,019 193,352 194,081 197,129 200,62010-14 years 200,293 201,543 194,766 195,307 191,971 192,908 196,15115-19 years 200,470 209,242 210,773 204,053 204,753 202,188 203,83020-24 years 220,176 223,253 232,208 235,175 229,539 232,002 230,30325-29 years 191,221 188,000 192,222 203,451 206,389 201,077 201,68630-34 years 196,672 193,698 191,485 197,497 210,577 213,199 207,00135-39 years 174,728 192,226 189,696 188,006 194,155 207,484 209,90940-44 years 169,939 171,292 188,860 186,837 185,717 192,170 205,90945-49 years 170,437 167,855 169,395 186,933 185,257 184,546 191,21850-54 years 198,165 166,081 163,443 164,699 181,364 179,501 178,61755-59 years 194,480 193,888 162,876 160,560 162,002 178,562 177,03360-64 years 168,055 186,935 186,742 157,293 155,363 156,997 173,25265-69 years 131,466 160,466 179,033 179,457 151,765 150,397 152,37170-74 years 94,308 122,277 150,784 169,648 171,431 146,136 145,74075-79 years 70,854 84,448 110,048 136,135 153,576 155,739 133,36380-84 years 55,347 57,051 68,807 90,683 113,244 128,821 131,80285 and over 63,848 72,177 78,645 93,057 121,373 157,537 193,560Total 2,904,321 2,988,194 3,064,144 3,140,008 3,213,274 3,280,420 3,337,654
Under 18 724,437 724,937 715,703 709,085 709,694 715,450 724,4305-19 years 604,018 607,123 602,557 592,712 590,805 592,226 600,60125-64 years 1,463,697 1,459,974 1,444,718 1,445,276 1,480,823 1,513,536 1,544,62565 and over 415,823 496,420 587,317 668,981 711,390 738,630 756,836100 and over 1,615 3,565 4,511 3,958 5,379 6,220 8,417
Source: Wichita State University, Center for Economic and Business Research, http://www.kansaseconomy.org/local-forecasts/population-forecast (accessed May 9, 2016).
Population Projections for Kansas, by Age Group2014-2044, Selected Years

Franklin
Seward
Ford
Montgomery
Finney
Chase
Ellis
Cowley
Reno
Crawford
Lyon
Atchison
McPherson
Labette
Barton Saline
Kearny
Ottawa
Jackson
Doniphan
Wyan-dotte
Wabaunsee
Pottawatomie
Johnson
Jefferson
Butler
Osage
Leaven-worth
Linn
Harvey
Geary
Shawnee
Riley
Sedgwick
Miami
Sumner
Douglas KansasCity
Lawrence
Manhattan
St.Joseph
Topeka
Wichita
Atchison
Coffeyville
Dodge City
Emporia
Garden City
Great Bend
Hays
Hutchison
Liberal
McPherson
Ottawa
Parsons
Pittsburg
Salina
Winfield
Greeley
Phillips
Pawnee
Clay
Bourbon
Republic Marshall
Woodson
Lincoln
Stanton
Sheridan
CherokeeComanche
Logan
Harper
Allen
Norton
Thomas
Hamilton
Osborne
Hodgeman
Trego
Cloud
Brown
Dickinson
Lane
Cheyenne
Wallace
Chautauqua
KiowaHaskell
Rice
Morton
Rush
Washington Nemaha
Ness
Grant
Edwards
Morris
Rooks
Barber
Anderson
Decatur
Sherman
Gray
Clark
Kingman
Scott
Jewell
Wilson
Wichita
Stevens
Graham
Gove
Neosho
Smith
Russell
Rawlins
Coffey
Stafford
Elk
Greenwood
Meade
Mitchell
Marion
Ellsworth
Pratt
Metropolitan and Micropolitan Areas in Kansas
Metropolitan Area (19 counties)Micropolitan Area (18 counties)Outside core-based Statistical
Area (CBSA) (68 counties)
Source: Institute for Policy & Social Research, The Universary of Kansas; data from the Executive Office of the President, Office of Management and Budget, Bulletin 20-01 released 3/6/2020; U.S. Census Bureau, 2010 Census.

Population of Metropolitan Areas in Kansas, 2010-2020
Metropolitan Area (MA)and County
April 1, 2010Census
July 1, 2012Estimate
July 1, 2014Estimate
July 1, 2015Estimate
July 1, 2016Estimate
July 1, 2017Estimate
July 1, 2018Estimate
July 1, 2019Estimate
April 1, 2020Census
NumericalChange
Apr 2010 -Apr 2020
PercentChange
Apr 2010 - Apr 2020
Kansas 2,853,118 2,886,024 2,901,861 2,910,717 2,912,977 2,910,892 2,912,748 2,912,635 2,937,880 84,762 3.0Inside MAs 1,923,137 1,960,731 1,983,765 1,998,220 2,007,747 2,012,779 2,021,183 2,026,526 2,045,874 122,737 6.4Outside MAs 929,981 925,293 918,096 912,497 905,230 898,113 891,565 886,109 892,006 -37,975 -4.1
Kansas City, KS MA 820,354 838,941 856,746 865,559 874,511 881,712 889,970 894,826 904,771 84,417 10.3Johnson 544,179 559,647 573,322 580,158 586,601 592,055 599,045 602,948 609,863 65,684 12.1Leavenworth 76,227 77,708 78,678 79,269 80,422 81,259 81,659 81,911 81,881 5,654 7.4Linn 9,656 9,481 9,532 9,574 9,604 9,694 9,771 9,714 9,591 -65 -0.7Miami 32,787 32,681 32,889 32,782 32,960 33,450 33,714 34,244 34,191 1,404 4.3Wyandotte 157,505 159,424 162,325 163,776 164,924 165,254 165,781 166,009 169,245 11,740 7.5
Lawrence MA 110,826 113,360 116,540 118,265 119,876 120,516 121,327 122,269 118,785 7,959 7.2Douglas 110,826 113,360 116,540 118,265 119,876 120,516 121,327 122,269 118,785 7,959 7.2
Manhattan MA 127,081 137,830 135,855 137,221 134,421 132,002 132,067 129,222 134,046 6,965 5.5Geary 34,362 37,946 36,530 36,783 35,401 33,935 32,998 31,992 36,739 2,377 6.9Pottawatomie 21,604 22,339 22,755 23,145 23,646 23,938 24,243 24,468 25,348 3,744 17.3Riley 71,115 77,545 76,570 77,293 75,374 74,129 74,826 72,762 71,959 844 1.2
St. Joseph MA 7,945 7,891 7,839 7,789 7,713 7,655 7,632 7,584 7,510 -435 -5.5Doniphan 7,945 7,891 7,839 7,789 7,713 7,655 7,632 7,584 7,510 -435 -5.5
Topeka MA 233,870 234,445 233,799 233,617 233,237 233,047 232,216 231,862 233,152 -718 -0.3Jackson 13,462 13,402 13,441 13,286 13,274 13,347 13,288 13,164 13,232 -230 -1.7Jefferson 19,126 18,858 18,798 18,789 18,838 18,935 18,901 19,165 18,368 -758 -4.0Osage 16,295 16,179 15,973 15,867 15,836 15,842 15,921 15,906 15,766 -529 -3.2Shawnee 177,934 179,013 178,651 178,789 178,413 178,096 177,224 176,735 178,909 975 0.5Wabaunsee 7,053 6,993 6,936 6,886 6,876 6,827 6,882 6,892 6,877 -176 -2.5
Wichita MA 623,061 628,264 632,986 635,769 637,989 637,847 637,971 640,763 647,610 24,549 3.9Butler 65,880 65,692 65,900 66,293 66,723 66,916 66,887 66,932 67,380 1,500 2.3Harvey 34,684 34,769 34,621 34,832 34,777 34,436 34,225 34,442 34,024 -660 -1.9Sedgwick 498,365 504,171 509,084 511,230 513,324 513,392 513,877 516,579 523,824 25,459 5.1Sumner 24,132 23,632 23,381 23,414 23,165 23,103 22,982 22,810 22,382 -1,750 -7.3
Source: U.S. Census Bureau, Population Division, https://www.census.gov/programs-surveys/popest/data/tables.html (accessed June 3, 2021); 2020 Census (PL94-171).
Metropolitan Areas appear as defined by the Office of Management and Budget (OMB) in OMB Bulletin 20-01 released 3/6/2020.

Reno1980
Ness1930
Gove1910
Finney2000
Clark1920
Gray1930
Lyon2000
Logan1910
Barber1930
Trego1930
Rice1940
Cowley1930
Pratt1930
Sumner1910
Meade1930
Lane1930
Rooks1910
Marion1920
Scott1980
Rush1930
Rawlins1930
Thomas1980
Barton1960
Norton1930
Kearny2000
Russell1940
Harper1910
Wallace1930
Sherman1970
Kiowa1910
Graham1910
Hamilton1950
Morris1910
Osborne1910
Grant2000
Morton1930
Cheyenne1930
Greeley1960
Greenwood1930
Sheridan1930
Stafford1910 Allen
1910
Wichita1970
Lincoln1910
Pawnee1950
Kingman1910
Labette1920
Stanton2000
Dickinson1930
Wilson1920
Hodgeman1930
Haskell2000
Ellsworth1910
Neosho1920
Comanche1920
Edwards1930
Crawford1920
Montgomery1930
Butler2020Ford
2020
Ellis2020
Smith1900
Jewell1900
Clay1890
Elk1890
Linn1890
Riley2020
Chase1900
Cloud1890
Phillips1900
Saline2010
Decatur1900
Osage1890
Marshall1900
Sedgwick2020
Ottawa1890
Coffey1900
Miami2020
Mitchell1890
Stevens2010
Nemaha1900
Brown1900
Seward2010
Republic1890
McPherson2020
Jackson1900
Harvey2010
Washington1890
Bourbon1890
Franklin2020
Wabaunsee1900
Geary2020
Pottawatomie2020
Cherokee1900
Anderson1890
Douglas2020
Johnson2020
Chautauqua1890
Woodson1900
Atchison1900
Shawnee2020
Jefferson2010
Doniphan1900 Census Years
1890190019101920193019401950196019701980200020102020
Census Year of Maximum Population by Kansas County1890-2020
Source: Institute for Policy & Social Research, The University of Kansas; data from U.S. Census Bureau, Decennial Census.
LeavenworthWyandotte
19702020

County 1860 1870 1880 1890 1900 1910 1920 1930 1940 1950 1960 1970
Allen 3,082 7,022 11,303 13,509 19,507 27,640 23,509 21,391 19,874 18,187 16,369 15,043Anderson 2,400 5,220 9,057 14,203 13,938 13,829 12,986 13,355 11,658 10,267 9,035 8,501Atchison 7,729 15,507 26,668 26,758 28,606 28,107 23,411 23,945 22,222 21,496 20,898 19,165Barber - - 2,661 7,973 6,594 9,916 9,739 10,178 9,073 8,521 8,713 7,016Barton - 2 10,318 13,172 13,784 17,876 18,422 19,776 25,010 29,909 32,368 30,663Bourbon 6,101 15,076 19,591 28,575 24,712 24,007 23,198 22,386 20,944 19,153 16,090 15,215Brown 2,607 6,823 12,817 20,796 22,369 21,314 20,949 20,553 17,395 14,651 13,229 11,685Butler 437 3,035 18,586 24,055 23,363 23,059 43,842 35,904 32,013 31,001 38,395 38,658Chase 808 1,975 6,081 8,233 8,246 7,527 7,144 6,952 6,345 4,831 3,921 3,408Chautauqua - - 11,072 12,297 11,804 11,429 11,598 10,352 9,233 7,376 5,956 4,642Cherokee 1,501 11,038 21,905 27,770 42,694 38,162 33,609 31,457 29,817 25,144 22,279 21,549Cheyenne - - 37 4,401 2,640 4,248 5,587 6,948 6,221 5,668 4,708 4,256Clark - - 163 2,357 1,701 4,093 4,989 4,796 4,081 3,946 3,396 2,896Clay 163 2,942 12,320 16,146 15,833 15,251 14,365 14,556 13,281 11,697 10,675 9,890Cloud - 2,323 15,343 19,295 18,071 18,388 17,714 18,006 17,247 16,104 14,407 13,466Coffey 2,842 6,201 11,438 15,856 16,643 15,205 14,254 13,653 12,278 10,408 8,403 7,397Comanche - - 372 2,549 1,619 3,281 5,302 5,238 4,412 3,888 3,271 2,702Cowley 158 1,175 21,538 34,478 30,156 31,790 35,155 40,903 38,139 36,905 37,861 35,012Crawford - 8,160 16,851 30,286 38,809 51,178 61,800 49,329 44,191 40,231 37,032 37,850Decatur - - 4,180 8,414 9,234 8,976 8,121 8,866 7,434 6,185 5,778 4,988Dickinson 378 3,043 15,251 22,273 21,816 24,361 25,777 25,870 22,929 21,190 21,572 19,993Doniphan 8,083 13,969 14,257 13,535 15,079 14,422 13,438 14,063 12,936 10,499 9,574 9,107Douglas 8,637 20,592 21,700 23,961 25,096 24,724 23,998 25,143 25,171 34,086 43,720 57,932Edwards - - 2,409 3,600 3,682 7,033 7,057 7,295 6,377 5,936 5,118 4,581Elk - - 10,623 12,216 11,443 10,128 9,034 9,210 8,180 6,679 5,048 3,858Ellis - 1,336 6,179 7,942 8,626 12,170 14,138 15,907 17,508 19,043 21,270 24,730Ellsworth - 1,185 8,494 9,272 9,626 10,444 10,379 10,132 9,855 8,465 7,677 6,146Finney - - 568 3,350 3,469 6,908 7,674 11,014 10,092 15,092 16,093 19,029Ford - 427 3,122 5,308 5,497 11,393 14,273 20,647 17,254 19,670 20,938 22,587Franklin 3,030 10,385 16,797 20,279 21,354 20,884 21,946 22,024 20,889 19,928 19,548 20,007Geary 1,163 5,526 6,994 10,423 10,744 12,681 13,452 14,366 15,222 21,671 28,779 28,111Gove - - 1,196 2,994 2,441 6,044 4,748 5,643 4,793 4,447 4,107 3,940Graham - - 4,258 5,029 5,173 8,700 7,624 7,772 6,071 5,020 5,586 4,751Grant - - 9 1,308 422 1,087 1,087 3,092 1,946 4,638 5,269 5,961Gray - - - 2,415 1,264 3,121 4,711 6,211 4,773 4,894 4,380 4,516Greeley - - 3 1,264 493 1,335 1,028 1,712 1,638 2,010 2,087 1,819Greenwood 759 3,484 10,548 16,309 16,196 16,060 14,715 19,235 16,495 13,574 11,253 9,141Hamilton - - 168 2,027 1,426 3,360 2,586 3,328 2,645 3,696 3,144 2,747Harper - - 4,133 13,266 10,310 14,748 13,656 12,823 12,068 10,263 9,541 7,871Harvey - - 11,451 17,601 17,591 19,200 20,744 22,120 21,712 21,698 25,865 27,236
Population in Kansas, by County, 1860-1970
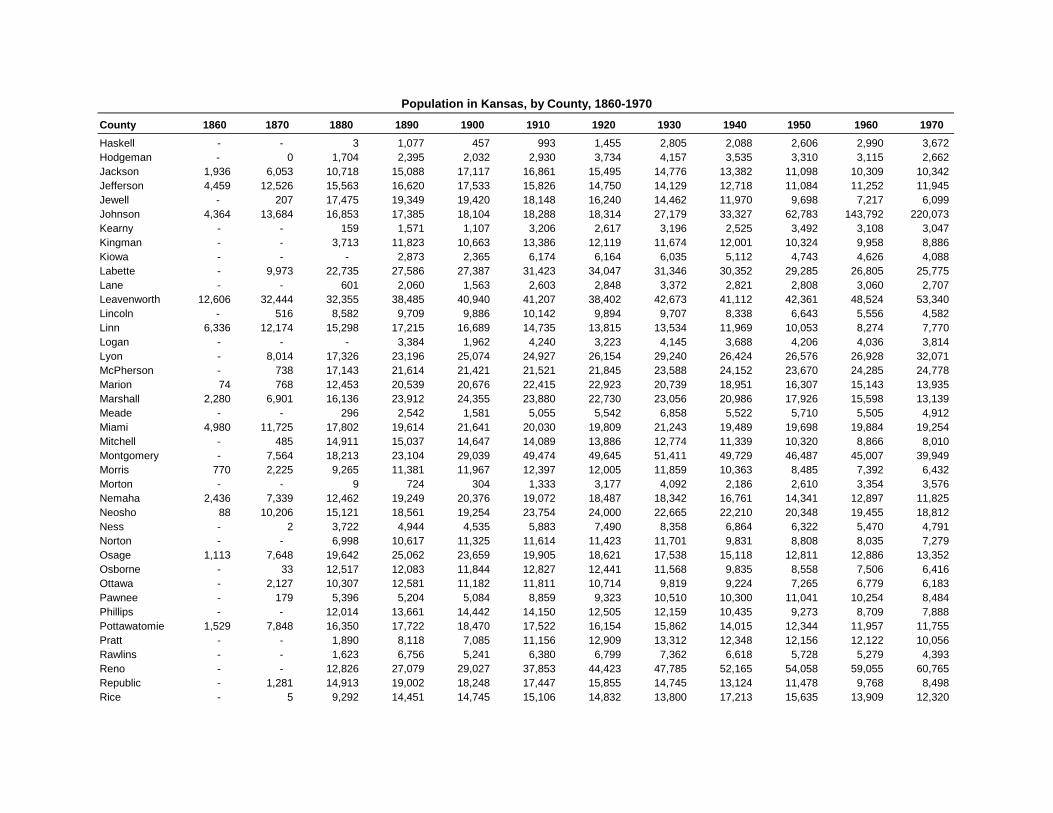
County 1860 1870 1880 1890 1900 1910 1920 1930 1940 1950 1960 1970
Population in Kansas, by County, 1860-1970
Haskell - - 3 1,077 457 993 1,455 2,805 2,088 2,606 2,990 3,672Hodgeman - 0 1,704 2,395 2,032 2,930 3,734 4,157 3,535 3,310 3,115 2,662Jackson 1,936 6,053 10,718 15,088 17,117 16,861 15,495 14,776 13,382 11,098 10,309 10,342Jefferson 4,459 12,526 15,563 16,620 17,533 15,826 14,750 14,129 12,718 11,084 11,252 11,945Jewell - 207 17,475 19,349 19,420 18,148 16,240 14,462 11,970 9,698 7,217 6,099Johnson 4,364 13,684 16,853 17,385 18,104 18,288 18,314 27,179 33,327 62,783 143,792 220,073Kearny - - 159 1,571 1,107 3,206 2,617 3,196 2,525 3,492 3,108 3,047Kingman - - 3,713 11,823 10,663 13,386 12,119 11,674 12,001 10,324 9,958 8,886Kiowa - - - 2,873 2,365 6,174 6,164 6,035 5,112 4,743 4,626 4,088Labette - 9,973 22,735 27,586 27,387 31,423 34,047 31,346 30,352 29,285 26,805 25,775Lane - - 601 2,060 1,563 2,603 2,848 3,372 2,821 2,808 3,060 2,707Leavenworth 12,606 32,444 32,355 38,485 40,940 41,207 38,402 42,673 41,112 42,361 48,524 53,340Lincoln - 516 8,582 9,709 9,886 10,142 9,894 9,707 8,338 6,643 5,556 4,582Linn 6,336 12,174 15,298 17,215 16,689 14,735 13,815 13,534 11,969 10,053 8,274 7,770Logan - - - 3,384 1,962 4,240 3,223 4,145 3,688 4,206 4,036 3,814Lyon - 8,014 17,326 23,196 25,074 24,927 26,154 29,240 26,424 26,576 26,928 32,071McPherson - 738 17,143 21,614 21,421 21,521 21,845 23,588 24,152 23,670 24,285 24,778Marion 74 768 12,453 20,539 20,676 22,415 22,923 20,739 18,951 16,307 15,143 13,935Marshall 2,280 6,901 16,136 23,912 24,355 23,880 22,730 23,056 20,986 17,926 15,598 13,139Meade - - 296 2,542 1,581 5,055 5,542 6,858 5,522 5,710 5,505 4,912Miami 4,980 11,725 17,802 19,614 21,641 20,030 19,809 21,243 19,489 19,698 19,884 19,254Mitchell - 485 14,911 15,037 14,647 14,089 13,886 12,774 11,339 10,320 8,866 8,010Montgomery - 7,564 18,213 23,104 29,039 49,474 49,645 51,411 49,729 46,487 45,007 39,949Morris 770 2,225 9,265 11,381 11,967 12,397 12,005 11,859 10,363 8,485 7,392 6,432Morton - - 9 724 304 1,333 3,177 4,092 2,186 2,610 3,354 3,576Nemaha 2,436 7,339 12,462 19,249 20,376 19,072 18,487 18,342 16,761 14,341 12,897 11,825Neosho 88 10,206 15,121 18,561 19,254 23,754 24,000 22,665 22,210 20,348 19,455 18,812Ness - 2 3,722 4,944 4,535 5,883 7,490 8,358 6,864 6,322 5,470 4,791Norton - - 6,998 10,617 11,325 11,614 11,423 11,701 9,831 8,808 8,035 7,279Osage 1,113 7,648 19,642 25,062 23,659 19,905 18,621 17,538 15,118 12,811 12,886 13,352Osborne - 33 12,517 12,083 11,844 12,827 12,441 11,568 9,835 8,558 7,506 6,416Ottawa - 2,127 10,307 12,581 11,182 11,811 10,714 9,819 9,224 7,265 6,779 6,183Pawnee - 179 5,396 5,204 5,084 8,859 9,323 10,510 10,300 11,041 10,254 8,484Phillips - - 12,014 13,661 14,442 14,150 12,505 12,159 10,435 9,273 8,709 7,888Pottawatomie 1,529 7,848 16,350 17,722 18,470 17,522 16,154 15,862 14,015 12,344 11,957 11,755Pratt - - 1,890 8,118 7,085 11,156 12,909 13,312 12,348 12,156 12,122 10,056Rawlins - - 1,623 6,756 5,241 6,380 6,799 7,362 6,618 5,728 5,279 4,393Reno - - 12,826 27,079 29,027 37,853 44,423 47,785 52,165 54,058 59,055 60,765Republic - 1,281 14,913 19,002 18,248 17,447 15,855 14,745 13,124 11,478 9,768 8,498Rice - 5 9,292 14,451 14,745 15,106 14,832 13,800 17,213 15,635 13,909 12,320

County 1860 1870 1880 1890 1900 1910 1920 1930 1940 1950 1960 1970
Population in Kansas, by County, 1860-1970
Riley 1,224 5,105 10,430 13,183 13,828 15,783 20,650 19,882 20,617 33,405 41,914 56,788Rooks - - 8,112 8,018 7,960 11,282 9,966 9,534 8,497 9,043 9,734 7,628Rush - - 5,490 5,204 6,134 7,826 8,360 9,093 8,285 7,231 6,160 5,117Russell - 156 7,351 7,333 8,489 10,800 10,748 11,045 13,464 13,406 11,348 9,428Saline - 4,246 13,808 17,442 17,076 20,338 25,103 29,337 29,535 33,409 54,715 46,592Scott - - 43 1,262 1,098 3,047 3,121 3,976 3,773 4,921 5,228 5,606Sedgwick - 1,095 18,753 43,626 44,037 73,095 92,234 136,330 143,311 222,290 343,231 350,694Seward - - 5 1,503 822 4,091 6,220 8,075 6,540 9,972 15,930 15,744Shawnee 3,513 13,121 29,093 49,172 53,727 61,874 69,159 85,200 91,247 105,418 141,286 155,322Sheridan - - 1,567 3,733 3,819 5,651 5,484 6,038 5,312 4,607 4,267 3,859Sherman - - 13 5,261 3,341 4,549 5,592 7,400 6,421 7,373 6,682 7,792Smith - 66 13,883 15,613 16,384 15,365 14,985 13,545 10,582 8,846 7,776 6,757Stafford - - 4,755 8,520 9,829 12,510 11,559 10,460 10,487 8,816 7,451 5,943Stanton - - 5 1,031 327 1,034 908 2,152 1,443 2,263 2,108 2,287Stevens - - 12 1,418 620 2,453 3,943 4,655 3,193 4,516 4,400 4,198Sumner - 22 20,812 30,271 25,631 30,654 29,213 28,960 26,163 23,646 25,316 23,553Thomas - - 161 5,538 4,112 5,455 5,517 7,334 6,425 7,572 7,358 7,501Trego - 166 2,535 2,535 2,722 5,398 5,880 6,470 5,822 5,868 5,473 4,436Wabaunsee 1,023 3,362 8,756 11,720 12,813 12,721 11,424 10,830 9,219 7,212 6,648 6,397Wallace - 538 686 2,468 1,178 2,759 2,424 2,882 2,216 2,508 2,069 2,215Washington 383 4,081 14,910 22,894 21,963 20,229 17,984 17,112 15,921 12,977 10,739 9,249Wichita - - 14 1,827 1,197 2,006 1,856 2,579 2,185 2,640 2,765 3,274Wilson 27 6,694 13,775 15,286 15,621 19,810 21,157 18,646 17,723 14,815 13,077 11,317Woodson 1,488 3,827 6,535 9,021 10,022 9,450 8,984 8,526 8,014 6,711 5,423 4,789Wyandotte 2,609 10,015 19,143 54,407 73,227 100,068 122,218 141,211 145,071 165,318 185,495 186,845Kansas 103,116 361,605 995,494 1,427,154 1,470,495 1,690,949 1,769,257 1,880,999 1,801,028 1,905,299 2,178,611 2,249,071
Single dash (-) indicates not available.
Source: U.S. Census Bureau, Population of States and Counties of the United States: 1790-1990 (PB96-119060); 1990 Census of Population and Housing, Population and Housing Units Counts: Kansas (CPH-2-18), http://www.census.gov/population/www/censusdata/hiscendata.html (accessed December 1, 2005).

Reno61,898
Johnson609,863
Butler67,380
Saline54,303
Shawnee178,909
Riley71,959
Sedgwick523,824
Douglas118,785
Greeley1,284
Franklin25,996
Phillips4,981
Jackson13,232
Pawnee6,253
Clay8,117
Bourbon14,360
Republic4,674
Seward21,964
Ford34,287
Marshall10,038
Woodson3,115
Lincoln2,939
Finney38,470
Stanton2,084
Sheridan2,447
Chase2,572
Ellis28,934
Cowley34,549
Cherokee19,362
Wabaunsee6,877
Comanche1,689
Logan2,762
Harper5,485
Crawford38,972
Allen12,526
Lyon32,179
Pottawatomie25,348
Atchison16,348
Norton5,459
Thomas7,930
Hamilton2,518
Osborne3,500
Hodgeman1,723
Trego2,808
Cloud9,032
Brown9,508
Jefferson18,368
Dickinson18,402
Lane1,574
Cheyenne2,616
Wallace1,512
Chautauqua3,379
Kiowa2,460
Haskell3,780
Rice9,427
Morton2,701
Rush2,956
Washington5,530
Nemaha10,273
McPherson30,223
Ness2,687
Grant7,352
Osage15,766
Labette20,184
Edwards2,907
Linn9,591
Morris5,386
Rooks4,919
Barber4,228
Anderson7,836
Decatur2,764
Sherman5,927
Gray5,653
Barton25,493
Clark1,991
Kingman7,470
Harvey34,024
Geary36,739
Scott5,151
Jewell2,932
Wilson8,624
Wichita2,152
Stevens5,250
Graham2,415
Kearny3,983
Gove2,718
Neosho15,904
Smith3,570
Russell6,691
Rawlins2,561
Coffey8,360
Stafford4,072
Elk2,483
Ottawa5,735
Greenwood6,016
Meade4,055
Miami34,191
Mitchell5,796
Marion11,823
Ellsworth6,376
Sumner22,382
Pratt9,157
Total Population in Kansas, by CountyApril 1, 2020
State: 2,937,880Source: Institute for Policy & Social Research, The University of Kansas; data from the U.S. Census Bureau.
Leavenworth81,881
Wyandotte169,245
Population1,284 - 5,0005,001 - 10,00010,001 - 50,00050,001 - 100,000100,001 - 609,863
Montgomery31,486

Phillips-11.7
Pawnee-10.3
Cherokee-10.4Comanche
-10.7
Pottawatomie17.3
Johnson12.1
Hodgeman-10.1
Lane-10.1
Haskell-11.2
Morton-16.5
Rush-10.6Ness
-13.5
Barber-13.0
Clark-10.1
Elk-13.8
Greenwood-10.1
Meade-11.4
Greeley3.0
Franklin0.0
Jackson-1.7Clay
-4.9
Bourbon-5.4
Republic-6.1
Doniphan-5.5
Seward-4.3
Ford1.3
Marshall-0.8
Woodson-5.9
Lincoln-9.3
Finney4.6
Stanton-6.8
Sheridan-4.3
Chase-7.8
Ellis1.7
Cowley-4.9
Reno-4.1
Wabaunsee-2.5Logan
0.2
Harper-9.1
Crawford-0.4
Allen-6.3
Lyon-4.5
Atchison-3.4
Norton-3.7
Thomas0.4
Hamilton-6.4
Osborne-9.3
Trego-6.4
Cloud-5.3
Brown-4.8
Jefferson-4.0
Dickinson-6.8
Butler2.3
Cheyenne-4.0
Wallace1.8
Chautauqua-7.9
Kiowa-3.6
Rice-6.5
Washington-4.6
Nemaha0.9
McPherson3.6
Grant-6.1
Osage-3.2
Labette-6.6
Edwards-4.3
Linn-0.7
Morris-9.1
Rooks-5.1
Anderson-3.3
Decatur-6.7
Sherman-1.4
Gray-5.9
Barton-7.9
Saline-2.3
Kingman-4.9
Harvey-1.9
Geary6.9
Scott4.4
Jewell-4.7
Wilson-8.3
Wichita-3.7
Stevens-8.3
Graham-7.0
Kearny0.2
Gove0.9
Neosho-3.7
Smith-7.3
Russell-4.0
Rawlins1.7
Shawnee0.5
Riley1.2
Coffey-2.8
Stafford-8.2
Ottawa-5.8
Sedgwick5.1
Miami4.3
Mitchell-9.1
Marion-6.6
Ellsworth-1.9
Sumner-7.3
Pratt-5.2
Douglas7.2
Percent Population Change in Kansas, by County2010 - 2020
State: 3.0Source: Institute for Policy & Social Research, The University of Kansas; data from the U.S. Census Bureau.
LeavenworthWyandotte
7.4
7.5
Percent Population Changeless than -10.0-10.0 - -5.0-4.9 - 5.05.1 - 10.0greater than 10.0
Montgomery-11.2

County 1980 1990 2000 2010 2020
PercentChange
2010-2020
Allen 15,654 14,638 14,385 13,371 12,526 -845 -6.3Anderson 8,749 7,803 8,110 8,102 7,836 -266 -3.3Atchison 18,397 16,932 16,774 16,924 16,348 -576 -3.4Barber 6,548 5,874 5,307 4,861 4,228 -633 -13.0Barton 31,343 29,382 28,205 27,674 25,493 -2,181 -7.9Bourbon 15,969 14,966 15,379 15,173 14,360 -813 -5.4Brown 11,955 11,128 10,724 9,984 9,508 -476 -4.8Butler 44,782 50,580 59,484 65,880 67,380 1,500 2.3Chase 3,309 3,021 3,030 2,790 2,572 -218 -7.8Chautauqua 5,016 4,407 4,359 3,669 3,379 -290 -7.9Cherokee 22,304 21,374 22,605 21,603 19,362 -2,241 -10.4Cheyenne 3,678 3,243 3,165 2,726 2,616 -110 -4.0Clark 2,599 2,418 2,390 2,215 1,991 -224 -10.1Clay 9,802 9,158 8,822 8,535 8,117 -418 -4.9Cloud 12,494 11,023 10,268 9,533 9,032 -501 -5.3Coffey 9,370 8,404 8,865 8,601 8,360 -241 -2.8Comanche 2,554 2,313 1,967 1,891 1,689 -202 -10.7Cowley 36,824 36,915 36,291 36,311 34,549 -1,762 -4.9Crawford 37,916 35,582 38,242 39,134 38,972 -162 -0.4Decatur 4,509 4,021 3,472 2,961 2,764 -197 -6.7Dickinson 20,175 18,958 19,344 19,754 18,402 -1,352 -6.8Doniphan 9,268 8,134 8,249 7,945 7,510 -435 -5.5Douglas 67,640 81,798 99,962 110,826 118,785 7,959 7.2Edwards 4,271 3,787 3,449 3,037 2,907 -130 -4.3Elk 3,918 3,327 3,261 2,882 2,483 -399 -13.8Ellis 26,098 26,004 27,507 28,452 28,934 482 1.7Ellsworth 6,640 6,586 6,525 6,497 6,376 -121 -1.9Finney 23,825 33,070 40,523 36,776 38,470 1,694 4.6Ford 24,315 27,463 32,458 33,848 34,287 439 1.3Franklin 22,062 21,994 24,784 25,992 25,996 4 0.0Geary 29,852 30,453 27,947 34,362 36,739 2,377 6.9Gove 3,726 3,231 3,068 2,695 2,718 23 0.9Graham 3,995 3,543 2,946 2,597 2,415 -182 -7.0Grant 6,977 7,159 7,909 7,829 7,352 -477 -6.1Gray 5,138 5,396 5,904 6,006 5,653 -353 -5.9Greeley 1,845 1,774 1,534 1,247 1,284 37 3.0Greenwood 8,764 7,847 7,673 6,689 6,016 -673 -10.1Hamilton 2,514 2,388 2,670 2,690 2,518 -172 -6.4Harper 7,778 7,124 6,536 6,034 5,485 -549 -9.1Harvey 30,531 31,028 32,869 34,684 34,024 -660 -1.9Haskell 3,814 3,886 4,307 4,256 3,780 -476 -11.2Hodgeman 2,269 2,177 2,085 1,916 1,723 -193 -10.1Jackson 11,644 11,525 12,657 13,462 13,232 -230 -1.7Jefferson 15,207 15,905 18,426 19,126 18,368 -758 -4.0Jewell 5,241 4,251 3,791 3,077 2,932 -145 -4.7Johnson 270,269 355,021 451,479 544,179 609,863 65,684 12.1Kearny 3,435 4,027 4,531 3,977 3,983 6 0.2Kingman 8,960 8,292 8,673 7,858 7,470 -388 -4.9Kiowa 4,046 3,660 3,278 2,553 2,460 -93 -3.6Labette 25,682 23,693 22,835 21,607 20,184 -1,423 -6.6Lane 2,472 2,375 2,155 1,750 1,574 -176 -10.1Leavenworth 54,809 64,371 68,691 76,227 81,881 5,654 7.4Lincoln 4,145 3,653 3,578 3,241 2,939 -302 -9.3Linn 8,234 8,254 9,570 9,656 9,591 -65 -0.7Logan 3,478 3,081 3,046 2,756 2,762 6 0.2Lyon 35,108 34,732 35,935 33,690 32,179 -1,511 -4.5
Population and Population Change in Kansas, by County, 1980-2020
Increase orDecrease2010-2020

County 1980 1990 2000 2010 2020
PercentChange
2010-2020
Population and Population Change in Kansas, by County, 1980-2020
Increase orDecrease2010-2020
McPherson 26,855 27,268 29,554 29,180 30,223 1,043 3.6Marion 13,522 12,888 13,361 12,660 11,823 -837 -6.6Marshall 12,787 11,705 10,965 10,117 10,038 -79 -0.8Meade 4,788 4,247 4,631 4,575 4,055 -520 -11.4Miami 21,618 23,466 28,351 32,787 34,191 1,404 4.3Mitchell 8,117 7,203 6,932 6,373 5,796 -577 -9.1Montgomery 42,281 38,816 36,254 35,471 31,486 -3,985 -11.2Morris 6,419 6,198 6,104 5,923 5,386 -537 -9.1Morton 3,454 3,480 3,496 3,233 2,701 -532 -16.5Nemaha 11,211 10,446 10,717 10,178 10,273 95 0.9Neosho 18,967 17,035 16,997 16,512 15,904 -608 -3.7Ness 4,498 4,033 3,454 3,107 2,687 -420 -13.5Norton 6,689 5,947 5,953 5,671 5,459 -212 -3.7Osage 15,319 15,248 16,712 16,295 15,766 -529 -3.2Osborne 5,959 4,867 4,452 3,858 3,500 -358 -9.3Ottawa 5,971 5,634 6,163 6,091 5,735 -356 -5.8Pawnee 8,065 7,555 7,233 6,973 6,253 -720 -10.3Phillips 7,406 6,590 6,001 5,642 4,981 -661 -11.7Pottawatomie 14,782 16,128 18,209 21,604 25,348 3,744 17.3Pratt 10,275 9,702 9,647 9,656 9,157 -499 -5.2Rawlins 4,105 3,404 2,966 2,519 2,561 42 1.7Reno 64,983 62,389 64,790 64,511 61,898 -2,613 -4.1Republic 7,569 6,482 5,835 4,980 4,674 -306 -6.1Rice 11,900 10,610 10,761 10,083 9,427 -656 -6.5Riley 63,505 67,139 62,852 71,115 71,959 844 1.2Rooks 7,006 6,039 5,685 5,181 4,919 -262 -5.1Rush 4,516 3,842 3,551 3,307 2,956 -351 -10.6Russell 8,868 7,835 7,370 6,970 6,691 -279 -4.0Saline 48,905 49,301 53,597 55,606 54,303 -1,303 -2.3Scott 5,782 5,289 5,120 4,936 5,151 215 4.4Sedgwick 367,088 403,662 452,869 498,365 523,824 25,459 5.1Seward 17,071 18,743 22,510 22,952 21,964 -988 -4.3Shawnee 154,916 160,976 169,871 177,934 178,909 975 0.5Sheridan 3,544 3,043 2,813 2,556 2,447 -109 -4.3Sherman 7,759 6,926 6,760 6,010 5,927 -83 -1.4Smith 5,947 5,078 4,536 3,853 3,570 -283 -7.3Stafford 5,694 5,365 4,789 4,437 4,072 -365 -8.2Stanton 2,339 2,333 2,406 2,235 2,084 -151 -6.8Stevens 4,736 5,048 5,463 5,724 5,250 -474 -8.3Sumner 24,928 25,841 25,946 24,132 22,382 -1,750 -7.3Thomas 8,451 8,258 8,180 7,900 7,930 30 0.4Trego 4,165 3,694 3,319 3,001 2,808 -193 -6.4Wabaunsee 6,867 6,603 6,885 7,053 6,877 -176 -2.5Wallace 2,045 1,821 1,749 1,485 1,512 27 1.8Washington 8,543 7,073 6,483 5,799 5,530 -269 -4.6Wichita 3,041 2,758 2,531 2,234 2,152 -82 -3.7Wilson 12,128 10,289 10,332 9,409 8,624 -785 -8.3Woodson 4,600 4,116 3,788 3,309 3,115 -194 -5.9Wyandotte 172,335 162,026 157,882 157,505 169,245 11,740 7.5Kansas 2,364,236 2,477,588 2,688,824 2,853,118 2,937,880 84,762 3.0
Source: U.S. Census Bureau, 1980 Census of Population , Vol. 1, Chapter A, Part 18; 1990 Census of Population, General Population Characteristics: Kansas (1990 CP-1-18); 2000 Census, Profile of General Demographic Characteristics (DP-1); 2010 Census (PL94-171); CQR, http://www.census.gov/prod/cen2000/notes/cqr-ks.pdf (accessed December 1, 2005); 2020 Census (PL94-171).
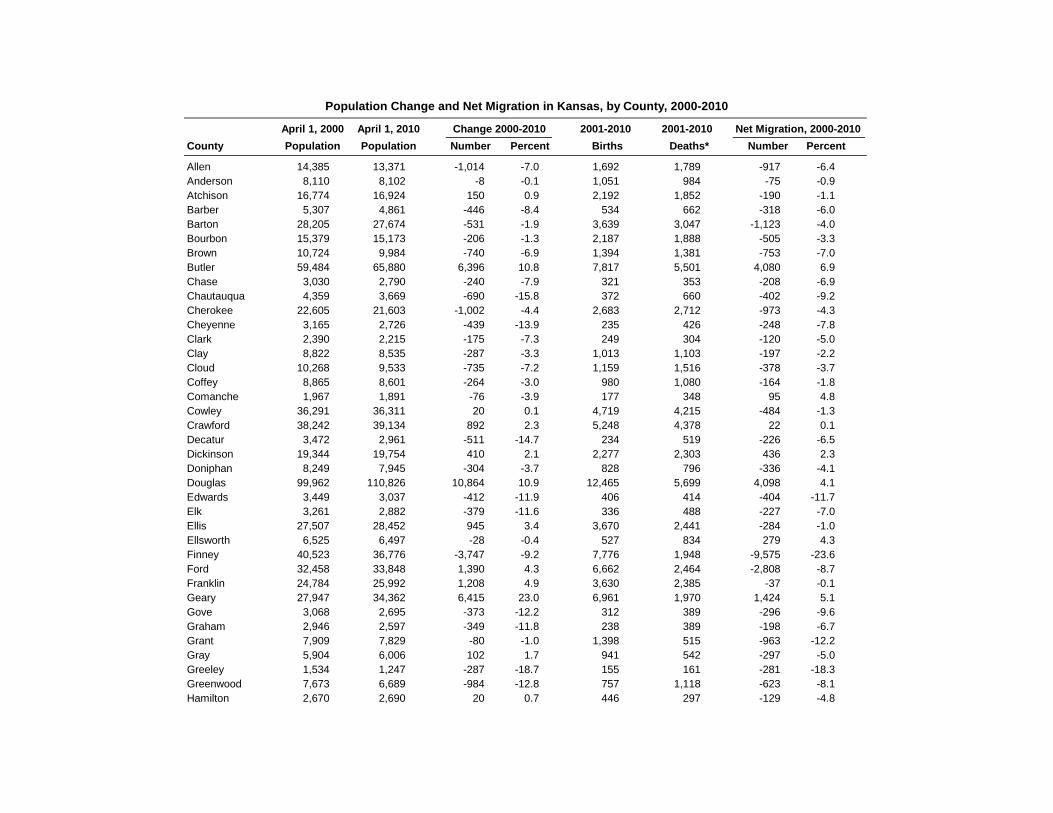
April 1, 2000 April 1, 2010 2001-2010 2001-2010
County Population Population Number Percent Births Deaths* Number Percent
Allen 14,385 13,371 -1,014 -7.0 1,692 1,789 -917 -6.4Anderson 8,110 8,102 -8 -0.1 1,051 984 -75 -0.9Atchison 16,774 16,924 150 0.9 2,192 1,852 -190 -1.1Barber 5,307 4,861 -446 -8.4 534 662 -318 -6.0Barton 28,205 27,674 -531 -1.9 3,639 3,047 -1,123 -4.0Bourbon 15,379 15,173 -206 -1.3 2,187 1,888 -505 -3.3Brown 10,724 9,984 -740 -6.9 1,394 1,381 -753 -7.0Butler 59,484 65,880 6,396 10.8 7,817 5,501 4,080 6.9Chase 3,030 2,790 -240 -7.9 321 353 -208 -6.9Chautauqua 4,359 3,669 -690 -15.8 372 660 -402 -9.2Cherokee 22,605 21,603 -1,002 -4.4 2,683 2,712 -973 -4.3Cheyenne 3,165 2,726 -439 -13.9 235 426 -248 -7.8Clark 2,390 2,215 -175 -7.3 249 304 -120 -5.0Clay 8,822 8,535 -287 -3.3 1,013 1,103 -197 -2.2Cloud 10,268 9,533 -735 -7.2 1,159 1,516 -378 -3.7Coffey 8,865 8,601 -264 -3.0 980 1,080 -164 -1.8Comanche 1,967 1,891 -76 -3.9 177 348 95 4.8Cowley 36,291 36,311 20 0.1 4,719 4,215 -484 -1.3Crawford 38,242 39,134 892 2.3 5,248 4,378 22 0.1Decatur 3,472 2,961 -511 -14.7 234 519 -226 -6.5Dickinson 19,344 19,754 410 2.1 2,277 2,303 436 2.3Doniphan 8,249 7,945 -304 -3.7 828 796 -336 -4.1Douglas 99,962 110,826 10,864 10.9 12,465 5,699 4,098 4.1Edwards 3,449 3,037 -412 -11.9 406 414 -404 -11.7Elk 3,261 2,882 -379 -11.6 336 488 -227 -7.0Ellis 27,507 28,452 945 3.4 3,670 2,441 -284 -1.0Ellsworth 6,525 6,497 -28 -0.4 527 834 279 4.3Finney 40,523 36,776 -3,747 -9.2 7,776 1,948 -9,575 -23.6Ford 32,458 33,848 1,390 4.3 6,662 2,464 -2,808 -8.7Franklin 24,784 25,992 1,208 4.9 3,630 2,385 -37 -0.1Geary 27,947 34,362 6,415 23.0 6,961 1,970 1,424 5.1Gove 3,068 2,695 -373 -12.2 312 389 -296 -9.6Graham 2,946 2,597 -349 -11.8 238 389 -198 -6.7Grant 7,909 7,829 -80 -1.0 1,398 515 -963 -12.2Gray 5,904 6,006 102 1.7 941 542 -297 -5.0Greeley 1,534 1,247 -287 -18.7 155 161 -281 -18.3Greenwood 7,673 6,689 -984 -12.8 757 1,118 -623 -8.1Hamilton 2,670 2,690 20 0.7 446 297 -129 -4.8
Net Migration, 2000-2010Change 2000-2010
Population Change and Net Migration in Kansas, by County, 2000-2010
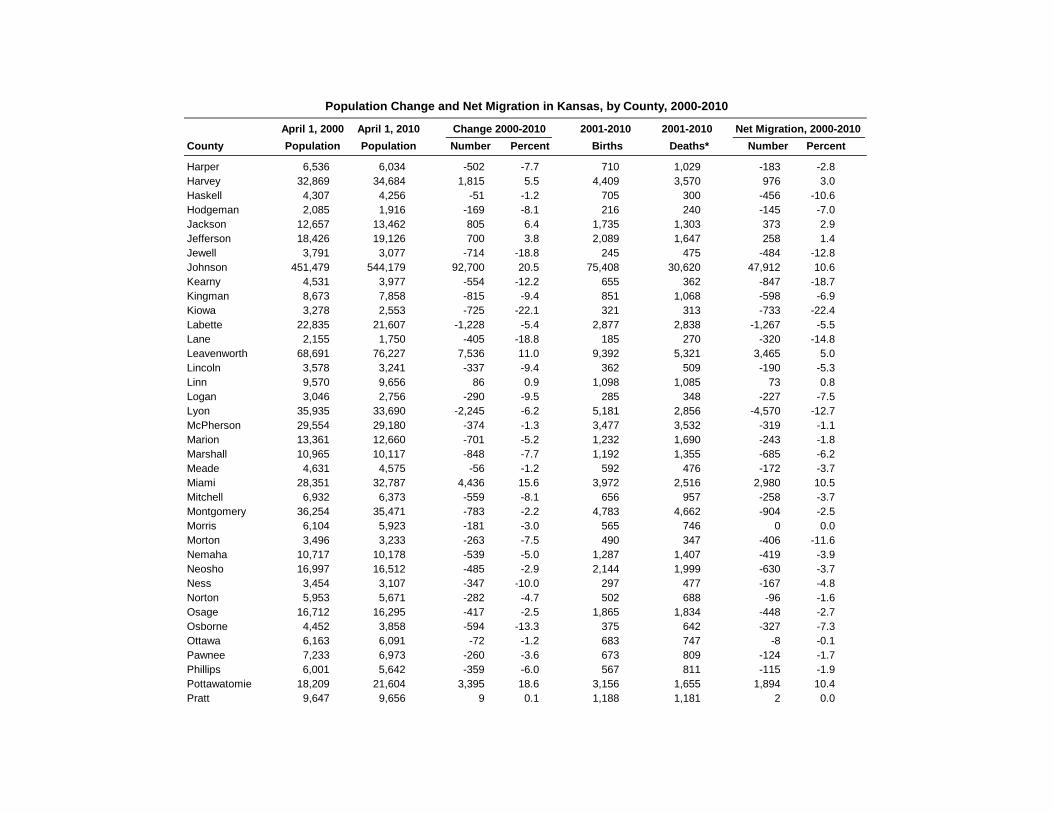
April 1, 2000 April 1, 2010 2001-2010 2001-2010
County Population Population Number Percent Births Deaths* Number Percent
Net Migration, 2000-2010Change 2000-2010
Population Change and Net Migration in Kansas, by County, 2000-2010
Harper 6,536 6,034 -502 -7.7 710 1,029 -183 -2.8Harvey 32,869 34,684 1,815 5.5 4,409 3,570 976 3.0Haskell 4,307 4,256 -51 -1.2 705 300 -456 -10.6Hodgeman 2,085 1,916 -169 -8.1 216 240 -145 -7.0Jackson 12,657 13,462 805 6.4 1,735 1,303 373 2.9Jefferson 18,426 19,126 700 3.8 2,089 1,647 258 1.4Jewell 3,791 3,077 -714 -18.8 245 475 -484 -12.8Johnson 451,479 544,179 92,700 20.5 75,408 30,620 47,912 10.6Kearny 4,531 3,977 -554 -12.2 655 362 -847 -18.7Kingman 8,673 7,858 -815 -9.4 851 1,068 -598 -6.9Kiowa 3,278 2,553 -725 -22.1 321 313 -733 -22.4Labette 22,835 21,607 -1,228 -5.4 2,877 2,838 -1,267 -5.5Lane 2,155 1,750 -405 -18.8 185 270 -320 -14.8Leavenworth 68,691 76,227 7,536 11.0 9,392 5,321 3,465 5.0Lincoln 3,578 3,241 -337 -9.4 362 509 -190 -5.3Linn 9,570 9,656 86 0.9 1,098 1,085 73 0.8Logan 3,046 2,756 -290 -9.5 285 348 -227 -7.5Lyon 35,935 33,690 -2,245 -6.2 5,181 2,856 -4,570 -12.7McPherson 29,554 29,180 -374 -1.3 3,477 3,532 -319 -1.1Marion 13,361 12,660 -701 -5.2 1,232 1,690 -243 -1.8Marshall 10,965 10,117 -848 -7.7 1,192 1,355 -685 -6.2Meade 4,631 4,575 -56 -1.2 592 476 -172 -3.7Miami 28,351 32,787 4,436 15.6 3,972 2,516 2,980 10.5Mitchell 6,932 6,373 -559 -8.1 656 957 -258 -3.7Montgomery 36,254 35,471 -783 -2.2 4,783 4,662 -904 -2.5Morris 6,104 5,923 -181 -3.0 565 746 0 0.0Morton 3,496 3,233 -263 -7.5 490 347 -406 -11.6Nemaha 10,717 10,178 -539 -5.0 1,287 1,407 -419 -3.9Neosho 16,997 16,512 -485 -2.9 2,144 1,999 -630 -3.7Ness 3,454 3,107 -347 -10.0 297 477 -167 -4.8Norton 5,953 5,671 -282 -4.7 502 688 -96 -1.6Osage 16,712 16,295 -417 -2.5 1,865 1,834 -448 -2.7Osborne 4,452 3,858 -594 -13.3 375 642 -327 -7.3Ottawa 6,163 6,091 -72 -1.2 683 747 -8 -0.1Pawnee 7,233 6,973 -260 -3.6 673 809 -124 -1.7Phillips 6,001 5,642 -359 -6.0 567 811 -115 -1.9Pottawatomie 18,209 21,604 3,395 18.6 3,156 1,655 1,894 10.4Pratt 9,647 9,656 9 0.1 1,188 1,181 2 0.0

April 1, 2000 April 1, 2010 2001-2010 2001-2010
County Population Population Number Percent Births Deaths* Number Percent
Net Migration, 2000-2010Change 2000-2010
Population Change and Net Migration in Kansas, by County, 2000-2010
Rawlins 2,966 2,519 -447 -15.1 215 402 -260 -8.8Reno 64,790 64,511 -279 -0.4 8,345 6,847 -1,777 -2.7Republic 5,835 4,980 -855 -14.7 466 839 -482 -8.3Rice 10,761 10,083 -678 -6.3 1,238 1,278 -638 -5.9Riley 62,852 71,115 8,263 13.1 9,915 3,078 1,426 2.3Rooks 5,685 5,181 -504 -8.9 619 696 -427 -7.5Rush 3,551 3,307 -244 -6.9 337 511 -70 -2.0Russell 7,370 6,970 -400 -5.4 756 1,026 -130 -1.8Saline 53,597 55,606 2,009 3.7 7,978 5,132 -837 -1.6Scott 5,120 4,936 -184 -3.6 674 547 -311 -6.1Sedgwick 452,869 498,365 45,496 10.0 78,837 38,285 4,944 1.1Seward 22,510 22,952 442 2.0 5,276 1,379 -3,455 -15.3Shawnee 169,871 177,934 8,063 4.7 25,116 16,737 -316 -0.2Sheridan 2,813 2,556 -257 -9.1 280 330 -207 -7.4Sherman 6,760 6,010 -750 -11.1 756 730 -776 -11.5Smith 4,536 3,853 -683 -15.1 326 663 -346 -7.6Stafford 4,789 4,437 -352 -7.4 480 627 -205 -4.3Stanton 2,406 2,235 -171 -7.1 374 187 -358 -14.9Stevens 5,463 5,724 261 4.8 897 476 -160 -2.9Sumner 25,946 24,132 -1,814 -7.0 3,088 2,724 -2,178 -8.4Thomas 8,180 7,900 -280 -3.4 1,031 788 -523 -6.4Trego 3,319 3,001 -318 -9.6 312 463 -167 -5.0Wabaunsee 6,885 7,053 168 2.4 825 653 -4 -0.1Wallace 1,749 1,485 -264 -15.1 150 188 -226 -12.9Washington 6,483 5,799 -684 -10.6 612 883 -413 -6.4Wichita 2,531 2,234 -297 -11.7 342 241 -398 -15.7Wilson 10,332 9,409 -923 -8.9 1,228 1,368 -783 -7.6Woodson 3,788 3,309 -479 -12.6 362 597 -244 -6.4Wyandotte 157,882 157,505 -377 -0.2 28,330 14,312 -14,395 -9.1Kansas 2,688,824 2,853,118 164,294 6.1 403,266 244,550 5,571 0.2
* Kansas total includes deaths not assigned to a county.
Source: U.S. Census Bureau, 2000 Census; 2010 Census; and CQR, http://www.census.gov/prod/cen2000/notes/cqr-ks.pdf (accessed May 9, 2006); Kansas Department of Health and Environment, Annual Summary of Vital Statistics, various issues.

CountyAll
PersonsUnder
5 Years18 yearsand over
21 yearsand over
65 yearsand over
85 yearsand over
Allen 13,371 880 10,223 9,528 2,445 406 Anderson 8,102 563 6,045 5,770 1,633 288 Atchison 16,924 1,106 12,831 11,594 2,601 393 Barber 4,861 307 3,769 3,627 991 152 Barton 27,674 1,986 20,890 19,655 4,688 768 Bourbon 15,173 1,120 11,287 10,473 2,628 420 Brown 9,984 725 7,450 7,126 1,829 312 Butler 65,880 4,367 48,129 45,126 8,327 1,272 Chase 2,790 151 2,175 2,102 591 93 Chautauqua 3,669 178 2,911 2,805 896 139 Cherokee 21,603 1,398 16,214 15,447 3,448 456 Cheyenne 2,726 140 2,145 2,083 717 154 Clark 2,215 145 1,656 1,605 487 110 Clay 8,535 579 6,514 6,277 1,744 339 Cloud 9,533 619 7,396 6,816 1,948 391 Coffey 8,601 491 6,514 6,244 1,483 221 Comanche 1,891 100 1,456 1,421 455 61 Cowley 36,311 2,459 27,441 25,532 5,726 920 Crawford 39,134 2,486 30,409 27,428 5,463 1,022 Decatur 2,961 150 2,406 2,340 808 156 Dickinson 19,754 1,286 14,859 14,241 3,566 634 Doniphan 7,945 453 6,170 5,560 1,286 215 Douglas 110,826 6,209 89,695 77,491 9,867 1,583 Edwards 3,037 180 2,316 2,247 581 94 Elk 2,882 171 2,267 2,189 700 105 Ellis 28,452 1,847 22,471 20,336 3,829 642 Ellsworth 6,497 343 5,280 5,114 1,228 228 Finney 36,776 3,532 25,000 23,058 3,089 403 Ford 33,848 3,254 23,378 21,674 3,377 583 Franklin 25,992 1,851 19,242 18,094 3,673 509 Geary 34,362 3,814 23,745 22,162 2,628 327 Gove 2,695 180 2,093 2,022 647 117 Graham 2,597 144 2,100 2,045 666 81 Grant 7,829 705 5,374 5,098 820 83 Gray 6,006 508 4,183 3,985 761 122 Greeley 1,247 81 981 944 261 47 Greenwood 6,689 398 5,212 5,039 1,485 217 Hamilton 2,690 253 1,927 1,825 366 62 Harper 6,034 406 4,606 4,439 1,307 230 Harvey 34,684 2,371 25,831 24,318 5,943 1,102 Haskell 4,256 345 2,930 2,760 456 54 Hodgeman 1,916 114 1,456 1,402 396 53 Jackson 13,462 906 9,888 9,494 2,073 280 Jefferson 19,126 1,097 14,401 13,829 2,952 361 Jewell 3,077 149 2,500 2,450 863 116 Johnson 544,179 39,180 400,823 385,343 59,322 9,332 Kearny 3,977 309 2,790 2,625 535 90 Kingman 7,858 457 5,958 5,720 1,570 274 Kiowa 2,553 132 2,003 1,834 482 88 Labette 21,607 1,498 16,345 15,404 3,587 612 Lane 1,750 86 1,356 1,311 369 56 Leavenworth 76,227 5,187 57,080 54,550 8,426 1,015 Lincoln 3,241 209 2,461 2,396 659 140 Linn 9,656 539 7,416 7,157 1,867 240
Population in Kansas, by Age and County, 2010

CountyAll
PersonsUnder
5 Years18 yearsand over
21 yearsand over
65 yearsand over
85 yearsand over
Population in Kansas, by Age and County, 2010
Logan 2,756 151 2,127 2,044 572 117 Lyon 33,690 2,344 25,750 23,391 4,213 679 McPherson 29,180 1,818 22,322 21,157 5,339 1,128 Marion 12,660 677 9,794 9,222 2,641 481 Marshall 10,117 655 7,781 7,503 2,134 405 Meade 4,575 340 3,247 3,110 785 143 Miami 32,787 2,140 23,944 22,871 4,287 554 Mitchell 6,373 378 5,006 4,708 1,341 250 Montgomery 35,471 2,437 27,072 25,228 6,156 1,065 Morris 5,923 307 4,651 4,491 1,322 227 Morton 3,233 214 2,360 2,248 548 118 Nemaha 10,178 663 7,511 7,259 2,049 459 Neosho 16,512 1,137 12,430 11,665 2,866 463 Ness 3,107 168 2,411 2,351 763 128 Norton 5,671 282 4,538 4,391 1,057 209 Osage 16,295 1,015 12,248 11,749 2,773 380 Osborne 3,858 209 3,044 2,950 974 194 Ottawa 6,091 350 4,542 4,398 1,066 125 Pawnee 6,973 385 5,445 5,195 1,215 197 Phillips 5,642 349 4,275 4,133 1,140 201 Pottawatomie 21,604 1,836 15,193 14,464 2,660 400 Pratt 9,656 639 7,451 6,881 1,822 363 Rawlins 2,519 130 2,044 1,987 672 120 Reno 64,511 4,254 49,275 46,416 10,994 1,866 Republic 4,980 253 4,018 3,917 1,347 285 Rice 10,083 626 7,674 7,085 1,801 278 Riley 71,115 4,835 57,947 47,777 5,208 921 Rooks 5,181 325 3,957 3,781 1,024 178 Rush 3,307 161 2,666 2,571 796 166 Russell 6,970 398 5,487 5,292 1,588 265 Saline 55,606 4,005 41,670 39,366 8,002 1,221 Scott 4,936 375 3,700 3,549 900 168 Sedgwick 498,365 39,302 362,989 343,030 56,969 8,291 Seward 22,952 2,301 15,617 14,329 1,948 270 Shawnee 177,934 12,396 133,763 127,209 25,612 3,790 Sheridan 2,556 171 1,953 1,896 563 92 Sherman 6,010 400 4,660 4,393 1,145 157 Smith 3,853 189 3,079 2,976 1,018 217 Stafford 4,437 252 3,400 3,277 930 164 Stanton 2,235 183 1,585 1,504 348 60 Stevens 5,724 485 3,973 3,771 752 144 Sumner 24,132 1,608 17,818 17,044 3,786 622 Thomas 7,900 518 6,056 5,461 1,216 217 Trego 3,001 135 2,402 2,319 703 121 Wabaunsee 7,053 465 5,261 5,064 1,111 126 Wallace 1,485 82 1,111 1,071 303 64 Washington 5,799 339 4,471 4,317 1,343 249 Wichita 2,234 165 1,626 1,583 401 69 Wilson 9,409 611 7,116 6,869 1,813 289 Woodson 3,309 178 2,651 2,565 750 144 Wyandotte 157,505 13,712 113,070 106,733 16,805 2,310 Kansas 2,853,118 205,492 2,126,179 1,999,716 376,116 59,318
Source: U.S. Census Bureau, 2010 Census, Profile of General Population and Housing Characteristics: 2010 (DP-1).

County 1960 1970 1980 1990 2000 2010
Allen 36.5 37.4 33.1 35.5 38.8 40.8Anderson 36.8 37.2 35.8 38.1 39.6 42.1Atchison 30.6 28.6 29.7 33.5 36.2 36.3Barber 32.1 37.8 37.8 37.5 42.6 45.8Barton 28.6 29.8 30.8 34.8 38.6 39.7Bourbon 39.6 39.5 35.4 36.8 38.0 38.2Brown 38.6 40.9 36.0 36.7 39.8 41.9Butler 29.5 30.3 31.0 33.8 35.9 37.2Chase 38.1 42.2 38.5 39.7 40.3 45.6Chautauqua 41.3 46.9 42.8 43.3 44.7 48.2Cherokee 36.0 34.6 34.0 35.8 37.0 40.5Cheyenne 34.2 38.4 41.1 41.8 44.2 50.0Clark 34.0 40.8 41.9 41.1 42.1 44.9Clay 38.7 40.3 37.2 39.2 41.3 43.3Cloud 36.6 36.9 36.5 39.9 41.4 42.2Coffey 39.9 43.0 33.1 36.2 39.2 43.0Comanche 35.6 40.4 40.5 41.6 46.9 47.4Cowley 33.1 34.0 32.6 34.7 37.0 38.5Crawford 37.9 32.9 33.3 34.4 33.8 32.6Decatur 35.0 39.0 39.3 40.2 44.3 51.4Dickinson 35.3 35.5 36.2 37.3 40.0 41.4Doniphan 34.4 31.7 31.4 35.1 36.8 39.6Douglas 24.3 23.2 24.3 25.8 26.6 28.4Edwards 33.8 38.0 37.8 39.4 41.0 44.8Elk 43.5 47.8 44.8 47.0 46.0 48.8Ellis 23.4 23.0 25.6 31.1 32.7 32.2Ellsworth 38.1 41.0 38.9 38.0 41.8 44.3Finney 24.7 24.1 26.2 27.2 28.1 30.2Ford 29.1 27.9 28.7 30.2 29.9 30.4Franklin 34.2 31.7 32.4 33.3 36.0 38.1Geary 23.9 23.2 23.9 26.5 29.1 27.7Gove 27.5 30.4 31.8 38.2 42.6 48.3
Median Age of Persons in Kansas, by County 1960-2010
Graham 27.2 30.9 35.5 39.1 44.4 49.4Grant 23.8 25.2 26.8 29.2 31.4 32.8Gray 30.3 31.2 29.3 32.2 33.0 34.7Greeley 25.9 30.8 31.5 33.2 38.6 46.6Greenwood 37.6 42.2 41.2 41.2 42.6 46.7Hamilton 27.3 33.6 37.0 38.1 37.6 33.5Harper 36.0 42.0 40.8 39.6 42.9 44.1Harvey 30.2 30.6 31.1 34.7 37.6 38.9Haskell 25.4 25.8 28.0 30.5 30.8 34.3Hodgeman 29.9 33.1 36.5 37.0 39.8 46.1Jackson 37.4 34.3 32.4 34.9 37.4 40.7Jefferson 34.1 31.2 32.8 35.2 38.0 42.6Jewell 40.0 41.6 40.0 42.7 46.2 52.5Johnson 28.3 27.0 30.4 32.8 35.2 36.4Kearny 26.1 28.0 28.0 30.8 31.6 35.5Kingman 32.1 35.8 34.8 36.9 40.2 44.5Kiowa 33.7 40.5 35.1 38.5 42.1 41.9Labette 35.9 33.7 32.3 35.0 37.9 40.5Lane 28.5 33.7 34.7 37.9 41.6 46.1Leavenworth 32.0 29.0 30.1 33.1 35.6 37.4Lincoln 38.5 43.9 44.0 42.4 43.7 46.4Linn 40.8 42.2 37.8 39.3 40.8 44.8Logan 28.1 30.8 33.4 38.1 40.7 44.9Lyon 29.9 24.3 26.3 29.1 30.9 32.5

County 1960 1970 1980 1990 2000 2010
Median Age of Persons in Kansas, by County 1960-2010
McPherson 31.7 31.4 31.8 34.7 38.1 41.4Marion 34.0 37.7 39.0 39.4 41.0 44.6Marshall 37.6 41.0 39.8 38.4 41.7 45.2Meade 29.8 34.6 33.6 36.9 36.1 38.8Miami 36.5 33.9 32.5 34.3 36.7 39.5Mitchell 36.5 36.7 33.5 37.7 41.1 45.6Montgomery 34.8 37.0 33.4 36.5 39.1 39.9Morris 37.4 41.4 39.6 38.9 42.0 47.2Morton 25.5 27.9 28.8 33.2 36.2 38.9Nemaha 32.9 34.9 34.0 35.6 39.1 42.5Neosho 35.0 34.7 33.4 36.3 38.4 40.2Ness 33.0 35.0 36.7 38.5 43.9 48.2Norton 37.1 37.1 38.3 39.0 40.1 43.5Osage 35.2 34.7 33.0 36.0 38.9 42.8Osborne 37.5 43.6 41.6 42.7 44.0 48.2Ottawa 38.6 39.8 37.9 38.5 40.1 42.7Pawnee 38.1 37.8 35.1 37.4 40.5 43.2Phillips 35.0 36.7 37.8 40.4 42.5 45.3Pottawatomie 34.1 33.4 30.2 32.8 35.9 34.8Pratt 32.1 36.2 33.9 36.8 40.2 40.9Rawlins 29.8 35.6 35.5 38.8 45.4 51.3Reno 30.0 29.6 30.6 35.0 38.2 39.9Republic 39.6 42.5 43.5 44.5 45.7 50.6Rice 33.0 35.6 35.6 37.0 37.6 39.3Riley 23.0 22.5 22.6 23.8 23.9 24.3Rooks 29.3 34.6 35.0 37.9 40.9 44.1Rush 34.6 40.9 42.0 43.1 44.6 48.7Russell 33.0 37.6 37.9 40.9 44.1 46.5Saline 24.9 26.6 29.6 33.5 36.1 37.8Scott 27.0 28.3 30.1 35.0 39.2 41.4Sedgwick 26.7 26.3 28.7 31.8 33.6 34.2Seward 25.7 26.0 26.9 29.0 29.0 28.9Shawnee 28.5 27.2 30.3 33.8 37.1 38.1Sheridan 26.9 29.7 31.8 37.1 41.5 46.9Sherman 31.1 28.3 30.7 35.5 37.8 42.1Smith 38.2 42.4 43.0 45.1 46.0 49.6Stafford 36.9 43.3 41.9 39.0 41.0 45.6Stanton 25.8 26.3 28.2 31.4 33.8 35.6Stevens 26.3 29.7 29.6 32.7 33.6 34.4Sumner 32.8 34.6 33.8 34.9 37.6 40.5Thomas 28.6 29.3 27.9 32.3 35.3 36.6Trego 28.6 36.0 34.9 39.1 43.5 49.3Wabaunsee 36.8 37.2 35.6 36.4 39.5 42.6Wallace 29.8 29.2 31.3 34.6 39.5 45.4Washington 38.0 40.7 40.0 42.1 43.6 46.4Wichita 25.5 24.8 28.8 33.6 36.7 40.3Wilson 37.4 41.1 35.7 39.1 40.6 43.1Woodson 41.4 43.6 41.1 41.4 44.1 48.2Wyandotte 28.7 27.3 28.8 31.7 32.5 32.8Kansas 26.9 28.7 30.1 32.9 35.2 36.0
Source: U.S. Census Bureau, 1970 Census of Population, General Population Characteristics: Kansas (PC(1)-B18); 1980 Census of Population, General Population Characteristics: Kansas (PC-1-B18); 1990 Census of Population and Housing, Summary of Population and Housing Characteristics: Kansas (CPH-1-18); Census 2000, Profile of General Demographic Characteristics (DP-1), http://www.census.gov/prod/cen2000/dp1/2kh20.pdf (accessed December 1, 2005); 2010 Census, Profile of General Population and Housing Characteristics: 2010 (DP-1).
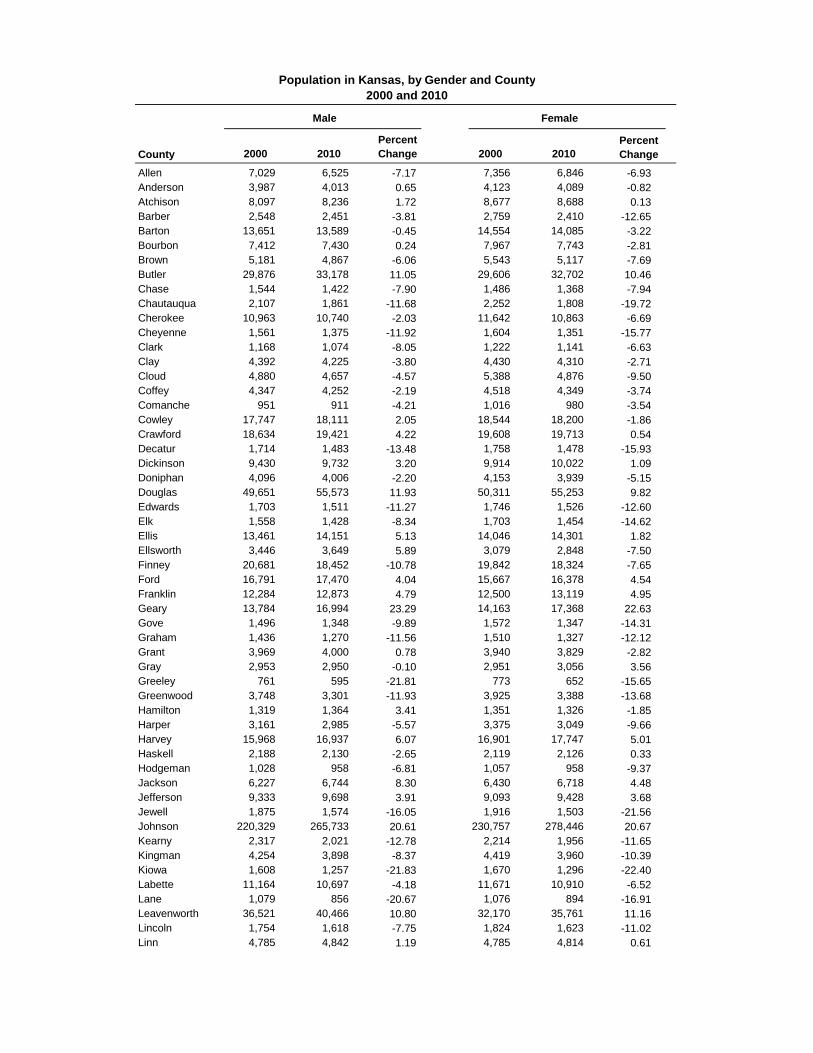
County 2000 2010Percent Change 2000 2010
Allen 7,029 6,525 -7.17 7,356 6,846 -6.93Anderson 3,987 4,013 0.65 4,123 4,089 -0.82Atchison 8,097 8,236 1.72 8,677 8,688 0.13Barber 2,548 2,451 -3.81 2,759 2,410 -12.65Barton 13,651 13,589 -0.45 14,554 14,085 -3.22Bourbon 7,412 7,430 0.24 7,967 7,743 -2.81Brown 5,181 4,867 -6.06 5,543 5,117 -7.69Butler 29,876 33,178 11.05 29,606 32,702 10.46Chase 1,544 1,422 -7.90 1,486 1,368 -7.94Chautauqua 2,107 1,861 -11.68 2,252 1,808 -19.72Cherokee 10,963 10,740 -2.03 11,642 10,863 -6.69Cheyenne 1,561 1,375 -11.92 1,604 1,351 -15.77Clark 1,168 1,074 -8.05 1,222 1,141 -6.63Clay 4,392 4,225 -3.80 4,430 4,310 -2.71Cloud 4,880 4,657 -4.57 5,388 4,876 -9.50Coffey 4,347 4,252 -2.19 4,518 4,349 -3.74Comanche 951 911 -4.21 1,016 980 -3.54Cowley 17,747 18,111 2.05 18,544 18,200 -1.86Crawford 18,634 19,421 4.22 19,608 19,713 0.54Decatur 1,714 1,483 -13.48 1,758 1,478 -15.93Dickinson 9,430 9,732 3.20 9,914 10,022 1.09Doniphan 4,096 4,006 -2.20 4,153 3,939 -5.15Douglas 49,651 55,573 11.93 50,311 55,253 9.82Edwards 1,703 1,511 -11.27 1,746 1,526 -12.60Elk 1,558 1,428 -8.34 1,703 1,454 -14.62Ellis 13,461 14,151 5.13 14,046 14,301 1.82Ellsworth 3,446 3,649 5.89 3,079 2,848 -7.50Finney 20,681 18,452 -10.78 19,842 18,324 -7.65Ford 16,791 17,470 4.04 15,667 16,378 4.54Franklin 12,284 12,873 4.79 12,500 13,119 4.95Geary 13,784 16,994 23.29 14,163 17,368 22.63Gove 1,496 1,348 -9.89 1,572 1,347 -14.31Graham 1,436 1,270 -11.56 1,510 1,327 -12.12Grant 3,969 4,000 0.78 3,940 3,829 -2.82Gray 2,953 2,950 -0.10 2,951 3,056 3.56Greeley 761 595 -21.81 773 652 -15.65Greenwood 3,748 3,301 -11.93 3,925 3,388 -13.68Hamilton 1,319 1,364 3.41 1,351 1,326 -1.85Harper 3,161 2,985 -5.57 3,375 3,049 -9.66Harvey 15,968 16,937 6.07 16,901 17,747 5.01Haskell 2,188 2,130 -2.65 2,119 2,126 0.33Hodgeman 1,028 958 -6.81 1,057 958 -9.37Jackson 6,227 6,744 8.30 6,430 6,718 4.48Jefferson 9,333 9,698 3.91 9,093 9,428 3.68Jewell 1,875 1,574 -16.05 1,916 1,503 -21.56Johnson 220,329 265,733 20.61 230,757 278,446 20.67Kearny 2,317 2,021 -12.78 2,214 1,956 -11.65Kingman 4,254 3,898 -8.37 4,419 3,960 -10.39Kiowa 1,608 1,257 -21.83 1,670 1,296 -22.40Labette 11,164 10,697 -4.18 11,671 10,910 -6.52Lane 1,079 856 -20.67 1,076 894 -16.91Leavenworth 36,521 40,466 10.80 32,170 35,761 11.16Lincoln 1,754 1,618 -7.75 1,824 1,623 -11.02Linn 4,785 4,842 1.19 4,785 4,814 0.61
Percent Change
Population in Kansas, by Gender and County2000 and 2010
Male Female

County 2000 2010Percent Change 2000 2010
Percent Change
Population in Kansas, by Gender and County2000 and 2010
Male Female
Logan 1,473 1,363 -7.47 1,573 1,393 -11.44Lyon 17,732 16,489 -7.01 18,203 17,201 -5.50McPherson 14,471 14,334 -0.95 15,083 14,846 -1.57Marion 6,512 6,372 -2.15 6,849 6,288 -8.19Marshall 5,393 5,003 -7.23 5,572 5,114 -8.22Meade 2,294 2,324 1.31 2,337 2,251 -3.68Miami 14,021 16,201 15.55 14,330 16,586 15.74Mitchell 3,420 3,218 -5.91 3,512 3,155 -10.17Montgomery 17,484 17,404 -0.46 18,768 18,067 -3.74Morris 3,005 2,955 -1.66 3,099 2,968 -4.23Morton 1,698 1,572 -7.42 1,798 1,661 -7.62Nemaha 5,276 5,145 -2.48 5,441 5,033 -7.50Neosho 8,210 8,151 -0.72 8,787 8,361 -4.85Ness 1,714 1,559 -9.04 1,740 1,548 -11.03Norton 3,273 3,170 -3.15 2,680 2,501 -6.68Osage 8,184 8,098 -1.05 8,528 8,197 -3.88Osborne 2,190 1,918 -12.42 2,262 1,940 -14.24Ottawa 3,080 3,144 2.08 3,083 2,947 -4.41Pawnee 3,822 3,870 1.26 3,411 3,103 -9.03Phillips 2,921 2,794 -4.35 3,080 2,848 -7.53Pottawatomie 9,011 10,716 18.92 9,198 10,888 18.37Pratt 4,674 4,761 1.86 4,973 4,895 -1.57Rawlins 1,482 1,255 -15.32 1,484 1,264 -14.82Reno 32,534 32,315 -0.67 32,256 32,196 -0.19Republic 2,815 2,447 -13.07 3,020 2,533 -16.13Rice 5,163 5,066 -1.88 5,598 5,017 -10.38Riley 33,524 37,040 10.49 29,319 34,075 16.22Rooks 2,815 2,533 -10.02 2,870 2,648 -7.74Rush 1,724 1,630 -5.45 1,827 1,677 -8.21Russell 3,542 3,443 -2.80 3,828 3,527 -7.86Saline 26,449 27,675 4.64 27,148 27,931 2.88Scott 2,522 2,487 -1.39 2,598 2,449 -5.74Sedgwick 223,870 246,042 9.90 228,999 252,323 10.19Seward 11,546 11,830 2.46 10,964 11,122 1.44Shawnee 82,239 85,996 4.57 87,632 91,938 4.91Sheridan 1,407 1,300 -7.60 1,406 1,256 -10.67Sherman 3,455 3,005 -13.02 3,305 3,005 -9.08Smith 2,182 1,889 -13.43 2,354 1,964 -16.57Stafford 2,336 2,211 -5.35 2,453 2,226 -9.25Stanton 1,227 1,141 -7.01 1,179 1,094 -7.21Stevens 2,666 2,840 6.53 2,797 2,884 3.11Sumner 12,765 12,039 -5.69 13,181 12,093 -8.25Thomas 3,976 3,884 -2.31 4,204 4,016 -4.47Trego 1,582 1,481 -6.38 1,737 1,520 -12.49Wabaunsee 3,485 3,593 3.10 3,400 3,460 1.76Wallace 870 742 -14.71 879 743 -15.47Washington 3,255 2,939 -9.71 3,228 2,860 -11.40Wichita 1,293 1,143 -11.60 1,238 1,091 -11.87Wilson 5,011 4,622 -7.76 5,321 4,787 -10.04Woodson 1,863 1,655 -11.16 1,925 1,654 -14.08Wyandotte 77,071 77,702 0.82 80,811 79,803 -1.25Kansas 1,328,474 1,415,408 6.54 1,359,944 1,437,710 5.72
Source: U.S. Census Bureau; 2000 Census of Population and Housing, Profiles of General Demographic Characteristics: Kansas (DP-1), http://www.census.gov/prod/cen2000/dp1/2kh20.pdf (accessed December 1, 2005); 2010 Census, Profile of General Population and Housing Characteristics: 2010 (DP-1).

Population in Kansas, by Race and CountyApril 1, 2020
County WhiteBlack or
African AmericanAmerican Indian
and Alaska Native AsianNative Hawaiian andother Pacific Islander
Some otherRace
Two ormore Races Total
Allen 11,180 186 150 67 2 159 782 12,526 Anderson 7,312 26 53 47 2 66 330 7,836 Atchison 14,111 788 88 83 7 269 1,002 16,348 Barber 3,857 8 34 16 5 91 217 4,228 Barton 21,157 312 149 80 3 1,855 1,937 25,493 Bourbon 12,585 469 100 98 2 146 960 14,360 Brown 7,772 100 872 45 7 105 607 9,508 Butler 58,119 1,463 569 1,005 39 957 5,228 67,380 Chase 2,271 20 16 8 3 146 108 2,572 Chautauqua 2,847 23 189 19 0 76 225 3,379 Cherokee 16,475 80 799 65 26 148 1,769 19,362 Cheyenne 2,282 7 7 12 0 105 203 2,616 Clark 1,724 6 21 24 1 90 125 1,991 Clay 7,542 50 50 53 0 66 356 8,117 Cloud 8,338 123 44 40 9 77 401 9,032 Coffey 7,777 45 37 44 1 50 406 8,360 Comanche 1,560 12 2 0 1 24 90 1,689 Cowley 27,413 895 784 505 179 1,425 3,348 34,549 Crawford 32,587 913 373 461 193 1,271 3,174 38,972 Decatur 2,605 9 9 15 0 7 119 2,764 Dickinson 16,814 117 87 80 21 248 1,035 18,402 Doniphan 6,701 268 83 32 19 66 341 7,510 Douglas 92,694 5,301 2,950 4,685 86 2,569 10,500 118,785 Edwards 2,400 14 17 2 1 211 262 2,907 Elk 2,253 5 48 4 0 18 155 2,483 Ellis 25,584 340 96 266 2 996 1,650 28,934 Ellsworth 5,655 254 53 31 0 66 317 6,376 Finney 19,812 1,542 367 1,548 35 6,541 8,625 38,470 Ford 17,167 978 753 417 14 8,409 6,549 34,287 Franklin 23,187 305 220 108 7 381 1,788 25,996 Geary 21,857 6,303 325 1,250 458 1,682 4,864 36,739 Gove 2,516 5 3 15 1 31 147 2,718 Graham 2,212 57 14 14 3 14 101 2,415 Grant 4,223 10 164 14 5 1,510 1,426 7,352 Gray 4,879 19 15 14 0 278 448 5,653

Population in Kansas, by Race and CountyApril 1, 2020
County WhiteBlack or
African AmericanAmerican Indian
and Alaska Native AsianNative Hawaiian andother Pacific Islander
Some otherRace
Two ormore Races Total
Greeley 1,075 2 12 5 1 84 105 1,284 Greenwood 5,494 28 35 36 1 52 370 6,016 Hamilton 1,597 13 27 5 0 538 338 2,518 Harper 4,829 17 98 15 5 204 317 5,485 Harvey 28,658 650 267 261 11 1,482 2,695 34,024 Haskell 2,842 13 11 2 0 557 355 3,780 Hodgeman 1,584 14 12 12 1 19 81 1,723 Jackson 10,727 103 1,213 34 18 165 972 13,232 Jefferson 16,797 103 128 43 31 124 1,142 18,368 Jewell 2,757 5 12 10 0 19 129 2,932 Johnson 473,342 28,781 2,568 33,030 384 18,692 53,066 609,863 Kearny 2,661 41 35 7 1 492 746 3,983 Kingman 6,925 38 36 35 4 99 333 7,470 Kiowa 2,184 43 12 16 4 30 171 2,460 Labette 16,464 867 451 91 9 264 2,038 20,184 Lane 1,406 0 8 0 3 51 106 1,574 Leavenworth 64,640 6,858 697 1,103 153 1,313 7,117 81,881 Lincoln 2,740 8 16 10 1 46 118 2,939 Linn 8,906 67 48 20 8 44 498 9,591 Logan 2,513 5 1 10 2 87 144 2,762 Lyon 23,801 651 266 574 16 3,774 3,097 32,179 McPherson 26,965 478 151 225 13 673 1,718 30,223 Marion 10,910 122 54 39 7 178 513 11,823 Marshall 9,480 42 23 46 2 56 389 10,038 Meade 3,262 37 12 13 0 316 415 4,055 Miami 30,907 436 166 161 16 317 2,188 34,191 Mitchell 5,490 19 12 13 0 40 222 5,796 Montgomery 24,297 1,566 1,023 201 24 949 3,426 31,486 Morris 4,985 16 15 18 1 63 288 5,386 Morton 2,076 20 16 31 9 275 274 2,701 Nemaha 9,700 64 39 39 7 96 328 10,273 Neosho 14,105 148 166 84 6 254 1,141 15,904 Ness 2,347 2 19 2 2 173 142 2,687 Norton 4,863 210 42 35 2 48 259 5,459 Osage 14,706 33 48 52 3 99 825 15,766

Population in Kansas, by Race and CountyApril 1, 2020
County WhiteBlack or
African AmericanAmerican Indian
and Alaska Native AsianNative Hawaiian andother Pacific Islander
Some otherRace
Two ormore Races Total
Osborne 3,304 1 19 18 0 29 129 3,500 Ottawa 5,338 30 22 11 0 30 304 5,735 Pawnee 5,361 249 38 28 3 128 446 6,253 Phillips 4,684 19 22 15 1 27 213 4,981 Pottawatomie 22,618 286 150 200 27 294 1,773 25,348 Pratt 8,104 106 67 45 7 323 505 9,157 Rawlins 2,283 19 3 11 0 73 172 2,561 Reno 52,761 1,863 519 352 48 1,776 4,579 61,898 Republic 4,437 15 13 11 9 11 178 4,674 Rice 7,853 145 63 30 0 438 898 9,427 Riley 54,567 5,011 440 3,367 225 2,322 6,027 71,959 Rooks 4,619 29 21 5 10 12 223 4,919 Rush 2,800 7 4 14 0 18 113 2,956 Russell 6,138 60 32 28 0 64 369 6,691 Saline 43,415 1,830 349 1,139 31 2,262 5,277 54,303 Scott 4,173 14 44 16 8 325 571 5,151 Sedgwick 357,757 46,531 6,581 22,511 575 32,207 57,662 523,824 Seward 9,015 672 527 535 6 5,982 5,227 21,964 Shawnee 132,398 14,211 2,213 2,521 180 8,403 18,983 178,909 Sheridan 2,257 3 11 12 2 46 116 2,447 Sherman 5,025 103 19 17 1 328 434 5,927 Smith 3,390 17 15 9 1 36 102 3,570 Stafford 3,500 14 36 13 1 175 333 4,072 Stanton 1,257 14 44 2 1 439 327 2,084 Stevens 3,484 20 62 22 0 1,066 596 5,250 Sumner 19,934 205 240 73 0 358 1,572 22,382 Thomas 7,100 108 48 47 0 184 443 7,930 Trego 2,644 5 5 12 0 9 133 2,808 Wabaunsee 6,303 31 40 18 4 53 428 6,877 Wallace 1,370 3 5 0 2 46 86 1,512 Washington 5,153 13 5 4 2 111 242 5,530 Wichita 1,547 3 23 2 2 273 302 2,152 Wilson 7,759 22 88 35 2 88 630 8,624 Woodson 2,890 8 30 0 0 17 170 3,115 Wyandotte 73,721 34,589 1,917 7,705 387 25,643 25,283 169,245 Kansas 2,222,462 168,809 30,995 86,273 3,412 145,422 280,507 2,937,880
Source: U.S. Census Bureau, 2020 Census (PL94-171).
CountyTotal
Population Number PercentTotal
Population Number Percent
Allen 13,371 392 2.93 12,526 502 4.01 28.1Anderson 8,102 123 1.52 7,836 155 1.98 26.0Atchison 16,924 383 2.26 16,348 583 3.57 52.2Barber 4,861 119 2.45 4,228 162 3.83 36.1Barton 27,674 3,683 13.31 25,493 4,127 16.19 12.1Bourbon 15,173 309 2.04 14,360 386 2.69 24.9Brown 9,984 306 3.06 9,508 352 3.70 15.0Butler 65,880 2,602 3.95 67,380 3,578 5.31 37.5Chase 2,790 100 3.58 2,572 222 8.63 122.0Chautauqua 3,669 87 2.37 3,379 138 4.08 58.6Cherokee 21,603 424 1.96 19,362 514 2.65 21.2Cheyenne 2,726 142 5.21 2,616 238 9.10 67.6Clark 2,215 163 7.36 1,991 203 10.20 24.5Clay 8,535 162 1.90 8,117 218 2.69 34.6Cloud 9,533 283 2.97 9,032 319 3.53 12.7Coffey 8,601 176 2.05 8,360 221 2.64 25.6Comanche 1,891 73 3.86 1,689 98 5.80 34.2Cowley 36,311 3,292 9.07 34,549 3,971 11.49 20.6Crawford 39,134 1,762 4.50 38,972 2,716 6.97 54.1Decatur 2,961 30 1.01 2,764 76 2.75 153.3Dickinson 19,754 769 3.89 18,402 905 4.92 17.7Doniphan 7,945 165 2.08 7,510 204 2.72 23.6Douglas 110,826 5,651 5.10 118,785 8,295 6.98 46.8Edwards 3,037 534 17.58 2,907 623 21.43 16.7Elk 2,882 79 2.74 2,483 101 4.07 27.8Ellis 28,452 1,299 4.57 28,934 2,016 6.97 55.2Ellsworth 6,497 322 4.96 6,376 365 5.72 13.4Finney 36,776 17,182 46.72 38,470 19,883 51.68 15.7Ford 33,848 17,321 51.17 34,287 19,666 57.36 13.5Franklin 25,992 937 3.60 25,996 1,147 4.41 22.4Geary 34,362 4,252 12.37 36,739 5,776 15.72 35.8Gove 2,695 42 1.56 2,718 83 3.05 97.6Graham 2,597 59 2.27 2,415 62 2.57 5.1Grant 7,829 3,439 43.93 7,352 3,862 52.53 12.3Gray 6,006 855 14.24 5,653 839 14.84 -1.9Greeley 1,247 171 13.71 1,284 199 15.50 16.4Greenwood 6,689 220 3.29 6,016 204 3.39 -7.3Hamilton 2,690 827 30.74 2,518 1,084 43.05 31.1Harper 6,034 298 4.94 5,485 425 7.75 42.6Harvey 34,684 3,747 10.80 34,024 4,055 11.92 8.2Haskell 4,256 1,149 27.00 3,780 1,119 29.60 -2.6Hodgeman 1,916 118 6.16 1,723 96 5.57 -18.6Jackson 13,462 438 3.25 13,232 630 4.76 43.8Jefferson 19,126 339 1.77 18,368 567 3.09 67.3Jewell 3,077 63 2.05 2,932 62 2.11 -1.6Johnson 544,179 38,949 7.16 609,863 54,389 8.92 39.6Kearny 3,977 1,135 28.54 3,983 1,396 35.05 23.0Kingman 7,858 199 2.53 7,470 268 3.59 34.7Kiowa 2,553 99 3.88 2,460 87 3.54 -12.1Labette 21,607 875 4.05 20,184 939 4.65 7.3Lane 1,750 74 4.23 1,574 143 9.09 93.2Leavenworth 76,227 4,308 5.65 81,881 5,602 6.84 30.0Lincoln 3,241 72 2.22 2,939 130 4.42 80.6Linn 9,656 186 1.93 9,591 238 2.48 28.0
Hispanic Population in Kansas, by County, 2010 and 2020
Hispanic Population
2010 2020
Hispanic Population PercentChange
2010-2020
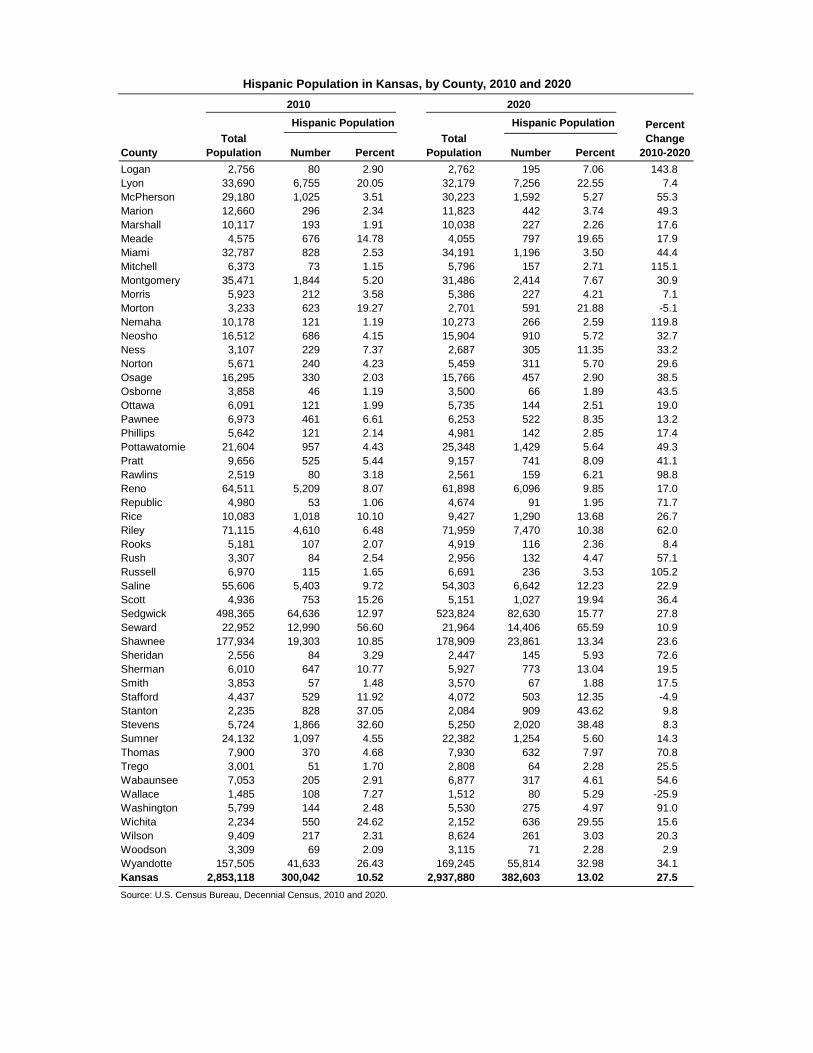
CountyTotal
Population Number PercentTotal
Population Number Percent
Hispanic Population in Kansas, by County, 2010 and 2020
Hispanic Population
2010 2020
Hispanic Population PercentChange
2010-2020
Logan 2,756 80 2.90 2,762 195 7.06 143.8Lyon 33,690 6,755 20.05 32,179 7,256 22.55 7.4McPherson 29,180 1,025 3.51 30,223 1,592 5.27 55.3Marion 12,660 296 2.34 11,823 442 3.74 49.3Marshall 10,117 193 1.91 10,038 227 2.26 17.6Meade 4,575 676 14.78 4,055 797 19.65 17.9Miami 32,787 828 2.53 34,191 1,196 3.50 44.4Mitchell 6,373 73 1.15 5,796 157 2.71 115.1Montgomery 35,471 1,844 5.20 31,486 2,414 7.67 30.9Morris 5,923 212 3.58 5,386 227 4.21 7.1Morton 3,233 623 19.27 2,701 591 21.88 -5.1Nemaha 10,178 121 1.19 10,273 266 2.59 119.8Neosho 16,512 686 4.15 15,904 910 5.72 32.7Ness 3,107 229 7.37 2,687 305 11.35 33.2Norton 5,671 240 4.23 5,459 311 5.70 29.6Osage 16,295 330 2.03 15,766 457 2.90 38.5Osborne 3,858 46 1.19 3,500 66 1.89 43.5Ottawa 6,091 121 1.99 5,735 144 2.51 19.0Pawnee 6,973 461 6.61 6,253 522 8.35 13.2Phillips 5,642 121 2.14 4,981 142 2.85 17.4Pottawatomie 21,604 957 4.43 25,348 1,429 5.64 49.3Pratt 9,656 525 5.44 9,157 741 8.09 41.1Rawlins 2,519 80 3.18 2,561 159 6.21 98.8Reno 64,511 5,209 8.07 61,898 6,096 9.85 17.0Republic 4,980 53 1.06 4,674 91 1.95 71.7Rice 10,083 1,018 10.10 9,427 1,290 13.68 26.7Riley 71,115 4,610 6.48 71,959 7,470 10.38 62.0Rooks 5,181 107 2.07 4,919 116 2.36 8.4Rush 3,307 84 2.54 2,956 132 4.47 57.1Russell 6,970 115 1.65 6,691 236 3.53 105.2Saline 55,606 5,403 9.72 54,303 6,642 12.23 22.9Scott 4,936 753 15.26 5,151 1,027 19.94 36.4Sedgwick 498,365 64,636 12.97 523,824 82,630 15.77 27.8Seward 22,952 12,990 56.60 21,964 14,406 65.59 10.9Shawnee 177,934 19,303 10.85 178,909 23,861 13.34 23.6Sheridan 2,556 84 3.29 2,447 145 5.93 72.6Sherman 6,010 647 10.77 5,927 773 13.04 19.5Smith 3,853 57 1.48 3,570 67 1.88 17.5Stafford 4,437 529 11.92 4,072 503 12.35 -4.9Stanton 2,235 828 37.05 2,084 909 43.62 9.8Stevens 5,724 1,866 32.60 5,250 2,020 38.48 8.3Sumner 24,132 1,097 4.55 22,382 1,254 5.60 14.3Thomas 7,900 370 4.68 7,930 632 7.97 70.8Trego 3,001 51 1.70 2,808 64 2.28 25.5Wabaunsee 7,053 205 2.91 6,877 317 4.61 54.6Wallace 1,485 108 7.27 1,512 80 5.29 -25.9Washington 5,799 144 2.48 5,530 275 4.97 91.0Wichita 2,234 550 24.62 2,152 636 29.55 15.6Wilson 9,409 217 2.31 8,624 261 3.03 20.3Woodson 3,309 69 2.09 3,115 71 2.28 2.9Wyandotte 157,505 41,633 26.43 169,245 55,814 32.98 34.1Kansas 2,853,118 300,042 10.52 2,937,880 382,603 13.02 27.5
Source: U.S. Census Bureau, Decennial Census, 2010 and 2020.
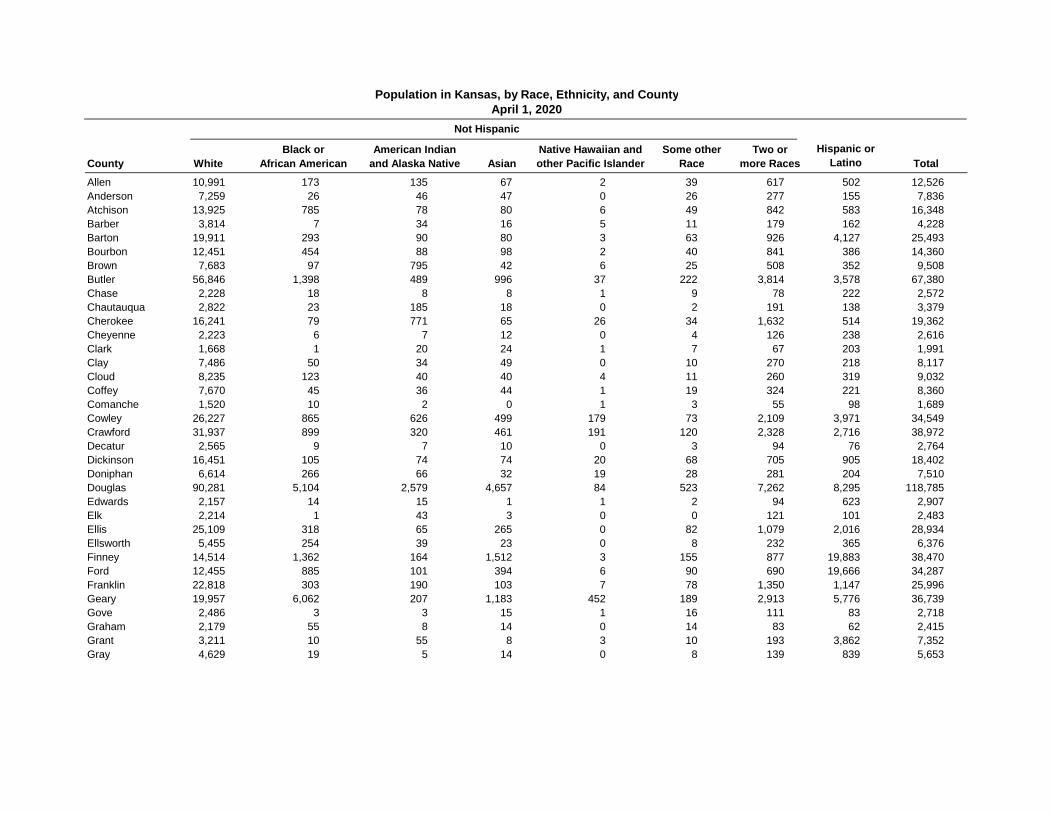
Population in Kansas, by Race, Ethnicity, and CountyApril 1, 2020
County WhiteBlack or
African AmericanAmerican Indian
and Alaska Native AsianNative Hawaiian andother Pacific Islander
Some otherRace
Two ormore Races Total
Allen 10,991 173 135 67 2 39 617 502 12,526 Anderson 7,259 26 46 47 0 26 277 155 7,836 Atchison 13,925 785 78 80 6 49 842 583 16,348 Barber 3,814 7 34 16 5 11 179 162 4,228 Barton 19,911 293 90 80 3 63 926 4,127 25,493 Bourbon 12,451 454 88 98 2 40 841 386 14,360 Brown 7,683 97 795 42 6 25 508 352 9,508 Butler 56,846 1,398 489 996 37 222 3,814 3,578 67,380 Chase 2,228 18 8 8 1 9 78 222 2,572 Chautauqua 2,822 23 185 18 0 2 191 138 3,379 Cherokee 16,241 79 771 65 26 34 1,632 514 19,362 Cheyenne 2,223 6 7 12 0 4 126 238 2,616 Clark 1,668 1 20 24 1 7 67 203 1,991 Clay 7,486 50 34 49 0 10 270 218 8,117 Cloud 8,235 123 40 40 4 11 260 319 9,032 Coffey 7,670 45 36 44 1 19 324 221 8,360 Comanche 1,520 10 2 0 1 3 55 98 1,689 Cowley 26,227 865 626 499 179 73 2,109 3,971 34,549 Crawford 31,937 899 320 461 191 120 2,328 2,716 38,972 Decatur 2,565 9 7 10 0 3 94 76 2,764 Dickinson 16,451 105 74 74 20 68 705 905 18,402 Doniphan 6,614 266 66 32 19 28 281 204 7,510 Douglas 90,281 5,104 2,579 4,657 84 523 7,262 8,295 118,785 Edwards 2,157 14 15 1 1 2 94 623 2,907 Elk 2,214 1 43 3 0 0 121 101 2,483 Ellis 25,109 318 65 265 0 82 1,079 2,016 28,934 Ellsworth 5,455 254 39 23 0 8 232 365 6,376 Finney 14,514 1,362 164 1,512 3 155 877 19,883 38,470 Ford 12,455 885 101 394 6 90 690 19,666 34,287 Franklin 22,818 303 190 103 7 78 1,350 1,147 25,996 Geary 19,957 6,062 207 1,183 452 189 2,913 5,776 36,739 Gove 2,486 3 3 15 1 16 111 83 2,718 Graham 2,179 55 8 14 0 14 83 62 2,415 Grant 3,211 10 55 8 3 10 193 3,862 7,352 Gray 4,629 19 5 14 0 8 139 839 5,653
Not Hispanic
Hispanic or Latino

Population in Kansas, by Race, Ethnicity, and CountyApril 1, 2020
County WhiteBlack or
African AmericanAmerican Indian
and Alaska Native AsianNative Hawaiian andother Pacific Islander
Some otherRace
Two ormore Races Total
Not Hispanic
Hispanic or Latino
Greeley 1,036 0 4 5 0 10 30 199 1,284 Greenwood 5,406 28 32 36 1 15 294 204 6,016 Hamilton 1,361 10 12 5 0 2 44 1,084 2,518 Harper 4,714 16 74 15 2 4 235 425 5,485 Harvey 27,349 596 183 260 10 82 1,489 4,055 34,024 Haskell 2,578 9 8 1 0 7 58 1,119 3,780 Hodgeman 1,546 14 7 10 1 2 47 96 1,723 Jackson 10,534 95 1,098 29 18 37 791 630 13,232 Jefferson 16,549 99 124 41 27 29 932 567 18,368 Jewell 2,743 4 10 10 0 8 95 62 2,932 Johnson 460,399 28,092 1,595 32,856 346 2,393 29,793 54,389 609,863 Kearny 2,378 34 10 5 1 2 157 1,396 3,983 Kingman 6,829 28 27 33 4 16 265 268 7,470 Kiowa 2,158 43 10 16 4 6 136 87 2,460 Labette 16,077 838 425 90 9 43 1,763 939 20,184 Lane 1,375 0 8 0 2 0 46 143 1,574 Leavenworth 62,503 6,656 589 1,060 138 253 5,080 5,602 81,881 Lincoln 2,691 6 13 8 0 12 79 130 2,939 Linn 8,782 62 46 20 8 16 419 238 9,591 Logan 2,457 4 0 10 2 10 84 195 2,762 Lyon 22,219 599 122 566 5 225 1,187 7,256 32,179 McPherson 26,519 475 93 213 8 140 1,183 1,592 30,223 Marion 10,750 118 35 39 7 67 365 442 11,823 Marshall 9,410 39 23 41 0 13 285 227 10,038 Meade 3,053 37 9 13 0 6 140 797 4,055 Miami 30,472 430 152 161 8 86 1,686 1,196 34,191 Mitchell 5,436 19 12 13 0 2 157 157 5,796 Montgomery 23,571 1,533 946 191 24 72 2,735 2,414 31,486 Morris 4,897 16 10 18 1 12 205 227 5,386 Morton 1,940 17 10 31 9 12 91 591 2,701 Nemaha 9,622 64 26 35 7 10 243 266 10,273 Neosho 13,767 131 127 84 6 25 854 910 15,904 Ness 2,305 2 9 2 0 6 58 305 2,687 Norton 4,690 199 33 35 2 9 180 311 5,459 Osage 14,505 33 43 52 3 24 649 457 15,766
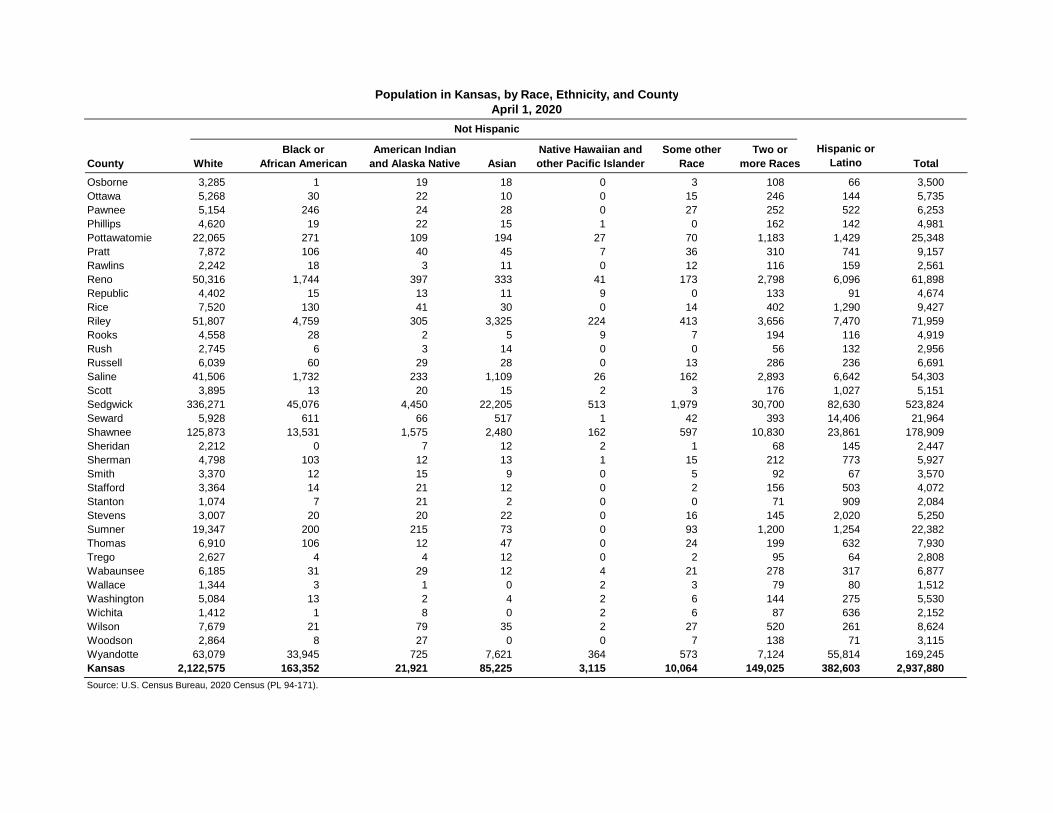
Population in Kansas, by Race, Ethnicity, and CountyApril 1, 2020
County WhiteBlack or
African AmericanAmerican Indian
and Alaska Native AsianNative Hawaiian andother Pacific Islander
Some otherRace
Two ormore Races Total
Not Hispanic
Hispanic or Latino
Osborne 3,285 1 19 18 0 3 108 66 3,500 Ottawa 5,268 30 22 10 0 15 246 144 5,735 Pawnee 5,154 246 24 28 0 27 252 522 6,253 Phillips 4,620 19 22 15 1 0 162 142 4,981 Pottawatomie 22,065 271 109 194 27 70 1,183 1,429 25,348 Pratt 7,872 106 40 45 7 36 310 741 9,157 Rawlins 2,242 18 3 11 0 12 116 159 2,561 Reno 50,316 1,744 397 333 41 173 2,798 6,096 61,898 Republic 4,402 15 13 11 9 0 133 91 4,674 Rice 7,520 130 41 30 0 14 402 1,290 9,427 Riley 51,807 4,759 305 3,325 224 413 3,656 7,470 71,959 Rooks 4,558 28 2 5 9 7 194 116 4,919 Rush 2,745 6 3 14 0 0 56 132 2,956 Russell 6,039 60 29 28 0 13 286 236 6,691 Saline 41,506 1,732 233 1,109 26 162 2,893 6,642 54,303 Scott 3,895 13 20 15 2 3 176 1,027 5,151 Sedgwick 336,271 45,076 4,450 22,205 513 1,979 30,700 82,630 523,824 Seward 5,928 611 66 517 1 42 393 14,406 21,964 Shawnee 125,873 13,531 1,575 2,480 162 597 10,830 23,861 178,909 Sheridan 2,212 0 7 12 2 1 68 145 2,447 Sherman 4,798 103 12 13 1 15 212 773 5,927 Smith 3,370 12 15 9 0 5 92 67 3,570 Stafford 3,364 14 21 12 0 2 156 503 4,072 Stanton 1,074 7 21 2 0 0 71 909 2,084 Stevens 3,007 20 20 22 0 16 145 2,020 5,250 Sumner 19,347 200 215 73 0 93 1,200 1,254 22,382 Thomas 6,910 106 12 47 0 24 199 632 7,930 Trego 2,627 4 4 12 0 2 95 64 2,808 Wabaunsee 6,185 31 29 12 4 21 278 317 6,877 Wallace 1,344 3 1 0 2 3 79 80 1,512 Washington 5,084 13 2 4 2 6 144 275 5,530 Wichita 1,412 1 8 0 2 6 87 636 2,152 Wilson 7,679 21 79 35 2 27 520 261 8,624 Woodson 2,864 8 27 0 0 7 138 71 3,115 Wyandotte 63,079 33,945 725 7,621 364 573 7,124 55,814 169,245 Kansas 2,122,575 163,352 21,921 85,225 3,115 10,064 149,025 382,603 2,937,880
Source: U.S. Census Bureau, 2020 Census (PL 94-171).

Johnson1,287.6
Sedgwick525.4
Greeley1.6
Franklin45.5
Phillips5.6
Jackson20.2
Pawnee8.3
Clay12.6
Bourbon22.6
Republic6.5
Doniphan19.1
Seward34.3
Ford31.2
Montgomery48.9
Marshall11.2
Woodson6.3
Lincoln4.1
Finney29.5
Stanton3.1
Sheridan2.7
Chase3.3
Ellis32.2
Cowley30.7
Cherokee33.0
Reno49.3
Wabaunsee8.7
Comanche2.1
Logan2.6
Harper6.8
Crawford66.1
Allen25.0
Lyon38.0
Pottawatomie30.1
Atchison37.9
Norton6.2
Thomas7.4
Hamilton2.5
Osborne3.9
Hodgeman2.0
Trego3.2
Cloud12.6
Brown16.7
Jefferson34.5
Dickinson21.7
Lane2.2
Butler47.1
Cheyenne2.6
Wallace1.7
Chautauqua5.3
Kiowa3.4
Haskell6.5
Rice13.0
Morton3.7
Rush4.1
Washington6.2
Nemaha14.3
McPherson33.6
Ness2.5
Grant12.8
Osage22.3
Labette31.3
Edwards4.7
Linn16.1
Morris7.7
Rooks5.5
Barber3.7
Anderson13.5
Decatur3.1
Sherman5.6
Gray6.5
Barton28.5
Clark2.0
Saline75.4
Kingman8.7
Harvey63.0
Geary95.5
Scott7.2
Jewell3.2
Wilson15.1
Wichita3.0
Stevens7.2
Graham2.7
Kearny4.6
Gove2.5
Neosho27.8
Smith4.0
Russell7.5
Rawlins2.4
Shawnee328.9
Riley118.0
Coffey13.3
Stafford5.1
Elk3.9
Ottawa8.0
Greenwood5.3
Meade4.1
Miami59.4
Mitchell8.3
Marion12.5
Ellsworth8.9
Sumner18.9
Pratt12.5
Douglas260.6
Population Density in Kansas, by County, 2020
State: 35.9Source: Institute for Policy & Social Research, The University of Kansas; data from the U.S. Census Bureau, 2020 Census.
LeavenworthWyandotte
176.7
1,116.1
Persons per Square Mile1.6 - 25.025.1 - 118.0118.1 - 328.9329.0 - 525.4525.5 - 1,287.6

County 1990 2000 2010 2020
Allen 500 29.1 28.6 26.7 25.0 Anderson 580 13.4 13.9 14.0 13.5 Atchison 431 39.2 38.8 39.3 37.9 Barber 1,134 5.2 4.7 4.3 3.7 Barton 895 32.9 31.5 30.9 28.5 Bourbon 635 23.5 24.1 23.9 22.6 Brown 571 19.5 18.8 17.5 16.7 Butler 1,430 35.4 41.7 46.1 47.1 Chase 773 3.9 3.9 3.6 3.3 Chautauqua 639 6.9 6.8 5.7 5.3 Cherokee 588 36.4 38.5 36.8 33.0 Cheyenne 1,020 3.2 3.1 2.7 2.6 Clark 975 2.5 2.5 2.3 2.0 Clay 645 14.2 13.7 13.2 12.6 Cloud 715 15.4 14.3 13.3 12.6 Coffey 627 13.3 14.1 13.7 13.3 Comanche 788 2.9 2.5 2.4 2.1 Cowley 1,126 32.8 32.2 32.3 30.7 Crawford 590 60.0 64.5 66.4 66.1 Decatur 894 4.5 3.9 3.3 3.1 Dickinson 847 22.4 22.8 23.3 21.7 Doniphan 393 20.8 21.0 20.2 19.1 Douglas 456 179.0 218.8 243.1 260.6 Edwards 622 6.1 5.5 4.9 4.7 Elk 644 5.1 5.0 4.5 3.9 Ellis 900 28.9 30.6 31.6 32.2 Ellsworth 716 9.2 9.1 9.1 8.9 Finney 1,302 25.4 31.1 28.2 29.5 Ford 1,098 25.0 29.5 30.8 31.2 Franklin 572 38.3 43.2 45.5 45.5 Geary 385 79.3 72.6 89.3 95.5 Gove 1,072 3.0 2.9 2.5 2.5 Graham 899 3.9 3.3 2.9 2.7 Grant 575 12.5 13.8 13.6 12.8 Gray 869 6.2 6.8 6.9 6.5 Greeley 778 2.3 2.0 1.6 1.6 Greenwood 1,143 6.9 6.7 5.9 5.3 Hamilton 997 2.4 2.7 2.7 2.5 Harper 801 8.9 8.2 7.5 6.8 Harvey 540 57.6 60.9 64.3 63.0 Haskell 578 6.7 7.5 7.4 6.5 Hodgeman 860 2.5 2.4 2.2 2.0 Jackson 656 17.5 19.3 20.5 20.2 Jefferson 533 29.7 34.4 35.9 34.5 Jewell 910 4.7 4.2 3.4 3.2 Johnson 473 744.3 946.1 1,149.6 1,287.6 Kearny 871 4.6 5.2 4.6 4.6 Kingman 863 9.6 10.0 9.1 8.7 Kiowa 723 5.1 4.5 3.5 3.4 Labette 645 36.5 35.2 33.5 31.3 Lane 717 3.3 3.0 2.4 2.2 Leavenworth 463 139.0 148.3 164.7 176.7 Lincoln 719 5.1 5.0 4.5 4.1 Linn 594 13.8 16.0 16.3 16.1 Logan 1,073 2.9 2.8 2.6 2.6
Population Density*2020 Land Area(sq. miles)
Land Area and Population Density in Kansas, by County, 1990-2020

County 1990 2000 2010 2020
Population Density*2020 Land Area(sq. miles)
Land Area and Population Density in Kansas, by County, 1990-2020
Lyon 847 40.8 42.2 39.8 38.0 McPherson 898 30.3 32.8 32.5 33.6 Marion 944 13.7 14.2 13.4 12.5 Marshall 900 13.0 12.1 11.2 11.2 Meade 978 4.3 4.7 4.7 4.1 Miami 576 40.7 49.2 57.0 59.4 Mitchell 702 10.3 9.9 9.1 8.3 Montgomery 644 60.2 56.2 55.1 48.9 Morris 695 8.9 8.8 8.5 7.7 Morton 730 4.8 4.8 4.4 3.7 Nemaha 717 14.5 14.9 14.2 14.3 Neosho 571 29.8 29.7 28.9 27.8 Ness 1,075 3.8 3.2 2.9 2.5 Norton 878 6.8 6.8 6.5 6.2 Osage 706 21.7 23.8 23.1 22.3 Osborne 893 5.5 5.0 4.3 3.9 Ottawa 721 7.8 8.5 8.5 8.0 Pawnee 754 10.0 9.6 9.2 8.3 Phillips 886 7.4 6.8 6.4 5.6 Pottawatomie 841 19.1 21.6 25.7 30.1 Pratt 735 13.2 13.1 13.1 12.5 Rawlins 1,069 3.2 2.8 2.4 2.4 Reno 1,255 49.8 51.6 51.4 49.3 Republic 717 9.1 8.1 6.9 6.5 Rice 726 14.6 14.8 13.9 13.0 Riley 610 110.1 103.1 116.6 118.0 Rooks 891 6.8 6.4 5.8 5.5 Rush 718 5.4 4.9 4.6 4.1 Russell 886 8.9 8.3 7.9 7.5 Saline 720 68.5 74.5 77.2 75.4 Scott 718 7.4 7.1 6.9 7.2 Sedgwick 998 403.7 453.2 499.6 525.4 Seward 639 29.3 35.2 35.9 34.3 Shawnee 544 292.7 309.0 327.1 328.9 Sheridan 896 3.4 3.1 2.9 2.7 Sherman 1,056 6.6 6.4 5.7 5.6 Smith 895 5.7 5.1 4.3 4.0 Stafford 792 6.8 6.0 5.6 5.1 Stanton 680 3.4 3.5 3.3 3.1 Stevens 727 6.9 7.5 7.9 7.2 Sumner 1,182 21.9 22.0 20.4 18.9 Thomas 1,075 7.7 7.6 7.4 7.4 Trego 889 4.2 3.7 3.4 3.2 Wabaunsee 794 8.3 8.6 8.9 8.7 Wallace 914 2.0 1.9 1.6 1.7 Washington 895 7.9 7.2 6.5 6.2 Wichita 719 3.8 3.5 3.1 3.0 Wilson 570 17.9 18.0 16.5 15.1 Woodson 498 8.2 7.6 6.6 6.3 Wyandotte 152 1,073.0 1,042.9 1,039.0 1,116.1 Kansas 81,759 30.3 32.9 34.9 35.9
Source: U.S. Census Bureau, Decennial Census, 1990-2020.
* Population density is defined as the average number of persons per square mile of land area, i.e., the number of inhabitants in the area divided by the number of square miles in the area.

GreeleyFranklin
Phillips
Jackson
Pawnee
Clay
Bourbon
Republic Doniphan
Seward
Ford
Montgomery
Marshall
Woodson
Lincoln
Finney
Stanton
Sheridan
Chase
Ellis
CowleyCherokee
Reno
Wabaunsee
Comanche
Logan
Harper
Crawford
Allen
Lyon
Pottawatomie
Atchison
Norton
Thomas
Hamilton
Osborne
Hodgeman
Trego
Cloud
Brown
Jefferson
Dickinson
Lane
Butler
Cheyenne
Wallace
Chautauqua
KiowaHaskell
Rice
Morton
Rush
WashingtonNemaha
McPhersonNess
Grant
Osage
Labette
Edwards
Linn
Morris
Rooks
Barber
Anderson
Decatur
Sherman
Gray
Barton
Clark
Saline
Kingman
Harvey
Geary
Scott
Jewell
Wilson
Wichita
Stevens
Graham
Kearny
Gove
Neosho
Smith
Russell
Rawlins
Shawnee
Riley
Coffey
Stafford
Elk
Ottawa
Sedgwick
Greenwood
Meade
Miami
Mitchell
Marion
Ellsworth
Sumner
Pratt
Douglas
Urban Clusters and Urbanized Areas in Kansas, 2010
Urban Cluster
Urbanized Area
Source: Institu te for Policy & Social Research , The Univers i ty o f Kansas ; data from U.S. Census Bureau.
Leavenworth
Wyandotte
Johnson

County Urban Rural
Allen 500.3 0.6 99.4Anderson 579.6 0.3 99.7Atchison 431.2 1.4 98.6Barber 1,134.1 0.0 100.0Barton 895.4 0.9 99.1Bourbon 635.5 0.7 99.3Brown 570.9 0.4 99.6Butler 1,429.9 1.5 98.5Chase 773.1 0.0 100.0Chautauqua 638.9 0.0 100.0Cherokee 587.6 1.4 98.7Cheyenne 1,019.9 0.0 100.0Clark 974.6 0.0 100.0Clay 645.3 0.3 99.7Cloud 715.3 0.4 99.7Coffey 626.9 0.3 99.7Comanche 788.3 0.0 100.0Cowley 1,125.8 1.4 98.6Crawford 589.8 2.2 97.8Decatur 893.5 0.0 100.0Dickinson 847.1 0.4 99.6Doniphan 393.4 0.8 99.2Douglas 455.9 7.7 92.3Edwards 621.9 0.0 100.0Elk 644.3 0.0 100.0Ellis 899.9 1.1 98.9Ellsworth 715.8 0.2 99.8Finney 1,302.0 1.0 99.0Ford 1,098.3 1.0 99.0Franklin 571.8 0.9 99.1Geary 384.6 4.8 95.2Gove 1,071.7 0.0 100.0Graham 898.5 0.0 100.0Grant 574.8 0.4 99.6Gray 868.9 0.0 100.0Greeley 778.5 0.0 100.0Greenwood 1,143.3 0.1 99.9Hamilton 996.5 0.0 100.0Harper 801.3 0.0 100.0Harvey 539.8 2.2 97.8Haskell 577.5 0.0 100.0Hodgeman 860.0 0.0 100.0Jackson 656.2 0.2 99.8Jefferson 532.6 0.0 100.0Jewell 909.8 0.0 100.0Johnson 473.4 43.2 56.8Kearny 870.5 0.0 100.0Kingman 863.4 0.2 99.8Kiowa 722.6 0.0 100.0Labette 645.3 0.9 99.2Lane 717.5 0.0 100.0Leavenworth 462.8 5.5 94.5Lincoln 719.4 0.0 100.0Linn 594.1 0.0 100.0
Total Land Area(in square miles)
Land Area and Percent Urban and Rural
in Kansas, by County, 2010
Percent of Land Area

County Urban RuralTotal Land Area(in square miles)
Land Area and Percent Urban and Rural
in Kansas, by County, 2010
Percent of Land Area
Logan 1,073.0 0.0 100.0Lyon 847.5 1.3 98.7McPherson 898.3 0.9 99.1Marion 944.3 0.1 99.9Marshall 900.2 0.2 99.8Meade 978.1 0.0 100.0Miami 575.7 1.5 98.5Mitchell 701.8 0.3 99.7Montgomery 643.5 1.8 98.2Morris 695.3 0.0 100.0Morton 729.7 0.0 100.0Nemaha 717.4 0.2 99.8Neosho 571.5 0.9 99.1Ness 1,074.8 0.0 100.0Norton 878.1 0.2 99.9Osage 705.5 0.3 99.7Osborne 892.5 0.0 100.0Ottawa 720.7 0.0 100.0Pawnee 754.3 0.4 99.6Phillips 885.9 0.2 99.8Pottawatomie 841.0 0.7 99.3Pratt 735.0 0.4 99.6Rawlins 1,069.4 0.0 100.0Reno 1,255.3 1.7 98.3Republic 717.4 0.0 100.0Rice 726.2 0.2 99.8Riley 609.8 3.6 96.4Rooks 890.5 0.0 100.0Rush 717.8 0.0 100.0Russell 886.3 0.2 99.8Saline 720.2 3.2 96.8Scott 717.5 0.2 99.8Sedgwick 997.5 20.7 79.3Seward 639.5 1.5 98.6Shawnee 544.0 14.6 85.4Sheridan 896.0 0.0 100.0Sherman 1,056.1 0.3 99.7Smith 895.5 0.0 100.0Stafford 792.0 0.0 100.0Stanton 680.3 0.0 100.0Stevens 727.3 0.2 99.8Sumner 1,181.9 0.4 99.6Thomas 1,074.7 0.3 99.7Trego 889.5 0.0 100.0Wabaunsee 794.3 0.0 100.0Wallace 913.7 0.0 100.0Washington 894.8 0.0 100.0Wichita 718.6 0.0 100.0Wilson 570.4 0.3 99.8Woodson 497.8 0.0 100.0Wyandotte 151.6 52.4 47.6Kansas 81,758.7 1.2 98.8
Source: U.S. Census Bureau, Census 2010, http://www.census.gov/geo/www/ua/2010urbanruralclass.html (accessed March 26, 2012).
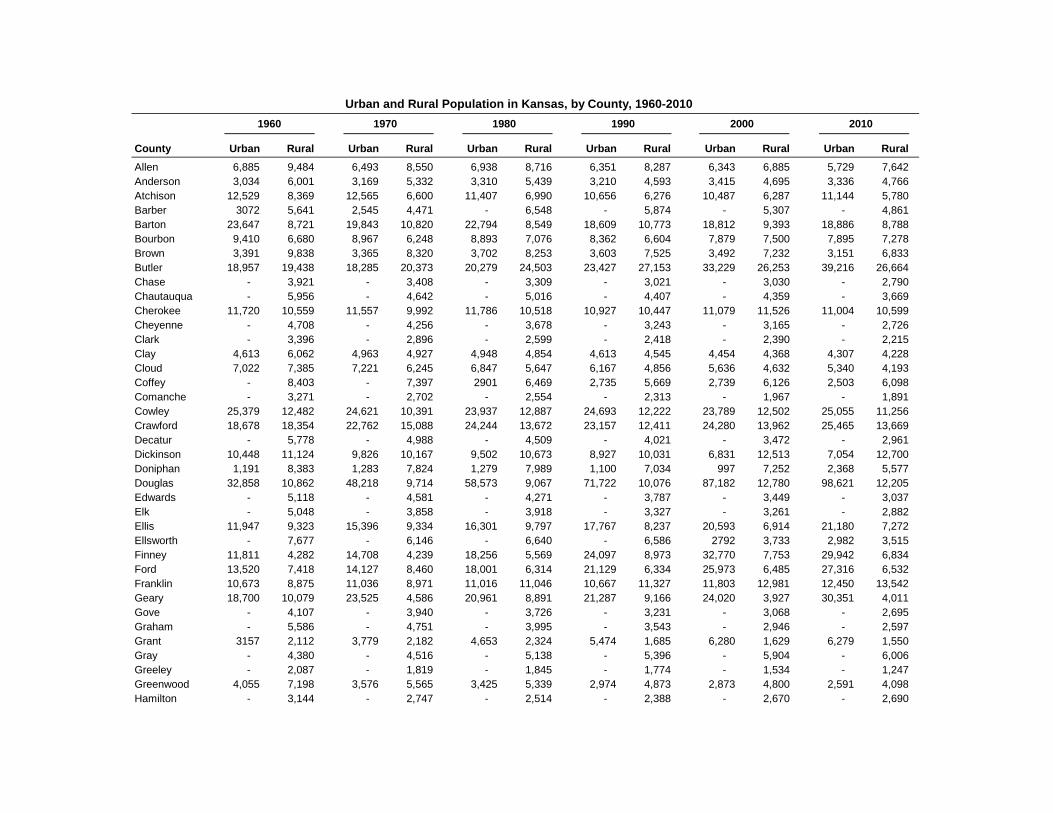
County Urban Rural Urban Rural Urban Rural Urban Rural Urban Rural Urban Rural
Allen 6,885 9,484 6,493 8,550 6,938 8,716 6,351 8,287 6,343 6,885 5,729 7,642Anderson 3,034 6,001 3,169 5,332 3,310 5,439 3,210 4,593 3,415 4,695 3,336 4,766Atchison 12,529 8,369 12,565 6,600 11,407 6,990 10,656 6,276 10,487 6,287 11,144 5,780Barber 3072 5,641 2,545 4,471 - 6,548 - 5,874 - 5,307 - 4,861Barton 23,647 8,721 19,843 10,820 22,794 8,549 18,609 10,773 18,812 9,393 18,886 8,788Bourbon 9,410 6,680 8,967 6,248 8,893 7,076 8,362 6,604 7,879 7,500 7,895 7,278Brown 3,391 9,838 3,365 8,320 3,702 8,253 3,603 7,525 3,492 7,232 3,151 6,833Butler 18,957 19,438 18,285 20,373 20,279 24,503 23,427 27,153 33,229 26,253 39,216 26,664Chase - 3,921 - 3,408 - 3,309 - 3,021 - 3,030 - 2,790Chautauqua - 5,956 - 4,642 - 5,016 - 4,407 - 4,359 - 3,669Cherokee 11,720 10,559 11,557 9,992 11,786 10,518 10,927 10,447 11,079 11,526 11,004 10,599Cheyenne - 4,708 - 4,256 - 3,678 - 3,243 - 3,165 - 2,726Clark - 3,396 - 2,896 - 2,599 - 2,418 - 2,390 - 2,215Clay 4,613 6,062 4,963 4,927 4,948 4,854 4,613 4,545 4,454 4,368 4,307 4,228Cloud 7,022 7,385 7,221 6,245 6,847 5,647 6,167 4,856 5,636 4,632 5,340 4,193Coffey - 8,403 - 7,397 2901 6,469 2,735 5,669 2,739 6,126 2,503 6,098Comanche - 3,271 - 2,702 - 2,554 - 2,313 - 1,967 - 1,891Cowley 25,379 12,482 24,621 10,391 23,937 12,887 24,693 12,222 23,789 12,502 25,055 11,256Crawford 18,678 18,354 22,762 15,088 24,244 13,672 23,157 12,411 24,280 13,962 25,465 13,669Decatur - 5,778 - 4,988 - 4,509 - 4,021 - 3,472 - 2,961Dickinson 10,448 11,124 9,826 10,167 9,502 10,673 8,927 10,031 6,831 12,513 7,054 12,700Doniphan 1,191 8,383 1,283 7,824 1,279 7,989 1,100 7,034 997 7,252 2,368 5,577Douglas 32,858 10,862 48,218 9,714 58,573 9,067 71,722 10,076 87,182 12,780 98,621 12,205Edwards - 5,118 - 4,581 - 4,271 - 3,787 - 3,449 - 3,037Elk - 5,048 - 3,858 - 3,918 - 3,327 - 3,261 - 2,882Ellis 11,947 9,323 15,396 9,334 16,301 9,797 17,767 8,237 20,593 6,914 21,180 7,272Ellsworth - 7,677 - 6,146 - 6,640 - 6,586 2792 3,733 2,982 3,515Finney 11,811 4,282 14,708 4,239 18,256 5,569 24,097 8,973 32,770 7,753 29,942 6,834Ford 13,520 7,418 14,127 8,460 18,001 6,314 21,129 6,334 25,973 6,485 27,316 6,532Franklin 10,673 8,875 11,036 8,971 11,016 11,046 10,667 11,327 11,803 12,981 12,450 13,542Geary 18,700 10,079 23,525 4,586 20,961 8,891 21,287 9,166 24,020 3,927 30,351 4,011Gove - 4,107 - 3,940 - 3,726 - 3,231 - 3,068 - 2,695Graham - 5,586 - 4,751 - 3,995 - 3,543 - 2,946 - 2,597Grant 3157 2,112 3,779 2,182 4,653 2,324 5,474 1,685 6,280 1,629 6,279 1,550Gray - 4,380 - 4,516 - 5,138 - 5,396 - 5,904 - 6,006Greeley - 2,087 - 1,819 - 1,845 - 1,774 - 1,534 - 1,247Greenwood 4,055 7,198 3,576 5,565 3,425 5,339 2,974 4,873 2,873 4,800 2,591 4,098Hamilton - 3,144 - 2,747 - 2,514 - 2,388 - 2,670 - 2,690
Urban and Rural Population in Kansas, by County, 1960-2010
1960 1970 1980 1990 2000 2010

County Urban Rural Urban Rural Urban Rural Urban Rural Urban Rural Urban Rural
Urban and Rural Population in Kansas, by County, 1960-2010
1960 1970 1980 1990 2000 2010
Harper 2,744 6,797 2,653 5,218 2,661 5,117 2,516 4,608 - 6,536 - 6,034Harvey 14,877 10,988 15,439 11,797 19,345 11,186 19,712 11,316 22,599 10,270 23,960 10,724Haskell - 2,990 - 3,672 - 3,814 - 3,886 - 4,307 - 4,256Hodgeman - 3,115 - 2,662 - 2,269 - 2,177 - 2,085 - 1,916Jackson 3,028 7,281 3,063 7,279 3,132 8,512 3,196 8,329 3,284 9,373 3,245 10,217Jefferson - 11,252 - 11,945 - 15,207 - 15,905 - 18,426 226 18,900Jewell - 7,217 - 6,099 - 5,241 - 4,251 - 3,791 - 3,077Johnson 122,071 21,721 199,910 17,752 244,828 25,441 333,636 21,418 428,500 22,586 523,317 20,862Kearny - 3,108 - 3,047 - 3,435 - 4,027 - 4,531 - 3,977Kingman 3,582 6,376 3,622 5,264 3,563 5,397 3,196 5,096 3,195 5,478 2,978 4,880Kiowa - 4,626 - 4,088 - 4,046 - 3,660 - 3,278 - 2,553Labette 13,929 12,876 13,015 12,760 12,898 12,784 11,924 11,769 11,143 11,692 10,298 11,309Lane - 3,060 - 2,707 - 2,472 - 2,375 - 2,155 - 1,750Leavenworth 22,052 26,472 37,004 16,336 38,963 15,846 45,615 18,756 46,845 21,846 54,073 22,154Lincoln - 5,556 - 4,582 - 4,145 - 3,653 - 3,578 - 3,241Linn - 8,274 - 7,770 - 8,234 - 8,254 - 9,570 - 9,656Logan - 4,036 - 3,814 - 3,478 - 3,081 - 3,046 - 2,756Lyon 18,190 8,738 23,327 8,744 25,287 9,821 25,512 9,220 26,798 9,137 24,830 8,860McPherson 12,605 11,680 13,615 11,163 14,908 11,947 15,498 11,770 16,920 12,634 16,488 12,692Marion - 15,143 2730 11,205 2,717 10,805 2,704 10,184 2,763 10,598 2,815 9,845Marshall 4,143 11,455 3,588 9,551 3,670 9,117 3,359 8,346 3,057 7,908 2,937 7,180Meade - 5,505 - 4,912 - 4,788 - 4,247 - 4,631 - 4,575Miami 9,406 10,478 8,916 10,338 9,016 12,602 9,288 14,178 12,629 15,722 16,082 16,705Mitchell 3,837 5,029 4,121 3,889 4,367 3,750 4,066 3,137 3,607 3,325 3,295 3,078Montgomery 34,069 10,938 28,072 11,877 28,552 13,729 22,859 15,957 20,931 15,321 20,068 15,403Morris 2,664 4,728 - 6,432 - 6,419 - 6,198 - 6,104 - 5,923Morton - 3,354 - 3,576 - 3,454 - 3,480 - 3,496 - 3,233Nemaha - 12,897 - 11,825 - 11,211 - 10,446 - 10,717 2,520 7,658Neosho 10,849 8,606 10,341 8,471 10,506 8,461 9,488 7,547 9,332 7,665 9,059 7,453Ness - 5,470 - 4,791 - 4,498 - 4,033 - 3,454 - 3,107Norton 3,345 4,690 3,627 3,652 3,400 3,289 3,017 2,930 3,750 2,203 2,893 2,778Osage - 12,886 2600 10,752 2,667 12,652 2,689 12,559 - 16,712 2,683 13,612Osborne - 7,506 - 6,416 - 5,959 - 4,867 - 4,452 - 3,858Ottawa - 6,779 - 6,183 - 5,971 - 5,634 - 6,163 - 6,091Pawnee 5,001 5,253 4,567 3,917 4,811 3,254 4,490 3,065 4,874 2,359 4,764 2,209Phillips 3,233 5,476 3,241 4,647 3,229 4,177 2,828 3,762 2,668 3,333 2,609 3,033Pottawatomie - 11,957 3185 8,570 3,321 11,461 3,849 12,279 4,238 13,971 8,876 12,728Pratt 8,156 3,966 6,736 3,320 6,885 3,390 6,687 3,015 6,448 3,199 6,546 3,110

County Urban Rural Urban Rural Urban Rural Urban Rural Urban Rural Urban Rural
Urban and Rural Population in Kansas, by County, 1960-2010
1960 1970 1980 1990 2000 2010
Rawlins - 5,279 - 4,393 - 4,105 - 3,404 - 2,966 - 2,519Reno 37,574 21,481 36,885 23,880 40,284 24,699 39,308 23,081 44,341 20,449 44,320 20,191Republic 2,940 6,828 3,063 5,435 2,805 4,764 2,517 3,965 - 5,835 - 4,980Rice 4,592 9,317 4,355 7,965 4,152 7,748 3,688 6,922 6,097 4,664 3,652 6,431Riley 22,993 18,921 42,296 14,492 46,912 16,593 49,734 17,405 53,605 9,238 61,269 9,846Rooks 3104 6,630 2,627 5,001 - 7,006 - 6,039 - 5,685 - 5,181Rush - 6,160 - 5,117 - 4,516 - 3,842 - 3,551 - 3,307Russell 6,113 5,235 5,371 4,057 5,427 3,441 4,781 3,054 4,329 3,041 4,108 2,862Saline 43,202 11,513 37,714 8,878 41,843 7,062 42,297 7,004 45,551 8,046 47,493 8,113Scott 3,555 1,673 4,001 1,605 4,154 1,628 3,785 1,504 3,687 1,433 3,647 1,289Sedgwick 311,460 31,771 317,424 33,270 325,610 40,921 360,578 43,084 413,159 39,710 460,197 38,168Seward 13,813 2,117 13,471 2,273 14,911 2,160 16,573 2,170 19,320 3,190 20,329 2,623Shawnee 119,500 21,786 132,108 23,214 125,936 28,980 132,711 28,265 142,541 27,330 149,777 28,157Sheridan - 4,267 - 3,859 - 3,544 - 3,043 - 2,813 - 2,556Sherman 4,459 2,223 5,510 2,282 5,708 2,051 4,983 1,943 4,838 1,922 4,553 1,457Smith - 7,776 - 6,757 - 5,947 - 5,078 - 4,536 - 3,853Stafford - 7,451 - 5,943 - 5,694 - 5,365 - 4,789 - 4,437Stanton - 2,108 - 2,287 - 2,339 - 2,333 - 2,406 - 2,235Stevens 2,912 1,488 2,739 1,459 3,165 1,571 3,179 1,869 3,773 1,690 3,936 1,788Sumner 10,019 15,297 9,194 14,359 9,472 15,456 9,619 16,222 9,751 16,195 8,964 15,168Thomas 4,210 3,148 4,658 2,843 5,544 2,907 5,396 2,862 5,359 2,821 5,463 2,437Trego 2808 2,665 - 4,436 - 4,165 - 3,694 - 3,319 - 3,001Wabaunsee - 6,648 - 6,397 - 6,867 - 6,603 - 6,885 - 7,053Wallace - 2,069 - 2,215 - 2,045 - 1,821 - 1,749 - 1,485Washington - 10,739 - 9,249 - 8,543 - 7,073 - 6,483 - 5,799Wichita - 2,765 - 3,274 - 3,041 - 2,758 - 2,531 - 2,234Wilson 6,827 6,250 6,375 4,942 6,461 5,667 5,436 4,853 2,910 7,422 2,570 6,839Woodson - 5,423 - 4,789 - 4,600 - 4,116 - 3,788 - 3,309Wyandotte 164,182 21,313 171,877 14,968 170,836 1,499 160,196 1,797 149,491 8,391 147,956 9,549Kansas 1,328,741 849,870 1,484,870 761,708 1,575,899 787,780 1,712,564 765,010 1,920,081 767,180 2,116,961 736,157
Source: U.S. Census Bureau, Decennial Census, 1960-2010.
Single dash (-) indicates no urban land area within the county.
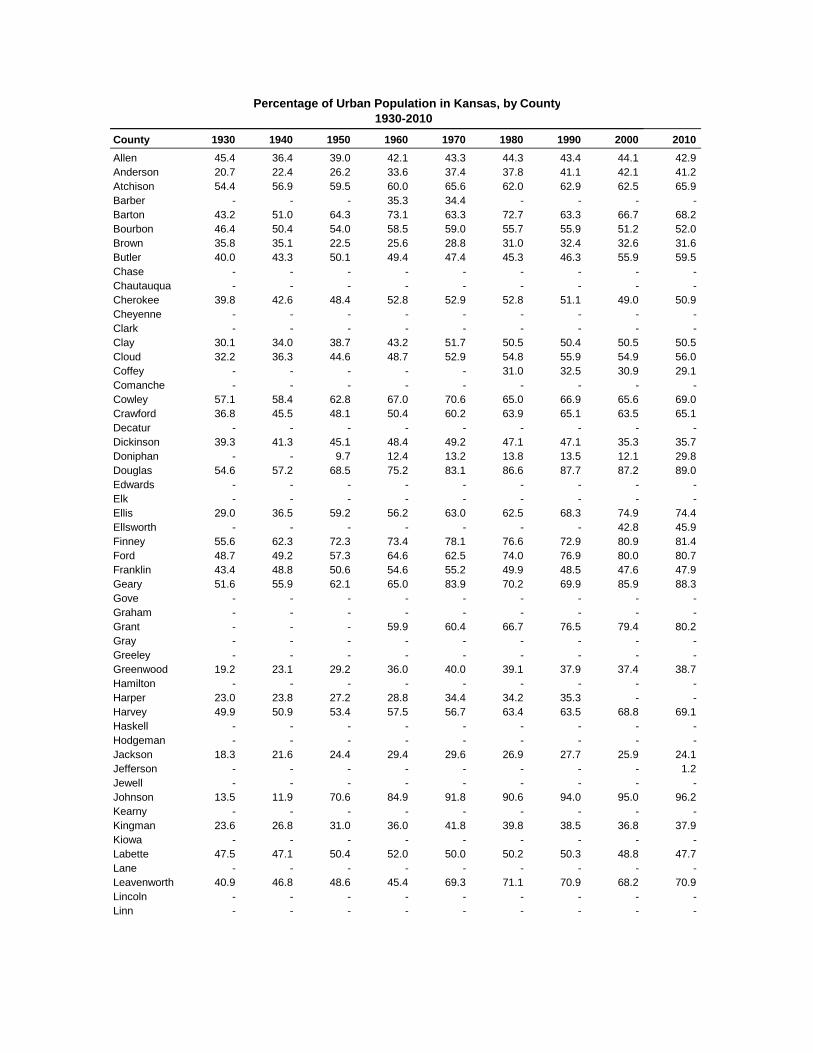
County 1930 1940 1950 1960 1970 1980 1990 2000 2010
Allen 45.4 36.4 39.0 42.1 43.3 44.3 43.4 44.1 42.9Anderson 20.7 22.4 26.2 33.6 37.4 37.8 41.1 42.1 41.2Atchison 54.4 56.9 59.5 60.0 65.6 62.0 62.9 62.5 65.9Barber - - - 35.3 34.4 - - - - Barton 43.2 51.0 64.3 73.1 63.3 72.7 63.3 66.7 68.2Bourbon 46.4 50.4 54.0 58.5 59.0 55.7 55.9 51.2 52.0Brown 35.8 35.1 22.5 25.6 28.8 31.0 32.4 32.6 31.6Butler 40.0 43.3 50.1 49.4 47.4 45.3 46.3 55.9 59.5Chase - - - - - - - - - Chautauqua - - - - - - - - - Cherokee 39.8 42.6 48.4 52.8 52.9 52.8 51.1 49.0 50.9Cheyenne - - - - - - - - - Clark - - - - - - - - - Clay 30.1 34.0 38.7 43.2 51.7 50.5 50.4 50.5 50.5Cloud 32.2 36.3 44.6 48.7 52.9 54.8 55.9 54.9 56.0Coffey - - - - - 31.0 32.5 30.9 29.1Comanche - - - - - - - - - Cowley 57.1 58.4 62.8 67.0 70.6 65.0 66.9 65.6 69.0Crawford 36.8 45.5 48.1 50.4 60.2 63.9 65.1 63.5 65.1Decatur - - - - - - - - - Dickinson 39.3 41.3 45.1 48.4 49.2 47.1 47.1 35.3 35.7Doniphan - - 9.7 12.4 13.2 13.8 13.5 12.1 29.8Douglas 54.6 57.2 68.5 75.2 83.1 86.6 87.7 87.2 89.0Edwards - - - - - - - - - Elk - - - - - - - - - Ellis 29.0 36.5 59.2 56.2 63.0 62.5 68.3 74.9 74.4Ellsworth - - - - - - - 42.8 45.9Finney 55.6 62.3 72.3 73.4 78.1 76.6 72.9 80.9 81.4Ford 48.7 49.2 57.3 64.6 62.5 74.0 76.9 80.0 80.7Franklin 43.4 48.8 50.6 54.6 55.2 49.9 48.5 47.6 47.9Geary 51.6 55.9 62.1 65.0 83.9 70.2 69.9 85.9 88.3Gove - - - - - - - - - Graham - - - - - - - - - Grant - - - 59.9 60.4 66.7 76.5 79.4 80.2Gray - - - - - - - - - Greeley - - - - - - - - - Greenwood 19.2 23.1 29.2 36.0 40.0 39.1 37.9 37.4 38.7Hamilton - - - - - - - - - Harper 23.0 23.8 27.2 28.8 34.4 34.2 35.3 - - Harvey 49.9 50.9 53.4 57.5 56.7 63.4 63.5 68.8 69.1Haskell - - - - - - - - - Hodgeman - - - - - - - - - Jackson 18.3 21.6 24.4 29.4 29.6 26.9 27.7 25.9 24.1Jefferson - - - - - - - - 1.2Jewell - - - - - - - - - Johnson 13.5 11.9 70.6 84.9 91.8 90.6 94.0 95.0 96.2Kearny - - - - - - - - - Kingman 23.6 26.8 31.0 36.0 41.8 39.8 38.5 36.8 37.9Kiowa - - - - - - - - - Labette 47.5 47.1 50.4 52.0 50.0 50.2 50.3 48.8 47.7Lane - - - - - - - - - Leavenworth 40.9 46.8 48.6 45.4 69.3 71.1 70.9 68.2 70.9Lincoln - - - - - - - - - Linn - - - - - - - - -
Percentage of Urban Population in Kansas, by County1930-2010
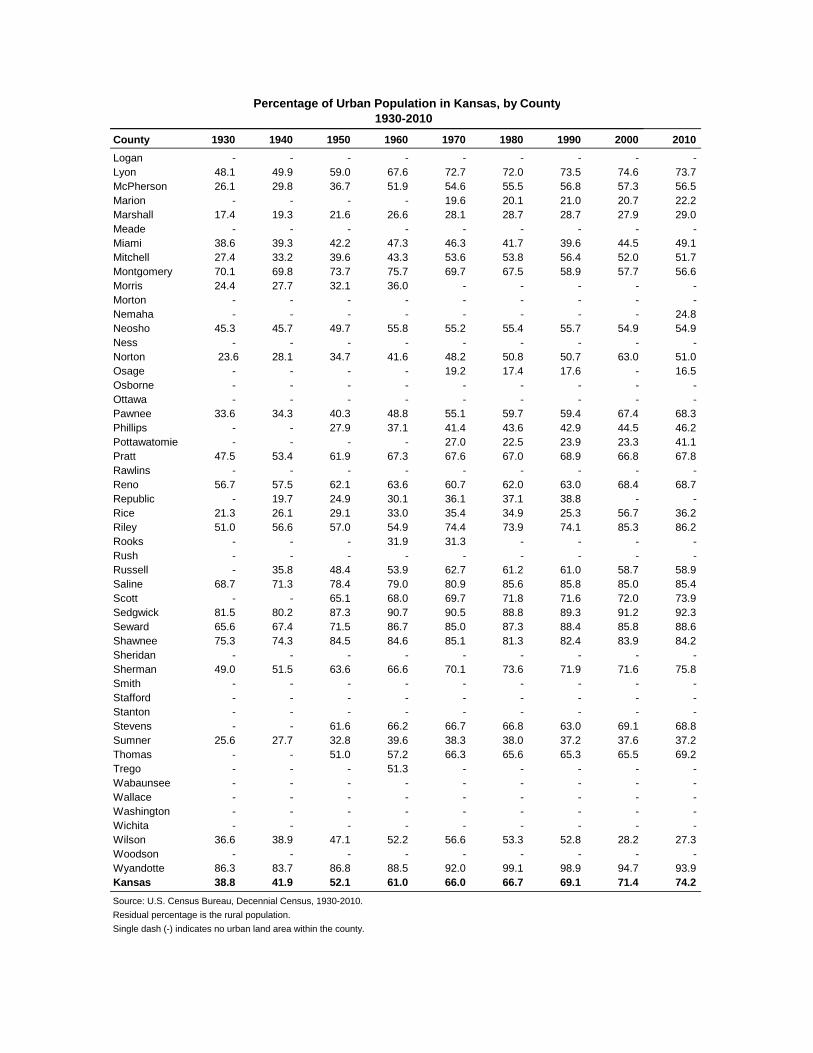
County 1930 1940 1950 1960 1970 1980 1990 2000 2010
Percentage of Urban Population in Kansas, by County1930-2010
Logan - - - - - - - - - Lyon 48.1 49.9 59.0 67.6 72.7 72.0 73.5 74.6 73.7McPherson 26.1 29.8 36.7 51.9 54.6 55.5 56.8 57.3 56.5Marion - - - - 19.6 20.1 21.0 20.7 22.2Marshall 17.4 19.3 21.6 26.6 28.1 28.7 28.7 27.9 29.0Meade - - - - - - - - - Miami 38.6 39.3 42.2 47.3 46.3 41.7 39.6 44.5 49.1Mitchell 27.4 33.2 39.6 43.3 53.6 53.8 56.4 52.0 51.7Montgomery 70.1 69.8 73.7 75.7 69.7 67.5 58.9 57.7 56.6Morris 24.4 27.7 32.1 36.0 - - - - - Morton - - - - - - - - - Nemaha - - - - - - - - 24.8Neosho 45.3 45.7 49.7 55.8 55.2 55.4 55.7 54.9 54.9Ness - - - - - - - - - Norton 23.6 28.1 34.7 41.6 48.2 50.8 50.7 63.0 51.0Osage - - - - 19.2 17.4 17.6 - 16.5Osborne - - - - - - - - - Ottawa - - - - - - - - - Pawnee 33.6 34.3 40.3 48.8 55.1 59.7 59.4 67.4 68.3Phillips - - 27.9 37.1 41.4 43.6 42.9 44.5 46.2Pottawatomie - - - - 27.0 22.5 23.9 23.3 41.1Pratt 47.5 53.4 61.9 67.3 67.6 67.0 68.9 66.8 67.8Rawlins - - - - - - - - - Reno 56.7 57.5 62.1 63.6 60.7 62.0 63.0 68.4 68.7Republic - 19.7 24.9 30.1 36.1 37.1 38.8 - - Rice 21.3 26.1 29.1 33.0 35.4 34.9 25.3 56.7 36.2Riley 51.0 56.6 57.0 54.9 74.4 73.9 74.1 85.3 86.2Rooks - - - 31.9 31.3 - - - - Rush - - - - - - - - - Russell - 35.8 48.4 53.9 62.7 61.2 61.0 58.7 58.9Saline 68.7 71.3 78.4 79.0 80.9 85.6 85.8 85.0 85.4Scott - - 65.1 68.0 69.7 71.8 71.6 72.0 73.9Sedgwick 81.5 80.2 87.3 90.7 90.5 88.8 89.3 91.2 92.3Seward 65.6 67.4 71.5 86.7 85.0 87.3 88.4 85.8 88.6Shawnee 75.3 74.3 84.5 84.6 85.1 81.3 82.4 83.9 84.2Sheridan - - - - - - - - - Sherman 49.0 51.5 63.6 66.6 70.1 73.6 71.9 71.6 75.8Smith - - - - - - - - - Stafford - - - - - - - - - Stanton - - - - - - - - - Stevens - - 61.6 66.2 66.7 66.8 63.0 69.1 68.8Sumner 25.6 27.7 32.8 39.6 38.3 38.0 37.2 37.6 37.2Thomas - - 51.0 57.2 66.3 65.6 65.3 65.5 69.2Trego - - - 51.3 - - - - - Wabaunsee - - - - - - - - - Wallace - - - - - - - - - Washington - - - - - - - - - Wichita - - - - - - - - - Wilson 36.6 38.9 47.1 52.2 56.6 53.3 52.8 28.2 27.3Woodson - - - - - - - - - Wyandotte 86.3 83.7 86.8 88.5 92.0 99.1 98.9 94.7 93.9Kansas 38.8 41.9 52.1 61.0 66.0 66.7 69.1 71.4 74.2
Single dash (-) indicates no urban land area within the county.
Residual percentage is the rural population.
Source: U.S. Census Bureau, Decennial Census, 1930-2010.

County Total Institutionalized Total Institutionalized
Allen 382 187 195 385 138 247 Anderson 103 95 8 92 75 17 Atchison 1,375 135 1,240 1,683 223 1,460 Barber 40 36 4 55 50 5 Barton 672 344 328 537 335 202 Bourbon 409 230 179 394 156 238 Brown 116 47 69 126 78 48 Butler 2,309 1,896 413 2,584 2,148 436 Chase 145 145 0 170 170 0 Chautauqua 79 70 9 77 44 33 Cherokee 202 183 19 176 157 19 Cheyenne 49 49 0 26 26 0 Clark 57 57 0 28 28 0 Clay 140 134 6 182 177 5 Cloud 498 185 313 569 253 316 Coffey 130 107 23 108 82 26 Comanche 65 65 0 46 46 0 Cowley 2,004 1,076 928 1,949 1,078 871 Crawford 1,773 610 1,163 1,496 467 1,029 Decatur 81 81 0 45 45 0 Dickinson 307 266 41 263 263 0 Doniphan 427 84 343 394 76 318 Douglas 8,792 572 8,220 8,502 537 7,965 Edwards 35 34 1 47 43 4 Elk 40 40 0 1 1 0 Ellis 1,033 269 764 1,817 93 1,724 Ellsworth 983 964 19 1,154 1,132 22 Finney 548 231 317 590 208 382 Ford 708 448 260 657 383 274 Franklin 478 128 350 541 177 364 Geary 847 235 612 912 239 673 Gove 56 56 0 51 50 1 Graham 40 26 14 31 31 0 Grant 79 79 0 51 51 0 Gray 78 78 0 86 86 0 Greeley 26 26 0 21 21 0 Greenwood 90 90 0 106 82 24 Hamilton 0 0 0 0 0 0 Harper 129 129 0 110 62 48
Non-Institutionalized
Persons in Group Quarters, 2020
Non-Institutionalized
Persons in Group Quarters, 2010
Group Quarters Population in Kansas, by County, 2010 and 2020
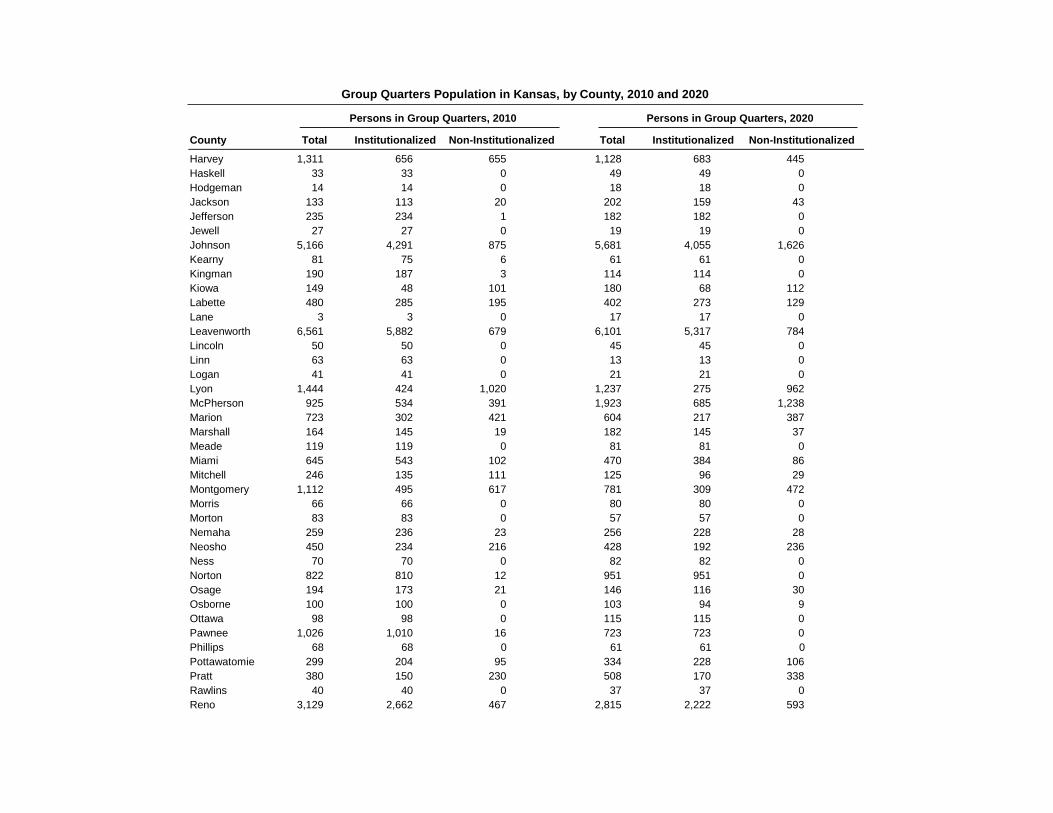
County Total Institutionalized Total Institutionalized Non-Institutionalized
Persons in Group Quarters, 2020
Non-Institutionalized
Persons in Group Quarters, 2010
Group Quarters Population in Kansas, by County, 2010 and 2020
Harvey 1,311 656 655 1,128 683 445 Haskell 33 33 0 49 49 0 Hodgeman 14 14 0 18 18 0 Jackson 133 113 20 202 159 43 Jefferson 235 234 1 182 182 0 Jewell 27 27 0 19 19 0 Johnson 5,166 4,291 875 5,681 4,055 1,626 Kearny 81 75 6 61 61 0 Kingman 190 187 3 114 114 0 Kiowa 149 48 101 180 68 112 Labette 480 285 195 402 273 129 Lane 3 3 0 17 17 0 Leavenworth 6,561 5,882 679 6,101 5,317 784 Lincoln 50 50 0 45 45 0 Linn 63 63 0 13 13 0 Logan 41 41 0 21 21 0 Lyon 1,444 424 1,020 1,237 275 962 McPherson 925 534 391 1,923 685 1,238 Marion 723 302 421 604 217 387 Marshall 164 145 19 182 145 37 Meade 119 119 0 81 81 0 Miami 645 543 102 470 384 86 Mitchell 246 135 111 125 96 29 Montgomery 1,112 495 617 781 309 472 Morris 66 66 0 80 80 0 Morton 83 83 0 57 57 0 Nemaha 259 236 23 256 228 28 Neosho 450 234 216 428 192 236 Ness 70 70 0 82 82 0 Norton 822 810 12 951 951 0 Osage 194 173 21 146 116 30 Osborne 100 100 0 103 94 9 Ottawa 98 98 0 115 115 0 Pawnee 1,026 1,010 16 723 723 0 Phillips 68 68 0 61 61 0 Pottawatomie 299 204 95 334 228 106 Pratt 380 150 230 508 170 338 Rawlins 40 40 0 37 37 0 Reno 3,129 2,662 467 2,815 2,222 593

County Total Institutionalized Total Institutionalized Non-Institutionalized
Persons in Group Quarters, 2020
Non-Institutionalized
Persons in Group Quarters, 2010
Group Quarters Population in Kansas, by County, 2010 and 2020
Republic 103 101 2 58 56 2 Rice 648 181 467 479 129 350 Riley 9,127 450 8,677 11,198 432 10,766 Rooks 72 69 3 196 196 0 Rush 67 67 0 75 75 0 Russell 89 83 6 106 90 16 Saline 1,465 575 890 1,554 873 681 Scott 105 105 0 73 73 0 Sedgwick 7,252 4,051 3,201 11,084 5,160 5,924 Seward 476 237 239 324 137 187 Shawnee 4,397 2,943 1,454 4,604 2,900 1,704 Sheridan 33 33 0 38 38 0 Sherman 102 49 53 252 48 204 Smith 56 56 0 59 50 9 Stafford 69 69 0 91 91 0 Stanton 47 47 0 33 33 0 Stevens 72 66 6 64 64 0 Sumner 409 386 23 312 312 0 Thomas 353 125 228 386 100 286 Trego 64 64 0 41 41 0 Wabaunsee 90 90 0 183 102 81 Wallace 19 18 1 24 24 0 Washington 114 111 3 112 93 19 Wichita 26 26 0 19 19 0 Wilson 121 121 0 145 103 42 Woodson 39 39 0 50 50 0 Wyandotte 1,335 1,041 294 2,986 1,731 1,255 Kansas 79,074 41,393 37,681 86,940 40,973 45,967
Source: U.S. Census Bureau, 2010 Census, Profile of General Population and Housing Characteristics: 2010 (DP-1); 2020 Census (PL94-171).

Number of Households in Kansas, by County 2000 and 2010
County Number Percent
Allen 5,775 5,475 -300 -5.2 2.43 2.37 Anderson 3,221 3,260 39 1.2 2.48 2.45 Atchison 6,275 6,241 -34 -0.5 2.51 2.49 Barber 2,235 2,139 -96 -4.3 2.35 2.25 Barton 11,393 11,283 -110 -1.0 2.41 2.39 Bourbon 6,161 5,986 -175 -2.8 2.44 2.47 Brown 4,318 4,094 -224 -5.2 2.44 2.41 Butler 21,527 23,992 2,465 11.5 2.67 2.65 Chase 1,246 1,150 -96 -7.7 2.34 2.30 Chautauqua 1,796 1,612 -184 -10.2 2.34 2.23 Cherokee 8,875 8,625 -250 -2.8 2.51 2.48 Cheyenne 1,360 1,260 -100 -7.4 2.29 2.12 Clark 979 923 -56 -5.7 2.39 2.34 Clay 3,617 3,559 -58 -1.6 2.39 2.36 Cloud 4,163 3,910 -253 -6.1 2.31 2.31 Coffey 3,489 3,497 8 0.2 2.49 2.42 Comanche 872 824 -48 -5.5 2.18 2.22 Cowley 14,039 13,940 -99 -0.7 2.46 2.46 Crawford 15,504 15,729 225 1.5 2.35 2.38 Decatur 1,494 1,378 -116 -7.8 2.24 2.09 Dickinson 7,903 8,073 170 2.2 2.40 2.41 Doniphan 3,173 3,136 -37 -1.2 2.48 2.40 Douglas 38,486 43,576 5,090 13.2 2.37 2.34 Edwards 1,455 1,302 -153 -10.5 2.33 2.31 Elk 1,412 1,284 -128 -9.1 2.25 2.21 Ellis 11,193 11,908 715 6.4 2.35 2.30 Ellsworth 2,481 2,463 -18 -0.7 2.30 2.24 Finney 12,948 12,359 -589 -4.5 3.09 2.93 Ford 10,852 11,145 293 2.7 2.92 2.97 Franklin 9,452 10,104 652 6.9 2.56 2.53
Households* Persons per Household
Change, 2000-2010April 1, 2000 Census
April 1, 2010 Census
April 1, 2000 Census
April 1, 2010 Census
Geary 10,458 12,690 2,232 21.3 2.61 2.64 Gove 1,245 1,154 -91 -7.3 2.42 2.29 Graham 1,263 1,196 -67 -5.3 2.28 2.14 Grant 2,742 2,716 -26 -0.9 2.86 2.85 Gray 2,045 2,153 108 5.3 2.82 2.75 Greeley 602 525 -77 -12.8 2.50 2.33 Greenwood 3,234 2,988 -246 -7.6 2.31 2.21 Hamilton 1,054 1,060 6 0.6 2.49 2.54 Harper 2,773 2,545 -228 -8.2 2.30 2.32 Harvey 12,581 13,411 830 6.6 2.50 2.49 Haskell 1,481 1,510 29 2.0 2.88 2.80 Hodgeman 796 803 7 0.9 2.58 2.37 Jackson 4,727 5,228 501 10.6 2.63 2.55 Jefferson 6,830 7,366 536 7.8 2.66 2.56 Jewell 1,695 1,450 -245 -14.5 2.21 2.10 Johnson 174,570 212,882 38,312 21.9 2.56 2.53 Kearny 1,542 1,400 -142 -9.2 3.35 2.78 Kingman 3,371 3,227 -144 -4.3 3.03 2.38 Kiowa 1,365 1,014 -351 -25.7 2.32 2.37 Labette 9,194 8,822 -372 -4.0 2.39 2.39 Lane 910 799 -111 -12.2 2.34 2.19 Leavenworth 23,071 26,447 3,376 14.6 2.69 2.63 Lincoln 1,529 1,423 -106 -6.9 2.29 2.24 Linn 3,807 4,020 213 5.6 2.48 2.39

Number of Households in Kansas, by County 2000 and 2010
County Number Percent
Households* Persons per Household
Change, 2000-2010April 1, 2000 Census
April 1, 2010 Census
April 1, 2000 Census
April 1, 2010 Census
Logan 1,243 1,219 -24 -1.9 2.40 2.23 Lyon 13,691 13,303 -388 -2.8 2.51 2.42 McPherson 11,205 11,748 543 4.8 2.49 2.41 Marion 5,114 5,005 -109 -2.1 2.46 2.39 Marshall 4,458 4,300 -158 -3.5 2.40 2.31 Meade 1,728 1,713 -15 -0.9 2.61 2.60 Miami 10,365 12,161 1,796 17.3 2.66 2.64 Mitchell 2,850 2,790 -60 -2.1 2.31 2.20 Montgomery 14,903 14,382 -521 -3.5 2.37 2.39 Morris 2,539 2,554 15 0.6 2.37 2.29 Morton 1,306 1,250 -56 -4.3 2.63 2.52 Nemaha 3,959 4,115 156 3.9 2.58 2.41 Neosho 6,739 6,645 -94 -1.4 2.45 2.42 Ness 1,516 1,365 -151 -10.0 2.23 2.22 Norton 2,266 2,163 -103 -4.5 2.28 2.24 Osage 6,490 6,552 62 1.0 2.54 2.46 Osborne 1,940 1,742 -198 -10.2 2.23 2.16 Ottawa 2,430 2,456 26 1.1 2.46 2.44 Pawnee 2,739 2,665 -74 -2.7 2.31 2.23 Phillips 2,496 2,432 -64 -2.6 2.35 2.29 Pottawatomie 6,771 7,878 1,107 16.3 2.65 2.70 Pratt 3,963 3,956 -7 -0.2 2.35 2.34 Rawlins 1,269 1,176 -93 -7.3 2.29 2.11 Reno 25,498 25,794 296 1.2 2.41 2.38 Republic 2,557 2,274 -283 -11.1 2.23 2.14 Rice 4,050 3,906 -144 -3.6 2.44 2.42 Riley 22,137 25,796 3,659 16.5 2.42 2.40 Rooks 2,362 2,238 -124 -5.2 2.32 2.28 Rush 1,548 1,511 -37 -2.4 2.24 2.14 Russell 3,207 3,173 -34 -1.1 2.23 2.17 Saline 21,436 22,416 980 4.6 2.43 2.42 Scott 2,045 1,983 -62 -3.0 2.46 2.44 Sedgwick 176,444 193,502 17,058 9.7 2.53 2.54 Seward 7,419 7,460 41 0.6 2.98 3.01 Shawnee 68,920 72,600 3,680 5.3 2.39 2.39 Sheridan 1,124 1,099 -25 -2.2 2.46 2.30 Sherman 2,758 2,608 -150 -5.4 2.40 2.27 Smith 1,953 1,748 -205 -10.5 2.27 2.17 Stafford 2,010 1,907 -103 -5.1 2.34 2.29 Stanton 858 825 -33 -3.8 2.74 2.65 Stevens 1,988 2,044 56 2.8 2.72 2.77 Sumner 9,888 9,454 -434 -4.4 2.58 2.51 Thomas 3,226 3,196 -30 -0.9 2.45 2.36 Trego 1,412 1,358 -54 -3.8 2.27 2.16 Wabaunsee 2,633 2,737 104 3.9 2.57 2.54 Wallace 674 620 -54 -8.0 2.56 2.36 Washington 2,673 2,474 -199 -7.4 2.35 2.30 Wichita 967 891 -76 -7.9 2.59 2.48 Wilson 4,203 3,933 -270 -6.4 2.40 2.36 Woodson 1,642 1,524 -118 -7.2 2.24 2.15 Wyandotte 59,700 58,399 -1,301 -2.2 2.62 2.67 Kansas 1,037,891 1,112,096 74,205 7.1 2.51 2.49
*The U.S. Census Bureau defines a household as a person or group of people who occupy a housing unit.
Source: U.S. Census Bureau, Census 2000, Summary File 4, http://factfinder.census.gov/ (accessed July 8, 2005); 2010 Census, Profile of General Population and Housing Characteristics: 2010 (DP-1).

Franklin45.5
Reno49.3
Crawford66.1
Johnson1,287.6
Butler47.1
Saline75.4
Harvey63.0
Geary95.5
Shawnee328.9
Riley118.0
Sedgwick525.4
Miami59.4
Douglas260.6
Greeley1.6
Phillips5.6
Jackson20.2
Pawnee8.3
Clay12.6
Bourbon22.6
Republic6.5
Doniphan19.1
Seward34.3
Ford31.2
Marshall11.2
Woodson6.3
Lincoln4.1
Finney29.5
Stanton3.1
Sheridan2.7
Chase3.3
Ellis32.2
Cowley30.7
Cherokee33.0
Wabaunsee8.7
Comanche2.1
Logan2.6
Harper6.8
Allen25.0
Lyon38.0
Pottawatomie30.1
Atchison37.9
Norton6.2
Thomas7.4
Hamilton2.5
Osborne3.9
Hodgeman2.0
Trego3.2
Cloud12.6
Brown16.7
Jefferson34.5
Dickinson21.7
Lane2.2
Cheyenne2.6
Wallace1.7
Chautauqua5.3
Kiowa3.4
Haskell6.5
Rice13.0
Morton3.7
Rush4.1
Washington6.2
Nemaha14.3
McPherson33.6
Ness2.5
Grant12.8
Osage22.3
Labette31.3
Edwards4.7
Linn16.1
Morris7.7
Rooks5.5
Barber3.7
Anderson13.5
Decatur3.1
Sherman5.6
Gray6.5
Barton28.5
Clark2.0
Kingman8.7
Scott7.2
Jewell3.2
Wilson15.1
Wichita3.0
Stevens7.2
Graham2.7
Kearny4.6
Gove2.5
Neosho27.8
Smith4.0
Russell7.5
Rawlins2.4
Coffey13.3
Stafford5.1
Elk3.9
Ottawa8.0
Greenwood5.3
Meade4.1
Mitchell8.3
Marion12.5
Ellsworth8.9
Sumner18.9
Pratt12.5
Population Density Classifications in Kansas by County, 2020
State: 35.9Source: Institute for Policy & Social Research, The University of Kansas; data from the U.S. Census Bureau, 2020 Census.
LeavenworthWyandotte
176.7
1,116.1
Population Density by Classification*(persons per square mile)
Frontier (less than 6.0 ppsm)Rural ( 6.0 - 19.9 ppsm)Densely-settled Rural (20.0 - 39.9 ppsm)Semi-Urban (40.0 - 149.9 ppsm)Urban (150.0 or more ppsm)
Montgomery48.9
* Kansas Department of Health and Environment classifications.
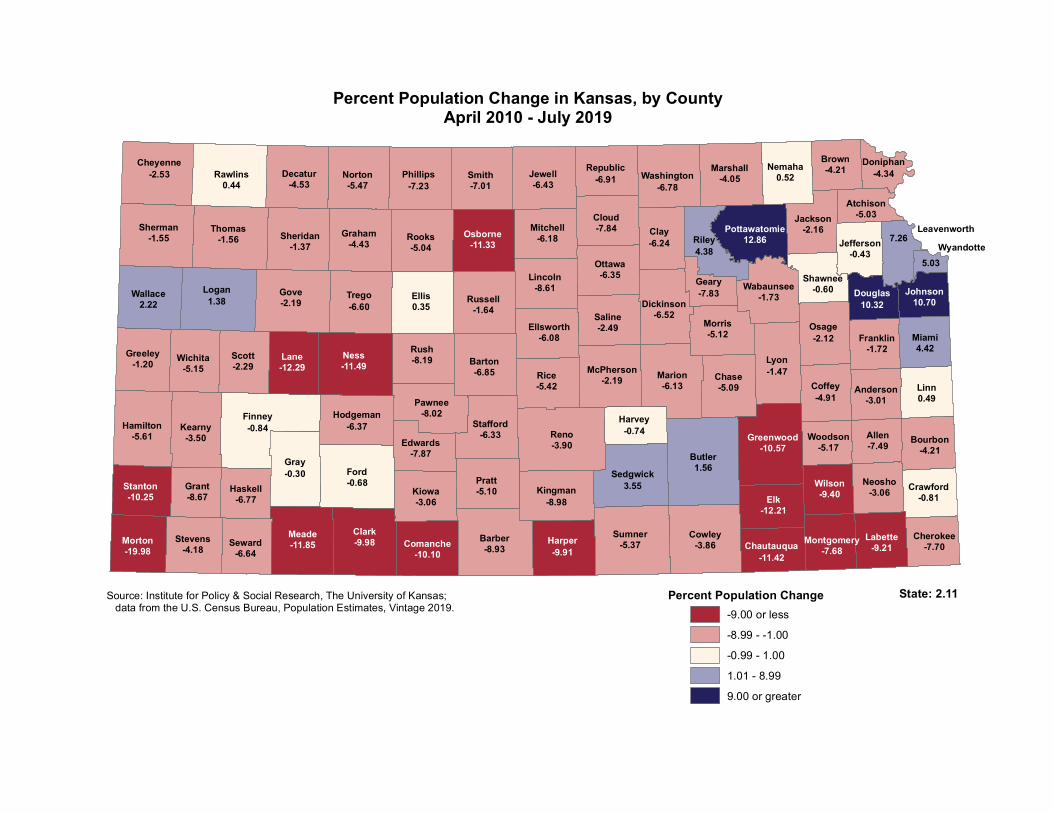
Stanton-10.25
Comanche-10.10
Harper-9.91
Pottawatomie12.86
Johnson10.70
Osborne-11.33
Lane-12.29
Chautauqua-11.42
Morton-19.98
Ness-11.49
Labette-9.21
Clark-9.98
Wilson-9.40Elk
-12.21
Greenwood-10.57
Meade-11.85
Douglas10.32
Greeley-1.20
Franklin-1.72
Phillips-7.23
Jackson-2.16
Pawnee-8.02
Clay-6.24
Bourbon-4.21
Republic-6.91
Doniphan-4.34
Seward-6.64
Ford-0.68
Marshall-4.05
Woodson-5.17
Lincoln-8.61
Finney-0.84
Sheridan-1.37
Chase-5.09
Ellis0.35
Cowley-3.86
Cherokee-7.70
Reno-3.90
Wabaunsee-1.73Logan
1.38
Crawford-0.81
Allen-7.49
Lyon-1.47
Atchison-5.03
Norton-5.47
Thomas-1.56
Hamilton-5.61
Hodgeman-6.37
Trego-6.60
Cloud-7.84
Brown-4.21
Jefferson-0.43
Dickinson-6.52
Butler1.56
Cheyenne-2.53
Wallace2.22
Kiowa-3.06
Haskell-6.77
Rice-5.42
Rush-8.19
Washington-6.78
Nemaha0.52
McPherson-2.19
Grant-8.67
Osage-2.12
Edwards-7.87
Linn0.49
Morris-5.12
Rooks-5.04
Barber-8.93
Anderson-3.01
Decatur-4.53
Sherman-1.55
Gray-0.30
Barton-6.85
Saline-2.49
Kingman-8.98
Harvey-0.74
Geary-7.83
Scott-2.29
Jewell-6.43
Wichita-5.15
Stevens-4.18
Graham-4.43
Kearny-3.50
Gove-2.19
Neosho-3.06
Smith-7.01
Russell-1.64
Rawlins0.44
Shawnee-0.60
Riley4.38
Coffey-4.91
Stafford-6.33
Ottawa-6.35
Sedgwick3.55
Miami4.42
Mitchell-6.18
Marion-6.13
Ellsworth-6.08
Sumner-5.37
Pratt-5.10
Percent Population Change in Kansas, by CountyApril 2010 - July 2019
State: 2.11Source: Institute for Policy & Social Research, The University of Kansas; data from the U.S. Census Bureau, Population Estimates, Vintage 2019.
LeavenworthWyandotte
7.26
5.03
Percent Population Change-9.00 or less-8.99 - -1.00-0.99 - 1.001.01 - 8.999.00 or greater
Montgomery-7.68

County
April 1, 2010
CensusJuly 1, 2012
EstimateJuly 1, 2013
EstimateJuly 1, 2014
EstimateJuly 1, 2015
EstimateJuly 1, 2016
EstimateJuly 1, 2017
EstimateJuly 1, 2018
EstimateJuly 1, 2019
Estimate
April 1, 2020
Census
Percent ChangeApr 2010-Apr 2020
Allen 13,371 13,304 13,065 12,889 12,680 12,667 12,545 12,500 12,404 12,526 -6.32Anderson 8,102 7,925 7,859 7,888 7,826 7,828 7,850 7,858 7,899 7,836 -3.28Atchison 16,924 16,779 16,697 16,534 16,429 16,376 16,319 16,202 16,138 16,348 -3.40Barber 4,861 4,867 4,909 4,881 4,824 4,672 4,569 4,462 4,458 4,228 -13.02Barton 27,674 27,522 27,447 27,339 27,164 26,904 26,427 26,120 25,938 25,493 -7.88Bourbon 15,173 14,877 14,835 14,798 14,734 14,619 14,604 14,538 14,499 14,360 -5.36Brown 9,984 9,869 9,916 9,789 9,710 9,639 9,619 9,592 9,541 9,508 -4.77Butler 65,880 65,692 65,706 65,900 66,293 66,723 66,916 66,887 66,932 67,380 2.28Chase 2,790 2,741 2,688 2,652 2,654 2,631 2,652 2,565 2,585 2,572 -7.81Chautauqua 3,669 3,562 3,532 3,460 3,389 3,361 3,320 3,287 3,203 3,379 -7.90Cherokee 21,603 21,206 20,915 20,785 20,552 20,280 20,151 20,024 19,948 19,362 -10.37Cheyenne 2,726 2,668 2,672 2,687 2,676 2,665 2,682 2,625 2,624 2,616 -4.04Clark 2,215 2,166 2,179 2,115 2,082 2,068 1,996 1,995 2,006 1,991 -10.11Clay 8,535 8,499 8,384 8,298 8,291 8,106 8,003 8,008 8,009 8,117 -4.90Cloud 9,533 9,416 9,355 9,332 9,192 9,088 8,922 8,725 8,779 9,032 -5.26Coffey 8,601 8,470 8,381 8,398 8,294 8,346 8,231 8,212 8,142 8,360 -2.80Comanche 1,891 1,916 1,928 1,950 1,828 1,844 1,763 1,740 1,704 1,689 -10.68Cowley 36,311 36,281 36,186 35,918 35,774 35,662 35,311 35,067 34,784 34,549 -4.85Crawford 39,134 39,333 39,264 39,291 39,166 39,082 38,942 38,884 38,734 38,972 -0.41Decatur 2,961 2,886 2,911 2,900 2,927 2,829 2,866 2,842 2,816 2,764 -6.65Dickinson 19,754 19,708 19,436 19,311 19,214 18,971 18,829 18,621 18,381 18,402 -6.84Doniphan 7,945 7,891 7,876 7,839 7,789 7,713 7,655 7,632 7,584 7,510 -5.48Douglas 110,826 113,360 114,779 116,540 118,265 119,876 120,516 121,327 122,269 118,785 7.18Edwards 3,037 2,968 2,969 3,026 2,955 2,896 2,871 2,806 2,783 2,907 -4.28Elk 2,882 2,662 2,634 2,695 2,572 2,514 2,511 2,470 2,507 2,483 -13.84Ellis 28,452 29,100 29,044 28,983 29,030 28,946 28,755 28,709 28,652 28,934 1.69Ellsworth 6,497 6,469 6,372 6,353 6,311 6,300 6,295 6,156 6,093 6,376 -1.86Finney 36,776 37,106 37,069 37,105 37,127 36,827 36,685 36,473 36,351 38,470 4.61Ford 33,848 34,661 34,872 34,923 34,617 34,446 34,082 33,623 33,346 34,287 1.30Franklin 25,992 25,836 25,747 25,551 25,495 25,546 25,667 25,681 25,618 25,996 0.02Geary 34,362 37,946 36,857 36,530 36,783 35,401 33,935 32,998 31,992 36,739 6.92Gove 2,695 2,762 2,796 2,749 2,700 2,621 2,623 2,612 2,665 2,718 0.85Graham 2,597 2,581 2,588 2,557 2,591 2,558 2,485 2,448 2,441 2,415 -7.01Grant 7,829 7,833 7,843 7,784 7,719 7,660 7,476 7,271 7,136 7,352 -6.09Gray 6,006 5,963 5,979 6,060 6,083 6,043 6,020 6,085 5,996 5,653 -5.88Greeley 1,247 1,268 1,283 1,302 1,302 1,280 1,227 1,229 1,211 1,284 2.97Greenwood 6,689 6,427 6,361 6,290 6,235 6,104 6,068 6,008 6,001 6,016 -10.06Hamilton 2,690 2,648 2,616 2,654 2,563 2,628 2,609 2,584 2,515 2,518 -6.39Harper 6,034 5,862 5,844 5,831 5,785 5,670 5,581 5,500 5,442 5,485 -9.10Harvey 34,684 34,769 34,736 34,621 34,832 34,777 34,436 34,225 34,442 34,024 -1.90Haskell 4,256 4,212 4,124 4,100 4,087 4,026 4,019 3,993 3,987 3,780 -11.18
Population in Kansas, by County, 2010-2020
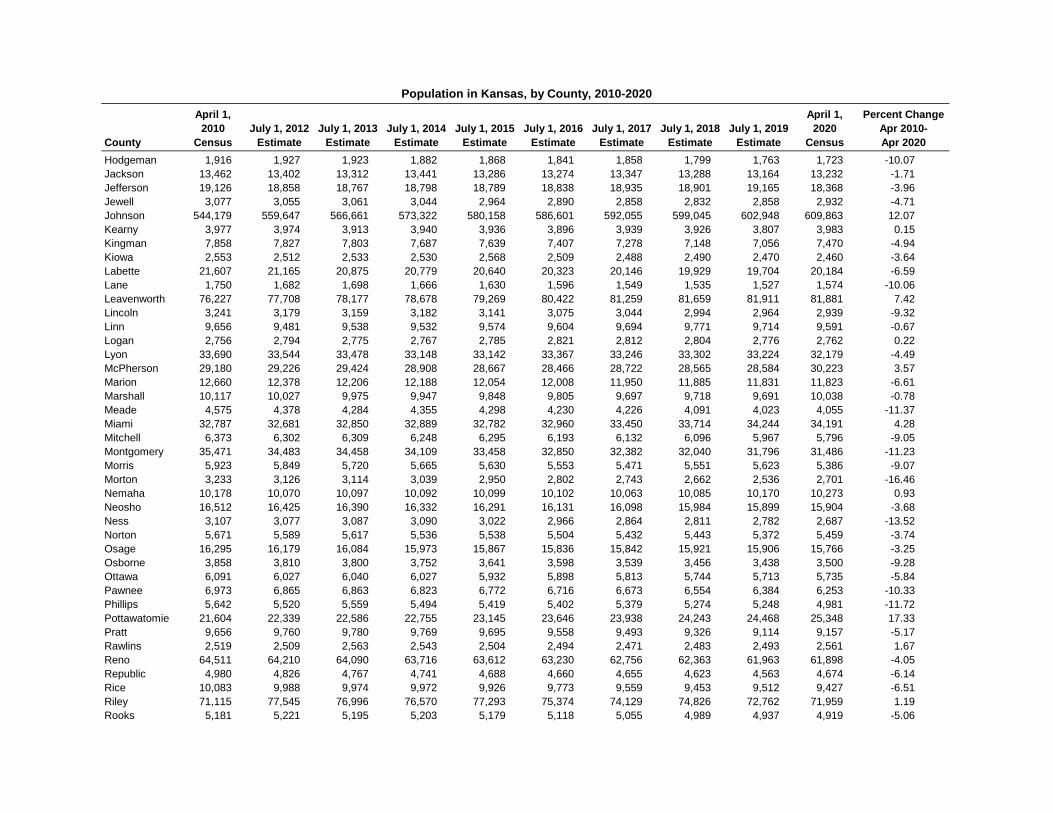
County
April 1, 2010
CensusJuly 1, 2012
EstimateJuly 1, 2013
EstimateJuly 1, 2014
EstimateJuly 1, 2015
EstimateJuly 1, 2016
EstimateJuly 1, 2017
EstimateJuly 1, 2018
EstimateJuly 1, 2019
Estimate
April 1, 2020
Census
Percent ChangeApr 2010-Apr 2020
Population in Kansas, by County, 2010-2020
Hodgeman 1,916 1,927 1,923 1,882 1,868 1,841 1,858 1,799 1,763 1,723 -10.07Jackson 13,462 13,402 13,312 13,441 13,286 13,274 13,347 13,288 13,164 13,232 -1.71Jefferson 19,126 18,858 18,767 18,798 18,789 18,838 18,935 18,901 19,165 18,368 -3.96Jewell 3,077 3,055 3,061 3,044 2,964 2,890 2,858 2,832 2,858 2,932 -4.71Johnson 544,179 559,647 566,661 573,322 580,158 586,601 592,055 599,045 602,948 609,863 12.07Kearny 3,977 3,974 3,913 3,940 3,936 3,896 3,939 3,926 3,807 3,983 0.15Kingman 7,858 7,827 7,803 7,687 7,639 7,407 7,278 7,148 7,056 7,470 -4.94Kiowa 2,553 2,512 2,533 2,530 2,568 2,509 2,488 2,490 2,470 2,460 -3.64Labette 21,607 21,165 20,875 20,779 20,640 20,323 20,146 19,929 19,704 20,184 -6.59Lane 1,750 1,682 1,698 1,666 1,630 1,596 1,549 1,535 1,527 1,574 -10.06Leavenworth 76,227 77,708 78,177 78,678 79,269 80,422 81,259 81,659 81,911 81,881 7.42Lincoln 3,241 3,179 3,159 3,182 3,141 3,075 3,044 2,994 2,964 2,939 -9.32Linn 9,656 9,481 9,538 9,532 9,574 9,604 9,694 9,771 9,714 9,591 -0.67Logan 2,756 2,794 2,775 2,767 2,785 2,821 2,812 2,804 2,776 2,762 0.22Lyon 33,690 33,544 33,478 33,148 33,142 33,367 33,246 33,302 33,224 32,179 -4.49McPherson 29,180 29,226 29,424 28,908 28,667 28,466 28,722 28,565 28,584 30,223 3.57Marion 12,660 12,378 12,206 12,188 12,054 12,008 11,950 11,885 11,831 11,823 -6.61Marshall 10,117 10,027 9,975 9,947 9,848 9,805 9,697 9,718 9,691 10,038 -0.78Meade 4,575 4,378 4,284 4,355 4,298 4,230 4,226 4,091 4,023 4,055 -11.37Miami 32,787 32,681 32,850 32,889 32,782 32,960 33,450 33,714 34,244 34,191 4.28Mitchell 6,373 6,302 6,309 6,248 6,295 6,193 6,132 6,096 5,967 5,796 -9.05Montgomery 35,471 34,483 34,458 34,109 33,458 32,850 32,382 32,040 31,796 31,486 -11.23Morris 5,923 5,849 5,720 5,665 5,630 5,553 5,471 5,551 5,623 5,386 -9.07Morton 3,233 3,126 3,114 3,039 2,950 2,802 2,743 2,662 2,536 2,701 -16.46Nemaha 10,178 10,070 10,097 10,092 10,099 10,102 10,063 10,085 10,170 10,273 0.93Neosho 16,512 16,425 16,390 16,332 16,291 16,131 16,098 15,984 15,899 15,904 -3.68Ness 3,107 3,077 3,087 3,090 3,022 2,966 2,864 2,811 2,782 2,687 -13.52Norton 5,671 5,589 5,617 5,536 5,538 5,504 5,432 5,443 5,372 5,459 -3.74Osage 16,295 16,179 16,084 15,973 15,867 15,836 15,842 15,921 15,906 15,766 -3.25Osborne 3,858 3,810 3,800 3,752 3,641 3,598 3,539 3,456 3,438 3,500 -9.28Ottawa 6,091 6,027 6,040 6,027 5,932 5,898 5,813 5,744 5,713 5,735 -5.84Pawnee 6,973 6,865 6,863 6,823 6,772 6,716 6,673 6,554 6,384 6,253 -10.33Phillips 5,642 5,520 5,559 5,494 5,419 5,402 5,379 5,274 5,248 4,981 -11.72Pottawatomie 21,604 22,339 22,586 22,755 23,145 23,646 23,938 24,243 24,468 25,348 17.33Pratt 9,656 9,760 9,780 9,769 9,695 9,558 9,493 9,326 9,114 9,157 -5.17Rawlins 2,519 2,509 2,563 2,543 2,504 2,494 2,471 2,483 2,493 2,561 1.67Reno 64,511 64,210 64,090 63,716 63,612 63,230 62,756 62,363 61,963 61,898 -4.05Republic 4,980 4,826 4,767 4,741 4,688 4,660 4,655 4,623 4,563 4,674 -6.14Rice 10,083 9,988 9,974 9,972 9,926 9,773 9,559 9,453 9,512 9,427 -6.51Riley 71,115 77,545 76,996 76,570 77,293 75,374 74,129 74,826 72,762 71,959 1.19Rooks 5,181 5,221 5,195 5,203 5,179 5,118 5,055 4,989 4,937 4,919 -5.06

County
April 1, 2010
CensusJuly 1, 2012
EstimateJuly 1, 2013
EstimateJuly 1, 2014
EstimateJuly 1, 2015
EstimateJuly 1, 2016
EstimateJuly 1, 2017
EstimateJuly 1, 2018
EstimateJuly 1, 2019
Estimate
April 1, 2020
Census
Percent ChangeApr 2010-Apr 2020
Population in Kansas, by County, 2010-2020
Rush 3,307 3,208 3,175 3,160 3,097 3,052 3,049 3,037 2,994 2,956 -10.61Russell 6,970 6,989 6,977 7,008 7,045 6,997 6,928 6,885 6,868 6,691 -4.00Saline 55,606 55,841 55,765 55,540 55,463 54,975 54,529 54,351 54,140 54,303 -2.34Scott 4,936 4,856 4,908 4,968 4,950 4,976 4,931 4,918 4,850 5,151 4.36Sedgwick 498,365 504,171 506,542 509,084 511,230 513,324 513,392 513,877 516,579 523,824 5.11Seward 22,952 23,358 23,318 23,308 23,283 22,907 22,239 21,904 21,421 21,964 -4.30Shawnee 177,934 179,013 178,714 178,651 178,789 178,413 178,096 177,224 176,735 178,909 0.55Sheridan 2,556 2,490 2,499 2,501 2,474 2,489 2,526 2,521 2,517 2,447 -4.26Sherman 6,010 6,122 6,094 6,069 5,965 5,960 5,935 5,915 5,932 5,927 -1.38Smith 3,853 3,754 3,700 3,730 3,691 3,657 3,616 3,582 3,571 3,570 -7.34Stafford 4,437 4,350 4,340 4,282 4,217 4,194 4,187 4,119 4,081 4,072 -8.23Stanton 2,235 2,156 2,179 2,143 2,072 2,111 2,056 2,026 1,987 2,084 -6.76Stevens 5,724 5,737 5,806 5,838 5,791 5,655 5,542 5,496 5,405 5,250 -8.28Sumner 24,132 23,632 23,534 23,381 23,414 23,165 23,103 22,982 22,810 22,382 -7.25Thomas 7,900 7,942 7,944 7,849 7,908 7,838 7,824 7,673 7,704 7,930 0.38Trego 3,001 2,939 2,943 2,893 2,904 2,848 2,842 2,782 2,779 2,808 -6.43Wabaunsee 7,053 6,993 7,024 6,936 6,886 6,876 6,827 6,882 6,892 6,877 -2.50Wallace 1,485 1,523 1,560 1,501 1,505 1,499 1,513 1,484 1,518 1,512 1.82Washington 5,799 5,727 5,626 5,610 5,568 5,561 5,475 5,457 5,449 5,530 -4.64Wichita 2,234 2,228 2,192 2,187 2,166 2,133 2,121 2,112 2,118 2,152 -3.67Wilson 9,409 9,121 9,093 8,971 8,847 8,709 8,707 8,668 8,555 8,624 -8.34Woodson 3,309 3,274 3,214 3,186 3,142 3,184 3,127 3,165 3,096 3,115 -5.86Wyandotte 157,505 159,424 161,004 162,325 163,776 164,924 165,254 165,781 166,009 169,245 7.45Kansas 2,853,118 2,886,024 2,894,306 2,901,861 2,910,717 2,912,977 2,910,892 2,912,748 2,912,635 2,937,880 2.97
Source: U.S. Census Bureau, Population Division, https://www.census.gov/programs-surveys/popest/data/tables.html (accessed June 3, 2021); 2020 Census (PL94-171).
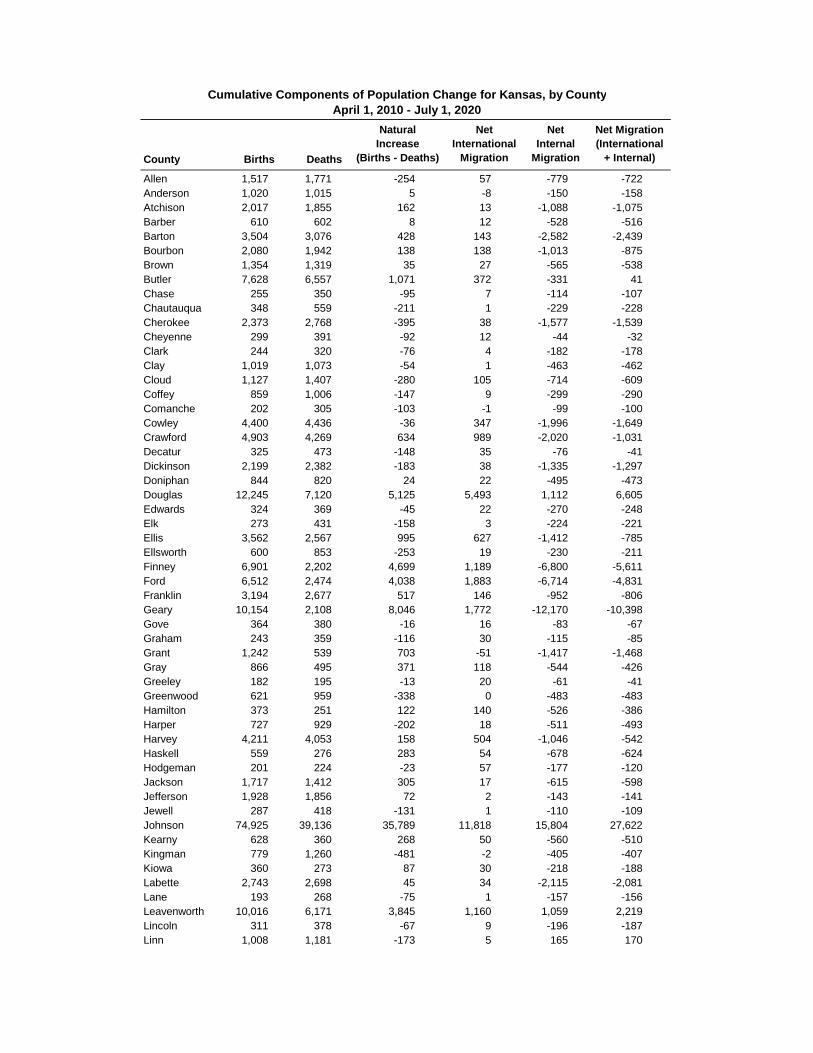
Cumulative Components of Population Change for Kansas, by CountyApril 1, 2010 - July 1, 2020
County Births Deaths
NaturalIncrease
(Births - Deaths)
NetInternational
Migration
NetInternal
Migration
Net Migration(International
+ Internal)
Allen 1,517 1,771 -254 57 -779 -722Anderson 1,020 1,015 5 -8 -150 -158Atchison 2,017 1,855 162 13 -1,088 -1,075Barber 610 602 8 12 -528 -516Barton 3,504 3,076 428 143 -2,582 -2,439Bourbon 2,080 1,942 138 138 -1,013 -875Brown 1,354 1,319 35 27 -565 -538Butler 7,628 6,557 1,071 372 -331 41Chase 255 350 -95 7 -114 -107Chautauqua 348 559 -211 1 -229 -228Cherokee 2,373 2,768 -395 38 -1,577 -1,539Cheyenne 299 391 -92 12 -44 -32Clark 244 320 -76 4 -182 -178Clay 1,019 1,073 -54 1 -463 -462Cloud 1,127 1,407 -280 105 -714 -609Coffey 859 1,006 -147 9 -299 -290Comanche 202 305 -103 -1 -99 -100Cowley 4,400 4,436 -36 347 -1,996 -1,649Crawford 4,903 4,269 634 989 -2,020 -1,031Decatur 325 473 -148 35 -76 -41Dickinson 2,199 2,382 -183 38 -1,335 -1,297Doniphan 844 820 24 22 -495 -473Douglas 12,245 7,120 5,125 5,493 1,112 6,605Edwards 324 369 -45 22 -270 -248Elk 273 431 -158 3 -224 -221Ellis 3,562 2,567 995 627 -1,412 -785Ellsworth 600 853 -253 19 -230 -211Finney 6,901 2,202 4,699 1,189 -6,800 -5,611Ford 6,512 2,474 4,038 1,883 -6,714 -4,831Franklin 3,194 2,677 517 146 -952 -806Geary 10,154 2,108 8,046 1,772 -12,170 -10,398Gove 364 380 -16 16 -83 -67Graham 243 359 -116 30 -115 -85Grant 1,242 539 703 -51 -1,417 -1,468Gray 866 495 371 118 -544 -426Greeley 182 195 -13 20 -61 -41Greenwood 621 959 -338 0 -483 -483Hamilton 373 251 122 140 -526 -386Harper 727 929 -202 18 -511 -493Harvey 4,211 4,053 158 504 -1,046 -542Haskell 559 276 283 54 -678 -624Hodgeman 201 224 -23 57 -177 -120Jackson 1,717 1,412 305 17 -615 -598Jefferson 1,928 1,856 72 2 -143 -141Jewell 287 418 -131 1 -110 -109Johnson 74,925 39,136 35,789 11,818 15,804 27,622Kearny 628 360 268 50 -560 -510Kingman 779 1,260 -481 -2 -405 -407Kiowa 360 273 87 30 -218 -188Labette 2,743 2,698 45 34 -2,115 -2,081Lane 193 268 -75 1 -157 -156Leavenworth 10,016 6,171 3,845 1,160 1,059 2,219Lincoln 311 378 -67 9 -196 -187Linn 1,008 1,181 -173 5 165 170
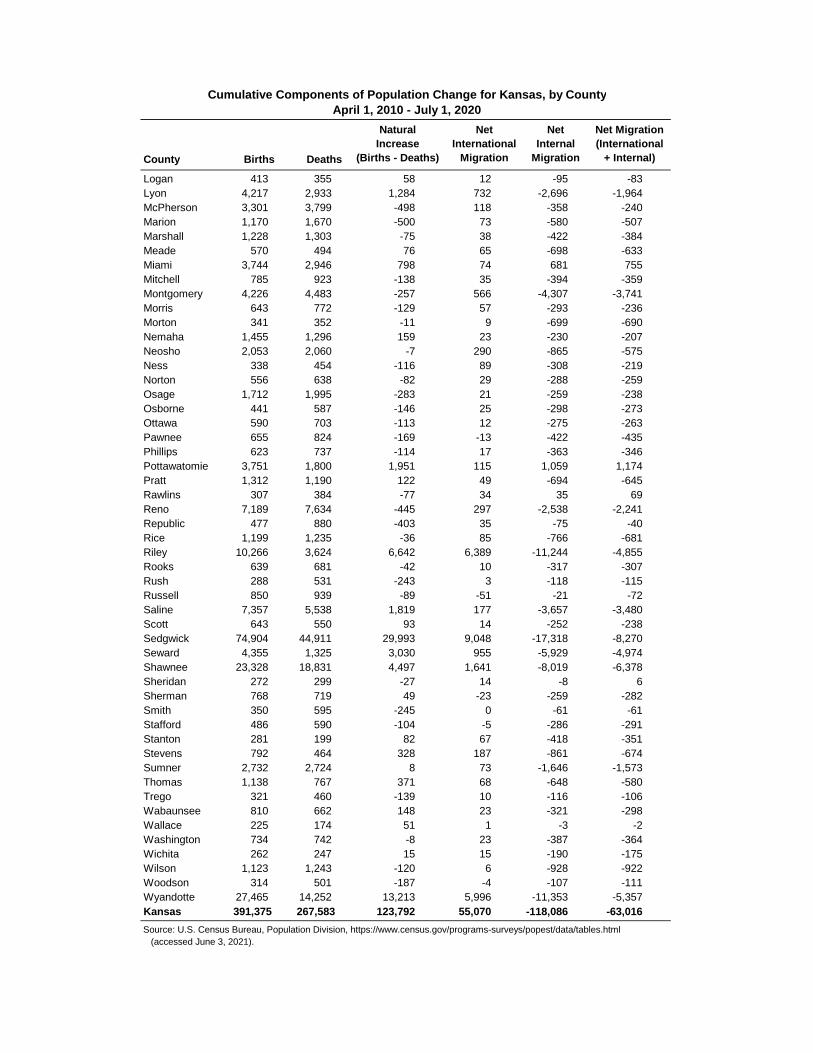
Cumulative Components of Population Change for Kansas, by CountyApril 1, 2010 - July 1, 2020
County Births Deaths
NaturalIncrease
(Births - Deaths)
NetInternational
Migration
NetInternal
Migration
Net Migration(International
+ Internal)
Logan 413 355 58 12 -95 -83Lyon 4,217 2,933 1,284 732 -2,696 -1,964McPherson 3,301 3,799 -498 118 -358 -240Marion 1,170 1,670 -500 73 -580 -507Marshall 1,228 1,303 -75 38 -422 -384Meade 570 494 76 65 -698 -633Miami 3,744 2,946 798 74 681 755Mitchell 785 923 -138 35 -394 -359Montgomery 4,226 4,483 -257 566 -4,307 -3,741Morris 643 772 -129 57 -293 -236Morton 341 352 -11 9 -699 -690Nemaha 1,455 1,296 159 23 -230 -207Neosho 2,053 2,060 -7 290 -865 -575Ness 338 454 -116 89 -308 -219Norton 556 638 -82 29 -288 -259Osage 1,712 1,995 -283 21 -259 -238Osborne 441 587 -146 25 -298 -273Ottawa 590 703 -113 12 -275 -263Pawnee 655 824 -169 -13 -422 -435Phillips 623 737 -114 17 -363 -346Pottawatomie 3,751 1,800 1,951 115 1,059 1,174Pratt 1,312 1,190 122 49 -694 -645Rawlins 307 384 -77 34 35 69Reno 7,189 7,634 -445 297 -2,538 -2,241Republic 477 880 -403 35 -75 -40Rice 1,199 1,235 -36 85 -766 -681Riley 10,266 3,624 6,642 6,389 -11,244 -4,855Rooks 639 681 -42 10 -317 -307Rush 288 531 -243 3 -118 -115Russell 850 939 -89 -51 -21 -72Saline 7,357 5,538 1,819 177 -3,657 -3,480Scott 643 550 93 14 -252 -238Sedgwick 74,904 44,911 29,993 9,048 -17,318 -8,270Seward 4,355 1,325 3,030 955 -5,929 -4,974Shawnee 23,328 18,831 4,497 1,641 -8,019 -6,378Sheridan 272 299 -27 14 -8 6Sherman 768 719 49 -23 -259 -282Smith 350 595 -245 0 -61 -61Stafford 486 590 -104 -5 -286 -291Stanton 281 199 82 67 -418 -351Stevens 792 464 328 187 -861 -674Sumner 2,732 2,724 8 73 -1,646 -1,573Thomas 1,138 767 371 68 -648 -580Trego 321 460 -139 10 -116 -106Wabaunsee 810 662 148 23 -321 -298Wallace 225 174 51 1 -3 -2Washington 734 742 -8 23 -387 -364Wichita 262 247 15 15 -190 -175Wilson 1,123 1,243 -120 6 -928 -922Woodson 314 501 -187 -4 -107 -111Wyandotte 27,465 14,252 13,213 5,996 -11,353 -5,357Kansas 391,375 267,583 123,792 55,070 -118,086 -63,016
Source: U.S. Census Bureau, Population Division, https://www.census.gov/programs-surveys/popest/data/tables.html (accessed June 3, 2021).

Reno35.2
Butler26.6Ford
19.2
Ellis25.5
Finney19.4
Clark39.9
Gray27.8
Lyon25.1
Logan38.7
Rice34.0
Cowley32.5
Pratt38.6
Sumner34.0
Meade35.2
Scott37.6
Thomas30.9
Barton35.2
Norton35.4
Riley13.3
Kearny30.1
Cloud39.1Sherman
34.9
Saline31.4 Osage
36.5
Hamilton25.5
Sedgwick25.0
Ottawa37.4
Grant26.2
Morton40.5
Greeley37.0
Coffey39.0
Miami29.2
Allen36.9
Wichita37.9
Pawnee34.6
Kingman38.3
Stevens30.2
Nemaha37.8
Brown38.4
Labette34.5
Stanton31.6
Seward17.4
Dickinson35.9
Wilson40.8
McPherson35.4
Haskell27.7
Jackson35.0
Harvey35.3
Ellsworth35.2
Neosho36.6
Bourbon37.3Edwards
39.4
Franklin28.7
Wabaunsee37.3
Geary15.0
Crawford25.3
Pottawatomie25.9
Cherokee34.3
Anderson40.6
Jefferson32.3
Douglas18.5
Johnson24.7
Atchison29.5
Shawnee32.5
Montgomery36.3
Doniphan33.4
Ness51.2
Gove47.0
Barber43.0
Elk60.1
Trego49.4
Smith54.5
Clay44.2
Lane43.1
Jewell61.3
Rooks42.3
Marion43.3 Linn
41.8
Rush46.9
Rawlins55.6
Chase47.7
Russell46.1
Phillips46.9
Harper45.4
Wallace47.3
Kiowa41.8
Decatur55.0
Graham54.6
Morris44.6
Marshall41.2
Osborne46.6
Cheyenne52.8
Greenwood47.9
Sheridan45.8
Stafford43.0
Lincoln48.1
Mitchell45.5
Republic54.9
Hodgeman46.3
Washington44.8
Comanche50.3
Chautauqua53.0
Woodson47.2
Older Population Dependency Ratio in Kansas, by County, 2019
Leavenworth24.4
Wyandotte21.0
Source: Institute for Policy & Social Research, The University of Kansas; data from U.S. Census Bureau. Population 65 and Olderper 100 People 18 through 64
13.3 - 21.021.1 - 31.631.7 - 40.840.9 - 50.350.4 - 61.3
Kansas: 27.4United States: 26.9

Pottawatomie64.7
Johnson52.9
Chautauqua-32.8
Geary91.8
Wichita-31.7
Riley32.0
Elk-30.8
Greenwood-30.1
Douglas34.4
Greeley-15.4
Franklin2.5
Phillips-10.0
Jackson9.6
Pawnee-10.5
Clay-4.0
Bourbon-3.5
Republic-26.1
Doniphan-13.3
Seward1.6
Ford12.3
Marshall-11.4
Woodson-22.8
Lincoln-21.6
Finney6.6
Stanton-27.5
Sheridan-15.8
Chase-24.1
Ellis11.5
Cowley-1.8
Cherokee-16.9
Reno-6.3
Wabaunsee-3.9
Comanche3.0
Logan3.6
Harper-9.3
Crawford10.1
Allen-19.4
Lyon-18.1
Atchison-2.1
Norton-7.9
Thomas2.6
Hamilton-7.9
Osborne-15.3
Hodgeman-17.0
Trego-9.2
Cloud-9.2
Brown-11.9
Jefferson-1.4
Dickinson4.6
Lane-29.9
Butler21.3
Cheyenne-15.2
Wallace-12.8
Kiowa-23.4
Haskell-18.2
Rice-7.6
Morton-27.4
Rush-12.6
Washington-7.7
Nemaha5.4
McPherson-2.0
Ness-13.4
Grant-4.8
Osage-11.0
Labette-12.3
Edwards-23.5
Linn-0.4
Morris-11.2
Rooks-8.2
Barber-1.9
Anderson-5.8
Decatur-16.9
Sherman-16.6
Gray8.7
Barton-5.6
Clark-9.9
Saline4.3
Kingman-20.0
Harvey9.8
Scott-3.7
Jewell-28.4
Wilson-19.7
Stevens8.3
Graham-20.7
Kearny-17.4
Gove-13.8
Neosho-6.0
Smith-18.8
Russell4.0
Rawlins-10.7
Shawnee7.4
Coffey-9.7
Stafford-6.5
Ottawa-9.8
Sedgwick20.0
Meade-7.9
Miami22.6
Mitchell-7.1
Marion-15.7
Ellsworth1.4
Sumner-18.9
Pratt13.8
Projected Percent Population Change in Kansas, by County2015 - 2045
State: 18.9Source: Institute for Policy & Social Research, The University of Kansas; data from Wichita State University, Center for Economic Development and Business Research.
Leavenworth26.8
Wyandotte9.5
Percent Population Changeless than -30.0-29.9 - -15.0-14.9 - 15.015.1 - 30.0greater than 30.0
Montgomery-12.7

Reno59,721
Johnson887,279
Butler80,978
Saline58,074
Geary71,019
Shawnee192,019
Riley99,338
Sedgwick613,941
Douglas158,706
Greeley1,125
Franklin26,253
Phillips4,884
Jackson14,616
Pawnee6,122
Clay8,013
Bourbon14,199
Republic3,493
Seward23,515
Ford38,786
Marshall8,808
Woodson2,406
Lincoln2,435
Finney39,551
Stanton1,502
Sheridan2,114
Chase2,033
Ellis32,354
Cowley35,143
Cherokee17,062
Wabaunsee6,682
Comanche1,898
Logan2,926
Harper5,278
Crawford43,196
Allen10,251
Lyon27,309
Pottawatomie38,376
Atchison16,051
Norton5,113
Thomas8,112
Hamilton2,279
Osborne3,119
Hodgeman1,572
Trego2,658
Cloud8,374
Brown8,614
Jefferson18,662
Dickinson20,197
Lane1,170
Cheyenne2,273
Wallace1,323
Chautauqua2,287
Kiowa1,965
Haskell3,325
Rice9,220
Morton2,183
Rush2,735
Washington5,169
Nemaha10,784
McPherson28,369
Ness2,601
Grant7,360
Osage14,112
Labette18,251
Edwards2,269
Linn9,496
Morris5,015
Rooks4,749
Barber4,733
Anderson7,354
Decatur2,437
Sherman4,989
Gray6,667
Barton25,572
Clark1,888
Kingman6,152
Harvey38,508
Scott4,782
Jewell2,128
Wilson7,114
Wichita1,473
Stevens6,285
Graham2,055
Kearny3,267
Gove2,276
Neosho15,364
Smith3,007
Russell7,320
Rawlins2,237
Coffey7,573
Stafford3,959
Elk1,803
Ottawa5,390
Greenwood4,368
Meade3,986
Miami39,902
Mitchell5,836
Marion10,207
Ellsworth6,432
Sumner19,081
Pratt11,028
Projected Population in Kansas, by County, 2045
State: 3,461,265Source: Institute for Policy & Social Research, The University of Kansas; data from Wichita State University, Center for Economic Development and Business Research.
Leavenworth100,604
Wyandotte178,817
Projected Population1,125 - 1,5001,501 - 5,0005,001 - 10,00010,001 - 50,00050,001 - 100,000100,001 - 887,279
Montgomery29,097
Doniphan6,763

County 2015 2020 2025 2030 2035 2040 2045
Allen 12,717 12,459 12,127 11,723 11,289 10,796 10,251 -19.4Anderson 7,808 7,850 7,842 7,771 7,658 7,511 7,354 -5.8Atchison 16,398 16,522 16,563 16,574 16,489 16,302 16,051 -2.1Barber 4,823 4,919 4,964 4,930 4,845 4,775 4,733 -1.9Barton 27,103 27,232 27,186 26,954 26,601 26,144 25,572 -5.6Bourbon 14,712 14,831 14,864 14,827 14,704 14,485 14,199 -3.5Brown 9,776 9,745 9,621 9,433 9,193 8,914 8,614 -11.9Butler 66,741 69,808 72,624 75,296 77,802 79,784 80,978 21.3Chase 2,679 2,598 2,508 2,417 2,307 2,179 2,033 -24.1Chautauqua 3,402 3,258 3,094 2,901 2,692 2,480 2,287 -32.8Cherokee 20,533 20,348 19,999 19,485 18,824 17,992 17,062 -16.9Cheyenne 2,679 2,645 2,608 2,559 2,476 2,365 2,273 -15.2Clark 2,096 2,057 2,030 1,997 1,967 1,931 1,888 -9.9Clay 8,347 8,419 8,452 8,402 8,284 8,147 8,013 -4.0Cloud 9,219 9,202 9,140 9,009 8,833 8,608 8,374 -9.2Coffey 8,384 8,424 8,419 8,354 8,195 7,922 7,573 -9.7Comanche 1,843 1,876 1,893 1,893 1,884 1,890 1,898 3.0Cowley 35,788 36,288 36,605 36,676 36,429 35,911 35,143 -1.8Crawford 39,217 40,266 41,089 41,858 42,412 42,802 43,196 10.1Decatur 2,932 2,908 2,866 2,796 2,690 2,565 2,437 -16.9Dickinson 19,303 19,707 20,021 20,209 20,287 20,287 20,197 4.6Doniphan 7,797 7,721 7,610 7,474 7,284 7,043 6,763 -13.3Douglas 118,053 126,661 132,938 139,977 146,623 152,369 158,706 34.4Edwards 2,968 2,887 2,789 2,676 2,546 2,409 2,269 -23.5Elk 2,605 2,510 2,380 2,230 2,084 1,936 1,803 -30.8Ellis 29,029 29,716 30,363 31,120 31,744 32,051 32,354 11.5Ellsworth 6,343 6,479 6,576 6,609 6,602 6,539 6,432 1.4Finney 37,118 37,923 38,608 39,125 39,440 39,578 39,551 6.6Ford 34,536 35,492 36,332 37,051 37,684 38,272 38,786 12.3Franklin 25,609 26,131 26,533 26,769 26,801 26,628 26,253 2.5Geary 37,030 42,541 47,150 51,719 56,840 63,127 71,019 91.8Gove 2,640 2,618 2,584 2,526 2,456 2,369 2,276 -13.8Graham 2,591 2,546 2,473 2,370 2,259 2,158 2,055 -20.7Grant 7,733 7,703 7,650 7,600 7,558 7,485 7,360 -4.8Gray 6,133 6,277 6,395 6,503 6,598 6,654 6,667 8.7Greeley 1,330 1,310 1,282 1,242 1,203 1,167 1,125 -15.4Greenwood 6,244 6,035 5,769 5,465 5,122 4,746 4,368 -30.1Hamilton 2,474 2,463 2,437 2,399 2,363 2,327 2,279 -7.9Harper 5,817 5,870 5,850 5,736 5,574 5,418 5,278 -9.3Harvey 35,073 35,996 36,798 37,517 38,090 38,442 38,508 9.8Haskell 4,064 3,961 3,850 3,725 3,610 3,480 3,325 -18.2Hodgeman 1,893 1,872 1,852 1,802 1,735 1,660 1,572 -17.0Jackson 13,338 13,755 14,099 14,375 14,551 14,626 14,616 9.6Jefferson 18,930 19,214 19,362 19,376 19,266 19,045 18,662 -1.4Jewell 2,970 2,861 2,752 2,618 2,452 2,279 2,128 -28.4Johnson 580,159 628,444 679,757 733,910 788,849 840,700 887,279 52.9Kearny 3,956 3,892 3,807 3,695 3,557 3,412 3,267 -17.4Kingman 7,687 7,566 7,406 7,168 6,869 6,518 6,152 -20.0Kiowa 2,564 2,428 2,316 2,226 2,137 2,047 1,965 -23.4Labette 20,803 20,766 20,559 20,174 19,643 18,981 18,251 -12.3Lane 1,670 1,610 1,542 1,470 1,378 1,276 1,170 -29.9Leavenworth 79,315 83,755 87,946 91,722 95,059 98,014 100,604 26.8Lincoln 3,105 3,026 2,925 2,809 2,695 2,567 2,435 -21.6Linn 9,536 9,685 9,741 9,746 9,720 9,627 9,496 -0.4
Population Projections for Kansas, by County2015-2045, Selected Years
PercentChange
2015-2045

County 2015 2020 2025 2030 2035 2040 2045
Population Projections for Kansas, by County2015-2045, Selected Years
PercentChange
2015-2045
Logan 2,825 2,896 2,963 2,995 2,990 2,955 2,926 3.6Lyon 33,339 32,526 31,671 30,808 29,716 28,530 27,309 -18.1McPherson 28,941 29,278 29,517 29,639 29,534 29,139 28,369 -2.0Marion 12,103 11,918 11,708 11,447 11,106 10,694 10,207 -15.7Marshall 9,936 9,882 9,746 9,548 9,304 9,060 8,808 -11.4Meade 4,330 4,296 4,282 4,257 4,214 4,124 3,986 -7.9Miami 32,553 34,022 35,326 36,594 37,912 39,079 39,902 22.6Mitchell 6,282 6,310 6,295 6,253 6,163 6,009 5,836 -7.1Montgomery 33,314 33,073 32,586 31,924 31,112 30,161 29,097 -12.7Morris 5,645 5,659 5,628 5,557 5,410 5,224 5,015 -11.2Morton 3,007 2,904 2,768 2,645 2,505 2,359 2,183 -27.4Nemaha 10,227 10,396 10,603 10,765 10,837 10,826 10,784 5.4Neosho 16,346 16,427 16,404 16,256 16,004 15,708 15,364 -6.0Ness 3,005 2,954 2,899 2,842 2,769 2,694 2,601 -13.4Norton 5,550 5,545 5,500 5,431 5,340 5,229 5,113 -7.9Osage 15,847 15,853 15,747 15,522 15,175 14,701 14,112 -11.0Osborne 3,683 3,652 3,615 3,532 3,400 3,259 3,119 -15.3Ottawa 5,975 5,991 5,957 5,858 5,716 5,575 5,390 -9.8Pawnee 6,838 6,861 6,822 6,724 6,570 6,366 6,122 -10.5Phillips 5,428 5,418 5,388 5,303 5,182 5,037 4,884 -10.0Pottawatomie 23,298 25,534 27,844 30,180 32,712 35,460 38,376 64.7Pratt 9,691 10,017 10,299 10,525 10,712 10,889 11,028 13.8Rawlins 2,506 2,510 2,508 2,473 2,409 2,326 2,237 -10.7Reno 63,718 63,949 63,817 63,377 62,610 61,395 59,721 -6.3Republic 4,725 4,581 4,395 4,186 3,958 3,727 3,493 -26.1Rice 9,977 10,023 9,966 9,856 9,680 9,468 9,220 -7.6Riley 75,247 80,983 82,352 85,170 89,592 93,715 99,338 32.0Rooks 5,174 5,188 5,158 5,080 4,977 4,861 4,749 -8.2Rush 3,130 3,110 3,069 3,014 2,946 2,852 2,735 -12.6Russell 7,039 7,213 7,326 7,370 7,357 7,330 7,320 4.0Saline 55,691 56,897 57,847 58,444 58,704 58,575 58,074 4.3Scott 4,964 4,971 4,957 4,918 4,880 4,846 4,782 -3.7Sedgwick 511,574 534,532 555,875 575,450 592,437 605,262 613,941 20.0Seward 23,152 23,345 23,499 23,609 23,649 23,621 23,515 1.6Shawnee 178,725 183,150 186,816 189,782 191,798 192,567 192,019 7.4Sheridan 2,512 2,478 2,416 2,362 2,296 2,219 2,114 -15.8Sherman 5,983 5,905 5,782 5,616 5,425 5,209 4,989 -16.6Smith 3,704 3,630 3,549 3,444 3,326 3,170 3,007 -18.8Stafford 4,236 4,244 4,226 4,200 4,140 4,058 3,959 -6.5Stanton 2,072 1,990 1,890 1,786 1,685 1,594 1,502 -27.5Stevens 5,806 5,914 5,978 6,031 6,113 6,220 6,285 8.3Sumner 23,535 23,158 22,637 21,961 21,128 20,160 19,081 -18.9Thomas 7,904 8,005 8,091 8,175 8,199 8,187 8,112 2.6Trego 2,927 2,966 2,981 2,959 2,885 2,777 2,658 -9.2Wabaunsee 6,951 7,022 7,035 6,987 6,884 6,779 6,682 -3.9Wallace 1,518 1,498 1,477 1,450 1,416 1,374 1,323 -12.8Washington 5,598 5,531 5,493 5,441 5,361 5,256 5,169 -7.7Wichita 2,157 2,042 1,921 1,806 1,692 1,588 1,473 -31.7Wilson 8,856 8,714 8,499 8,232 7,904 7,509 7,114 -19.7Woodson 3,115 3,054 2,953 2,833 2,695 2,550 2,406 -22.8Wyandotte 163,369 167,639 170,891 173,563 175,834 177,551 178,817 9.5Kansas 2,911,641 3,028,726 3,131,917 3,231,168 3,322,617 3,398,563 3,461,265 18.9
Source: Wichita State University, Center for Economic Development and Business Research, https://www.cedbr.org/forecast-blog/county-population (accessed June 21, 2021).

County 2015 2020 2025 2030 2035 2040 2045
Allen 2,484 2,866 3,196 3,362 3,304 3,203 3,062 23.3Anderson 1,666 1,862 2,112 2,305 2,318 2,242 2,147 28.9Atchison 2,691 3,124 3,675 3,995 4,159 4,107 4,038 50.0Barber 972 1,148 1,342 1,426 1,393 1,295 1,225 26.1Barton 4,783 5,674 6,641 7,269 7,275 7,033 6,849 43.2Bourbon 2,734 3,220 3,650 3,931 3,915 3,865 3,776 38.1Brown 1,891 2,250 2,547 2,713 2,696 2,563 2,457 29.9Butler 9,558 12,398 15,496 18,090 19,554 20,271 20,627 115.8Chase 630 702 753 798 763 731 663 5.2Chautauqua 871 897 959 967 906 809 731 -16.1Cherokee 3,705 4,386 5,107 5,646 5,821 5,743 5,520 49.0Cheyenne 728 789 886 899 849 797 732 0.6Clark 442 479 511 534 522 508 496 12.2Clay 1,827 2,118 2,338 2,447 2,438 2,376 2,310 26.4Cloud 1,959 2,150 2,355 2,442 2,436 2,297 2,217 13.2Coffey 1,660 2,062 2,480 2,775 2,844 2,804 2,663 60.4Comanche 456 533 605 644 619 623 614 34.6Cowley 6,162 7,396 8,601 9,532 9,854 9,803 9,606 55.9Crawford 5,858 6,988 8,148 9,002 9,381 9,483 9,419 60.8Decatur 806 913 1,010 1,061 1,047 968 880 9.2Dickinson 3,614 4,209 4,873 5,364 5,483 5,458 5,380 48.9Doniphan 1,392 1,658 1,941 2,067 2,112 2,088 2,036 46.3Douglas 12,708 17,166 21,625 25,841 28,839 30,906 32,883 158.8Edwards 591 684 795 848 827 810 778 31.7Elk 738 783 818 793 741 665 585 -20.7Ellis 4,123 5,109 5,978 6,605 6,831 6,899 6,922 67.9Ellsworth 1,252 1,494 1,723 1,867 1,871 1,845 1,781 42.3Finney 3,619 4,643 5,736 6,759 7,386 7,627 7,774 114.8Ford 3,716 4,502 5,404 6,226 6,892 7,311 7,584 104.1Franklin 4,086 5,101 6,305 7,290 7,665 7,764 7,677 87.9Geary 2,891 3,190 3,453 3,535 3,468 3,453 3,688 27.6Gove 620 668 739 744 700 657 616 -0.6Graham 644 740 810 844 803 726 681 5.7Grant 912 1,124 1,312 1,435 1,474 1,465 1,472 61.4Gray 904 1,128 1,370 1,583 1,692 1,752 1,793 98.3Greeley 277 310 359 395 373 352 334 20.7Greenwood 1,491 1,697 1,884 1,962 1,898 1,771 1,632 9.5Hamilton 308 350 393 473 457 444 449 45.9Harper 1,262 1,463 1,614 1,636 1,603 1,513 1,433 13.5Harvey 6,378 7,682 9,026 10,013 10,428 10,463 10,447 63.8Haskell 501 627 731 797 814 831 817 63.0Hodgeman 456 522 614 657 649 618 577 26.5Jackson 2,413 2,949 3,480 3,952 4,232 4,304 4,291 77.8Jefferson 3,352 4,194 5,056 5,856 6,137 6,163 5,997 78.9Jewell 844 933 962 942 846 731 628 -25.6Johnson 76,022 102,539 131,811 161,413 185,153 203,290 218,760 187.8Kearny 572 695 803 903 925 916 882 54.2Kingman 1,676 1,881 2,166 2,311 2,291 2,176 2,046 22.1Kiowa 486 511 513 490 444 414 372 -23.5Labette 3,845 4,508 5,192 5,768 5,889 5,759 5,497 43.0Lane 387 439 470 478 473 438 392 1.4Leavenworth 10,365 13,596 16,960 19,978 21,857 23,237 24,410 135.5Lincoln 671 772 871 882 849 779 719 7.2Linn 2,004 2,320 2,577 2,829 2,816 2,745 2,702 34.9
Population Projections for Kansas, by County
2015-2045, Selected Years
PercentChange
2015-2045
People Age 65 and Over

County 2015 2020 2025 2030 2035 2040 2045
Population Projections for Kansas, by County
2015-2045, Selected Years
PercentChange
2015-2045
People Age 65 and Over
Logan 552 642 748 812 785 766 738 33.7Lyon 4,708 5,657 6,529 7,017 7,036 6,787 6,415 36.3McPherson 5,645 6,973 8,407 9,523 9,914 10,037 9,912 75.6Marion 2,704 3,092 3,538 3,845 3,834 3,664 3,480 28.7Marshall 2,140 2,419 2,723 2,889 2,790 2,634 2,505 17.0Meade 787 932 1,072 1,170 1,254 1,239 1,196 51.9Miami 5,111 6,559 8,341 10,049 11,181 11,896 12,503 144.6Mitchell 1,433 1,625 1,783 1,876 1,837 1,755 1,651 15.2Montgomery 6,185 7,130 8,021 8,572 8,522 8,166 7,781 25.8Morris 1,357 1,576 1,786 1,942 1,924 1,829 1,725 27.2Morton 555 655 736 810 811 834 811 46.2Nemaha 2,039 2,270 2,598 2,899 2,992 2,988 2,919 43.2Neosho 3,030 3,513 4,041 4,346 4,430 4,335 4,199 38.6Ness 724 832 937 1,001 948 895 805 11.1Norton 1,095 1,197 1,348 1,465 1,492 1,474 1,430 30.6Osage 2,996 3,656 4,369 4,902 4,954 4,920 4,752 58.6Osborne 916 1,029 1,139 1,202 1,160 1,064 991 8.2Ottawa 1,109 1,371 1,598 1,810 1,807 1,807 1,759 58.6Pawnee 1,322 1,589 1,786 1,952 1,961 1,966 1,976 49.5Phillips 1,198 1,409 1,560 1,656 1,621 1,545 1,442 20.4Pottawatomie 3,127 3,955 4,898 5,746 6,208 6,497 7,071 126.1Pratt 1,773 2,166 2,535 2,741 2,747 2,740 2,722 53.5Rawlins 685 781 860 882 847 772 704 2.8Reno 11,676 13,935 16,060 17,507 17,783 17,515 17,020 45.8Republic 1,283 1,429 1,521 1,558 1,473 1,344 1,185 -7.6Rice 1,776 2,125 2,456 2,676 2,660 2,638 2,544 43.3Riley 6,256 7,970 9,723 11,069 11,834 12,382 13,019 108.1Rooks 1,074 1,230 1,423 1,548 1,544 1,485 1,408 31.1Rush 755 896 997 1,065 1,063 1,013 937 24.1Russell 1,571 1,799 2,015 2,180 2,151 2,099 2,012 28.1Saline 8,920 11,012 13,169 14,857 15,826 15,937 15,894 78.2Scott 938 1,109 1,233 1,308 1,334 1,316 1,264 34.7Sedgwick 67,228 86,575 107,452 124,245 134,077 139,525 142,650 112.2Seward 2,098 2,484 2,914 3,298 3,581 3,735 3,736 78.1Shawnee 29,471 37,005 43,881 49,282 51,876 52,619 52,851 79.3Sheridan 577 667 735 787 751 717 670 16.2Sherman 1,155 1,327 1,518 1,616 1,609 1,554 1,495 29.4Smith 988 1,092 1,186 1,261 1,205 1,107 1,030 4.2Stafford 872 1,026 1,158 1,280 1,270 1,215 1,135 30.2Stanton 344 402 446 478 482 470 455 32.4Stevens 760 904 1,070 1,226 1,325 1,359 1,414 86.0Sumner 4,135 4,988 5,892 6,301 6,237 5,953 5,631 36.2Thomas 1,236 1,544 1,815 1,974 1,954 1,968 1,898 53.5Trego 707 844 971 1,050 1,035 1,000 932 31.8Wabaunsee 1,268 1,527 1,822 2,022 1,999 1,961 1,900 49.8Wallace 329 369 421 455 442 412 393 19.6Washington 1,318 1,379 1,444 1,492 1,432 1,338 1,242 -5.7Wichita 383 463 510 524 519 489 458 19.6Wilson 1,814 2,093 2,387 2,454 2,355 2,217 2,108 16.2Woodson 698 792 885 925 894 803 761 9.0Wyandotte 18,586 22,825 27,498 31,186 33,011 34,459 35,647 91.8Kansas 426,410 532,985 644,733 738,103 789,790 817,131 835,245 95.9
Source: Wichita State University, Center for Economic Development and Business Research, https://www.cedbr.org/forecast-blog/county-population (accessed June 21, 2021).

Source: Institute for Policy & Social Research, The University of Kansas; data from U.S. Census Bureau.
0%
10%
20%
30%
40%
50%
60%
70%
80%
90%
100%
1900-10 1910-20 1920-30 1930-40 1940-50 1950-60 1960-70 1970-80 1980-90 1990-2000 2000-10 2010-20
Percentage of PlacesPopulation Change in Kansas Places, by Decade, 1900-2020
Gained 5% or more Changed less than 5% Lost 5% or more
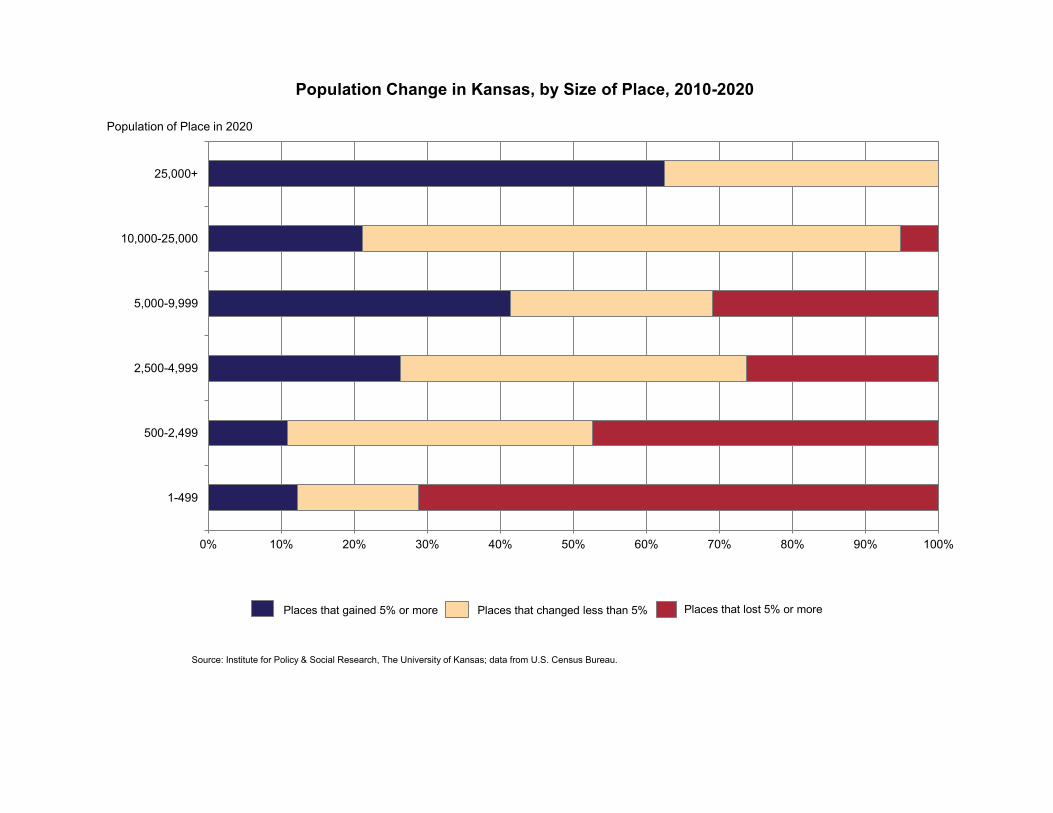
Source: Institute for Policy & Social Research, The University of Kansas; data from U.S. Census Bureau.
0% 10% 20% 30% 40% 50% 60% 70% 80% 90% 100%
1-499
500-2,499
2,500-4,999
5,000-9,999
10,000-25,000
25,000+
Population of Place in 2020
Population Change in Kansas, by Size of Place, 2010-2020
Places that gained 5% or more Places that changed less than 5% Places that lost 5% or more
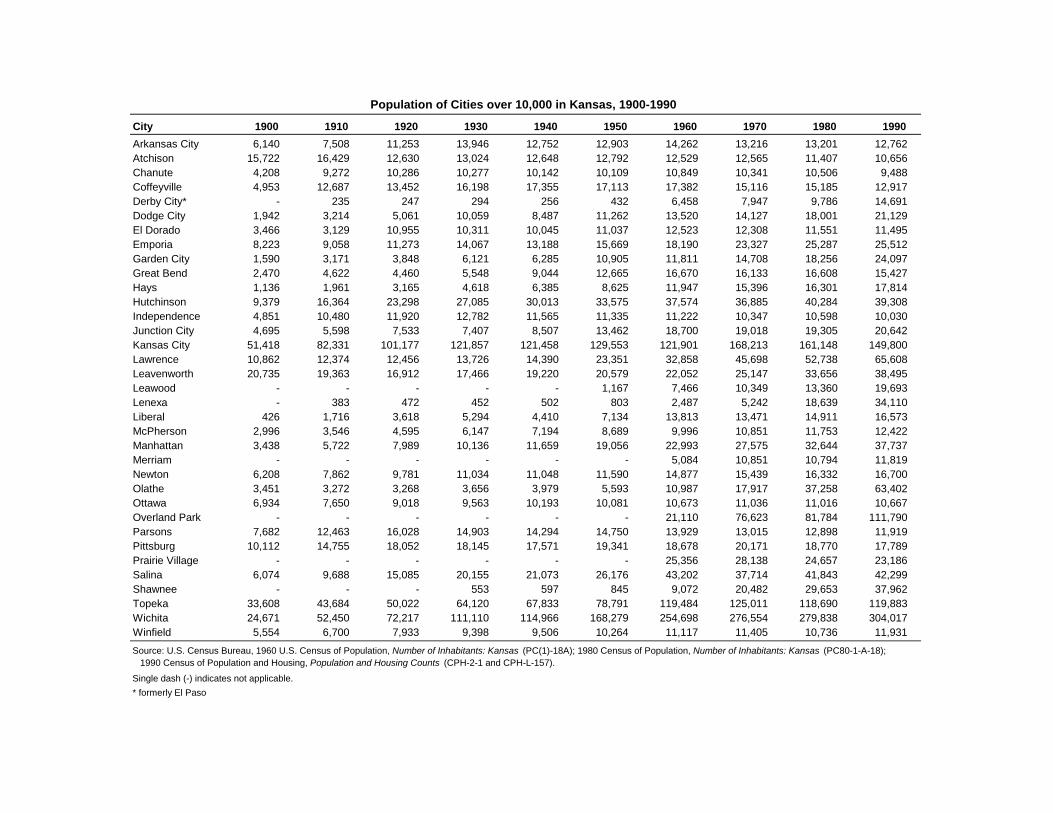
Population of Cities over 10,000 in Kansas, 1900-1990
City 1900 1910 1920 1930 1940 1950 1960 1970 1980 1990
Arkansas City 6,140 7,508 11,253 13,946 12,752 12,903 14,262 13,216 13,201 12,762 Atchison 15,722 16,429 12,630 13,024 12,648 12,792 12,529 12,565 11,407 10,656 Chanute 4,208 9,272 10,286 10,277 10,142 10,109 10,849 10,341 10,506 9,488 Coffeyville 4,953 12,687 13,452 16,198 17,355 17,113 17,382 15,116 15,185 12,917 Derby City* - 235 247 294 256 432 6,458 7,947 9,786 14,691 Dodge City 1,942 3,214 5,061 10,059 8,487 11,262 13,520 14,127 18,001 21,129 El Dorado 3,466 3,129 10,955 10,311 10,045 11,037 12,523 12,308 11,551 11,495 Emporia 8,223 9,058 11,273 14,067 13,188 15,669 18,190 23,327 25,287 25,512 Garden City 1,590 3,171 3,848 6,121 6,285 10,905 11,811 14,708 18,256 24,097 Great Bend 2,470 4,622 4,460 5,548 9,044 12,665 16,670 16,133 16,608 15,427 Hays 1,136 1,961 3,165 4,618 6,385 8,625 11,947 15,396 16,301 17,814 Hutchinson 9,379 16,364 23,298 27,085 30,013 33,575 37,574 36,885 40,284 39,308 Independence 4,851 10,480 11,920 12,782 11,565 11,335 11,222 10,347 10,598 10,030 Junction City 4,695 5,598 7,533 7,407 8,507 13,462 18,700 19,018 19,305 20,642 Kansas City 51,418 82,331 101,177 121,857 121,458 129,553 121,901 168,213 161,148 149,800 Lawrence 10,862 12,374 12,456 13,726 14,390 23,351 32,858 45,698 52,738 65,608 Leavenworth 20,735 19,363 16,912 17,466 19,220 20,579 22,052 25,147 33,656 38,495 Leawood - - - - - 1,167 7,466 10,349 13,360 19,693 Lenexa - 383 472 452 502 803 2,487 5,242 18,639 34,110 Liberal 426 1,716 3,618 5,294 4,410 7,134 13,813 13,471 14,911 16,573 McPherson 2,996 3,546 4,595 6,147 7,194 8,689 9,996 10,851 11,753 12,422 Manhattan 3,438 5,722 7,989 10,136 11,659 19,056 22,993 27,575 32,644 37,737 Merriam - - - - - - 5,084 10,851 10,794 11,819 Newton 6,208 7,862 9,781 11,034 11,048 11,590 14,877 15,439 16,332 16,700 Olathe 3,451 3,272 3,268 3,656 3,979 5,593 10,987 17,917 37,258 63,402 Ottawa 6,934 7,650 9,018 9,563 10,193 10,081 10,673 11,036 11,016 10,667 Overland Park - - - - - - 21,110 76,623 81,784 111,790 Parsons 7,682 12,463 16,028 14,903 14,294 14,750 13,929 13,015 12,898 11,919 Pittsburg 10,112 14,755 18,052 18,145 17,571 19,341 18,678 20,171 18,770 17,789 Prairie Village - - - - - - 25,356 28,138 24,657 23,186 Salina 6,074 9,688 15,085 20,155 21,073 26,176 43,202 37,714 41,843 42,299 Shawnee - - - 553 597 845 9,072 20,482 29,653 37,962 Topeka 33,608 43,684 50,022 64,120 67,833 78,791 119,484 125,011 118,690 119,883 Wichita 24,671 52,450 72,217 111,110 114,966 168,279 254,698 276,554 279,838 304,017 Winfield 5,554 6,700 7,933 9,398 9,506 10,264 11,117 11,405 10,736 11,931
Single dash (-) indicates not applicable.
* formerly El Paso
Source: U.S. Census Bureau, 1960 U.S. Census of Population, Number of Inhabitants: Kansas (PC(1)-18A); 1980 Census of Population, Number of Inhabitants: Kansas (PC80-1-A-18); 1990 Census of Population and Housing, Population and Housing Counts (CPH-2-1 and CPH-L-157).

Population of Cities over 10,000 in KansasApril 1, 2010 - April 1, 2020
City
April 1,2010
Census
July 1,2011
Estimate
July 1,2012
Estimate
July 1,2013
Estimate
July 1,2014
Estimate
July 1,2015
Estimate
July 1,2016
Estimate
July 1,2017
Estimate
July 1,2018
Estimate
July 1,2019
Estimate
April 1,2020
Census
Andover 11,791 11,942 12,075 12,243 12,436 12,650 12,906 13,111 13,290 13,400 14,892 26.30Arkansas City 12,415 12,365 12,330 12,272 12,164 12,096 11,992 11,852 11,744 11,623 11,974 -3.55Atchison 11,021 10,904 10,915 10,862 10,762 10,691 10,655 10,623 10,548 10,505 10,885 -1.23Coffeyville 10,295 10,108 10,008 9,983 9,878 9,694 9,543 9,431 9,339 9,261 8,826 -14.27Derby 22,158 22,734 23,000 23,117 23,283 23,444 23,644 23,661 24,725 24,970 25,625 15.65Dodge City 27,340 27,724 27,972 28,144 28,169 27,919 27,772 27,472 27,114 26,884 27,788 1.64El Dorado 13,021 13,176 13,077 13,014 12,991 13,009 13,031 13,007 12,962 12,949 12,870 -1.16Emporia 24,916 24,909 24,827 24,768 24,517 24,507 24,708 24,618 24,685 24,620 24,139 -3.12Garden City 26,665 26,964 26,947 26,913 26,928 26,936 26,715 26,601 26,441 26,332 28,151 5.57Gardner 19,123 20,011 20,363 20,610 20,769 21,033 21,377 21,567 21,870 22,061 23,287 21.77Great Bend 15,995 16,025 15,921 15,874 15,821 15,757 15,609 15,324 15,187 15,070 14,733 -7.89Hays 20,510 20,776 21,039 21,003 20,997 21,064 21,014 20,888 20,847 20,805 21,116 2.95Haysville 10,826 10,886 10,961 11,021 11,110 11,193 11,259 11,269 11,270 11,345 11,262 4.03Hutchinson 42,080 42,091 41,904 41,767 41,548 41,453 41,252 40,927 40,635 40,366 40,006 -4.93Junction City 23,353 23,969 25,789 25,035 24,816 25,005 24,056 23,047 22,402 21,707 22,932 -1.80Kansas City 145,786 146,251 147,494 148,961 150,192 151,584 152,608 152,888 153,385 153,488 156,607 7.42Lansing 11,265 11,385 11,592 11,653 11,715 11,786 11,902 11,968 12,004 11,967 11,239 -0.23Lawrence 87,643 89,344 90,183 91,429 92,985 94,336 95,859 96,858 97,393 98,239 94,934 8.32Leavenworth 35,251 35,616 35,777 35,878 35,901 35,914 36,220 36,285 36,191 36,027 37,351 5.96Leawood 31,867 32,272 32,543 32,972 34,332 34,570 34,686 34,721 34,782 34,756 33,902 6.39Lenexa 48,190 48,874 49,368 50,302 50,955 52,471 53,076 53,620 55,432 55,672 57,434 19.18Liberal 20,525 20,700 20,909 20,867 20,855 20,838 20,497 19,895 19,601 19,164 19,825 -3.41McPherson 13,155 13,136 13,154 13,255 13,029 13,005 12,991 13,194 13,095 13,084 14,082 7.05Manhattan 52,281 54,170 56,638 56,161 55,757 56,603 55,406 55,254 55,080 54,571 54,100 3.48Merriam 11,003 11,123 11,190 11,266 11,253 11,271 11,269 11,231 11,209 11,089 11,098 0.86Newton 19,132 19,094 19,120 19,075 18,994 19,070 19,022 18,822 18,771 18,874 18,602 -2.77Olathe 125,872 128,332 129,991 131,847 132,904 134,384 136,040 137,678 139,949 140,648 141,290 12.25Ottawa 12,649 12,561 12,523 12,451 12,330 12,280 12,286 12,320 12,302 12,296 12,625 -0.19Overland Park 173,372 176,074 178,752 181,030 184,101 186,371 189,489 191,570 193,018 195,679 197,238 13.77Parsons 10,500 10,391 10,279 10,146 10,093 10,016 9,854 9,764 9,648 9,528 9,600 -8.57Pittsburg 20,233 20,265 20,331 20,353 20,357 20,337 20,266 20,171 20,105 20,010 20,646 2.04Prairie Village 21,447 21,655 21,778 21,884 21,829 21,859 21,859 22,401 22,449 22,314 22,957 7.04Salina 47,707 47,929 47,985 47,928 47,738 47,671 47,236 46,844 46,674 46,475 46,889 -1.71Shawnee 62,209 63,027 63,586 64,280 64,494 65,050 65,443 65,641 66,036 65,864 67,311 8.20Topeka 127,473 128,242 128,123 127,771 127,549 127,468 126,993 126,547 125,731 125,209 126,587 -0.70Wichita 382,368 383,791 385,794 387,278 388,500 389,520 390,691 390,438 389,527 390,335 397,532 3.97Winfield 12,301 12,303 12,328 12,286 12,201 12,150 12,198 12,082 12,002 11,900 11,777 -4.26
July 1 population estimates are revised annually; therefore, previously published July 1 estimate data are not comparable.
Source: U.S. Census Bureau, Population Estimates, https://www.census.gov/programs-surveys/popest/technical-documentation/research/evaluation-estimates/2020-evaluation-estimates/2010s-cities-and -towns-total.html (accessed June 21, 2021); Count Question Resolution (CQR), http://www.census.gov/prod/cen2010/notes/cqr-KS-tb.pdf (accessed May 23, 2014); 2020 Census (PL94-171).
Percent Change
April 2010-April 2020

!
!
!
!
!
!
!
!
!
!
!
!
!
!
!
!
!
!
!
!
!
!
!
!
!
!
!
!
!!
!
!
!
!
!
!
!
!
!
!
!
!
!
!
!
! !!!!!!
!
!
!
!
!
!
!
!
!
!
!
!
!
!
!
!
!
!
!
!
!
!
!
!
!
!!
!
!
!
!
!!
!
!
!
!
!
!
!
!
!
!
!
!
!!
!
!
!
!
!
!
!
!
!
!
!
!
!
!
!
Cheyenne Rawlins JewellSmithDecatur
Phillips
Republic
WashingtonNorton Marshall Nemaha
Brown
Doniphan
Cloud
Jackson
AtchisonSherman Thomas Sheridan Rooks Osborne MitchellGraham Clay Riley Pottawatomie
Jefferson
Ottawa Geary
Lincoln Shawnee
Wabaunsee
LoganWallace Russell
Dickinson
EllisGove Trego
DouglasSalineEllsworth
Morris
OsageLyon
Franklin Miami
Wichita Scott LaneGreeley Ness Rush
Barton
McPherson
Marion
Rice Chase
Coffey
Anderson Linn
FinneyKearnyHamilton Hodgeman StaffordHarveyReno Greenwood
EdwardsButler
Woodson Allen
Bourbon
Gray
Ford SedgwickPrattStanton HaskellGrant Kiowa
NeoshoKingman CrawfordElk
Sumner
CowleyMeade Clark BarberMorton Stevens Seward
Montgomery
Harper
Labette
Comanche CherokeeChautauqua
Wilson
Ada
AmesAsherville
Baileyville
Bala
Bavaria
Beaumont
Beaver
Bendena
Big Bow
Bremen
Bridgeport
Bucyrus
Burdick
Catharine
Centerville
Centropolis
Chicopee
Codell
Crestline
Croweburg
Dennis
Detroit
Devon
Eastshore
Edson
Elyria
Falun
FarlingtonFort Dodge
Fort Riley
Franklin
FurleyGarland
Grantville
Greenwich
Hallowell
HarrisHealy
Herkimer
Hillsdale
Home
Idana
Ionia
Keats
Kelly
Kipp
Lafontaine
Lake City
Levant
Lowell
Ludell
McConnell AFB
Marienthal
Mentor
Mildred
Milton
Mont Ida
Monument
Munjor
Murdock
Navarre
Neal
Newbury
New Salem
Nicodemus
Niles
Norway
Oaklawn-Sunview
Odin
Ogallah
OpolisPeckPiedmont
Pierceville
Pilsen
Piqua
RadleyRingo
Riverton
Rock
RosaliaSt. Marks
Shallow Water
Silverdale
Somerset
SouthMound
Stuttgart
Sycamore
Talmage Tecumseh
Urbana
Vassar
WabaunseeWakarusa
Wayside
Welda
Wells
Weskan
WilroadsGardens
Woodruff
Wright
Yoder
Zeandale
Roxbury
St.Benedict
Williamstown
Yale
Kickapoo Tribal Centerand
Kickapoo Sites 1,2, and 5-7Census Designated Places in Kansas, 2020
Source: Institute for Policy & Social Research, The University of Kansas; U.S. Census Bureau, 2020 Census.Census designated places (CDPs) are statistical geographic entities representing closely settled, unincorporated communities that are locally recognized and identified by name. They are the statistical equivalents of incorporated places, with the primary differences being the lack of a legally defined boundary and an active, functioning governmental structure, chartered by the state and administered by elected officials.
LeavenworthWyandotte
Johnson
Pawnee
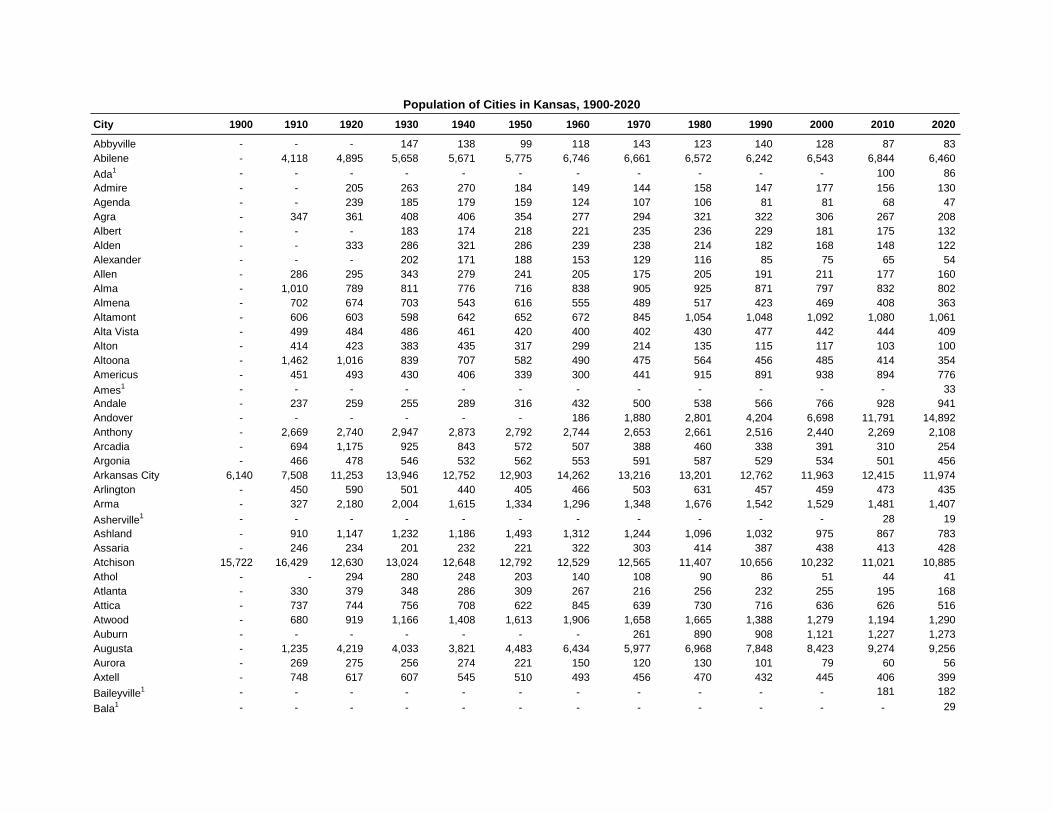
Population of Cities in Kansas, 1900-2020
City 1900 1910 1920 1930 1940 1950 1960 1970 1980 1990 2000 2010 2020
Abbyville - - - 147 138 99 118 143 123 140 128 87 83Abilene - 4,118 4,895 5,658 5,671 5,775 6,746 6,661 6,572 6,242 6,543 6,844 6,460
Ada1 - - - - - - - - - - - 100 86Admire - - 205 263 270 184 149 144 158 147 177 156 130Agenda - - 239 185 179 159 124 107 106 81 81 68 47Agra - 347 361 408 406 354 277 294 321 322 306 267 208Albert - - - 183 174 218 221 235 236 229 181 175 132Alden - - 333 286 321 286 239 238 214 182 168 148 122Alexander - - - 202 171 188 153 129 116 85 75 65 54Allen - 286 295 343 279 241 205 175 205 191 211 177 160Alma - 1,010 789 811 776 716 838 905 925 871 797 832 802Almena - 702 674 703 543 616 555 489 517 423 469 408 363Altamont - 606 603 598 642 652 672 845 1,054 1,048 1,092 1,080 1,061Alta Vista - 499 484 486 461 420 400 402 430 477 442 444 409Alton - 414 423 383 435 317 299 214 135 115 117 103 100Altoona - 1,462 1,016 839 707 582 490 475 564 456 485 414 354Americus - 451 493 430 406 339 300 441 915 891 938 894 776
Ames1 - - - - - - - - - - - - 33Andale - 237 259 255 289 316 432 500 538 566 766 928 941Andover - - - - - - 186 1,880 2,801 4,204 6,698 11,791 14,892Anthony - 2,669 2,740 2,947 2,873 2,792 2,744 2,653 2,661 2,516 2,440 2,269 2,108Arcadia - 694 1,175 925 843 572 507 388 460 338 391 310 254Argonia - 466 478 546 532 562 553 591 587 529 534 501 456Arkansas City 6,140 7,508 11,253 13,946 12,752 12,903 14,262 13,216 13,201 12,762 11,963 12,415 11,974Arlington - 450 590 501 440 405 466 503 631 457 459 473 435Arma - 327 2,180 2,004 1,615 1,334 1,296 1,348 1,676 1,542 1,529 1,481 1,407
Asherville1 - - - - - - - - - - - 28 19Ashland - 910 1,147 1,232 1,186 1,493 1,312 1,244 1,096 1,032 975 867 783Assaria - 246 234 201 232 221 322 303 414 387 438 413 428Atchison 15,722 16,429 12,630 13,024 12,648 12,792 12,529 12,565 11,407 10,656 10,232 11,021 10,885Athol - - 294 280 248 203 140 108 90 86 51 44 41Atlanta - 330 379 348 286 309 267 216 256 232 255 195 168Attica - 737 744 756 708 622 845 639 730 716 636 626 516Atwood - 680 919 1,166 1,408 1,613 1,906 1,658 1,665 1,388 1,279 1,194 1,290Auburn - - - - - - - 261 890 908 1,121 1,227 1,273Augusta - 1,235 4,219 4,033 3,821 4,483 6,434 5,977 6,968 7,848 8,423 9,274 9,256Aurora - 269 275 256 274 221 150 120 130 101 79 60 56Axtell - 748 617 607 545 510 493 456 470 432 445 406 399
Baileyville1 - - - - - - - - - - - 181 182
Bala1 - - - - - - - - - - - - 29

Population of Cities in Kansas, 1900-2020
City 1900 1910 1920 1930 1940 1950 1960 1970 1980 1990 2000 2010 2020
Baldwin City - 1,386 1,137 1,127 1,096 1,741 1,877 2,520 2,829 2,961 3,400 4,515 4,826Barnard - 425 359 416 306 242 205 190 163 129 123 70 64Barnes - 454 395 361 391 308 247 209 257 167 152 159 165Bartlett - 249 222 167 161 143 137 138 163 107 124 80 69Basehor - - - - - - - 724 1,483 1,613 2,238 4,613 6,896Bassett - 415 319 194 124 117 67 62 31 20 22 14 20
Bavaria1 - - - - - - - - - - - - 60Baxter Springs - 1,598 3,608 4,541 4,921 4,647 4,498 4,489 4,773 4,351 4,602 4,238 3,888Bazine - - - 423 465 456 429 386 385 373 311 334 282Beattie - 497 452 434 389 321 314 288 316 221 277 200 197
Beaumont1 - - - - - - - - - - - - 36
Beaver1 - - - - - - - - - - - - 52Bel Aire - - - - - - - - - 3,695 5,836 6,769 8,262Belle Plaine - 849 839 825 878 971 1,579 1,553 1,706 1,649 1,708 1,681 1,467Belleville - 2,224 2,254 2,383 2,580 2,858 2,940 3,063 2,805 2,517 2,239 1,991 2,007Beloit - 3,082 3,315 3,502 3,765 4,085 3,837 4,121 4,367 4,066 4,019 3,835 3,404Belpre - 485 488 382 300 231 211 191 154 116 104 84 97Belvue - - 199 186 226 193 179 161 212 207 228 205 177
Bendena1 - - - - - - - - - - - 117 117Benedict - 215 275 223 213 176 128 91 111 84 103 73 69Bennington - 386 371 374 369 325 535 561 579 568 623 672 622Bentley - - - - - - 204 260 311 360 368 530 560Benton - 240 224 253 235 269 452 517 609 669 827 880 943Bern - - - 306 236 216 206 191 220 190 204 166 161Beverly - 335 344 328 292 255 199 193 171 131 199 162 135
Big Bow1 - - - - - - - - - - - - 32Bird City - 190 489 740 694 784 678 671 546 467 482 447 437Bison - - 357 397 366 326 291 285 279 252 235 255 179Blue Mound - 596 570 545 449 424 319 308 319 251 277 275 219Blue Rapids - 1,756 1,534 1,465 1,433 1,430 1,426 1,148 1,280 1,131 1,088 1,019 928Bluff City - 307 272 233 252 172 152 109 95 69 80 65 45Bogue - - - - 157 211 234 257 197 150 179 143 155Bonner Springs - 1,447 1,599 1,837 1,837 2,277 3,171 3,884 6,266 6,413 6,768 7,314 7,837
Bremen1 - - - - - - - - - - - - 51Brewster - - - 487 408 467 317 320 327 296 285 305 291
Bridgeport1 - - - - - - - - - - - - 64Bronson - 595 590 450 421 415 354 397 414 343 346 323 304Brookville - 280 212 237 221 213 246 238 259 226 259 262 247Brownell - - - 207 162 211 118 98 92 44 48 29 23Bucklin - 696 835 917 832 824 752 771 786 710 725 794 727

Population of Cities in Kansas, 1900-2020
City 1900 1910 1920 1930 1940 1950 1960 1970 1980 1990 2000 2010 2020
Bucyrus1 - - - - - - - - - - - 193 171Buffalo - 807 739 799 555 437 422 321 386 293 284 232 217Buhler - - 486 520 634 750 888 1,019 1,188 1,277 1,358 1,327 1,325Bunker Hill - 242 268 298 253 271 200 181 124 111 101 95 103Burden - 424 441 507 522 541 580 503 518 518 564 535 512Burdett - - - - - - - 285 275 248 256 247 228
Burdick1 - - - - - - - - - - - - 62Burlingame - 1,422 1,330 1,127 1,019 1,065 1,151 999 1,239 1,074 1,017 934 971Burlington - 2,180 2,236 2,273 2,379 2,304 2,113 2,099 2,901 2,735 2,790 2,674 2,634Burns - 489 622 455 409 294 314 268 224 226 268 228 234Burr Oak - 746 638 595 560 505 473 426 366 278 265 174 140Burrton - 689 679 649 842 749 774 808 976 866 932 901 861Bushong - - - 193 135 93 51 39 62 57 55 34 27Bushton - 222 326 325 473 532 499 397 388 341 314 279 203Byers - - 212 185 153 83 52 46 47 46 50 35 38Caldwell - 2,205 2,191 2,046 1,962 2,000 1,788 1,540 1,401 1,351 1,284 1,068 1,025Cambridge - - 233 277 246 221 140 110 113 74 103 82 92
Camp Forsyth1 - - - - - - - 2,334 2,054 1,967 - - -Caney - 3,597 3,427 2,794 2,629 2,876 2,682 2,192 2,284 2,062 2,092 2,203 1,788Canton - 684 700 728 796 771 784 893 926 794 829 748 685Carbondale - 461 383 399 415 453 664 1,041 1,518 1,526 1,478 1,437 1,352Carlton - - - 138 101 76 78 40 49 39 38 42 40Cassoday - - - - - - - 123 122 95 130 129 113
Catharine1 - - - - - - - - - - - 104 113Cawker City - 870 788 739 657 691 686 726 640 588 521 469 457Cedar - - 149 148 144 86 73 46 53 25 26 14 11Cedar Point - - 190 141 140 107 87 73 66 39 53 28 22Cedar Vale - 948 1,044 1,000 952 1,010 859 665 848 760 723 579 476
Centerville1 - - - - - - - - - - - - 78Centralia - 665 619 682 607 574 527 511 486 452 534 512 485
Centropolis1 - - - - - - - - - - - - 100Chanute 4,208 9,272 10,286 10,277 10,142 10,109 10,849 10,341 10,506 9,488 9,411 9,119 8,722Chapman - 781 853 819 782 990 1,095 1,132 1,255 1,264 1,241 1,393 1,377Chase - 263 286 278 825 961 922 800 753 577 490 477 396Chautauqua - 348 401 282 254 215 205 137 156 132 113 111 108Cheney - 734 636 669 714 777 1,101 1,160 1,404 1,560 1,783 2,094 2,181Cherokee - 1,452 1,091 1,158 1,101 849 797 790 775 651 722 714 590Cherryvale - 4,304 4,698 4,251 3,185 2,952 2,783 2,609 2,769 2,464 2,386 2,367 2,192Chetopa - 1,548 1,519 1,344 1,606 1,671 1,538 1,596 1,751 1,357 1,281 1,125 929
Chicopee1 - - - - - - - - - - - 408 422
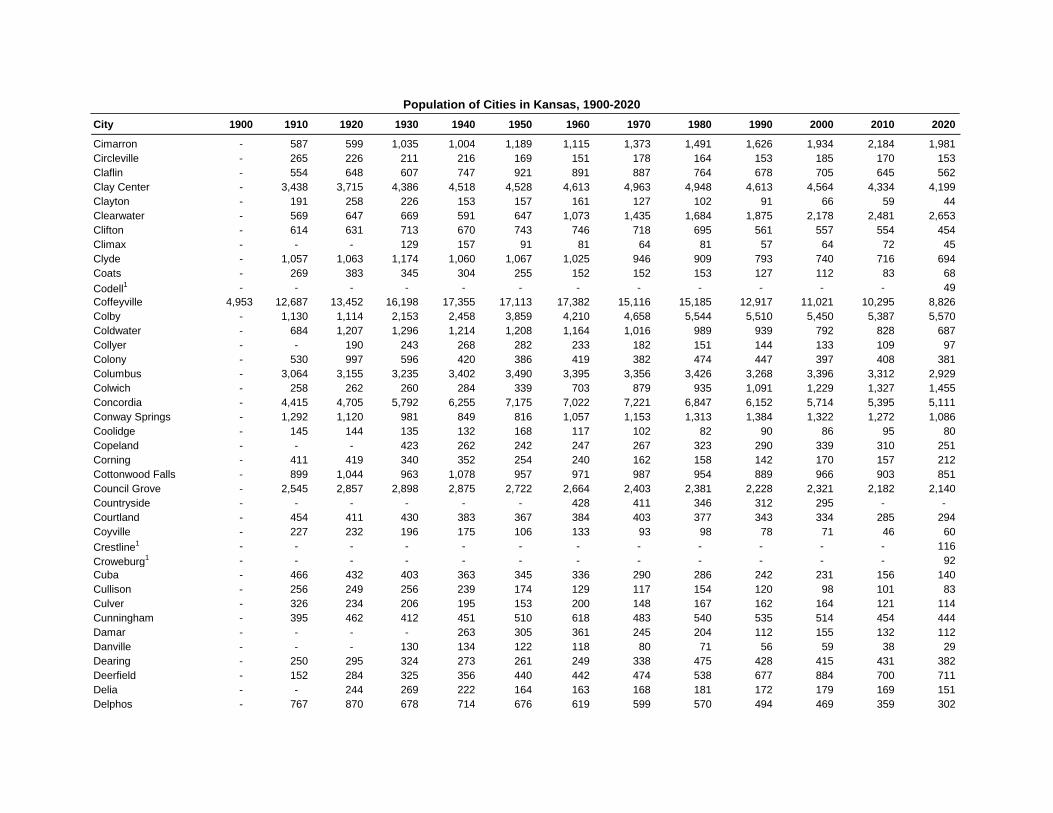
Population of Cities in Kansas, 1900-2020
City 1900 1910 1920 1930 1940 1950 1960 1970 1980 1990 2000 2010 2020
Cimarron - 587 599 1,035 1,004 1,189 1,115 1,373 1,491 1,626 1,934 2,184 1,981Circleville - 265 226 211 216 169 151 178 164 153 185 170 153Claflin - 554 648 607 747 921 891 887 764 678 705 645 562Clay Center - 3,438 3,715 4,386 4,518 4,528 4,613 4,963 4,948 4,613 4,564 4,334 4,199Clayton - 191 258 226 153 157 161 127 102 91 66 59 44Clearwater - 569 647 669 591 647 1,073 1,435 1,684 1,875 2,178 2,481 2,653Clifton - 614 631 713 670 743 746 718 695 561 557 554 454Climax - - - 129 157 91 81 64 81 57 64 72 45Clyde - 1,057 1,063 1,174 1,060 1,067 1,025 946 909 793 740 716 694Coats - 269 383 345 304 255 152 152 153 127 112 83 68
Codell1 - - - - - - - - - - - - 49Coffeyville 4,953 12,687 13,452 16,198 17,355 17,113 17,382 15,116 15,185 12,917 11,021 10,295 8,826Colby - 1,130 1,114 2,153 2,458 3,859 4,210 4,658 5,544 5,510 5,450 5,387 5,570Coldwater - 684 1,207 1,296 1,214 1,208 1,164 1,016 989 939 792 828 687Collyer - - 190 243 268 282 233 182 151 144 133 109 97Colony - 530 997 596 420 386 419 382 474 447 397 408 381Columbus - 3,064 3,155 3,235 3,402 3,490 3,395 3,356 3,426 3,268 3,396 3,312 2,929Colwich - 258 262 260 284 339 703 879 935 1,091 1,229 1,327 1,455Concordia - 4,415 4,705 5,792 6,255 7,175 7,022 7,221 6,847 6,152 5,714 5,395 5,111Conway Springs - 1,292 1,120 981 849 816 1,057 1,153 1,313 1,384 1,322 1,272 1,086Coolidge - 145 144 135 132 168 117 102 82 90 86 95 80Copeland - - - 423 262 242 247 267 323 290 339 310 251Corning - 411 419 340 352 254 240 162 158 142 170 157 212Cottonwood Falls - 899 1,044 963 1,078 957 971 987 954 889 966 903 851Council Grove - 2,545 2,857 2,898 2,875 2,722 2,664 2,403 2,381 2,228 2,321 2,182 2,140Countryside - - - - - - 428 411 346 312 295 - -Courtland - 454 411 430 383 367 384 403 377 343 334 285 294Coyville - 227 232 196 175 106 133 93 98 78 71 46 60
Crestline1 - - - - - - - - - - - - 116
Croweburg1 - - - - - - - - - - - - 92Cuba - 466 432 403 363 345 336 290 286 242 231 156 140Cullison - 256 249 256 239 174 129 117 154 120 98 101 83Culver - 326 234 206 195 153 200 148 167 162 164 121 114Cunningham - 395 462 412 451 510 618 483 540 535 514 454 444Damar - - - - 263 305 361 245 204 112 155 132 112Danville - - - 130 134 122 118 80 71 56 59 38 29Dearing - 250 295 324 273 261 249 338 475 428 415 431 382Deerfield - 152 284 325 356 440 442 474 538 677 884 700 711Delia - - 244 269 222 164 163 168 181 172 179 169 151Delphos - 767 870 678 714 676 619 599 570 494 469 359 302

Population of Cities in Kansas, 1900-2020
City 1900 1910 1920 1930 1940 1950 1960 1970 1980 1990 2000 2010 2020
Denison - 295 240 202 176 166 184 248 231 225 231 187 146
Dennis1 - - - - - - - - - - - - 152Denton - 337 193 193 156 157 161 162 156 166 186 148 130Derby - - - - 256 432 6,458 7,947 9,786 14,691 17,807 22,158 25,625De Soto - 337 345 384 383 518 1,271 1,839 2,061 2,291 4,561 5,720 6,118
Detroit1 - - - - - - - - - - - 114 102
Devon1 - - - - - - - - - - - - 71Dexter - 512 497 484 424 354 291 286 366 320 364 278 224Dighton - 370 503 803 974 1,246 1,526 1,540 1,390 1,361 1,261 1,038 960Dodge City 1,942 3,214 5,061 10,059 8,487 11,262 13,520 14,127 18,001 21,129 25,176 27,340 27,788Doniphan - 134 171 140 - - - - - - - - -Dorrance - 281 299 325 414 365 331 234 220 195 205 185 146Douglass - 657 1,010 804 760 729 1,058 1,126 1,450 1,722 1,813 1,700 1,555Downs - 1,427 1,508 1,383 1,219 1,221 1,206 1,268 1,324 1,119 1,038 900 800Dresden - - - 231 180 162 134 103 84 73 51 41 43Dunlap - 333 300 273 219 134 134 102 82 65 81 30 27Durham - 268 288 254 245 229 183 143 130 119 114 112 89Dwight - 298 246 334 295 281 281 322 320 365 330 272 217Earlton - - 381 166 174 141 104 102 79 69 80 55 60Eastborough - - - - 312 708 1,001 1,141 854 896 826 773 756Easton - 310 228 277 255 255 320 435 460 405 362 253 213
Eastshore1 - - - - - - - - - - - - 92Edgerton - 443 323 278 264 266 414 513 1,214 1,244 1,440 1,671 1,748Edmond - - 213 197 180 110 91 90 56 37 47 49 28Edna - 489 500 502 507 422 442 418 537 438 423 442 388
Edson1 - - - - - - - - - - - - 17Edwardsville - - 203 228 243 274 513 619 3,364 3,979 4,146 4,340 4,717Effingham - 674 616 646 676 525 564 605 634 540 588 546 495Elbing - - 230 110 101 98 105 128 175 184 218 229 226El Dorado 3,466 3,129 10,995 10,311 10,045 11,037 12,523 12,308 10,510 11,495 12,057 13,021 12,870El Paso - 235 247 294 - - - - - - - - -Elgin - - 600 446 336 212 148 115 139 118 82 89 60Elk City - 659 725 607 680 524 498 432 404 334 305 325 260Elk Falls - 271 293 288 294 276 179 124 151 122 112 107 113Elkhart - - 1,160 1,435 902 1,132 1,780 2,089 2,243 2,318 2,233 2,205 1,888Ellinwood - 976 1,103 1,115 2,059 2,569 2,729 2,416 2,508 2,329 2,164 2,131 2,011Ellis - 1,404 1,876 1,957 2,042 2,649 2,218 2,137 2,062 1,814 1,873 2,062 1,958Ellsworth - 2,041 2,065 2,072 2,227 2,193 2,361 2,080 2,465 2,757 2,965 3,120 3,066Elmdale - 253 248 246 239 180 114 102 109 83 50 55 40Elsmore - 216 237 203 180 152 128 116 104 91 73 77 50

Population of Cities in Kansas, 1900-2020
City 1900 1910 1920 1930 1940 1950 1960 1970 1980 1990 2000 2010 2020
Elwood - 636 750 849 1,014 1,020 1,191 1,283 1,275 1,079 1,145 1,224 1,125
Elyria1 - - - - - - - - - - - - 120Emmett - - - 268 191 143 128 156 223 165 277 191 170Emporia 8,223 9,058 11,273 14,067 13,188 15,669 18,190 23,327 25,287 25,512 26,760 24,916 24,139Englewood - 518 466 477 377 341 243 158 111 96 109 77 58Ensign - - - 244 202 227 255 237 209 192 203 187 166Enterprise - 706 975 764 671 795 1,015 868 839 865 836 855 708Erie - 1,300 1,167 1,184 1,286 1,296 1,309 1,414 1,415 1,276 1,211 1,150 1,047Esbon - 347 375 319 292 278 237 206 234 167 148 99 69Eskridge - 797 759 726 648 601 519 589 603 518 589 534 439Eudora - 640 627 599 603 929 1,526 2,071 2,934 3,006 4,307 6,136 6,408Eureka - 2,333 2,606 3,698 3,803 3,958 4,055 3,576 3,425 2,974 2,914 2,633 2,332Everest - 436 403 386 375 363 348 304 331 310 314 284 265
Fairview - 386 386 367 333 336 272 283 258 306 271 260 240Fairway - - - - - 1,816 5,398 5,227 4,619 4,173 3,952 3,882 4,170Fall River - 383 376 339 336 261 226 191 173 113 156 162 131
Falun1 - - - - - - - - - - - 87 83
Farlington1 - - - - - - - - - - - - 68Florence - 1,168 1,517 1,493 1,329 1,009 853 777 729 636 671 465 394Fontana - 246 206 187 174 168 138 160 173 131 149 224 210Ford - 205 272 382 296 244 252 246 272 247 314 216 203Formoso - 453 374 381 293 271 192 180 166 128 129 93 94
Fort Dodge1 - - - - - - - - - - - 165 97
Fort Riley2 - - - - - - - 2,310 2,147 112 103 - -
Fort Riley North1 - - - - - - - 12,469 16,086 12,848 8,114 7,761 9,230Fort Scott - 10,463 10,693 10,763 10,557 10,335 9,410 8,967 8,893 8,362 8,297 8,087 7,552Fowler - 473 490 724 563 778 717 588 592 571 567 590 534Frankfort - 1,426 1,314 1,346 1,243 1,237 1,106 960 1,038 927 855 726 730
Franklin1 - - - - - - - - - - - 375 473Frederick - 151 145 135 84 53 48 39 29 18 11 18 8Fredonia - 3,040 3,954 3,446 3,524 3,257 3,233 3,080 3,047 2,599 2,600 2,482 2,151Freeport - 161 56 105 67 30 31 21 12 10 6 5 -Frontenac - 3,396 3,225 2,085 1,766 1,569 1,713 2,223 2,586 2,628 2,996 3,437 3,382Fulton - 416 411 393 309 243 207 213 194 191 184 163 165
Furley1 - - - - - - - - - - - - 39Galatia - - - 194 150 89 73 78 69 47 61 39 45Galena - 6,096 4,712 4,736 4,375 4,029 3,827 3,712 3,587 3,308 3,287 3,085 2,761Galesburg - 183 205 199 165 189 128 146 181 160 150 126 149Galva - 322 350 358 463 426 442 522 651 651 701 870 834Garden City 1,590 3,171 3,848 6,121 6,285 10,905 11,811 14,790 18,256 24,097 28,451 26,658 28,151

Population of Cities in Kansas, 1900-2020
City 1900 1910 1920 1930 1940 1950 1960 1970 1980 1990 2000 2010 2020
Garden Plain - 296 361 336 323 323 560 678 775 731 797 849 948Gardner - 514 514 493 510 676 1,619 1,839 2,392 4,277 9,396 19,123 23,287Garfield - 333 368 451 335 297 278 261 277 236 198 190 151
Garland1 - - - - - - - - - - - - 31Garnett - 2,334 2,329 2,768 2,607 2,693 3,034 3,169 3,310 3,210 3,368 3,415 3,242Gas - 1,281 367 326 357 294 342 438 543 505 556 564 475Gaylord - 308 356 291 245 231 239 211 203 173 145 114 87Gem - - - 200 125 118 116 80 101 104 96 88 98Geneseo - 566 561 536 632 660 558 453 496 382 272 267 236Geuda Springs - 254 266 340 275 245 223 223 217 219 212 185 158Girard - 2,446 3,161 2,442 2,554 2,426 2,350 2,591 2,888 2,794 2,773 2,789 2,496Glade - - - - - 107 133 180 131 101 114 96 52Glasco - 720 724 707 741 803 812 767 710 556 536 498 441Glen Elder - 565 615 617 555 582 444 422 491 448 439 445 362Goddard - 225 255 255 248 274 533 955 1,427 1,804 2,037 4,344 5,084Goessel - - - - - - 327 386 421 506 565 539 556Goff - 422 398 437 339 315 259 207 196 156 181 126 106Goodland - 1,993 2,664 3,626 3,306 4,690 4,459 5,510 5,708 4,983 4,948 4,489 4,465Gorham - - - - - 375 429 379 355 284 360 334 376Gove City - 196 132 241 284 206 228 172 148 103 105 80 80Grainfield - 309 290 343 341 371 389 374 417 357 327 277 322Grandview Plaza - - - - - - - 734 1,189 1,233 1,184 1,560 1,697
Grantville1 - - - - - - - - - - - 180 182Great Bend 2,470 4,622 4,460 5,548 9,044 12,665 16,670 16,133 16,608 15,427 15,345 15,995 14,733Greeley - 492 496 504 387 436 415 368 405 339 327 302 273Green - 289 297 293 246 219 190 163 155 150 147 128 95Greenleaf - 781 778 660 739 614 562 448 462 353 357 331 350Greensburg - 1,199 1,215 1,338 1,417 1,723 1,988 1,907 1,885 1,792 1,574 777 740
Greenwich1 - - - - - - - - - - - - 64Grenola - 532 547 552 517 380 349 290 335 256 231 216 151Gridley - - 321 434 418 360 321 328 404 356 372 341 313Grinnell - - 162 303 289 364 396 449 410 348 329 259 260Gypsum - 623 732 638 615 523 593 391 423 365 414 405 400Haddam - 408 392 381 384 375 311 289 239 195 169 104 110
Hallowell1 - - - - - - - - - - - - 101Halstead - 1,004 1,163 1,373 1,397 1,328 1,598 1,716 1,994 2,015 1,873 2,085 2,179Hamilton - 325 398 549 519 456 400 349 363 301 334 268 182Hamlin - 208 211 183 174 118 99 95 80 50 53 46 25Hanover - 1,039 947 880 896 854 773 793 802 696 653 682 690Hanston - - - 254 251 286 279 282 257 326 259 206 259

Population of Cities in Kansas, 1900-2020
City 1900 1910 1920 1930 1940 1950 1960 1970 1980 1990 2000 2010 2020
Hardtner - - 385 341 313 373 372 300 336 198 199 172 167Harper - 1,638 1,770 1,485 1,695 1,672 1,899 1,665 1,823 1,735 1,567 1,473 1,313
Harris1 - - - 134 127 84 36 41 80 39 53 51 47Hartford - 589 575 516 491 395 337 478 551 541 500 371 355Harveyville - 331 333 321 302 236 204 279 280 267 267 236 178Havana - 227 318 289 253 215 162 144 169 121 86 104 84Haven - 528 1,301 553 653 720 982 1,146 1,125 1,198 1,175 1,237 1,170Havensville - 412 333 263 232 208 166 163 183 135 146 133 119Haviland - 568 607 641 499 606 725 705 770 624 612 701 678Hays 1,136 1,961 3,165 4,618 6,385 8,625 11,947 15,396 16,301 17,814 20,013 20,510 21,116Haysville - - - - - - 5,836 6,531 8,006 8,364 8,502 10,826 11,262Hazelton - 315 281 299 260 250 246 176 143 128 144 93 82
Healy1 - - - - - - - - - - - 234 195Hepler - 276 241 210 259 224 178 152 165 150 154 132 90Herington - 3,273 4,065 4,519 3,804 3,775 3,702 3,165 2,930 2,685 2,563 2,526 2,109
Herkimer1 - - - - - - - - - - - - 54Herndon - 273 411 430 448 321 339 268 220 170 149 129 119Hesston - - - 526 403 686 1,103 1,926 3,013 3,012 3,509 3,709 3,505Hiawatha - 2,974 3,222 3,302 3,238 3,294 3,391 3,365 3,702 3,603 3,417 3,172 3,280Highland - 763 809 788 764 717 755 899 954 942 976 1,012 903Hill City - 983 732 1,027 1,115 1,432 2,421 2,071 2,028 1,835 1,604 1,474 1,403Hillsboro - 1,134 1,451 1,458 1,580 2,150 2,441 2,730 2,717 2,704 2,854 2,993 2,732
Hillsdale1 - - - 214 - - - - - - - 229 247Hoisington - 1,975 2,395 3,001 3,719 4,012 4,248 3,710 3,678 3,182 2,975 2,706 2,699Holcomb - - - - - - - 272 816 1,400 2,026 2,094 2,245Hollenberg - - - - 128 97 55 47 57 28 31 21 10Holmdel Gardens - - - - - 1,248 1,436 - - - - - -Holton - 2,842 2,703 2,705 2,885 2,705 3,028 3,063 3,132 3,196 3,353 3,329 3,401Holyrood - 361 421 432 559 748 737 593 567 492 464 447 403
Home1 - - - - - - - - - - - 160 154Hope - 567 589 556 500 480 463 438 468 404 372 368 317Horace - 189 212 230 234 258 195 137 137 168 143 70 102Horton - 3,600 4,009 4,049 2,872 2,354 2,361 2,177 2,130 1,885 1,967 1,776 1,523Howard - 1,163 1,060 1,069 1,170 1,149 1,017 918 965 815 808 687 570Hoxie - 532 616 800 957 1,157 1,289 1,419 1,462 1,342 1,244 1,201 1,211Hoyt - - 282 228 238 246 283 420 536 489 571 669 593Hudson - 253 235 197 221 194 201 181 157 159 133 129 95Hugoton - 105 644 1,368 1,349 2,781 2,912 2,739 3,165 3,179 3,708 3,904 3,747Humboldt - 2,548 2,525 2,558 2,290 2,308 2,285 2,249 2,230 2,178 1,999 1,953 1,847Hunnewell - 208 209 205 166 103 83 77 86 87 83 67 44
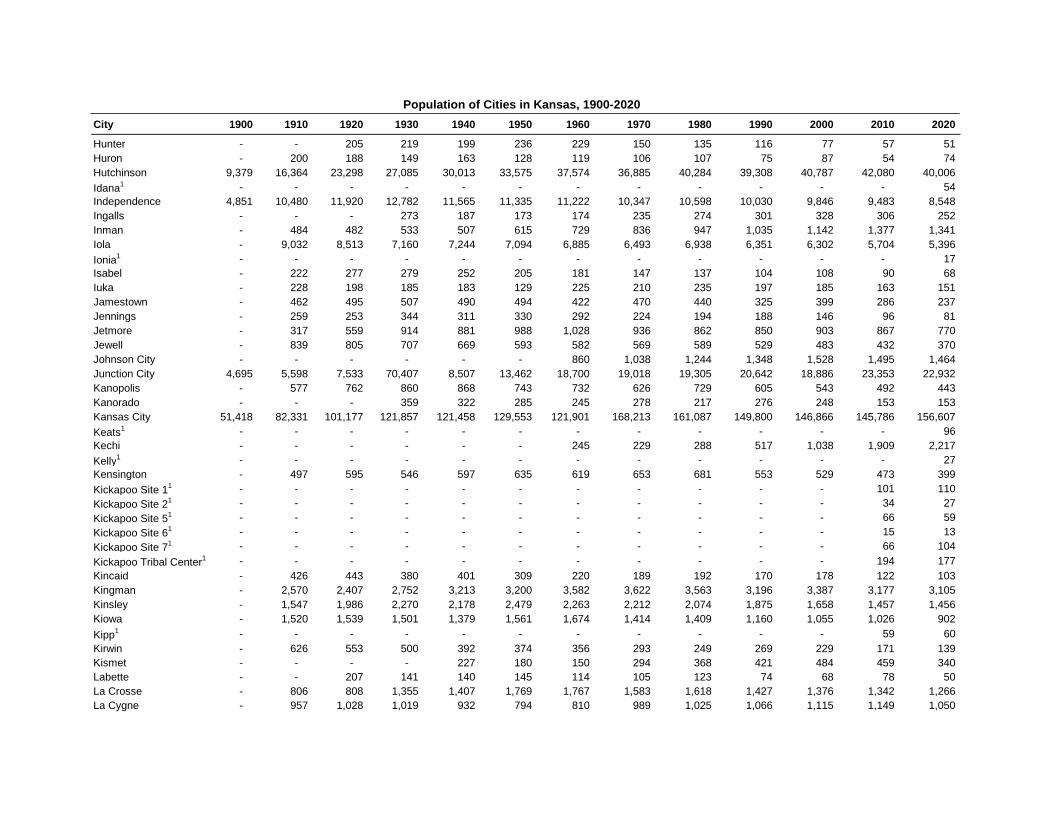
Population of Cities in Kansas, 1900-2020
City 1900 1910 1920 1930 1940 1950 1960 1970 1980 1990 2000 2010 2020
Hunter - - 205 219 199 236 229 150 135 116 77 57 51Huron - 200 188 149 163 128 119 106 107 75 87 54 74Hutchinson 9,379 16,364 23,298 27,085 30,013 33,575 37,574 36,885 40,284 39,308 40,787 42,080 40,006
Idana1 - - - - - - - - - - - - 54Independence 4,851 10,480 11,920 12,782 11,565 11,335 11,222 10,347 10,598 10,030 9,846 9,483 8,548Ingalls - - - 273 187 173 174 235 274 301 328 306 252Inman - 484 482 533 507 615 729 836 947 1,035 1,142 1,377 1,341Iola - 9,032 8,513 7,160 7,244 7,094 6,885 6,493 6,938 6,351 6,302 5,704 5,396
Ionia1 - - - - - - - - - - - - 17Isabel - 222 277 279 252 205 181 147 137 104 108 90 68Iuka - 228 198 185 183 129 225 210 235 197 185 163 151Jamestown - 462 495 507 490 494 422 470 440 325 399 286 237Jennings - 259 253 344 311 330 292 224 194 188 146 96 81Jetmore - 317 559 914 881 988 1,028 936 862 850 903 867 770Jewell - 839 805 707 669 593 582 569 589 529 483 432 370Johnson City - - - - - - 860 1,038 1,244 1,348 1,528 1,495 1,464Junction City 4,695 5,598 7,533 70,407 8,507 13,462 18,700 19,018 19,305 20,642 18,886 23,353 22,932Kanopolis - 577 762 860 868 743 732 626 729 605 543 492 443Kanorado - - - 359 322 285 245 278 217 276 248 153 153Kansas City 51,418 82,331 101,177 121,857 121,458 129,553 121,901 168,213 161,087 149,800 146,866 145,786 156,607
Keats1 - - - - - - - - - - - - 96Kechi - - - - - - 245 229 288 517 1,038 1,909 2,217
Kelly1 - - - - - - - - - - - - 27Kensington - 497 595 546 597 635 619 653 681 553 529 473 399
Kickapoo Site 11 - - - - - - - - - - - 101 110
Kickapoo Site 21 - - - - - - - - - - - 34 27
Kickapoo Site 51 - - - - - - - - - - - 66 59
Kickapoo Site 61 - - - - - - - - - - - 15 13
Kickapoo Site 71 - - - - - - - - - - - 66 104
Kickapoo Tribal Center1 - - - - - - - - - - - 194 177Kincaid - 426 443 380 401 309 220 189 192 170 178 122 103Kingman - 2,570 2,407 2,752 3,213 3,200 3,582 3,622 3,563 3,196 3,387 3,177 3,105Kinsley - 1,547 1,986 2,270 2,178 2,479 2,263 2,212 2,074 1,875 1,658 1,457 1,456Kiowa - 1,520 1,539 1,501 1,379 1,561 1,674 1,414 1,409 1,160 1,055 1,026 902
Kipp1 - - - - - - - - - - - 59 60Kirwin - 626 553 500 392 374 356 293 249 269 229 171 139Kismet - - - - 227 180 150 294 368 421 484 459 340Labette - - 207 141 140 145 114 105 123 74 68 78 50La Crosse - 806 808 1,355 1,407 1,769 1,767 1,583 1,618 1,427 1,376 1,342 1,266La Cygne - 957 1,028 1,019 932 794 810 989 1,025 1,066 1,115 1,149 1,050
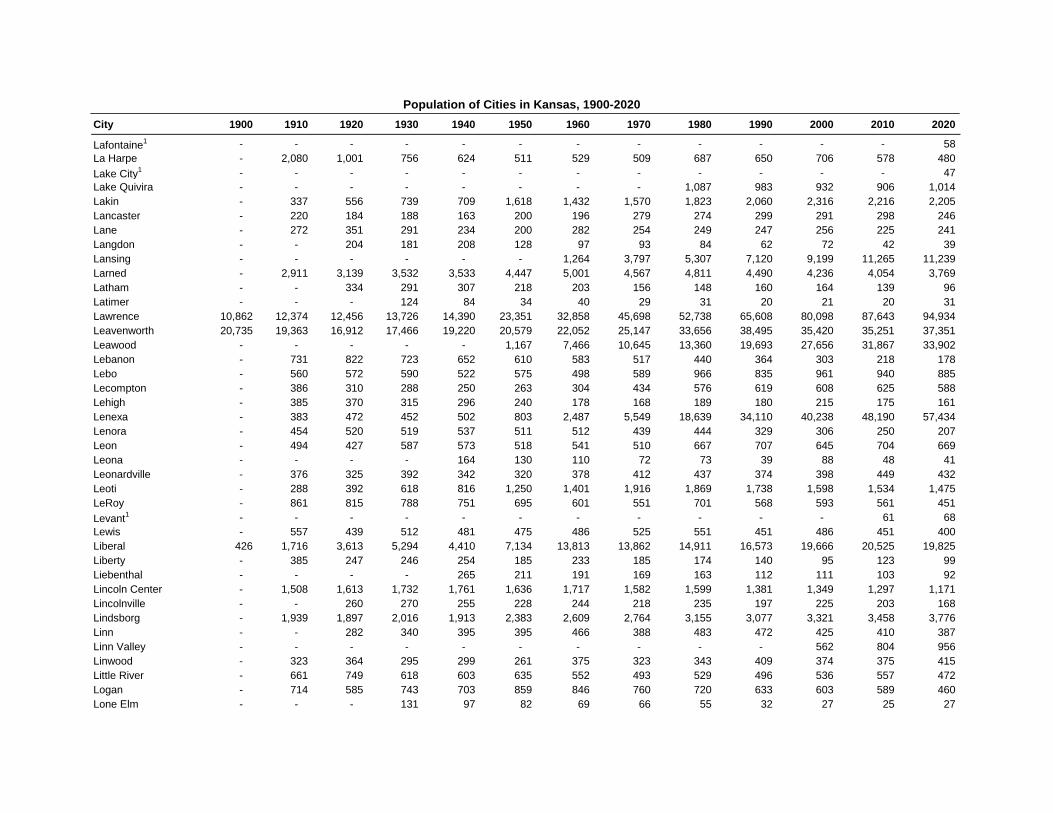
Population of Cities in Kansas, 1900-2020
City 1900 1910 1920 1930 1940 1950 1960 1970 1980 1990 2000 2010 2020
Lafontaine1 - - - - - - - - - - - - 58La Harpe - 2,080 1,001 756 624 511 529 509 687 650 706 578 480
Lake City1 - - - - - - - - - - - - 47Lake Quivira - - - - - - - - 1,087 983 932 906 1,014Lakin - 337 556 739 709 1,618 1,432 1,570 1,823 2,060 2,316 2,216 2,205Lancaster - 220 184 188 163 200 196 279 274 299 291 298 246Lane - 272 351 291 234 200 282 254 249 247 256 225 241Langdon - - 204 181 208 128 97 93 84 62 72 42 39Lansing - - - - - - 1,264 3,797 5,307 7,120 9,199 11,265 11,239Larned - 2,911 3,139 3,532 3,533 4,447 5,001 4,567 4,811 4,490 4,236 4,054 3,769Latham - - 334 291 307 218 203 156 148 160 164 139 96Latimer - - - 124 84 34 40 29 31 20 21 20 31Lawrence 10,862 12,374 12,456 13,726 14,390 23,351 32,858 45,698 52,738 65,608 80,098 87,643 94,934Leavenworth 20,735 19,363 16,912 17,466 19,220 20,579 22,052 25,147 33,656 38,495 35,420 35,251 37,351Leawood - - - - - 1,167 7,466 10,645 13,360 19,693 27,656 31,867 33,902Lebanon - 731 822 723 652 610 583 517 440 364 303 218 178Lebo - 560 572 590 522 575 498 589 966 835 961 940 885Lecompton - 386 310 288 250 263 304 434 576 619 608 625 588Lehigh - 385 370 315 296 240 178 168 189 180 215 175 161Lenexa - 383 472 452 502 803 2,487 5,549 18,639 34,110 40,238 48,190 57,434Lenora - 454 520 519 537 511 512 439 444 329 306 250 207Leon - 494 427 587 573 518 541 510 667 707 645 704 669Leona - - - - 164 130 110 72 73 39 88 48 41Leonardville - 376 325 392 342 320 378 412 437 374 398 449 432Leoti - 288 392 618 816 1,250 1,401 1,916 1,869 1,738 1,598 1,534 1,475LeRoy - 861 815 788 751 695 601 551 701 568 593 561 451
Levant1 - - - - - - - - - - - 61 68Lewis - 557 439 512 481 475 486 525 551 451 486 451 400Liberal 426 1,716 3,613 5,294 4,410 7,134 13,813 13,862 14,911 16,573 19,666 20,525 19,825Liberty - 385 247 246 254 185 233 185 174 140 95 123 99Liebenthal - - - - 265 211 191 169 163 112 111 103 92Lincoln Center - 1,508 1,613 1,732 1,761 1,636 1,717 1,582 1,599 1,381 1,349 1,297 1,171Lincolnville - - 260 270 255 228 244 218 235 197 225 203 168Lindsborg - 1,939 1,897 2,016 1,913 2,383 2,609 2,764 3,155 3,077 3,321 3,458 3,776Linn - - 282 340 395 395 466 388 483 472 425 410 387Linn Valley - - - - - - - - - - 562 804 956Linwood - 323 364 295 299 261 375 323 343 409 374 375 415Little River - 661 749 618 603 635 552 493 529 496 536 557 472Logan - 714 585 743 703 859 846 760 720 633 603 589 460Lone Elm - - - 131 97 82 69 66 55 32 27 25 27
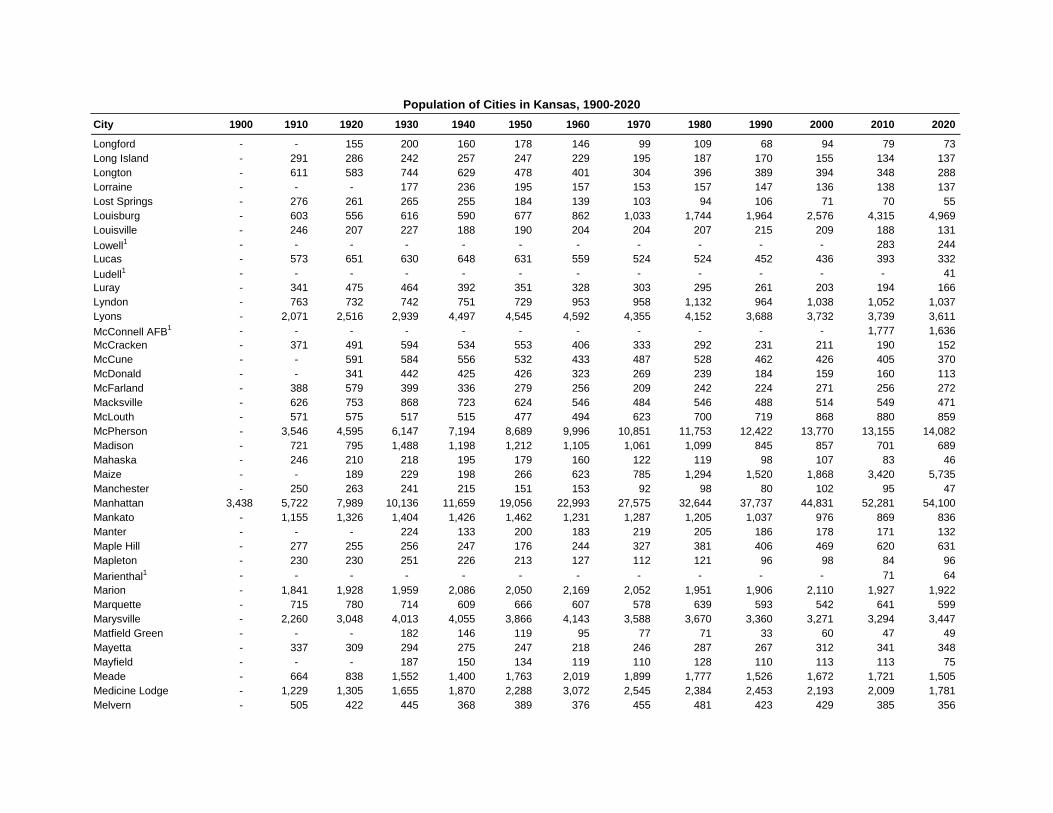
Population of Cities in Kansas, 1900-2020
City 1900 1910 1920 1930 1940 1950 1960 1970 1980 1990 2000 2010 2020
Longford - - 155 200 160 178 146 99 109 68 94 79 73Long Island - 291 286 242 257 247 229 195 187 170 155 134 137Longton - 611 583 744 629 478 401 304 396 389 394 348 288Lorraine - - - 177 236 195 157 153 157 147 136 138 137Lost Springs - 276 261 265 255 184 139 103 94 106 71 70 55Louisburg - 603 556 616 590 677 862 1,033 1,744 1,964 2,576 4,315 4,969Louisville - 246 207 227 188 190 204 204 207 215 209 188 131
Lowell1 - - - - - - - - - - - 283 244Lucas - 573 651 630 648 631 559 524 524 452 436 393 332
Ludell1 - - - - - - - - - - - - 41Luray - 341 475 464 392 351 328 303 295 261 203 194 166Lyndon - 763 732 742 751 729 953 958 1,132 964 1,038 1,052 1,037Lyons - 2,071 2,516 2,939 4,497 4,545 4,592 4,355 4,152 3,688 3,732 3,739 3,611
McConnell AFB1 - - - - - - - - - - - 1,777 1,636McCracken - 371 491 594 534 553 406 333 292 231 211 190 152McCune - - 591 584 556 532 433 487 528 462 426 405 370McDonald - - 341 442 425 426 323 269 239 184 159 160 113McFarland - 388 579 399 336 279 256 209 242 224 271 256 272Macksville - 626 753 868 723 624 546 484 546 488 514 549 471McLouth - 571 575 517 515 477 494 623 700 719 868 880 859McPherson - 3,546 4,595 6,147 7,194 8,689 9,996 10,851 11,753 12,422 13,770 13,155 14,082Madison - 721 795 1,488 1,198 1,212 1,105 1,061 1,099 845 857 701 689Mahaska - 246 210 218 195 179 160 122 119 98 107 83 46Maize - - 189 229 198 266 623 785 1,294 1,520 1,868 3,420 5,735Manchester - 250 263 241 215 151 153 92 98 80 102 95 47Manhattan 3,438 5,722 7,989 10,136 11,659 19,056 22,993 27,575 32,644 37,737 44,831 52,281 54,100Mankato - 1,155 1,326 1,404 1,426 1,462 1,231 1,287 1,205 1,037 976 869 836Manter - - - 224 133 200 183 219 205 186 178 171 132Maple Hill - 277 255 256 247 176 244 327 381 406 469 620 631Mapleton - 230 230 251 226 213 127 112 121 96 98 84 96
Marienthal1 - - - - - - - - - - - 71 64Marion - 1,841 1,928 1,959 2,086 2,050 2,169 2,052 1,951 1,906 2,110 1,927 1,922Marquette - 715 780 714 609 666 607 578 639 593 542 641 599Marysville - 2,260 3,048 4,013 4,055 3,866 4,143 3,588 3,670 3,360 3,271 3,294 3,447Matfield Green - - - 182 146 119 95 77 71 33 60 47 49Mayetta - 337 309 294 275 247 218 246 287 267 312 341 348Mayfield - - - 187 150 134 119 110 128 110 113 113 75Meade - 664 838 1,552 1,400 1,763 2,019 1,899 1,777 1,526 1,672 1,721 1,505Medicine Lodge - 1,229 1,305 1,655 1,870 2,288 3,072 2,545 2,384 2,453 2,193 2,009 1,781Melvern - 505 422 445 368 389 376 455 481 423 429 385 356

Population of Cities in Kansas, 1900-2020
City 1900 1910 1920 1930 1940 1950 1960 1970 1980 1990 2000 2010 2020
Menlo - - - 204 144 113 99 48 42 50 57 61 33
Mentor1 - - - - - - - - - - - - 101Meriden - 467 422 390 421 378 402 472 707 622 706 813 744Merriam - - - - - - 5,084 10,955 10,794 11,819 11,008 11,003 11,098Milan - 240 222 198 224 165 144 162 135 109 137 82 56Mildred - - 336 341 155 79 60 42 64 46 36 28 25Milford - - - 300 271 284 318 296 465 579 502 530 408
Milton1 - - - - - - - - - - - 155 155Miltonvale - 829 821 814 800 911 814 718 588 484 523 539 440Minneapolis - 1,895 1,842 1,741 2,087 1,801 2,024 1,971 2,075 1,983 2,046 2,032 1,946Minneola - 348 493 617 490 660 679 630 712 705 717 745 738Mission - - - - - - 4,626 8,125 8,643 9,504 9,727 9,323 9,954Mission Hills - - - - - 1,275 3,621 4,198 3,904 3,446 3,593 3,498 3,594Mission Woods - - - - - 205 243 237 213 182 165 178 203Moline - 808 950 897 870 871 698 555 553 473 457 371 345Montezuma - - 163 424 340 509 543 606 730 838 966 966 975
Mont Ida1 - - - - - - - - - - - - 23
Monument1 - - - - - - - - - - - - 56Moran - 559 676 651 592 616 549 550 643 551 562 558 466Morganville - 285 262 281 264 278 226 257 261 181 198 192 180Morland - 237 296 385 356 287 317 300 223 234 164 154 115Morrill - 398 552 519 387 362 299 308 336 299 277 230 218Morrowville - - - 246 308 229 195 201 180 173 168 155 114Moscow - - - 249 177 222 211 228 228 252 247 310 272Mound City - 698 720 655 703 707 661 714 755 789 821 694 647Moundridge - 626 733 870 864 942 1,214 1,271 1,453 1,531 1,593 1,737 1,974Mound Valley - 956 803 666 648 566 481 467 381 405 418 407 348Mount Hope - 519 513 466 442 473 539 665 791 805 830 813 806Mulberry - 997 2,697 1,596 1,175 779 642 622 647 555 577 520 409Mullinville - 289 361 436 428 410 385 376 339 289 279 255 197Mulvane - 1,084 1,239 1,042 940 1,387 2,981 3,185 4,254 4,683 5,155 6,111 6,286Munden - 275 339 205 193 169 177 123 152 143 122 100 96
Munjor1 - - - - - - - - - - - 213 232
Murdock1 - - - - - - - - - - - - 37Muscotah - 491 427 365 331 248 228 206 248 194 200 176 155Narka - 278 207 252 193 220 166 130 120 113 93 94 81Nashville - - - 234 212 159 137 107 127 118 111 64 54Natoma - 407 518 583 651 775 775 603 515 392 367 335 302
Navarre1 - - - - - - - - - - - - 52
Neal1 - - - - - - - - - - - - 37

Population of Cities in Kansas, 1900-2020
City 1900 1910 1920 1930 1940 1950 1960 1970 1980 1990 2000 2010 2020
Neodesha - 2,872 3,943 3,381 3,376 3,723 3,594 3,295 3,414 2,837 2,848 2,486 2,275Neosho Falls - 571 628 462 452 355 222 184 157 157 179 141 134Neosho Rapids - 256 267 306 253 204 178 234 289 235 274 265 229Ness City - 712 905 1,509 1,355 1,612 1,653 1,756 1,769 1,724 1,534 1,449 1,329Netawaka - 250 267 229 226 213 225 192 218 167 170 143 139New Albany - 213 223 150 165 152 104 59 78 60 73 56 57
Newbury1 - - - - - - - - - - - - 78New Cambria - - 127 130 144 160 187 160 175 152 150 126 106
New Salem1 - - - - - - - - - - - - 58New Strawn - - - - - - - - 457 428 425 394 414Newton 6,208 7,862 9,781 11,034 11,048 11,590 14,877 15,439 16,332 16,700 17,190 19,132 18,602Nickerson - 1,195 1,049 1,052 1,052 1,013 1,091 1,187 1,292 1,137 1,194 1,070 1,058
Nicodemus1 - - - - - - - - - - - - 14
Niles1 - - - - - - - - - - - - 56Niotaze - 317 186 235 241 162 124 83 104 99 122 82 90Norcatur - 482 476 524 440 368 302 284 226 198 169 151 159North Newton - - - - - 566 890 963 1,222 1,262 1,522 1,759 1,814Norton - 1,787 2,186 2,767 2,762 3,060 3,345 3,627 3,400 3,017 3,012 2,928 2,747Nortonville - 638 696 606 562 568 595 727 692 643 620 637 601
Norway1 - - - - - - - - - - - - 17Norwich - 392 430 477 411 378 430 414 476 455 551 491 444Oak Hill - - - 147 147 92 69 41 35 13 35 24 24
Oaklawn-Sunview1 - - - - - - - - - 3,240 3,135 3,276 2,880Oakley - 681 768 1,159 1,138 1,915 2,190 2,327 2,343 2,045 2,173 2,045 2,046Oberlin - 1,157 1,247 1,629 1,878 2,019 2,337 2,291 2,387 2,197 1,994 1,788 1,644
Odin1 - - - - - - - - - - - 101 87Offerle - - 225 298 273 269 208 212 244 228 220 199 179
Ogallah1 - - - - - - - - - - - - 28Ogden - 230 596 418 494 845 1,780 1,491 1,804 1,494 1,762 2,087 1,661Oketo - 253 225 225 218 169 128 133 130 116 87 66 64Olathe 3,451 3,272 3,268 3,656 3,979 5,593 10,987 17,917 37,258 63,402 92,962 125,872 141,290Olivet - - - 145 172 127 116 64 65 59 64 67 73Olmitz - - - 166 130 125 141 161 140 130 138 114 90Olpe - 215 235 317 331 293 722 453 477 431 504 546 519Olsburg - - - 175 177 140 137 151 166 192 192 219 218Onaga - 759 838 930 741 882 850 761 752 761 704 702 679Oneida - 211 276 224 187 138 119 112 120 79 70 75 61
Opolis1 - - - - - - - - - - - - 104Osage City - 2,432 2,376 2,402 2,079 1,919 2,213 2,600 2,667 2,683 3,034 2,943 2,861Osawatomie - 2,568 3,293 4,440 4,145 4,347 4,622 4,294 4,459 4,590 4,645 4,447 4,255

Population of Cities in Kansas, 1900-2020
City 1900 1910 1920 1930 1940 1950 1960 1970 1980 1990 2000 2010 2020
Osborne - 1,566 1,635 1,881 1,876 2,068 2,049 1,980 2,120 1,778 1,607 1,431 1,335Oskaloosa - 851 700 733 800 721 807 955 1,092 1,074 1,165 1,113 1,110Oswego - 2,317 2,386 1,845 1,953 1,997 2,027 2,200 2,218 1,870 2,046 1,829 1,668Otis - - 505 407 413 410 362 387 410 385 325 282 296Ottawa 6,934 7,650 9,018 9,563 10,193 10,081 10,673 11,036 11,016 10,667 11,921 12,649 12,625Overbrook - - - - - 387 509 748 930 920 947 1,058 1,005Overland Park - - - - - - - 77,934 81,784 111,790 149,080 173,372 197,238Oxford - 624 748 1,129 1,020 798 989 1,113 1,125 1,143 1,173 1,049 1,048Ozawkie - - - - - - - 137 472 458 552 645 638Palco - 279 281 290 276 405 575 398 329 295 248 277 208Palmer - - 179 187 182 150 169 166 149 121 108 111 125Paola - 3,207 3,238 3,762 3,511 3,972 4,784 4,622 4,557 4,698 5,011 5,602 5,768Paradise - - - 178 161 145 134 145 89 66 64 49 35Park - - - - - 223 218 178 183 150 151 126 112Park City - - - - - - 2,687 2,529 3,778 5,054 5,814 7,297 8,333Parker - 398 436 364 361 251 181 255 270 256 281 277 241Parkerfield - - - - - - - - - - - 426 406Parkerville - 157 144 127 105 78 59 25 42 28 73 59 46Parsons 7,682 12,463 16,028 14,903 14,294 14,750 13,929 13,015 12,898 11,919 11,514 10,500 9,600Partridge - 246 253 270 226 221 221 302 268 213 259 248 209Pawnee Rock - 458 428 399 388 359 380 442 409 367 356 252 193Paxico - - 249 261 237 196 276 216 168 174 211 221 210Peabody - 1,416 2,455 1,491 1,367 1,194 1,309 1,368 1,474 1,349 1,384 1,210 937
Peck1 - - - - - - - - - - - - 162Penalosa - - - 128 118 71 84 32 31 21 27 17 18Perry - 400 481 418 392 399 495 664 907 881 901 929 852Peru - 575 570 628 487 368 340 289 286 206 183 139 101Phillipsburg - 1,302 1,310 1,543 2,109 2,589 3,233 3,241 3,229 2,828 2,668 2,581 2,337
Piedmont1 - - - - - - - - - - - - 52
Pierceville1 - - - - - - - - - - - - 98
Pilsen1 - - - - - - - - - - - - 65
Piqua1 - - - - - - - - - - - 107 90Pittsburg 10,112 14,755 18,052 18,145 17,571 19,341 18,678 20,171 18,770 17,789 19,243 20,233 20,646
Plains3 - - - - - - 780 857 1,044 957 1,163 1,146 1,037Plainville - 1,090 1,004 1,058 1,232 2,082 3,104 2,627 2,458 2,173 2,029 1,903 1,746Pleasanton - 1,373 1,291 1,214 1,227 1,178 1,098 1,216 1,303 1,231 1,387 1,216 1,208Plevna - - 202 174 161 200 117 124 115 117 99 98 85Pomona - 523 485 501 485 453 489 541 868 835 923 832 884Portis - 304 390 340 349 286 232 178 172 129 123 103 86Potwin - 249 415 427 487 465 635 497 563 448 457 449 421
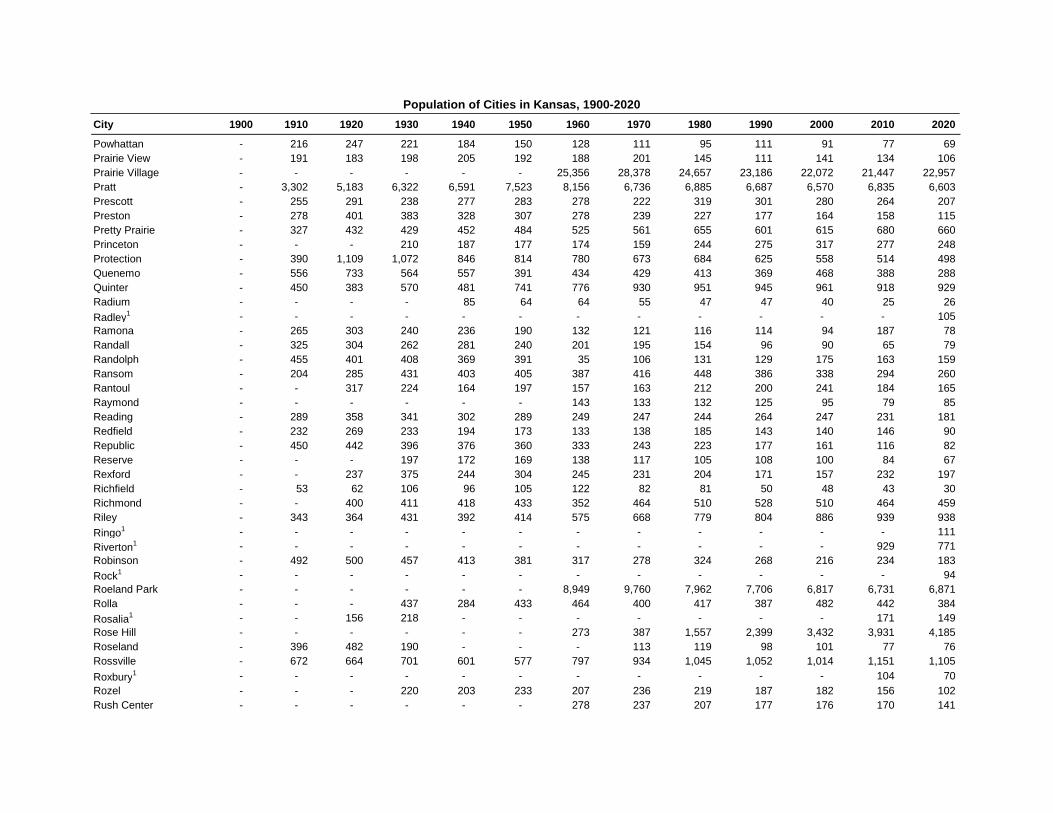
Population of Cities in Kansas, 1900-2020
City 1900 1910 1920 1930 1940 1950 1960 1970 1980 1990 2000 2010 2020
Powhattan - 216 247 221 184 150 128 111 95 111 91 77 69Prairie View - 191 183 198 205 192 188 201 145 111 141 134 106Prairie Village - - - - - - 25,356 28,378 24,657 23,186 22,072 21,447 22,957Pratt - 3,302 5,183 6,322 6,591 7,523 8,156 6,736 6,885 6,687 6,570 6,835 6,603Prescott - 255 291 238 277 283 278 222 319 301 280 264 207Preston - 278 401 383 328 307 278 239 227 177 164 158 115Pretty Prairie - 327 432 429 452 484 525 561 655 601 615 680 660Princeton - - - 210 187 177 174 159 244 275 317 277 248Protection - 390 1,109 1,072 846 814 780 673 684 625 558 514 498Quenemo - 556 733 564 557 391 434 429 413 369 468 388 288Quinter - 450 383 570 481 741 776 930 951 945 961 918 929Radium - - - - 85 64 64 55 47 47 40 25 26
Radley1 - - - - - - - - - - - - 105Ramona - 265 303 240 236 190 132 121 116 114 94 187 78Randall - 325 304 262 281 240 201 195 154 96 90 65 79Randolph - 455 401 408 369 391 35 106 131 129 175 163 159Ransom - 204 285 431 403 405 387 416 448 386 338 294 260Rantoul - - 317 224 164 197 157 163 212 200 241 184 165Raymond - - - - - - 143 133 132 125 95 79 85Reading - 289 358 341 302 289 249 247 244 264 247 231 181Redfield - 232 269 233 194 173 133 138 185 143 140 146 90Republic - 450 442 396 376 360 333 243 223 177 161 116 82Reserve - - - 197 172 169 138 117 105 108 100 84 67Rexford - - 237 375 244 304 245 231 204 171 157 232 197Richfield - 53 62 106 96 105 122 82 81 50 48 43 30Richmond - - 400 411 418 433 352 464 510 528 510 464 459Riley - 343 364 431 392 414 575 668 779 804 886 939 938
Ringo1 - - - - - - - - - - - - 111
Riverton1 - - - - - - - - - - - 929 771Robinson - 492 500 457 413 381 317 278 324 268 216 234 183
Rock1 - - - - - - - - - - - - 94Roeland Park - - - - - - 8,949 9,760 7,962 7,706 6,817 6,731 6,871Rolla - - - 437 284 433 464 400 417 387 482 442 384
Rosalia1 - - 156 218 - - - - - - - 171 149Rose Hill - - - - - - 273 387 1,557 2,399 3,432 3,931 4,185Roseland - 396 482 190 - - - 113 119 98 101 77 76Rossville - 672 664 701 601 577 797 934 1,045 1,052 1,014 1,151 1,105
Roxbury1 - - - - - - - - - - - 104 70Rozel - - - 220 203 233 207 236 219 187 182 156 102Rush Center - - - - - - 278 237 207 177 176 170 141

Population of Cities in Kansas, 1900-2020
City 1900 1910 1920 1930 1940 1950 1960 1970 1980 1990 2000 2010 2020
Russell - 1,692 1,700 2,352 4,819 6,483 6,113 5,371 5,427 4,783 4,696 4,506 4,401Russell Springs - 82 115 141 198 161 93 83 56 29 32 24 26Sabetha - 1,768 2,003 2,332 2,241 2,173 2,318 2,376 2,286 2,341 2,589 2,571 2,545
St. Benedict1 - - - - - - - - - - - - 50St. Francis - 492 733 944 1,041 1,892 1,594 1,725 1,610 1,495 1,497 1,329 1,263St. George - - 211 216 203 251 259 241 309 397 434 639 1,054St. John - 1,785 1,671 1,552 1,735 1,735 1,753 1,477 1,501 1,357 1,318 1,295 1,228
St. Marks1 - - - - - - - - - - - - 124St. Marys - 1,397 1,321 1,304 1,132 1,201 1,509 1,434 1,598 1,791 2,198 2,627 2,759St. Paul - 927 974 800 869 783 675 804 746 687 646 629 614Salina 6,074 9,688 15,085 20,155 21,073 26,176 43,202 37,714 41,843 42,299 45,679 47,707 46,889Satanta - - - 508 345 667 686 1,161 1,117 1,073 1,239 1,133 1,092Savonburg - 257 258 230 198 155 131 109 113 93 91 109 74Sawyer - - 263 276 239 223 192 164 213 183 124 124 89Scammon - 2,233 1,694 1,093 737 561 429 457 501 466 496 482 376Scandia - 579 547 608 614 611 643 567 480 421 436 372 344Schoenchen - - - - 259 170 188 182 209 200 214 207 170Scott City - 918 1,112 1,544 1,848 3,204 3,555 4,001 4,154 3,785 3,855 3,816 4,113Scottsville - 248 165 169 187 108 60 46 56 26 21 25 26Scranton - 770 622 538 500 487 576 575 664 674 724 710 653Sedan - 1,211 1,885 1,776 1,948 1,640 1,677 1,555 1,579 1,306 1,342 1,124 1,000Sedgwick - 626 731 832 738 732 1,095 1,083 1,471 1,438 1,537 1,695 1,603Selden - 297 280 399 401 438 347 271 266 248 201 219 184Seneca - 1,806 1,885 1,864 2,015 1,911 2,072 2,182 2,389 2,027 2,122 1,991 2,139Severance - 383 350 312 266 197 146 128 134 98 108 94 76Severy - 608 551 525 570 477 492 384 447 357 359 259 205Seward - - - 127 125 130 92 66 88 71 63 64 41
Shallow Water1 - - - - - - - - - - - - 89Sharon - 350 325 316 296 278 272 265 283 256 210 158 147Sharon Springs - 440 815 792 760 994 966 1,012 982 872 835 748 751Shawnee - - - 553 597 845 9,072 20,946 29,653 37,962 47,996 62,209 67,311
Silverdale1 - - - - - - - - - - - - 61Silver Lake - 260 260 336 362 331 392 811 1,350 1,390 1,358 1,439 1,345Simpson - 211 295 273 235 234 154 131 123 107 114 86 82Smith Center - 1,292 1,567 1,736 1,686 2,026 2,379 2,389 2,240 2,016 1,931 1,665 1,571Smolan - - - - - - - 175 169 195 218 215 162Soldier - 358 346 274 247 193 171 173 165 135 122 136 102Solomon - 949 1,071 1,032 872 834 1,008 973 1,018 939 1,072 1,095 993
Somerset1 - - - - - - - - - - - - 90South Haven - 483 423 442 405 358 408 413 439 420 390 363 324

Population of Cities in Kansas, 1900-2020
City 1900 1910 1920 1930 1940 1950 1960 1970 1980 1990 2000 2010 2020
South Hutchinson - 387 639 669 915 1,045 1,672 1,879 2,226 2,444 2,539 2,457 2,521
South Mound1 - - - - - - - - - - - - 27Spearville - 576 629 703 603 610 602 738 693 716 813 773 791Speed - - - 139 111 70 75 58 41 64 44 37 37Spivey - 252 226 219 181 109 98 78 83 88 80 78 61Spring Hill - 605 555 566 489 619 909 1,186 2,005 2,191 2,727 5,437 7,952Stafford - 1,927 1,752 1,614 2,011 2,005 1,862 1,414 1,425 1,344 1,161 1,042 959Stark - 191 189 197 160 157 96 124 143 79 106 72 69Sterling - 2,133 2,060 1,868 2,215 2,243 2,303 2,312 2,312 2,191 2,642 2,328 2,248Stockton - 1,317 1,324 1,291 1,418 1,867 2,073 1,818 1,825 1,507 1,558 1,329 1,480Strong City - 762 944 805 848 680 659 545 675 617 584 485 386
Stuttgart1 - - - - - - - - - - - - 44Sublette - - - 673 582 838 1,077 1,208 1,293 1,378 1,592 1,453 1,413Summerfield - 554 539 398 396 305 237 254 225 169 211 156 125Sun City - - - 404 305 231 188 119 85 88 81 53 37Susank - - - - - 100 87 59 52 61 57 34 31
Sycamore1 - - - - - - - - - - - - 70Sylvan Grove - 464 450 530 540 506 400 403 376 321 324 279 291Sylvia - 634 542 540 477 496 402 390 353 308 297 218 215Syracuse - 1,126 1,059 1,383 1,226 2,075 1,888 1,720 1,654 1,606 1,824 1,812 1,826
Talmage1 - - - - - - - - - - - 99 78Tampa - 256 262 275 222 216 145 154 113 113 144 112 105
Tecumseh1 - - - - - - - - - - - - 696Tescott - 421 377 382 402 412 396 393 331 317 339 319 265Thayer - 542 528 495 461 423 396 430 517 435 500 497 432The Highlands - - - - - - - - - - - - 349Timken - - - - 170 138 147 123 99 87 83 76 38Tipton - - 230 294 248 246 252 315 321 267 243 210 193Tonganoxie - 1,018 971 1,109 1,114 1,138 1,354 1,717 1,864 2,347 2,728 4,996 5,573Topeka 33,608 43,684 50,022 64,120 67,833 78,791 119,484 125,011 115,266 119,883 122,377 127,473 126,587Toronto - 627 829 706 737 600 524 431 466 317 312 281 206Towanda - 275 718 424 374 417 1,031 1,190 1,332 1,289 1,338 1,450 1,447Treece - - 991 749 568 378 280 225 194 172 149 138 -Tribune - 158 243 436 607 1,010 1,036 1,013 955 918 835 741 772Troy - 940 1,013 1,042 1,049 977 1,051 1,047 1,240 1,073 1,054 1,010 964Turon - 572 631 576 594 632 559 430 481 393 436 387 309Tyro - 603 454 272 322 279 289 206 289 243 226 220 177Udall - 330 381 436 419 410 600 668 891 824 794 746 661Ulysses - - 103 1,140 824 2,243 3,157 3,779 4,653 5,474 5,960 6,161 5,788Uniontown - 256 300 298 277 232 211 286 371 290 288 272 293
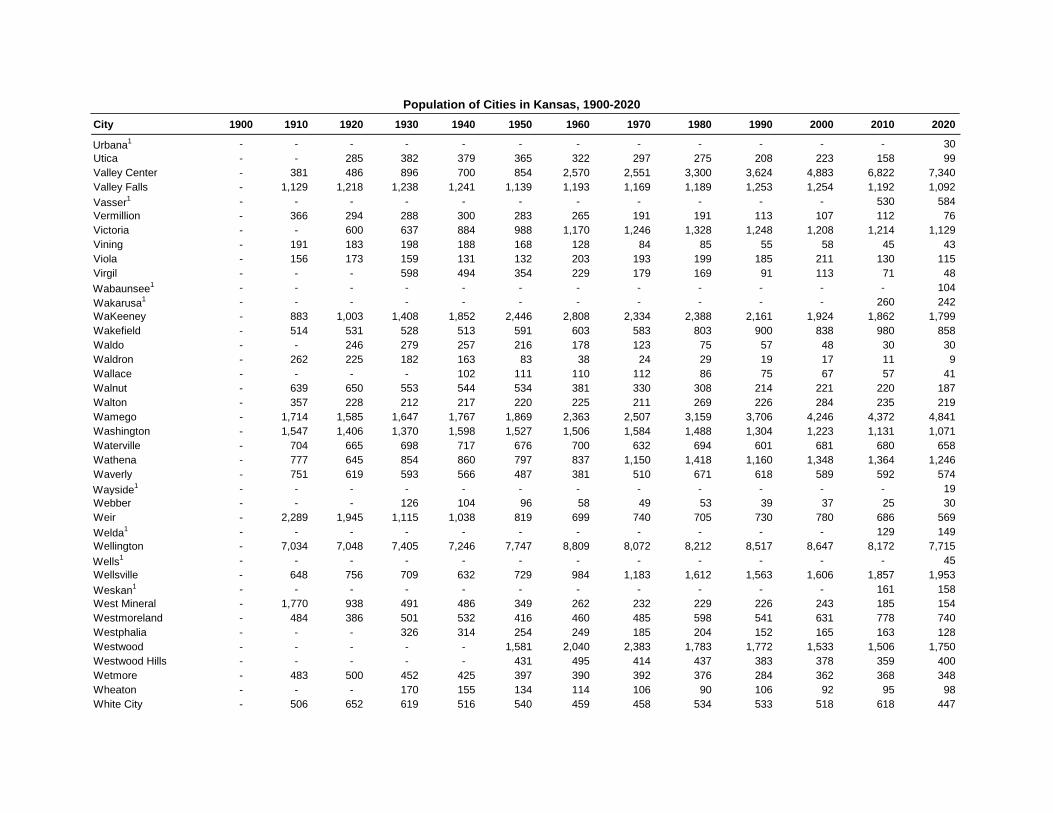
Population of Cities in Kansas, 1900-2020
City 1900 1910 1920 1930 1940 1950 1960 1970 1980 1990 2000 2010 2020
Urbana1 - - - - - - - - - - - - 30Utica - - 285 382 379 365 322 297 275 208 223 158 99Valley Center - 381 486 896 700 854 2,570 2,551 3,300 3,624 4,883 6,822 7,340Valley Falls - 1,129 1,218 1,238 1,241 1,139 1,193 1,169 1,189 1,253 1,254 1,192 1,092
Vasser1 - - - - - - - - - - - 530 584Vermillion - 366 294 288 300 283 265 191 191 113 107 112 76Victoria - - 600 637 884 988 1,170 1,246 1,328 1,248 1,208 1,214 1,129Vining - 191 183 198 188 168 128 84 85 55 58 45 43Viola - 156 173 159 131 132 203 193 199 185 211 130 115Virgil - - - 598 494 354 229 179 169 91 113 71 48
Wabaunsee1 - - - - - - - - - - - - 104
Wakarusa1 - - - - - - - - - - - 260 242WaKeeney - 883 1,003 1,408 1,852 2,446 2,808 2,334 2,388 2,161 1,924 1,862 1,799Wakefield - 514 531 528 513 591 603 583 803 900 838 980 858Waldo - - 246 279 257 216 178 123 75 57 48 30 30Waldron - 262 225 182 163 83 38 24 29 19 17 11 9Wallace - - - - 102 111 110 112 86 75 67 57 41Walnut - 639 650 553 544 534 381 330 308 214 221 220 187Walton - 357 228 212 217 220 225 211 269 226 284 235 219Wamego - 1,714 1,585 1,647 1,767 1,869 2,363 2,507 3,159 3,706 4,246 4,372 4,841Washington - 1,547 1,406 1,370 1,598 1,527 1,506 1,584 1,488 1,304 1,223 1,131 1,071Waterville - 704 665 698 717 676 700 632 694 601 681 680 658Wathena - 777 645 854 860 797 837 1,150 1,418 1,160 1,348 1,364 1,246Waverly - 751 619 593 566 487 381 510 671 618 589 592 574
Wayside1 - - - - - - - - - - - - 19Webber - - - 126 104 96 58 49 53 39 37 25 30Weir - 2,289 1,945 1,115 1,038 819 699 740 705 730 780 686 569
Welda1 - - - - - - - - - - - 129 149Wellington - 7,034 7,048 7,405 7,246 7,747 8,809 8,072 8,212 8,517 8,647 8,172 7,715
Wells1 - - - - - - - - - - - - 45Wellsville - 648 756 709 632 729 984 1,183 1,612 1,563 1,606 1,857 1,953
Weskan1 - - - - - - - - - - - 161 158West Mineral - 1,770 938 491 486 349 262 232 229 226 243 185 154Westmoreland - 484 386 501 532 416 460 485 598 541 631 778 740Westphalia - - - 326 314 254 249 185 204 152 165 163 128Westwood - - - - - 1,581 2,040 2,383 1,783 1,772 1,533 1,506 1,750Westwood Hills - - - - - 431 495 414 437 383 378 359 400Wetmore - 483 500 452 425 397 390 392 376 284 362 368 348Wheaton - - - 170 155 134 114 106 90 106 92 95 98White City - 506 652 619 516 540 459 458 534 533 518 618 447
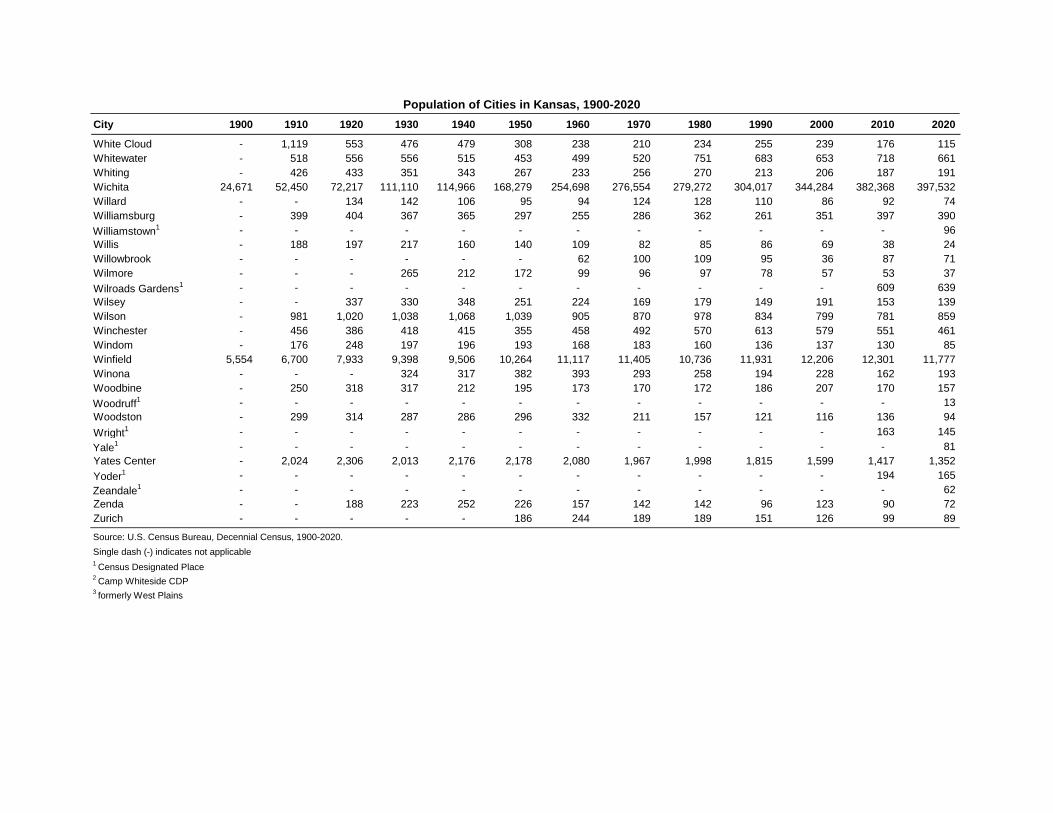
Population of Cities in Kansas, 1900-2020
City 1900 1910 1920 1930 1940 1950 1960 1970 1980 1990 2000 2010 2020
White Cloud - 1,119 553 476 479 308 238 210 234 255 239 176 115Whitewater - 518 556 556 515 453 499 520 751 683 653 718 661Whiting - 426 433 351 343 267 233 256 270 213 206 187 191Wichita 24,671 52,450 72,217 111,110 114,966 168,279 254,698 276,554 279,272 304,017 344,284 382,368 397,532Willard - - 134 142 106 95 94 124 128 110 86 92 74Williamsburg - 399 404 367 365 297 255 286 362 261 351 397 390
Williamstown1 - - - - - - - - - - - - 96Willis - 188 197 217 160 140 109 82 85 86 69 38 24Willowbrook - - - - - - 62 100 109 95 36 87 71Wilmore - - - 265 212 172 99 96 97 78 57 53 37
Wilroads Gardens1 - - - - - - - - - - - 609 639Wilsey - - 337 330 348 251 224 169 179 149 191 153 139Wilson - 981 1,020 1,038 1,068 1,039 905 870 978 834 799 781 859Winchester - 456 386 418 415 355 458 492 570 613 579 551 461Windom - 176 248 197 196 193 168 183 160 136 137 130 85Winfield 5,554 6,700 7,933 9,398 9,506 10,264 11,117 11,405 10,736 11,931 12,206 12,301 11,777Winona - - - 324 317 382 393 293 258 194 228 162 193Woodbine - 250 318 317 212 195 173 170 172 186 207 170 157
Woodruff1 - - - - - - - - - - - - 13Woodston - 299 314 287 286 296 332 211 157 121 116 136 94
Wright1 - - - - - - - - - - - 163 145
Yale1 - - - - - - - - - - - - 81Yates Center - 2,024 2,306 2,013 2,176 2,178 2,080 1,967 1,998 1,815 1,599 1,417 1,352
Yoder1 - - - - - - - - - - - 194 165
Zeandale1 - - - - - - - - - - - - 62Zenda - - 188 223 252 226 157 142 142 96 123 90 72Zurich - - - - - 186 244 189 189 151 126 99 89
Single dash (-) indicates not applicable1 Census Designated Place 2 Camp Whiteside CDP 3 formerly West Plains
Source: U.S. Census Bureau, Decennial Census, 1900-2020.

City
April 1,2010
Census
July 1,2011
Estimate
July 1,2012
Estimate
July 1,2013
Estimate
July 1,2014
Estimate
July 1,2015
Estimate
July 1,2016
Estimate
July 1,2017
Estimate
July 1,2018
Estimate
July 1,2019
Estimate
April 1,2020
Census
PercentChange
April 2010- April 2020
Abbyville 87 89 90 90 89 89 88 86 85 85 83 -4.60Abilene 6,844 6,805 6,748 6,596 6,546 6,506 6,410 6,353 6,270 6,176 6,460 -5.61Admire 156 156 155 155 153 153 154 153 153 152 130 -16.67Agenda 68 71 68 68 67 66 66 66 65 65 47 -30.88Agra 267 261 260 261 255 251 249 248 241 240 208 -22.10Albert 175 175 174 174 173 173 172 169 166 165 132 -24.57Alden 148 155 154 151 151 150 148 144 142 141 122 -17.57Alexander 65 63 63 63 61 60 59 59 59 58 54 -16.92Allen 177 175 174 174 172 172 172 171 171 170 160 -9.60Alma 832 825 815 815 802 792 787 778 778 776 802 -3.61Almena 408 407 402 402 397 395 392 385 385 379 363 -11.03Alta Vista 444 441 437 438 433 428 426 421 422 422 409 -7.88Altamont 1,080 1,078 1,067 1,050 1,043 1,041 1,033 1,030 1,028 1,024 1,061 -1.76Alton 103 102 102 102 99 96 95 94 92 91 100 -2.91Altoona 414 406 403 401 396 390 385 385 384 379 354 -14.49Americus 894 894 891 887 880 885 887 883 883 878 776 -13.20Andale 928 950 965 969 985 997 1,001 997 989 987 941 1.40Andover 11,791 11,942 12,075 12,243 12,436 12,650 12,906 13,111 13,290 13,400 14,892 26.30Anthony 2,269 2,228 2,197 2,240 2,233 2,211 2,163 2,127 2,097 2,073 2,108 -7.10Arcadia 310 310 310 311 310 309 308 308 309 308 254 -18.06Argonia 501 502 500 497 492 488 482 479 473 469 456 -8.98Arkansas City 12,415 12,365 12,330 12,272 12,164 12,096 11,992 11,852 11,744 11,623 11,974 -3.55Arlington 473 477 473 472 465 463 458 455 452 448 435 -8.03Arma 1,481 1,485 1,483 1,473 1,468 1,453 1,444 1,432 1,426 1,416 1,407 -5.00Ashland 867 828 845 850 824 812 805 777 776 781 783 -9.69Assaria 413 415 414 413 411 407 403 404 406 407 428 3.63Atchison 11,021 10,904 10,915 10,862 10,762 10,691 10,655 10,623 10,548 10,505 10,885 -1.23Athol 44 43 43 42 42 42 41 41 41 41 41 -6.82Atlanta 195 194 194 191 190 189 187 185 184 180 168 -13.85Attica 626 615 610 597 596 591 579 569 562 556 516 -17.57Atwood 1,194 1,189 1,189 1,219 1,210 1,193 1,191 1,183 1,191 1,199 1,290 8.04Auburn 1,227 1,226 1,227 1,220 1,218 1,217 1,215 1,218 1,220 1,212 1,273 3.75Augusta 9,274 9,373 9,326 9,313 9,319 9,355 9,394 9,399 9,362 9,344 9,256 -0.19Aurora 60 59 59 59 59 58 58 57 55 56 56 -6.67Axtell 406 401 403 401 406 399 397 400 401 402 399 -1.72Baldwin City 4,515 4,550 4,546 4,563 4,586 4,681 4,697 4,634 4,684 4,700 4,826 6.89Barnard 70 70 69 69 68 68 66 66 64 64 64 -8.57Barnes 159 163 160 157 157 156 156 154 154 153 165 3.77
Population of Cities in Kansas, April 1, 2010 - April 1, 2020

City
April 1,2010
Census
July 1,2011
Estimate
July 1,2012
Estimate
July 1,2013
Estimate
July 1,2014
Estimate
July 1,2015
Estimate
July 1,2016
Estimate
July 1,2017
Estimate
July 1,2018
Estimate
July 1,2019
Estimate
April 1,2020
Census
PercentChange
April 2010- April 2020
Population of Cities in Kansas, April 1, 2010 - April 1, 2020
Bartlett 80 79 78 77 77 76 75 75 74 73 69 -13.75Basehor 4,613 4,713 4,783 4,893 5,114 5,396 5,664 6,028 6,216 6,520 6,896 49.49Bassett 14 23 23 22 22 21 21 21 21 22 20 42.86Baxter Springs 4,238 4,214 4,179 4,116 4,088 4,045 3,990 3,961 3,931 3,941 3,888 -8.26Bazine 334 336 331 331 331 322 317 306 299 296 282 -15.57Beattie 200 197 198 197 196 193 191 188 189 189 197 -1.50Bel Aire 6,769 6,798 6,832 6,907 7,266 7,403 7,650 7,907 8,077 8,311 8,262 22.06Belle Plaine 1,681 1,647 1,632 1,623 1,606 1,602 1,581 1,575 1,565 1,552 1,467 -12.73Belleville 1,991 1,955 1,930 1,907 1,899 1,898 1,888 1,887 1,873 1,851 2,007 0.80Beloit 3,835 3,787 3,807 3,812 3,778 3,805 3,749 3,713 3,693 3,616 3,404 -11.24Belpre 84 90 88 87 89 87 85 84 83 82 97 15.48Belvue 205 206 207 207 205 203 201 201 199 201 177 -13.66Benedict 73 72 71 70 70 69 66 66 66 65 69 -5.48Bennington 672 657 655 653 652 642 636 630 618 614 622 -7.44Bentley 530 530 529 530 530 528 526 523 518 515 560 5.66Benton 880 883 879 875 876 877 881 879 873 871 943 7.16Bern 166 164 164 164 164 164 164 163 163 163 161 -3.01Beverly 162 159 157 156 157 155 152 149 147 145 135 -16.67Bird City 447 441 437 437 440 438 436 439 429 427 437 -2.24Bison 255 248 246 243 243 236 233 233 233 230 179 -29.80Blue Mound 275 275 273 274 273 275 274 276 274 270 219 -20.36Blue Rapids 1,019 1,002 1,006 999 995 980 974 964 965 963 928 -8.93Bluff City 65 64 63 62 62 61 60 59 60 59 45 -30.77Bogue 143 145 142 143 140 142 140 136 134 134 155 8.39Bonner Springs 7,314 7,358 7,457 7,541 7,616 7,658 7,752 7,800 7,821 7,933 7,837 7.15Brewster 305 307 307 307 301 299 295 294 288 289 291 -4.59Bronson 323 313 312 312 309 310 308 306 304 304 304 -5.88Brookville 262 263 265 265 263 262 257 255 254 253 247 -5.73Brownell 29 29 29 29 29 28 28 27 26 26 23 -20.69Bucklin 794 812 814 812 815 804 799 788 774 765 727 -8.44Buffalo 232 228 225 224 219 216 213 214 213 210 217 -6.47Buhler 1,327 1,340 1,337 1,331 1,322 1,318 1,306 1,294 1,286 1,275 1,325 -0.15Bunker Hill 95 95 96 96 96 95 96 95 94 94 103 8.42Burden 535 542 543 546 542 541 539 535 533 530 512 -4.30Burdett 247 246 242 242 239 236 234 233 228 219 228 -7.69Burlingame 934 933 920 912 905 896 891 887 888 896 971 3.96Burlington 2,674 2,639 2,636 2,612 2,614 2,577 2,575 2,548 2,548 2,534 2,634 -1.50Burns 228 225 222 217 216 213 210 209 207 208 234 2.63
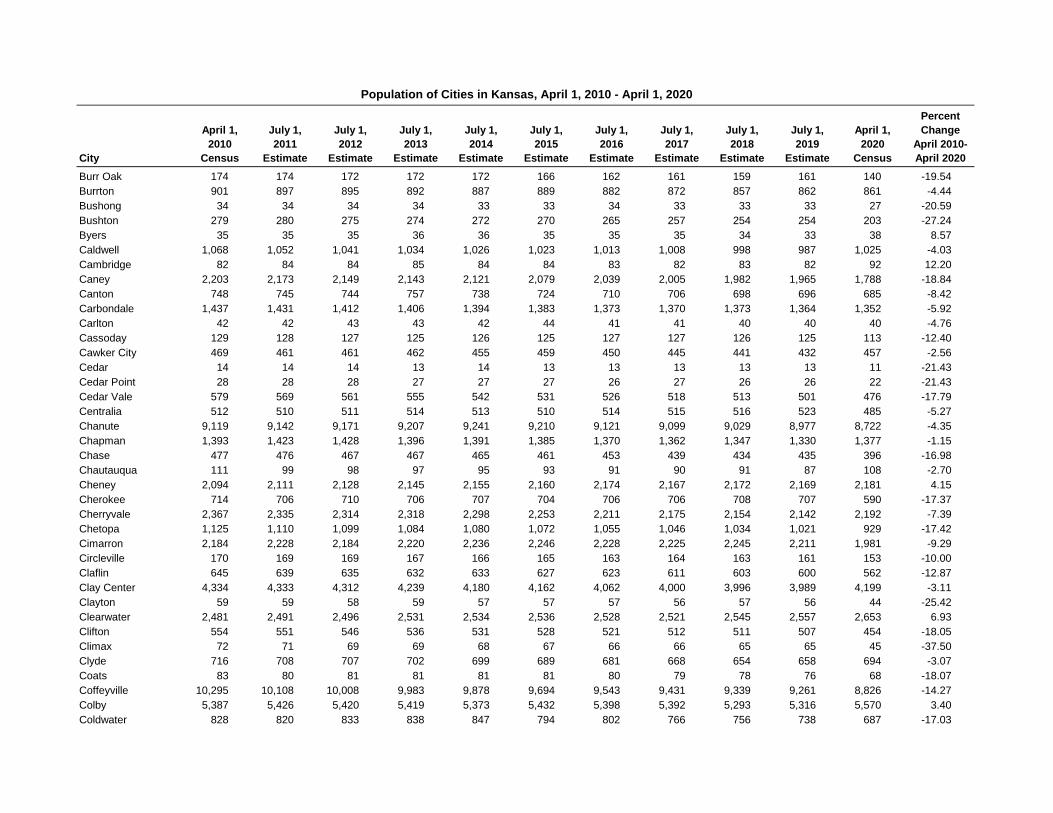
City
April 1,2010
Census
July 1,2011
Estimate
July 1,2012
Estimate
July 1,2013
Estimate
July 1,2014
Estimate
July 1,2015
Estimate
July 1,2016
Estimate
July 1,2017
Estimate
July 1,2018
Estimate
July 1,2019
Estimate
April 1,2020
Census
PercentChange
April 2010- April 2020
Population of Cities in Kansas, April 1, 2010 - April 1, 2020
Burr Oak 174 174 172 172 172 166 162 161 159 161 140 -19.54Burrton 901 897 895 892 887 889 882 872 857 862 861 -4.44Bushong 34 34 34 34 33 33 34 33 33 33 27 -20.59Bushton 279 280 275 274 272 270 265 257 254 254 203 -27.24Byers 35 35 35 36 36 35 35 35 34 33 38 8.57Caldwell 1,068 1,052 1,041 1,034 1,026 1,023 1,013 1,008 998 987 1,025 -4.03Cambridge 82 84 84 85 84 84 83 82 83 82 92 12.20Caney 2,203 2,173 2,149 2,143 2,121 2,079 2,039 2,005 1,982 1,965 1,788 -18.84Canton 748 745 744 757 738 724 710 706 698 696 685 -8.42Carbondale 1,437 1,431 1,412 1,406 1,394 1,383 1,373 1,370 1,373 1,364 1,352 -5.92Carlton 42 42 43 43 42 44 41 41 40 40 40 -4.76Cassoday 129 128 127 125 126 125 127 127 126 125 113 -12.40Cawker City 469 461 461 462 455 459 450 445 441 432 457 -2.56Cedar 14 14 14 13 14 13 13 13 13 13 11 -21.43Cedar Point 28 28 28 27 27 27 26 27 26 26 22 -21.43Cedar Vale 579 569 561 555 542 531 526 518 513 501 476 -17.79Centralia 512 510 511 514 513 510 514 515 516 523 485 -5.27Chanute 9,119 9,142 9,171 9,207 9,241 9,210 9,121 9,099 9,029 8,977 8,722 -4.35Chapman 1,393 1,423 1,428 1,396 1,391 1,385 1,370 1,362 1,347 1,330 1,377 -1.15Chase 477 476 467 467 465 461 453 439 434 435 396 -16.98Chautauqua 111 99 98 97 95 93 91 90 91 87 108 -2.70Cheney 2,094 2,111 2,128 2,145 2,155 2,160 2,174 2,167 2,172 2,169 2,181 4.15Cherokee 714 706 710 706 707 704 706 706 708 707 590 -17.37Cherryvale 2,367 2,335 2,314 2,318 2,298 2,253 2,211 2,175 2,154 2,142 2,192 -7.39Chetopa 1,125 1,110 1,099 1,084 1,080 1,072 1,055 1,046 1,034 1,021 929 -17.42Cimarron 2,184 2,228 2,184 2,220 2,236 2,246 2,228 2,225 2,245 2,211 1,981 -9.29Circleville 170 169 169 167 166 165 163 164 163 161 153 -10.00Claflin 645 639 635 632 633 627 623 611 603 600 562 -12.87Clay Center 4,334 4,333 4,312 4,239 4,180 4,162 4,062 4,000 3,996 3,989 4,199 -3.11Clayton 59 59 58 59 57 57 57 56 57 56 44 -25.42Clearwater 2,481 2,491 2,496 2,531 2,534 2,536 2,528 2,521 2,545 2,557 2,653 6.93Clifton 554 551 546 536 531 528 521 512 511 507 454 -18.05Climax 72 71 69 69 68 67 66 66 65 65 45 -37.50Clyde 716 708 707 702 699 689 681 668 654 658 694 -3.07Coats 83 80 81 81 81 81 80 79 78 76 68 -18.07Coffeyville 10,295 10,108 10,008 9,983 9,878 9,694 9,543 9,431 9,339 9,261 8,826 -14.27Colby 5,387 5,426 5,420 5,419 5,373 5,432 5,398 5,392 5,293 5,316 5,570 3.40Coldwater 828 820 833 838 847 794 802 766 756 738 687 -17.03

City
April 1,2010
Census
July 1,2011
Estimate
July 1,2012
Estimate
July 1,2013
Estimate
July 1,2014
Estimate
July 1,2015
Estimate
July 1,2016
Estimate
July 1,2017
Estimate
July 1,2018
Estimate
July 1,2019
Estimate
April 1,2020
Census
PercentChange
April 2010- April 2020
Population of Cities in Kansas, April 1, 2010 - April 1, 2020
Collyer 109 105 106 105 103 104 102 101 100 100 97 -11.01Colony 408 415 411 409 414 418 419 421 420 423 381 -6.62Columbus 3,312 3,279 3,254 3,210 3,190 3,154 3,112 3,093 3,073 3,051 2,929 -11.56Colwich 1,327 1,330 1,334 1,344 1,361 1,375 1,402 1,403 1,411 1,469 1,455 9.65Concordia 5,395 5,339 5,334 5,303 5,289 5,211 5,155 5,063 4,955 4,985 5,111 -5.26Conway Springs 1,272 1,257 1,247 1,236 1,232 1,228 1,217 1,212 1,217 1,217 1,086 -14.62Coolidge 95 93 94 93 94 91 93 93 92 89 80 -15.79Copeland 310 312 305 302 305 304 302 300 303 298 251 -19.03Corning 157 163 163 163 163 163 163 162 162 163 212 35.03Cottonwood Falls 903 897 888 874 865 864 857 864 837 844 851 -5.76Council Grove 2,182 2,185 2,181 2,135 2,121 2,108 2,084 2,053 2,088 2,119 2,140 -1.92Courtland 285 281 276 275 272 267 266 266 263 260 294 3.16Coyville 46 45 45 44 44 43 43 43 42 42 60 30.43Cuba 156 153 150 148 147 145 144 144 143 142 140 -10.26Cullison 101 105 106 107 107 106 105 104 102 100 83 -17.82Culver 121 122 124 124 124 120 119 117 116 115 114 -5.79Cunningham 454 478 474 472 466 465 452 447 439 433 444 -2.20Damar 132 133 133 133 133 132 131 129 128 125 112 -15.15Danville 38 37 37 36 36 36 35 35 34 34 29 -23.68De Soto 5,720 5,790 5,868 5,923 6,037 6,085 6,110 6,128 6,473 6,525 6,118 6.96Dearing 431 412 408 408 404 397 390 384 381 380 382 -11.37Deerfield 700 700 703 692 697 697 701 708 706 687 711 1.57Delia 169 180 179 178 180 178 179 179 178 176 151 -10.65Delphos 359 359 355 356 353 348 344 340 333 331 302 -15.88Denison 187 186 185 182 183 181 180 180 179 175 146 -21.93Denton 148 148 147 147 146 145 143 142 140 139 130 -12.16Derby 22,158 22,734 23,000 23,117 23,283 23,444 23,644 23,661 24,725 24,970 25,625 15.65Dexter 278 279 279 280 278 279 277 274 274 273 224 -19.42Dighton 1,038 1,025 988 998 979 958 938 909 901 896 960 -7.51Dodge City 27,340 27,724 27,972 28,144 28,169 27,919 27,772 27,472 27,114 26,884 27,788 1.64Dorrance 185 186 186 184 187 188 186 184 182 181 146 -21.08Douglass 1,700 1,713 1,701 1,691 1,685 1,688 1,689 1,683 1,668 1,660 1,555 -8.53Downs 900 910 903 902 892 867 855 841 823 818 800 -11.11Dresden 41 40 40 40 40 41 39 40 40 39 43 4.88Dunlap 30 30 29 29 29 29 28 28 28 28 27 -10.00Durham 112 114 111 109 109 109 108 108 109 108 89 -20.54Dwight 272 271 270 263 260 258 255 251 255 258 217 -20.22Earlton 55 54 54 53 53 53 52 52 52 52 60 9.09

City
April 1,2010
Census
July 1,2011
Estimate
July 1,2012
Estimate
July 1,2013
Estimate
July 1,2014
Estimate
July 1,2015
Estimate
July 1,2016
Estimate
July 1,2017
Estimate
July 1,2018
Estimate
July 1,2019
Estimate
April 1,2020
Census
PercentChange
April 2010- April 2020
Population of Cities in Kansas, April 1, 2010 - April 1, 2020
Eastborough 773 758 758 758 756 754 752 744 736 732 756 -2.20Easton 253 257 258 258 257 257 258 259 258 257 213 -15.81Edgerton 1,671 1,792 1,801 1,812 1,807 1,807 1,807 1,805 1,800 1,783 1,748 4.61Edmond 49 49 48 49 48 48 47 46 47 46 28 -42.86Edna 442 436 432 426 424 421 415 412 408 403 388 -12.22Edwardsville 4,340 4,362 4,405 4,433 4,448 4,463 4,494 4,496 4,504 4,515 4,717 8.69Effingham 546 548 546 544 536 533 531 527 524 522 495 -9.34El Dorado 13,021 13,176 13,077 13,014 12,991 13,009 13,031 13,007 12,962 12,949 12,870 -1.16Elbing 229 232 230 229 228 229 229 229 224 229 226 -1.31Elgin 89 88 86 86 84 82 82 81 80 78 60 -32.58Elk City 325 318 315 315 312 305 299 295 292 290 260 -20.00Elk Falls 107 103 99 98 100 95 93 93 92 93 113 5.61Elkhart 2,205 2,166 2,131 2,120 2,068 2,008 1,907 1,867 1,813 1,726 1,888 -14.38Ellinwood 2,131 2,136 2,119 2,111 2,095 2,072 2,045 2,005 1,970 1,952 2,011 -5.63Ellis 2,062 2,099 2,115 2,105 2,093 2,085 2,072 2,049 2,034 2,026 1,958 -5.04Ellsworth 3,120 3,105 3,106 3,067 3,060 3,042 3,038 3,036 2,981 2,956 3,066 -1.73Elmdale 55 55 54 53 52 52 52 52 51 51 40 -27.27Elsmore 77 74 73 72 70 69 69 68 68 66 50 -35.06Elwood 1,224 1,231 1,221 1,223 1,218 1,210 1,200 1,192 1,192 1,189 1,125 -8.09Emmett 191 192 193 192 191 190 190 189 188 187 170 -10.99Emporia 24,916 24,909 24,827 24,768 24,517 24,507 24,708 24,618 24,685 24,620 24,139 -3.12Englewood 77 74 75 76 74 72 72 69 69 70 58 -24.68Ensign 187 192 188 186 187 187 186 185 186 183 166 -11.23Enterprise 855 859 850 830 826 819 807 799 791 778 708 -17.19Erie 1,150 1,144 1,133 1,122 1,108 1,107 1,095 1,094 1,087 1,080 1,047 -8.96Esbon 99 100 98 97 97 95 92 92 91 92 69 -30.30Eskridge 534 527 523 524 514 509 505 501 501 502 439 -17.79Eudora 6,136 6,223 6,221 6,254 6,316 6,409 6,421 6,304 6,366 6,401 6,408 4.43Eureka 2,633 2,608 2,534 2,507 2,477 2,450 2,399 2,384 2,359 2,354 2,332 -11.43Everest 284 284 281 283 280 278 276 275 275 274 265 -6.69Fairview 260 258 256 257 254 252 249 249 246 246 240 -7.69Fairway 3,882 3,908 3,930 3,955 3,948 3,955 3,972 3,968 3,978 3,961 4,170 7.42Fall River 162 160 156 154 153 152 149 147 145 145 131 -19.14Florence 465 468 462 456 453 447 442 440 437 433 394 -15.27Fontana 224 230 232 232 231 232 231 234 238 239 210 -6.25Ford 216 221 221 223 225 222 221 218 215 214 203 -6.02Formoso 93 93 91 92 91 89 87 86 85 86 94 1.08Fort Scott 8,087 7,964 7,921 7,893 7,870 7,828 7,763 7,750 7,719 7,689 7,552 -6.62

City
April 1,2010
Census
July 1,2011
Estimate
July 1,2012
Estimate
July 1,2013
Estimate
July 1,2014
Estimate
July 1,2015
Estimate
July 1,2016
Estimate
July 1,2017
Estimate
July 1,2018
Estimate
July 1,2019
Estimate
April 1,2020
Census
PercentChange
April 2010- April 2020
Population of Cities in Kansas, April 1, 2010 - April 1, 2020
Fowler 590 584 566 551 561 553 544 543 526 516 534 -9.49Frankfort 726 712 715 710 708 696 692 689 695 693 730 0.55Frederick 18 18 18 18 18 18 17 17 17 19 8 -55.56Fredonia 2,482 2,436 2,401 2,386 2,353 2,319 2,284 2,282 2,270 2,237 2,151 -13.34Freeport* 5 - - - - - - - - - - -Frontenac 3,437 3,454 3,462 3,440 3,451 3,423 3,414 3,399 3,393 3,385 3,382 -1.60Fulton 163 161 160 160 159 159 158 156 155 155 165 1.23Galatia 39 39 39 39 39 38 38 37 36 36 45 15.38Galena 3,085 3,072 3,044 2,999 2,977 2,940 2,902 2,885 2,866 2,855 2,761 -10.50Galesburg 126 125 124 122 121 121 120 121 119 118 149 18.25Galva 870 877 891 898 887 873 863 864 868 877 834 -4.14Garden City 26,665 26,964 26,947 26,913 26,928 26,936 26,715 26,601 26,441 26,332 28,151 5.57Garden Plain 849 857 863 869 882 898 901 895 901 910 948 11.66Gardner 19,123 20,011 20,363 20,610 20,769 21,033 21,377 21,567 21,870 22,061 23,287 21.77Garfield 190 189 186 186 184 181 180 178 175 168 151 -20.53Garnett 3,415 3,389 3,320 3,284 3,282 3,247 3,248 3,256 3,250 3,251 3,242 -5.07Gas 564 556 551 538 529 520 518 510 508 503 475 -15.78Gaylord 114 112 111 108 108 107 106 105 105 104 87 -23.68Gem 88 89 89 89 87 87 86 85 84 84 98 11.36Geneseo 267 268 266 266 267 266 263 258 255 258 236 -11.61Geuda Springs 185 184 185 182 181 181 180 179 178 176 158 -14.59Girard 2,789 2,781 2,780 2,764 2,757 2,740 2,725 2,705 2,692 2,667 2,496 -10.51Glade 96 96 96 96 95 93 92 92 90 90 52 -45.83Glasco 498 491 491 487 485 476 472 462 453 455 441 -11.45Glen Elder 445 439 437 439 437 440 433 433 431 424 362 -18.65Goddard 4,344 4,486 4,540 4,591 4,701 4,726 4,731 4,746 4,729 4,797 5,084 17.03Goessel 539 531 524 517 514 510 507 502 499 498 556 3.15Goff 126 120 117 118 118 117 117 117 117 118 106 -15.87Goodland 4,489 4,517 4,566 4,543 4,523 4,444 4,439 4,420 4,403 4,414 4,465 -0.53Gorham 334 343 343 343 343 345 343 340 338 337 376 12.57Gove City 80 79 80 80 78 76 71 70 69 71 80 0.00Grainfield 277 279 283 284 276 268 255 252 246 248 322 16.25Grandview Plaza 1,560 1,763 1,875 1,809 1,778 1,776 1,707 1,634 1,589 1,542 1,697 8.78Great Bend 15,995 16,025 15,921 15,874 15,821 15,757 15,609 15,324 15,187 15,070 14,733 -7.89Greeley 302 303 297 294 296 295 294 295 295 299 273 -9.60Green 128 128 131 129 126 125 122 120 120 119 95 -25.78Greenleaf 331 329 322 316 314 311 312 306 305 304 350 5.74Greensburg 777 794 780 788 788 801 784 778 781 777 740 -4.76

City
April 1,2010
Census
July 1,2011
Estimate
July 1,2012
Estimate
July 1,2013
Estimate
July 1,2014
Estimate
July 1,2015
Estimate
July 1,2016
Estimate
July 1,2017
Estimate
July 1,2018
Estimate
July 1,2019
Estimate
April 1,2020
Census
PercentChange
April 2010- April 2020
Population of Cities in Kansas, April 1, 2010 - April 1, 2020
Grenola 216 209 199 196 200 191 187 187 184 187 151 -30.09Gridley 341 336 336 332 332 330 333 328 325 322 313 -8.21Grinnell 259 262 265 266 258 250 240 236 231 233 260 0.39Gypsum 405 405 403 401 397 398 396 392 390 389 400 -1.23Haddam 104 105 103 100 100 99 99 98 97 97 110 5.77Halstead 2,085 2,085 2,084 2,076 2,066 2,072 2,066 2,046 2,026 2,042 2,179 4.51Hamilton 268 268 261 257 254 252 247 246 244 244 182 -32.09Hamlin 46 37 37 37 36 36 36 36 36 36 25 -45.65Hanover 682 689 677 671 672 668 669 658 656 654 690 1.17Hanston 206 220 216 216 211 210 206 209 202 198 259 25.73Hardtner 172 174 173 174 173 171 166 163 159 158 167 -2.91Harper 1,473 1,451 1,431 1,408 1,408 1,399 1,372 1,351 1,332 1,318 1,313 -10.86Hartford 371 374 373 374 370 370 371 370 371 369 355 -4.31Harveyville 236 247 244 249 249 247 246 244 248 246 178 -24.58Havana 104 116 115 115 112 112 110 106 105 105 84 -19.23Haven 1,237 1,244 1,237 1,238 1,227 1,225 1,214 1,204 1,194 1,185 1,170 -5.42Havensville 133 136 138 139 142 143 147 150 152 155 119 -10.53Haviland 701 696 685 688 688 696 682 676 676 671 678 -3.28Hays 20,510 20,776 21,039 21,003 20,997 21,064 21,014 20,888 20,847 20,805 21,116 2.95Haysville 10,826 10,886 10,961 11,021 11,110 11,193 11,259 11,269 11,270 11,345 11,262 4.03Hazelton 93 94 93 94 94 93 90 88 86 86 82 -11.83Hepler 132 132 132 132 131 132 132 133 132 133 90 -31.82Herington 2,526 2,511 2,487 2,428 2,403 2,383 2,347 2,325 2,294 2,257 2,109 -16.51Herndon 129 131 131 133 133 130 128 127 128 128 119 -7.75Hesston 3,709 3,711 3,728 3,733 3,726 3,780 3,782 3,756 3,721 3,736 3,505 -5.50Hiawatha 3,172 3,258 3,221 3,235 3,193 3,166 3,144 3,137 3,128 3,111 3,280 3.40Highland 1,012 1,020 1,017 1,015 1,016 1,012 1,006 999 999 996 903 -10.77Hill City 1,474 1,494 1,462 1,465 1,449 1,465 1,451 1,408 1,388 1,384 1,403 -4.82Hillsboro 2,993 2,966 2,927 2,889 2,882 2,850 2,852 2,836 2,819 2,804 2,732 -8.72Hoisington 2,706 2,701 2,679 2,668 2,650 2,619 2,589 2,542 2,499 2,484 2,699 -0.26Holcomb 2,094 2,110 2,109 2,106 2,110 2,111 2,095 2,087 2,074 2,065 2,245 7.21Hollenberg 21 21 21 20 20 20 20 20 20 20 10 -52.38Holton 3,329 3,300 3,286 3,256 3,283 3,240 3,266 3,269 3,245 3,209 3,401 2.16Holyrood 447 445 445 437 435 432 432 431 419 414 403 -9.84Hope 368 362 357 349 346 342 337 335 331 328 317 -13.86Horace 70 70 71 72 73 72 71 68 68 67 102 45.71Horton 1,776 1,765 1,745 1,751 1,729 1,712 1,698 1,695 1,690 1,679 1,523 -14.25Howard 687 664 636 630 643 616 602 600 591 599 570 -17.03

City
April 1,2010
Census
July 1,2011
Estimate
July 1,2012
Estimate
July 1,2013
Estimate
July 1,2014
Estimate
July 1,2015
Estimate
July 1,2016
Estimate
July 1,2017
Estimate
July 1,2018
Estimate
July 1,2019
Estimate
April 1,2020
Census
PercentChange
April 2010- April 2020
Population of Cities in Kansas, April 1, 2010 - April 1, 2020
Hoxie 1,201 1,182 1,177 1,182 1,182 1,169 1,176 1,195 1,192 1,190 1,211 0.83Hoyt 669 658 653 647 654 649 641 642 638 630 593 -11.36Hudson 129 127 126 127 126 124 125 124 123 122 95 -26.36Hugoton 3,904 3,858 3,930 3,978 4,008 3,968 3,870 3,792 3,759 3,698 3,747 -4.02Humboldt 1,953 1,939 1,945 1,914 1,877 1,843 1,834 1,810 1,800 1,783 1,847 -5.43Hunnewell 67 62 61 61 61 61 60 61 61 60 44 -34.33Hunter 57 58 58 58 57 57 56 56 55 54 51 -10.53Huron 54 74 74 74 73 73 73 75 74 74 74 37.04Hutchinson 42,080 42,091 41,904 41,767 41,548 41,453 41,252 40,927 40,635 40,366 40,006 -4.93Independence 9,483 9,313 9,251 9,268 9,171 8,992 8,815 8,679 8,579 8,509 8,548 -9.86Ingalls 306 300 294 289 293 295 293 291 294 289 252 -17.65Inman 1,377 1,383 1,385 1,390 1,361 1,348 1,330 1,331 1,333 1,334 1,341 -2.61Iola 5,704 5,684 5,680 5,566 5,520 5,426 5,401 5,358 5,331 5,279 5,396 -5.40Isabel 90 91 90 91 91 90 85 84 82 82 68 -24.44Iuka 163 163 165 166 166 165 162 161 159 155 151 -7.36Jamestown 286 281 283 280 279 275 272 266 260 262 237 -17.13Jennings 96 95 94 93 93 94 91 93 92 91 81 -15.63Jetmore 867 885 872 870 851 846 833 840 813 799 770 -11.19Jewell 432 435 430 430 426 415 403 399 396 399 370 -14.35Johnson City 1,495 1,480 1,441 1,457 1,435 1,388 1,414 1,378 1,357 1,332 1,464 -2.07Junction City 23,353 23,969 25,789 25,035 24,816 25,005 24,056 23,047 22,402 21,707 22,932 -1.80Kanopolis 492 490 489 481 477 474 472 472 458 451 443 -9.96Kanorado 153 153 155 155 154 152 152 151 151 152 153 0.00Kansas City 145,786 146,251 147,494 148,961 150,192 151,584 152,608 152,888 153,385 153,488 156,607 7.42Kechi 1,909 1,946 1,960 1,968 1,989 2,000 2,006 2,001 1,999 2,008 2,217 16.13Kensington 473 464 458 452 455 449 444 440 437 435 399 -15.64Kincaid 122 119 117 116 117 116 116 117 117 117 103 -15.57Kingman 3,177 3,184 3,150 3,131 3,074 3,048 2,955 2,897 2,840 2,802 3,105 -2.27Kinsley 1,457 1,454 1,428 1,430 1,456 1,425 1,397 1,385 1,355 1,344 1,456 -0.07Kiowa 1,026 1,041 1,027 1,035 1,028 1,016 984 963 939 938 902 -12.09Kirwin 171 168 168 168 165 162 160 160 156 156 139 -18.71Kismet 459 461 467 466 468 465 460 448 438 429 340 -25.93La Crosse 1,342 1,302 1,301 1,289 1,282 1,257 1,238 1,237 1,232 1,215 1,266 -5.66La Cygne 1,149 1,145 1,125 1,129 1,125 1,124 1,127 1,129 1,130 1,120 1,050 -8.62La Harpe 578 574 569 558 548 539 541 535 533 531 480 -16.96Labette 78 71 71 69 69 69 68 67 67 66 50 -35.90Lake Quivira 906 915 925 932 930 934 941 939 943 938 1,014 11.92Lakin 2,216 2,218 2,224 2,191 2,205 2,200 2,176 2,204 2,196 2,128 2,205 -0.50
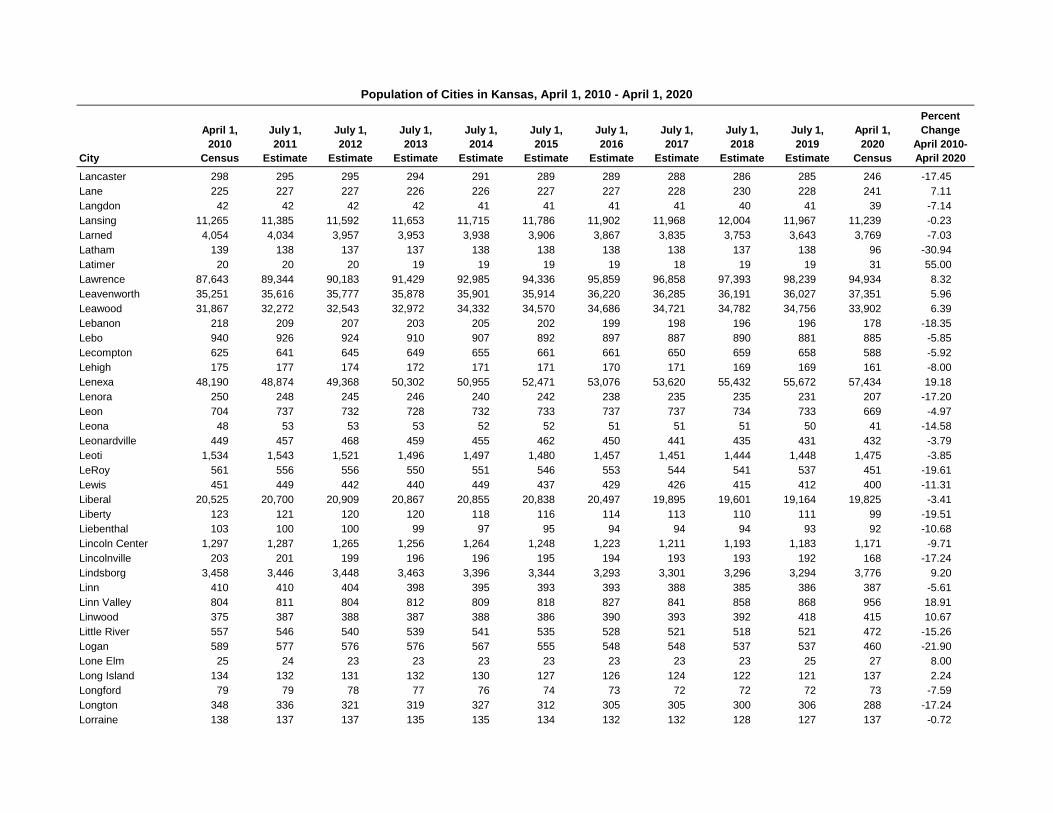
City
April 1,2010
Census
July 1,2011
Estimate
July 1,2012
Estimate
July 1,2013
Estimate
July 1,2014
Estimate
July 1,2015
Estimate
July 1,2016
Estimate
July 1,2017
Estimate
July 1,2018
Estimate
July 1,2019
Estimate
April 1,2020
Census
PercentChange
April 2010- April 2020
Population of Cities in Kansas, April 1, 2010 - April 1, 2020
Lancaster 298 295 295 294 291 289 289 288 286 285 246 -17.45Lane 225 227 227 226 226 227 227 228 230 228 241 7.11Langdon 42 42 42 42 41 41 41 41 40 41 39 -7.14Lansing 11,265 11,385 11,592 11,653 11,715 11,786 11,902 11,968 12,004 11,967 11,239 -0.23Larned 4,054 4,034 3,957 3,953 3,938 3,906 3,867 3,835 3,753 3,643 3,769 -7.03Latham 139 138 137 137 138 138 138 138 137 138 96 -30.94Latimer 20 20 20 19 19 19 19 18 19 19 31 55.00Lawrence 87,643 89,344 90,183 91,429 92,985 94,336 95,859 96,858 97,393 98,239 94,934 8.32Leavenworth 35,251 35,616 35,777 35,878 35,901 35,914 36,220 36,285 36,191 36,027 37,351 5.96Leawood 31,867 32,272 32,543 32,972 34,332 34,570 34,686 34,721 34,782 34,756 33,902 6.39Lebanon 218 209 207 203 205 202 199 198 196 196 178 -18.35Lebo 940 926 924 910 907 892 897 887 890 881 885 -5.85Lecompton 625 641 645 649 655 661 661 650 659 658 588 -5.92Lehigh 175 177 174 172 171 171 170 171 169 169 161 -8.00Lenexa 48,190 48,874 49,368 50,302 50,955 52,471 53,076 53,620 55,432 55,672 57,434 19.18Lenora 250 248 245 246 240 242 238 235 235 231 207 -17.20Leon 704 737 732 728 732 733 737 737 734 733 669 -4.97Leona 48 53 53 53 52 52 51 51 51 50 41 -14.58Leonardville 449 457 468 459 455 462 450 441 435 431 432 -3.79Leoti 1,534 1,543 1,521 1,496 1,497 1,480 1,457 1,451 1,444 1,448 1,475 -3.85LeRoy 561 556 556 550 551 546 553 544 541 537 451 -19.61Lewis 451 449 442 440 449 437 429 426 415 412 400 -11.31Liberal 20,525 20,700 20,909 20,867 20,855 20,838 20,497 19,895 19,601 19,164 19,825 -3.41Liberty 123 121 120 120 118 116 114 113 110 111 99 -19.51Liebenthal 103 100 100 99 97 95 94 94 94 93 92 -10.68Lincoln Center 1,297 1,287 1,265 1,256 1,264 1,248 1,223 1,211 1,193 1,183 1,171 -9.71Lincolnville 203 201 199 196 196 195 194 193 193 192 168 -17.24Lindsborg 3,458 3,446 3,448 3,463 3,396 3,344 3,293 3,301 3,296 3,294 3,776 9.20Linn 410 410 404 398 395 393 393 388 385 386 387 -5.61Linn Valley 804 811 804 812 809 818 827 841 858 868 956 18.91Linwood 375 387 388 387 388 386 390 393 392 418 415 10.67Little River 557 546 540 539 541 535 528 521 518 521 472 -15.26Logan 589 577 576 576 567 555 548 548 537 537 460 -21.90Lone Elm 25 24 23 23 23 23 23 23 23 25 27 8.00Long Island 134 132 131 132 130 127 126 124 122 121 137 2.24Longford 79 79 78 77 76 74 73 72 72 72 73 -7.59Longton 348 336 321 319 327 312 305 305 300 306 288 -17.24Lorraine 138 137 137 135 135 134 132 132 128 127 137 -0.72
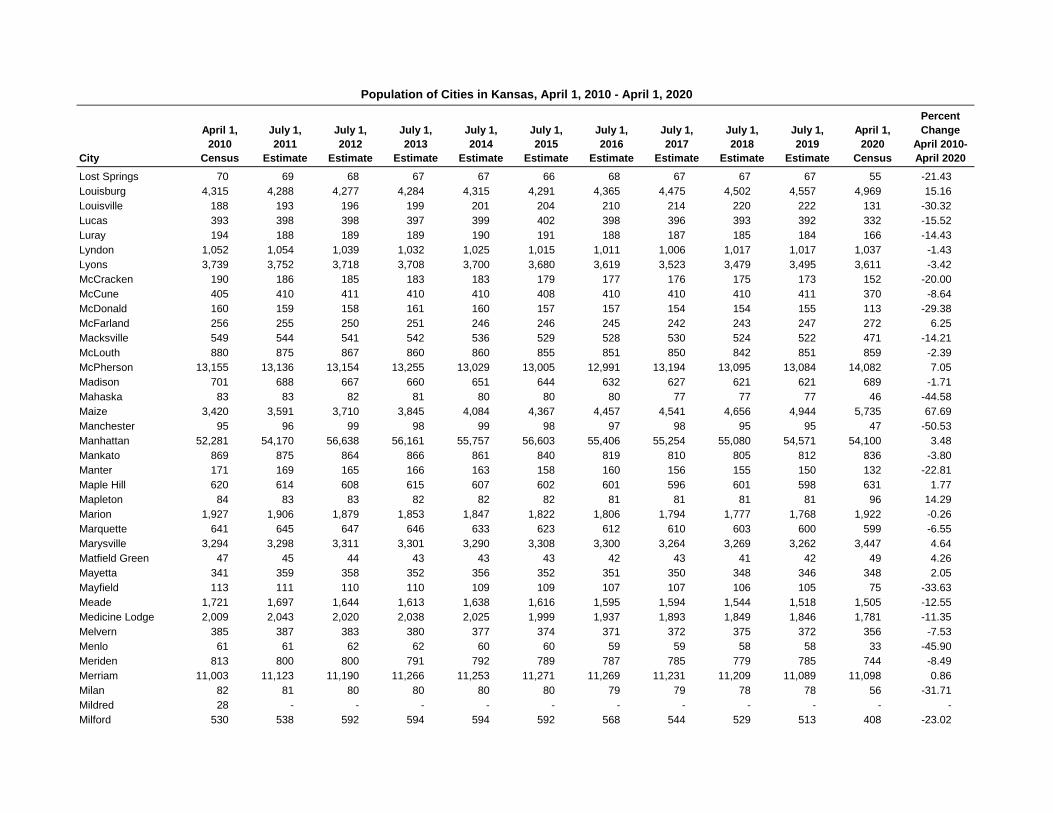
City
April 1,2010
Census
July 1,2011
Estimate
July 1,2012
Estimate
July 1,2013
Estimate
July 1,2014
Estimate
July 1,2015
Estimate
July 1,2016
Estimate
July 1,2017
Estimate
July 1,2018
Estimate
July 1,2019
Estimate
April 1,2020
Census
PercentChange
April 2010- April 2020
Population of Cities in Kansas, April 1, 2010 - April 1, 2020
Lost Springs 70 69 68 67 67 66 68 67 67 67 55 -21.43Louisburg 4,315 4,288 4,277 4,284 4,315 4,291 4,365 4,475 4,502 4,557 4,969 15.16Louisville 188 193 196 199 201 204 210 214 220 222 131 -30.32Lucas 393 398 398 397 399 402 398 396 393 392 332 -15.52Luray 194 188 189 189 190 191 188 187 185 184 166 -14.43Lyndon 1,052 1,054 1,039 1,032 1,025 1,015 1,011 1,006 1,017 1,017 1,037 -1.43Lyons 3,739 3,752 3,718 3,708 3,700 3,680 3,619 3,523 3,479 3,495 3,611 -3.42McCracken 190 186 185 183 183 179 177 176 175 173 152 -20.00McCune 405 410 411 410 410 408 410 410 410 411 370 -8.64McDonald 160 159 158 161 160 157 157 154 154 155 113 -29.38McFarland 256 255 250 251 246 246 245 242 243 247 272 6.25Macksville 549 544 541 542 536 529 528 530 524 522 471 -14.21McLouth 880 875 867 860 860 855 851 850 842 851 859 -2.39McPherson 13,155 13,136 13,154 13,255 13,029 13,005 12,991 13,194 13,095 13,084 14,082 7.05Madison 701 688 667 660 651 644 632 627 621 621 689 -1.71Mahaska 83 83 82 81 80 80 80 77 77 77 46 -44.58Maize 3,420 3,591 3,710 3,845 4,084 4,367 4,457 4,541 4,656 4,944 5,735 67.69Manchester 95 96 99 98 99 98 97 98 95 95 47 -50.53Manhattan 52,281 54,170 56,638 56,161 55,757 56,603 55,406 55,254 55,080 54,571 54,100 3.48Mankato 869 875 864 866 861 840 819 810 805 812 836 -3.80Manter 171 169 165 166 163 158 160 156 155 150 132 -22.81Maple Hill 620 614 608 615 607 602 601 596 601 598 631 1.77Mapleton 84 83 83 82 82 82 81 81 81 81 96 14.29Marion 1,927 1,906 1,879 1,853 1,847 1,822 1,806 1,794 1,777 1,768 1,922 -0.26Marquette 641 645 647 646 633 623 612 610 603 600 599 -6.55Marysville 3,294 3,298 3,311 3,301 3,290 3,308 3,300 3,264 3,269 3,262 3,447 4.64Matfield Green 47 45 44 43 43 43 42 43 41 42 49 4.26Mayetta 341 359 358 352 356 352 351 350 348 346 348 2.05Mayfield 113 111 110 110 109 109 107 107 106 105 75 -33.63Meade 1,721 1,697 1,644 1,613 1,638 1,616 1,595 1,594 1,544 1,518 1,505 -12.55Medicine Lodge 2,009 2,043 2,020 2,038 2,025 1,999 1,937 1,893 1,849 1,846 1,781 -11.35Melvern 385 387 383 380 377 374 371 372 375 372 356 -7.53Menlo 61 61 62 62 60 60 59 59 58 58 33 -45.90Meriden 813 800 800 791 792 789 787 785 779 785 744 -8.49Merriam 11,003 11,123 11,190 11,266 11,253 11,271 11,269 11,231 11,209 11,089 11,098 0.86Milan 82 81 80 80 80 80 79 79 78 78 56 -31.71Mildred 28 - - - - - - - - - - -Milford 530 538 592 594 594 592 568 544 529 513 408 -23.02

City
April 1,2010
Census
July 1,2011
Estimate
July 1,2012
Estimate
July 1,2013
Estimate
July 1,2014
Estimate
July 1,2015
Estimate
July 1,2016
Estimate
July 1,2017
Estimate
July 1,2018
Estimate
July 1,2019
Estimate
April 1,2020
Census
PercentChange
April 2010- April 2020
Population of Cities in Kansas, April 1, 2010 - April 1, 2020
Miltonvale 539 528 526 523 521 511 506 495 485 487 440 -18.37Minneapolis 2,032 2,026 2,013 2,020 2,019 1,990 1,978 1,948 1,919 1,904 1,946 -4.23Minneola 745 718 736 739 718 706 702 680 680 682 738 -0.94
Mission 9,323 9,406 9,459 9,505 9,476 9,481 9,467 9,428 9,403 9,922 9,954 6.77Mission Hills 3,498 3,515 3,538 3,558 3,565 3,575 3,587 3,572 3,582 3,550 3,594 2.74Mission Woods 178 180 181 180 180 198 196 195 195 193 203 14.04Moline 371 359 342 337 345 329 321 320 315 320 345 -7.01Montezuma 966 972 949 944 967 967 960 956 971 961 975 0.93Moran 558 559 554 545 533 525 523 518 516 510 466 -16.49Morganville 192 196 195 194 192 193 188 188 188 190 180 -6.25Morland 154 156 153 154 152 155 152 147 145 145 115 -25.32Morrill 230 235 232 234 231 227 226 228 227 226 218 -5.22Morrowville 155 158 155 151 150 149 149 147 147 147 114 -26.45Moscow 310 314 320 323 322 318 310 303 299 293 272 -12.26Mound City 694 689 681 681 681 680 680 682 685 678 647 -6.77Mound Valley 407 402 401 395 391 389 383 380 376 376 348 -14.50Moundridge 1,737 1,863 1,861 1,871 1,834 1,807 1,835 1,872 1,865 1,869 1,974 13.64Mount Hope 813 817 818 816 816 814 810 805 801 802 806 -0.86Mulberry 520 519 522 519 520 519 519 520 520 519 409 -21.35Mullinville 255 253 248 250 248 253 245 244 243 239 197 -22.75Mulvane 6,111 6,138 6,263 6,282 6,277 6,293 6,307 6,362 6,427 6,489 6,286 2.86Munden 100 98 96 96 95 93 93 93 93 91 96 -4.00Muscotah 176 174 175 174 172 171 170 170 169 168 155 -11.93Narka 94 93 91 88 88 86 86 86 85 84 81 -13.83Nashville 64 62 62 62 61 61 59 58 57 56 54 -15.63Natoma 335 332 330 328 324 314 310 304 297 295 302 -9.85Neodesha 2,486 2,440 2,406 2,414 2,382 2,353 2,315 2,313 2,300 2,268 2,275 -8.49Neosho Falls 141 142 140 137 136 136 138 135 138 135 134 -4.96Neosho Rapids 265 264 266 265 263 263 263 264 263 263 229 -13.58Ness City 1,449 1,472 1,452 1,459 1,460 1,430 1,404 1,354 1,331 1,316 1,329 -8.28Netawaka 143 142 142 143 144 142 139 139 139 137 139 -2.80New Albany 56 55 54 54 53 53 52 52 52 51 57 1.79New Cambria 126 126 126 127 127 126 127 125 125 126 106 -15.87New Strawn 394 388 385 386 394 390 392 387 382 378 414 5.08Newton 19,132 19,094 19,120 19,075 18,994 19,070 19,022 18,822 18,771 18,874 18,602 -2.77Nickerson 1,070 1,047 1,043 1,038 1,027 1,025 1,013 1,003 995 987 1,058 -1.12Niotaze 82 81 80 79 77 76 75 74 74 72 90 9.76

City
April 1,2010
Census
July 1,2011
Estimate
July 1,2012
Estimate
July 1,2013
Estimate
July 1,2014
Estimate
July 1,2015
Estimate
July 1,2016
Estimate
July 1,2017
Estimate
July 1,2018
Estimate
July 1,2019
Estimate
April 1,2020
Census
PercentChange
April 2010- April 2020
Population of Cities in Kansas, April 1, 2010 - April 1, 2020
Norcatur 151 149 147 149 147 150 144 146 145 144 159 5.30North Newton 1,759 1,780 1,779 1,792 1,784 1,797 1,795 1,777 1,756 1,762 1,814 3.13Norton 2,928 2,879 2,841 2,859 2,816 2,818 2,804 2,769 2,776 2,734 2,747 -6.18Nortonville 637 627 623 619 615 615 614 614 608 612 601 -5.65Norwich 491 495 490 485 477 472 458 450 440 432 444 -9.57Oak Hill 24 24 24 24 24 24 24 23 23 23 24 0.00Oakley 2,045 2,048 2,068 2,062 2,055 2,068 2,094 2,087 2,081 2,062 2,046 0.05Oberlin 1,788 1,764 1,739 1,753 1,746 1,759 1,701 1,723 1,707 1,692 1,644 -8.05Offerle 199 198 195 195 199 193 189 188 183 182 179 -10.05Ogden 2,087 2,134 2,190 2,164 2,128 2,140 2,065 1,993 1,973 1,949 1,661 -20.41Oketo 66 73 73 73 73 70 71 70 70 70 64 -3.03Olathe 125,872 128,332 129,991 131,847 132,904 134,384 136,040 137,678 139,949 140,648 141,290 12.25Olivet 67 67 66 67 67 66 66 66 66 66 73 8.96Olmitz 114 114 114 113 113 112 111 109 107 106 90 -21.05Olpe 546 546 546 545 539 540 543 538 537 535 519 -4.95Olsburg 219 223 224 223 223 222 222 224 222 219 218 -0.46Onaga 702 702 706 701 693 690 691 689 688 684 679 -3.28Oneida 75 71 71 71 71 71 71 71 71 71 61 -18.67Osage City 2,943 2,941 2,905 2,881 2,857 2,834 2,819 2,815 2,817 2,803 2,861 -2.79Osawatomie 4,447 4,408 4,382 4,377 4,351 4,312 4,295 4,290 4,258 4,273 4,255 -4.32Osborne 1,431 1,425 1,417 1,411 1,394 1,352 1,337 1,315 1,284 1,279 1,335 -6.71Oskaloosa 1,113 1,094 1,088 1,080 1,077 1,074 1,069 1,067 1,060 1,065 1,110 -0.27Oswego 1,829 1,844 1,825 1,800 1,793 1,779 1,752 1,737 1,716 1,695 1,668 -8.80Otis 282 275 275 271 270 265 261 260 260 256 296 4.96Ottawa 12,649 12,561 12,523 12,451 12,330 12,280 12,286 12,320 12,302 12,296 12,625 -0.19Overbrook 1,058 1,056 1,044 1,035 1,026 1,021 1,017 1,015 1,017 1,019 1,005 -5.01Overland Park 173,372 176,074 178,752 181,030 184,101 186,371 189,489 191,570 193,018 195,679 197,238 13.77Oxford 1,049 1,033 1,023 1,018 1,013 1,012 1,007 1,007 1,004 998 1,048 -0.10Ozawkie 645 639 632 627 626 621 620 622 620 625 638 -1.09Palco 277 282 283 284 285 284 280 276 272 268 208 -24.91Palmer 111 112 110 108 108 107 107 105 105 105 125 12.61Paola 5,602 5,590 5,564 5,630 5,601 5,559 5,559 5,581 5,680 5,721 5,768 2.96Paradise 49 49 49 49 50 50 50 49 49 48 35 -28.57Park 126 127 129 130 126 123 117 116 112 113 112 -11.11Park City 7,297 7,393 7,452 7,545 7,570 7,630 7,679 7,695 7,699 7,765 8,333 14.20Parker 277 273 268 269 269 268 268 269 269 266 241 -13.00
Parkerfield 426 424 426 427 423 424 420 418 417 413 406 -4.69
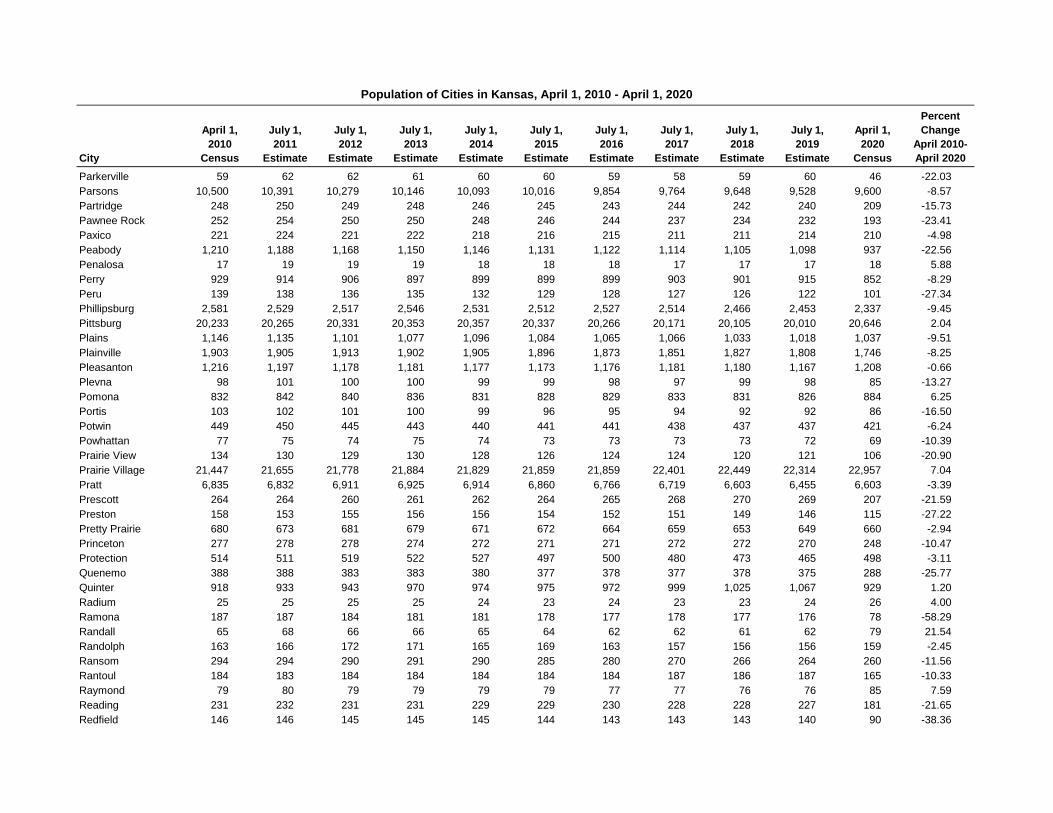
City
April 1,2010
Census
July 1,2011
Estimate
July 1,2012
Estimate
July 1,2013
Estimate
July 1,2014
Estimate
July 1,2015
Estimate
July 1,2016
Estimate
July 1,2017
Estimate
July 1,2018
Estimate
July 1,2019
Estimate
April 1,2020
Census
PercentChange
April 2010- April 2020
Population of Cities in Kansas, April 1, 2010 - April 1, 2020
Parkerville 59 62 62 61 60 60 59 58 59 60 46 -22.03Parsons 10,500 10,391 10,279 10,146 10,093 10,016 9,854 9,764 9,648 9,528 9,600 -8.57Partridge 248 250 249 248 246 245 243 244 242 240 209 -15.73Pawnee Rock 252 254 250 250 248 246 244 237 234 232 193 -23.41Paxico 221 224 221 222 218 216 215 211 211 214 210 -4.98Peabody 1,210 1,188 1,168 1,150 1,146 1,131 1,122 1,114 1,105 1,098 937 -22.56Penalosa 17 19 19 19 18 18 18 17 17 17 18 5.88Perry 929 914 906 897 899 899 899 903 901 915 852 -8.29Peru 139 138 136 135 132 129 128 127 126 122 101 -27.34Phillipsburg 2,581 2,529 2,517 2,546 2,531 2,512 2,527 2,514 2,466 2,453 2,337 -9.45Pittsburg 20,233 20,265 20,331 20,353 20,357 20,337 20,266 20,171 20,105 20,010 20,646 2.04Plains 1,146 1,135 1,101 1,077 1,096 1,084 1,065 1,066 1,033 1,018 1,037 -9.51Plainville 1,903 1,905 1,913 1,902 1,905 1,896 1,873 1,851 1,827 1,808 1,746 -8.25Pleasanton 1,216 1,197 1,178 1,181 1,177 1,173 1,176 1,181 1,180 1,167 1,208 -0.66Plevna 98 101 100 100 99 99 98 97 99 98 85 -13.27Pomona 832 842 840 836 831 828 829 833 831 826 884 6.25Portis 103 102 101 100 99 96 95 94 92 92 86 -16.50Potwin 449 450 445 443 440 441 441 438 437 437 421 -6.24Powhattan 77 75 74 75 74 73 73 73 73 72 69 -10.39Prairie View 134 130 129 130 128 126 124 124 120 121 106 -20.90Prairie Village 21,447 21,655 21,778 21,884 21,829 21,859 21,859 22,401 22,449 22,314 22,957 7.04Pratt 6,835 6,832 6,911 6,925 6,914 6,860 6,766 6,719 6,603 6,455 6,603 -3.39Prescott 264 264 260 261 262 264 265 268 270 269 207 -21.59Preston 158 153 155 156 156 154 152 151 149 146 115 -27.22Pretty Prairie 680 673 681 679 671 672 664 659 653 649 660 -2.94Princeton 277 278 278 274 272 271 271 272 272 270 248 -10.47Protection 514 511 519 522 527 497 500 480 473 465 498 -3.11Quenemo 388 388 383 383 380 377 378 377 378 375 288 -25.77Quinter 918 933 943 970 974 975 972 999 1,025 1,067 929 1.20Radium 25 25 25 25 24 23 24 23 23 24 26 4.00Ramona 187 187 184 181 181 178 177 178 177 176 78 -58.29Randall 65 68 66 66 65 64 62 62 61 62 79 21.54Randolph 163 166 172 171 165 169 163 157 156 156 159 -2.45Ransom 294 294 290 291 290 285 280 270 266 264 260 -11.56Rantoul 184 183 184 184 184 184 184 187 186 187 165 -10.33Raymond 79 80 79 79 79 79 77 77 76 76 85 7.59Reading 231 232 231 231 229 229 230 228 228 227 181 -21.65Redfield 146 146 145 145 145 144 143 143 143 140 90 -38.36
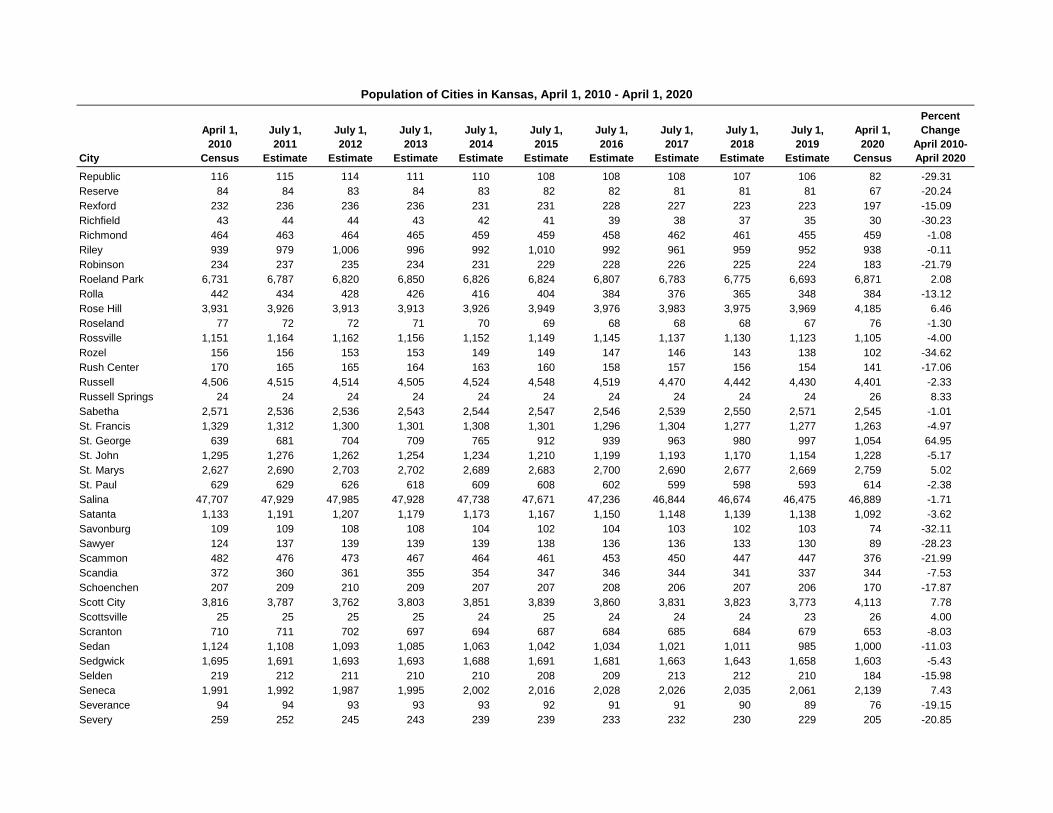
City
April 1,2010
Census
July 1,2011
Estimate
July 1,2012
Estimate
July 1,2013
Estimate
July 1,2014
Estimate
July 1,2015
Estimate
July 1,2016
Estimate
July 1,2017
Estimate
July 1,2018
Estimate
July 1,2019
Estimate
April 1,2020
Census
PercentChange
April 2010- April 2020
Population of Cities in Kansas, April 1, 2010 - April 1, 2020
Republic 116 115 114 111 110 108 108 108 107 106 82 -29.31Reserve 84 84 83 84 83 82 82 81 81 81 67 -20.24Rexford 232 236 236 236 231 231 228 227 223 223 197 -15.09Richfield 43 44 44 43 42 41 39 38 37 35 30 -30.23Richmond 464 463 464 465 459 459 458 462 461 455 459 -1.08Riley 939 979 1,006 996 992 1,010 992 961 959 952 938 -0.11Robinson 234 237 235 234 231 229 228 226 225 224 183 -21.79Roeland Park 6,731 6,787 6,820 6,850 6,826 6,824 6,807 6,783 6,775 6,693 6,871 2.08Rolla 442 434 428 426 416 404 384 376 365 348 384 -13.12Rose Hill 3,931 3,926 3,913 3,913 3,926 3,949 3,976 3,983 3,975 3,969 4,185 6.46Roseland 77 72 72 71 70 69 68 68 68 67 76 -1.30Rossville 1,151 1,164 1,162 1,156 1,152 1,149 1,145 1,137 1,130 1,123 1,105 -4.00Rozel 156 156 153 153 149 149 147 146 143 138 102 -34.62Rush Center 170 165 165 164 163 160 158 157 156 154 141 -17.06Russell 4,506 4,515 4,514 4,505 4,524 4,548 4,519 4,470 4,442 4,430 4,401 -2.33Russell Springs 24 24 24 24 24 24 24 24 24 24 26 8.33Sabetha 2,571 2,536 2,536 2,543 2,544 2,547 2,546 2,539 2,550 2,571 2,545 -1.01St. Francis 1,329 1,312 1,300 1,301 1,308 1,301 1,296 1,304 1,277 1,277 1,263 -4.97St. George 639 681 704 709 765 912 939 963 980 997 1,054 64.95St. John 1,295 1,276 1,262 1,254 1,234 1,210 1,199 1,193 1,170 1,154 1,228 -5.17St. Marys 2,627 2,690 2,703 2,702 2,689 2,683 2,700 2,690 2,677 2,669 2,759 5.02St. Paul 629 629 626 618 609 608 602 599 598 593 614 -2.38Salina 47,707 47,929 47,985 47,928 47,738 47,671 47,236 46,844 46,674 46,475 46,889 -1.71Satanta 1,133 1,191 1,207 1,179 1,173 1,167 1,150 1,148 1,139 1,138 1,092 -3.62Savonburg 109 109 108 108 104 102 104 103 102 103 74 -32.11Sawyer 124 137 139 139 139 138 136 136 133 130 89 -28.23Scammon 482 476 473 467 464 461 453 450 447 447 376 -21.99Scandia 372 360 361 355 354 347 346 344 341 337 344 -7.53Schoenchen 207 209 210 209 207 207 208 206 207 206 170 -17.87Scott City 3,816 3,787 3,762 3,803 3,851 3,839 3,860 3,831 3,823 3,773 4,113 7.78Scottsville 25 25 25 25 24 25 24 24 24 23 26 4.00Scranton 710 711 702 697 694 687 684 685 684 679 653 -8.03Sedan 1,124 1,108 1,093 1,085 1,063 1,042 1,034 1,021 1,011 985 1,000 -11.03Sedgwick 1,695 1,691 1,693 1,693 1,688 1,691 1,681 1,663 1,643 1,658 1,603 -5.43Selden 219 212 211 210 210 208 209 213 212 210 184 -15.98Seneca 1,991 1,992 1,987 1,995 2,002 2,016 2,028 2,026 2,035 2,061 2,139 7.43Severance 94 94 93 93 93 92 91 91 90 89 76 -19.15Severy 259 252 245 243 239 239 233 232 230 229 205 -20.85

City
April 1,2010
Census
July 1,2011
Estimate
July 1,2012
Estimate
July 1,2013
Estimate
July 1,2014
Estimate
July 1,2015
Estimate
July 1,2016
Estimate
July 1,2017
Estimate
July 1,2018
Estimate
July 1,2019
Estimate
April 1,2020
Census
PercentChange
April 2010- April 2020
Population of Cities in Kansas, April 1, 2010 - April 1, 2020
Seward 64 63 62 62 63 62 62 63 62 61 41 -35.94Sharon 158 160 159 158 158 156 151 148 145 145 147 -6.96Sharon Springs 748 766 765 782 754 754 750 759 744 761 751 0.40Shawnee 62,209 63,027 63,586 64,280 64,494 65,050 65,443 65,641 66,036 65,864 67,311 8.20Silver Lake 1,439 1,440 1,437 1,432 1,427 1,428 1,425 1,420 1,410 1,405 1,345 -6.53Simpson 86 85 85 84 83 83 82 81 81 79 82 -4.65Smith Center 1,665 1,643 1,632 1,614 1,633 1,620 1,604 1,586 1,571 1,565 1,571 -5.65Smolan 215 217 217 216 213 212 210 206 205 204 162 -24.65Soldier 136 138 140 139 140 136 135 135 134 132 102 -25.00Solomon 1,095 1,091 1,089 1,064 1,050 1,044 1,028 1,022 1,008 996 993 -9.32South Haven 363 363 364 365 360 359 357 353 351 349 324 -10.74South Hutchinson 2,457 2,470 2,474 2,539 2,535 2,546 2,533 2,517 2,506 2,484 2,521 2.60Spearville 773 793 801 806 810 806 804 799 784 777 791 2.33Speed 37 36 36 36 36 35 35 35 34 34 37 0.00Spivey 78 85 84 86 84 83 81 79 78 77 61 -21.79Spring Hill 5,437 5,539 5,607 5,718 5,879 5,987 6,171 6,621 6,984 7,336 7,952 46.26Stafford 1,042 1,029 1,017 1,012 996 979 969 963 944 931 959 -7.97Stark 72 70 70 69 68 68 67 67 67 66 69 -4.17Sterling 2,328 2,328 2,302 2,296 2,296 2,283 2,250 2,213 2,196 2,205 2,248 -3.44Stockton 1,329 1,329 1,332 1,323 1,325 1,319 1,307 1,291 1,273 1,261 1,480 11.36Strong City 485 480 475 464 457 458 453 457 443 446 386 -20.41Sublette 1,453 1,445 1,425 1,396 1,388 1,383 1,361 1,359 1,352 1,348 1,413 -2.75Summerfield 156 152 152 152 152 149 148 146 147 147 125 -19.87Sun City 53 54 53 54 53 53 51 50 48 48 37 -30.19Susank 34 34 34 34 34 33 33 32 32 32 31 -8.82Sylvan Grove 279 295 290 287 289 286 278 276 270 268 291 4.30Sylvia 218 213 213 212 210 210 208 206 206 205 215 -1.38Syracuse 1,812 1,774 1,783 1,760 1,785 1,723 1,767 1,753 1,735 1,691 1,826 0.77Tampa 112 111 109 107 107 104 103 103 102 100 105 -6.25Tescott 319 307 305 306 303 298 297 291 286 282 265 -16.93Thayer 497 488 484 479 473 474 470 469 464 464 432 -13.08The Highlands - 327 328 325 324 324 321 318 316 314 349 - Timken 76 68 68 67 67 66 65 65 65 64 38 -50.00Tipton 210 207 205 206 203 205 200 198 197 192 193 -8.10Tonganoxie 4,996 5,085 5,118 5,163 5,193 5,252 5,343 5,469 5,556 5,597 5,573 11.55Topeka 127,473 128,242 128,123 127,771 127,549 127,468 126,993 126,547 125,731 125,209 126,587 -0.70Toronto 281 283 280 274 271 267 269 264 266 259 206 -26.69Towanda 1,450 1,485 1,477 1,470 1,465 1,465 1,470 1,469 1,459 1,454 1,447 -0.21
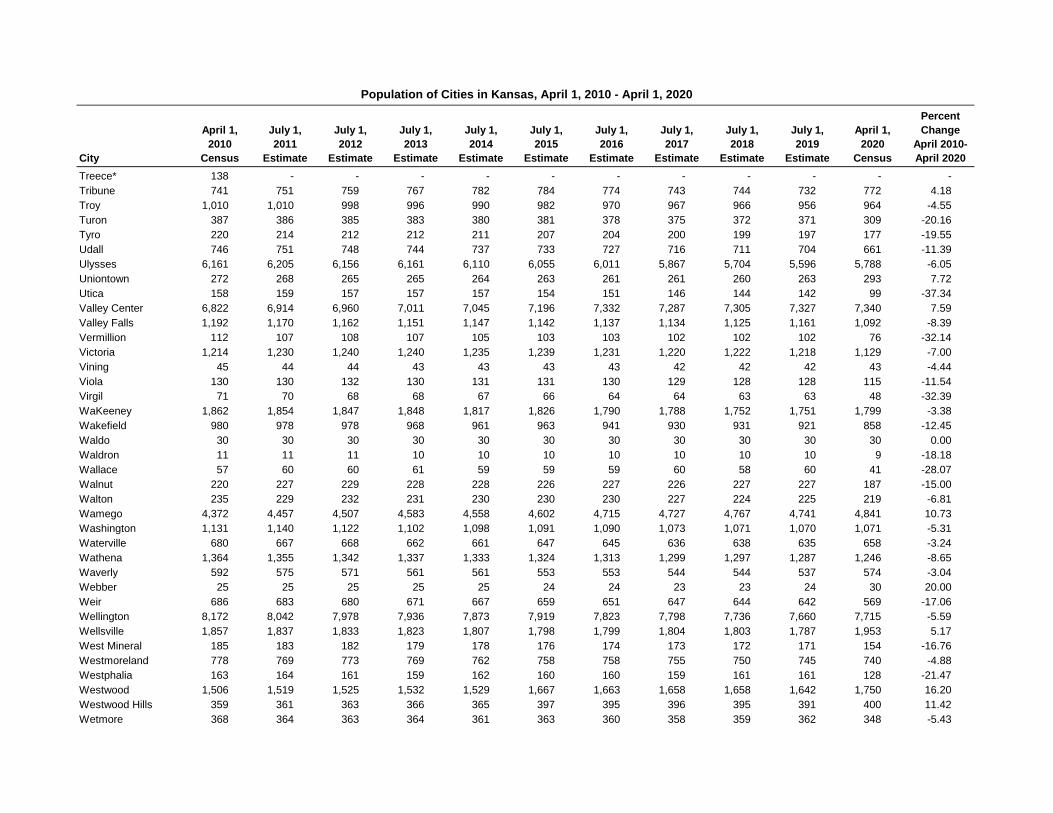
City
April 1,2010
Census
July 1,2011
Estimate
July 1,2012
Estimate
July 1,2013
Estimate
July 1,2014
Estimate
July 1,2015
Estimate
July 1,2016
Estimate
July 1,2017
Estimate
July 1,2018
Estimate
July 1,2019
Estimate
April 1,2020
Census
PercentChange
April 2010- April 2020
Population of Cities in Kansas, April 1, 2010 - April 1, 2020
Treece* 138 - - - - - - - - - - -Tribune 741 751 759 767 782 784 774 743 744 732 772 4.18Troy 1,010 1,010 998 996 990 982 970 967 966 956 964 -4.55Turon 387 386 385 383 380 381 378 375 372 371 309 -20.16Tyro 220 214 212 212 211 207 204 200 199 197 177 -19.55Udall 746 751 748 744 737 733 727 716 711 704 661 -11.39Ulysses 6,161 6,205 6,156 6,161 6,110 6,055 6,011 5,867 5,704 5,596 5,788 -6.05Uniontown 272 268 265 265 264 263 261 261 260 263 293 7.72Utica 158 159 157 157 157 154 151 146 144 142 99 -37.34Valley Center 6,822 6,914 6,960 7,011 7,045 7,196 7,332 7,287 7,305 7,327 7,340 7.59Valley Falls 1,192 1,170 1,162 1,151 1,147 1,142 1,137 1,134 1,125 1,161 1,092 -8.39Vermillion 112 107 108 107 105 103 103 102 102 102 76 -32.14Victoria 1,214 1,230 1,240 1,240 1,235 1,239 1,231 1,220 1,222 1,218 1,129 -7.00Vining 45 44 44 43 43 43 43 42 42 42 43 -4.44Viola 130 130 132 130 131 131 130 129 128 128 115 -11.54Virgil 71 70 68 68 67 66 64 64 63 63 48 -32.39WaKeeney 1,862 1,854 1,847 1,848 1,817 1,826 1,790 1,788 1,752 1,751 1,799 -3.38Wakefield 980 978 978 968 961 963 941 930 931 921 858 -12.45Waldo 30 30 30 30 30 30 30 30 30 30 30 0.00Waldron 11 11 11 10 10 10 10 10 10 10 9 -18.18Wallace 57 60 60 61 59 59 59 60 58 60 41 -28.07Walnut 220 227 229 228 228 226 227 226 227 227 187 -15.00Walton 235 229 232 231 230 230 230 227 224 225 219 -6.81Wamego 4,372 4,457 4,507 4,583 4,558 4,602 4,715 4,727 4,767 4,741 4,841 10.73Washington 1,131 1,140 1,122 1,102 1,098 1,091 1,090 1,073 1,071 1,070 1,071 -5.31Waterville 680 667 668 662 661 647 645 636 638 635 658 -3.24Wathena 1,364 1,355 1,342 1,337 1,333 1,324 1,313 1,299 1,297 1,287 1,246 -8.65Waverly 592 575 571 561 561 553 553 544 544 537 574 -3.04Webber 25 25 25 25 25 24 24 23 23 24 30 20.00Weir 686 683 680 671 667 659 651 647 644 642 569 -17.06Wellington 8,172 8,042 7,978 7,936 7,873 7,919 7,823 7,798 7,736 7,660 7,715 -5.59Wellsville 1,857 1,837 1,833 1,823 1,807 1,798 1,799 1,804 1,803 1,787 1,953 5.17West Mineral 185 183 182 179 178 176 174 173 172 171 154 -16.76Westmoreland 778 769 773 769 762 758 758 755 750 745 740 -4.88Westphalia 163 164 161 159 162 160 160 159 161 161 128 -21.47Westwood 1,506 1,519 1,525 1,532 1,529 1,667 1,663 1,658 1,658 1,642 1,750 16.20Westwood Hills 359 361 363 366 365 397 395 396 395 391 400 11.42Wetmore 368 364 363 364 361 363 360 358 359 362 348 -5.43
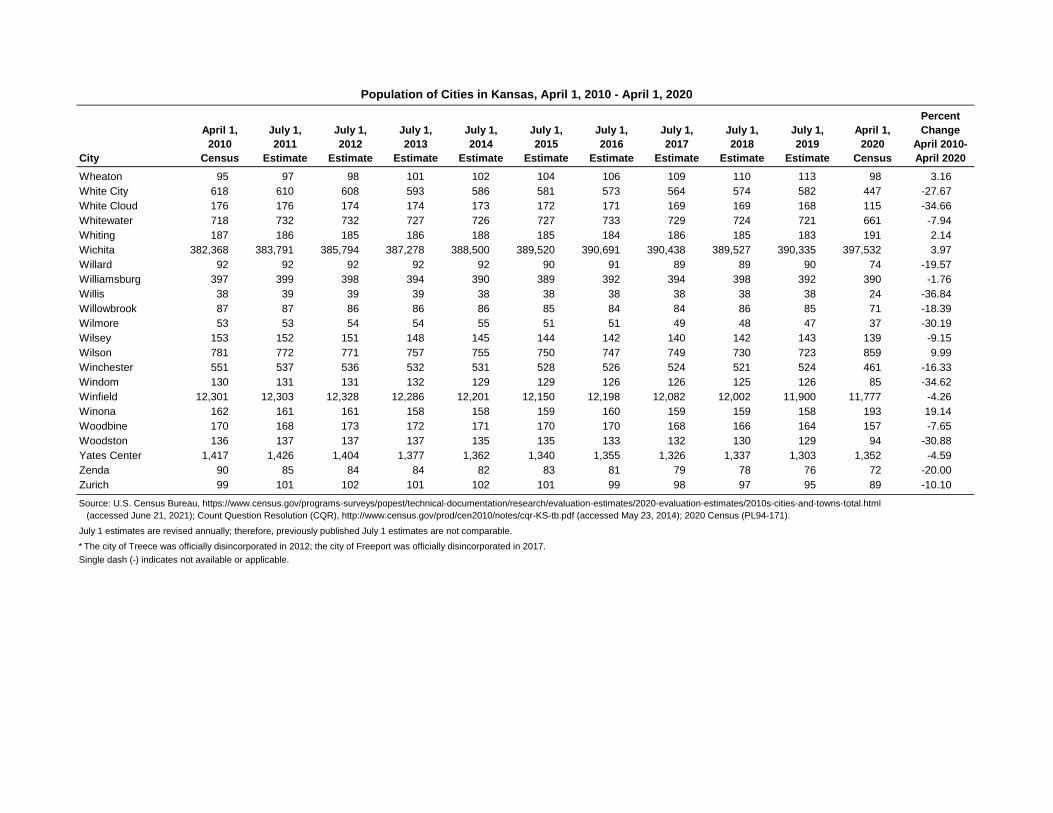
City
April 1,2010
Census
July 1,2011
Estimate
July 1,2012
Estimate
July 1,2013
Estimate
July 1,2014
Estimate
July 1,2015
Estimate
July 1,2016
Estimate
July 1,2017
Estimate
July 1,2018
Estimate
July 1,2019
Estimate
April 1,2020
Census
PercentChange
April 2010- April 2020
Population of Cities in Kansas, April 1, 2010 - April 1, 2020
Wheaton 95 97 98 101 102 104 106 109 110 113 98 3.16White City 618 610 608 593 586 581 573 564 574 582 447 -27.67White Cloud 176 176 174 174 173 172 171 169 169 168 115 -34.66Whitewater 718 732 732 727 726 727 733 729 724 721 661 -7.94Whiting 187 186 185 186 188 185 184 186 185 183 191 2.14Wichita 382,368 383,791 385,794 387,278 388,500 389,520 390,691 390,438 389,527 390,335 397,532 3.97Willard 92 92 92 92 92 90 91 89 89 90 74 -19.57Williamsburg 397 399 398 394 390 389 392 394 398 392 390 -1.76Willis 38 39 39 39 38 38 38 38 38 38 24 -36.84Willowbrook 87 87 86 86 86 85 84 84 86 85 71 -18.39Wilmore 53 53 54 54 55 51 51 49 48 47 37 -30.19Wilsey 153 152 151 148 145 144 142 140 142 143 139 -9.15Wilson 781 772 771 757 755 750 747 749 730 723 859 9.99Winchester 551 537 536 532 531 528 526 524 521 524 461 -16.33Windom 130 131 131 132 129 129 126 126 125 126 85 -34.62Winfield 12,301 12,303 12,328 12,286 12,201 12,150 12,198 12,082 12,002 11,900 11,777 -4.26Winona 162 161 161 158 158 159 160 159 159 158 193 19.14Woodbine 170 168 173 172 171 170 170 168 166 164 157 -7.65Woodston 136 137 137 137 135 135 133 132 130 129 94 -30.88Yates Center 1,417 1,426 1,404 1,377 1,362 1,340 1,355 1,326 1,337 1,303 1,352 -4.59Zenda 90 85 84 84 82 83 81 79 78 76 72 -20.00Zurich 99 101 102 101 102 101 99 98 97 95 89 -10.10
Single dash (-) indicates not available or applicable.
July 1 estimates are revised annually; therefore, previously published July 1 estimates are not comparable.
* The city of Treece was officially disincorporated in 2012; the city of Freeport was officially disincorporated in 2017.
Source: U.S. Census Bureau, https://www.census.gov/programs-surveys/popest/technical-documentation/research/evaluation-estimates/2020-evaluation-estimates/2010s-cities-and-towns-total.html (accessed June 21, 2021); Count Question Resolution (CQR), http://www.census.gov/prod/cen2010/notes/cqr-KS-tb.pdf (accessed May 23, 2014); 2020 Census (PL94-171).
Related Documents