Population Growth, Fertility Decline, and Ageing in Hong Kong The Perceived and Real Demographic Effects of Migration I Jianfa Shen Erbiao Dai Shanghai-Hong Kong Development Institute Hong Kong Institute of Asia-Pacific Studies July 2006

Welcome message from author
This document is posted to help you gain knowledge. Please leave a comment to let me know what you think about it! Share it to your friends and learn new things together.
Transcript

Population Growth, Fertility Decline, and Ageing in Hong Kong
The Perceived and Real Demographic Effects of MigrationI
Jianfa Shen
Erbiao Dai
Shanghai-Hong Kong Development Institute
Hong Kong Institute ofAsia-Pacific Studies
July 2006
Shanghai-Hong Kong Development institute Occasional Paper No. i4
About the Authors
Jianfa Shen is Co-director, Urhan and Regional Development in Pacific Asia Programme at the Hong Kong Institute of Asia-Pacific Studies and Professor at the Department of Geography and Resource Management, The Chinese University of Hong Kong.
Erbiao Dai is a Research Associate Professor in the International Centre for the Study of East Asian Development, Kitakyushu, Japan.
Opinions expressed in the publications of the Shanghai-Hong Kong Development
Institute and Hong Kong Institute of Asia-Pacific Studies are the authors'. They
do not necessarily reflect those of the Institutes.
© 2006 Jianfa Shen and Erbiao Dai
ISBN-IO: 962-441-814-4 ISBN-13: 978-962-441-814-9
All rights reserved. No part of this book may be reproduced in any form without
written pennission from the authors.
Population Growth, Fertility Decline, and Ageing in Hong Kong
The Perceived and Real Demographic Effects of Migration
Introduction
Demographic changes have profound social and economic implications (Ng, 1992:233). The most dramatic example in Hong Kong is the shrinking of the school age population. This has put great pressure on various schools. Some 129 primary schools stopped admitting year-one students and 69 primary schools were closed in the period from September 2002 to September 2005 (Ming Pao Daily News, 16 February 2006). It is expected that some secondary schools will also be closed, as the numher of year-one students entering secondary schools will decline from about 82,000 in 2005 to 61,000 in 2010. Declining levels of fertility and an ageing population have also attracted much public attention in Hong Kong (Task Force on Population Policy, 2003; Shen, 2005a, 2005b).
Hong Kong has experienced a significant growth in population since the end of the Second World War (Ho, Liu and Lam, 1991). Migration from mainland China bas been a significant source of population growth and fuelled the development of labour-intensive manufacturing in the 1960s and 1970s. Since the early 1980s, althougb the demand for low-skilled migrant labour has declined with the emergence of a business-services based economy, the inflow of migrants from mainland China has remained at a fairly high level.

3 2 Population Growth, Fertility Decline. and Ageing in Hong Kong
During the years following the outbreak of the Asian Financial I
Crisis in 1997, Hong Kong faced a difficult economic situation. Both the rate of unemployment and the number of recipients of Comprehensive Social SecurityAssistance (CSSA) increased sharply. The annual inflow ofabout 50,000 migrants from mainland China with one-way permits is considered to cause problems of unemployment and poverty, as such migrants have less education and lower levels of income than local Hong Kong residents. For example, the number of new arrivals (those who have resided in Hong Kong for less than seven years), mainly from mainland China, receiving CSSA benefits increased from 45,945 in March 1999 to 69,345 in December 2002, growing from 12.0% to 14.9% of total CSSArecipients in the same period. In June 2002, 16.6% of new arrivals were CSSA recipients, while only 5.7% of the local population were CSSA recipients (Task Force on Population Policy, 2003:76-79). One major policy suggestion of the government's Task Force on Population Policy (2003) is that migrants will only be eligible for CSSA and subsidized public medical services after having resided in Hong Kong for over seven years. Another suggestion was to introduce new migration schcmes to attract migrants with talent or capital.
Indeed, several studies have examined the economic performance of migranl$ in Hong Kong (Lam and Liu, 1993, 2000). Lam and Liu (1998: 118) found that the income gap between mainland migrants and thc local population widened from 11.3% in 1981 to 28.7% in 1996. Their study was based on migrants who arrived in Hong Kong before 1981. Chiu, Choi, and Ting (2005) found that migrants who had lived ill Hong Kong for over ten years still had a lower income than natives. The recent 200 I census also showed that the income of new migrants from the mainland fell below the average level of the total population. The median monthly income ofdomestic households with new migrants dropped from HK$13,000 in 1996 to HK$12,050 in 200 I, while that of all domestic households in Hong Kong increased from HK$17,500 to HK$18,705 (CSD, 2002d:40). Other than some low-income households with new migrants who are unable to meet their basic needs (about 20%) and thus rely on CSSA, the dilemma facing new migrants from mainland China is that their income is
Population Growth, Fertility Decline, and Ageing in Hong Kong
low in Hong Kong but their cash income is significantly higher than the ordinary income in mainland China. Thus, Hong Kong remains attractive to most migrants from mainland China.
The focus ofthis paper is on the demographic effeet ofmigration on the population in Hong Kong. There are positive and negative perceptions ofthe demographie effects ofmigration. Some are eorrect, while others are wrong and need clarifieation. For example, accepting migrants from mainland China has been considered to be an effective way of relieving the severe problem of an ageing population -in Hong Kong (Yip et aI., 200 I). The perception oftheir impact on the'fertility level is mixed. On the one hand, it is considered that the mainly female adult migrants from the mainland due to cross-bouiJdary marriages are reducing the marriage chances of local women, resulting in a decline in Hong Kong's fertility level. On thc other hand, the ehildren born from the mainland wives of Hong Kong permanent residents during their visits in Hong Kong have the right of abode in Hong Kong and are counted in the total births of the city. It seems that the real effect of mainland wives and ncw migrants on the fertility level in Hong Kong is not "well understood, given the high level of cross-boundary marriages and migration between Hong Kong and mainland China.
This paper attempts to scrutinize the demographic effects of migration related to these issues. It is hoped that the results will help in forming proper policy responses to an acute fertility problem and to the "expected" severe problem of an ageing population in the future.
An urban population is a dynamic and open system (Plane and Rogerson, 1994; Shen, 1994a, 1994b; Rogers, 1995). As an open population system, three important points can be noted. First, thcre are both flows ofimmigration and emigration in an open city. Second, some children born in the eity may be those of visitors to the city, while residents of the city may give birth to ehildren outside of that city. Third, with regard to Hong Kong, the large number of crossboundary marriages makes the situation even more complicated. Mainland spouses, especially wives, cannot join their Hong Kong permanent resident spouses immediately after getting married. They usually have to wait for about five years before they are able to obtain one-way permits to enter Hong Kong (Task Force on Population
4 5 Population Growth, Fertility Decline, and Ageing in Hong Kong
Policy, 2003:49). Such mainland wives may give birth to children within and outside of Hong Kong. Aecording to the law, all of these children have the right of abode in the city.
A few points should be noted about a dynamic population system such as Hong Kong's. First, the proportion of those aged 60+ in a stable population is about 20%. Thus if the proportion of elderly people in a population is small, as is the case in Hong Kong, such a proportion can be expected to inerease in the future. Second, the future size of the elderly population will be determined by the existing population, with a time delay of 60 or 65 years. For example, the size of the population aged 60+ in Hong Kong 60 years later will mainly be determined by the current population aged 0 to 50, assuming that no person can live beyond age of 110 and that no large-scale immigration and emigration occurs. A change in the fertility rate or an increase in the number of migrants would not reduce the number of elderly people and the demand for medical services and social welfare support in the next 60 years. Third, each individual, including each migrant, will undergo a natural ageing process, eventually becoming a member of the elderly population in future. Increasing the number of young migrants can reduce the proportion of elderly people now, but will increase the number of elderly people in the future. Thus "young migrants" come at the cost of a future ageing population.
The rest of the paper is organized as follows. The relative contributions of migration and natural increase to population growth in Hong Kong will first be examined. Then, the decline in fertility, the relationship between marriage and migration, the ageing of the population, and the possible role of migration in solving the ageing problem will be discussed. Some conclusions are reached in the final section.
Migration and Population Growth
In the past 150 years, Hong Kong has grown from a small fishing village to a metropolis with a population of nearly seven million. In 1845, there were only 23,817 persons in Hong Kong (Lam and Liu,
Population Growth, Fertility Decline, andAgeing in Hong Kong
1998:11). The population increased to 0.46 million in 1911 and to 1.63 million in 1941 (Feng, 2001:54). Hong Kong's population kept growing, except during the period of 1941-1945 when the territory came under Japanese occupation. The population reached 3.20 million in 1961,5.24 million in 1981, and 6.92 million in 2004 (CSD, 2006: Table 00 I). Due to a significant influx of male migrants, Hong Kong bad much larger male population than female population until 1961. The gender ratio (males per 100 females) was 184 in 1911 and 135 in 1931. It reached a normal gender ratio of 106 for the population as a whole in 1961 (CSD, 1969:13). In 1961, 50.5% of Honr-Kong's population was born in mainland China (Lam and Liu, 1998:i5).
This section will focus on the period 1961-1004 when detailed data on components of population change are available. There was large-scale migration from mainland China to Hong Kong in the 1960s-1980s, Thus it is a common perception that population growth in Hong Kong was caused mainly by such migration. It is useful to note that the Census and Statistics Department (CSD) changed its approach in compiling population statistics from the "Extended de facto" approach to the "Resident population" approach in 1996 (CSD, 2002b). Thus, population data from the CSD before 1996 is based on the former approach and after 1996 on the latter approach (CSD, 2006). The impact ofsuch a change on the total population and net migration in 1996 is estimated as follows. The total population in mid-1995 and mid-1996 was 6,156,100 and 6,435,500, respectively, and the natural population increase and net migration from mid-1995 to mid-1996 was 35,600 and 119,300 respectively. It is estimated that the total population was adjusted upwards by 124,500 due to the change in statistical approach (CSD, 2002c:8). This adjustment was also adopted by the authors to estimate net migration in 1996, which was 41,000, considering the total population at the end of 1995 and 1996 and the natural increase in the population in 1996.
During the period 1961-2004, net migration to Hong Kong was characterized by large fluctuations. There were positive and negative net migration flows in different years. In the 44 years under consideration, Hong Kong lost population through migration in eight years, i.e., 1961, 1963-1966, 1969, 1976, and 1990. During the period
6 7 Population Growth, Fertility Decline, andAgeing in Hong Kong
1961-1995, the number of births was over 69,000 and the natural population increase was over 37,000 a year. On the other hand. net migration was less than 30,000 a year in most years. It was smaller than the natural increase in population in most years until 1993. Migration aceounted for over 50% of the increase in population in Hong Kong only in four years before 1984, Le., 1973 and 1978-1980 (CSD, 2006:Tables 003-004).
It was in the most recent period 1993-2004 that migration became the most important source of population growth in Hong Kong. Migration accounted for over 56% of the population growth in this period except in the years 1997 and 2002. In 2004, migration accounted for 84% of the population growth in Hong Kong. During the period 1993-2004, the natural increase in population further dropped from 40,000 to 11,000 a year, and the problem of an ageing population began to arise in Hong Kong (CSD, 2006:Table 003). In recent years, many have eome to see migration from mainland China as a positive measure to relieve the ageing problem. The issue will be further discussed in the section on population ageing and migration.
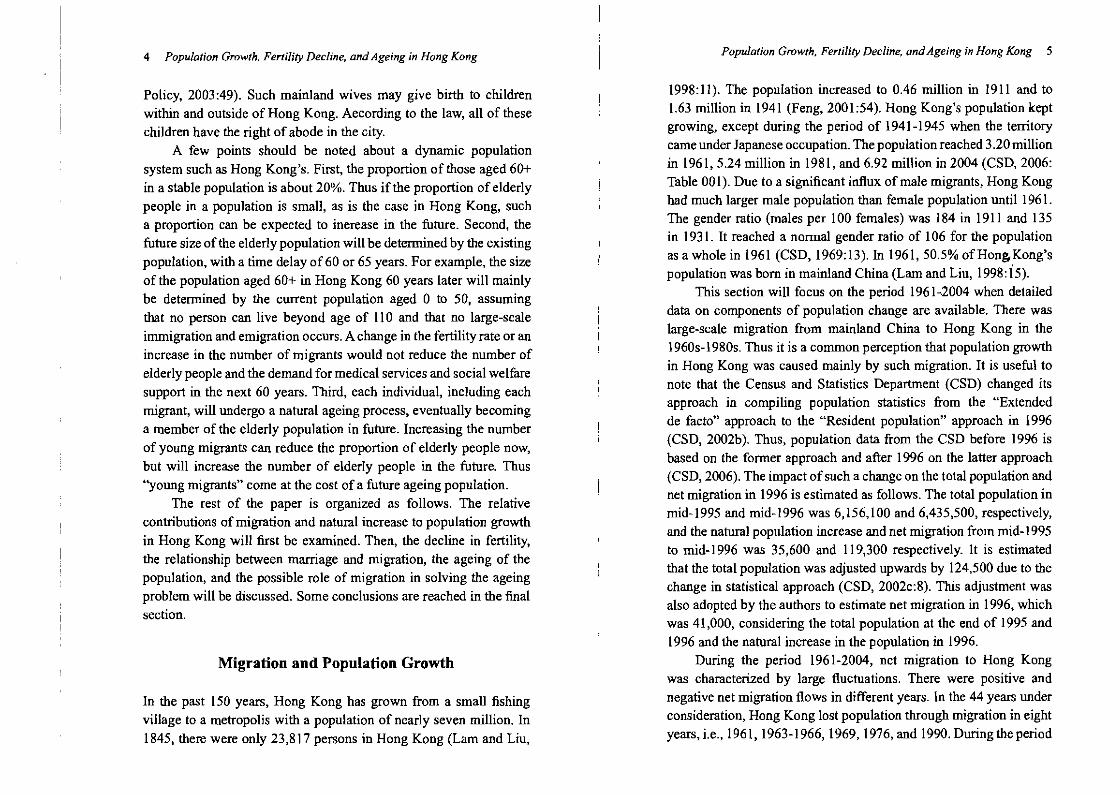
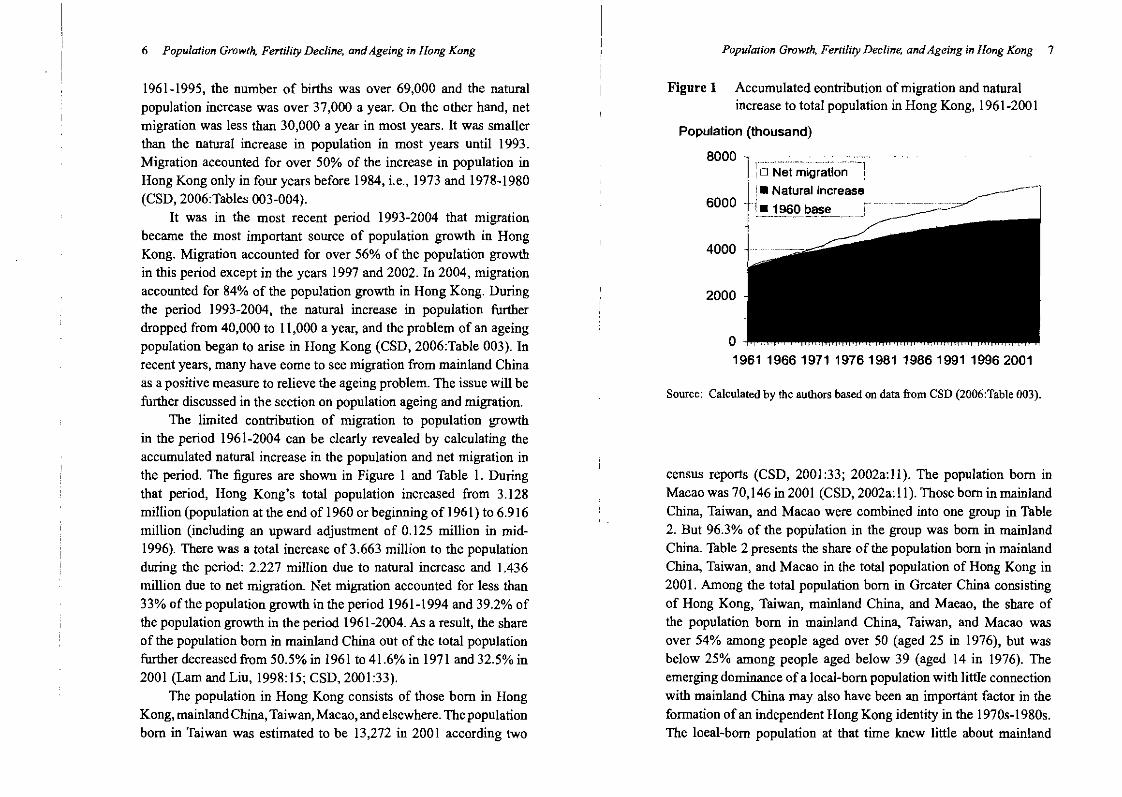
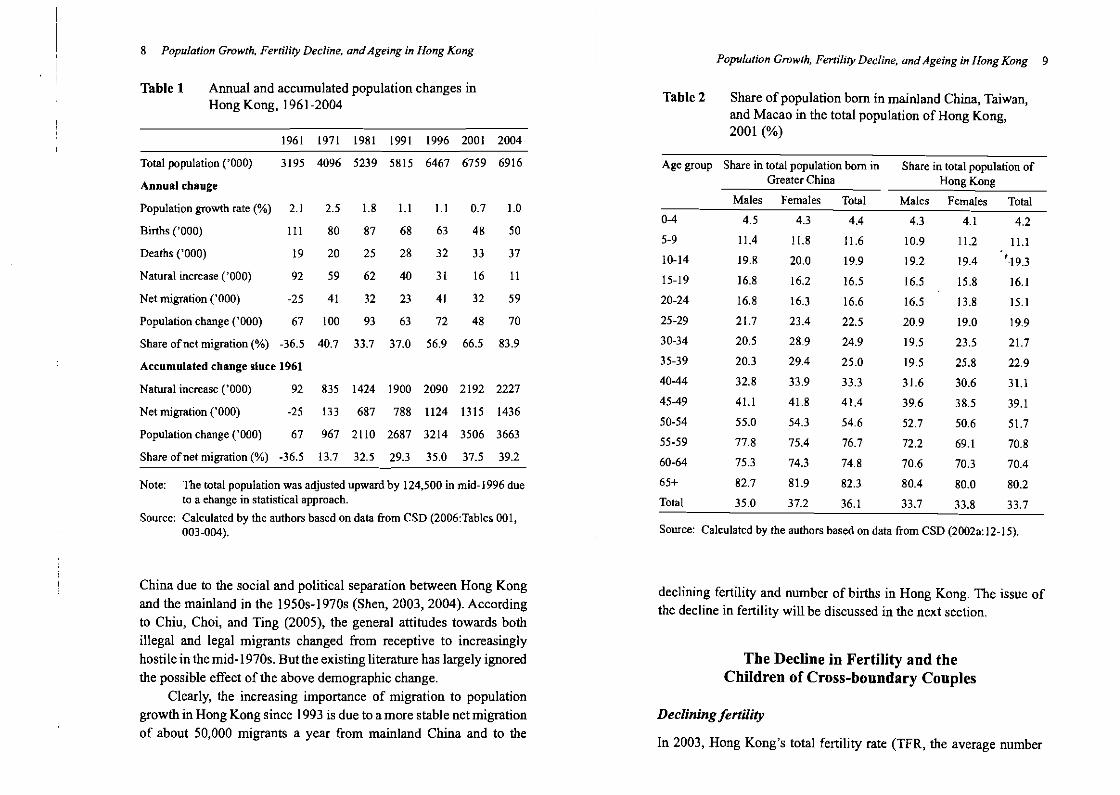
The limited contribution of migration to population growth in the period 1961-2004 can be clearly revealed by calculating the accumulated natural increase in the population and net migration in the period. The figures are shown in Figure I and Table 1. During that period, Hong Kong's total population increased from 3.128 million (population at the end of 1960 or beginning of 1961) to 6.916 million (including an upward adjustment of 0.125 million in mid1996). There was a total inerease of 3.663 million to the population during the period: 2.227 million due to natural increase and 1.436 million due to net migration. Net migration accounted for less than 33% of the population growth in the period 1961-1994 and 39.2% of the population growth in the period 1961-2004. As a result, the share of the population born in mainland China out of the total population further decreased from 50.5% in 1961 to 41.6% in 1971 and 32.5% in 2001 (Lam and Liu, 1998:15; CSD, 2001:33).
The population in Hong Kong consists of those born in Hong Kong, mainland China, Taiwan, Macao, and elsewhere. The population born in Taiwan was estimated to be 13,272 in 2001 according two
Population Growth, Fertility Decline, and Ageing in Hong Kong
Fignre 1 Accumulated eontribution of migration and natural increase to total population in Hong Kong, 1961-200 I
Population (thousand)
8000 11.·.... ···_..:.._.. ·· _:...:.:.. ':Cl I 0 Net migration !
I. Natural increas~ __---.- ; l _ ~6000 _______:1II..!!l6Q.~l,I~ J
4000
2000
o 196119661971 19761981 19861991 19962001
Source: Calculated by the authors based on data from CSD (2006:Table 003).
census reports (CSD, 2001:33; 2002a:I1). The population born in Macao was 70,146 in 2001 (CSD, 2002a:ll). Those born in mainland China, Taiwan, and Macao were combined into one group in Table 2. But 96.3% of the population in the group was born in mainland China. Table 2 presents the share of the population born in mainland China, Taiwan, and Macao in the total population of Hong Kong in 2001. Among the total population born in Greater China consisting of Hong Kong, Taiwan, mainland China, and Maeao, the share of the population born in mainland China, Taiwan, and Macao was over 54% among people aged over 50 (aged 25 in 1976), but was below 25% among people aged below 39 (aged 14 in 1976). The emerging dominance of a local-born population with little connection with mainland China may also have been an important factor in the formation of an independent Hong Kong identity in the I970s-1980s. The loeal-born population at that time knew little about mainland
8 Population Growth. Fertility Decline, and Ageing in Hong Kong Population Growth, FertilJ'ty Decline, and Ageing in Hong Kong 9
Table 1 Annual and accumulated population changes in Table 2 Share of population born in mainland China, Taiwan, Hong Kong, 1961-2004
and Macao in the total population of Hong Kong, 2001 (%)
1961 1971 1981 1991 1996 2001 2004
Total population ('000) 3195 4096 5239 5815 6467 6759 6916 Age group Share in total population born in Share in total population of Greater China Hong Kong Annual change
Males Females Total Males Females TotalPopulation growth rate (%) 2.1 2.5 1.8 Ll Ll 0.7 1.0
0-4 4.5 4.3 4.4 4.3 4.1 4.2 Births ('000) III 80 87 68 63 48 50
5-9 11.4 11.8 11.6 10.9 11.2 ILl Deaths ('000) 19 20 25 28 32 33 37 10-14 19.8 20.0 19.9 19.2 19.4 '·19.3 Natural increase ('000) 92 59 62 40 31 16 11 15-19 16.8 16.2 16.5 16.5 15.8 16.1
Net migration ('000) -25 41 32 23 41 32 59 20-24 16.8 16.3 16.6 16.5 13.8 15.1
Population change ('000) 67 100 93 63 72 48 70 25-29 21.7 23.4 22.5 20.9 19.0 19.9
Share ofnet migration (%) -36.5 40.7 33.7 37.0 56.9 66.5 83.9 30-34 20.5 28.9 24.9 19.5 23.5 21.7
35-39 20.3 29.4 25.0 19.5 25.8 22.9Accumulated change since 1961 40-44 32.8 33.9 33.3 31.6 30.6 3LlNatural increase ('000) 92 835 1424 1900 2090 2192 2227 45-49 4Ll 41.8 41.4 39.6 38.5 39.1
Net migration ('000) -25 133 687 788 1124 1315 1436 50-54 55.0 54.3 54.6 52.7 50.6 51.7
Population change ('000) 67 967 2110 2687 3214 3506 3663 55-59 77.8 75.4 76.7 72.2 69.1 70.8
Share ofnet migration (%) -36.5 13.7 32.5 29.3 35.0 37.5 39.2 60-64 75.3 74.3 74.8 70.6 70.3 70.4
Note: The total population was adjusted upward by 124,500 in mid-1996 due 65+ 82.7 81.9 82.3 80.4 80.0 80.2 to a ehange in statistical approach. Total 35.0 37.2 36.1 33.7 33.8 33.7
Source: Calculated by the authors based on data from CSD (2006:Tablcs 001, 003-004). Source: Calculated by the authors based on data from CSD (2002a: 12-(5).
China due to the social and political separation between Hong Kong declining fertility and number of births in Hong Kong. The issue of
and the mainland in the 1950s-1970s (Shen, 2003, 2004). According the decline in fertility will be discussed in the next section. to Chiu, Choi, and Ting (2005), the general attitudes towards both illegal and legal migrants changed from receptive to increasingly
hostile in the mid-1970s. But the existing literature has largely ignored The Decline in Fertility and the the possible effect of the above demographic change. Children of Cross-boundary Couples
Clearly, the increasing importance of migration to population growth in Hong Kong since 1993 is due to a more stable net migration Decliningfertility of about 50,000 migrants a year from mainland China and to the
In 2003, Hong Kong's total fertility rate (TFR, the average number

10 Population Growth, Fertility Decline, and Ageing in Hong Kong Population Growth, Fertility Decline. and Ageing in Hong Kong II
of children a woman will have in her whole life aecording to the r
age-specific fertility rates of women of various ages) was only 0.901 1~ I~ ~ ~:;; ~ ~ ~ ~ ~ ~ ~ (CSD, 2005h:FD6), the lowest in the world. In comparison, the TFR was 1.330 in Japan, 1.369 in Singapore, 1.710 in Sweden, and 1.640 I;:; I~ ~ '" :6;g;; r-: N 000 N
in the UK in 2003 (World Bank, 2005). It is noted that the TFR for ~ ~ ~ ..,. ~ :::: 3 "" g:: ..,. ..,. ~ Hong Kong in 2003 reported by World Bank (2005) was 0.959, before . 1"'1- ~ 00 00..,. r-the recent adjustment by the CSD (2005b). g; ::::,.; ~ ~ .,., ~;!2 00 N N g
From 1971 to 2004, the TFR in Hong Kong declined by 73.2%, - ...; '" :::: ...;...; '" ~ .,.,
from 3.459 to 0.927. The total number of births dropped from 1-1- ~ ..,. 110,900 in 1961 to 49,800 in 2004 (Table 3). As mentioned before, ~ ~ ~ :g ~ :2 ~ ~ ~ ~ ~ 9 the deelining number of children has already resulted in a shrinking number of children attending primary and secondary schools. It also 1 ~ 1 ~ ~ - N ~ ~ ~ ~ 00 00 00\ M""" t-- 00 0\ V) 1.0 00 t-- t-- 0
has major implications on the future labour supply and on an ageing - ...; r- - N N '" population, whieh will be examined in the next section. This seetion M ("1')00-
foeuses on the eauses of the decline in fertility and the effect of ~ ~ ~ g g ~ ~ ~;;; g g g·00 -- .. 0\ --
children of cross-boundary eouples on Hong Kong's fertility level. - C - '" ~ .. The average fertility level of a population is determined by the ;g; '" 0.,., 00 ~ NO", G00o t-~. N0I;J'JMNO . \Or-O\ 0
patterns and timing of marriage and childbearing. These are in tum ~ ~ ~ ...... 0\ g ~ ~:;; f; ~ =: :::::0\ 0\\0.... ~
affeeted by a number ofsoeial, eeonomic, and cultural factors (Mason, ~:;? ;:l0
1997). Aecording to data from the CSD (2005b:FD6), women aged :0 :;; ~:;:: ;:: ~ ';; ~ ~!;j ~ ~ ;j: 00 !§. 25-29 had the highest fertility rate in the period 1975-2004, with the § - '" r- ~ - .,;.,; '" - - '" 6l exeeption of the period 1997-2002, when women aged 30-34 had a ~. -e ~ -.. ID 00 ~oo-r-- \D J,:;;;
slightly higher fertility rate than women aged 25-29. However, age- § ~ ~ a: ~ ~ ~ ~ C;;::;,.; ;; ~ ~ .g specific fertility rates declined dramatieally in all ages in the period :; - ; - '" '" '" ~ o ." 1975-2004. i'J £ 0 §
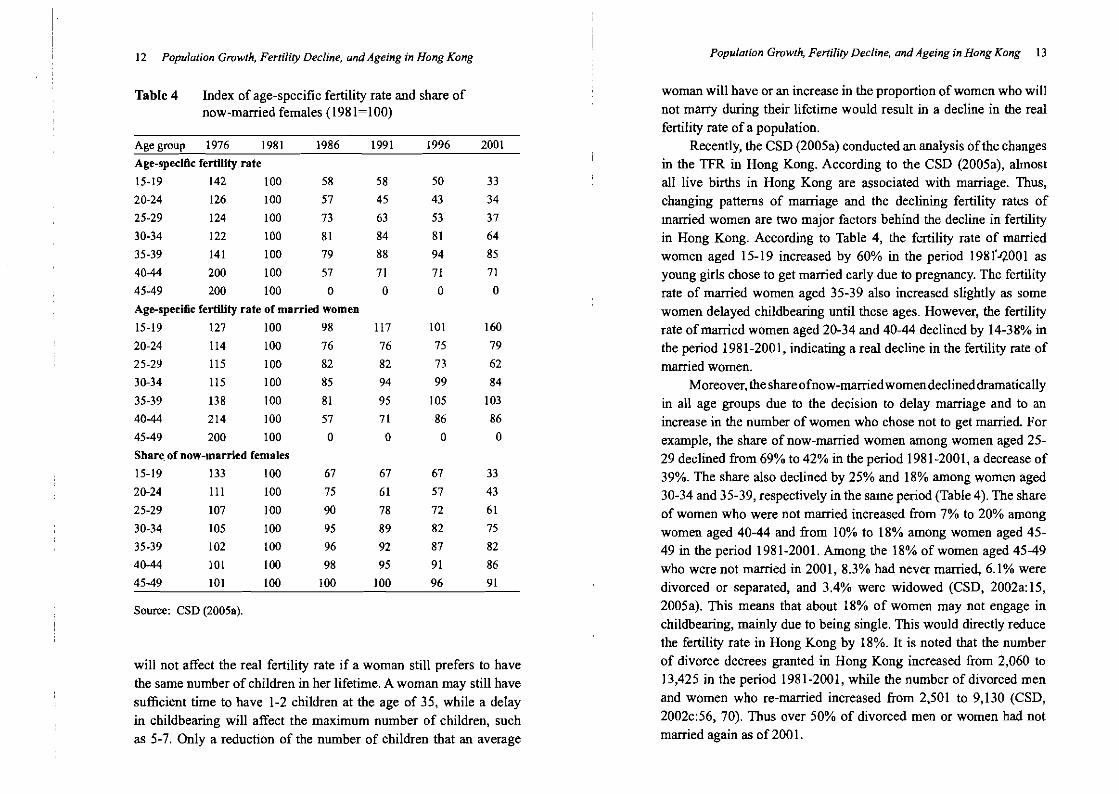
According to Table 4, the fertility rate declined by over 60% ~ ~ 1! 1lu ,.Q 01J ~
among women aged 15-29, 36% among women aged 30-34, and less 11 iU:;l.... .0
than 15% among women aged 35-39 in the period 1981-2001. The '::' t e. l(j l(j],w" 1:1 0\ 0 0\ 0\ 0 0\ ";:J
delays in marriage and childbearing contributed to a mueh greater ;;;t: ~ ~... '2 ~_V) ~.,., ~ 0 u"l:l 0 .... U uV) ~ decline in the fertility rate among young women aged under 34, and ~ :a ~ ~ ~ ~ ~ ~ ?f ~ oS
'-0 u.fl££ >->tIS >.>.>->tIS >.
to less of a deeline among women aged 35-44. The average age of .;2., ~ 'c: .5 Q C ~ £ ~ ~ ~.s ~ '" ~o .. .oee ~~~~e~~ 0
women's first marriage increased from 23.9 to 27.5 in the period ::E 8 ~ ~ 'c: ;!l:g ;g.s ~ ;g :g ;g.s ~ 1981-2001 (CSD, 2002c:62). The median interval from marriage to ';;;' .!!, ~ ~ :ij 7i 7i 'E .!!, 7i 7i 7i 'E oSofioo l!=>->'-'- '-uOO'-'-'-tJ tIS
the birth of the first child increased from 14.7 months to 27.5 months "".5; .1:: u ~ ~ ~ ~:::: ~ ~ ~ liP c,J...~ tJlUQ,) .0 .oClft ut::-utJtJ'E ~
in the same period (CSD, 2002c:87). ~ '" '3 .g e: '3 t ~ -e ~ ~ ~ § .g -e -e ~ § ~ It is noted that just delaying the time of marriage or childbearing ... I=: F: oS f- F: ~ ::;: ~ Z ~ Z g, .:l ~ ~ Z g, ~
Population Growth, Fertility Decline, and Ageing in Hong Kong 1312 Population Growth, Fertility Decline, and Ageing in Hong Kong
woman will have or an increase in the proportion of women who will Table 4 Index of age-specific fertility rate and share of now-married females (1981~ I00) not marry during their lifetime would result in a decline in the real
fertility rate ofa population. Age group 1976 1981 1986 1991 1996 2001 Recently, the CSD (2005a) conducted an analysis ofthe changes Age-.pedfic fertility rate in the TFR in Hong Kong. According to the CSD (2005a), almost 15-19 142 100 58 58 50 33 all live births in Hong Kong are associated with marriage. Thus, 20-24 126 100 57 45 43 34 changing patterns of marriage and the declining fertility rates of 25-29 124 100 73 63 53 37 married women are two major factors behind the decline in fertility 30-34 122 100 81 84 81 64 in Hong Kong. According to Table 4, the fertility rate of married 35-39 141 100 79 88 94 85 women aged 15-19 increased by 60% in the period 1981'-'200I as 40-44 200 100 57 71 71 71 young girls chose to get married early due to pregnancy. The fertility 45-49 200 100 0 0 0 0 rate of married WOmen aged 35-39 also increased slightly as some Age-specific fertility rate of married women women delayed childbearing until these ages. However, the fertility 15-19 127 100 98 117 101 160 rate ofmarried WOmen aged 20-34 and 40-44 declined by 14-38% in 20-24 114 100 76 76 75 79 the period 1981-2001, indicating a real decline in the fertility rate of 25-29 115 100 82 82 73 62 married women. 30-34 115 100 85 94 99 84 Moreover, the share ofnow-married women declined dramatically 35-39 138 100 81 95 105 103 in all age groups due to the decision to delay marriage and to an 40-44 214 100 57 71 86 86 increase in the number of women who chose not to get married. For 45-49 200 100 0 0 0 0 example, the share of now-married WOmen among women aged 25Share. of now-married females 29 declined from 69% to 42% in the period 1981-200I, a decrease of 15-19 133 100 67 67 67 33 39%. The share also declined by 25% and 18% among women aged 20-24 111 100 75 61 57 43 30-34 and 35-39, respectively in the same period (Table 4). The share 25-29 107 100 90 78 72 61 of women who were not married increased from 7% to 20% among 30-34 105 100 95 89 82 75 women aged 40-44 and from 10% to 18% among women aged 4535-39 102 100 96 92 87 82 49 in the period 1981-2001. Among the 18% of women aged 45-49 40-44 101 100 98 95 91 86 who were not married in 2001,8.3% had never married, 6.1% were 45-49 101 100 100 100 96 91 divorced or separated, and 3.4% were widowed (CSD, 2002a: 15,
2005a). This means that about 18% of WOmen may not engage in Source: CSD (2005a). childbearing, mainly due to being single. This would directly reduce the fertility rate in Hong Kong by 18%. It is noted that the number of divorce decrees granted in Hong Kong increased from 2,060 towill not affect the real fertility rate if a woman still prefers to have 13,425 in the period 1981-2001, while the number of divorced men the same number of children in her lifetime. A woman may still have and women who re-married increased from 2,501 to 9,130 (CSD, sufficient time to have 1-2 children at the age of 35, while a delay 2002c:56, 70). Thus over 50% of divorced men or WOmen had not in childbearing will affect the maximum number of children, such married again as of 200 I.as 5-7. Only a reduction of the number of children that an average

14 Population Growth, Fertility Decline, andAgeing in Hong Kong Population Growth, Fertility Decline, andAgeing in Hong Kong 15
In the period 1981-200 I, an additional 8% of women aged 4549 were not married, and this would have the effect of reduciog the fertility rate by 8%. Furthermore, an additional 22% of women aged 30-34 were not married duriog that period. If we make an extreme estimation based on the assumption that women not married at the age 30-34 will never marry, the increase io the proportion of such women means that the fertility rate was reduced by 22% io the period 1981-200 I. This aceounted for 42% of the 52% reduction in the TFR in Hong Kong during that period. This estimation was smaller than the 56% contribution to the deelioe in TFR by the declining share of now-married women io the period 1976-2001 estimated by the CSD (2005a). The CSD estimation was on the high side as it ignored the possibility that women who get married later may have the same number of children as they would have had if they had not delayed their marriage. If this is the case, then the real fertility rate did iodeed declioe and was not caused simply by delayed marriage. Overall, it is concluded that the real declioe in the married fertility rate may account for over 58% of the decline io fertility io the period 19812001. Thus, supportive incentives and childcare facilities arc needed to encourage married women to have children io their 308 and 40s.
Trends according to alternative indicators offertility
The TFR measures the fertility level for one year. It is an integrated iodieator of the fertility levels of women at different ages io a particular year. Thus, the TFR in 2001 depended on the fertility rates of women aged 15-49 io that year and it was not equal to the total number of children a woman aged 15 or aged 49 would have in her whole life. It is useful to examioe directly the overall fertility rate of women born at specific years. One useful indicator is the number of children a woman has had at the age of 50 when she completes the process of childbearing in her life. This may be called the life fertility rate or the total cohort fertility rate.
By 2001, women born in 1928-1953 io Hong Kong had completed their childbearing process and the life fertility rate was available. According to Table 3, on average, such women gave birth to over 93% of their total children by the age of39, and the share was
98.6% for women born in year 1948. This share was used to estimate in Table 3 the total number of children that a woman born io 19581963 would have before or on reaching age 50 after 2001, given the number of children an average woman already had at the age of 39 hefore or in the year 200 I.
Accordiog to Table 3, the life fertility rate declined from 4.837 for women born in 1933 to 2.628 for women born in 1948. The estimated life fertility rate was 1.424 for women born io 1963 (aged 39 io the year2001) io Hong Kong. The observed number of children was 1.404 at age 39 io 2001. Both figures are significantly higher than the reported TFR of 0.932 io Hong Kong io 200 I. This means that an average woman aged 39 io 2001 may have less than one child in her whole life. More time is needed to monitor such a low fertility level as such women have not completed their childbearing process.
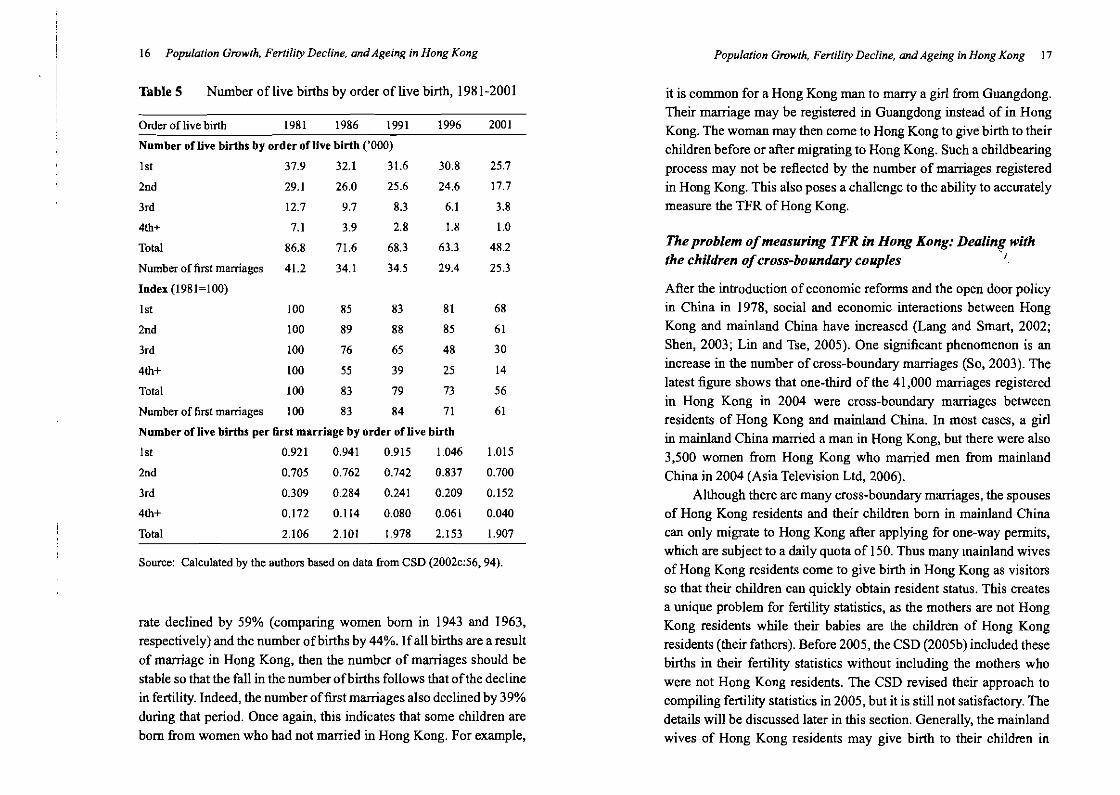
Table 5 presents the number of live births by order of birth in Hong Kong io the period 1981-2001. Duriog that period, the number of first-order births declined by 32%, down from 37,900 in 1981 to 25,700 io 200 I. The number of second-order births declioed by 39%. There was a dramatic decline of 70% in the number of third-order births, and an 86% decline io the number of fourth-order or later births io the same period. This indicates that women in Hong Kong were much less likely to have a third child or more in 200 I. Overall, the first-order births accounted for 43.7% and 53.3% of total births in Hong Kong in 1981 and 200 I, respectively. Second-order births accounted for 33.5% and 36.7% of total births in Hong Kong io 1981 and 2001, respectivcly.
Table 5 also presents the ratio of the number of births to the number of first marriages. It is interestiog to note that the ratio has been very stable over the years. The number of total births per first marriage declined slightly from 2.106 in 1981 to 1.907 io 2001. The number of first-order births actually increased from 0.921 to 1.015 in the period 1981-2001. This iodicates that some women giving birth in Hong Kong may not be registering their marriage in Hong Kong.
Overall, the decliniog trend of the TFR, life fertility rate, and number of births was consistent in Hong Kong io the period 19812001. In this period, the TFR declined by 52%, the life fertility
16 Population Growth, Fertility Decline, and Ageing in Hong Kong Population Growth, Fertility Decline, and Ageing in Hong Kong 17
Table 5 Number of live births by order oflive birth, 1981-2001 it is common for a Hong Kong man to marry a girl from Guangdong.
Order oflive birth 1981 1986 1991 1996 2001
Number of live births hy order oflive birth ('000)
1st 37.9 32.1 31.6 30.8 25.7
2ud 29.1 26.0 25.6 24.6 17.7
3rd 12.7 9.7 8.3 6.1 3.8
41h+ 7.1 3.9 2.8 1.8 1.0
Total 86.8 71.6 68.3 63.3 48.2
Number of first marriages 41.2 34.1 34.5 29.4 25.3
Iudex (1981~100)
1st 100 85 83 81 68
2nd 100 89 88 85 61
3rd 100 76 65 48 30
4th+ 100 55 39 25 14
Total 100 83 79 73 56
Number of first marriages 100 83 84 71 61
Number of live births per first marriage by order of live birth
1sl 0.921 0.941 0.915 1.046 1.015
2nd 0.705 0.762 0.742 0.837 0.700
3rd 0.309 0.284 0.241 0.209 0.152
4th+ 0.172 0.114 0.080 0.061 0.040
Total 2.106 2.101 1.978 2.153 1.907
Sonree: Calculated by the authors based on data from CSD (2002c:56, 94).
rate declined by 59% (comparing women born in 1943 and 1963,
respectively) and the number ofbirths by 44%. Ifall births are a result
of marriage in Hong Kong, then the number of marriages should be
stable so that the fall in the number ofbirths follows that ofthe decline
in fertility. Indeed, the number offust marriages also declined by 39%
during that period. Once again, this indicates that some children are
born from women who had not married in Hong Kong. For example,
Their marriage may be registered in Guangdong instead of in Hong
Kong. The woman may then come to Hong Kong to give birth to their
children before or after migrating to Hong Kong. Such a childbearing
process may not be reflectcd by the number of marriages registered
in Hong Kong. This also poses a challenge to the ability to accurately measure the TFR ofHong Kong.
The problem ofmeasuring TFR in Hong Kong: Dealin(J with the children ofcross-boundary couples
After the introduction of economic reforms and the open door policy in China in 1978, social and economic interactions between Hong
Kong and mainland China have increased (Lang and Smart, 2002;
Shen, 2003; Lin and Tse, 2005). One significant phenomenon is an
increase in the number of cross-boundary marriages (So, 2003). The
latest figure shows that one-third of the 41,000 marriages registered
in Hong Kong in 2004 were cross-boundary marriages between
residents of Hong Kong and mainland China. In most cases, a girl
in mainland China married a man in Hong Kong, but there were also
3,500 women from Hong Kong who married men from mainland
China in 2004 (Asia Television Ltd, 2006).
Although there are many cross-boundary marriages, the spouses
of Hong Kong residents and their children born in mainland China
can only migrate to Hong Kong after applying for one-way permits,
which are subject to a daily quota of ISO. Thus many mainland wives
of Hong Kong residents come to give birth in Hong Kong as visitors
so that their children can quickly obtain resident status. This creates
a unique problem for fertility statistics, as the mothers are not Hong Kong residents while their babies are the children of Hong Kong
residents (their fathers). Before 2005, the CSD (2005b) included these
births in their fertility statistics without including the mothers who
were not Hong Kong residents. The CSD revised their approach to
compiling fertility statistics in 2005, but it is still not satisfactory. The
details will be discussed later in this section. Generally, the mainland
wives of Hong Kong residents may give birth to their children in
40
20
Population Growth, Fertility Decline, andAgeing in Hong Kong 1918 Population Growth, Fertility Decline, and Ageing in Hong Kong
mainland China or Hong Kong before migrating permanently to
Hong Kong. Excluding the children born of those wives of Hong Kong
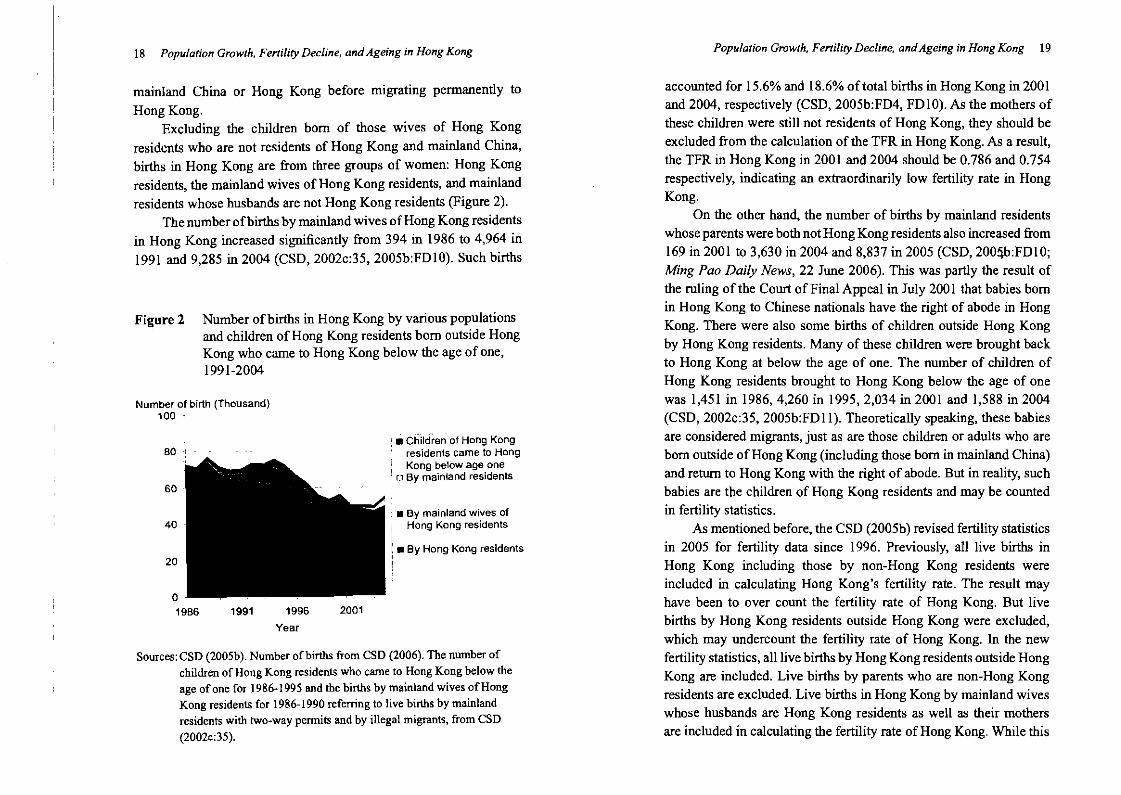
residents who are not residents of Hong Kong and mainland China, births in Hong Kong are from three groups of women: Hong Kong residents, the mainland wives of Hong Kong residents, and mainland residents whose husbands are not Hong Kong residents (Figure 2).
The number ofbirths by mainland wives ofHong Kong residents in Hong Kong increased significantly from 394 in 1986 to 4,964 in 1991 and 9,285 in 2004 (CSD, 2002c:35, 2005b:FDlO). Such births
Figure 2 Number of births in Hong Kong by various populations and children ofHong Kong residents born outside Hong Kong who carne to Hong Kong below the age of one, 1991-2004
Number of birth (Thousand) 100
: • Children of Hong Kong 80 residents came to Hong
Kong beloW age one ! rJ By mainland residents
60
• By mainland wives of
accounted for 15.6% and 18.6% of total births in Hong Kong in 200 I and 2004, respectively (CSD, 2005b:FD4, FDlO). As the mothers of these children were still not residents of Hong Kong, they should be excluded from the calculation of the TFR in Hong Kong. As a result, the TFR in Hong Kong in 2001 and 2004 should be 0.786 and 0.754 respectively, indicating an extraordinarily low fertility rate in Hong Kong.
On the other hand, the number of births by mainland residents whose parents were both not Hong Kong residents also increased from 169 in 2001 to 3,630 in 2004 and 8,837 in 2005 (CSD,200!jb:FDlO; Ming Pao Daily News, 22 June 2006). This was partly the result of the ruling of the Court of Final Appeal in July 200 I that babies born in Hong Kong to Chinese nationals have the right of abode in Hong Kong. Tbere were also some births of children outside Hong Kong by Hong Kong residents. Many of these children were brought back to Hong Kong at below the age of one. The number of children of Hong Kong residents brought to Hong Kong below the age of one was 1,451 in 1986, 4,260 in 1995, 2,034 in 2001 and 1,588 in 2004 (CSD, 2002c:35, 2005b:FDlI). Theoretically speaking, these babies are considered migrants, just as are those children or adults who are born outside of Hong Kong (including those born in mainland China) and return to Hong Kong with the right of abode. But in reality, such babies are tbe cbildren of Hong Kong residents and may be counted in fertility statistics.
I
,
I,,
Hong Kong residents As mentioned before, the CSD (2005b) revised fertility statistics
• By Hong Kong residen1s in 2005 for fertility data since 1996. Previously, all live births in
o 1986 1991 1996 2001
Year
Sources:CSD (2005b). Number ofbirths from CSD (2006). The number of children of Hong Kong residents who came to Hong Kong below the age of one for 1986-1995 and tbe births by mainland wives ofHong Kong residents for 1986-1990 referring to live births by mainland residents with two-way pennits and by illegal migrants, from CSD (2002c:35).
Hong Kong including those by non-Hong Kong residents were included in calculating Hong Kong's fertility rate. The result may have been to over count the fertility rate of Hong Kong. But live births by Hong Kong residents outside Hong Kong were eXcluded, wbich may undercount the fertility rate of Hong Kong. In the new fertility statistics, all live births by Hong Kong residents outside Hong Kong are included. Live births by parents who are non-Hong Kong residents are eXCluded. Live births in Hong Kong by mainland wives whose husbands are Hong Kong residents as well as their mothers are included in calculating the fertility rate of Hong Kong. While this
20 Population Growth, Fertility Decline, and Ageing in Hong Kong Population Growth, Fertility Decline, and Ageing in Hong Kong 21
o u."
is a kind of solution to the complicated issue in Hong Kong, such a .-"' cmethod also over counts the fertility rate of Hong Kong in the sense 0 0 0[f. ~
~ II) gf- - - - ?'l that only mainland wives who give birth in Hong Kong are included. .d~~~G' .c -" ."~ ~~The problem is illustrated in the following. ~
u ~
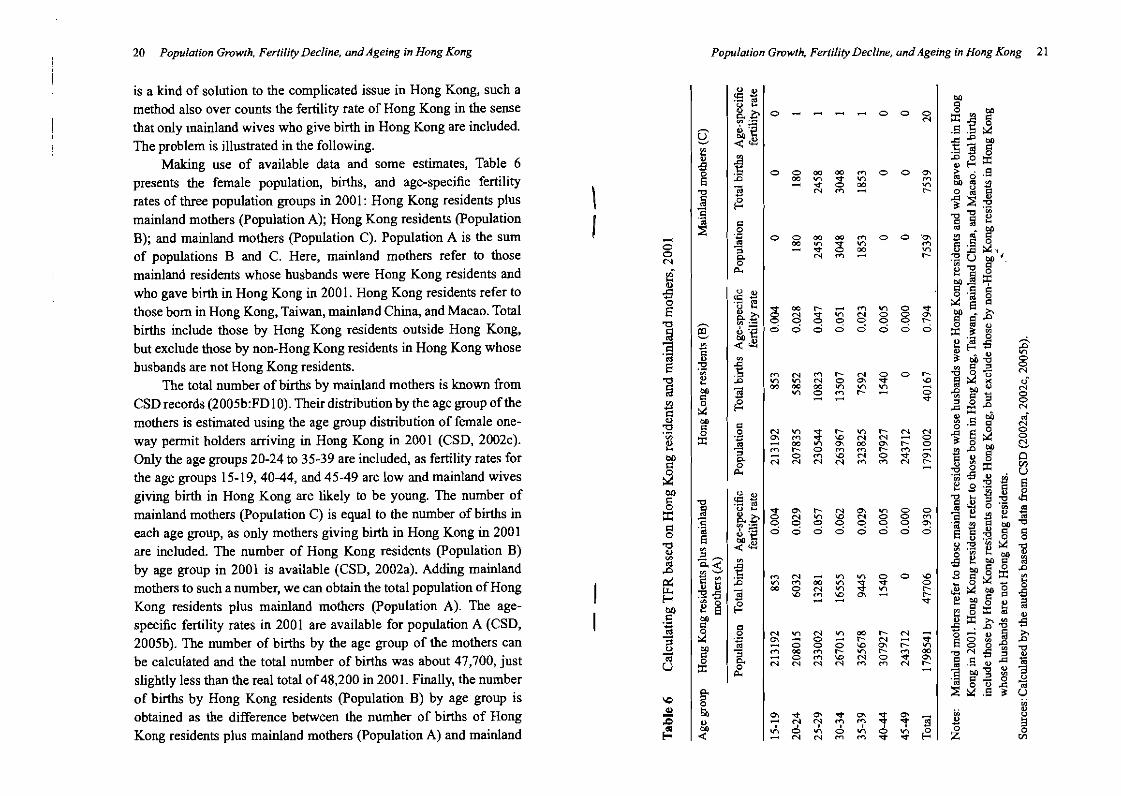
:S S § Making use of available data and some estimates, Table 6
.. ~~~ -fl ~ 0 0 00 00 .... 0 0 ~ 0 .S
00 ~ .". ~ ....-" '"Spresents the female population, births, and age-specific fertility .". 0 ~ "''''l!J - N .... "" ... .§ ." o ~ 5-rates of three population groups in 200 I: Hong Kong residents plus ~::E~\ ~
." ." ~.13mainland mothers (Population A); Hong Kong residents (population o ;l ~
-~ c
~ .."::E 0 0 00 .... 0 0B); and mainland mothers (population C). Population A is the sum I l!J '" C
~ ~ .... "" '"0 Ii :.§ ~,"" .". 3 ~ ~ of populations B and C. Here, mainland mothers refer to those N 0 §' - N .... -"" ... :g U bO I_
~ ." C" ~ § 0mainland residents whose husbands were Hong Kong residents and ii
~ -a ~ 0$who gave birth in Hong Kong in 2001. Hong Kong residents refer to .;3" o "; 0 0 ~ 13 C~ I'l
.-... .... ~ 0 .".those born in Hong Kong, Taiwan, mainland China, and Macao. Total E g,~ "" .". -~ N 0 graB8 8 0 0 8 ...'"~ o '" 0",; ",; ",; ",; ",; ",; ",; ",;tb='=births include those by Hong Kong residents outside Hong Kong, '0 :>: ._~ 0~§: 0 0
."t: <~ ~ ~ -fl -"but exclude those by non-Hong Kong residents in Hong Kong whose ~ " '" Ii'il ~ on ~ 0
~
.c en l=l::l 0~husbands are not Hong Kong residents. S 0 ~ S
~
"'0 0 U ~.... N .... ... N 0 0 ...
-~ ~ ~ N 0 .". '0 § ~ >< u-"The total number of births by mainland mothers is known from ] 00 ~ ~ ~"" ~ ""0 .... '" ... ;; .0 I:l£I CI.l ~." S <Il c:: ~ 0C - .". ::l 0.0 0CSD records (2005b:FD 10). Their distribution by the age group of the 0 - ~ -" :>: N '"
~ ~ C'd~."mothers is estimated using the age group distribution of female one- " ~
C C o'S c::l ~:s" N ~ ... ~ ... N N0 ..c:: S ~ g.... .". '0 N N 0 e ~ 0 Nway permit holders arriving in Hong Kong in 200 I (CSD, 2002c). '" :>: '" -...~ 0 21 .0 bD '-' -.... ... 0
.".
.... .... ... .... "" ""~ 0 .... '" '0 N '"0 .". ;; l=l II) 8 QOnly the age groups 20-24 to 35-39 are included, as fertility rates for bD ;::; N N N .... .... N ... .g~:I:: enu"-
§' - ·... £3u·the age groups 15-19,40-44, and 45-49 are low and mainland wives " en "'O-!9 S~ ~ g "Ui. c:: 0
§ u 0 "'0 I-< :;;.g tJ:lgiving birth in Hong Kong are likely to be young. The number of bD
fa~o'u;.-"' o ~] ... N ~ 0 0mainland mothers (Population C) is equal to the number of births in ::I: g '"N '0 '"N 0 0 .... "i3eS~~g,~ 0 0
~
0 0 0 0 "a -f!3 l=l bO "0:s ~
",; ",; ",; 0 0 ",;Z:-seach age group, as only mothers giving birth in Hong Kong in 200 I 0 0 0 '" s 8 ~ g §.,,1::"" 13 ~;gtl~"'O
~ <~ lUare included. The number of Hong Kong residents (Population B) '0 OVlhbO
'" .a~ .c ~ -B~gro ~ ".. c,<by age group in 2001 is available (CSD, 2002a). Adding mainland .J:> ~ ~ Bgro:i:~.S .... N ~ 0 0 '0
~ .... ~~
.". 0~ - ;:r. ... ... 0 ~ - s-= ~ -" u 0 0 N ~ ~mothers to such a number, we can obtain the total population ofHong "" ~~gpg-B'0 .... '0 ...~-5 SI l:: ~ 0 "" - '" - .". e ~ 0 ~ g -Kong residents plus mainland mothers (Population A). The age- bD ~ 13 ~ ~o::C II)
." u::I:;>-..CI'lo:SCspecific fertility rates in 2001 are available for population A (CSD, I .9 -:S • .0"0C
0 N ~ N ~ ... N o ...... u1ij >. 0 ..."" N .".~ ;; 0 ;:; '0 ;:: ~ 58'8.0.02005b). The number of births by the age group of the mothers can ~ ." ;;:; ~ '" .... ... '"... .... "O~o:S~]~C 0 .... '0 N 0 .".<il C,0
0 ;::; "" '""" ;; .s o..c:: ~be calculated and the total number of births was about 47,700, just N N N .... .... N !::U :>: -abO"O~::l" .- l=l .a 0 uslightly less than the real total of48,200 in 200 I. Finally, the number C'dou~'iic, ::E ~ .5 ~ U
~of births by Hong Kong residents (population B) by age group is \C 0 u ~Iih~ .". .". .".obtained as the difference between the number of births of Hong .c $
~ ~ ~ on 0 ~ ~ ~u -'", '""i ";' '"";' 6 ,.'" S ~
0Kong residents plus mainland mothers (Population A) and mainland ~ N N .... .... .". .". ~ Z- '"

22 Population Growth, Fe1"tility Decline. and Ageing in Hong Kong Population Growth, Fertility Decline. andAgeing in Hong Kong 231
mothers (Population C). The age-specific fertility rates and the TFR ~.!l ~ .~ e I00 \0 ~ N t- 0 0 t of Hong Kong residents are then calculated. o..i:' 0 II"'l 0\ 0 "t - 0 00
~._ 0 0 0 _ 0 0 0 II"'l
1 s
The TFR was 0.930 in 2001 for population A according to ~~ 6 d d 6 d d d .
<~the new fertility ratc definition of the CSD in 2005. The TFR for population B was 0.794 in 200 I. The TFR for Population C was as ~ 0000 00 MOO 0\ .chigh as 20, as only mothers giving birth in 200 I were included and ~ ~ 2; ~ ~
NM_ r-the age-specific fertility rate was I in each age group. ~ 1 ~
The TFR for population A is simply calculated by adding the population and births in population B and C. Thus, the TFR of 1
1.5fpopulation A is over counted as it assumes that the TFR for population til
C was an unrealistic 20 in 200 I. If we assume that the age-specific fertility rates of mainland
mothers are the same as those of Hong Kong residents, then the agespecific fertility rates and the TFR ofpopulation A should be the same €1as those of population B, meaning that the TFR for population A is j0.794. .~
.~
! ~In Table 7, we set up another set of data. We are assuming the ]
same population and births for population B. However, the simulated jnumberofmainland mothers (Population C I) is estimated by assuming .~ lthat their age-specific fertility ratcs are two times those of Hong Kong
residents (Population B). The number of Hong Kong residents plus simulated mainland mothers (Popnlation A I) is also re-calculated. J Under these conditions, the TFR for population B was still 0.794 in ~ "'0
~200 I. The TFR for mainland mothers was a more realistic 1.587 in ~ "'S 2001 while the TFR for population AI was 0.858, lower then 0.930 in § s~
.:~ .E ~
Indeed, no data are available on the TFR ofmainland mothers or ]Table 6 and the figure oftbe CSD (2005b). ]
~ ""
-50
~ 0new mainland migrants in Hong Kong. But 2001 census data about ~ S
.- "'0
f~
the number of children living with each couple are illustrative. The ~ fa ""Ci200 I data show that the average number was 1.4 for a couple of S·t;
:-: anon-migrants (1.36 million couples), 1.3 for a couple ofwbom both "" husband and wife were new mainland migrants (2,658 couples), 1.2 u is:<:
for a couple ofwbom only the husband was a new mainland migrant §'(4,266 couples), and 1.6 for a couple of whom only the wife was .... ~a new mainland migrant (90,325 couples) (CSD, 2002d:21). The "
number of children for a couple of whom only the wife was a new ~ ~
§."1 o N ~ \0 1.0o r- 00 _
N_t-1I"'l MID 0\ 0\
0 0 0\r-1.0 00 g- N N M 0\
p.,
u!!3
.!l M
U~I"O:I"oor--_MV') "'t ~a 0 N "0:1" V') N 0 0 0\r;Il._ 0 0 0 0 0 0 r-~~ 6 6 0 6 6 d 6
<"
~ M N M r-- N 0 0 t V') V') N 0 0\ "'t ID OOOOOOIl"'lIl"'lV"l _
II"'l 0 M r-- _ 0 ..,.~
~ ~ :; ~ ~ ~ ~ ~.~
1 _ 00 II"'l 0\ 00 0\ t- 0 M r-- 0 M M r-- M _ 0 M ID N 0 '<:t 0\ N N N N M M N ~
~ .£ .~ e I"'t 0\ N \0 ID II"'l 0 00 ~.~ g ~ :g ~ ~ is g ~ u~ 6 6 0 0 0 0 6 6 O£I t::< ~ ~ .c M N _ II"'l II"'l 001.0.E
II"'l M 00 II"'l '<:t "'t 0 00 0 N II"'l "'t II"'l r-
.c ..... IDMI.OO\- t..,..s Fl
N r-- 00 M _ r-- N _S 0\ M _ II"'l "'t N ....... 00 _ 0 r-- r-- M 0\ r-- ID."
1 M _ ID M M r-- M 0\ _ - V') 0\ ID 0 "'t 00 N N N N M M N 00"" 0 p.,
0\ '<:t 0\ "'t 0\ "'t 0\ . '7 ~ ~ ~ ~ ,. ,. .s II"'l ~ ~ ~ ~ ~ ::i Fl
.... ~ ~ " ~ .§ ~ o M!:=" ~$ ~ ~
~ ti ~ '5 e- 0
"' a]] ~:s._ M
~ a""-0b ~ ~~ .~ .5 ,g :;: ~.E ,g c.
~
~i:l
~:N ~ ~
~ "" ,., 15 ~:-:
~ " § "" .~ :<: t: .... " 0
.:!? ~ ~ .c - a u " ';;~
~ " ,g~ o .alii' -o~
~ !!J i5 5 ·iii :9 a ~ .... ~
o "" ~ is2:-: !ic: S"" . ~ ~ -0 ~ ... ""'"
~ B ;0
<Q~ 0 ::; U ::; ~ E!(gJ:lo v;-s~~
~ i3~ til
24 Population Growth, Fertility Decline, and Ageing in Hong Kong
mainland migrant was only 14.3% higher than the number ofchildren of a local couple.
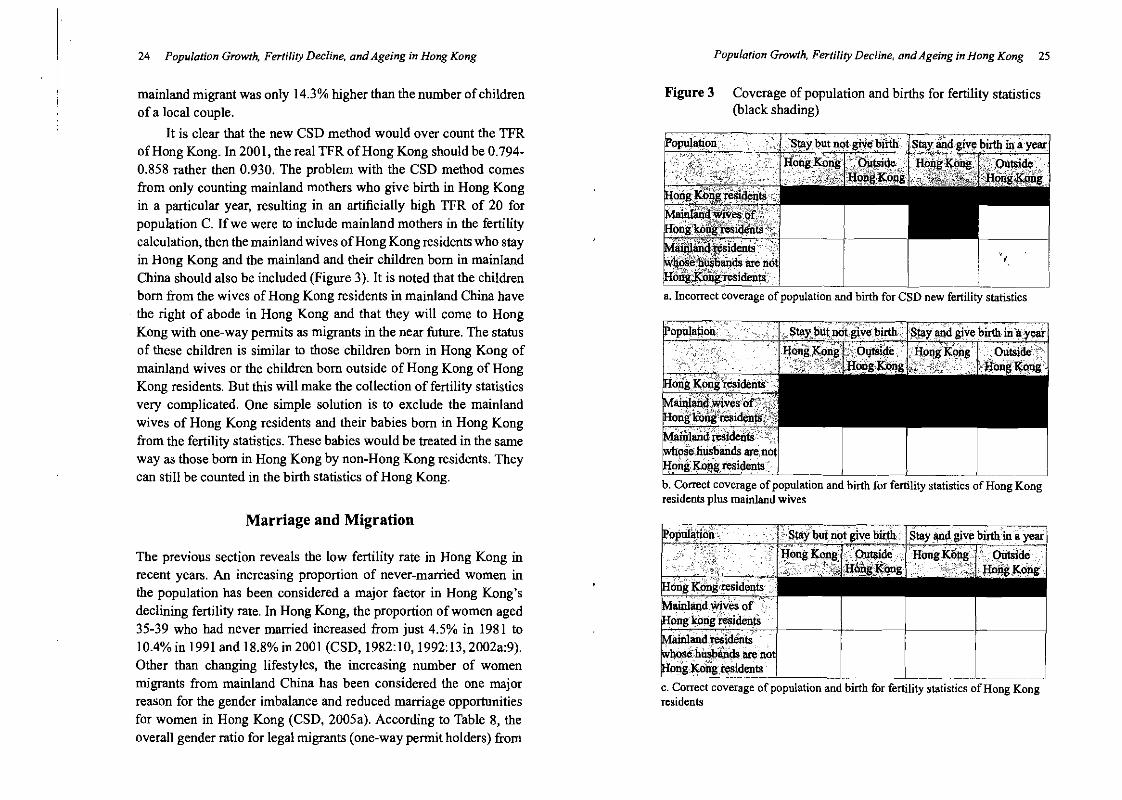
It is clear that the new CSD method would over count the TFR of Hong Kong. In 2001, the real TFR ofHong Kong should be 0.7940.858 rather then 0.930. The problem with the CSD method Comes from only counting mainland mothers who give birth in Hong Kong in a particular year, resulting in an artificially high TFR of 20 for population C. Ifwe were to include mainland mothers in the fertility calculation, then the mainland wives ofHong Kong residents who stay in Hong Kong and the mainland and their children born in mainland China should also be included (Figure 3). It is noted that the children born from the wives of Hong Kong residents in mainland China have the right of abode in Hong Kong and that they will come to Hong Kong with one-way permits as migrants in the near future. The status of these children is similar to those children born in Hong Kong of mainland wives or the children born outside of Hong Kong of Hong Kong residents. But this will make the collection of fertility statistics very complicated. One simple solution is to exclude the mainland wives of Hong Kong residents and their babies born in Hong Kong from the fertility statistics. These babies would be treated in the same way as those born in Hong Kong by non-Hong Kong residents. They can still be counted in the birth statistics of Hong Kong.
Marriage and Migration
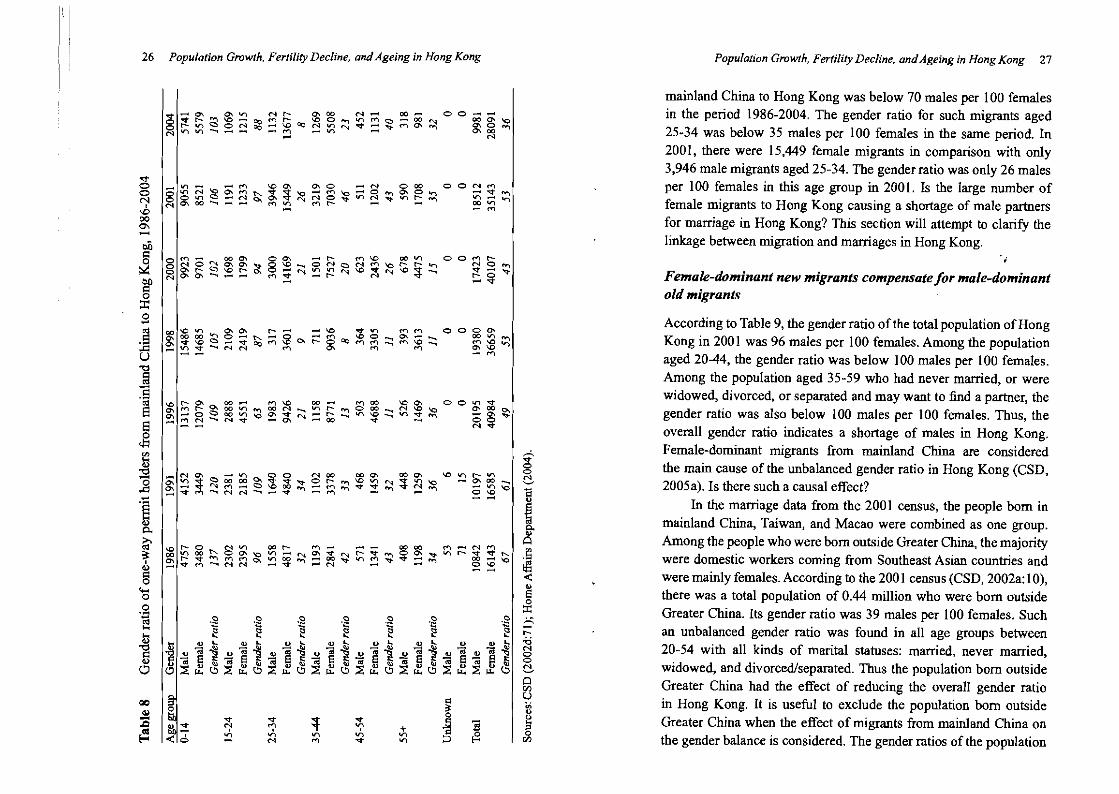
The previous section reveals the low fertility rate in Hong Kong in recent years. An increasing proportion of never-married women in the population has been considered a major faetor in Hong Kong's declining fertility rate. In Hong Kong, the proportion ofwomen aged 35-39 who had never married increased from just 4.5% in 1981 to 10.4% in 1991 and 18.8% in 2001 (CSD, 1982:10, 1992: 13, 2002a:9). Other than changing lifestyles, the increasing number of women migrants from mainland China has been considered the one major reason for the gender imbalance and reduced marriage opportunities for women in Hong Kong (CSD, 2005a). According to Table 8, the overall gender ratio for legal migrants (one-way permit holders) from
Population Growth, Fertility Decline, andAgeing in Hong Kong 25
Figure 3 Coverage of population and births for fertility statistics (black shading)
" ,iiden~ ~ 1~~me'nJ
6rlg~~fftfu~ideD.tS:>! ~__~ J 8. Incorrect coverage ofpopulatlon and birth for CSD new fertility statistics
•sUtr but DQt give birth.
ainland re.i<tents ·bose.bUsbands are Dotl ,ng Kong residents
c. Correct coverage ofpopulation and birth for fertility statistics of Hong Kong residents
__
_ _
,
26 Population Growth, Fertility Decline, andAgeing in Hong Kong
<!; o
-~ '"00
""oii § 101M.... 00 0"1 00'1 ...... r:- M \0 !Xl on
d ~ ~
~ .9
~ ] .~
j ~
:E o .d
.~
"1-0\ "'V') Nt'-- 0-.00 N_ 00_ 00 __..,.r-"'\O_ \00 .... OOMl:'- ""lM 000\gr-v)~ON~_\O~N""~""_~MO\~ O\o~ _ NN""lV\ .... -- -M _VI"" 0\00
_1""' _M 100\ 0-.0 _N OClO OONMOVlN~O\M~V~~-M~-O~O\O~ -~~ ~~~~~~~~Vl~~~~Vl~~~~~ ~~~M
oNO~0"I0"I~8\O~ONCNM~r:-r:-~ ~~~~~~~M~~~~~\O~~\O~~-~I~ ::J ..... g ~ t-.. ~..... ::: ~ ::b ;g ~ ~ O\V\O~_~~Mg~~O~MM~M\O~ _~~-NN M 0\ M M
'011:-0\ l""l1O ..... 0000_ 00_ 100-. O\ ..... r:-~OO~~OON_~r:-~OClO~N\O~ ~~~_~~~~~~=~_Vl~_~~~
-_
.... NO"I -..., 00 <'100 000"1 000\ O"IV)~~OO!XI~V'<:t'q-Or:- ...... \OV)~~'I'"l'O
~;;M""~N""~~",,,,::::::::,,,o:t:!......
".. ~ ~ \01:-0 NV) oor:- M_ - :> ooV)oor-..OO\'ov)_~O'l..,.~r:-~...... 0=:- 0\ r- v ...... M M 0. on 00 .......... 00 """ ....., M """ d)= ..... V ...... -'NN _-::t _N
o ....o .9
~......
0000
00 M r
0
NO~ ~o~ -~
0 ~ ~ M\O~_M~\O
OO\'O::t-.."r-"""",,r-.. ~ o::t --' ...... 00 ...... '0 '_
- OlD tJ::::......... ....... <:" e ~
OOVlo::t O\ClO~ og~ NV
~ 1.O""'lr-V1 ~
.... O\tXI .... __ 0::2'0 a -- i
0." 0 M_NM
";; .9.9.9.9.9.9 .9 ~ .... - ...... .... ~ ~ ~ ~ ~ ~ E~ ~ U ..!:!~ ~~ Bti B~ ,.g~ ,..gti ..2 Q)~ ~= "OQ)c<i'"l5vCll"l:Su!S!"'OUcd'"l5I1)!!!'"l5Uc<i'"l5uc<ill)~~ 0 d) c-8:s:=:-;Es=-t::::t::-Er::-t::::t::-8s=-e- 8 1:: 0
r'" o~Q)\\l~Q)\\I~v\\l~Q)\\l~v\\l~lIJ\\I~v~(i\\lN v "..c=,u..~..c.~~..c./.l.;~..c=,/.l.;e"..c.u..~"':;I.1.~..c=,Lr.,,,,,/.l.;<':' '-'
Populo/ion Growth, Ferti/ity Decline, andAgeing in Hong Kong 27
mainland China to Hong Kong was below 70 males per 100 females in the period 1986-2004. The gender ratio for such migrants aged 25-34 was below 35 males per 100 females in the same period. In 2001, there were 15,449 female migrants in comparison with only 3,946 male migrants aged 25-34. The gender ratio was only 26 males per 100 females in this age group in 2001. Is the large number of female migrants to Hong Kong causing a shortage of male partners for marriage in Hong Kong? This section will attempt to clarify the linkage between migration and marriages in Hong Kong.
Female-dominant new migrants compensate for male-dominant old migrants
According to Table 9, the gender ratio of the total population of Hong Kong in 200 I was 96 males per 100 females. Among the population aged 20-44, the gender ratio was below 100 males per 100 females. Among the population aged 35-59 who had never married, or were widowed, divorced, or separated and may want to find a partner, the gender ratio was also below 100 males per 100 females. Thus, the overall gender ratio indicates a shortage of males in Hong Kong. Female-dominant migrants from mainland China are considered the main cause of the unbalanced gender ratio in Hong Kong (CSD, 2005a). Is there such a causal effect?
In the marriage data from the 200 I census, the people born in mainland China, Taiwan, and Macao were combined as one group. Among the people who were born outside Greater China, the majority were domestic workers coming from Southeast Asian countries and were mainly females. According to the 2001 census (CSD, 2002a: I0), there was a total population of 0.44 million who were born outside Greater China. Its gender ratio was 39 males per 100 females. Such an unbalanced gender ratio was found in all age groups between 20-54 with all kinds of marital statuses: married, never married, widowed, and divorced/separated. Thus the population born outside
61 Greater China had the effect of reducing the overall gender ratio u
in Hong Kong. It is useful to eXClude the population born outside ..;!; ;; Greater China when the effect of migrants from mainland China on
00
~~ :f + j 'E ~ ~ ~ ~ N M ~ ~ ~o " .. .s J the gender balance is considered. The gender ratios of the population "'

28 Population Growth, Fertility Decline, and Ageing in Hong Kong
born in Hong Kong and in mainland China, Taiwan, and Macao will be analysed in this section. As mentioned before, the majority of people born in the mainland China, Taiwan, and Macao category were born in mainland China.
In 200 I, 2,26 million people in Hong Kong were born in mainland China, Taiwan, and Macao (Table 9). The overall gender ratio ofthis population was 96, the same as that of the total population of Hong Kong. This means that the gender ratio of this population was not lower than the average of population born in Hong Kong and outside Greater China. Among the population aged 20-24 and 40-59, there were more males than females, indicating that migrants from mainland China were not the cause of an excessive number of women in Hong Kong in these age groups. On the other hand, among the population aged 30-39, there were 34% more women than men, indicating the effect of female-dominant migrants from mainland China. However, this does not mean that there were fewer men than women among those who need to find a partner.
Among the population born in mainland China, Taiwan, and Macao and aged 20-54, there were 17-43% more men than women among those who had never married. Among the people aged 2034 who may want to find a partner, including those who have never married, or who were widowed, divorced, or separated, there were also more men than women. Thus, among the population born in mainland China, Taiwan, and Macao, the main problem is the lack of women rather than men.
Why has the recent female-dominant migration from mainland China not changed the basic situation ofmore men than women among those born in mainland China who may want to find a partner? The reason for this is that there were more males than females among the migrants from mainland China in the 1960s and I970s. This resulted in a higher gender ratio of over 100 among the population born in mainland China in the age group 40-59. Many of these people may have to find marriage partners in mainland China. This unbalanced gender ratio was also clear in the total population of Hong Kong aecording to the 1981 census data. In 1981, the gender ratio of the population aged 25-34,35-44, and 45-54 was as high as 118, 130, and
Population Growth, Fertility Decline, and Ageing in Hong Kong 29
Table 9 Gender ratio by marital status and age group in the total population of Hong Kong and in the population born in mainland China, Taiwan, and Macao, 2001 (males per 100 females)
Age Never Now Widowed! Total Never married! group married married divorced! widowed!
separated divorced! separated
Total population of Hong Kong
20-24 99 38 38 92 "98 25-29 108 52 51 85 106 30-34 112 65 45 79 106 35-39 105 83 48 85 93 40-44 95 104 40 98 73 45-49 94 109 40 101 66 50-54 123 117 37 108 64
55-59 177 131 36 118 57 Total 106 10 I 32 96 91 Population born in mainland China, Taiwan, and Macao
20-24 117 63 50 110 117 25-29 136 62 51 94 132 30-34 146 55 33 66 118 35-39 124 64 29 65 72
40-44 127 107 31 102 60 45-49 134 110 34 104 60 50-54 143 122 36 113 58 55-59 242 137 34 123 55 Total 120 112 29 96 69
Source: Calculated by the authors based on data from CSD (2002a:9. 13).
116, respectively (CSD, 1982:6-7). Thus, the recent female-dominant
new migrants from mainland China have largely come to compensate for the gender unbalance caused by the male-dominant old migrants
in the 1960s and I970s. They are not greatly affecting the chances of Hong Kong women to find male partners in Hong Kong. This is also

30 Population Growth. Fertility Decline. andAgeing in Hong Kong
made elear if we foeus on the gender ratio of the population born io Hong Kong.
A shortage ofwomen among the Hong Kong-born population who may want a partner
The population born io Hong Kong was 4 million in 2001. The overall gender ratio was 105 males per 100 females (Table 10). The male population was 5% larger than the female population. Among the population aged 20-59, men generally outnumbered women by 3-10%. However, among the population who had never married, men outnumbered women by 6-41 % in all ages from 20 to 59 except for the age group 45-49. It is likely that some women married men who had onee been married/divoreed rather than that such women married people not born in Hong Kong.
Among the people who had never married, or who had divorced and separated and thus may want to find a partner, there were also 1034% more men than women in the age group 20-39. Clearly, there is a shortage of women rather than men among those who may want to find a partuer for marriage among the population born in Hong Kong. There is a shortage of men only io the age group 40-59. There are two possible reasons for this. First, among those who are widowed or divoreed, men may be more likely than women to get re-married. Second, a man is mare likely to marry a younger woman. In the period 1981-200 I, the median age of marriage of all bridegrooms was three years older than that of all brides io Hong Kong. Over 25% of bridegrooms were five years older than their brides io the same period (CSD, 2002c:62-63). According to Table 10, among the married people born io Hong Kong, there were more women than men among those aged 20-34 but more men than women among those aged 35-59.
Considering the population born in Hong Kong, mainland China, Taiwan, and Macao as a whole, the gender ratio was 102, close to the gender ratio of the population born in Hong Kong in 200 I. There were more females than males in the age group 30-39. But this did not affect the opportunities for these women to find partuers. Among the population aged 20-39 who may want a partner, there were 8-31%
Population Growth. Fertility Decline, andAgeing in Hong Kong 31
Table 10 Gender ratio by marital status and age group io the population born io Hong Kong and in the population born in Greater Chioa, 2001 (males per 100 females)
Age Never Now Widowed! Total Never married! group married married divorced! widowed!
separated divorced! separated
Population born in Hong KODg
20-24 110 48 53 106 110
25-29 124 61 69 103 '123
30-34 139 85 65 104 134
35-39 124 102 65 106 1I4
40-44 106 113 48 107 87
45-49 98 115 48 107 75
50-54 129 118 40 1I0 74
55-59 141 120 39 108 64
Total 113 104 42 105 106
Population born in Greater China
20-24 III 52 52 106 III
25-29 126 61 64 101 125
30-34 140 74 53 93 131
35-39 124 89 52 94 108
40-44 108 110 42 105 82
45-49 104 ll3 42 106 70
50-54 133 120 38 III 67
55-59 191 133 36 119 58
Total 114 108 33 102 96
Source: Calculated by the authors based on data from CSD (2002a: 12-13).
more men than women in 2001. Among the population who had never married, there were more men than women io the age range 20-59.
Another set of data that could explicitly illustrate the marriage
problem of the population in Hong Kong are the pereentages of both males and females who have never married. If the share is low for

Ii
II r 32 Population Growth, Fertility Decline, and Ageing in Hong Kong
Population Growth, Fertility Decline, and Ageing in Hong Kong 33
the male population but high for the female population, then one may Table 11 The share of the population never married by age group,
gender, and place ofbirth in Hong Kong, 200 I (%) ., assume that the males have married female migrants, resulting in a
I j! shortage of men. However, accordIng to Table 11, among both the Age Gender Hong Kong Mainland Greater Elsewhere Total males and females born in Hong Kong there was a similarly high group China, China
share of people who had never married in 2001. For example, the figures were 15.5% and 15.6% for males and females aged 40-44 in 200 I. Generally, among the population born in mainland China, Taiwan, and Macao the percentage of people who had never married was much smaller; for the age group 40-44 in 2001, it was 4.2% and
20-24 Male
Female
Total
96.6
92.6
94.7
Taiwan, and Macao
92.4
86.6
89.6
95.9
91.6
93.8
75.5
75.2
75.2
95.5
89.2
92.2
3.4% for males and females, respectively. On the other hand, the male 25-29 Male 80.1 63.3 76.5 49.1 '75.5
population born outside Greater China had a modest share of people Female 66.6 43.8 61.3 52.7 59.7
who had never married (10.6% for the age group 40-44), while the Total 73.5 53.3 68.9 52.2 66.9
female population born outside Greater China had a very high share 30-34 Male 49.0 29.3 45.0 27.2 44.1
of people who had never married (19.1 % for the age group 40-44). Female 36.7 13.2 29.9 37.1 31.2
Thus, although there were more men than women in the total Total 43.0 19.6 37.2 35.4 36.9
population in Hong Kong, a situation that had been caused by a lower 35-39 Male 26.9 9.6 23.4 L7.2 23.2
gender ratio of population born in mainland China, Taiwan, Macao, Female 22.9 5.0 17.6 27.0 18.8
and outside Greater China, there were generally more men than Total 25.0 6.8 20.4 24.9 20.8
women among the population who had been born in Greater China 40-44 Male 15.5 4.2 11.8 10.6 11.7
and had never married. For the population born in Hong Kong who Female 15.6 3.4 11.4 19.1 12.2 may want a partner, the problem was also that there were more men Total 15.5 3.8 11.6 16.9 12.0 than women in the age group 20-39. The problem of more women 45-49 Male 10.4 4.2 7.8 7.5 7.8 than men only occurred among those aged 40-59. Thus, at least for Female 11.3 3.2 7.9 13.4 8.3 women aged 20-39 in Hong Kong, the genuine problem was a lack of Total 10.8 3.7 7.9 11.5 8.1 suitable partners to marry, rather than a shortage ofmen caused by the 50-54 Male 9.0 3.7 6.L 6.0 6.1 inflow of female-dominant migrants from mainland China. Female 7.6 2.9 5.1 8.9 5.3
Indeed, due to their rising economic status and levels of , Total 8.3 3.3 5.6 7.8 5.7 education, women may be having more difficulty finding suitable 55-59 Male 7.0 3.4 4.2 4.6 4.2 partners who can match their expectations (V-Beat Magazine, 2006). Female 5.4 1.7 2.6 4.9 2.8 According to a recent survey of 500 women aged 25-45 in Hong Total 6.2 2.7 3.5 4.7 3.6 Kong conducted by the Radio and Television Hong Kong and the Total Male 59.3 20.8 45.8 35.6 45.4 City University of Hong Kong (Ming Pao Daily News, 12 Fehruary
Female 55.5 16.6 41.1 40.6 41.0 2006), 84.3% of women consider a stable income to be the most important condition in choosing a partner. However, globalization
Total 57.5 18.6 43.5 39.2 43.2
and the economic transition in Hong Kong are necessitating frequent Source: CaLculaLed by the authors based On data from CSD (2002a: 12-14).
changes in employment and leading to less permanent employment,

I, "
34 Population Growth, Fertility Decline, and Ageing in Hong Kong
thus reducing the economie stability and attractiveness of men for marriage. All of this is contributing to delayed marriages and to an increasing proportion of people who are not married. These issues have to be addressed when dealing with the low fertility rate in Hong Kong. Indeed, if the marriage problem is caused by the femaledominant migrants from mainland China, then the number of births should not be affected. As the male population of Hong Kong is not greatly affected by such immigration, and if men were simply marrying mainland women instead oflocal women, the total number of couples and the total number of births would not be affected. But as shown in the previous section, both birth numbers and the fertility rate have declined in Hong Kong. Furthermore, migrants and visitors from mainland China who marry Hong Kong husbands do account for many of the births in Hong Kong. It can be concluded that migrants from mainland China do not affect the marriage opportunities for women and the fertility rate in Hong Kong.
Population Ageing and Migration
Other than the low fertility rate, another burning demographic issue in Hong Kong is the ageing of the population. In 2004, the number of births remained at the low level of 49,800, while the number of oneway permit holders from mainland China was reduced from 53,500 in 2003 to 38,000 in 2004, indieating a trend ofslow population growth in Hong Kong (Home Affairs Department, 2004). This has stimulated public concern over local population issues and policies. Migration is considered by many to be a possible solution to Hong Kong's ageing problem (Yip et aI., 2001; Tsui, 2005). This section will discuss the actual situation of the ageing population in Hong Kong and whether migration is an effective solution to this problem.
Ageing and the elderly population
Many people believe that the problem of an ageing population is currently very serious in Hong Kong, and have proposed solutions such as trying to increase the fertility rate and immigration. But this
Papulation Growth, Fertility Decline, and Ageing in Hong Kong 35
is a misconception. Ageing refers to an increase in the proportion of elderly population aged 60+ or 65+ in the total population and such a proportion remains at a high level. Currently, the problem of ageing is not a serious one in Hong Kong. The proportion of people aged 65+ in the total population only increased slightly from 8.7% in 1991 to 10.2% in 1996 and 11.2% in 2001 (CSD, 2002c:IO). Compared with other developed countries, this proportion is low, even lower than that of the USA, whieh has no problem of population ageing. The proportion ofpeople aged 65+ was 16.4% in Germany, 17.2% in Japan, 17.4% in Sweden, and 12.3% in USA in 2000 (Departp1ent of Economic and Social Affairs Population Division, 200 I).
The current low proportion of elderly people among the population in Hong Kong is a result of the high fertility rate and significant amount of immigration from the 1950s to 1970s. But similar to many other countries, the proportion ofpeople aged 65+ will rise continuously, reaching 12.5% in 2012,20% in 2025, and 29.2% in 2050 (Department of Economic and Social Affairs Population Division, 2001; Planning Department, 2003:57). By 2050, Hong Kong will have a very serious ageing problem. The situation will be similar to that in Germany and Sweden. The proportion of elderly people among the population in these two countries will be 31 % and 30.4%, respectively, in 2050. In 2050, Japan will be the country with the most serious ageing problem in the world. Its elderly population will reach 36.4% in that year.
It should be noted that even if the TFR maintains at the replacement level of 2.1, the level where births offset deaths, the elderly population would comprise around 20%. The current proportion of elderly people among the population in Hong Kong is far below the normal level. Therefore, an ageing population is a normal phenomenon. However, a society needs to take measures to limit its elderly population to under 25%. Otherwise, having a high proportion of elderly people among the population will have serious social and economic consequences.
Finally, the number of elderly people aged over 60 or 65 (those born before 1990 or 1985) from now to 2050 will be determined by the current population. According to the age structure data from the
I, . I !i ~ 36 Population Growth, Fer/Wty Decline. and Ageing in Hong Kong iii Ii' I I': 2001 census, the number of people aged 60 or 65 was about 50,000
in 200 L In 2011, 2021 and 2031, the number of people entering the age of 60 will be 96,000, 135,000, and 114,000, respectively. The number of such people will fall back to 50,000 only by 2061 (CSD, 2002a:8). Therefore, it is certain that there will be sustained growth in the elderly population from now to 2031. Raising the fertility rate or attracting more immigrants cannot change such growth in the elderly population up to 2031. It is projected that the number of people aged 65+ will increase from 747,000 in 2001 to 953,000 in 2012 (CSD, 2002a; Planning Department, 2003). Therefore, the govermnent and society should prepare well in advance for the medical care and financial support of the elderly.
The population target, fertility level, and migration policy
When discussing population policy, many people do not differentiate the population target from the fertility level and migration policy. This makes it difficult to tackle the key issue of the population problem. Population target refers to the desirable size of the total population to ensure an adequate labour supply to support economic development. Concerns about ageing are actually focused on the issue of whether Hong Kong will have enough of a working population to create sufficient wealth to support a huge elderly population. In order to solve the derived economic problem of an ageing population, we can raise fertility levels so as to increase the future supply of labour. Other options include improving the education and skill level of the population or speeding up economic restructuring to increase personal income so that individuals, households, and society are able
to support the elderly population. As mentioned before, a serious ageing problem will only occur
in the future. The immigration of a young labour force at that time will reduce the proportion of elderly people among the population, and increase the labour supply as well as the number of births. But currently, such an immigration measure is not effective or necessary to solve the ageing problem, and may even exaggerate the problem in the future. The immigration of people aged 25-40 now would only increase the elderly population and thus worsen the ageing situation,
PopfJlation Growth, Fertility Decline, and Ageing in Hong Kong 37
20-35 years later. Therefore, migration is only a useful and effective measure in the future, not now. It is another matter if the immigration ofpeople with more talents is encouraged to meet the needs ofcurrent economic development in Hong Kong. A migration policy that tackles the ageing problem should be differentiated from a migration policy for enhancing economic competitiveness.
Conclusion
Demographic changes have profound social and economic implications. The focus of this paper is on the demographic effect of migration on the population in Hong Kong. There are positive and negative perceptions of the demographic effects of migration. Some are correct perceptions, while others are wrong. For example, migrants from the mainland have been considered to be an effective way of relieving the problem of an ageing population in Hong Kong (Yip et aI., 200 I). Many people believe that the low marriage rate of the female population in Hong Kong is largely caused by the immigration of women from mainland China. This paper shows that these perceptions are not valid. Furthermore, the real effect of the mainland wives and new migrants on the fertility level in Hong Kong is not well understood.
Based on detailed analyses ofpopulation, migration, and fertility data, this paperscrutinizes the demographic effects ofmigration related to above issues in Hong Kong. The results will help in forming proper policy response to an acute fertility problem and to the "expected" severe problem of an ageing population in the future.
During the period 1961-1993, net migration was smaller than the natural increase in the population in Hong Kong in most years until 1993. It was in the most recent period 1993-2004 that migration became the most important source of population growth in Hong Kong. Migration accounted for over 56% of the population growth in this period except in 1997 and 2002. Overall, net migration accounted for less than 39.2% of the population growth in the period 19612004.

38 Population Growth, Fertility Decline, and Ageing in Hong Kong
The paper argues that the existing method of calculating the TFR of Hong Kong is problematic and that the children born from the mainland wives of Hong Kong residents in Hong Kong should be excluded. It is estimated that the real TFR of Hong Kong in 200 I should be 0.794-0.858 rather than 0.930. If we wish to include mainland wives in fertility calculations, then the mainland wives of Hong Kong residents who stay in Hong Kong and the mainland and their children born in mainland China should also be included. It is noted that the children of tbe wives of Hong Kong residents in mainland China have the right of abode in Hong Kong and that they will come to Hong Kong with one-way permits as migrants in the near future. The status of these children is similar to those children born in Hong Kong to mainland wives or those children born outside of Hong Kong to Hong Kong residents. But this will make the collection of fertility statistics very complicated. One simple solution is to exclude the mainland wives of Hong Kong residents and their babies born in Hong Kong from the fertility statistics.
Although there are more women than men in the total population of Hong Kong, there are generally more men than women among the population who were born in Greater China and have never married. For the population born in Hong Kong, the problem was also that of more men than women in the age group 20-39 in 200 I. Thus, at least for women aged 20-39 in Hong Kong, the genuine problem is a lack of suitable partners to marry, rather than a shortage of men due to the inflow offemale-dominant migrants from mainland China.
The paper argues that the problem of ageing is not currently a serious one in Hong Kong, and that the immediate immigration of young migrants is not an effective solution to the future problem of a large elderly population. Current migrants will sooner or later become elderly people, making the ageing problem much worse in the future. The paper argues that the timing of migration is important in assessing its impact on an ageing population. Migration is a measure best adopted in the future when the problem of ageing becomes very serious, rather than now. Indeed, an ageing population is a normal phenomenon, and Hong Kong is following a similar trend seen in other countries. The number of elderly people in 2050 has already
Population Growth, Fertility Decline, and Ageing in Hong Kong 39
been determined. Therefore, the society has to prepare well for the possible peak of an ageing population in the future. It is important to distinguish a migration policy for dealing with the problem of ageing from a migration policy' for attracting talented people to stimulate economic development. The fundamental solution to an ageing population would be to maintain a reasonable fertility level (with a TFR around 2), increase individual and family savings, and raise social security contributions to support the elderly life.
Because of social developments and changes in lifestyle, most couples in Hong Kong are choosing to have fewer than two oheven no children. To increase the fertility level will be a great social challenge. Countries like Germany and Japan have adopted various incentives to raise their fertility levcls without much success. One feasible measure for Hong Kong is to increase the level of government support for families to raise their children, such as a larger child allowance in income tax and offering better childcare facilities. Improving the quality of education, living standards, and housing will also help. Incentives should particularly aim at encouraging couples to have a second and third child. For example, the child allowance for the second and third children can be much higher than that for the first child. Such a policy has to be strong enough to have a significant effect. The policy will not result in a very high TFR (such as over 3) in Hong Kong, as only some couples in Hong Kong may eventually be persuaded to have more than two children.
References
Asia Television Ltd. 2006. "Tracing Current Events" (Home Channel), 4 February.
Census and Statistics Department (CSD). 1969. Hong Kong Statistics 1947-1967. Hong Kong: Government Printer.
---.1982. Hong Kong 1981 Census: Basic Tables. Hong Kong: Government Printer.
---. 1992. Hong Kong Annual Digest ofStatistics. Hong Kong: Govemment Printer.
I
40 Population Growth. Fertility Decline. and Ageing in Hong Kong I' ,I ,
---.. 2001. 2001 Population Census: Summary Results. Hong ! Kong: Printing Department.
---,. 2002a. 2001 Population Census: Main Tables. Hong Kong: Printing Department.
---. 2002b. "Compiling Population Estimates of Hong Kong," Hong Kong Monthly Digest ofStatistics: February 2002. Hong Kong: Printing Department, pp. FD 1-FD13.
---. 2002c. Demographic Trends in Hong Kong 1981-2001. Hong Kong: Printing Department.
---. 2002d. Thematic Report - Persons from the Mainland Having Resided in Hong Kong for Less Than 7 Years. Hong Kong: Printing Department.
---. 2005a. "Analysis of the Change in the Total Fertility Rate," Hong Kong Monthly Digest ofStatistics: September 2005. Hong Kong: Government Logistics Department, pp. FCI-FCII.
---. 2005b. "The Fertility Trend in Hong Kong, 1975-2004," Hong Kong Monthly Digest of Statistics: April 2005. Hong Kong: Government Logistics Department, pp. FDI-FDI2.
---. 2006. "Population and Vital Events," (http://www.censtatd. gov. hk/hong_kong_statistics/statistics_by_subj eel/index. jsp?subjectID~I, accessed on 6 January 2006).
Chiu, S. W. K, Choi S. Y. P. and Ting K F. 2005. "GettingAhead in the Capitalist Paradise: Migration from China and Socioeconomic Attainment in Colonial Hong Kong," The International Migration Review, 39(1):203-227.
Department of Economic and Social Affairs Population Division, United Nations. 200 I. World Population Ageing: 1950-2050 (http://www.un.org/esa/population/publications/worldageing 19502050/, accessed on 13 July 2005).
Feng, B. 2001. A Century ofHong Kong Real Estate Development. Hong Kong: Joint Publishing. (In Chinese)
Home Affairs Department. 2004. "The Quarterly Report on Questionnaire Survey, Fourth Quarter of 2004: Services for New Arrivals from the Mainland," (http://www.had.gov.
Population Growth, Fertility Decline, and Ageing in Hong Kong 41
hk/en/public_services/services_for_new_arrivals_from_the mainland/surveys.hlm, accessed on 12 February 2006).
Ho, L. S., Liu P. W. and Lam K. C. 1991. "International Labour Migration: The Case of Hong Kong." Hong Kong: Occasional Paper No.8, Hong Kong Institute of Asia-Pacific Studies, The Chinese University ofHong Kong.
Lam, K. C. and Liu P. W. 1993. "Are Immigrants Assimilating Better Now than a Decade Ago?: The Case of Hong Kong." Hong Kong: Occasional Paper No. 31, Hong Kong Institute of AsiaPacific Studies, The Chinese University ofHong Kong.
---. 1998. Immigration and the Economy ofHong Kong. Hong Kong: City University ofHong Kong Press.
---. 2000. "Earnings Divergence of Immigrants." Hong Kong: Occasional Paper No. 104, Hong Kong Institute ofAsia-Pacific Studies, The Chinese University ofHong Kong.
Lang, G. and Smart J. 2002. "Migration and the 'Second Wife' in South China: Toward Cross-border Polygyny," The International Migration Review, 36(2):546-569.
Lin, G. C. S. and Tse P. H. M. 2005. "Flexible Sojourning in the Era of Globalization: Cross-border Population Mobility in the Hong Kong-Guangdong Border Region," International Journal ofUrban and Regional Research, 29(4):867-894.
Mason, K O. 1997. "Explaining Fertility Transitions," Demography, 34(4):443-454.
Ng, N. Y. T. 1992. "Population: Growth, Profile and Redistribution," in Cheng J. Y. S. and Kwong P. C. K (eds), The Other Hong Kong Report 1992. Hong Kong: The Chinese University Press, pp.213-234.
Plane, D. A. and Rogerson P. A. 1994. The Geographical Analysis of Population: With Applications to Planning and Business. New York: John Wiley.
Planning Department. 2003. Projections ofPopulation Distribution: 2003-2012. Hong Kong: Government Logistics Department.
ill:
42 Population Growth, Fertility Decline. andAgeing in Hong Kong IIII
i'l Rogers, A. 1995. Multiregional Demography: Principles, Methods [\1 Ji
and Extensions. New York: Wiley. Iii!
Shen, J. 1994a. "Dynamic Analysis of Spatial Population Systems," ;1i~ ,~ ~i! CATMOG 57, School of Environmental Sciences, University of
East Anglia, Norwich.
---.. 1994b, "Spatial-dynamic Population Systems: Analysis and I:': I:i! Projection," Environment and Planning A, 26(3):471-488. :i:1
---.. 2003. "Cross-border Connection between Hong Kong and II Mainland China under 'Two Systems' Before and Beyond 1997," II I Geografiska Annaler Series B: Human Geography, 85(1): 1-17.
---.. 2004, "Cross-border Urban Governance in Hong Kong: The Role of Slate in a Globalizing City-region," The Professional
iii Geographer, 56(4):530-543.:I~
I ---.. 2005a. "Immigration of Talents Cannot Solve the Ageing Problem," Ming Pao Daily News, Forum Section, 28 February, A26. (In Chinese)
---. 2005b. "Immigration of Talents May Worsen the Ageing Problem in Future," Ming Pao Daily News, Forum Section, 2 March, B 15. (In Chinese)
So, A. y. 2003. "Cross-border Families in Hong Kong: The Role of Social Class and Politics," Critical Asian Studies, 35(4):515534.
Task Force on Population Policy. 2003. Report of the Task Force on Population Policy, 2003. Hong Kong: Printing Department.
Tsui, Wing-suen. 2005. "PopUlation Problem and Gender Unbalance," Hong Kong Economic Journal, 28 February. (In Chinese)
V-Beat Magazine. 2006. "35% Female Undergraduates Worry About Prospect ofManiage," V-Beat Magazine, 72:8-10. (In Chinese)
World Bank. 2005. World Development Indicators 2005 (CD-ROM). Washington, DC: World Bank.
Yip, P. S. F., Lee J., Cban B. andAu J. 2001. "A Study ofDemographic Changes under Sustained Below-replacement Fertility in Hong Kong SAR," Social Science & Medicine, 53(8):1003-1009.
Related Documents