273 VOL. 34, NO. 3 SOUTHWESTERN ENTOMOLOGIST SEP. 2009 Population Genetics and Phylogeography of Ixodes scapularis 1 from Canines and Deer in Arkansas R. T. Trout, C. D. Steelman, and A. L. Szalanski Department of Entomology, University of Arkansas, Fayetteville, AR 72701 Abstract. The blacklegged tick, Ixodes scapularis Say, is the principal vector of Borrelia burgdorferi Johnson, Schmid, Hyde, Steigerwalt & Brenner east of the Rocky Mountains. The population genetic structure was determined using DNA sequences of a 253-bp region of the mitochondrial DNA rRNA 16S gene from 46 blacklegged ticks collected from canines, Canis lupus familiaris L., and white-tailed deer, Odocoileus virginianus (Zimmermann), in four Arkansas ecoregions. Of the 253 nucleotide characters, 21 were variable. Eighteen haplotypes were identified of which 11 occurred only once. Most of the sequences were haplotype Ix9 (30%) which was found in all three ecoregions and on both host species. Molecular phylogenetic relationship of the 18 blacklegged tick haplotypes was constructed using other Ixodes species as outgroup taxa, and two I. scapularis clades were found representing the American and Southern lineages. Our results indicated that blacklegged tick is genetically variable in Arkansas, and the presence of the American lineage increases the risk for Lyme disease in Arkansas. Introduction Lyme disease, Borrelia burgdorferi Johnson, Schmid, Hyde, Steigerwalt & Brenner, is transmitted primarily by the blacklegged tick, Ixodes scapularis Say (Oliver et al. 1993). The tick is common throughout eastern North America, along the Atlantic coast, the Midwest, and the Gulf coast (Dennis et al. 1998). Blacklegged ticks from all of the regions have transmitted Lyme disease in laboratory settings (Oliver et al. 1993). Adult ticks commonly infest canines, Canis lupus familiaris L. (Daniels et al. 1993), white-tailed deer, Odocoileus virginianus (Zimmermann) (Apperson et al. 1990), and other mammals (Estrada-Pena and Jongejan 1999). Consequently, the presence of the tick on canines and deer combined with antibodies in the serum of the host can provide a measurable risk for Lyme disease (Daniels et al. 1993). Further understanding of the ticks on the two host species may illustrate that risk. Population genetic studies on blood-feeding arthropods provides information on the population structure of an ectoparasite, creates inferences and predictions into pathogen transmission, and identifies areas of high and low selection pressure (Black et al. 2001). Genetic variability of ticks is often influenced by population size and migration; whereas the amount of genetic variation is best described by host abundance, host mobility, and degree of host specificity (Hilburn and Sattler 1986). ________________________ 1 Acari: Ixodidae

Welcome message from author
This document is posted to help you gain knowledge. Please leave a comment to let me know what you think about it! Share it to your friends and learn new things together.
Transcript
273
VOL. 34, NO. 3 SOUTHWESTERN ENTOMOLOGIST SEP. 2009
Population Genetics and Phylogeography of Ixodes scapularis1 from Canines and Deer in Arkansas R. T. Trout, C. D. Steelman, and A. L. Szalanski Department of Entomology, University of Arkansas, Fayetteville, AR 72701 Abstract. The blacklegged tick, Ixodes scapularis Say, is the principal vector of Borrelia burgdorferi Johnson, Schmid, Hyde, Steigerwalt & Brenner east of the Rocky Mountains. The population genetic structure was determined using DNA sequences of a 253-bp region of the mitochondrial DNA rRNA 16S gene from 46 blacklegged ticks collected from canines, Canis lupus familiaris L., and white-tailed deer, Odocoileus virginianus (Zimmermann), in four Arkansas ecoregions. Of the 253 nucleotide characters, 21 were variable. Eighteen haplotypes were identified of which 11 occurred only once. Most of the sequences were haplotype Ix9 (30%) which was found in all three ecoregions and on both host species. Molecular phylogenetic relationship of the 18 blacklegged tick haplotypes was constructed using other Ixodes species as outgroup taxa, and two I. scapularis clades were found representing the American and Southern lineages. Our results indicated that blacklegged tick is genetically variable in Arkansas, and the presence of the American lineage increases the risk for Lyme disease in Arkansas.
Introduction
Lyme disease, Borrelia burgdorferi Johnson, Schmid, Hyde, Steigerwalt & Brenner, is transmitted primarily by the blacklegged tick, Ixodes scapularis Say (Oliver et al. 1993). The tick is common throughout eastern North America, along the Atlantic coast, the Midwest, and the Gulf coast (Dennis et al. 1998). Blacklegged ticks from all of the regions have transmitted Lyme disease in laboratory settings (Oliver et al. 1993). Adult ticks commonly infest canines, Canis lupus familiaris L. (Daniels et al. 1993), white-tailed deer, Odocoileus virginianus (Zimmermann) (Apperson et al. 1990), and other mammals (Estrada-Pena and Jongejan 1999). Consequently, the presence of the tick on canines and deer combined with antibodies in the serum of the host can provide a measurable risk for Lyme disease (Daniels et al. 1993). Further understanding of the ticks on the two host species may illustrate that risk.
Population genetic studies on blood-feeding arthropods provides information on the population structure of an ectoparasite, creates inferences and predictions into pathogen transmission, and identifies areas of high and low selection pressure (Black et al. 2001). Genetic variability of ticks is often influenced by population size and migration; whereas the amount of genetic variation is best described by host abundance, host mobility, and degree of host specificity (Hilburn and Sattler 1986). ________________________
1Acari: Ixodidae
274
The expected high levels of gene flow in ectoparasites can be attributed to genetic diversity in mitochondrial DNA among the host populations; large amounts have been found in populations of white-tailed deer from Georgia and South Carolina (15 deer haplotypes among six sites) (Purdue et al. 2000). Often dispersal of ticks by deer and consequently their ectoparasites is limited because of geographical boundaries and overharvesting the host. Both mitochondrial and nuclear DNA have been used to identify phylogenetic relationships among ixodid ticks (McLain et al. 1995, Fukunaga et al. 2000). Phylogenetic analysis of the mitochondrial 16S rDNA (ribosomal DNA) region revealed that hard ticks did not evolve until the early Cretaceous Period (Black and Piesman 1994). Nuclear ribosomal DNA ITS-1 (first internal transcribed spacer) and ITS-2 regions were used to validate the single species of I. scapularis and I. dammini (Spielman, Clifford, Piesman & Corwin) (Wesson et al. 1993). However, the ITS-2 region is not useful for assessing phylogenetic relationships among ticks because the region is variable and ticks evolved relatively recently (Rich et al. 1997). Other genetic studies using allozymes for I. pacificus Cooley (Kain et al. 1997) and I. ricinus (L.) (de Laye et al. 1997) found a lack of differentiation among the populations between nearby localities and high rates of gene flow, indicating a rapid expansion of each population. Those allozyme studies concluded that the dispersal and population size of the host as well as use by ticks of a broad host range contributes to the great amounts of gene flow. Previous work on genetic variation using the mtDNA 16S gene (Rich et al. 1995, Norris et al. 1996), 18S nuclear rDNA gene (Norris et al. 1996), ITS-1 nuclear DNA gene (McLain et al. 1995), and D3 rDNA gene (McLain et al. 2001) of blacklegged ticks in North America found this tick species to separate into American and Southern lineages. These studies used ticks collected from laboratory colonies or immature specimens from the field; however, none of these studies used ticks collected from identified hosts. Only one of those studies used a relatively large sample size (Norris et al. 1996); the other studies used less than 30 ticks from several U.S. states (typically two or three ticks per state). Additionally, these studies were focused along the eastern coast of North America and a few field samples were from the Midwest, Alabama, and Mississippi. We used PCR and direct sequencing of a portion of the mtDNA 16S gene of blacklegged ticks from Arkansas to assess the extent of genetic variation among populations by ecoregion and host species. Mitochondrial markers are often reliable for identifying diverse populations because they are maternally inherited, do not recombine, and lineages can rapidly become extinct (Rich et al. 1995). We believe the tick populations will be closely associated because mitochondrial genes are often used to examine relationships among closely related species and blacklegged tick is the most common tick infesting deer and the second most common tick infesting canines in Arkansas (Trout and Steelman unpublished). Data from this study provides insight into use by ticks of canines and deer for dispersal and help illustrate potential pathogen dispersal patterns among blacklegged tick haplotypes in Arkansas.
Materials and Methods
The University of Arkansas Veterinary Entomology Laboratory assembled and mailed collection kits to 323 veterinarian clinics throughout the state. Samples sent from a clinic were processed and an additional kit was returned for additional
275
collections (14% participation). Kits included collection and mailing instructions and 100% ethanol-filled vials. Collection kits also were assembled and distributed to the Arkansas Game and Fish Commission to collect ticks from hunter-killed deer examined for chronic wasting disease (a separately funded study). Ticks were collected from March 2006 to January 2008 and all collections were from the state of Arkansas including small portions of the Ozarks. Collectors removed ticks from the host; stored them in 100% ethanol-filled vials; recorded information such as date, location, and host species; and sent the specimens to the University of Arkansas where they were identified to engorgement state, gender, and species (Arthur 1961, Lancaster 1973, Goddard and Norment 1985). Voucher specimens are maintained in the University of Arkansas Arthropod Museum, Fayetteville, AR. To minimize contamination, DNA extraction and PCR were done in different laboratories, negative checks were used, and supplies were dedicated to each procedure. A subsample of the blacklegged tick collections was used for molecular analyses and the tick DNA was isolated in the Veterinary Entomology Laboratory at the University of Arkansas. After each specimen was dried on paper towels, it was longitudinally cut and subjected to the Qiagen Dneasy Insect Protocol (Qiagen Inc. Rohm and Haas Company, Valencia, CA). Samples were stored at -20EC in a freezer to delay DNA degradation until further analyses. PCR and gel electrophoresis were done in the Social Insects Genetic Laboratory at the University of Arkansas. Each PCR set included a negative and a positive check. A master mix reaction was prepared according to the protocol of Szalanski et al. (1997), and a Flexigene thermocycler (Techne Duxford, Cambridge, UK) was used for all reactions. Negative checks substituted sterile water for template DNA. Reaction products were analyzed by electrophoresis in 1% agarose gels stained with ethidium bromide and visualized and documented with a UVP biodoc-it system (UVP Inc., Upland, CA). Extracted DNA from blacklegged ticks was assessed by PCR with mitochondrial primers 16S+2 (5’ TTG GGC AAG AAG ACC CTA TGA A 3’) and 16S-1 (5’ CCG GTC TGA ACT CAG ATC AAG T 3’) (Black and Piesman 1994). Each reaction was initially denatured for 2 minutes at 94°C. Amplification included 35 cycles of denaturing at 95°C for 30 seconds, annealing at 55°C for 30 seconds, and extension at 72°C for 60 seconds. At the end of the cycles, the samples were held for 5 minutes for a final extension at 72°C. Reaction products were analyzed with gel electrophoresis in 1% agarose gels stained with ethidium bromide, and visualized with a UVP biodoc-it system (UVP Inc., Upland, CA). Amplified products were purified and concentrated with minicolumns according to the manufacturer’s instructions (Wizard PCRpreps, Promega, Madison, WI). Samples were sent to the University of Arkansas Medical Sciences DNA Sequencing Facility (Little Rock, AR) for direct sequencing in both directions using an Applied Biosystems Genetic Analyzer (Model 3100, Foster City, CA). Sequences were initially aligned using MAAFTv6 (Katoh et al. 2005), and PAUP* 4.0b10 (Swofford 2001) was used for phylogenetic analyses. Consensus sequences were derived from both directions of the DNA sequences using Bioedit 5.09 (Hall 1999) to verify nucleotide polymorphisms. Mitochondrial DNA haplotypes were aligned with MacClade version 4 (Sinauer Associates, Sunderland, MA). Representatives of each haplotype were submitted to GenBank as accession numbersGQ368831-GQ368848. PAUP* 4.0b10 distance matrix option (Swofford 2001) was used to calculate genetic distances according to the Kimura 2-parameter model of sequence evolution (Kimura 1980), maximum likelihood, and unweighted
276
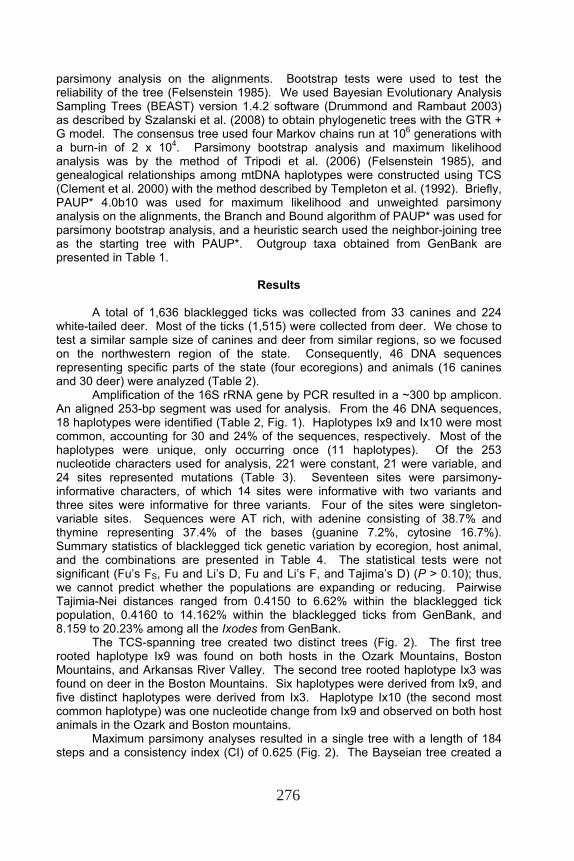
parsimony analysis on the alignments. Bootstrap tests were used to test the reliability of the tree (Felsenstein 1985). We used Bayesian Evolutionary Analysis Sampling Trees (BEAST) version 1.4.2 software (Drummond and Rambaut 2003) as described by Szalanski et al. (2008) to obtain phylogenetic trees with the GTR + G model. The consensus tree used four Markov chains run at 106 generations with a burn-in of 2 x 10⁴. Parsimony bootstrap analysis and maximum likelihood analysis was by the method of Tripodi et al. (2006) (Felsenstein 1985), and genealogical relationships among mtDNA haplotypes were constructed using TCS (Clement et al. 2000) with the method described by Templeton et al. (1992). Briefly, PAUP* 4.0b10 was used for maximum likelihood and unweighted parsimony analysis on the alignments, the Branch and Bound algorithm of PAUP* was used for parsimony bootstrap analysis, and a heuristic search used the neighbor-joining tree as the starting tree with PAUP*. Outgroup taxa obtained from GenBank are presented in Table 1.
Results
A total of 1,636 blacklegged ticks was collected from 33 canines and 224 white-tailed deer. Most of the ticks (1,515) were collected from deer. We chose to test a similar sample size of canines and deer from similar regions, so we focused on the northwestern region of the state. Consequently, 46 DNA sequences representing specific parts of the state (four ecoregions) and animals (16 canines and 30 deer) were analyzed (Table 2).
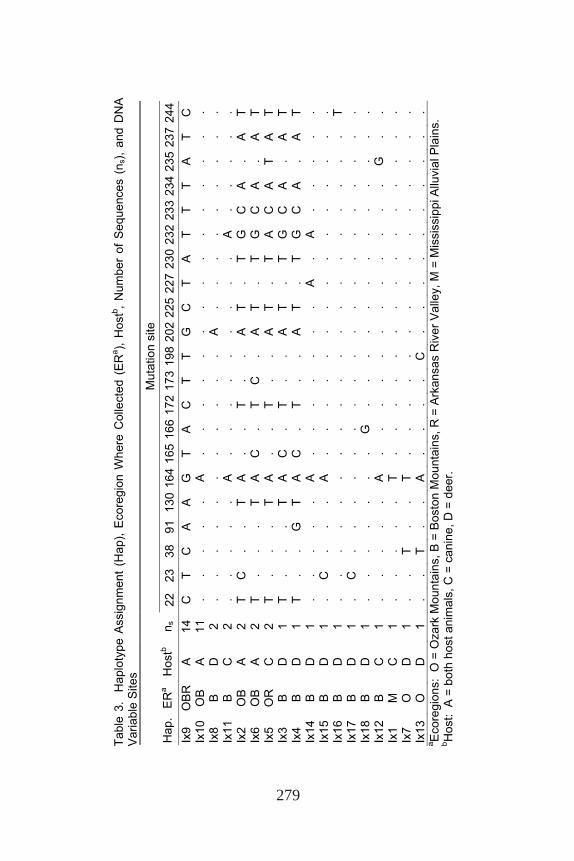
Amplification of the 16S rRNA gene by PCR resulted in a ~300 bp amplicon. An aligned 253-bp segment was used for analysis. From the 46 DNA sequences, 18 haplotypes were identified (Table 2, Fig. 1). Haplotypes Ix9 and Ix10 were most common, accounting for 30 and 24% of the sequences, respectively. Most of the haplotypes were unique, only occurring once (11 haplotypes). Of the 253 nucleotide characters used for analysis, 221 were constant, 21 were variable, and 24 sites represented mutations (Table 3). Seventeen sites were parsimony-informative characters, of which 14 sites were informative with two variants and three sites were informative for three variants. Four of the sites were singleton-variable sites. Sequences were AT rich, with adenine consisting of 38.7% and thymine representing 37.4% of the bases (guanine 7.2%, cytosine 16.7%). Summary statistics of blacklegged tick genetic variation by ecoregion, host animal, and the combinations are presented in Table 4. The statistical tests were not significant (Fu’s FS, Fu and Li’s D, Fu and Li’s F, and Tajima’s D) (P > 0.10); thus, we cannot predict whether the populations are expanding or reducing. Pairwise Tajimia-Nei distances ranged from 0.4150 to 6.62% within the blacklegged tick population, 0.4160 to 14.162% within the blacklegged ticks from GenBank, and 8.159 to 20.23% among all the Ixodes from GenBank.
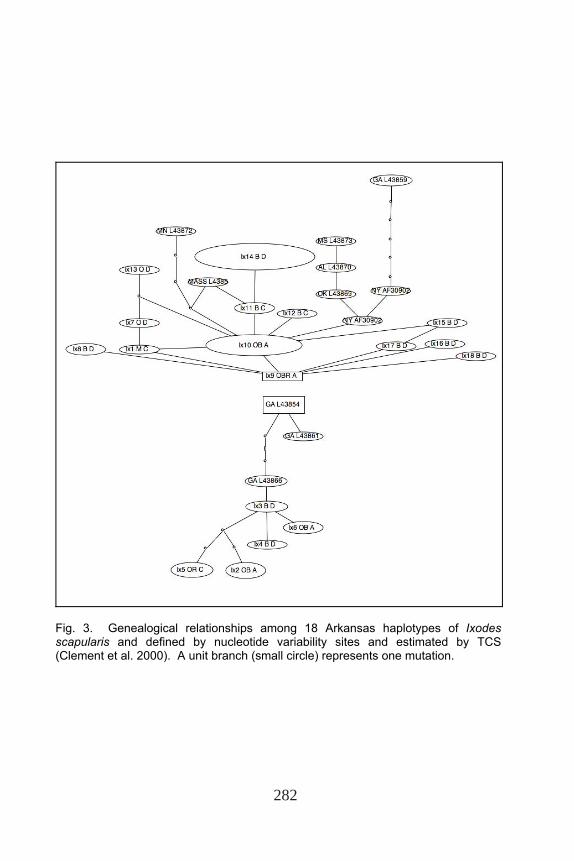
The TCS-spanning tree created two distinct trees (Fig. 2). The first tree rooted haplotype Ix9 was found on both hosts in the Ozark Mountains, Boston Mountains, and Arkansas River Valley. The second tree rooted haplotype Ix3 was found on deer in the Boston Mountains. Six haplotypes were derived from Ix9, and five distinct haplotypes were derived from Ix3. Haplotype Ix10 (the second most common haplotype) was one nucleotide change from Ix9 and observed on both host animals in the Ozark and Boston mountains.
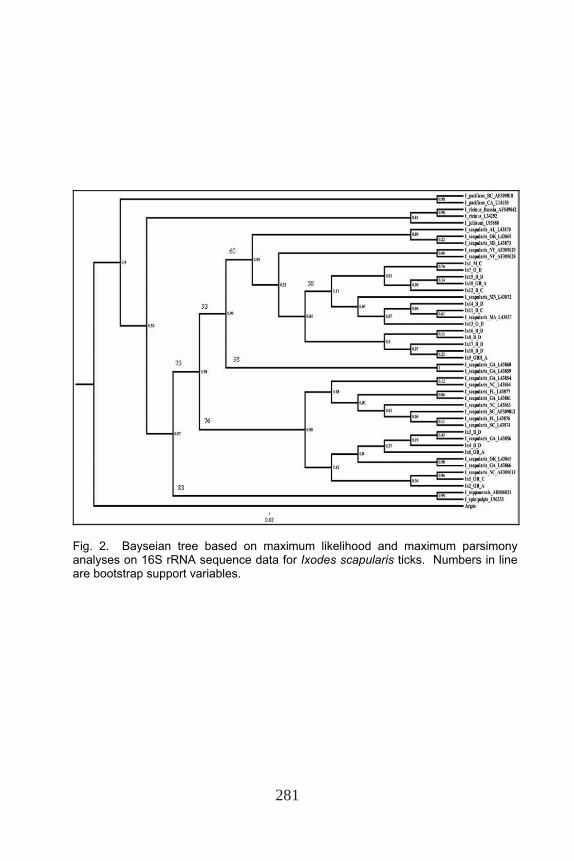
Maximum parsimony analyses resulted in a single tree with a length of 184 steps and a consistency index (CI) of 0.625 (Fig. 2). The Bayseian tree created a
277
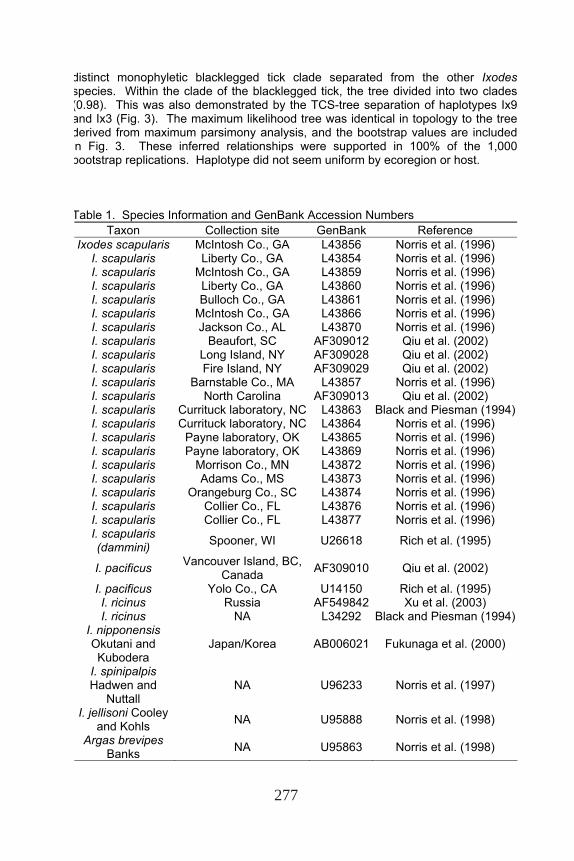
distinct monophyletic blacklegged tick clade separated from the other Ixodes species. Within the clade of the blacklegged tick, the tree divided into two clades (0.98). This was also demonstrated by the TCS-tree separation of haplotypes Ix9 and Ix3 (Fig. 3). The maximum likelihood tree was identical in topology to the tree derived from maximum parsimony analysis, and the bootstrap values are included in Fig. 3. These inferred relationships were supported in 100% of the 1,000 bootstrap replications. Haplotype did not seem uniform by ecoregion or host. Table 1. Species Information and GenBank Accession Numbers
Taxon Collection site GenBank Reference Ixodes scapularis McIntosh Co., GA L43856 Norris et al. (1996)
I. scapularis Liberty Co., GA L43854 Norris et al. (1996) I. scapularis McIntosh Co., GA L43859 Norris et al. (1996) I. scapularis Liberty Co., GA L43860 Norris et al. (1996) I. scapularis Bulloch Co., GA L43861 Norris et al. (1996) I. scapularis McIntosh Co., GA L43866 Norris et al. (1996) I. scapularis Jackson Co., AL L43870 Norris et al. (1996) I. scapularis Beaufort, SC AF309012 Qiu et al. (2002) I. scapularis Long Island, NY AF309028 Qiu et al. (2002) I. scapularis Fire Island, NY AF309029 Qiu et al. (2002) I. scapularis Barnstable Co., MA L43857 Norris et al. (1996) I. scapularis North Carolina AF309013 Qiu et al. (2002) I. scapularis Currituck laboratory, NC L43863 Black and Piesman (1994)I. scapularis Currituck laboratory, NC L43864 Norris et al. (1996) I. scapularis Payne laboratory, OK L43865 Norris et al. (1996) I. scapularis Payne laboratory, OK L43869 Norris et al. (1996) I. scapularis Morrison Co., MN L43872 Norris et al. (1996) I. scapularis Adams Co., MS L43873 Norris et al. (1996) I. scapularis Orangeburg Co., SC L43874 Norris et al. (1996) I. scapularis Collier Co., FL L43876 Norris et al. (1996) I. scapularis Collier Co., FL L43877 Norris et al. (1996) I. scapularis (dammini) Spooner, WI U26618 Rich et al. (1995)
I. pacificus Vancouver Island, BC, Canada AF309010 Qiu et al. (2002)
I. pacificus Yolo Co., CA U14150 Rich et al. (1995) I. ricinus Russia AF549842 Xu et al. (2003) I. ricinus NA L34292 Black and Piesman (1994)
I. nipponensis Okutani and Kubodera
Japan/Korea AB006021 Fukunaga et al. (2000)
I. spinipalpis Hadwen and
Nuttall NA U96233 Norris et al. (1997)
I. jellisoni Cooley and Kohls NA U95888 Norris et al. (1998)
Argas brevipes Banks NA U95863 Norris et al. (1998)
278
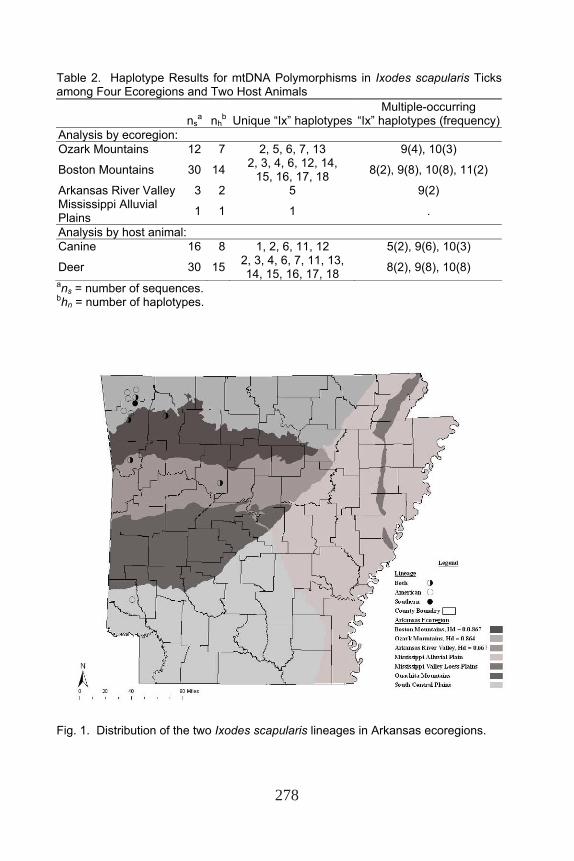
Table 2. Haplotype Results for mtDNA Polymorphisms in Ixodes scapularis Ticks among Four Ecoregions and Two Host Animals
nsa nh
b Unique “Ix” haplotypesMultiple-occurring
“Ix” haplotypes (frequency)Analysis by ecoregion: Ozark Mountains 12 7 2, 5, 6, 7, 13 9(4), 10(3)
Boston Mountains 30 14 2, 3, 4, 6, 12, 14, 15, 16, 17, 18 8(2), 9(8), 10(8), 11(2)
Arkansas River Valley 3 2 5 9(2) Mississippi Alluvial Plains 1 1 1 .
Analysis by host animal: Canine 16 8 1, 2, 6, 11, 12 5(2), 9(6), 10(3)
Deer 30 15 2, 3, 4, 6, 7, 11, 13, 14, 15, 16, 17, 18 8(2), 9(8), 10(8)
ans = number of sequences. bhn = number of haplotypes.
Fig. 1. Distribution of the two Ixodes scapularis lineages in Arkansas ecoregions.
279
Tabl
e 3.
H
aplo
type
Ass
ignm
ent
(Hap
), E
core
gion
Whe
re C
olle
cted
(E
Ra ),
Hos
tb , N
umbe
r of
Seq
uenc
es (
n s),
and
DN
A
Var
iabl
e S
ites
Mut
atio
n si
te
H
ap.
ER
a H
ostb
n s
22
2338
9113
016
416
516
617
217
319
8 20
222
522
723
023
223
323
423
523
724
4Ix
9 O
BR
A
14
C
T
C
A
A
G
T A
C
T
T G
C
T
A
T T
T A
T
C
Ix10
O
B
A
11
. .
. .
. A
.
. .
. .
. .
. .
. .
. .
. .
Ix8
B
D
2 .
. .
. .
. .
. .
. .
A
. .
. .
. .
. .
. Ix
11
B
C
2 .
. .
. .
A
. .
. .
. .
. .
. A
.
. .
. .
Ix2
OB
A
2
T C
.
. T
A
. .
T .
. A
T
. T
G
C
A
. A
T
Ix6
OB
A
2
T .
. .
T A
C
.
T C
.
A
T .
T G
C
A
.
A
T Ix
5 O
R
C
2 T
. .
. T
A
. .
T .
. A
T
. T
A
C
A
T A
T
Ix3
B
D
1 T
. .
. T
A
C
. T
. .
A
T .
T G
C
A
.
A
T Ix
4 B
D
1
T .
. G
T
A
C
. T
. .
A
T .
T G
C
A
.
A
T Ix
14
B
D
1 .
. .
. .
A
. .
. .
. .
. A
.
A
. .
. .
. Ix
15
B
D
1 .
C
. .
. A
.
. .
. .
. .
. .
. .
. .
. .
Ix16
B
D
1
. .
. .
. .
. .
. .
. .
. .
. .
. .
. .
T Ix
17
B
D
1 .
C
. .
. .
. .
. .
. .
. .
. .
. .
. .
. Ix
18
B
D
1 .
. .
. .
. .
G
. .
. .
. .
. .
. .
. .
. Ix
12
B
C
1 .
. .
. .
A
. .
. .
. .
. .
. .
. .
G
. .
Ix1
M
C
1 .
. .
. .
T .
. .
. .
. .
. .
. .
. .
. .
Ix7
O
D
1 .
. T
. .
T .
. .
. .
. .
. .
. .
. .
. .
Ix13
O
D
1
. .
T .
. A
.
. .
. C
.
. .
. .
. .
. .
. a E
core
gion
s: O
= O
zark
Mou
ntai
ns, B
= B
osto
n M
ount
ains
, R =
Ark
ansa
s R
iver
Val
ley,
M =
Mis
siss
ippi
Allu
vial
Pla
ins.
b H
ost:
A =
bot
h ho
st a
nim
als,
C =
can
ine,
D =
dee
r.
280
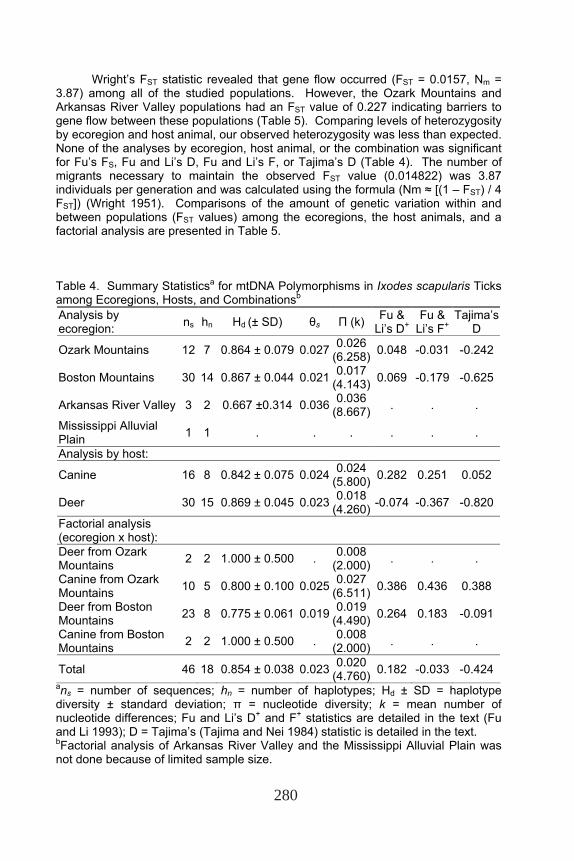
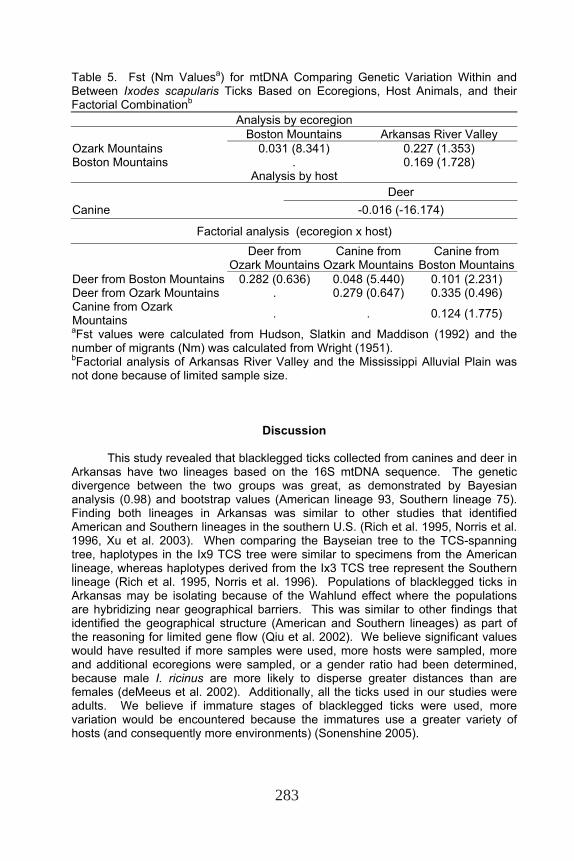
Wright’s FST statistic revealed that gene flow occurred (FST = 0.0157, Nm = 3.87) among all of the studied populations. However, the Ozark Mountains and Arkansas River Valley populations had an FST value of 0.227 indicating barriers to gene flow between these populations (Table 5). Comparing levels of heterozygosity by ecoregion and host animal, our observed heterozygosity was less than expected. None of the analyses by ecoregion, host animal, or the combination was significant for Fu’s FS, Fu and Li’s D, Fu and Li’s F, or Tajima’s D (Table 4). The number of migrants necessary to maintain the observed FST value (0.014822) was 3.87 individuals per generation and was calculated using the formula (Nm [(1 – FST) / 4 FST]) (Wright 1951). Comparisons of the amount of genetic variation within and between populations (FST values) among the ecoregions, the host animals, and a factorial analysis are presented in Table 5. Table 4. Summary Statisticsa for mtDNA Polymorphisms in Ixodes scapularis Ticks among Ecoregions, Hosts, and Combinationsb Analysis by ecoregion: ns hn Hd (± SD) s (k) Fu &
Li’s D+ Fu &
Li’s F+ Tajima’s
D
Ozark Mountains 12 7 0.864 ± 0.079 0.027 0.026(6.258) 0.048 -0.031 -0.242
Boston Mountains 30 14 0.867 ± 0.044 0.021 0.017(4.143) 0.069 -0.179 -0.625
Arkansas River Valley 3 2 0.667 ±0.314 0.036 0.036(8.667) . . .
Mississippi Alluvial Plain 1 1 . . . . . .
Analysis by host:
Canine 16 8 0.842 ± 0.075 0.024 0.024(5.800) 0.282 0.251 0.052
Deer 30 15 0.869 ± 0.045 0.023 0.018(4.260) -0.074 -0.367 -0.820
Factorial analysis (ecoregion x host):
Deer from Ozark Mountains 2 2 1.000 ± 0.500 . 0.008
(2.000) . . .
Canine from Ozark Mountains 10 5 0.800 ± 0.100 0.025 0.027
(6.511) 0.386 0.436 0.388
Deer from Boston Mountains 23 8 0.775 ± 0.061 0.019 0.019
(4.490) 0.264 0.183 -0.091
Canine from Boston Mountains 2 2 1.000 ± 0.500 . 0.008
(2.000) . . .
Total 46 18 0.854 ± 0.038 0.023 0.020(4.760) 0.182 -0.033 -0.424
ans = number of sequences; hn = number of haplotypes; Hd ± SD = haplotype diversity ± standard deviation; = nucleotide diversity; k = mean number of nucleotide differences; Fu and Li’s D+ and F+ statistics are detailed in the text (Fu and Li 1993); D = Tajima’s (Tajima and Nei 1984) statistic is detailed in the text. bFactorial analysis of Arkansas River Valley and the Mississippi Alluvial Plain was not done because of limited sample size.
281
Fig. 2. Bayseian tree based on maximum likelihood and maximum parsimony analyses on 16S rRNA sequence data for Ixodes scapularis ticks. Numbers in line are bootstrap support variables.
282
Fig. 3. Genealogical relationships among 18 Arkansas haplotypes of Ixodes scapularis and defined by nucleotide variability sites and estimated by TCS (Clement et al. 2000). A unit branch (small circle) represents one mutation.
283
Table 5. Fst (Nm Valuesa) for mtDNA Comparing Genetic Variation Within and Between Ixodes scapularis Ticks Based on Ecoregions, Host Animals, and their Factorial Combinationb
Analysis by ecoregion Boston Mountains Arkansas River Valley
Ozark Mountains 0.031 (8.341) 0.227 (1.353) Boston Mountains . 0.169 (1.728)
Analysis by host Deer
Canine -0.016 (-16.174)
Factorial analysis (ecoregion x host)
Deer from Ozark Mountains
Canine from Ozark Mountains
Canine from Boston Mountains
Deer from Boston Mountains 0.282 (0.636) 0.048 (5.440) 0.101 (2.231) Deer from Ozark Mountains . 0.279 (0.647) 0.335 (0.496) Canine from Ozark Mountains . . 0.124 (1.775) aFst values were calculated from Hudson, Slatkin and Maddison (1992) and the number of migrants (Nm) was calculated from Wright (1951). bFactorial analysis of Arkansas River Valley and the Mississippi Alluvial Plain was not done because of limited sample size.
Discussion
This study revealed that blacklegged ticks collected from canines and deer in Arkansas have two lineages based on the 16S mtDNA sequence. The genetic divergence between the two groups was great, as demonstrated by Bayesian analysis (0.98) and bootstrap values (American lineage 93, Southern lineage 75). Finding both lineages in Arkansas was similar to other studies that identified American and Southern lineages in the southern U.S. (Rich et al. 1995, Norris et al. 1996, Xu et al. 2003). When comparing the Bayseian tree to the TCS-spanning tree, haplotypes in the Ix9 TCS tree were similar to specimens from the American lineage, whereas haplotypes derived from the Ix3 TCS tree represent the Southern lineage (Rich et al. 1995, Norris et al. 1996). Populations of blacklegged ticks in Arkansas may be isolating because of the Wahlund effect where the populations are hybridizing near geographical barriers. This was similar to other findings that identified the geographical structure (American and Southern lineages) as part of the reasoning for limited gene flow (Qiu et al. 2002). We believe significant values would have resulted if more samples were used, more hosts were sampled, more and additional ecoregions were sampled, or a gender ratio had been determined, because male I. ricinus are more likely to disperse greater distances than are females (deMeeus et al. 2002). Additionally, all the ticks used in our studies were adults. We believe if immature stages of blacklegged ticks were used, more variation would be encountered because the immatures use a greater variety of hosts (and consequently more environments) (Sonenshine 2005).
284
Although our study was limited in sample size, the study correlated with
previous findings. Rich et al. (1995) compared 16S mtDNA from 21 sites east of the Mississippi River and along the Atlantic Coast from Maine to Florida and found a distinct separation of American and Southern blacklegged ticks. These distinct lineages were isolated in the northern U.S., but in the southern U.S. the American lineage may have been reintroduced to the region by elk, Cervus canadensis (Erxleben); deer; or birds. Much nucleotide variation in the 12S and 16S genes from blacklegged ticks along the Atlantic Coast was identified, and two mitochondrial lineages existed that gave rise to two allopatric lineages (Norris et al. 1996). Investigations into other genetic regions found the ITS-1 region separating the blacklegged tick species into three clades representing the northeast (Massachusetts, New Jersey, and New York), mid-east (Maryland and North Carolina), and southeast (Georgia and Florida) (McLain et al. 1995). Our study found two lineages, previously recognized as the American and Southern lineage, of blacklegged ticks in Arkansas, with most of the specimens more similar to ticks from the American lineage. This is important because the American lineage is more likely to transmit Borrelia (Qiu et al. 2002). Interestingly, there was little geographic- or host-specific population structure among blacklegged ticks in Arkansas. All ecoregions and both host animals had little gene flow occurring between the populations, but this may be because of recent human demographic changes in Arkansas that include a 14% gain in the population of the state from 1990 to 2000 (Anonymous 2001). The northwestern Arkansas region of Springdale, Fayetteville, and Bentonville (Benton and Washington counties) is one of the 10 fastest growing metropolitan areas in the U.S., accounting for more than 47% of the population growth of Arkansas (Anonymous 2001). This metropolitan area is in the northern Ozark Mountains and southern Boston Mountains. The greater gene flow between the Boston Mountain canines and the Ozark Mountain deer may be because pet owners in the Boston Mountains transport canines into the Ozark Mountains and allow their pets to come into contact with tick-infested deer habitat. Conversely, the Ozark Mountains provide less food selection (Rogers et al. 1990), forcing deer to leave the Ozark Mountains and enter the Boston Mountains to search for better habitat. Our finding that blacklegged ticks from the American lineage are in Arkansas raises a concern because the American lineage is more likely than the Southern lineage to transmit Lyme disease (Qiu et al. 2002). Analyses of the ompC gene of B. burgdorferi identified differences in the American and Southern lineages for blacklegged tick vector competence. There are differences in genetic structure, evolutionary history, and epidemiological characters between the American and Southern lineages of blacklegged ticks that may contribute to the differences in vector competence differences (Qiu et al. 2002). This study identified ticks capable of vectoring Lyme disease in Arkansas, whereas previous studies identified the causative agent and similar agents in Arkansas and neighboring states (Gullo 1998, Bacon et al. 2003, Moore et al. 2003, Stromodahl et al. 2003). This study adds more questions about southern cases of Lyme disease (Goddard 2001) such as haplotype-bacteria interactions and prevalence of specific pathogens. Because we identified blacklegged ticks in Arkansas capable of vectoring Lyme disease, it is important to investigate the identity and prevalence of tick-borne bacteria in Arkansas.
285
Acknowledgment
We thank veterinarians with the Arkansas Veterinarian Society and members
of the Arkansas Game and Fish Commission for collecting blacklegged ticks. This research was supported in part by the University of Arkansas, Arkansas Agricultural Experiment Station.
References Cited
Anonymous. 2001. Population change and distribution: census 2000 brief. U.S.
Dep. of Commerce. http://www.census.gov/prod/2001pubs/c2kbr01-2.pdf. Apperson, C. S., J. F. Levine, and W. L. Nicholson. 1990. Geographic occurrence
of Ixodes scapularis and Amblyomma americanum (Acari: Ixodidae) infesting white-tailed deer in North Carolina. J. Wildlife Dis. 26: 550-553.
Arthur, D. R. 1961. Ticks and Disease. Row, Peterson and Company, Evanston, IL.
Bacon, R. M., R. D. Gilmore Jr., M. Quintana, J. Piesman, and B. J. B. Johnson. 2003. DNA evidence of Borrelia lonestari in Amblyomma americanum (Acari: Ixodidae) in Southeast Missouri. J. Med. Entomol. 40: 590-592.
Black, W. C., and J. Piesman. 1994. Phylogeny of hard- and soft- tick taxa (Acari: Ixodida) based on mitochondrial 16S rDNA sequences. Proc. Nat. Acad. Sci. 91: 10034-10038.
Black IV, W. C., C. F. Baer, M. F. Antolin, and N. M. DuTeau. 2001. Population genomics: genome-wide sampling of insect populations. Annu. Rev. Entomol. 46: 441- 469.
Clement, M., D. Posada, and K. A. Crandall. 2000. TCS: a computer program to estimate gene genealogies. Molecular Ecol. 9: 1657-1659.
Daniels, T. J., D. Fish, J. F. Levine, M. A. Greco, A. T. Eaton, P. J. Padgett, and D. A. LaPointe. 1993. Canine exposure to Borrelia burgdorferi and prevalence of Ixodes dammini (Acari: Ixodidae) on deer as a measure of Lyme disease risk in the northeastern United States. J. Med. Entomol. 30: 171-178.
Dennis, D. T., T. S. Nekomoto, J. C. Victor, W. S. Paul, and J. Piesman. 1998. Reported distribution of Ixodes scapularis and Ixodes pacificus (Acari: Ixodidae) in the United States. J. Med. Entomol. 35: 629-638.
Drummond, A. J., and A. Rambaut. 2003. BEAST v1.0. (http://evolve.zoo.ox.ac.uk/ beast/).
Estrada-Pena, A., and F. Jongejan. 1999. Ticks feeding on humans: a review of records on human-biting Ixodoidea with special reference to pathogen transmission. Exp. App. Acarol. 23: 685-715.
Felsenstein, J. 1985. Confidence limits on phylogenies: an approach using the bootstrap. Evolution 39: 783-791.
Fu, Y. X., and W. H. Li. 1993. Coalescing into the 21st century: an overview and prospective of coalescent theory. Theory Pop. Biol. 56: 1-10.
Fukunaga, M., M. Yabuki, A. Hamase, J. H. Oliver Jr., and M. Nakao. 2000. Molecular phylogenetic analysis of Ixodid ticks based on the ribosomal DNA spacer, internal transcribed spacer 2, sequences. J. Parasitol. 86: 38-43.
Goddard, J. 2001. What’s going on with Lyme disease in the South? Inf. Med. 18: 132-133.
Goddard, J., and B. R. Norment. 1985. A Guide to the Ticks of Mississippi. Mississippi State University, Mississippi Agricultural and Forestry Experiment Station Bull. 935.
Gullo, S. 1998. Hard Ticks (Acari: Ixodidae) Collected from Selected Counties of Arkansas, and the Detection of Borrelia burgdorferi DNA in Potential Tick Vectors by Using the Polymerase Chain Reaction (PCR) Assay. Ph.D. dissertation, University of Arkansas, Fayetteville.
Hall, T. A. 1999. BioEdit: a User-friendly Biological Sequence Alignment and Analysis Program for Windows 95/98/NT. Nucleic Acids Symp. Ser. 41: 95-98.
Hilburn, L. R., and P. W. Sattler. 1986. Are tick populations really less variable and should they be? Heredity 57: 113-117.
Hudson, R. R., M. Slatkin, and W. P. Maddison. 1992. Estimation of levels of gene flow from DNA sequence data. Genetics 132: 583-589
Kain, D. E., F. A H. Sperling, and R. S. Lane. 1997. Population genetic structure of Ixodes pacificus (Acari: Ixodidae) using allozymes. J. Med. Entomol. 34: 441-450.
Katoh, K., K. Kuma, H. Toh, and T Miyata. 2005. MAFFT version 5: improvement in accuracy of multiple sequence alignment. Nucleic Acids Res. 32: 511-518.
Kimura, M. 1980. A simple method for estimating evolutionary rate of base substitutions through comparative study of nucleotide sequences. J. Mol. Evol. 16: 111-120.
Lancaster, J. L. 1973. A Guide to Ticks of Arkansas. Agricultural Experiment Station Bull. 779. Division of Agriculture, University of Arkansas, Fayetteville.
de Laye, C., L. Beati, A. Aeschlimann, F. Renud, and T. de Meeus. 1997. Population genetic structure of Ixodes ricinus in Switzerland from allozymic data: no evidence of divergence between nearby sites. International J. Parasitol. 27: 769-773.
McLain, D. K., J. Li, and J. H. Oliver, Jr. 2001. Interspecific and geographical variation in the sequence of rDNA expansion segment D3 of Ixodes ticks (Acari: Ixodidae). Heredity 86: 234-242.
McLain, D. K., D. M. Wesson, F. H. Collins, and J. H. Oliver, Jr. 1995. Evolution of the rDNA spacer, ITS 2, in the ticks Ixodes scapularis and Ixodes pacificus (Acari: Ixodidae). Heredity 75: 303-319.
de Meeus, T., L. Beati, C. de Laye, A. Aeschlimann, and F. Renaud. 2002. Sex-biased genetic structure in the vector of Lyme disease Ixodes ricinus. Evolution 56: 1802-1807.
Moore, V. A. IV, A. S. Varela, M. J. Yabsley, W. R. Davidson, and S. E. Little. 2003. Detection of Borrelia lonestari, putative agent of southern tick-associated rash illness, in white-tailed deer (Odocoileus virginianus) from the southeastern United States. J. Clinic. Microbiol. 41: 424-427.
Norris, D. E., J. S. H. Klompen, J. E. Keirans, and W. C. Black IV. 1996. Population genetics of Ixodes scapularis (Acari: Ixodidae) based on mitochondrial 16S and 12S genes. J. Med. Entomol. 33: 78-89.
Oliver, Jr., J. H., F. W. Chandler, Jr., M. P. Luttrell, A. M. James, D. E. Stallknecht, B. S. McGuire, H., J. Hutcheson, G. A. Cummins, and R. S. Lane. 1993. Isolation and transmission of the Lyme disease spirochete from the southeastern United States. Proc. Nat. Acad. Sci. 90: 7371-7375.
Purdue, J. R., M. H. Smith, and J. C. Patton. 2000. Female philopatry and extreme spatial genetic heterogeneity in white-tailed deer. J. Mammal. 81: 179-185.
286
Qiu, W. G., D. E. Dykhuizen, M. S. Acosta, and B. J. Luft. 2002. Geographic uniformity of the lyme disease spirochete (Borrelia burgdorferi) and its shared history with tick vector (Ixodes scapularis) in the northeastern United States. Genetics 160: 833-849.
Rich, S. M., D. A. Caporale, S. R. Telford III, T. D. Kocher, D. L. Hartl, and A. Spielman. 1995. Distribution of the Ixodes ricinus-like ticks of eastern North America. Proc. Nat. Acad. Sci. 92: 6284-6288.
Rich, S. M., B. M. Rosenthal, S. R. Telford III, A. Spielman, D. L. Hartl, and F. J. Ayala. 1997. Heterogeneity of the internal transcribed spacer (ITS-2) region within individual deer ticks. Insect Mol. Biol. 6: 123-129
Rogers, M. J., L. K. Halls, and J. G. Dickson. 1990. Deer habitat in the Ozark forests of Arkansas. USDA, Forest Service, Res. Paper SO-259.
Sonenshine, D. E. 2005. The biology of tick vectors of human disease, pp. 12-36 . In J. L. Goodman, D. T. Dennis, and D. E. Sonenshine [eds.] Tick-borne Disease of Humans. ASM Press, Washington, DC.
Stromdahl, E. Y., P. C. Williamson, T. M. Kollars, Jr., S. R. Evans, R. K. Barry, M. A. Vince, and N. A. Dobbs. 2003. Evidence of Borrelia lonestari DNA in Amblyomma americanum (Acari: Ixodidae) removed from humans. J. Clin. Microbiol. 41: 5557-5562.
Swofford, D. J. 2001. PAUP* Phylogentic analysis using parsimony (*and other methods), Version 4.0b10. Sinauer Associates, Sunderland, MA.
Szalanski, A. L., D. D. Sui, T. S. Harris, and T. O. Powers. 1997. Identification of cyst nematodes of agronomic and regulatory concern with PCR-RFLP of ITS1. J. Nematol. 29: 255-267.
Szalanski, A. L., J. W. Austin, J. A. McKern, C. D. Steelman, and R. E. Gold. 2008. Mitochondrial and ribosomal internal transcribed spacer 1 diversity of Cimex lectularius (Hemiptera: Cimicidae). J. Med. Entomol. 45: 229-236.
Tajima, F. and M. Nei. 1984. Estimation of evolutionary distance between nucleotide sequences. Mol. Biol. and Evol. 1: 269-285.
Templeton, A. R., K. A. Crandall, and C. F. Sing. 1992. A cladistic analysis of phenotypic associations with haplotypes inferred from restriction endonuclease mapping and DNA sequence data. III. Cladogram estimation. Genetics 132: 619-633.
Tripodi, A. D., J. W. Austin, A. L. Szalanski, J. McKern, M. K. Carroll, R. K. Saran, and M. T. Messenger. 2006. Phylogeography of Reticulitermes termites (Isoptera: Rhinotermitidae) in California inferred from mitochondrial DNA sequences. Ann. Entomol. Soc. Am. 99: 697-706.
Wesson, D. M., D. K. McLain, J. H. Oliver, J. Piesman, and F. H. Collins. 1993. Investigation of the validity of species status of Ixodes dammini (Acari: Ixodidae) using rDNA. Proc. Nat. Acad. Sci. 90: 10221-10225.
Wright, S. 1951. The genetical structure of populations. Ann. Eugenics 15: 323-354.
Xu, G., Q. Q. Fang, J. E. Keirans, and L. A. Durden. 2003. Molecular phylogenetic analyses indicate that the Ixodes ricinus complex is a paraphyletic group. J. Parasitol. 89: 452-457.
287
Related Documents