Universidade de São Paulo 2014-08-06 Population genetic structure of the Atlantic Forest endemic Conopophaga lineata (Passeriformes: Conopophagidae) reveals a contact zone in the Atlantic Forest Journal of Ornithology, Heidelberg, Aug. 2014 http://www.producao.usp.br/handle/BDPI/46073 Downloaded from: Biblioteca Digital da Produção Intelectual - BDPI, Universidade de São Paulo Biblioteca Digital da Produção Intelectual - BDPI Departamento de Genética e Biologia Evolutiva - IB/BIO Artigos e Materiais de Revistas Científicas - IB/BIO

Welcome message from author
This document is posted to help you gain knowledge. Please leave a comment to let me know what you think about it! Share it to your friends and learn new things together.
Transcript
Universidade de São Paulo
2014-08-06
Population genetic structure of the Atlantic
Forest endemic Conopophaga lineata
(Passeriformes: Conopophagidae) reveals a
contact zone in the Atlantic Forest Journal of Ornithology, Heidelberg, Aug. 2014http://www.producao.usp.br/handle/BDPI/46073
Downloaded from: Biblioteca Digital da Produção Intelectual - BDPI, Universidade de São Paulo
Biblioteca Digital da Produção Intelectual - BDPI
Departamento de Genética e Biologia Evolutiva - IB/BIO Artigos e Materiais de Revistas Científicas - IB/BIO
ORIGINAL ARTICLE
Population genetic structure of the Atlantic Forest endemicConopophaga lineata (Passeriformes: Conopophagidae) revealsa contact zone in the Atlantic Forest
Gisele Pires Mendonca Dantas • Eloisa Helena Reis Sari • Gustavo Sebastian Cabanne •
Rodrigo Oliveira Pessoa • Miguel Angelo Marini • Cristina Yumi Miyaki •
Fabrıcio Rodrigues Santos
Received: 17 October 2013 / Revised: 14 May 2014 / Accepted: 8 July 2014
� Dt. Ornithologen-Gesellschaft e.V. 2014
Abstract The Rufous Gnateater, Conopophaga lineata,
is a small insectivorous understory bird which is endemic
to and widely distributed in the tropical and subtropical
Atlantic forest of South America. Its distribution makes it
ideally suited for testing two major hypotheses for the
origin of biodiversity, namely, the riverine barrier and the
forest refuge hypotheses. In this study, we sequenced
mitochondrial (control region) and nuclear markers (intron
5 of the b-fibrinogen gene) for individuals distributed in the
southern Atlantic forest and obtained a strong genetic
structure with one clear discontinuity in northern Brazilian
state of Sao Paulo. We consistently detected signals of
demographic expansion for both markers, with estimates
indicating that expansion started in the Late Pleistocene
(250,000 years ago), suggesting that the forest refuge
hypothesis potentially explains Rufous Gnateater’s diver-
sification. We also found evidence of gene flow between
populations from each side of this discontinuity, with a
possible secondary contact zone occurring in the states of
Minas Gerais, Sao Paulo, and Rio de Janeiro.
Keywords Atlantic forest � Phylogeography �Passeriformes � Forest refugia � Pleistocene � Secondary
contact
Zusammenfassung
Die populationsgenetische Struktur des in der Mata
Atlantica endemischen Rotkehl-Muckenfressers (Co-
nopophaga lineata, Passeriformes: conopophagidae)
lasst eine Kontaktzone in der Mata Atlantica erkennen
Der Rotkehl-Muckenfresser, Conopophaga lineata, ist ein
kleiner insektivorer Vogel, der im Unterholz der tropischen
und subtropischen Mata Atlantica in Sudamerika endem-
isch und weit verbreitet ist. Die Verbreitung des Rotkehl-
Muckenfressers macht ihn besonders dafur geeignet, zwei
Haupthypothesen zum Ursprung von Biodiversitat zu te-
sten, die ,,Flusse als Barrieren‘‘-Hypothese (‘‘riverine bar-
rier hypothesis’’) und die ,,Walder als Ruckzugsgebiete‘‘-
Hypothese (‘‘forest refuges hypothesis’’). Wir haben mi-
tochondriale Marker (Kontrollregion) und Zellkernmarker
(Intron 5 von b-Fibrinogen) fur in der sudlichen Mata
Atlantica verbreitete Individuen sequenziert und eine
Communicated by J. Fjeldsa.
G. P. M. Dantas (&) � E. H. R. Sari � F. R. Santos
Laboratorio de Biodiversidade E Evolucao Molecular (LBEM),
Departamento de Biologia Geral, Instituto de Ciencias
Biologicas, Universidade Federal de Minas Gerais, Avenida
Antonio Carlos, 6627,Bloco L3, Sala 244,
Caixa Postal 486, Belo Horizonte, MG 31270-010, Brazil
e-mail: [email protected]
G. P. M. Dantas
Pontificia Universidade Catolica de Minas Gerais, PPG in
Vertebrate Zoology, Belo Horizonte, Minas Gerais, Brazil
G. S. Cabanne � R. O. Pessoa � C. Y. Miyaki
Departamento de Genetica e Biologia Evolutiva, Instituto de
Biociencias, Universidade de Sao Paulo, rua do Matao, 277,
Cidade Universitaria, Sao Paulo, SP, Brazil
G. S. Cabanne
CONICET–Museo Argentino de Ciencias Naturales ‘‘Bernadino
Rivadavia’’, Buenos Aires, Argentina
R. O. Pessoa
Universidade Estadual de Montes Claros (UNIMONTES),
Montes Claros, MG, Brazil
M. A. Marini
Departamento de Zoologia, Universidade de Brasılia, Brasilia,
DF, Brazil
123
J Ornithol
DOI 10.1007/s10336-014-1106-0
ausgepragte genetische Struktur mit einer klaren Disk-
ontinuitat im Norden des Bundesstaates Sao Paulo gefun-
den. Fur beide Marker haben wir durchweg Signale
demographischer Ausbreitung entdeckt, die schatzung-
sweise im spaten Pleistozan (vor 250000 Jahren) begann,
was darauf hindeutet, dass die ,,Walder als
Ruckzugsgebiete‘‘-Hypothese einen moglichen Einfluss-
faktor bei der Diversifikation des Rotkehl-Muckenfressers
darstellt. Wir haben auch Hinweise auf Genfluss zwischen
Populationen auf beiden Seiten der Diskontinuitat gefun-
den, mit einer moglichen sekundaren Kontaktzone in den
Bundesstaaten Minas Gerais, Sao Paulo und Rio de Janeiro.
Introduction
The Rufous Gnateater (Conopophaga lineata; Weir and
Schluter 2008) (Conopophagidae: Passeriformes) is a small
insectivorous understory bird, endemic to the Atlantic
forest (Sick 1997; Whitney 2003). This species is distrib-
uted in tropical and subtropical forests of South America
(Sigrislt 2005), from Paraguay and northeast Argentina to
northeast Brazil (Sick 1997; Whitney 2003). This biome is
considered to be one of the most important areas for con-
servation in the world, due to its high biodiversity, high
levels of endemism, and degradation (Ribeiro et al. 2009).
Although approximately 11 % of the primary forest still
remains—in a highly fragmented state (Ribeiro et al.
2009)—new species are still being discovered in the area
(Weber et al. 2005; Miranda et al. 2006). Its biota is the
result of a complex evolutionary history, but the processes
shaping it are poorly understood (Mustrangi and Patton
1997; Costa et al. 2000; Geise et al. 2001; Pellegrino et al.
2005). The evolutionary processes involved in the forma-
tion of the Atlantic forest can be indirectly studied based on
phylogeographic analyses of endemic species. In addition,
knowledge of the range limits of lineages and species is
fundamental for the effective conservation of biodiversity
(Moritz 2002).
There are several hypotheses for the origin of extreme
biodiversity in tropical forests. The riverine barrier
hypothesis (Wallace 1852) predicts that some rivers limit
regional faunas and therefore may represent gene flow
barriers, reshaping much of the biota’s distribution. In the
Atlantic forest, the Doce river (Costa et al. 2000; Silva
et al. 2004; Brown 2005), Jequitinhonha river (Lacerda
et al. 2007), Sao Francisco river, and Paraıba do Sul river
(Silva and Straube 1996; Pellegrino et al. 2005) may be
barriers to dispersal for many animals. Additionally, the
tectonic activity associated with the formation of such
geographical landmarks could also have influenced the
distribution of biodiversity, mainly in the southern Atlantic
forest where a complex relief exists, with many mountain
ranges and valleys, as also in the region of Serra do Mar
(Petri and Fulfaro 1983; Riccomini et al. 1989; Cabanne
et al. 2008).
Isolation in forest refugia during the cycles of climate
change that occurred during the Pleistocene may also have
contributed to diversification, mainly in the Amazon basin
(Haffer 1969; Vanzolini and Williams 1970; Brown and
Ab’Saber 1979; Haffer and Prance 2001). The Pleistocene
refuge hypothesis proposes that during glacial maxima,
rainforests were reduced to patches (refugia) isolated by
open areas and that organisms isolated in these refugia
diverged into new species by drift and/or divergent selec-
tion. In the following interglacial period, the forest expan-
ded, resulting in secondary contact among the now
reproductively isolated new clades. Brown and Ab’Saber
(1979) proposed that open areas dominated the current
Atlantic forest’s landscape during the maximum of the Late
Pleistocene glaciations, suggesting that the refuge hypoth-
esis could be very useful for gaining a better understanding
of the biological diversification of the biome.
A paleoclimate model for the distribution of the Atlantic
forest predicted that there were two large and stable forest
refugia at the last glacial maxima during the Pleistocene—
one in the state of Pernambuco, north of the Atlantic forest,
and another one in the state of Bahia (Carnaval and Moritz
2008). According to this model, throughout the Pleisto-
cene, the forest was more stable in the north region than in
the southern region, i.e., south of the Doce river, where
several smaller forest refugia occur. This model is partially
compatible with phylogeographic or population genetic
data on Passeriformes (Cabanne et al. 2007, 2008; d’Horta
et al. 2011; Maldonado-Coelho 2012), bats (Pavan et al.
2011), lizards (Pellegrino et al. 2005), and frogs (Carnaval
et al. 2009; Amaro et al. 2012).
Few studies have investigated the evolutionary history
of the Rufous Gnateater, despite its large distribution, and
remarkable geographical variation in song and plumage
(Willis et al. 1983; Whitney 2003; Dantas et al. 2007;
Dantas et al. 2009). Three subspecies are recognized: Co-
nopophaga lineata (C. l.) cearae is found in northeastern
Brazil, from Ceara to Pernambuco; C. l. lineata occurs
from Pernambuco to southern Bahia, Central Brazil, and in
southern Goias and northern Mato Grosso do Sul; C. l.
vulgaris is found in southeastern Brazil, from southern
Espırito Santo to Rio Grande do Sul, and in eastern Para-
guay, Misiones, and eastern Uruguay (Whitney 2003). A
phylogeny of the genus Conopophaga based on mito-
chondrial data indicates that C. l. cearae does not form a
monophyletic clade with the other two subspecies (C. l.
lineata and C. l. vulgaris; Pessoa 2007). C. lineata is a
species which is endemic to the Atlantic forest, and as such
it represents a good model for evolutionary studies in this
biome. The Atlantic forest is distributed along eastern
J Ornithol
123
Brazil, eastern Paraguay, and north-eastern Argentina
(Gusmao Camara 2003).
In this context, the aim of our study is to evaluate the
phylogeography of the Rufous Gnateater in the Atlantic
forest, based on mitochondrial (the ‘‘Control’’ region) and
nuclear [intron 5 of the b-fibrinogen [FIB5)] DNA
sequences, in order to evaluate if the previous gene flow
barriers described for other vertebrates in the Atlantic forest
could also have influenced this species. First, if rivers were
important barriers to gene flow for the Rufous Gnaeater, we
would expect to find breaks concordant with river positions,
i.e., a presence of low or no gene flow between the two sides
of the river. Alternatively, if forest refuges did act as gene
flow barriers for the Rufous Gnaeater, we would expect to
find more than one break; this would not necessarily be
concordant with river positions, but would be associated to
a clear signal of population expansion due to the expansion
of the forest after the glacial period.
Methodology
Study area and samples
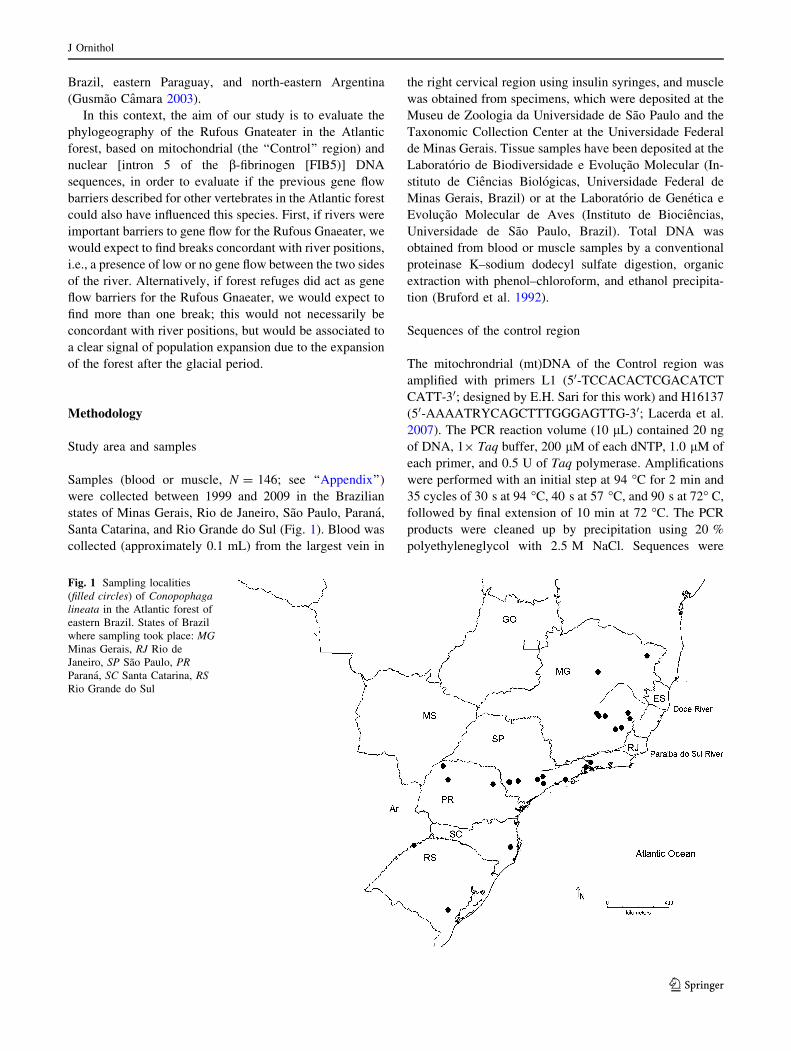
Samples (blood or muscle, N = 146; see ‘‘Appendix’’)
were collected between 1999 and 2009 in the Brazilian
states of Minas Gerais, Rio de Janeiro, Sao Paulo, Parana,
Santa Catarina, and Rio Grande do Sul (Fig. 1). Blood was
collected (approximately 0.1 mL) from the largest vein in
the right cervical region using insulin syringes, and muscle
was obtained from specimens, which were deposited at the
Museu de Zoologia da Universidade de Sao Paulo and the
Taxonomic Collection Center at the Universidade Federal
de Minas Gerais. Tissue samples have been deposited at the
Laboratorio de Biodiversidade e Evolucao Molecular (In-
stituto de Ciencias Biologicas, Universidade Federal de
Minas Gerais, Brazil) or at the Laboratorio de Genetica e
Evolucao Molecular de Aves (Instituto de Biociencias,
Universidade de Sao Paulo, Brazil). Total DNA was
obtained from blood or muscle samples by a conventional
proteinase K–sodium dodecyl sulfate digestion, organic
extraction with phenol–chloroform, and ethanol precipita-
tion (Bruford et al. 1992).
Sequences of the control region
The mitochrondrial (mt)DNA of the Control region was
amplified with primers L1 (50-TCCACACTCGACATCT
CATT-30; designed by E.H. Sari for this work) and H16137
(50-AAAATRYCAGCTTTGGGAGTTG-30; Lacerda et al.
2007). The PCR reaction volume (10 lL) contained 20 ng
of DNA, 19 Taq buffer, 200 lM of each dNTP, 1.0 lM of
each primer, and 0.5 U of Taq polymerase. Amplifications
were performed with an initial step at 94 �C for 2 min and
35 cycles of 30 s at 94 �C, 40 s at 57 �C, and 90 s at 72� C,
followed by final extension of 10 min at 72 �C. The PCR
products were cleaned up by precipitation using 20 %
polyethyleneglycol with 2.5 M NaCl. Sequences were
Fig. 1 Sampling localities
(filled circles) of Conopophaga
lineata in the Atlantic forest of
eastern Brazil. States of Brazil
where sampling took place: MG
Minas Gerais, RJ Rio de
Janeiro, SP Sao Paulo, PR
Parana, SC Santa Catarina, RS
Rio Grande do Sul
J Ornithol
123

obtained in a MegaBACE 1000 sequencer (Amersham-
Biosciences, GE Healthcare, Little Chalfont, UK) or in
ABI Prima 377 and ABI 3700 DNA sequencers (Applied
Biosystems, Foster City, CA). The sequencing was con-
ducted using intern primers LEC2 and H4 (Lacerda et al.
2007).
Nuclear sequences
The nuclear intron 5 from the b-fibrinogen gene was
amplified with the primers FIB5 and FIB6 (Marini and
Hackett 2002). The PCR reaction volume (10 lL) con-
tained 20–40 ng of total DNA, 19 Taq buffer, 200 lM of
each dNTP, 0.5 lM of each primer, and 0.5 U of Taq
polymerase. Amplifications were performed with an initial
step at 95 �C for 4 min and 37 cycles of 45 s at 94 �C, 45 s
at 53.5 �C, and 1 min at 72 �C, followed by a final
extension of 10 min at 72 �C.
PCR products were cleaned by precipitation using 20 %
polyethyleneglicol with 2.5 M NaCl. The sequences were
obtained in a MegaBACE 1000 sequencer (Amersham-
Biosciences) using the same primers. The alignments were
made by eye using Bioedit version 5.06 (Hall 2001). The
heterozygous nucleotide positions were identified by their
high-quality double peaks in the electropherograms. All
resolved positions received a posterior probability of 1 in
the phasing analyses. To identify both haplotypes of het-
erozygous individuals with multiple variable sites, we used
a Bayesian approach in the program PHASE 2.0 (Stephens
et al. 2001; Stephens and Donnelly 2003), implemented in
DNAsp 5.1 software (Librado and Rozas 2009).
Analytical methods
Descriptive analyses, including estimates of haplotype
diversity (h) and nucleotide diversity (p), were performed
in DNAsp v.5.10.01 (Librado and Rozas 2009). We applied
the Network software version 4.6 (www.fluxus-technology.
com) to obtain separate networks for intron 5 from the b-
fibrinogen gene (410 bp) and Control region (472 bp)
using the median joining method (Bandelt et al. 1999;
Polzin and Daneschmand 2003). We also calculated Taj-
ima’s (1989), Fu and Li’s (1993), and Ramos-Onsins and
Rozas’ neutral deviation parameters (D, D*, F*, F) of the
R2 statistic with DNAsp v.5.10.01 (Librado and Rozas
2009). We selected these test statistics due to their power to
detect population expansion scenarios in specific sampling
conditions and with a specified population expansion rate,
time since the expansion, sample size, and number of
segregation sites (Ramos-Onsins and Rozas 2002). We
used the Akaike information criterion (AIC) as imple-
mented in jModel test software (Posada and Cradall 1998)
to select the evolutionary model that best fit the Control
region. The evolutionary model selected was TPM3 ? I,
with a proportion of invariable site (I) of 0.74, and FIB5
(Jukes and Cantor model), with a proportion of invariable
sites (I) of 0.352 and a discrete gamma distribution
(a = 0.3860).
In addition, to analyze population size dynamics through
time, we reconstructed the phylogenies using the Extended
Bayesian Skyline Plot method (EBSP; Heled and Drum-
mond 2008) implemented in BEAST 1.6.1 (Drummond and
Rambaut 2007). We performed four independent runs of
30,000,000 steps, logged every 1,000 steps, and a burn-in
of 3,000,000 runs. For the BEAST analysis we considered
the mutation rate to be 2.1 % per mya (Weir and Schluter
2008) compared to the Control region and 0.53 % com-
pared to FIB5 (Axelsson et al. 2004). To evaluate the
convergence of parameters between runs and the perfor-
mance of analysis (ESS values [200), we used TRACER
version 1.5 (http://beast.bio.ed.ac.uk/Tracer) (Drummond
and Rambaut 2007). To check the level of population
genetic structure among localities, we performed an ana-
lysis of molecular variance (AMOVA) with two hierar-
chical levels using ARLEQUIN 3.5 (Excoffier and Lischer
2010). Additionally, we performed a Bayesian analysis of
population structure using sequences of FIB5 in BAPS
version 5.4. (The Bayesian Analysis of Population Struc-
ture; Corander and Tang 2007.) BAPS estimates hidden
population substructure by clustering sampled populations
into panmictic groups. This analysis takes into account
each individual and the probability at which it fits into each
cluster, uninformed by the population origin of the indi-
vidual. We tested the mixture analysis with two through to
20 populations, with the population allele frequencies and
structure parameters automatically set to be uninformative.
This approach produced a joint posterior distribution of
partitions of the sampled populations into panmictic
groups, along with their respective allele frequencies. We
ran BAPS ten times for 105 interactions after a burn-in
period of 20,000 steps. The resulting partitions were
averaged based on their plotted posterior probabilities.
We performed divergence time estimates between pairs
of C. lineata lineages with Isolation–Migration (IM)
software (Nielsen and Wakeley 2001; Hey and Nielsen
2004). We then estimated the effective population sizes
for current (h1, h2) and ancestral (ha) populations, the
divergence time between lineages, and migration between
populations (m1, m2) using the IM model. To define the
priors, we carried out initial runs followed by five pos-
terior runs for each analysis, applied a burn-in of
2,000,000 steps, and finished with at least 20,000,000
steps in the chain after the burn-in stage and a minimum
effective sample size value of 50. To obtain the diver-
gence times in years, we considered t = t/u (Hey and
Nielsen 2004). To calculate the dates, we assumed a
J Ornithol
123
divergence of 0.53 % per million years for FIB5 (Ax-
elsson et al. 2004; Cabanne et al. 2008).
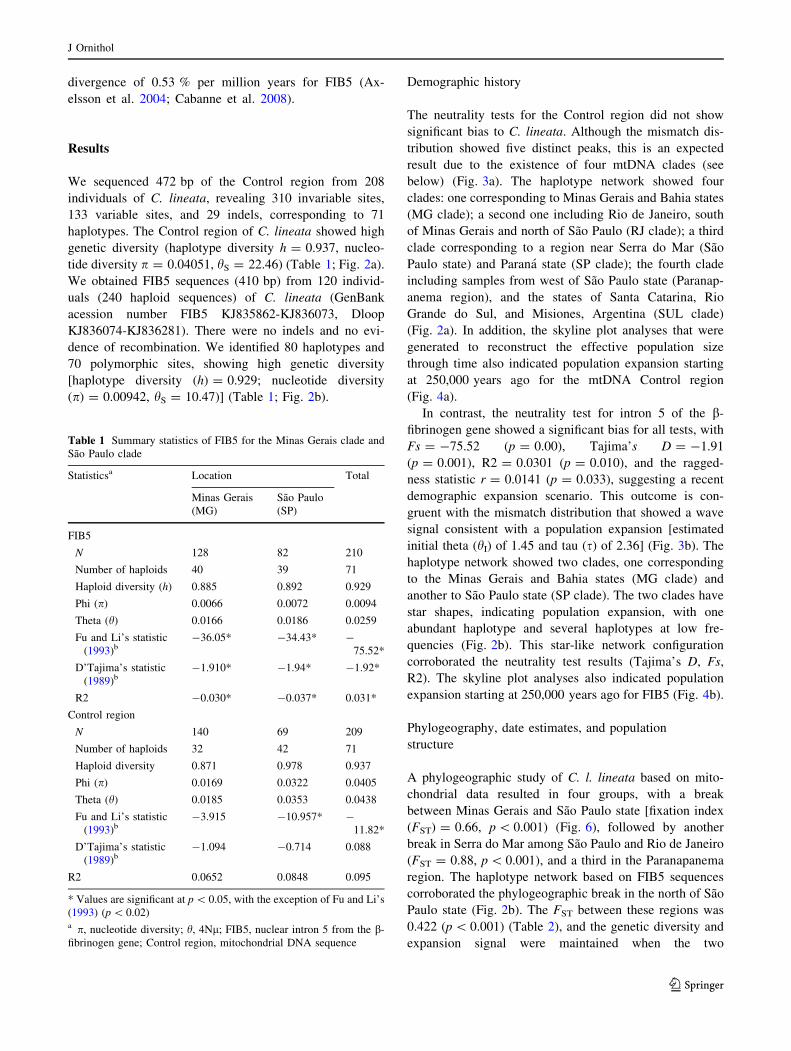
Results
We sequenced 472 bp of the Control region from 208
individuals of C. lineata, revealing 310 invariable sites,
133 variable sites, and 29 indels, corresponding to 71
haplotypes. The Control region of C. lineata showed high
genetic diversity (haplotype diversity h = 0.937, nucleo-
tide diversity p = 0.04051, hS = 22.46) (Table 1; Fig. 2a).
We obtained FIB5 sequences (410 bp) from 120 individ-
uals (240 haploid sequences) of C. lineata (GenBank
acession number FIB5 KJ835862-KJ836073, Dloop
KJ836074-KJ836281). There were no indels and no evi-
dence of recombination. We identified 80 haplotypes and
70 polymorphic sites, showing high genetic diversity
[haplotype diversity (h) = 0.929; nucleotide diversity
(p) = 0.00942, hS = 10.47)] (Table 1; Fig. 2b).
Demographic history
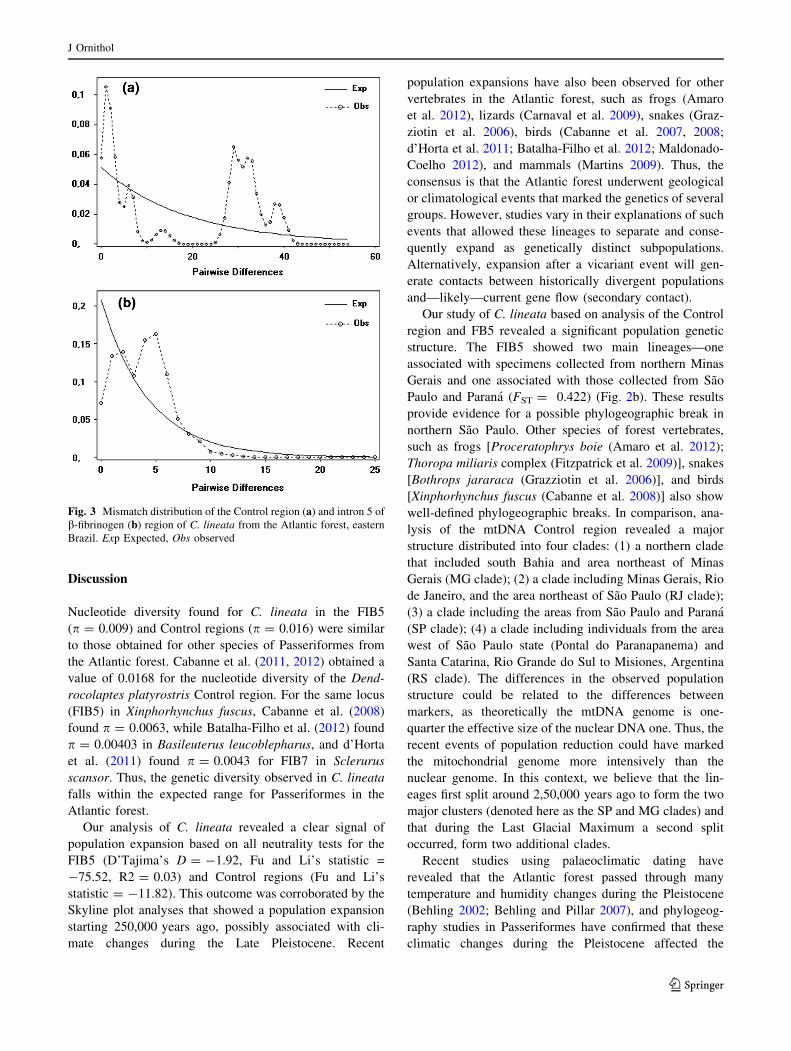
The neutrality tests for the Control region did not show
significant bias to C. lineata. Although the mismatch dis-
tribution showed five distinct peaks, this is an expected
result due to the existence of four mtDNA clades (see
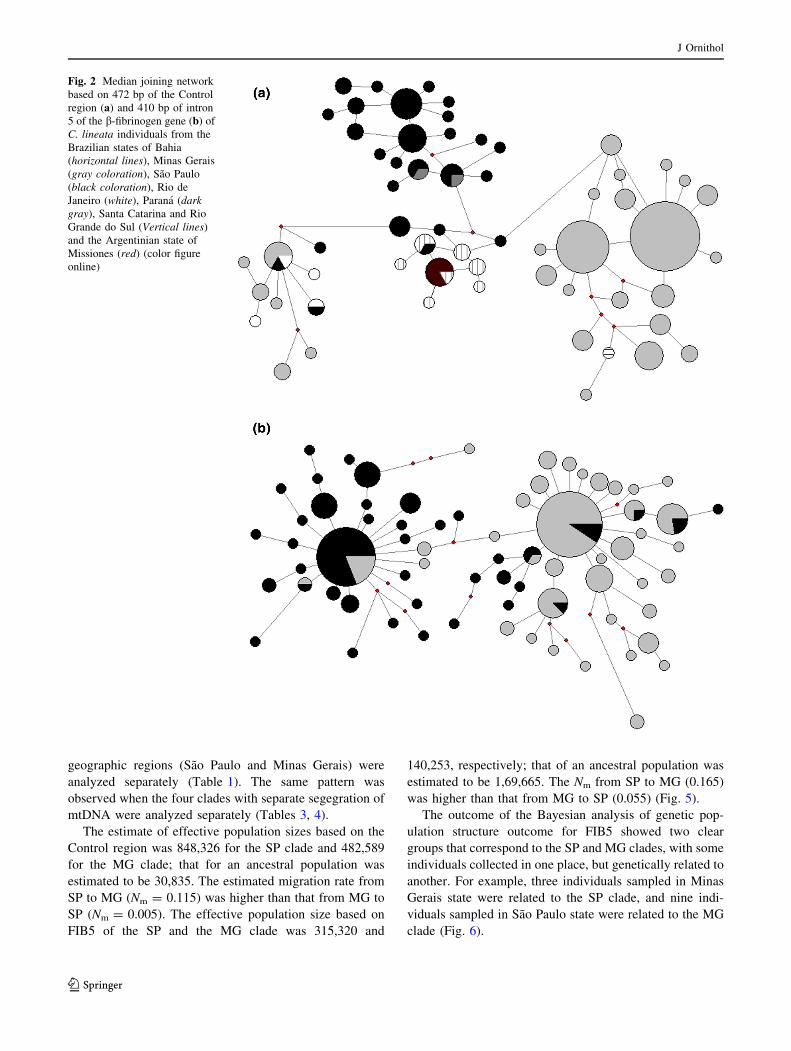
below) (Fig. 3a). The haplotype network showed four
clades: one corresponding to Minas Gerais and Bahia states
(MG clade); a second one including Rio de Janeiro, south
of Minas Gerais and north of Sao Paulo (RJ clade); a third
clade corresponding to a region near Serra do Mar (Sao
Paulo state) and Parana state (SP clade); the fourth clade
including samples from west of Sao Paulo state (Paranap-
anema region), and the states of Santa Catarina, Rio
Grande do Sul, and Misiones, Argentina (SUL clade)
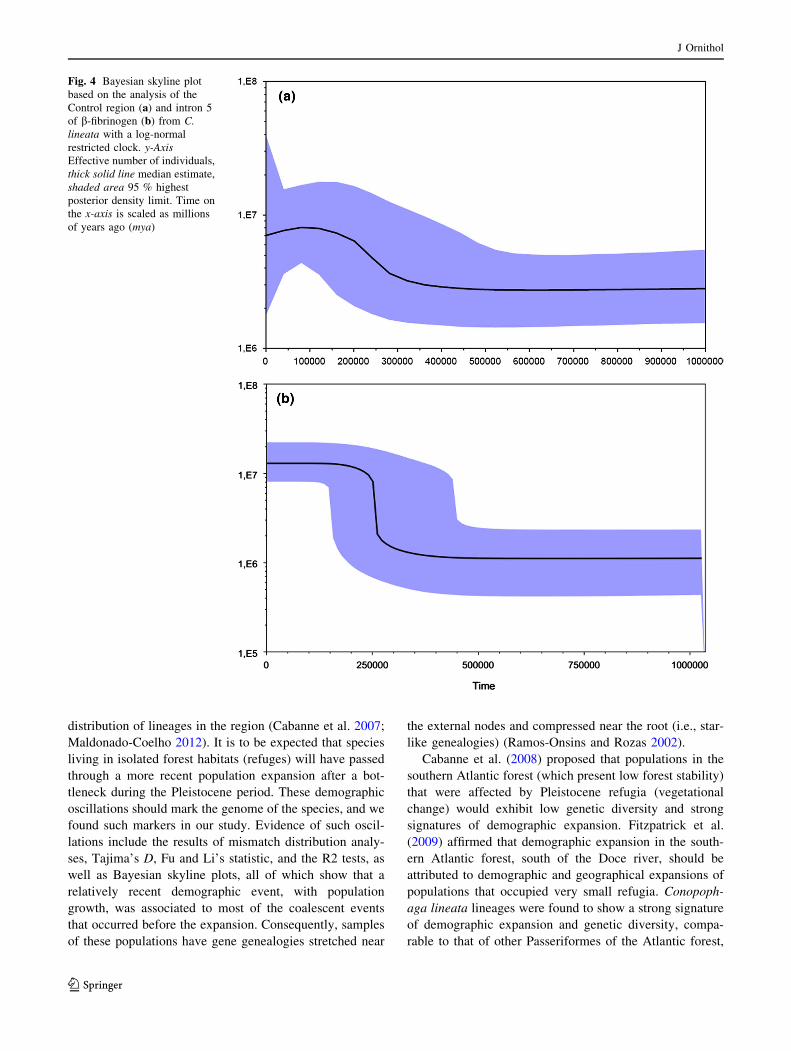
(Fig. 2a). In addition, the skyline plot analyses that were
generated to reconstruct the effective population size
through time also indicated population expansion starting
at 250,000 years ago for the mtDNA Control region
(Fig. 4a).
In contrast, the neutrality test for intron 5 of the b-
fibrinogen gene showed a significant bias for all tests, with
Fs = -75.52 (p = 0.00), Tajima’s D = -1.91
(p = 0.001), R2 = 0.0301 (p = 0.010), and the ragged-
ness statistic r = 0.0141 (p = 0.033), suggesting a recent
demographic expansion scenario. This outcome is con-
gruent with the mismatch distribution that showed a wave
signal consistent with a population expansion [estimated
initial theta (hI) of 1.45 and tau (s) of 2.36] (Fig. 3b). The
haplotype network showed two clades, one corresponding
to the Minas Gerais and Bahia states (MG clade) and
another to Sao Paulo state (SP clade). The two clades have
star shapes, indicating population expansion, with one
abundant haplotype and several haplotypes at low fre-
quencies (Fig. 2b). This star-like network configuration
corroborated the neutrality test results (Tajima’s D, Fs,
R2). The skyline plot analyses also indicated population
expansion starting at 250,000 years ago for FIB5 (Fig. 4b).
Phylogeography, date estimates, and population
structure
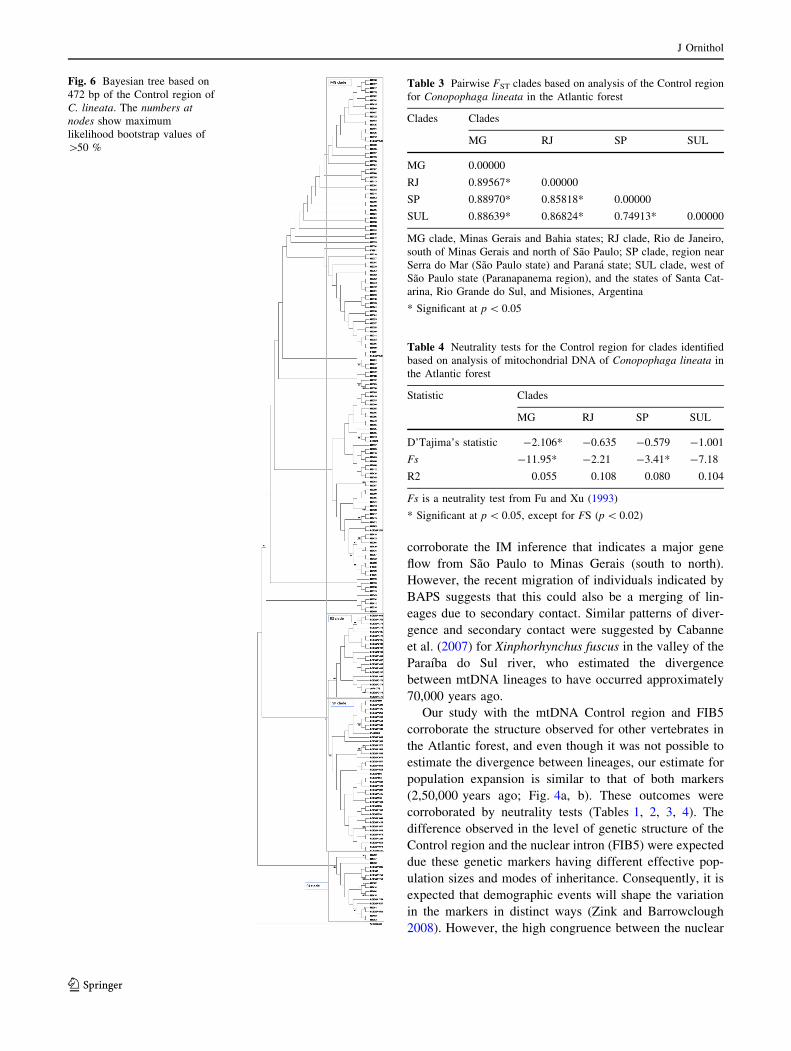
A phylogeographic study of C. l. lineata based on mito-
chondrial data resulted in four groups, with a break
between Minas Gerais and Sao Paulo state [fixation index
(FST) = 0.66, p \ 0.001) (Fig. 6), followed by another
break in Serra do Mar among Sao Paulo and Rio de Janeiro
(FST = 0.88, p \ 0.001), and a third in the Paranapanema
region. The haplotype network based on FIB5 sequences
corroborated the phylogeographic break in the north of Sao
Paulo state (Fig. 2b). The FST between these regions was
0.422 (p \ 0.001) (Table 2), and the genetic diversity and
expansion signal were maintained when the two
Table 1 Summary statistics of FIB5 for the Minas Gerais clade and
Sao Paulo clade
Statisticsa Location Total
Minas Gerais
(MG)
Sao Paulo
(SP)
FIB5
N 128 82 210
Number of haploids 40 39 71
Haploid diversity (h) 0.885 0.892 0.929
Phi (p) 0.0066 0.0072 0.0094
Theta (h) 0.0166 0.0186 0.0259
Fu and Li’s statistic
(1993)b-36.05* -34.43* -
75.52*
D’Tajima’s statistic
(1989)b-1.910* -1.94* -1.92*
R2 -0.030* -0.037* 0.031*
Control region
N 140 69 209
Number of haploids 32 42 71
Haploid diversity 0.871 0.978 0.937
Phi (p) 0.0169 0.0322 0.0405
Theta (h) 0.0185 0.0353 0.0438
Fu and Li’s statistic
(1993)b-3.915 -10.957* -
11.82*
D’Tajima’s statistic
(1989)b-1.094 -0.714 0.088
R2 0.0652 0.0848 0.095
* Values are significant at p \ 0.05, with the exception of Fu and Li’s
(1993) (p \ 0.02)a p, nucleotide diversity; h, 4Nl; FIB5, nuclear intron 5 from the b-
fibrinogen gene; Control region, mitochondrial DNA sequence
J Ornithol
123
geographic regions (Sao Paulo and Minas Gerais) were
analyzed separately (Table 1). The same pattern was
observed when the four clades with separate segegration of
mtDNA were analyzed separately (Tables 3, 4).
The estimate of effective population sizes based on the
Control region was 848,326 for the SP clade and 482,589
for the MG clade; that for an ancestral population was
estimated to be 30,835. The estimated migration rate from
SP to MG (Nm = 0.115) was higher than that from MG to
SP (Nm = 0.005). The effective population size based on
FIB5 of the SP and the MG clade was 315,320 and
140,253, respectively; that of an ancestral population was
estimated to be 1,69,665. The Nm from SP to MG (0.165)
was higher than that from MG to SP (0.055) (Fig. 5).
The outcome of the Bayesian analysis of genetic pop-
ulation structure outcome for FIB5 showed two clear
groups that correspond to the SP and MG clades, with some
individuals collected in one place, but genetically related to
another. For example, three individuals sampled in Minas
Gerais state were related to the SP clade, and nine indi-
viduals sampled in Sao Paulo state were related to the MG
clade (Fig. 6).
Fig. 2 Median joining network
based on 472 bp of the Control
region (a) and 410 bp of intron
5 of the b-fibrinogen gene (b) of
C. lineata individuals from the
Brazilian states of Bahia
(horizontal lines), Minas Gerais
(gray coloration), Sao Paulo
(black coloration), Rio de
Janeiro (white), Parana (dark
gray), Santa Catarina and Rio
Grande do Sul (Vertical lines)
and the Argentinian state of
Missiones (red) (color figure
online)
J Ornithol
123
Discussion
Nucleotide diversity found for C. lineata in the FIB5
(p = 0.009) and Control regions (p = 0.016) were similar
to those obtained for other species of Passeriformes from
the Atlantic forest. Cabanne et al. (2011, 2012) obtained a
value of 0.0168 for the nucleotide diversity of the Dend-
rocolaptes platyrostris Control region. For the same locus
(FIB5) in Xinphorhynchus fuscus, Cabanne et al. (2008)
found p = 0.0063, while Batalha-Filho et al. (2012) found
p = 0.00403 in Basileuterus leucoblepharus, and d’Horta
et al. (2011) found p = 0.0043 for FIB7 in Sclerurus
scansor. Thus, the genetic diversity observed in C. lineata
falls within the expected range for Passeriformes in the
Atlantic forest.
Our analysis of C. lineata revealed a clear signal of
population expansion based on all neutrality tests for the
FIB5 (D’Tajima’s D = -1.92, Fu and Li’s statistic =
-75.52, R2 = 0.03) and Control regions (Fu and Li’s
statistic = -11.82). This outcome was corroborated by the
Skyline plot analyses that showed a population expansion
starting 250,000 years ago, possibly associated with cli-
mate changes during the Late Pleistocene. Recent
population expansions have also been observed for other
vertebrates in the Atlantic forest, such as frogs (Amaro
et al. 2012), lizards (Carnaval et al. 2009), snakes (Graz-
ziotin et al. 2006), birds (Cabanne et al. 2007, 2008;
d’Horta et al. 2011; Batalha-Filho et al. 2012; Maldonado-
Coelho 2012), and mammals (Martins 2009). Thus, the
consensus is that the Atlantic forest underwent geological
or climatological events that marked the genetics of several
groups. However, studies vary in their explanations of such
events that allowed these lineages to separate and conse-
quently expand as genetically distinct subpopulations.
Alternatively, expansion after a vicariant event will gen-
erate contacts between historically divergent populations
and—likely—current gene flow (secondary contact).
Our study of C. lineata based on analysis of the Control
region and FB5 revealed a significant population genetic
structure. The FIB5 showed two main lineages—one
associated with specimens collected from northern Minas
Gerais and one associated with those collected from Sao
Paulo and Parana (FST = 0.422) (Fig. 2b). These results
provide evidence for a possible phylogeographic break in
northern Sao Paulo. Other species of forest vertebrates,
such as frogs [Proceratophrys boie (Amaro et al. 2012);
Thoropa miliaris complex (Fitzpatrick et al. 2009)], snakes
[Bothrops jararaca (Grazziotin et al. 2006)], and birds
[Xinphorhynchus fuscus (Cabanne et al. 2008)] also show
well-defined phylogeographic breaks. In comparison, ana-
lysis of the mtDNA Control region revealed a major
structure distributed into four clades: (1) a northern clade
that included south Bahia and area northeast of Minas
Gerais (MG clade); (2) a clade including Minas Gerais, Rio
de Janeiro, and the area northeast of Sao Paulo (RJ clade);
(3) a clade including the areas from Sao Paulo and Parana
(SP clade); (4) a clade including individuals from the area
west of Sao Paulo state (Pontal do Paranapanema) and
Santa Catarina, Rio Grande do Sul to Misiones, Argentina
(RS clade). The differences in the observed population
structure could be related to the differences between
markers, as theoretically the mtDNA genome is one-
quarter the effective size of the nuclear DNA one. Thus, the
recent events of population reduction could have marked
the mitochondrial genome more intensively than the
nuclear genome. In this context, we believe that the lin-
eages first split around 2,50,000 years ago to form the two
major clusters (denoted here as the SP and MG clades) and
that during the Last Glacial Maximum a second split
occurred, form two additional clades.
Recent studies using palaeoclimatic dating have
revealed that the Atlantic forest passed through many
temperature and humidity changes during the Pleistocene
(Behling 2002; Behling and Pillar 2007), and phylogeog-
raphy studies in Passeriformes have confirmed that these
climatic changes during the Pleistocene affected the
Fig. 3 Mismatch distribution of the Control region (a) and intron 5 of
b-fibrinogen (b) region of C. lineata from the Atlantic forest, eastern
Brazil. Exp Expected, Obs observed
J Ornithol
123
distribution of lineages in the region (Cabanne et al. 2007;
Maldonado-Coelho 2012). It is to be expected that species
living in isolated forest habitats (refuges) will have passed
through a more recent population expansion after a bot-
tleneck during the Pleistocene period. These demographic
oscillations should mark the genome of the species, and we
found such markers in our study. Evidence of such oscil-
lations include the results of mismatch distribution analy-
ses, Tajima’s D, Fu and Li’s statistic, and the R2 tests, as
well as Bayesian skyline plots, all of which show that a
relatively recent demographic event, with population
growth, was associated to most of the coalescent events
that occurred before the expansion. Consequently, samples
of these populations have gene genealogies stretched near
the external nodes and compressed near the root (i.e., star-
like genealogies) (Ramos-Onsins and Rozas 2002).
Cabanne et al. (2008) proposed that populations in the
southern Atlantic forest (which present low forest stability)
that were affected by Pleistocene refugia (vegetational
change) would exhibit low genetic diversity and strong
signatures of demographic expansion. Fitzpatrick et al.
(2009) affirmed that demographic expansion in the south-
ern Atlantic forest, south of the Doce river, should be
attributed to demographic and geographical expansions of
populations that occupied very small refugia. Conopoph-
aga lineata lineages were found to show a strong signature
of demographic expansion and genetic diversity, compa-
rable to that of other Passeriformes of the Atlantic forest,
Fig. 4 Bayesian skyline plot
based on the analysis of the
Control region (a) and intron 5
of b-fibrinogen (b) from C.
lineata with a log-normal
restricted clock. y-Axis
Effective number of individuals,
thick solid line median estimate,
shaded area 95 % highest
posterior density limit. Time on
the x-axis is scaled as millions
of years ago (mya)
J Ornithol
123
such as X. fuscus (Cabanne et al. 2007, 2008), B. leucob-
lepharus (Batalha-Filho et al. 2012), and S. scansor
(d’Horta et al. 2011).
Alternatively, other studies have corroborated the
hypothesis of rivers as barriers (e.g., Pellegrino et al. 2005;
Lacerda et al. 2007). Pellegrino et al. (2005) found two
lineages in geckos (Gymnodactylus darwinii complex) that
diverged between southern Minas Gerais and Sao Paulo,
suggesting that this divergence resulted from the formation
of the Paraıba do Sul valley. However, if the Paraıba do Sul
river were to be responsible for the splitting of the C.
lineata lineages, we would expect that these lineages would
be older than the Pleistocene period and have accumulated
mutations for the last 15 million years (the date of the
formation of the Paraiba valley), thereby showing a
remarkable differentiation and low gene flow.
In contradiction to this latter possibility, our results
demonstrate recent demographic expansion for both lin-
eages (the MG and SP clades), associated with date esti-
mates of expansion occurring in the Pleistocene period
(2,50,000 years ago), and seem to indicate that forest
refugia during glaciations affected the evolutionary history
of C. lineata in the southern Atlantic forest. We believe
that the lineages from Minas Gerais were most likely
derived from the Bahia refugia and that the lineages from
Sao Paulo were derived from Sao Paulo refugia. In addi-
tion, our results for FIB5 using BAPS confirmed the
structure in two major clades, but indicated gene flow
between them, mainly observed in 12 individuals from the
regions of Buri, Teodoro Sampaio, and Euclides da Cunha
in Sao Paulo state and the regions of Nova Lima, Santa
Barbara and Caratinga in Minas Gerais state. These results
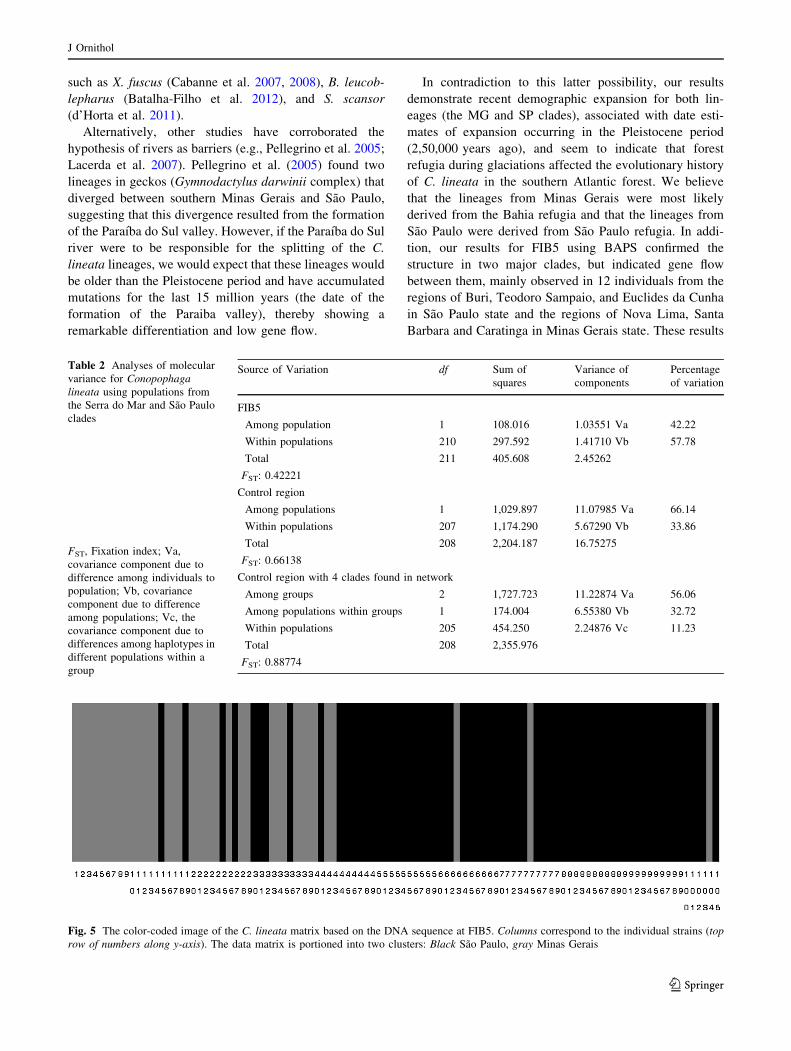
Table 2 Analyses of molecular
variance for Conopophaga
lineata using populations from
the Serra do Mar and Sao Paulo
clades
FST, Fixation index; Va,
covariance component due to
difference among individuals to
population; Vb, covariance
component due to difference
among populations; Vc, the
covariance component due to
differences among haplotypes in
different populations within a
group
Source of Variation df Sum of
squares
Variance of
components
Percentage
of variation
FIB5
Among population 1 108.016 1.03551 Va 42.22
Within populations 210 297.592 1.41710 Vb 57.78
Total 211 405.608 2.45262
FST: 0.42221
Control region
Among populations 1 1,029.897 11.07985 Va 66.14
Within populations 207 1,174.290 5.67290 Vb 33.86
Total 208 2,204.187 16.75275
FST: 0.66138
Control region with 4 clades found in network
Among groups 2 1,727.723 11.22874 Va 56.06
Among populations within groups 1 174.004 6.55380 Vb 32.72
Within populations 205 454.250 2.24876 Vc 11.23
Total 208 2,355.976
FST: 0.88774
Fig. 5 The color-coded image of the C. lineata matrix based on the DNA sequence at FIB5. Columns correspond to the individual strains (top
row of numbers along y-axis). The data matrix is portioned into two clusters: Black Sao Paulo, gray Minas Gerais
J Ornithol
123
corroborate the IM inference that indicates a major gene
flow from Sao Paulo to Minas Gerais (south to north).
However, the recent migration of individuals indicated by
BAPS suggests that this could also be a merging of lin-
eages due to secondary contact. Similar patterns of diver-
gence and secondary contact were suggested by Cabanne
et al. (2007) for Xinphorhynchus fuscus in the valley of the
Paraıba do Sul river, who estimated the divergence
between mtDNA lineages to have occurred approximately
70,000 years ago.
Our study with the mtDNA Control region and FIB5
corroborate the structure observed for other vertebrates in
the Atlantic forest, and even though it was not possible to
estimate the divergence between lineages, our estimate for
population expansion is similar to that of both markers
(2,50,000 years ago; Fig. 4a, b). These outcomes were
corroborated by neutrality tests (Tables 1, 2, 3, 4). The
difference observed in the level of genetic structure of the
Control region and the nuclear intron (FIB5) were expected
due these genetic markers having different effective pop-
ulation sizes and modes of inheritance. Consequently, it is
expected that demographic events will shape the variation
in the markers in distinct ways (Zink and Barrowclough
2008). However, the high congruence between the nuclear
Fig. 6 Bayesian tree based on
472 bp of the Control region of
C. lineata. The numbers at
nodes show maximum
likelihood bootstrap values of
[50 %
Table 3 Pairwise FST clades based on analysis of the Control region
for Conopophaga lineata in the Atlantic forest
Clades Clades
MG RJ SP SUL
MG 0.00000
RJ 0.89567* 0.00000
SP 0.88970* 0.85818* 0.00000
SUL 0.88639* 0.86824* 0.74913* 0.00000
MG clade, Minas Gerais and Bahia states; RJ clade, Rio de Janeiro,
south of Minas Gerais and north of Sao Paulo; SP clade, region near
Serra do Mar (Sao Paulo state) and Parana state; SUL clade, west of
Sao Paulo state (Paranapanema region), and the states of Santa Cat-
arina, Rio Grande do Sul, and Misiones, Argentina
* Significant at p \ 0.05
Table 4 Neutrality tests for the Control region for clades identified
based on analysis of mitochondrial DNA of Conopophaga lineata in
the Atlantic forest
Statistic Clades
MG RJ SP SUL
D’Tajima’s statistic -2.106* -0.635 -0.579 -1.001
Fs -11.95* -2.21 -3.41* -7.18
R2 0.055 0.108 0.080 0.104
Fs is a neutrality test from Fu and Xu (1993)
* Significant at p \ 0.05, except for FS (p \ 0.02)
J Ornithol
123
and mitochondrial marker revealed in our study leads us to
suggest that the evolutionary history of C. lineata consists
of major population splits during the Pleistocene followed
by population expansions.
Cabanne et al. (2008) proposed that minor geographic
features that are traditionally considered to be inefficient
barriers could be important for explaining a number of
observed biogeographic patterns in the Atlantic forest,
where climatic changes appear as a central factor
modulating the effect of barriers to gene flow. In this
context, the Paraıba do Sul valley and the mountain
ranges of Serra da Mantiqueira and Serra do Mar could
be highly susceptible to climatic alterations, such as
changes in water flow and vegetation. This partial bar-
rier effect may be considered together with more
widespread changes in the forest distribution during
glaciations to explain the divergence and transitions of
lineages in the southern Atlantic forest. Consequently,
the pattern of C. lineata genetic structure we docu-
mented using the mtDNA Control region could be
generated by vicariance events occurring in the Pleis-
tocene followed by secondary contact in the Holocene.
Batalha-Filho et al. (2012) studied Basileuterus leu-
coblepharus in the southern Atlantic forest in Brazil and
did not find any significant structure, suggesting that
this species with different habitat requirements could
show a more homogeneous phylogeographic distribu-
tion. Thus, while some endemic taxa from the Atlantic
forest may be highly influenced by selective ecological
filters working as barriers, other species with higher a
tolerance to habitat fragmentation would be able to
maintain gene flow or disperse across these barriers.
Contrary to expectations, C. lineata is a species rela-
tively tolerant of habitat fragmentation (Dantas et al.
2007) that showed a clear signal of population structure.
On the other hand, Salisbury et al. (2012) suggested that
canopy birds tend to be less genetically differentiated
than understory birds, which is a likely explanation for
the genetic structure we observed in C. lineata.
Evolution in isolation and secondary contact provides
a possible explanation for the current phylogeographic
structure of C. lineata. Costa (2003) suggested that
speciation in the Neotropics could not be explained by
any single model of vicariance or climatic change. Thus,
it is possible that no general pattern for the diversifi-
cation of organisms in the Atlantic forest will be
determined—rather, a complex range of scenarios shall
be described. The refuge hypothesis, the influence of
geography, and rivers as barriers are among the most
discussed models in the study of Neotropical diversifi-
cation. Our data do not support a primary influence of
rivers on the divergence between the two main mito-
chondrial lineages of C. lineata in the south-central
Atlantic forest. Our data do support the influence of
isolation by distance in separated forest relicts as a main
vicariant event, followed by subsequent demographic
expansions, in shaping the current distribution and
phylogeographic structure of C. lineata. Thus, vicari-
ance and demographic expansions leading to secondary
contact appear to be related to recent natural forest
landscape dynamics affecting the population of birds,
and perhaps other organisms endemic to this region.
Acknowledgments This work was supported by FAPEMIG (Fun-
dacao de Amparo a Pesquisa do Estado de Minas Gerais 17228),
CNPq, FAPESP (BIOTA 2013/50297-0), NSF (DOB 1343578),
NASA, CAPES (Coordenacao de Aperfeicoamento de Pessoal de
Nıvel Superior), and the Research Center on Biodiversity and Com-
puting (BioComp) of the Universidade de Sao Paulo (USP), supported
by the USP Provost’s Office for Research. Gisele Dantas worked
under a Post-doctoral grant CAPES/PNPD (2010/52590-8) and CNPq
(503145/2009-2). We also thank the Instituto Brasileiro do Meio
Ambiente e dos Recursos Naturais Renovaveis (Brazil), Instituto
Florestal de Sao Paulo (Brazil), and Instituto Estadual de Florestas de
Minas Gerais (Brazil) for the permits to collect samples (IBAMA/
MMA no 03/2004 IBAMA/MMA: 011/2000, processes 1835/2000;
053/2001, 1835/00-07; 070/2002, 02015.001835/00-07; 207/2003,
02015.023482/98-38). We gratefully acknowledge the improvements
in English usage made by Caitlin Stern through the Association of
Field Ornithologists’ program of editorial assistance.
Appendix
See Table 5.
J Ornithol
123
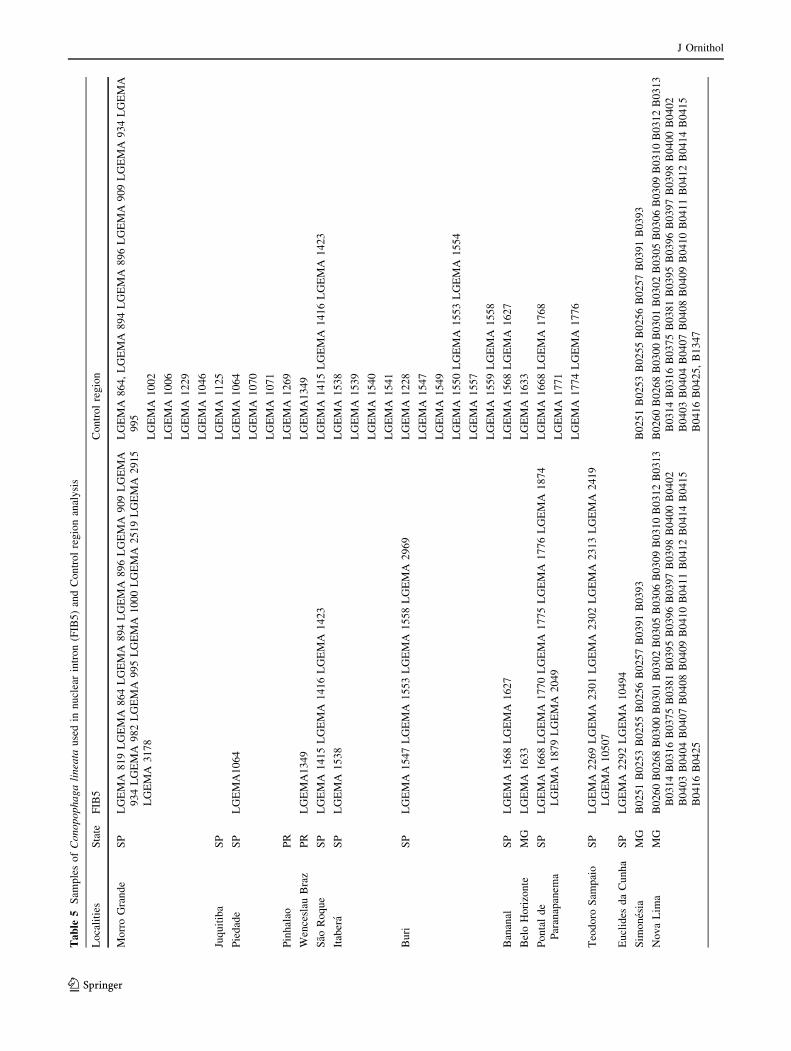
Ta
ble
5S
amp
les
of
Co
no
po
ph
ag
ali
nea
tau
sed
inn
ucl
ear
intr
on
(FIB
5)
and
Co
ntr
ol
reg
ion
anal
ysi
s
Lo
cali
ties
Sta
teF
IB5
Co
ntr
ol
reg
ion
Mo
rro
Gra
nd
eS
PL
GE
MA
81
9L
GE
MA
86
4L
GE
MA
89
4L
GE
MA
89
6L
GE
MA
90
9L
GE
MA
93
4L
GE
MA
98
2L
GE
MA
99
5L
GE
MA
10
00
LG
EM
A2
51
9L
GE
MA
29
15
LG
EM
A3
17
8
LG
EM
A8
64
,L
GE
MA
89
4L
GE
MA
89
6L
GE
MA
90
9L
GE
MA
93
4L
GE
MA
99
5
LG
EM
A1
00
2
LG
EM
A1
00
6
LG
EM
A1
22
9
LG
EM
A1
04
6
Juq
uit
iba
SP
LG
EM
A1
12
5
Pie
dad
eS
PL
GE
MA
10
64
LG
EM
A1
06
4
LG
EM
A1
07
0
LG
EM
A1
07
1
Pin
hal
aoP
RL
GE
MA
12
69
Wen
cesl
auB
raz
PR
LG
EM
A1
34
9L
GE
MA
13
49
Sao
Ro
qu
eS
PL
GE
MA
14
15
LG
EM
A1
41
6L
GE
MA
14
23
LG
EM
A1
41
5L
GE
MA
14
16
LG
EM
A1
42
3
Itab
era
SP
LG
EM
A1
53
8L
GE
MA
15
38
LG
EM
A1
53
9
LG
EM
A1
54
0
LG
EM
A1
54
1
Bu
riS
PL
GE
MA
15
47
LG
EM
A1
55
3L
GE
MA
15
58
LG
EM
A2
96
9L
GE
MA
12
28
LG
EM
A1
54
7
LG
EM
A1
54
9
LG
EM
A1
55
0L
GE
MA
15
53
LG
EM
A1
55
4
LG
EM
A1
55
7
LG
EM
A1
55
9L
GE
MA
15
58
Ban
anal
SP
LG
EM
A1
56
8L
GE
MA
16
27
LG
EM
A1
56
8L
GE
MA
16
27
Bel
oH
ori
zon
teM
GL
GE
MA
16
33
LG
EM
A1
63
3
Po
nta
ld
e
Par
anap
anem
a
SP
LG
EM
A1
66
8L
GE
MA
17
70
LG
EM
A1
77
5L
GE
MA
17
76
LG
EM
A1
87
4
LG
EM
A1
87
9L
GE
MA
20
49
LG
EM
A1
66
8L
GE
MA
17
68
LG
EM
A1
77
1
LG
EM
A1
77
4L
GE
MA
17
76
Teo
do
roS
amp
aio
SP
LG
EM
A2
26
9L
GE
MA
23
01
LG
EM
A2
30
2L
GE
MA
23
13
LG
EM
A2
41
9
LG
EM
A1
05
07
Eu
clid
esd
aC
un
ha
SP
LG
EM
A2
29
2L
GE
MA
10
49
4
Sim
on
esia
MG
B0
25
1B
02
53
B0
25
5B
02
56
B0
25
7B
03
91
B0
39
3B
02
51
B0
25
3B
02
55
B0
25
6B
02
57
B0
39
1B
03
93
No
va
Lim
aM
GB
02
60
B0
26
8B
03
00
B0
30
1B
03
02
B0
30
5B
03
06
B0
30
9B
03
10
B0
31
2B
03
13
B0
31
4B
03
16
B0
37
5B
03
81
B0
39
5B
03
96
B0
39
7B
03
98
B0
40
0B
04
02
B0
40
3B
04
04
B0
40
7B
04
08
B0
40
9B
04
10
B0
41
1B
04
12
B0
41
4B
04
15
B0
41
6B
04
25
B0
26
0B
02
68
B0
30
0B
03
01
B0
30
2B
03
05
B0
30
6B
03
09
B0
31
0B
03
12
B0
31
3
B0
31
4B
03
16
B0
37
5B
03
81
B0
39
5B
03
96
B0
39
7B
03
98
B0
40
0B
04
02
B0
40
3B
04
04
B0
40
7B
04
08
B0
40
9B
04
10
B0
41
1B
04
12
B0
41
4B
04
15
B0
41
6B
04
25
,B
13
47
J Ornithol
123
References
Amaro RC, Carnaval AC, Yonenaga-Yassuda Y, Trefaut MR (2012)
Demographic processes in the montane Atlantic rainforest:
molecular and cytogenetic evidence from the endemic frog
Proceratophrys boiei. Mol Phylogenet Evol 63:880–888
Axelsson E, Smith NGC, Sundstrom H, Berlin S, Ellegren H (2004)
Male-biased mutation rate and divergence in autosomal,
Z-linked and W-linked introns of chicken and turkey. Mol Biol
Evol 21:1538–1547
Bandelt HJ, Forster P, Rohl A (1999) Median-joining networks for
inferring intraspecific phylogenies. Mol Biol Evol 16:37–48
Batalha-Filho H, Cabanne GS, Miyaki CY (2012) Phylogeography of an
Atlantic Forest passerine reveals demographic stability through the
last glacial maximum. Mol Phylogenet Evol 65:892–902
Behling H (2002) South and southeast Brazilian grasslands during late
quaternary times: a synthesis. Palaeogeogr Paleoclimatol Palae-
oecol 177:19–27
Behling H, Pillar VDP (2007) Late quaternary vegetation, biodiver-
sity and fire dynamics on the southern Brazilian highland and
their implication for conservation and management of modern
Araucaria forest and grassland ecosystems. Phil Trans R Soc B
362:243–251
Brown KS (2005) Geological, evolutionary, and ecological bases of
the diversification of neotropical butterflies: implications for
conservation. In: Berminhgam E, Dick CW, Moritz C (eds)
Tropical Rainforest: past present and future. University of
Chicago Press, Chicago, pp 166–200
Brown KS, Ab’Saber AN (1979) Ice-age forest refuges and evolution
in Neotropics: correlation of paleoclimatological, geomorpho-
logical and pedological data with biological endemism. Paleo-
climas 5:1–30
Bruford MW, Hanotte O, Brookfield JFY, Burke T (1992) Single-
locus and multilocus DNA fingerprinting. In: Hoelzel AR (ed)
Molecular genetic analysis of populations—a practical approach.
IRL Press, New York, pp 287–336
Cabanne GS, Santos FR, Miyaki CY (2007) Phylogeography of
Xiphorhynchus fuscus (Passeriformes, Dendrocolaptidae): vicar-
iance and recent demographic expansion in southern Atlantic
Forest. Biol J Linn Soc 91:73–84
Cabanne GS, d’Horta FM, Sari EH, Santos FR, Miyaki CY (2008)
Nuclear and mitochondrial phylogeography of the Atlantic
Forest endemic Xiphorhynchus fuscus (Aves: dendrocolaptidae):
biogeography and systematics implications. Mol Phylogenet
Evol 49:760–773
Cabanne GS, DHorta FM, Meyer D, Silva JMC, Myiaki CY (2011)
Evolution of dendrocolaptes platyrostris (Aves:Furnariidae)
between the south American open vegetation corridor and the
Atlantic Forest. Biol J Linn Soc 103:801–820
Cabanne GS, Sari HER, Meyer D, Santos FR, Miyaki CY (2012)
Matrilineal evidence for demographic expansion, low diversity
and lack of phylogeographic structure in the Atlantic forest
endemic Grenish Schiffornis Schiffornis virescens (Aves: tityri-
dae). J Ornithol 154:371–384
Carnaval AC, Moritz C (2008) Historical climate modeling predicts
patterns of current biodiversity in the Brazilian Atlantic Forest.
J Biogeogr 35:1187–1201
Carnaval AC, Hickerson MJ, Haddad CFB, Rodrigues MT, Moritz C
(2009) Stability predicts genetic diversity in the Brazilian
Atlantic forest hotspot. Science 323:785–789
Corander J, Tang J (2007) Bayesian analysis of population structure
based on linked molecular information. Math Biosci 205:19–31
Costa LP, Leite YLR, da Fonseca GAB, da Fonseca MT (2000)
Biogeography of south American forest mammals: endemism
and diversity in the Atlantic forest. Biotropica 32:872–881Ta
ble
5co
nti
nu
ed
Lo
cali
ties
Sta
teF
IB5
Co
ntr
ol
reg
ion
Ara
po
ng
aM
GB
02
62
B0
29
9B
02
62
B0
29
9
B0
30
2
Car
atin
ga
MG
B0
26
4B
02
65
B0
38
2B
03
83
B0
38
6B
03
87
B0
38
8B
03
89
B0
26
4B
02
65
B0
38
2B
03
83
B0
38
6B
03
87
B0
38
8B
03
89
Jeq
uit
inh
on
ha
MG
B0
26
7B
04
19
B0
42
0B
04
21
B0
42
2B
04
23
B0
42
4B
02
67
B0
41
9B
04
20
B0
42
1B
04
22
B0
42
3B
04
24
Vic
osa
MG
B0
37
7B
03
77
Bo
caiu
va
MG
B0
84
1B
08
41
San
taB
arb
ara
MG
B0
95
8B
09
58
Itat
itai
aR
JL
GE
MA
17
50
LG
EM
A1
75
1L
GE
MA
17
59
Ran
cho
Qu
eim
ado
SC
LG
EM
A2
18
5L
GE
MA
21
95
LG
EM
A2
18
9L
GE
MA
21
92
LG
EM
A2
19
3
LG
EM
A2
19
7
Pel
ota
sR
SL
GE
MA
21
70
LG
EM
A2
17
1
LG
EM
A2
17
4
Mis
sio
nes
Ar
LG
EM
A1
40
4L
GE
MA
14
07
LG
EM
A1
40
3L
GE
MA
14
01
LG
EM
A1
40
8
J Ornithol
123
Costa LP (2003) The historical bridge between the Amazon and the
Atlantic Forest of Brazil: a study of molecular phylogeography
with small mammals. J Biogeogr 30:71–86
d’Horta F, Cabanne GS, Meyer D, Miyaki CY (2011) The genetic
effects of late quaternary climatic changes over a tropical
latitudinal gradient: diversification of an Atlantic Forest passer-
ine. Mol Ecol 20:1932–1935
Dantas GPM, Santos FR, Marini MA (2007) Genetic variability of
Conopophaga lineata (Conopophagidae) in Atlantic Forest
fragments. Braz J Biol 67:631–637
Dantas GPM, Santos FR, Marini MA (2009) Efeitos de fragmentacao
na razao sexual de Conopophaga lineata em fragmentos de Mata
Atlantica no Estado de Minas Gerais. Iheringia Serie Zool
99:115–119
Drummond AJ, Rambaut A (2007) BEAST: bayesian evolutionary
analysis by sampling trees. BMC Evol Biol 7:214
Excoffier L, Lischer HLE (2010) Arlequim ver 3.5: a new series of
programs to perform population genetics analyses under Linux
and Windows. Mol Ecol Res 10:564–567
Fitzpatrick SW, Brasileiro CA, Haddad CF, Zamudio KR (2009)
Geographical variation in genetic structure of an Atlantic coastal
forest frog reveals regional differences in habitat stability. Mol
Ecol 18:2877–2896
Fu Y-X, Li WH (1993) Statistical tests of neutrality of mutations.
Genetics 133:693–709
Geise L, Smith MF, Patton JL (2001) Diversification in the genus
Akodon (Rodentia: sigmodontinae) in southeastern South Amer-
ica: mitochondrial DNA sequence analysis. J Mamm 82:92–101
Grazziotin FG, Monzel M, Echeverrigarauy S, Bonato SL (2006)
Phylogeography of the Bothrops jararaca complex (Serpentes:
viperidae): past fragmentation and island colonization in the
Brazilian Atlantic Forest. Mol Ecol 15:3969–3982
Gusmao Camara I (2003) Brief history of conservation in the Atlantic
forest. In: Galindo-Leal C, Gusmao Camara I(eds). The state of
the hotspots: The Atlantic Forest. Island Press, Washington DC,
pp 31–42
Haffer J (1969) Speciation in Amazonian forest birds. Science
165:131–137
Haffer J, Prance GT (2001) Climatic forcing of evolution in
Amazonia during the Cenozoic: on the refuge theory of biotic
differentiation. Amazoniana 16:579–605
Hall TA (2001) BioEdit: a user-friendly biological sequence align-
ment editor and analysis program for Windows 95/98/NT.
Nucleic Acids Symp Ser 41:95–98
Heled J, Drummond AD (2008) Bayesian inference of population size
history from multiple loci. BMC Evol Biol 8:289
Hey J, Nielsen R (2004) Multilocus methods for estimating popula-
tion sizes, migration rates and divergence time, with applications
to the divergence of Drosophila pseudoobscura and D. persim-
ilis. Genetics 167:747–760
Lacerda DR, Marini MA, Santos FR (2007) Mitochondrial DNA
corroborates the species distinctiveness of the Planalto (Tham-
nophilus pelzelni Hellmayr, 1924), the Sooretama (T. ambiguus
Swainson, 1825) Slaty-antshrikes (Passeriformes: thamnophili-
dae). Braz J Biol 67:873–882
Librado P, Rozas J (2009) DnaSP v. 5: a software for comprehensive
analysis of DNA polymorphism data. Bioinformatics
25:1451–1452
Maldonado-Coelho M (2012) Climatic oscillations shape the phylo-
geographical structure of Atlantic forest fire-eye antbirds (Aves:
thamnophilidae). Biol J Linn Soc 105:900–924
Marini MA, Hackett SJ (2002) A multifaceted approach to the
characterization of an intergeneric hybrid manakin (Pipridae)
from Brazil. Auk 119:1114–1120
Martins FM (2009) The Brazilian Atlantic Forest historical biogeog-
raphy and the Carnaval-Moritz model of Pleistocene refugia:
what do the phylogeographical studies tell us? Biol J Linn Soc
104:499–509
Miranda JM, Bernardi IP, Passos FC (2006) A new species of
Eptesicus (Mammalia: chiroptera) from Atlantic Forest Brazil.
Zootaxa 1383:57–68
Moritz C (2002) Strategies to protect biological diversity and the
evolutionary process that sustain it. Syst Biol 51:238–254
Mustrangi MA, Patton JL (1997) Phylogeography and systematics of
the slender mouse opossum Marmosops (Marsupialia: didelphi-
dae). Univ Calif Publ Zool 130:1–86
Nielsen R, Wakeley J (2001) Distinguishing migration from isolation:
a Markov chain Monte Carlo approach. Genetics 158:885–896
Pavan AC, Martins FM, Santos FR, Ditchfield A, Redondo RAF
(2011) Patterns of diversification in two species of short-tailed
bats (Carollia Gray, 1838): the effects of historical fragmenta-
tion of Brazilian rainforests. Biol J Linn Soc 102:527–539
Pellegrino KCM, Rodrigues MI, Waite AN, Morando M, Yassuda
YY, Sites JW (2005) Phylogeography and species limits in the
Gymnodactylus darwinii complex (Gekkonidae, Squamata):
genetic structure coincides with river systems in the Brazilian
Atlantic Forest. Biol J Linn Soc 85:13–26
Pessoa RO (2007) Sistematica e Biogeografia Historica da Famılia
Conopophagidae (Aves: Passeriformes): Especiacao nas Flores-
tas da America do Sul. PhD thesis. Instituto de Biociencias da
Universidade de Sao Paulo, Sao Paulo
Petri S, Fulfaro VJ (1983) Geologia do Brasil—Fanerozoico. Editora
da Universidade de Sao Paulo, Sao Paulo
Polzin T, Daneschmand SV (2003) On Steiner trees and minimum
spanning trees in hypergraphs. Oper Res Lett 31:12–20
Posada D, Cradall KA (1998) Modeltest: testing the model of DNA
substitution. Bioinformatics 14:817–818
Ramos-Onsins SE, Rozas J (2002) Statistical properties of new
neutrality tests against population growth. Mol Biol Evol
19:2092–2100
Ribeiro MC, Metzger JP, Martensen AC, Ponzoni FJ, Hirota MM
(2009) The Brazilian Atlantic Forest: how much is left, and how
is the remaining forest distributed? Implications for conserva-
tion. Biol Conserv 142:1141–1153
Riccomini C, Peloggia AUG, Salon JCL, Kohner MW, Figueira RM
(1989) Neotectonic activity in the Serra do Mar rift system
(southeastern Brazil). J South Am Earth Sci 2:191–197
Salisbury CL, Seddon N, Cooney CR, Tobias JA (2012) The
latitudinal grandient in dispersal constraints: ecological special-
ization drivers diversification in tropical birds. Ecol Lett
15:847–855
Sick H (1997) Ornitologia Brasileira. Nova Fronteira, Rio de Janeiro
912p
Sigrislt T (2005) Aves do Brasil: uma visao artıstica. Editora Avis
Brasilis, Sao Paulo
Silva JMC, Straube FC (1996) Systematics and biogeography of
scaled woodcreepers (Aves: dendrocolpatidae). Stud Neotrop
Fauna Environ 31:3–10
Silva JMC, De Sousa MC, Castelleti CHM (2004) Areas of endemism
for passerine birds in Atlantic Forest, South America. Glob Ecol
Biog 13:85–93
Stephens M, Donnelly P (2003) A comparison of Bayesian methods
for haplotype reconstruction from population genotype data. Am
J Hum Genet 73:1162–1169
Stephens M, Smith NJ, Donnelly P (2001) A new statistical method
for haplotype reconstruction from population data. Am J Hum
Genet 68:978–989
Tajima F (1989) Statistical method for testing the neutral mutation
hypothesis by DNA polymorphism. Genetics 123:585–595
Vanzolini PE, Williams EE (1970) South American anoles: the
geographic differentiation and evolution of the Anolis chrysol-
epis species group (Sauria: iguanidae). Arq Zool 19:1–298
J Ornithol
123

Wallace AR (1852) On the monkeys of the Amazon. Proc Zool Soc
London 20:107–110
Weber LN, Gonzaga LP, Carvalho-e-Silva SP (2005) A New species
of Physalaemus from the lowland Atlantic Forest of Rio de
Janeiro State Brazil (Amphibia, Anura, Leptodactylidaea). Arq
Mus Nac 63:677–684
Weir JT, Schluter D (2008) Calibrating the avian molecular clock.
Mol Ecol 17:2321–2328
Whitney BM (2003) Family Conopophagidae. In: del Hoyo J, Elliot
A, Christie DA (eds) Handbook of the birds of the world:
Broadbills to Tapaculos, vol 8. Lynx Edicions, Barcelona,
pp 732–747
Willis EO, Oniki Y, Silva WR (1983) On the behaviour of Rufous
Gnateaters (Conopophaga lineata, Formicariidae). Naturalia
8:67–93
Zink RM, Barrowclough GF (2008) Mitochondrial DNA under siege
in avian phylogeography. Mol Ecol 17:2107–2121
J Ornithol
123
Related Documents


![Distribution of endemic cetaceans in relation to ... · cetacean ranges in the western North Atlantic, the Atlantic Margin hydrocarbon basin off eastern Canada [14] was added to the](https://static.cupdf.com/doc/110x72/5f9d15a52502011f77219e02/distribution-of-endemic-cetaceans-in-relation-to-cetacean-ranges-in-the-western.jpg)


