REGULAR PAPER Population expansion of the invasive Pomacentridae Chromis limbata (Valenciennes, 1833) in southern Brazilian coast: long-term monitoring, fundamental niche availability and new records Antônio B. Anderson 1,2 | Jodir Pereira da Silva 3 | Raquel Sorvilo 3 | Carlo Leopoldo B. Francini 4 | Sergio R. Floeter 2 | Jo ~ ao P. Barreiros 5,6,7 1 Department of Oceanography, ICTIOLAB - Laboratory of Ichthyology, Federal University of Espírito Santo, Vitória, Espírito Santo, Brazil 2 Marine Macroecology and Biogeography Laboratory, Department of Ecology and Zoology, Federal University of Santa Catarina, Florianópolis, Brazil 3 Departamento de Ciências, Colégio Técnico de Campinas (CTC), Universidade Estadual de Campinas (UNICAMP), Jorge de Figueiredo Corrêa, Campinas, S~ ao Paulo, Brazil 4 Instituto Laje Viva, S~ ao Paulo, Brazil 5 Centre for Ecology, Evolution and Environmental Changes (CE3C)/Azorean Biodiversity Group and 7, Universidade dos Açores – Faculdade de Ciências Agrárias e do Ambiente , Angra do Heroísmo, Portugal 6 Faculdade de Ciências Agrárias e do Ambiente, University of Azores, R. da M~ ae de Deus, Ponta Delgada, Azores, Portugal 7 Programa de Pós-Graduaç~ ao - Centro APTA Pescado Marinho, Instituto de Pesca, Avenida Francisco Matarazzo, 455 - Parque da Agua Branca - Barra Funda, Santos, S~ ao Paulo, Brazil Correspondence Antônio B. Anderson, Laboratory of Ichthyology, Department of Oceanography, Federal University of Espírito Santo, Vitória, ES 29075-910, Brazil/ Sergio R. Floeter, Marine Macroecology and Biogeography Laboratory - Federal University of Santa Catarina, Florianópolis, Santa Catarina - Brazil Email: [email protected]; [email protected] Funding information CNPq, Grant/Award Number: CNPq 475367/2006-5; ECOPERE-SE Project; FAPES, Grant/Award Number: PROFIX program Nº 10/2018 - T.O.: 348/2018; FAPESC, Grant/Award Number: Biodiversidade Marinha do Estado de Santa Catarina Project PI: A.L. FAPESC 4302/2010-8; FAPESC/CNPq, Grant/Award Number: SISBIOTA-Mar project PI: S.R.F. CNPq 563276/2010-0; FAPESC 6308/2011-8; Petrobras (BR), Grant/Award Number: MAArE Project; King Abdullah University of Science and Technology; Coordenaç~ ao de Aperfeiçoamento de Pessoal de Nível Superior Abstract Human-mediated species invasions are recognized as a leading cause of global biotic homogenization and extinction. Studies on colonization events since early stages, establishment of new populations and range extension are scarce because of their rarity, difficult detection and monitoring. Chromis limbata is a reef- associated and non-migratory marine fish from the family Pomacentridae found in depths ranging between 3 and 45 m. The original distribution of the species encompassed exclusively the eastern Atlantic, including the Azores, Madeira and the Canary Islands. It is also commonly reported from West Africa between Sene- gal and Pointe Noire, Congo. In 2008, vagrant individuals of C. limbata were recorded off the east coast of Santa Catarina Island, South Brazil (27 41 0 44 00 S, 48 27 0 53 00 W). This study evaluated the increasing densities of C. limbata populations in Santa Catarina State shoreline. Two recent expansions, northwards to S~ ao Paulo State and southwards to Rio Grande do Sul State, are discussed, and a niche model of maximum entropy (MaxEnt) was performed to evaluate suitable C. limbata habitats. Brazilian populations are established and significantly increas- ing in most sites where the species has been detected. The distributional bound- aries predicted by the model are clearly wider than their known range of occurrence, evidencing environmental suitability in both hemispheres from areas where the species still does not occur. Ecological processes such as competition, predation and specially habitat selectivity may regulate their populations and Received: 18 November 2019 Accepted: 29 April 2020 DOI: 10.1111/jfb.14365 FISH 362 © 2020 The Fisheries Society of the British Isles J Fish Biol. 2020;97:362–373. wileyonlinelibrary.com/journal/jfb

Welcome message from author
This document is posted to help you gain knowledge. Please leave a comment to let me know what you think about it! Share it to your friends and learn new things together.
Transcript

R E GU L A R P A P E R
Population expansion of the invasive Pomacentridae Chromislimbata (Valenciennes, 1833) in southern Brazilian coast:long-term monitoring, fundamental niche availability and newrecords
Antônio B. Anderson1,2 | Jodir Pereira da Silva3 | Raquel Sorvilo3 |
Carlo Leopoldo B. Francini4 | Sergio R. Floeter2 | Jo~ao P. Barreiros5,6,7
1Department of Oceanography, ICTIOLAB - Laboratory of Ichthyology, Federal University of Espírito Santo, Vitória, Espírito Santo, Brazil
2Marine Macroecology and Biogeography Laboratory, Department of Ecology and Zoology, Federal University of Santa Catarina, Florianópolis, Brazil
3Departamento de Ciências, Colégio Técnico de Campinas (CTC), Universidade Estadual de Campinas (UNICAMP), Jorge de Figueiredo Corrêa, Campinas, S~ao Paulo,
Brazil
4Instituto Laje Viva, S~ao Paulo, Brazil
5Centre for Ecology, Evolution and Environmental Changes (CE3C)/Azorean Biodiversity Group and 7, Universidade dos Açores – Faculdade de Ciências Agrárias e
do Ambiente , Angra do Heroísmo, Portugal
6Faculdade de Ciências Agrárias e do Ambiente, University of Azores, R. da M~ae de Deus, Ponta Delgada, Azores, Portugal
7Programa de Pós-Graduaç~ao - Centro APTA Pescado Marinho, Instituto de Pesca, Avenida Francisco Matarazzo, 455 - Parque da �Agua Branca - Barra Funda, Santos,
S~ao Paulo, Brazil
Correspondence
Antônio B. Anderson, Laboratory of
Ichthyology, Department of Oceanography,
Federal University of Espírito Santo, Vitória, ES
29075-910, Brazil/ Sergio R. Floeter, Marine
Macroecology and Biogeography Laboratory -
Federal University of Santa Catarina,
Florianópolis, Santa Catarina - Brazil
Email: [email protected];
Funding information
CNPq, Grant/Award Number: CNPq
475367/2006-5; ECOPERE-SE Project;
FAPES, Grant/Award Number: PROFIX
program Nº 10/2018 - T.O.: 348/2018;
FAPESC, Grant/Award Number:
Biodiversidade Marinha do Estado de Santa
Catarina Project PI: A.L. FAPESC
4302/2010-8; FAPESC/CNPq, Grant/Award
Number: SISBIOTA-Mar project PI:
S.R.F. CNPq 563276/2010-0; FAPESC
6308/2011-8; Petrobras (BR), Grant/Award
Number: MAArE Project; King Abdullah
University of Science and Technology;
Coordenaç~ao de Aperfeiçoamento de Pessoal
de Nível Superior
Abstract
Human-mediated species invasions are recognized as a leading cause of global
biotic homogenization and extinction. Studies on colonization events since early
stages, establishment of new populations and range extension are scarce because
of their rarity, difficult detection and monitoring. Chromis limbata is a reef-
associated and non-migratory marine fish from the family Pomacentridae found in
depths ranging between 3 and 45 m. The original distribution of the species
encompassed exclusively the eastern Atlantic, including the Azores, Madeira and
the Canary Islands. It is also commonly reported from West Africa between Sene-
gal and Pointe Noire, Congo. In 2008, vagrant individuals of C. limbata were
recorded off the east coast of Santa Catarina Island, South Brazil (27� 410 4400 S,
48� 270 5300 W). This study evaluated the increasing densities of C. limbata
populations in Santa Catarina State shoreline. Two recent expansions, northwards
to S~ao Paulo State and southwards to Rio Grande do Sul State, are discussed, and
a niche model of maximum entropy (MaxEnt) was performed to evaluate suitable
C. limbata habitats. Brazilian populations are established and significantly increas-
ing in most sites where the species has been detected. The distributional bound-
aries predicted by the model are clearly wider than their known range of
occurrence, evidencing environmental suitability in both hemispheres from areas
where the species still does not occur. Ecological processes such as competition,
predation and specially habitat selectivity may regulate their populations and
Received: 18 November 2019 Accepted: 29 April 2020
DOI: 10.1111/jfb.14365
FISH
362 © 2020 The Fisheries Society of the British Isles J Fish Biol. 2020;97:362–373.wileyonlinelibrary.com/journal/jfb

overall distribution range. A long-term monitoring programme and population
genetics studies are necessary for a better understanding of this invasion and its
consequences to natural communities.
K E YWORD S
alien species, biological invasions, damselfishes, maximum entropy niche model, southwestern
Atlantic
1 | INTRODUCTION
Human-mediated climate change is the main cause of irreversible
changes in marine ecosystems, such as ocean warming and acidi-
fication, biodiversity loss, declines and distributional shifts in
marine species populations (Booth et al., 2017; Pecl et al., 2017).
Biological invasions mediated by anthropic activities are recog-
nized as a leading cause of global biotic homogenization and
extinction (Bailey et al., 2011). Such phenomena, alongside fac-
tors such as habitat loss and overexploitation of natural
resources, have been acting synergically as drivers of worldwide
biodiversity loss (Butchart et al., 2010). Therefore, much atten-
tion has been paid to a better understanding of processes and
the mechanisms involved in each stage of human-mediated inva-
sions (i.e., transport, colonization, establishment and control)
(Anderson et al., 2017; Carlton, 1996).
In the Hawaiian Islands, from 1955 to 1961, 11 grouper, snapper
and emperor fish species were intentionally released by the Hawaii
Division of Fish and Game to enhance Hawaiian shallow-water game
and food fisheries (Johnston & Purkis, 2016). Within 15 years, three
of the introduced species established populations, whereas eight did
not. Two species, Lutjanus kasmira (Forsskål, 1775) and Cephalopholis
argus Schneider, 1801, are now considered invasive (Johnston &
Purkis, 2016).
There are now over 1000 alien species inhabiting the Mediterra-
nean Sea, and most of them are thermophilic (i.e., can have their
populations increased and established or have their distributional
range increased by global warming) that have entered the eastern
basin through the Suez Canal (Katsanevakis et al., 2014; Kletou et al.,
2016). According to Kletou et al. (2016), Lessepsian invasions are
increasing rapidly, and ca. 130 species of marine fish are now
inhabiting the Mediterranean. For example, the blue spotted
cornetfish Fistularia commersonii Rüppell, 1838, colonized nearly the
entire Mediterranean in just 7 years, threatening over 41 taxa of
native fish species (Kletou et al., 2016). Another example is the
pufferfish Lagocephalus sceleratus (Gmelin, 1789) which preys upon
Mediterranean commercially important cephalopod species and is
now classed as a fisheries pest (Kletou et al., 2016). Despite all efforts
to access, understand and control ecological invasion processes, stud-
ies about colonization events since early stages are scarce because of
their difficult detection and complex and expensive monitoring
(Anderson et al., 2017).
The Azores chromis Chromis limbata (Valenciennes, 1833) is a
marine reef-associated and non-migratory Pomacentrid fish,
inhabiting rocky reefs at depths ranging from 3 to 45 m (Allen,
1991; Anderson et al., 2017; Brito et al., 2002). Its original distribu-
tion encompasses the eastern Atlantic, including the Azores,
Madeira and Canary Islands, and West Africa between Senegal and
Pointe Noire, Congo (Allen, 1991; Anderson et al., 2017; Edwards,
1986) (Figure 1). Adults inhabit rocky reefs and sand-weed bottoms
(Allen, 1991; Anderson et al., 2017). They are oviparous and have
distinct pairing during breeding. After spawning, their eggs adhere
to the substrate where parental care by males includes vigilance
and aeration (Anderson et al., 2017; Breder & Rosen, 1966). During
summer, nesting males defend territories and take care of the
demersal eggs (Mapstone & Wood, 1975). Chromis chromis
(Linnaeus, 1758), the most likely sister species of C. limbata
(Edwards, 1986; Wood, 1977), after a pelagic larval phase of
18–19 days settles on adult grounds (Anderson et al., 2017; Domi-
ngues et al., 2006; Raventós & Macpherson, 2001). Immature speci-
mens of C. limbata are more uniformly brownish, with silvery
shining longitudinal bands. Juveniles and adults prey upon zoo-
plankton (Allen, 1991; Anderson et al., 2017). Wirtz (2012)
observed C. limbata forming large plankton-feeding aggregations of
more than 100 individuals and males defending rocky reef
spawning areas in places deeper than 10 m.
Brazilian reef fishes have been studied and monitored by local
marine scientists since the end of the past century (Floeter et al.,
2001; Moura et al., 1999). In 2008, vagrant individuals of C. limbata
were observed at Campeche Island, located 1.5 km on the east coast
of Santa Catarina Island, southern Brazil (27� 410 4400 S, 48� 270 5300 W)
(Leite et al., 2009). Since then, Santa Catarina's populations of
C. limbata have colonized most islands and islets in the vicinities of
Santa Catarina Island (Florianópolis), with densities significantly
increasing (Anderson et al., 2017). Also, in 2008, vagrant individuals of
C. limbata were reported in the vicinities of S~ao Sebasti~ao Island, S~ao
Paulo State, Brazil. After reports of recent new records from the S~ao
Sebasti~ao Island, questions emerged among invasive species scien-
tists: (a) Have the populations reached a growth asymptote (carrying
capacity), or are they themselves fluctuating? (b) Are there more
niches available for C. limbata along the Brazilian coast and
elsewhere?
This study evaluated the increasing densities of C. limbata
populations in Santa Catarina State. A niche model of maximum
ANDERSON ET AL. 363FISH

entropy (MaxEnt) was developed to evaluate habitat suitability for
C. limbata along the southwest Atlantic coast (Verbruggen et al., 2009),
and recent new records of the species from S~ao Paulo State were dis-
cussed. For a better understanding of such invasion effects on local reef
fish communities, a long-term monitoring programme is urgent.
2 | MATERIALS AND METHODS
2.1 | Study area
This study was carried out on the coasts of three Brazilian states: Santa
Catarina (long-term monitoring), S~ao Paulo and Rio Grande do Sul (new
records). The monitoring of the expansion of the established population
of C. limbata, from 2010 to 2019, was conducted in subtropical reefs at
Florianópolis, Santa Catarina (27� 350 41.0800 S, 48� 320 38.9600 W). The
geomorphology of these rocky reefs is characterized, in its major portion,
by steep granitic rocky reefs ending in 12–15 m deep sandy bottoms.
The water visibility annual average is 4 m. The temperature range is
between 10�C during the harsh austral winters and 28�C in summer.
These rocky reefs are regarded as the southernmost limit of distribution
of tropical reef fish species that inhabit the tropical northern portion of
the Brazilian coast (Anderson et al., 2014, 2015, 2017, 2019). Five islets
were selected for sampling because of their logistic accessibility (e.g., dis-
tance from the shore and confirmed C. limbata's established populations)
(Anderson et al., 2017): Arvoredo, Deserta, Galé, Aranhas and Xavier.
New records and range extension of C. limbata to the state of S~ao
Paulo are now confirmed from Cabras Island, located in the vicinities
of S~ao Sebasti~ao Channel (23� 490 5000 S, 45� 230 3600 W). New
records and range expansion towards the southern Brazilian coast are
now confirmed for the state of Rio Grande do Sul (Parcel de Torres –
29� 420 4.6000 S, 48� 280 40.3200 W) (Figure 1).
2.2 | Field data collection techniques (SantaCatarina State)
Underwater visual censuses (UVCs) [20 × 2 m (40 m2)] were used to
quantify fish density along Santa Catarina State. For this methodol-
ogy, a scuba diver swam 1 m above the substratum along 20 m,
recording fish 1 m to each side of the transect (Anderson et al., 2017).
During the transects, the diver also sexed the fish according to their
colour patterns; females were yellow [ca. 13 cm TL (total length)]
(Figure 5a–c), and males were grey blue (young males) to a strong
cobalt blue while defending the nest (ca. 15 cm TL) (Figure 5d).The
present work is based on 9 years of UVCs conducted by the authors
and the database of the Marine Macroecology and Biogeography Lab-
oratory. In total, over 1000 UVCs from 2010 to 2019 were con-
ducted, and then a cut-off of 30 UVCs per site per year was selected
for analyses. Samples were collected in the shallow part of the reef
ranging from 5 to 14 m depth. All samples were obtained in the same
sites, in the mornings during the austral summers (e.g., from early
December to March) (Anderson et al., 2015, 2017, 2019).
2.3 | New records
Observations in S~ao Paulo State occurred inside the Marine Protected
Area of Cabras Island Monitoring Programme, project ECOPERE-SE
(Reef Fish Ecology from Southwestern Brazilian Coast), implemented
F IGURE 1 Map of Chromislimbata's distribution in 2018. Themonitoring of Brazilian establishedpopulations in time was conducted inSanta Catarina State (7); monitoring ofrange extensions (new records) wasconducted in S~ao Paulo State (8)
364 ANDERSON ET AL.FISH
(a)
(b)
(c)
140 Size (cm)
15 Adult
10
5
0
Recruits
Mean density ± SE
Total mean
Total density ± SD
450
400
350
300
250
200
150
100
140
120
100
80
60
40
20
0
50
0
Tota
l den
sity
per y
ear ±
SD
Den
sity\
size
Tota
l den
sity
per y
ear ±
SD
*GLMPr(>|t|) < 0.05< AIC 161.16
Total mean
2010 2011 2012 2013 2014 2015
Timeline
2016 2017 2018 2019
Recruits total density ± SD
•GLMPr(>|t|) = 0.07< AIC 51.103
and young
120
100
80
60
40
20
0
F IGURE 2 (a) Santa Catarina'spopulation variations from 2010 to 2019.Circles represent the number of individualsdetected. Different colours representdifferent sizes (ontogenetic stages) ofindividuals. Asterisks indicate significance[generalized linear model (GLM)]. Chromislimbata illustration by JPB imagDOP.(b) Light green circles represent the total
density of C. limbata per year. The dashedred line represents the total 9 years’ meandensity. Asterisks represent the GLMsignificance Pr(>|t|) < 0.05, and lettersrepresent the Tukey post hoc contrasts test.(c) Purple circles represent the total densityper year of recruits (individual ≤ 5 cm TL).The dashed red line represents the total9 years’ mean density. Black dots representthe GLM significance Pr(>|t|) = 0.07 (notsignificant)
MaxEnt
50°0�N
50°0�S
0°0�
100°0�W 50°0�W 0°0� 50°0�E
00.250.50.751
F IGURE 3 Maximum entropyniche model (MaxEnt). Representativemodel map of maximum entropy forChromis limbata. Warmer coloursindicate better predicted conditions
ANDERSON ET AL. 365FISH
in January 2005. The Monitoring Programme comprised monthly sam-
pling periods, including diurnal and nocturnal scuba dives (depth
range: 4–13 m) and freediving (depth range: surface to 3 m), surround-
ing Cabras Island, to record all rocky reef fish species. The dives' aver-
age time was 60 min for scuba and 40 min for freediving.
Photographs of C. limbata were taken using a point-and-shoot camera
(Canon G9) in Ikelite housing and two Sea & Sea Strobes YS-110.
Photos were taken in macro mode as close to the fish as possible
and recorded in RAW and JPEG file modes. In every photographic
record, the diver took notes of the fish size. As a measure of reference
and to avoid distortions in the assessment, the diver positioned a 5 cm
ruler on the substrate close to the site occupied by the fish. Images were
analysed after edition using free software Image J 1.49 (http://imagej.
nih.gov/ij/) to obtain meristic data and measurements to confirm the fish
identification followed (Canestrini, 1872; Froese & Pauly, 2019).
In December 2016 one vagrant individual of C. limbata was detected
and photographed in Queimada Grande Island, also in S~ao Paulo State
(24� 290 14.5500 S, 46� 400 36.7600 W), by L. Francine. New records from
Rio Grande do Sul State were collected from recreational divers' videos
posted online. Those were recorded on 4 March 2017 at the Parcel de
Torres – a rocky outcrop located 20–25 km offshore (29� 420 4.6000 S,
48� 280 40.3200 W), at depths ranging from 22 to 30 m (video https://
www.youtube.com/watch?v=uZoNhCf_iNE&t=386s).
2.4 | Data analyses
2.4.1 | Population expansion in Santa Catarina
Generalized linear models (GLM) were used to evaluate the effect of
time on C. limbata's densities in Santa Catarina State. Individuals’
densities were used as a dependent variable and time (year) as an inde-
pendent variable according to Chatfield (1989) and Rencher and
Schaalje (2008). For significant differences, Tukey contrasts were used to
analyse variations between years. Tukey post hoc test contrasts were
performed using the “multicomp” R packages (Hothorn et al., 2016),
“lsmeans” (Lenth & Lenth, 2018) and “multicompView” (Graves et al.,
2015). Assumptions of normality and homoscedasticity were assessed
using Kolmogorov–Smirnov/Lilliefors and Bartlett's tests. Data were log
transformed (log X + 1) to meet the assumptions of normality
(Snedecor & Cochran, 1989; Underwood, 1981; Zar, 1999). The analysis
was performed in R environment (R Core Team 2019).
2.4.2 | Niche modelling procedures
Macroecological niches of C. limbata were modelled using the MaxEnt – a
machine learning algorithm (R package dismo v1.1–4) which consists of a
technique based on the principle of maximum entropy – using species'
presence data as proposed by Philips and Dudík (2008). This algorithm has
been tested worldwide in several studies and is considered an adequate
tool to be used in such contexts (see Elith & Leathwick, 2009; Hernandez
et al., 2006; Philips & Dudík, 2008). Only accurate data (i.e., published
papers) collected in literature regarding occurrence of species were applied
to elaborate the model (Verbruggen et al., 2009) (Appendices 1 and 2).
2.4.3 | Presence data and environmental variables
A total of 708 georeferenced occurrences were used to model C. limbata
niche availability. Occurrence records were obtained from scientific journal
articles (Appendix 2). For later use in the modelling procedures, the
MaxEnt00.250.50.751
MaxEnt00.250.50.751
MaxEnt00.250.50.751
6°0�S
21°0�S
55°0�N
40°0�N
56°0�N
41°0�N
36°0�S
52°0�W
(a) (b) (c)37°0�W 76°0�W 61°0�W 11°0�W 4°0�E
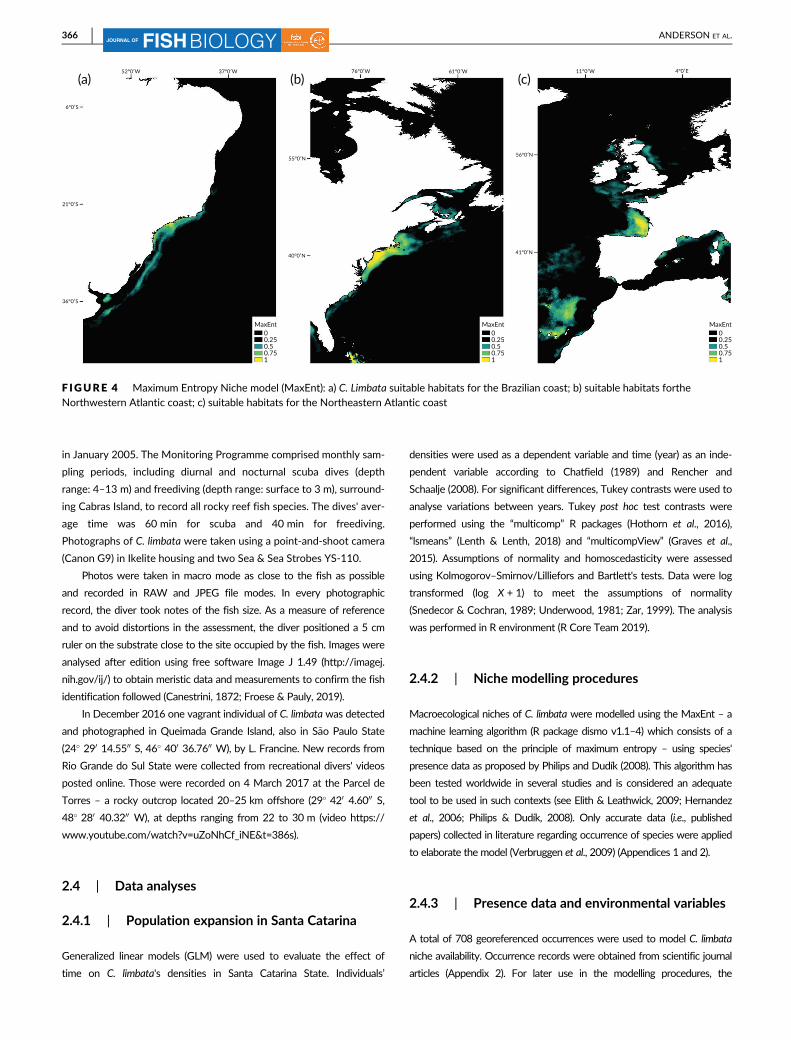
F IGURE 4 Maximum Entropy Niche model (MaxEnt): a) C. Limbata suitable habitats for the Brazilian coast; b) suitable habitats fortheNorthwestern Atlantic coast; c) suitable habitats for the Northeastern Atlantic coast
366 ANDERSON ET AL.FISH

background (i.e., “pseudo-occurrences”) was generated with respect to a cir-
cumference of 500 km around the occurrence records as proposed by Elith
et al. (2011). To avoid spatial autocorrelation, occurrences located <1 km
apart were randomly selected and removed, as well as duplicate entries.
The data set of environmental variables (global scale) (see Appen-
dix 3) was used to generate the model and was downloaded from Bio-
Oracle data set (Assis et al., 2018; Tyberghein et al., 2012). Predictive
variables were selected considering relationships among C. limbata's
biology, ecology and collinearity between environmental variables
(Assis et al., 2018; Tyberghein et al., 2012).
The best-fit model was selected according to the following steps.
(a) The multicollinearity test was conducted using Pearson's correla-
tion coefficient (R) to examine the cross-correlation between environ-
mental variables (Farashi & Naderi, 2017). (b) Variables with a cross-
correlation coefficient value >0.9 were excluded from further analysis
(see Appendix 3) (Farashi & Naderi, 2017). (c) GLMs were used to test
the significance of environmental variables (Appendix 4) and then to
select the best-fitted model according to the AIC (i.e., the preferred
model is the one with a minimum AIC value) (Appendix 4) (Akaike,
1998). (d) Such procedures resulted in a subset of 15 variables used as
the best-fitted input for the model (Figure 4, Appendices 4 and 6).
Both presence data and environmental variables were processed and
analysed in R (R Development Core Team, 2019). (e) The performance
of the models was measured using the area under the curve (AUC)
(Philips & Dudík, 2008; Phillips et al., 2011; Verbruggen et al., 2009).
3 | RESULTS
3.1 | The invasive populations in Santa Catarina
A total of 780 strip transects were conducted during the austral
summers (i.e., December to April) from 2010 to 2019, covering a
total area of 31,200 m2 and corresponding to ca. 117 h of underwa-
ter observation. This work resulted in 10 years’ monitoring of
C. limbata's populations in the coast of Santa Catarina, southern Bra-
zil (Figure 2).
The invasive Pomacentrid populations in Santa Catarina vary sig-
nificantly in time [GLM Pr(>|t|) < 0.05] (Figure 2b; Appendix 5). Con-
sidering species' population structure in time, large schools of small
individuals (e.g., ≤5 cm) were detected in 2016, 2017, 2018 and 2019.
Despite the large numbers of recruits detected, no significant differ-
ences were found over time [GLM Pr(>|t|) = 0.07] (Figure 2c; Appen-
dix 5). The number of adult female and young male feeding
aggregations has increased since 2010 (Figure 2a). Large adult males'
densities also increased along Santa Catarina coast in the same period
(Figure 2a). Despite their populational significant variations in time
(Figure 2b), no significant differences were detected among years
(Figure 2b; Appendix 5).
3.2 | Fundamental niche availability model
The model predicts highly probable suitable habitats for C. limbata
in the northwestern Atlantic to the coasts of New Jersey, Connect-
icut and Massachusetts (Figures 3 and 4), the southern Brazilian
coast, from Espírito Santo State to Rio Grande dos Sul State and in
the northeastern Atlantic to the coast of France (Figures 3 and 4).
Among the 15 environmental predictors analysed, the most signifi-
cant variables are related to primary productivity and oceano-
graphic conditions (Table 1; Appendix 6). The models presented a
good performance with an AUC value of 0.99. Results were closer
to a perfect prediction, indicating that most essential environmen-
tal variables which determine species distributions were consid-
ered in the data set (Table 1; Appendix 6) (Verbruggen
et al., 2009).
TABLE 1 Environmental variablesused in the MaxEnt model and theircontribution to the model predictions.
Environmental variables Unit Contribution (%) Permutation importance
Diffuse attenuation mean m−1 23.3 47.9
Dissolved oxygen mean mol m−3 22.2 0
Current velocity maximum m−1 13 12.4
Primary productivity maximum g m−3 day−1 10.3 10.4
Current velocity minimum m−1 8.2 9.4
Par maximum E m−2 day−1 8.2 5.7
Cloud cover maximum % 4.3 5.8
Par mean E m−2 day−1 1.9 1.2
Temperature maximum �C 1.8 0.9
Calcite mean mol m−3 1.7 0.8
Phosphate maximum mol m−3 1.5 0
Chlorophyll mean mol m−3 1.2 1
Phosphate minimum mol m−3 0.8 2.2
Silicate minimum mol m−3 0.8 0.2
Surface pH – 0.8 2.1
Bold values are shown Variables with higher permutation importance.
ANDERSON ET AL. 367FISH

3.3 | Brazilian populations' range expansion (newrecords)
Vagrant individuals of C. limbata were recorded in the southeastern
Brazilian coast from 2008 to 2019. During the Monitoring Programme
of the Marine Protected Area of Cabras Island, four individuals of
C. limbata were recorded. The site for all records was S~ao Sebasti~ao
Channel, east coast of S~ao Sebasti~ao Island (23� 490 5000 S,
45� 230 3600 W). Among these records, a vagrant individual of
C. limbata [8–10 cm standard length (SL)] was repeatedly detected at
the vicinity of Cabras Island every month from June 2008 to June
2009. In the same area, another fish, 12 cm, was recorded in January
and April 2011. From March to May 2012, another individual, 10 cm,
was recorded, and finally in May 2014 an 8 cm fish was monitored
until July 2015, when it reached 10 cm (Figure 5). Since then, no fur-
ther records have been reported from Cabras Island.
All encounters occurred in the same rocky-bottom area of ca.
20 m2. Individuals were usually observed feeding together with large
aggregations of Abudefduf saxatilis (Linnaeus, 1758), and only in the
last records C. limbata wasdetected feeding together with a single
individual of its congener Chromis multilineata (Guichenot, 1853).
The differences between the sizes and time of occurrence indicated
the presence of more than one individual during the time of
observations.
In December 2016 one adult male was photographed in Que-
imada Grande Island, S~ao Paulo State coast, representing a new
record and range extension of C. limbata's populations for the Brazil-
ian coast (Figure 5d). In February, 2017 a video was uploaded showing
several individuals of C. limbata in the Parcel de Torres, Rio Grande do
Sul State (29� 34.5010 S, 048� 07.5670 W), extending the southern-
most distribution limit of the invasive Pomacentridae and
corroborating the model predictions regarding the fundamental niche
availability for southern Brazil (https://www.youtube.com/watch?v=
uZoNhCf_iNE). The video shows mature females, large males (blue
individuals) and a small school of recruits, which suggests a growing
population.
4 | DISCUSSION
4.1 | Santa Catarina's established populations andthe “Arc of Capricorn” region influence
New populations of invasive marine fish species along the western
Atlantic coast have been monitored with greater concern since the
establishment of the Indo-Pacific lionfish species, Pterois volitans
(Linnaeus, 1758) and Pterois miles (Bennett, 1828), along the Atlantic
coast of the United States (Schofield, 2009). From 1999 to 2015 the
species also colonized the Caribbean, extending their range to the
southern Brazilian coast (Ferreira et al., 2015; Schofield, 2009). Experi-
ments with intentional introductions of 11 marine predatory fish (e.g.,
grouper, snapper and emperor fish) were conducted in the Hawaiian
Islands from 1955 to 1961 to produce new fishery resources
(Johnston & Purkis, 2016). Within 15 years eight species' populations
crashed, and three established self-sustained populations. Two spe-
cies, L. kasmira (Forsskål, 1775) the common bluestripe snapper and
C. argus (Schneider, 1801) the Peacock hind, are classified as invasive
(Johnston & Purkis, 2016). In 2013 the Indo-West Pacific damselfish,
known as Regal demoiselle Neopomacentrus cyanomos (Bleeker, 1856),
was first recorded in the west Atlantic, when it was reported to be
common on reefs near Coatzacoalcos, in the extreme southwest Gulf
of Mexico corner (Robertson et al., 2016). From 2013 to 2015 the
F IGURE 5 Pictures of Chromislimbata (♀) from (a) Santa CatarinaState (image A. B. Anderson), (b and c)S~ao Sebasti~ao (Cabras Island) (♀), S~aoPaulo State (images J. P. Silva) and(d) Queimada Grande Island (♂), S~aoPaulo State (image L. Francini)
368 ANDERSON ET AL.FISH

species was observed on six nearshore reefs adjacent to Veracruz City,
Veracruz, Mexico (Robertson et al., 2016). Robertson et al. (2016) also
suggested that N. cyanomos may compete with native planktivorous
damselfishes [e.g., the Brown chromis C. multilineata (Guichenot, 1853)]
and have adverse effects on populations. This 10-year monitoring study
of C. limbata's populations in the southern Brazilian coast, compared to
the works mentioned earlier, seems to follow the same invasive pattern
of establishment and expansion. In a near future, C. limbata may repre-
sent a threat to local native damselfishes competing for resources such
as food, shelter and nesting areas (Anderson et al., 2017).
The establishment of a new population will depend on abiotic (e.g.,
topography, temperature, nutrient availability) and biotic [e.g., initial colo-
nizers (healthy propagules, larvae, adults), mating success, new mutations,
elimination of deleterious alleles, repeated inflow of new genotypes, compe-
tition, predation] factors (Anderson et al., 2017; Kaňuch et al., 2014). The
low genetic diversity detected in Santa Catarina's established populations
compared to native populations from Macaronesia (Anderson et al., 2017)
suggests a small larval pulse or the arrival of a small group of individuals.
Populations in Santa Catarina seem to be varying significantly
(Figure 2). Blue males with large harems of females and large schools of
small individuals (<5 cm) were detected in all studied sites from 2013 to
2019 (Figure 2a). This may well point to a healthy increasing population,
with potential for spatial domination (e.g., higher density and biomass
than local congener C. multilineata and other Pomacentrids such as
A. saxatilis) in the near future (Anderson et al., 2017).
The southwestern Atlantic biogeographic ecotone is also known as
the Arc of Capricorn (i.e., encompassing the states of Rio de Janeiro, S~ao
Paulo, Paraná, Santa Catarina and Rio Grande do Sul) and represents the
southernmost limit of distribution for most tropical organisms (Anderson
et al., 2015, 2017). Moreover, the region is considered a warm temperate
biogeographic province (Bernardes et al., 2018; Horta et al., 2001). This
part of the Brazilian coast, especially Santa Catarina State, presents sea-
sonal patterns of temperate variations with a monthly average of
25.6 ± 0.5�C in winter and 27.0 ± 0.9�C in summer (Anderson et al.,
2015, 2017; Bernardes et al., 2018). This seasonal pattern is determined
by both warm tropical waters from the Brazilian Current (originating from
the north and flowing southwards) and cool waters from the South Atlan-
tic Central Water, flowing north. This mass of water intrudes on the shal-
low coastal shelf of this region, especially during the spring and summer
northeastern winds, and features temperatures of ≤16�C (Anderson et al.,
2015; Bernardes et al., 2018). Such characteristics seem to work as an
optimum habitat for C. limbata and may have influenced the establishment
of a healthy population. Otherwise, further north along the coast of S~ao
Paulo State, with slightly warmer water masses, C. limbata was also
detected, albeit in modest numbers (Anderson et al., 2017).
4.2 | Fundamental niche availability
The main predictors which have influenced the model were variables
related to primary productivity, temperature, oceanographic and topo-
graphic conditions (Table 1). Therefore, the model reinforces the affin-
ity of the species to areas with cooler waters and high primary
production (e.g., regions with upwelling) (Anderson et al., 2017). All
main regions highlighted by the model have distinct oceanographic
characteristics regarding temperature, currents, upwellings and resur-
gence phenomena, which directly affect primary productivity [e.g., the
Golf Stream in the northwestern Atlantic, the Iberian Poleward Cur-
rent system in the northeastern Atlantic and the Brazil current in the
southwestern Atlantic (Bernardes et al., 2018; Bukata et al., 2018;
Peliz et al., 2005)].
Many northwestern and northeastern Atlantic sites do not pre-
sent topographic conditions such as complex rocky coastlines with
small archipelagos, islands or nearshore islets. Moreover, temperature
seems to be a limiting factor for C. limbata's dispersal. These abiotic
and biotic factors – such as predations and competition – may explain
why C. limbata does not occur, so far, in those regions.
Considering that the Brazilian populations of C. limbata (S~ao
Paulo and Santa Catarina States) have the same age (i.e., in both
cases, first records were documented in 2008–2009), the low densi-
ties from S~ao Paulo (warmer oceanic water masses) may emphasize
that the larger Brazilian populations have affinities to colder,
nutrient-rich and more productive waters, such as those in Santa
Catarina's coasts, where upwelling is a constant phenomenon and
primary productivity is higher when compared to northerner parts of
the Brazilian coast (Anderson et al., 2017; Bernardes et al., 2018).
Temperature may be a limiting factor to the expansion of C. limbata
towards the northern Brazilian coast, considering the average sea
surface temperature of such regions (Anderson et al., 2017; Matano
et al., 2010; Olson et al., 1988). Otherwise, deeper and colder reefs
(a depth of 50 m maximum) may represent a refuge and also work as
“stepping stones” for C. limbata's northward expansion (e.g., Vitória-
Trindade Sea Mount Chain) (Pinheiro et al., 2017). Mediterranean
and African populations of Chromis species have been recorded from
10 to 40 m depth (Bertoncini et al., 2010; Domingues et al., 2005;
Domingues et al., 2007).
4.3 | S~ao Paulo vagrant specimens and new recordorigins
Leite et al. (2009) described that all the encounters of C. limbata in
Santa Catarina State occurred in the same rocky-bottom area of ca.
20 m2, suggesting a restricted occupation area based on specific sub-
strate conditions and/or behavioural interactions (e.g., reproductive
and feeding behaviours), which indicates site fidelity and small resi-
dential range. This study suggests that C. limbata may have similar ter-
ritorial behaviours on Brazilian-colonized areas. The differences
between sizes and time of occurrence of C. limbata indicate the pres-
ence of more than one individual during the observations. In this par-
ticular case, different sizes and record timing could be explained
through recurrent introductions of C. limbata in the S~ao Sebasti~ao
canal. It is possible to apply Williamson & Fritter's “rule of ten” (1996)
for this. In other words, the probability of success of an introduction
is very low, and most introductions fail to establish and spread. It has
been suggested that only 1 out of every 10 introductions survives,
ANDERSON ET AL. 369FISH

only one-tenth of these become established and spread and only a
tenth of these become invasive (Williamson & Fitter, 1996).
Since 2008 C. limbata has been recorded in the vicinities of S~ao
Sebasti~ao, S~ao Paulo State, Brazil; the most recent one was from Que-
imada Grande Island, in December 2016. According to Leite
et al. (2009), the first record of C. limbata in Santa Catarina occurred
in that same year, which suggests that both records may have the
same origin. Otherwise, recent records in S~ao Paulo may well be a nat-
ural dispersal from Santa Catarina's established populations. The
genetic study published by Anderson et al. (2017) concluded that
Santa Catarina's populations do not share haplotypes with
Macaronesian populations, which may imply that the source of both
populations probably originated from western Africa. When consider-
ing species' morphology (Figure 5), specimens from S~ao Paulo and
Santa Catarina are remarkably similar. Nevertheless, no C. limbata
have been found yet along the relatively small Paraná coastline. This
is important for discussion because this state borders S~ao Paulo
(north) and Santa Catarina (south).
4.4 | The long-distance dispersal
Ocean currents can drift fish larvae to new destinations although dis-
tance is a prime factor in determining which species will prevail. Dis-
tance apparently acts as a natural filter and probably excludes species
with short larval stages, such as damselfishes (Pomacentridae), and
selects others with long larval lives such as surgeon fishes
(Acanthuridae) (Luiz et al., 2004, 2012, 2015). Cowen et al. (2006)
showed that typical larval dispersal distances for the wider Caribbean,
providing ecologically significant numbers of settlers, were only on a
scale of 50–100 km for most species with a relatively high rate of
local retention or recruitment from adjacent locations. Recent inva-
sion events to the Brazilian coast were related to a supposed flow of
the superficial currents on the tropical Atlantic flowing westward from
Africa to Brazil or via natural larval dispersal from the Caribbean
towards the Brazilian coast (Anderson et al., 2015; Anderson et al.,
2017; Ferreira et al., 2015; Leite et al., 2009; Luiz et al., 2004).
Semi-submersible oil rigs are notorious to transport entire communi-
ties of marine organisms through oceans (Anderson et al., 2017; Wanless
et al., 2010). Recently, the presence of the Pomacentrids Abudefduf
hoefleri (Steindachner, 1881) and A. saxatilis in the Canaries has been
attributed to oil rigs (Pajuelo et al., 2016). Damselfishes, especially within
the genus Abudefduf, Neopomacentrus and Chromis, have been detected
rafting in plastic debris, algae and flotsam (Luiz et al., 2015; Robertson
et al., 2016), which led us to consider the “hitchhiker's hypothesis” as the
most plausible (Anderson et al., 2017). Other records of invasive species
can be interpreted in a different way, suggesting ballast water among the
most important vectors of introduced species in the marine realm, with a
high risk to coastal habitats (Ferreira et al., 2004a, 2004b, 2009, 2015;
Lopes et al., 2009).
Because invasion mediated by ships is the main pathway of
exotic species, it is evident that there is a need to monitor areas
adjacent to harbours together with the application of rigorous
controls of ballast water. Despite the increasing rate in exotic spe-
cies reports, Brazil does not have an effective control system for bal-
last water. NORMAM (Brazilian Navy Authority Rules/Directives)
determines that ships exchange ballast water within an isobath of
200 m, to reduce the risk of spreading exotic species. Nonetheless,
the control of any species present is not effective (de Paula Costa
et al., 2011).
Considering the growth in the number of ship visits to Brazilian
harbours (Wilmsmeier & Monios, 2016), the increase in their transit
speeds and the possibility of ballast water to function as an incubator
during the cruise for some planktonic species and the fact that
C. limbata larvae and juveniles prey upon zooplankton (Bax et al.,
2003; Gollasch et al., 2000), it is plausible to consider the hypothesis
of shipping transport for C. limbata larvae to Brazil (Anderson et al.,
2017). In contrast, there are no evidences of any Pomacentridae listed
in samples collected directly from ship ballast waters (Williams et al.,
1988; Wonham et al., 2000).
4.5 | The impacts in local communities
Considering the high level of primary productivity which occurred in
the recently colonized areas, the invader C. limbata may not pose a
threat to local planktivorous fish, regarding competitive behaviours
towards food resource (Anderson et al., 2017). On the contrary, the
aggressive behaviour of adult males during reproduction may pose a
severe threat to their congeners, other Pomacentridae and species
which have the same demersal reproductive behavioural patterns [e.
g., C. multilineata, Stegastes fuscus (Cuvier, 1830), A. saxatilis, Stegastes
pictus (Castelnau, 1855), Stegastes variabilis (Castelnau, 1855)]
(Anderson et al., 2017; Laglbauer et al., 2017). Moreover, the aggres-
sive reproductive behaviour of C. limbata adult males may cause detri-
mental effects on shelter availability for local fish. In rocky reef
systems, shelter availability (e.g., holes and crevices) is a valuable
resource to species which rely on the environment as protection
against predation and parental care (Anderson et al., 2017, 2019). The
need for behavioural studies in the invaded areas is urgent for a better
understanding of patterns, such as reproductive seasonality, spawning
characteristics and habitat use.
According to Pinnegar (2018), large populations of C. chromis play
a fundamental role in the Mediterranean Sea by transferring nutrients
from pelagic systems to the littoral in the form of solid and liquid
wastes. In addition, C. chromis represents a major prey item for preda-
tors and mesoconsumers in Mediterranean food webs (Pinnegar,
2018). It is also considered a major consumer of fish eggs and there-
fore may have a strong influence on the dynamics of other fish spe-
cies (Pinnegar, 2018). Therefore, the increasing numbers of the
invasive C. limbata in southern Brazil may have, in a near future, the
same effects of the system described by Pinnegar (2018), regarding
the populations of its Atlanto-Mediterranean congener C. chromis.
Long-term monitoring of such impacts is crucial for a better under-
standing of ecological impacts of invasive species in marine
ecosystems.
370 ANDERSON ET AL.FISH

5 | CONCLUSIONS
This study indicated that C. limbata populations in Santa Catarina
State vary over time and are expanding in space, obeying the general
patterns of invasive species. Specimens detected in S~ao Paulo State in
the early stages of the colonization (2008) may have the same origin
as Santa Catarina's populations, and may also have originated the
most recent records (2017). Despite the wide availability of funda-
mental niches for C. limbata worldwide, temperature seems to be a
limiting factor for their dispersal. From all the dispersal hypotheses
which could account for this invasion in south Brazil, the oil rig trans-
portation and “hitchhikers” or rafting seem more plausible.
The present population of this invader in Brazilian waters and
their eventual effects on native reef fish communities are still not pos-
sible to evaluate. The rocky reefs of southern Brazil are positioned in
a biogeographic climatic transition zone, affected by several oceano-
graphic and climatic phenomena (e.g., upwellings, current shifts, La
Niña and El Niño southern oscillations, cold ocean water intrusions
during the austral winters). Such climatic complexity affects local ich-
thyofauna population’s density and biomass, which can underestimate
the real effects of C. limbata's invasion on local communities. A long-
term monitoring programme (including genetic studies) of this inva-
sion would be crucial to elucidate the drivers of such unique dispersal
and evaluate in situ the impacts of a species invasion in a new
environment.
ACKNOWLEDGEMENTS
We thank FAPES (Fundaç~ao de Amparo à Pesquisa e Inovaç~ao do
Espírito Santo, Brazil)/CAPES (Coordenaç~ao de Aperfeiçoamento de
Pessoal de Nível Superior, Brazil) (PROFIX programme number
10/2018 – T.O.: 348/2018) for A.B.A. postdoctoral scholarship. We
also thank the anonymous reviewers and A.R.W. (Red Sea Research
Center – King Abdullah University of Science and Technology), who
contributed to the improvement of this paper. Thanks to the Marine
Macroecology and Biogeography Laboratory (LBMM) staff for field
support. Funding sources: SISBIOTA-Mar (PI: S.R.F., CNPq
563276/2010-0; FAPESC 6308/2011-8), Ilhas do Sul Project (PI:
S.R.F., CNPq 475367/2006-5), MAArE Project – Monitoramento
Ambiental do Arvoredo e Entorno (PI: B. Segal), CAPES scholarship to
A.B.A., Biodiversidade Marinha do Estado de Santa Catarina Project
(PI: A.L., FAPESC 4302/2010-8) and ECOPERE-SE Project (Ecologia
de Peixes Recifais da Costa Sudeste do Brasil) (PI: J.P. Silva).
AUTHOR CONTRIBUTIONS
A.B.A. contributed the original idea and helped with data generation,
data analysis, manuscript preparation and reviews; S.R.F., J.P.S. and
J.P.S.B. contributed the original idea and helped with manuscript prep-
aration, reviews and funding; R.S. and C.L.B.F. contributed to manu-
script preparation.
CONFLICTS OF INTEREST
All authors declare that they have no conflict of interest.
ETHICAL APPROVAL
All applicable international, national and/or institutional guidelines for
the care and use of animals were followed.
SAMPLING AND FIELD STUDIES
All necessary permits for sampling and observational field studies
were obtained by the authors from competent authorities.
ORCID
Antônio B. Anderson https://orcid.org/0000-0003-2502-7018
Jodir Pereira da Silva https://orcid.org/0000-0001-7510-7935
Sergio R. Floeter https://orcid.org/0000-0002-3201-6504
Jo~ao P. Barreiros https://orcid.org/0000-0003-4531-6685
REFERENCES
Akaike, H. (1998). Factor analysis and AIC. In E. Parzen, K. Tanabe, &
G. Kitagawa (Eds.), Selected papers of Hirotugu Akaike (pp. 371–386).New York, NY: Springer.
Allen, G. (1991). Damselfishes of the world. Hong Kong: Mergus Press.
Anderson, A., Bonaldo, R., Barneche, D., Hackradt, C., Félix-Hackradt, F.,
García-Chartón, J., & Floeter, S. (2014). Recovery of grouper assem-
blages indicates effectiveness of a marine protected area in southern
Brazil. Marine Ecology Progress Series, 514, 207–215.Anderson, A. B., Batista, M. B., Gibran, F. Z., Félix-Hackradt, F. C.,
Hackradt, C. W., García-Charton, J. A., & Floeter, S. R. (2019). Habitat
use of five key species of reef fish in rocky reef systems of southern
Brazil: evidences of MPA effectiveness. Marine Biodiversity, 49(2),
1027–1036.Anderson, A. B., Carvalho-Filho, A., Morais, R. A., Nunes, L. T.,
Quimbayo, J. P., & Floeter, S. R. (2015). Brazilian tropical fishes in their
southern limit of distribution: checklist of Santa Catarina's rocky reef
ichthyofauna, remarks and new records. Checklist 11, n. 4, p. 1688.
Anderson, A. B., Salas, E. M., Rocha, L. A., & Floeter, S. R. (2017). The
recent colonization of South Brazil by the Azores Chromis Chromis
limbata. Journal of Fish Biology, 91, 558–573.Assis, J., Tyberghein, L., Bosch, S., Verbruggen, H., Serr~ao, E. A., & De
Clerck, O. (2018). Bio-ORACLE v2.0: extending marine data layers for
bioclimatic modelling. Global Ecology and Biogeography, 27, 277–284.Bailey, S. A., Deneau, M. G., Jean, L., Wiley, C. J., Leung, B., &
MacIsaac, H. J. (2011). Evaluating efficacy of an environmental policy
to prevent biological invasions. Environmental Science & Technology,
45, 2554–2561.Bax, N., Williamson, A., Aguero, M., Gonzalez, E., & Geeves, W. (2003).
Marine invasive alien species: a threat to global biodiversity. Marine
Policy, 27, 313–323.Bernardes, M. B., Anderson, A. B., Franzan Sanches, P., Simionatto Polito, P.,
Lima Silveira, T., Velez-Rubio, G., … Martinez, A. (2018). Kelps' long-
distance dispersal: role of ecological/oceanographic processes and impli-
cations to marine forest conservation. Diversity, 10, 11.
Bertoncini, �A. A., Machado, L. F., Barreiros, J. P., Hostim-Silva, M., &
Verani, J. R. (2010). Rocky reef fish community structure in two Azor-
ean islands (Portugal) Central North Atlantic. Journal of the Marine Bio-
logical Association of the United Kingdom, 90, 1353–1362.Booth, D. J., Poloczanska, E., Donelson, J. M., Molinos, J. G., &
Burrows, M. (2017). Biodiversity and climate change in the oceans. In
B. F. Phillips & M. Pérez-Ramírez (Eds.), Climate change impacts on fish-
eries and aquaculture: A global analysis (Vol. 1, pp. 63–89). Hoboken,
NJ: John Wiley & Sons Ltd.
Breder, C. M., & Rosen, D. E. (1966). Modes of reproduction in fishes
(p. 941). Neptune City, NJ: T. F. H. Publications, Inc..
ANDERSON ET AL. 371FISH

Brito, A., Pascual, P. J., Falcón, J., Sancho, A., & González, G. (2002). Peces
de las islas Canarias. La Laguna, Spain: Catálogo comentado e ilustrado,
Francisco Lemus Editor.
Bukata, R. P., Jerome, J. H., Kondratyev, A. S., & Pozdnyakov, D. V. (2018).
Optical properties and remote sensing of inland and coastal waters, Boca
Raton, Florida: CRC Press.
Butchart, S. H. M., Walpole, M., Collen, B., van Strien, A.,
Scharlemann, J. P. W., Almond, R. E. A., … Watson, R. (2010). Global
biodiversity: indicators of recent declines. Science, 328, 1164–1168.Canestrini, G. (1872). Fauna d'Italia; parte terza Pesci. Milano, Italy: Vallardi.
Carlton, J. T. (1996). Biological invasions and cryptogenic species. Ecology,
77, 1653–1655.Chatfield, C. (1989). Non-linear and non-stationary time series analysis:
M.B. Priestley, (academic press, London, 1988), 237 pp. International
Journal of Forecasting, 5, 428–429.Cowen, R. K., Paris, C. B., & Srinivasan, A. (2006). Scaling of connectivity in
marine populations. Science, 311, 522–527.de Paula Costa, M. D., Souza-Conceiç~ao, J. M., Schwingel, P. R., &
Spach, H. L. (2011). Assessment of larval distribution of invasive
Omobranchus punctatus (Valenciennes, 1836)(Pisces: Blenniidae) in a
subtropical estuary (southern Brazil). Aquatic Invasions, 6, S33–S38.Domingues, V. S., Bucciarelli, G., Almada, V. C., & Bernardi, G. (2005). His-
torical colonization and demography of the Mediterranean damselfish,
Chromis chromis. Molecular Ecology, 14, 4051–4063.Domingues, V. S., Santos, R. S., Brito, A., Alexandrou, M., & Almada, V. C.
(2007). Mitochondrial and nuclear markers reveal isolation by distance
and effects of Pleistocene glaciations in the northeastern Atlantic and
Mediterranean populations of the white seabream (Diplodus sargus, L.).
Journal of Experimental Marine Biology and Ecology, 346, 102–113.Domingues, V. S., Santos, R. S., Brito, A., & Almada, V. C. (2006). Historical
population dynamics and demography of the eastern Atlantic
pomacentrid Chromis limbata (Valenciennes, 1833). Molecular Phyloge-
netics and Evolution, 40, 139–147.Edwards, A. (1986). A new damselfish, Chromis lubbocki (Teleostei:
Pomacentridae) from the Cape Verde archipelago, with notes on other
eastern Atlantic pomacentrids. Zoologische Mededelingen, 60,
181–207.Elith, J., & Leathwick, J. R. (2009). Species distribution models: ecological
explanation and prediction across space and time. Annual Review of
Ecology, Evolution, and Systematics, 40, 677–697.Elith, J., Phillips, S. J., Hastie, T., Dudík, M., Chee, Y. E., & Yates, C. J.
(2011). A statistical explanation of MAXENT for ecologists. Diversity
and Distributions, 17, 43–57.Farashi, A., & Naderi, M. (2017). Predicting invasion risk of raccoon Pro-
cyon lotor in Iran using environmental niche models. Landscape and
Ecological Engineering, 13, 229–236.Ferreira, C., Floeter, S., Gasparini, J., Ferreira, B., & Joyeux, J. (2004a). Tro-
phic structure patterns of Brazilian reef fishes: a latitudinal compari-
son. Journal of Biogeography, 31, 1093–1106.Ferreira, C. E., Luiz, O. J., Floeter, S. R., Lucena, M. B., Barbosa, M. C.,
Rocha, C. R., & Rocha, L. A. (2015). First record of invasive lionfish
(Pterois volitans) for the Brazilian coast. PLoS One, 10, e0123002.
Ferreira, C. E. L., Gonçalves, J. E. A., & Coutinho, R. (2004b). Cascos de
navios e plataformas como vetores na introduç~ao de espécies exóticas.�Agua de lastro e bioinvas~ao, 1, 143–155.
Ferreira, C. E. L., Junqueira, A. d. O. R., Villac, M. C., & Lopes, R. M. (2009).
Marine bioinvasions in the Brazilian coast: Brief report on history of
events, vectors, ecology, impacts and management of non-indigenous
species. In Biological invasions in marine ecosystems (pp. 459–477). Ber-lin, Heidelberg: Springer.
Floeter, S. R., Guimar~aes, R. Z. P., Rocha, L. A., Ferreira, C. E. L.,
Rangel, C. A., & Gasparini, J. L. (2001). Geographic variation in reef-fish
assemblages along the Brazilian coast. Global Ecology and Biogeogra-
phy, 10, 423–431.
Froese, R. & Pauly, D. (2019). Fishbase (www database). World Wide Web
Electronic Publications. Retrieved from https://www.fishbase.de/s-
earch.php (accessed June 2019).
Gollasch, S., Lenz, J., Dammer, M., & Andres, H.-G. (2000). Survival of
tropical ballast water organisms during a cruise from the Indian
Ocean to the North Sea. Journal of Plankton Research, 22,
923–937.Graves, S., Piepho, H. & Selzer, L. (2015). Dorai-Raj S. multcompView: visu-
alizations of paired comparisons. R package version, 01-05.
Hernandez, P. A., Graham, C. H., Master, L. L., & Albert, D. L. (2006). The
effect of sample size and species characteristics on performance of
different species distribution modeling methods. Ecography, 29,
773–785.Horta, P., Amancio, E., Coimbra, C., & Oliveira, E. (2001). Considerações
sobre a distribuiç~ao e origem da flora de macroalgas marinhas
brasileiras. Hoehnea, 28, 243–265.Hothorn, T., Bretz, F., Westfall, P., Heiberger, R. M., Schuetzenmeister, A.,
Scheibe, S., & Hothorn, M. T. (2016). Package “multcomp.” Simultaneous
inference in general parametric models. Vienna, Austria: Project for Sta-
tistical Computing.
Johnston, M. W., & Purkis, S. J. (2016). Forecasting the success of invasive
marine species; lessons learned from purposeful reef fish releases in
the Hawaiian islands. Fisheries Research, 174, 190–200.Kaňuch, P., Berggren, Å., & Cassel-Lundhagen, A. (2014). Genetic diversity
of a successful colonizer: isolated populations of Metrioptera roeselii
regain variation at an unusually rapid rate. Ecology and Evolution, 4,
1117–1126.Katsanevakis, S., Coll, M., Piroddi, C., Steenbeek, J., Ben Rais Lasram, F.,
Zenetos, A., & Cardoso, A. C. (2014). Invading the Mediterranean Sea:
biodiversity patterns shaped by human activities. Frontiers in Marine
Science, 1, 32.
Kletou, D., Hall-Spencer, J. M., & Kleitou, P. (2016). A lionfish (Pterois miles)
invasion has begun in the Mediterranean Sea. Marine Biodiversity
Records, 9, 46.
Laglbauer, B. J. L., Afonso, P., Donnay, A., Santos, R. S. & Fontes, J. (2017).
Reproductive synchrony in a temperate damselfish, Chromis limbata.
acta ethologica 20, 297-311.
Leite, J. R., Bertoncini, �A. A., Bueno, L., Daros, F., Alves, J., & Hostim-
Silva, M. (2009). The occurrence of Azores Chromis, Chromis limbata in
the South-Western Atlantic. Marine Biodiversity Records, 2, e145.
Lenth, R., & Lenth, M. R. (2018). Package “lsmeans.”. The American Statisti-
cian, 34, 216–221.Lopes, R. M. C., Pombo, L., Cunha, V. B. & Rimoldi, D. (2009). Informe sobre
as espécies exóticas invasoras marinhas no Brasil: Ministério do Meio
Ambiente, Brasília, Série Biodiversidade 33, 440 pp.
Luiz, O. J., Allen, A. P., Robertson, D. R., Floeter, S. R., & Madin, J. S.
(2015). Seafarers or castaways: ecological traits associated with rafting
dispersal in tropical reef fishes. Journal of Biogeography, 42,
2323–2333.Luiz, O. J., Floeter, S., Gasparini, J., Ferreira, C., & Wirtz, P. (2004). The
occurrence of Acanthurus monroviae (Perciformes: Acanthuridae) in
the South-Western Atlantic, with comments on other eastern Atlantic
reef fishes occurring in Brazil. Journal of Fish Biology, 65, 1173–1179.Luiz, O. J., Madin, J. S., Robertson, D. R., Rocha, L. A., Wirtz, P., &
Floeter, S. R. (2012). Ecological traits influencing range expansion
across large oceanic dispersal barriers: insights from tropical Atlantic
reef fishes. Proceedings of the Royal Society of London B: Biological Sci-
ences, 279, 1033–1040.Mapstone, G. M., & Wood, E. M. (1975). The ethology of Abudefduf
luridus and Chromis chromis (Pisces: Pomacentridae) from the Azores.
Journal of Zoology, 175, 179–199.Matano, R. P., Palma, E. D., & Piola, A. R. (2010). The influence of the Brazil
and Malvinas currents on the southwestern Atlantic shelf circulation.
Ocean Science, 6, 983–995.
372 ANDERSON ET AL.FISH

Moura, R. L. d., Gasparini, J. L., & Sazima, I. (1999). New records and range
extensions of reef fishes in the Western South Atlantic, with com-
ments on reef fish distribution along the Brazilian coast. Revista
Brasileira de Zoologia, 16, 513–530.Olson, D. B., Podestá, G. P., Evans, R. H., & Brown, O. B. (1988). Temporal
variations in the separation of Brazil and Malvinas currents. Deep Sea
Research Part A. Oceanographic Research Papers, 35, 1971–1990.Schofield, P. J. (2009). Geographic extent and chronology of the invasion
of non-native lionfish (Pterois volitans (Linnaeus 1758) and P. miles
(Bennett 1828)) in the Western North Atlantic and Caribbean Sea.
Aquatic Invasions, 4, 473–479.Pajuelo, J. G., González, J. A., Triay-Portella, R., Martín, J. A., Ruiz-Díaz, R.,
Lorenzo, J. M., & Luque, �A. (2016). Introduction of non-native marine
fish species to the Canary Islands waters through oil platforms as vec-
tors. Journal of Marine Systems, 163, 23–30.Pecl, G. T., Araújo, M. B., Bell, J. D., Blanchard, J., Bonebrake, T. C.,
Chen, I.-C., … Williams, S. E. (2017). Biodiversity redistribution under
climate change: impacts on ecosystems and human well-being. Science,
355, eaai9214.
Peliz, �A., Dubert, J., Santos, A. M. P., Oliveira, P. B., & Le Cann, B. (2005).
Winter upper ocean circulation in the Western Iberian Basin-fronts,
eddies and poleward flows: an overview. Deep Sea Research Part I:
Oceanographic Research Papers, 52, 621–646.Philips, S. J., & Dudík, M. (2008). Modeling of species distributions with
Maxent: new extensions and a comprehensive evaluation. Ecography,
31, 161–175.Phillips, S., Dudik, M. & Schapire, R. (2011). Maximum entropy modeling of
species geographic distributions (MaxEnt), version 3.3. 3k.
Pinheiro, H. T., Bernardi, G., Simon, T., Joyeux, J.-C., Macieira, R. M.,
Gasparini, J. L., … Rocha, L. A. (2017). Island biogeography of marine
organisms. Nature, 549, 82–85.Pinnegar, J. (2018). Why the damselfish Chromis chromis is a key species in
the Mediterranean rocky littoral–a quantitative perspective. Journal of
Fish Biology, 92, 851–872.Raventós, N., & Macpherson, E. (2001). Planktonic larval duration and set-
tlement marks on the otoliths of Mediterranean littoral fishes. Marine
Biology, 138, 1115–1120.Rencher, A. C., & Schaalje, G. B. (2008). Linear models in statistics (p. 678).
Hoboken, NJ: Published simultaneously in Canada.
Robertson, D. R., Simoes, N., Rodríguez, C. G., Piñeros, V. J., & Perez-
España, H. (2016). An indo-Pacific damselfish well established in the
southern Gulf of Mexico: prospects for a wider, adverse invasion. Jour-
nal of the Ocean Science Foundation, 19, 1–17.R Core Team 2019: A Language and Environment for Statistical Comput-
ing R. Foundation for Statistical Computing, Vienna, Austria. https://
www.R-project.org/.
Snedecor, G., & Cochran, W. (1989). The normal distribution. In Statistical
methods (8th ed., pp. 53–58). Ames, IA: Iowa State University Press.
Tyberghein, L., Verbruggen, H., Pauly, K., Troupin, C., Mineur, F., & De
Clerck, O. (2012). Bio-ORACLE: a global environmental dataset for
marine species distribution modelling. Global Ecology and Biogeography,
21, 272–281.Underwood, A. (1981). Techniques of analysis of variance in experimental
marine biology and ecology. Oceanography and Marine Biology An
Annual Review, 19, 513–605.Verbruggen, H., Tyberghein, L., Pauly, K., Vlaeminck, C.,
Nieuwenhuyze, K. V., Kooistra, W. H. C. F., … Clerck, O. D. (2009).
Macroecology meets macroevolution: evolutionary niche dynamics in
the seaweed Halimeda. Global Ecology and Biogeography, 18, 393–405.Wanless, R. M., Scott, S., Sauer, W. H. H., Andrew, T. G., Glass, J. P.,
Godfrey, B., … Yeld, E. (2010). Semi-submersible rigs: a vector
transporting entire marine communities around the world. Biological
Invasions, 12, 2573–2583.Williams, R. J., Griffiths, F. B., Van der Wal, E. J., & Kelly, J. (1988). Cargo
vessel ballast water as a vector for the transport of non-indigenous
marine species. Estuarine, Coastal and Shelf Science, 26, 409–420.Williamson, M., & Fitter, A. (1996). The varying success of invaders. Ecol-
ogy, 77, 1661–1666.Wilmsmeier, G., & Monios, J. (2016). Institutional structure and agency in
the governance of spatial diversification of port system evolution in
Latin America. Journal of Transport Geography, 51, 294–307.Wirtz, P. (2012). Seven new records of fish from NGor Island, Senegal.
Arquipelago Life and Marine Sciences, 29, 77–81.Wonham, M. J., Carlton, J. T., Ruiz, G. M., & Smith, L. D. (2000). Fish and
ships: relating dispersal frequency to success in biological invasions.
Marine Biology, 136, 1111–1121.Wood, E. M. (1977). A review of damsel fishes (Pisces: Pomacentridae) of
the genus Chromis from the central and eastern Atlantic and the Medi-
terranean. Journal of Fish Biology, 10, 331–345.Zar, J. (1999). Biostatistical analysis. Upper Saddle River, NJ: Prentice Hall.
SUPPORTING INFORMATION
Additional supporting information may be found online in the
Supporting Information section.
How to cite this article: Anderson AB, da Silva JP, Sorvilo R,
Francini CLB, Floeter SR, Barreiros JP. Population expansion
of the invasive Pomacentridae Chromis limbata (Valenciennes,
1833) in southern Brazilian coast: long-term monitoring,
fundamental niche availability and new records. J Fish Biol.
2020;97:362–373. https://doi.org/10.1111/jfb.14365
ANDERSON ET AL. 373FISH
Related Documents