Population Differentiation of Southern Indian Male Lineages Correlates with Agricultural Expansions Predating the Caste System GaneshPrasad ArunKumar 1,13. , David F. Soria-Hernanz 2,3. , Valampuri John Kavitha 1,4. , Varatharajan Santhakumari Arun 1 , Adhikarla Syama 1 , Kumaran Samy Ashokan 5 , Kavandanpatti Thangaraj Gandhirajan 6 , Koothapuli Vijayakumar 5 , Muthuswamy Narayanan 7 , Mariakuttikan Jayalakshmi 1 , Janet S. Ziegle 8 , Ajay K. Royyuru 9 , Laxmi Parida 9 , R. Spencer Wells 2 , Colin Renfrew 10 , Theodore G. Schurr 11 , Chris Tyler Smith 12 , Daniel E. Platt 9 , Ramasamy Pitchappan 1,13 *, The Genographic Consortium " 1 The Genographic Laboratory, School of Biological Sciences, Madurai Kamaraj University, Madurai, Tamil Nadu, India, 2 National Geographic Society, Washington, District of Columbia, United States of America, 3 Institut de Biologia Evolutiva (CSIC-UPF), Departament de Cie `ncies Experimentals i de la Salut, Universitat Pompeu Fabra, Barcelona, Spain, 4 Department of Biotechnology, Mother Teresa Women’s University, Kodaikanal, Tamil Nadu, India, 5 Nilgiri Adivasi Welfare Association, Kota Hall Road, Kothagiri, Tamil Nadu, India, 6 Government College of Fine Arts, Chennai, Tamil Nadu, India, 7 Department of Zoology, St. Xaviers College, Palayamkottai, Tamil Nadu, India, 8 Applied Biosystems, Foster City, California, United States of America, 9 Computational Biology Group, IBM - Thomas J. Watson Research Center, New York, New York, United States of America, 10 McDonald Institute for Archaeological Research, University of Cambridge, Cambridge, United Kingdom, 11 Department of Anthropology, University of Pennsylvania, Philadelphia, Pennsylvania, United States of America, 12 The Wellcome Trust Sanger Institute, Wellcome Trust Genome Campus, Hinxton, United Kingdom, 13 Chettinad Academy of Research and Education, Kelampakkam, Chennai, Tamil Nadu, India Abstract Previous studies that pooled Indian populations from a wide variety of geographical locations, have obtained contradictory conclusions about the processes of the establishment of the Varna caste system and its genetic impact on the origins and demographic histories of Indian populations. To further investigate these questions we took advantage that both Y chromosome and caste designation are paternally inherited, and genotyped 1,680 Y chromosomes representing 12 tribal and 19 non-tribal (caste) endogamous populations from the predominantly Dravidian-speaking Tamil Nadu state in the southernmost part of India. Tribes and castes were both characterized by an overwhelming proportion of putatively Indian autochthonous Y-chromosomal haplogroups (H-M69, F-M89, R1a1-M17, L1-M27, R2-M124, and C5-M356; 81% combined) with a shared genetic heritage dating back to the late Pleistocene (10–30 Kya), suggesting that more recent Holocene migrations from western Eurasia contributed ,20% of the male lineages. We found strong evidence for genetic structure, associated primarily with the current mode of subsistence. Coalescence analysis suggested that the social stratification was established 4–6 Kya and there was little admixture during the last 3 Kya, implying a minimal genetic impact of the Varna (caste) system from the historically-documented Brahmin migrations into the area. In contrast, the overall Y-chromosomal patterns, the time depth of population diversifications and the period of differentiation were best explained by the emergence of agricultural technology in South Asia. These results highlight the utility of detailed local genetic studies within India, without prior assumptions about the importance of Varna rank status for population grouping, to obtain new insights into the relative influences of past demographic events for the population structure of the whole of modern India. Citation: ArunKumar G, Soria-Hernanz DF, Kavitha VJ, Arun VS, Syama A, et al. (2012) Population Differentiation of Southern Indian Male Lineages Correlates with Agricultural Expansions Predating the Caste System. PLoS ONE 7(11): e50269. doi:10.1371/journal.pone.0050269 Editor: Manfred Kayser, Erasmus University Medical Center, The Netherlands Received April 18, 2012; Accepted October 22, 2012; Published November 28, 2012 Copyright: ß 2012 ArunKumar et al. This is an open-access article distributed under the terms of the Creative Commons Attribution License, which permits unrestricted use, distribution, and reproduction in any medium, provided the original author and source are credited. Funding: The study is supported by ‘‘The Genographic Project’’ funded by The National Geographic Society, IBM and Waitt Family Foundation. CTS was supported by The Wellcome Trust (Grant number 098051). The funders had no role in study design, data collection and analysis, decision to publish, or preparation of the manuscript. Competing Interests: Janet S. Ziegle is an employee of Applied Biosystems. Ajay K. Royyuru, Laxmi Parida and Daniell E. Platt are employees of IBM. Asif Javed and Pandikumar Swamikrishnan, both members of the Genographic Consortium are also employees of IBM. There is no patenting or profit making to be declared. This does not alter the authors’ adherence to all the PLOS ONE policies on sharing data and materials. * E-mail: [email protected] . These authors contributed equally to this work. " Consortium members are listed in Acknowledgements. Introduction Contemporary Indian populations exhibit a high cultural, morphological, and linguistic diversity, as well as some of the highest genetic diversities among continental populations after Africa [1,2]. Indian populations are broadly classified into two categories: ‘tribal’ and ‘non-tribal’ groups [3]. Tribal groups, constituting 8% of the Indian population, are characterized by traditional modes of subsistence such as hunting and gathering, PLOS ONE | www.plosone.org 1 November 2012 | Volume 7 | Issue 11 | e50269

Welcome message from author
This document is posted to help you gain knowledge. Please leave a comment to let me know what you think about it! Share it to your friends and learn new things together.
Transcript
Population Differentiation of Southern Indian MaleLineages Correlates with Agricultural ExpansionsPredating the Caste System
GaneshPrasad ArunKumar1,13., David F. Soria-Hernanz2,3., Valampuri John Kavitha1,4., Varatharajan
Santhakumari Arun1, Adhikarla Syama1, Kumaran Samy Ashokan5, Kavandanpatti
Thangaraj Gandhirajan6, Koothapuli Vijayakumar5, Muthuswamy Narayanan7,
Mariakuttikan Jayalakshmi1, Janet S. Ziegle8, Ajay K. Royyuru9, Laxmi Parida9, R. Spencer Wells2,
Colin Renfrew10, Theodore G. Schurr11, Chris Tyler Smith12, Daniel E. Platt9, Ramasamy Pitchappan1,13*,
The Genographic Consortium"
1 The Genographic Laboratory, School of Biological Sciences, Madurai Kamaraj University, Madurai, Tamil Nadu, India, 2National Geographic Society, Washington, District
of Columbia, United States of America, 3 Institut de Biologia Evolutiva (CSIC-UPF), Departament de Ciencies Experimentals i de la Salut, Universitat Pompeu Fabra,
Barcelona, Spain, 4Department of Biotechnology, Mother Teresa Women’s University, Kodaikanal, Tamil Nadu, India, 5Nilgiri Adivasi Welfare Association, Kota Hall Road,
Kothagiri, Tamil Nadu, India, 6Government College of Fine Arts, Chennai, Tamil Nadu, India, 7Department of Zoology, St. Xaviers College, Palayamkottai, Tamil Nadu,
India, 8Applied Biosystems, Foster City, California, United States of America, 9Computational Biology Group, IBM - Thomas J. Watson Research Center, New York, New
York, United States of America, 10McDonald Institute for Archaeological Research, University of Cambridge, Cambridge, United Kingdom, 11Department of
Anthropology, University of Pennsylvania, Philadelphia, Pennsylvania, United States of America, 12 The Wellcome Trust Sanger Institute, Wellcome Trust Genome Campus,
Hinxton, United Kingdom, 13Chettinad Academy of Research and Education, Kelampakkam, Chennai, Tamil Nadu, India
Abstract
Previous studies that pooled Indian populations from a wide variety of geographical locations, have obtained contradictoryconclusions about the processes of the establishment of the Varna caste system and its genetic impact on the origins anddemographic histories of Indian populations. To further investigate these questions we took advantage that both Ychromosome and caste designation are paternally inherited, and genotyped 1,680 Y chromosomes representing 12 tribaland 19 non-tribal (caste) endogamous populations from the predominantly Dravidian-speaking Tamil Nadu state in thesouthernmost part of India. Tribes and castes were both characterized by an overwhelming proportion of putatively Indianautochthonous Y-chromosomal haplogroups (H-M69, F-M89, R1a1-M17, L1-M27, R2-M124, and C5-M356; 81% combined)with a shared genetic heritage dating back to the late Pleistocene (10–30 Kya), suggesting that more recent Holocenemigrations from western Eurasia contributed ,20% of the male lineages. We found strong evidence for genetic structure,associated primarily with the current mode of subsistence. Coalescence analysis suggested that the social stratification wasestablished 4–6 Kya and there was little admixture during the last 3 Kya, implying a minimal genetic impact of the Varna(caste) system from the historically-documented Brahmin migrations into the area. In contrast, the overall Y-chromosomalpatterns, the time depth of population diversifications and the period of differentiation were best explained by theemergence of agricultural technology in South Asia. These results highlight the utility of detailed local genetic studieswithin India, without prior assumptions about the importance of Varna rank status for population grouping, to obtain newinsights into the relative influences of past demographic events for the population structure of the whole of modern India.
Citation: ArunKumar G, Soria-Hernanz DF, Kavitha VJ, Arun VS, Syama A, et al. (2012) Population Differentiation of Southern Indian Male Lineages Correlates withAgricultural Expansions Predating the Caste System. PLoS ONE 7(11): e50269. doi:10.1371/journal.pone.0050269
Editor: Manfred Kayser, Erasmus University Medical Center, The Netherlands
Received April 18, 2012; Accepted October 22, 2012; Published November 28, 2012
Copyright: � 2012 ArunKumar et al. This is an open-access article distributed under the terms of the Creative Commons Attribution License, which permitsunrestricted use, distribution, and reproduction in any medium, provided the original author and source are credited.
Funding: The study is supported by ‘‘The Genographic Project’’ funded by The National Geographic Society, IBM and Waitt Family Foundation. CTS wassupported by The Wellcome Trust (Grant number 098051). The funders had no role in study design, data collection and analysis, decision to publish, orpreparation of the manuscript.
Competing Interests: Janet S. Ziegle is an employee of Applied Biosystems. Ajay K. Royyuru, Laxmi Parida and Daniell E. Platt are employees of IBM. Asif Javedand Pandikumar Swamikrishnan, both members of the Genographic Consortium are also employees of IBM. There is no patenting or profit making to be declared.This does not alter the authors’ adherence to all the PLOS ONE policies on sharing data and materials.
* E-mail: [email protected]
. These authors contributed equally to this work.
" Consortium members are listed in Acknowledgements.
Introduction
Contemporary Indian populations exhibit a high cultural,
morphological, and linguistic diversity, as well as some of the
highest genetic diversities among continental populations after
Africa [1,2]. Indian populations are broadly classified into two
categories: ‘tribal’ and ‘non-tribal’ groups [3]. Tribal groups,
constituting 8% of the Indian population, are characterized by
traditional modes of subsistence such as hunting and gathering,
PLOS ONE | www.plosone.org 1 November 2012 | Volume 7 | Issue 11 | e50269
foraging and seasonal agriculture of various kinds [2,3]. In
contrast, most other Indians fall into non-tribal categories, many of
them classified as castes under the Hindu Varna (Color caste)
system which groups caste populations, primarily on occupation,
into Brahmin (priestly class), Kshatriya (warrior and artisan),
Vyasa (merchant), Shudra (unskilled labor) and the most recently
added fifth class, Panchama, the scheduled castes of India [2,3].
Generally, both non-tribal and tribal populations employ a
patrilineal caste endogamy. This practice, together with the
male-specific genetic transmission of the non-recombining portion
of the Y-chromosome (NRY), provides a unique opportunity to
study the impact of historical demographic processes and the social
structure on the gene pool of India.
The distribution of deep-rooted Indian-specific Y-chromosomal
and mitochondrial lineages suggests an initial settlement of
modern humans in the subcontinent from the early out-of-Africa
migration [4,5,6,7,8,9]. The greater genetic isolation of many
tribal groups and their differences in Y-chromosomal haplogroup
(HG) lineages compared to non-tribal groups, have generally been
interpreted as evidence of tribes being direct descendants of the
earliest Indian settlers [2,10,11,12,13]. Moreover, these tribe-caste
genetic differences have been attributed to the establishment of the
Hindu Varna system that has been maintained for millennia since
both Y chromosome and caste designation are paternally
inherited. However, the origin of caste system in India is still a
controversial subject [8,14,15,16], and there are two main schools
of thought about it. First, demic diffusion models propose an
expansion of Indo-European (IE) speakers 3 Kya (thousand years
ago) from Central Asia [10,17,18,19,20,21,22]. Alternatively,
other models propose the origin of caste as the result of cultural
diffusion and/or autochthonous demographic processes without
any major genetic influx from outside India [6,7,16,23]. Overall,
the genetic impact and mode of establishment of the caste system,
the extent of a common indigenous Pleistocene (10 Kya to
30 Kya) genetic heritage and the degree of admixture from West
Eurasian Holocene (10 Kya) migrations and their level of impact
on the tribal and non-tribal groups from India, remain unresolved
[5,6,7,10,16].
The lack of consensus among previous studies may reflect
difficulties associated with the conflicting relationships between
genetics and the socio-cultural factors used to pool truly
endogamous groups into broader categories, sometimes grouping
Indian populations sampled from a wide variety of geographical
locations together, such as a tribe-caste dichotomy or caste-rank
hierarchy [2,5,7]. One goal of pooling data from multiple
populations has been to smooth individual drift effects in an effort
to reconstruct putative ancestry [10] and thereby potentially infer
the past demographic processes shaping genetic diversity. How-
ever, the success of this approach relies on whether the
classification employed indeed reflects the true historical relation-
ships among these endogamous groups. Methods seeking to
identify the best grouping from an exploration of alternative
possible classifications, based on seeking maximal between-
population differences and minimal within-population variation
[24], would be of special relevance for studies on Indian
populations classified based on Varna status. This is the case
because several castes have suffered from historically fluid
definitions of their rank status, and both the origins and the scope
of the genetic impact of the Varna system on these populations are
still unclear [8,20,25,26,27,28]. Further, since the implementation
of the Varna system throughout India was not a uniform process
[17], broad classifications of multiple Indian samples from all over
the subcontinent based on Varna status, or tribe-caste dichotomy,
may not reflect true endogamous populations and could also
obscure genetic signals and the finer details of Indian demographic
histories. For this reason, a genetic study using a careful and
extensive sampling of well-defined non-tribal and tribal endoga-
mous populations from a restricted area designed to reduce the
confounding relationships among socio-cultural factors, without
presuming Varna rank status, to find empirically the best
approach of population grouping, could be a successful model to
obtain new insights of past Indian demographic processes.
Here, we attempted to apply this strategy to unravel the
population structure and genetic history of the southernmost state
of India, Tamil Nadu (TN), which is well known for its rigid caste
system [15], and to relate the resulting genetic data to the
paleoclimatic, archaeological, and historical evidence from this
region. The paleoclimatic and archaeological records show post-
LGM (Last Glacial Maximum) wet period expansions of foragers
into the region, whose interactions with later aridification-driven
migrations of agriculturists have been traced
[29,30,31,32,33,34,35]. Archaeology also reveals the establish-
ment of metallurgy [36] and river settlements [17], just several
centuries prior to the creation of the earliest written records of the
Sangam literature (300 BCE to 300 CE). These historical records
named several populations including some in the present study
(e.g., Paliyan, Pulayar, Valayar) reflecting the existence of these
now endogamous groups at that time [37,38]. More recent reports
dated to the 6th century CE, under the reign of the Sarabhapur-
iyas, [39] illustrate the local implementation of the Varna system
around 1 Kya, following the arrival of Brahmins into the region
[15,17]. The Tamil epics of this period, such as the Purananuru
anthology and Silapathikaram, describe a society with a well-
defined occupational class structure based on subsistence practices
[22]. Earlier genetic studies of TN populations identified clear
differentiations of endogamous ethnic groups classified into Major
Population Groups (MPG) based on socio-cultural characteristics
reflecting subsistence, traditional occupation, and native language
(mother tongue) [40,41]. Although some studies have identified hill
tribes as the earliest settlers, and others suggested a common
genetic signature among distantly ranked-caste populations, the
main evolutionary and demographic processes shaping the
observed genetic differences among populations from TN are still
unresolved in the literature [15,42,43,44].
In the present study, we examined the Y-chromosomal lineages
of 1,680 individuals sampled from 12 tribal and 19 non-tribal well-
defined endogamous populations. We first investigated whether
tribal and non-tribal groups shared a common genetic heritage
and characterized the proportion of putatively autochthonous and
non-autochthonous Indian Y-chromosomal haplogroups. It is
important to note that the total sample size used here is higher
than those in other studies covering the entire Indian subconti-
nent. Further, the detailed anthropological annotation of endog-
amous populations sampled from a restricted region within India,
together with the paleoclimatic, archeological and historical
regional-background were all important aspects needed to reduce
the confounding relationships among socio-cultural factors. This
general approach allowed us to infer important genetic signals and
the finer details of the population demographic histories.
Therefore, we sought to determine which of the classifications
based either on the Varna system (rank status, tribe-caste
dichotomy), or social-cultural factors (reflecting subsistence,
traditional customs and native language), or geography better
indicated true endogamous groups by exhibiting higher between-
population differences and lower within-population variation.
Since both Y chromosome and caste designation are paternally
inherited, we further explored whether any of these genetic
differences could be attributed to the historical evidences of the
Genetic Structure of Southern Indian Populations
PLOS ONE | www.plosone.org 2 November 2012 | Volume 7 | Issue 11 | e50269
establishment of the Hindu Varna system. In contrast, we found
the overall Y-chromosomal patterns, the time depth of population
diversifications and the period of differentiation correlated better
with archeological evidences and the demographic processes of
Neolithic agricultural expansions into the region.
Materials and Methods
Sampling StrategyTamil Nadu, the land of Tamils (Tamil has the most ancient
literary tradition of all Dravidian languages), is the southeastern
most province of India, measuring 130,058 km2 with a population
of 62,405,679 (2001 Indian Census: http/www.censusindia.gov.
in), the majority living in 17,272 villages. We sampled a total of
1,680 men, avoiding relatives to the third degree, from 12 tribal
and 19 non-tribal endogamous populations, which were selected
for their cultural uniqueness, geographical spread, and ethno-
graphic features. Samples from tribal participants were collected in
their isolated native villages and settlements from the tropical
forests of Western Ghats on the west side of TN. In contrast, non-
tribal populations exhibit a larger census sizes and geographical
spread and they were sampled in colleges and community
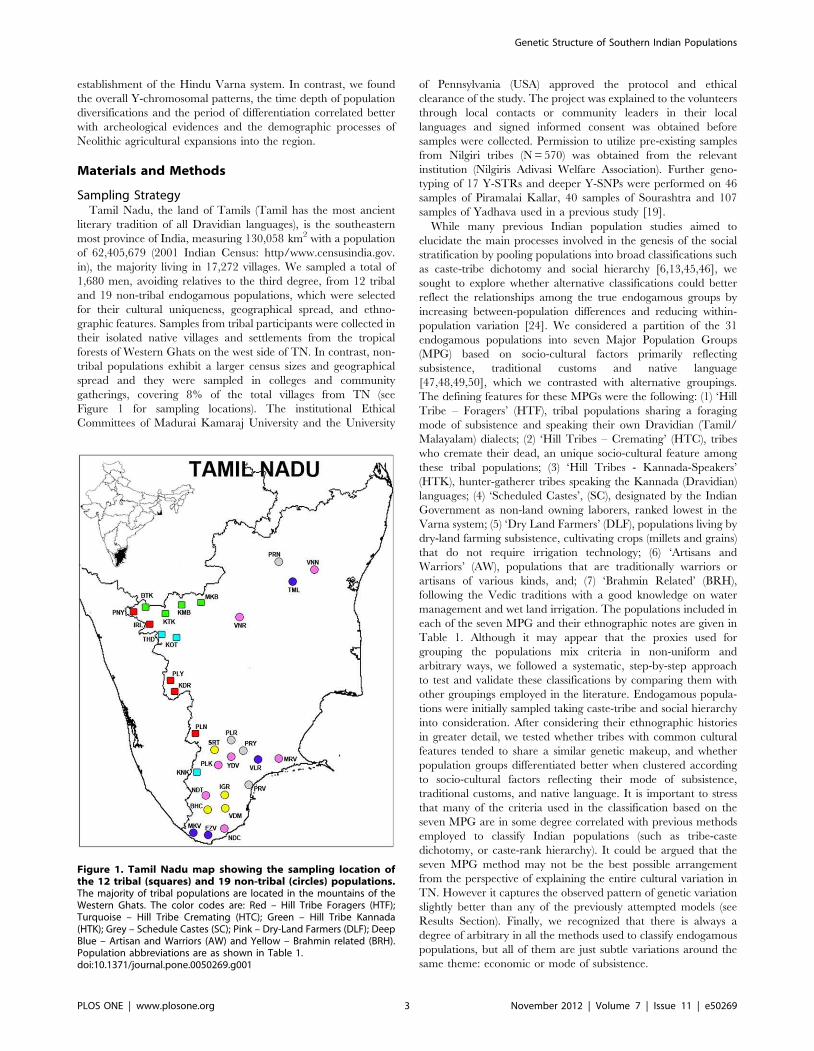
gatherings, covering 8% of the total villages from TN (see
Figure 1 for sampling locations). The institutional Ethical
Committees of Madurai Kamaraj University and the University
of Pennsylvania (USA) approved the protocol and ethical
clearance of the study. The project was explained to the volunteers
through local contacts or community leaders in their local
languages and signed informed consent was obtained before
samples were collected. Permission to utilize pre-existing samples
from Nilgiri tribes (N= 570) was obtained from the relevant
institution (Nilgiris Adivasi Welfare Association). Further geno-
typing of 17 Y-STRs and deeper Y-SNPs were performed on 46
samples of Piramalai Kallar, 40 samples of Sourashtra and 107
samples of Yadhava used in a previous study [19].
While many previous Indian population studies aimed to
elucidate the main processes involved in the genesis of the social
stratification by pooling populations into broad classifications such
as caste-tribe dichotomy and social hierarchy [6,13,45,46], we
sought to explore whether alternative classifications could better
reflect the relationships among the true endogamous groups by
increasing between-population differences and reducing within-
population variation [24]. We considered a partition of the 31
endogamous populations into seven Major Population Groups
(MPG) based on socio-cultural factors primarily reflecting
subsistence, traditional customs and native language
[47,48,49,50], which we contrasted with alternative groupings.
The defining features for these MPGs were the following: (1) ‘Hill
Tribe – Foragers’ (HTF), tribal populations sharing a foraging
mode of subsistence and speaking their own Dravidian (Tamil/
Malayalam) dialects; (2) ‘Hill Tribes – Cremating’ (HTC), tribes
who cremate their dead, an unique socio-cultural feature among
these tribal populations; (3) ‘Hill Tribes - Kannada-Speakers’
(HTK), hunter-gatherer tribes speaking the Kannada (Dravidian)
languages; (4) ‘Scheduled Castes’, (SC), designated by the Indian
Government as non-land owning laborers, ranked lowest in the
Varna system; (5) ‘Dry Land Farmers’ (DLF), populations living by
dry-land farming subsistence, cultivating crops (millets and grains)
that do not require irrigation technology; (6) ‘Artisans and
Warriors’ (AW), populations that are traditionally warriors or
artisans of various kinds, and; (7) ‘Brahmin Related’ (BRH),
following the Vedic traditions with a good knowledge on water
management and wet land irrigation. The populations included in
each of the seven MPG and their ethnographic notes are given in
Table 1. Although it may appear that the proxies used for
grouping the populations mix criteria in non-uniform and
arbitrary ways, we followed a systematic, step-by-step approach
to test and validate these classifications by comparing them with
other groupings employed in the literature. Endogamous popula-
tions were initially sampled taking caste-tribe and social hierarchy
into consideration. After considering their ethnographic histories
in greater detail, we tested whether tribes with common cultural
features tended to share a similar genetic makeup, and whether
population groups differentiated better when clustered according
to socio-cultural factors reflecting their mode of subsistence,
traditional customs, and native language. It is important to stress
that many of the criteria used in the classification based on the
seven MPG are in some degree correlated with previous methods
employed to classify Indian populations (such as tribe-caste
dichotomy, or caste-rank hierarchy). It could be argued that the
seven MPG method may not be the best possible arrangement
from the perspective of explaining the entire cultural variation in
TN. However it captures the observed pattern of genetic variation
slightly better than any of the previously attempted models (see
Results Section). Finally, we recognized that there is always a
degree of arbitrary in all the methods used to classify endogamous
populations, but all of them are just subtle variations around the
same theme: economic or mode of subsistence.
Figure 1. Tamil Nadu map showing the sampling location ofthe 12 tribal (squares) and 19 non-tribal (circles) populations.The majority of tribal populations are located in the mountains of theWestern Ghats. The color codes are: Red – Hill Tribe Foragers (HTF);Turquoise – Hill Tribe Cremating (HTC); Green – Hill Tribe Kannada(HTK); Grey – Schedule Castes (SC); Pink – Dry-Land Farmers (DLF); DeepBlue – Artisan and Warriors (AW) and Yellow – Brahmin related (BRH).Population abbreviations are as shown in Table 1.doi:10.1371/journal.pone.0050269.g001
Genetic Structure of Southern Indian Populations
PLOS ONE | www.plosone.org 3 November 2012 | Volume 7 | Issue 11 | e50269
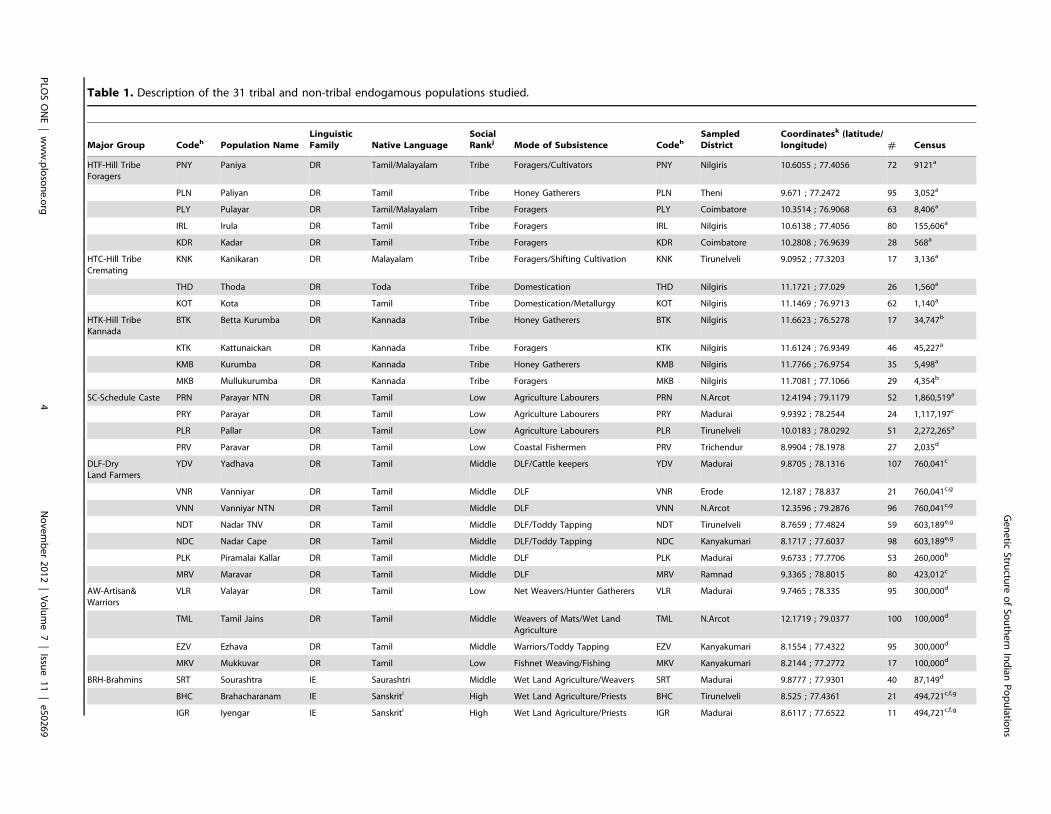
Table 1. Description of the 31 tribal and non-tribal endogamous populations studied.
Major Group Codeh Population Name
Linguistic
Family Native Language
Social
Rankj Mode of Subsistence CodehSampled
District
Coordinatesk (latitude/
longitude) # Census
HTF-Hill TribeForagers
PNY Paniya DR Tamil/Malayalam Tribe Foragers/Cultivators PNY Nilgiris 10.6055 ; 77.4056 72 9121a
PLN Paliyan DR Tamil Tribe Honey Gatherers PLN Theni 9.671 ; 77.2472 95 3,052a
PLY Pulayar DR Tamil/Malayalam Tribe Foragers PLY Coimbatore 10.3514 ; 76.9068 63 8,406a
IRL Irula DR Tamil Tribe Foragers IRL Nilgiris 10.6138 ; 77.4056 80 155,606a
KDR Kadar DR Tamil Tribe Foragers KDR Coimbatore 10.2808 ; 76.9639 28 568a
HTC-Hill TribeCremating
KNK Kanikaran DR Malayalam Tribe Foragers/Shifting Cultivation KNK Tirunelveli 9.0952 ; 77.3203 17 3,136a
THD Thoda DR Toda Tribe Domestication THD Nilgiris 11.1721 ; 77.029 26 1,560a
KOT Kota DR Tamil Tribe Domestication/Metallurgy KOT Nilgiris 11.1469 ; 76.9713 62 1,140a
HTK-Hill TribeKannada
BTK Betta Kurumba DR Kannada Tribe Honey Gatherers BTK Nilgiris 11.6623 ; 76.5278 17 34,747b
KTK Kattunaickan DR Kannada Tribe Foragers KTK Nilgiris 11.6124 ; 76.9349 46 45,227a
KMB Kurumba DR Kannada Tribe Honey Gatherers KMB Nilgiris 11.7766 ; 76.9754 35 5,498a
MKB Mullukurumba DR Kannada Tribe Foragers MKB Nilgiris 11.7081 ; 77.1066 29 4,354b
SC-Schedule Caste PRN Parayar NTN DR Tamil Low Agriculture Labourers PRN N.Arcot 12.4194 ; 79.1179 52 1,860,519a
PRY Parayar DR Tamil Low Agriculture Labourers PRY Madurai 9.9392 ; 78.2544 24 1,117,197c
PLR Pallar DR Tamil Low Agriculture Labourers PLR Tirunelveli 10.0183 ; 78.0292 51 2,272,265a
PRV Paravar DR Tamil Low Coastal Fishermen PRV Trichendur 8.9904 ; 78.1978 27 2,035d
DLF-DryLand Farmers
YDV Yadhava DR Tamil Middle DLF/Cattle keepers YDV Madurai 9.8705 ; 78.1316 107 760,041c
VNR Vanniyar DR Tamil Middle DLF VNR Erode 12.187 ; 78.837 21 760,041c,g
VNN Vanniyar NTN DR Tamil Middle DLF VNN N.Arcot 12.3596 ; 79.2876 96 760,041c,g
NDT Nadar TNV DR Tamil Middle DLF/Toddy Tapping NDT Tirunelveli 8.7659 ; 77.4824 59 603,189e,g
NDC Nadar Cape DR Tamil Middle DLF/Toddy Tapping NDC Kanyakumari 8.1717 ; 77.6037 98 603,189e,g
PLK Piramalai Kallar DR Tamil Middle DLF PLK Madurai 9.6733 ; 77.7706 53 260,000b
MRV Maravar DR Tamil Middle DLF MRV Ramnad 9.3365 ; 78.8015 80 423,012c
AW-Artisan&Warriors
VLR Valayar DR Tamil Low Net Weavers/Hunter Gatherers VLR Madurai 9.7465 ; 78.335 95 300,000d
TML Tamil Jains DR Tamil Middle Weavers of Mats/Wet LandAgriculture
TML N.Arcot 12.1719 ; 79.0377 100 100,000d
EZV Ezhava DR Tamil Middle Warriors/Toddy Tapping EZV Kanyakumari 8.1554 ; 77.4322 95 300,000d
MKV Mukkuvar DR Tamil Low Fishnet Weaving/Fishing MKV Kanyakumari 8.2144 ; 77.2772 17 100,000d
BRH-Brahmins SRT Sourashtra IE Saurashtri Middle Wet Land Agriculture/Weavers SRT Madurai 9.8777 ; 77.9301 40 87,149d
BHC Brahacharanam IE Sanskriti High Wet Land Agriculture/Priests BHC Tirunelveli 8.525 ; 77.4361 21 494,721c,f,g
IGR Iyengar IE Sanskriti High Wet Land Agriculture/Priests IGR Madurai 8.6117 ; 77.6522 11 494,721c,f,g
Genetic
Structu
reofSo
uthern
Indian
Populatio
ns
PLO
SONE|www.plosone.org
4November2012
|Volume7
|Issu
e11
|e50269
Y-Chromosomal AnalysisDNAs were extracted from blood or mouth-wash samples using
standard methods [19]. Samples were genotyped for single
nucleotide polymorphisms (SNPs) with a set of 23 custom TaqMan
assays (Applied Biosystems) using a 7900HT Fast Real-Time PCR
System. In addition, 19 Y-chromosomal short tandem repeat
(STR) and 6 SNP loci (Y-filerTM and Multiplex II Kits, ABI) were
genotyped using an ABI 3130XL Gene Analyzer, and fragment
sizes were determined using the GeneMapper Analysis Software
(v3.2, ABI) as described elsewhere [51]. Genotypes were validated
by testing reference samples from Coriell and the Genographic
Consortium. The multi-copy markers DYS385a and DYS385b
were excluded from further analyses because of ambiguity in
distinguishing these loci. Y chromosome haplogroups (HGs) and
paragroups were determined according to the 2008 YCC
nomenclature [52].
Statistical AnalysisThe software ARLEQUIN 3.11 [53] was employed to compute
Nei’s D (Nei 1987) and conduct AMOVA [54] using both Y-
chromosome HG frequencies and haplotype data. Fisher exact
tests were carried out among populations and MPGs to identify
significantly over- or under-represented HGs. Among those over-
represented HGs that tended to characterize any given MPG,
Fisher exact tests were further performed on the number of
populations over-represented in the given HG within the MPG
versus those outside of the MPG to quantify the significance of
such associations. Principal Component Analysis (PCA) [55] was
performed using HG frequencies, centered without variance
normalization [56] and with the significant components identified
by employing the skree-plot method [57] using R, version 2.9.1
(http://www.r-project.org/). The same software was implemented
to perform non-metric multidimensional scaling (MDS) [58] using
RST distances generated from the 17 Y-STR data of the TN
populations, using ARLEQUIN. The relative HG age estimates
were based on the variance of 17 STRs of the most frequent HGs
for the seven MPG as previously described [51].
We considered the problem of how to quantify the significance
of the difference between specific population group structures.
AMOVA’s resampling scheme compares individual group struc-
tures to the whole ensemble of randomly varied assignments of
populations to groups, as well as of samples to populations. This
tests the hypothesis that a specific group structure represents
organization of the genetics among populations better than would
be expected by chance. In our case, we had the different problem
of testing whether one group structure was significantly better than
another group structure. In this case, assignments were already
determined, and likely are both already better than expected by
chance. The question we tested was whether that variation in data
randomly drawn from a population could have produced sufficient
variation in the AMOVA results to account for the differences
between the specific group assignments being compared by
chance? Hence we resampled the STR haplotypes with replace-
ment, modeled by a multinomial distribution, and computed the
median and 95%CI’s of the results using R, version 2.9.1. We
tested resampling sizes up to 5,000 times, and found that 500 were
sufficient to give reasonable accuracy on the median and
confidence interval estimates. We therefore resampled each
configuration only 500 times.
The phylogenetic relationships among Y-STR haplotypes
drawn from individual haplogroups were estimated with the
reduced-median (RM) network algorithm in the program Network
4.5.0 [59,60], applying weights inverse to averaged haplotype
variance and reduced median reduction coefficient set at 1.0. This
Table
1.Cont.
MajorGro
up
Codeh
PopulationName
Linguistic
Family
NativeLanguage
Social
Rankj
ModeofSubsistence
Codeh
Sampled
District
Coord
inatesk(latitu
de/
longitude)
#Censu
s
VDM
Vad
ama
IESanskriti
High
WetLandAgriculture/Priests
VDM
Tirunelveli
8.5854;77.7261
63
494,721c,f,g
a-2001Census,GovernmentofIndia,http:www.censusindia.gov.in.
b-1981IndianCensus.
c-1931IndianCensus.
d-Estimatedcensussize.
e-1901IndianCensus.
f -AllBrahmin-relatedcastesin
Tam
ilNad
u,
g-Noinform
ationavailable.
h-Populationcodeusedin
PCA&MDSplots,
i -San
skritisthelanguag
eofscripturesan
dceremonies,butpopulationsquicklyad
optedlocalculturesan
dlanguag
es.
j -Lower,Middle
&Highersocial
ranks
areself-perceived/assignedclassifications.
k-Approximatecoordinates.
NTN(NorthTam
ilNad
u),TNV(Tirunelveli).
DR(Dravidian),IE
(Indo-European
).doi:10.1371/journal.pone.0050269.t001
Genetic Structure of Southern Indian Populations
PLOS ONE | www.plosone.org 5 November 2012 | Volume 7 | Issue 11 | e50269
program creates a tree topology based on the interrelationships of
the emergence and transmission of mutations in the respective
haplotypes. Even under simplifying conditions, the construction of
this simple combinatorial structure is algorithmically difficult, and
diverse algorithms give different answers. This result can be
informative if some subset of the results is consistent among
models. Therefore, in addition to using Network for assessing the
phylogenetic relationships of Y-STR haplotypes, we also used
ULTRANET (http://www.dei.unipd.it/,ciompin/main/Sito/
Ultranet.html), where the underlying distance (metric) between
nodes is ultrametric. Since tree structures reflect an ultrametric
structure, an algorithm that maps the compatibility of associations
according to such a structure may be uniquely informative. This
approach, which is orthogonal to other phylogenetic approaches,
helped confirm the results observed in RM network analysis,
thereby validating the consistency of the population associations
with evolutionarily related haplotypes.
Coalescence methods, as implemented in BATWING [61],
were applied to several different subsets of populations to quantify
major underlying demographic events, estimate divergence times
and assess the phylogenetic relationships among TN populations.
One of the major characteristics of BATWING is that the trees it
produces are constructed on the assumption of no gene flow
among demes. The proportions of samples the Metropolis-
Hastings algorithm provides in each tree gives some sense of the
strength of that candidate tree in representing the data. These
estimates account for the impact of mutation histories through the
likelihood scores obtained over the distributions of priors for
mutation rates and other demographic parameters. The outcome
of these estimates is that modal, and near modal, trees will show a
somewhat filtered view of the genetics contributing to the most
likely trees observed. Given these considerations, BATWING is
expected a priori to be appropriate for testing whether major
population differentiation occurred before or after the Varna
system was historically established in TN, under the assumption of
restricted admixture among populations under this social organi-
zation and structured endogamous system. The various testing
procedures described above, including MDS, PCA, the AMOVA
tests for differentiation, and the Fisher tests, were further applied
to establish whether there was a signal for common gene pools
among populations, as required for typical BATWING analyses.
In addition, BATWING admixture validation tests [62] of the
TN data were applied under three simulated potential scenarios.
In the first scenario, an individual population (Paniya) was
randomly split, and the BATWING analysis of the population
split time was performed. BATWING generally produced a
median time of less than 500 years, with the 95% confidence
intervals (CI) covering only the last two generations. In the second
scenario, recent gene flow was modeled between two populations
(Paniya and Brahacharanam) estimated by BATWING to have
already been isolated for a significant time (19.5 Kya) by randomly
mixing different proportions of chromosomes from each popula-
tion. BATWING gave much younger population divergence
estimates (9.3 Kya) than the unmixed split, even with only 5% of
the Y-chromosomes mixed randomly between the two popula-
tions, with a 10% mix between populations decreased the
divergence time estimates by more than 50% (3 Kya). In the
third scenario, we explored the impact of BATWING estimates by
randomly introducing an in-migrating population (Paniya) carry-
ing new paternal lineages into two differentiated demes (Braha-
charanam and Kota: split time was estimated at 4.7 Kya). These
estimates were only slightly affected (the split time actually
appeared to increase to 6.2 Kya) when the in-migrating propor-
tion did not exceed more than 40–50%. At that point, the modal
trees were dominated by the in-migrating population. Overall, the
results of the BATWING admixture tests based on data from the
TN populations were similar to those observed in a study of
religious populations within Lebanon [62]. Therefore, BATWING
generally seems to show little sensitivity to gene flow from
immigrants bringing new paternal lineages (different HGs) into the
parent population, but is very sensitive to gene flow between
populations sharing paternal lineages from the same HGs.
Besides assuming no gene flow, BATWING presupposes that
the population samples are random. As a result, using BATWING
to analyze the histories of individual HGs drawn from populations
yields dramatically different estimates of coalescence times, times
of expansion, and other population parameters because, as
mentioned in the admixture modeling, BATWING is more
sensitive to admixture than in-migration. Thus, BATWING may
be applied to individual HGs to extract information about specific
in-migration events. Further, HGs that tend to correlate strongly
with overall population estimates are likely to be more represen-
tative of their common ancestral gene pool. These results may be
expected in that selection of the modal population trees will tend
to preserve configurations where the most common of the shared
lineages comprise the strongest signals contributing to the
likelihood function. Therefore, selection of modal trees acts as a
filter that tends to exclude immigrating contributions, although it
will be heavily influenced by inter-population migration.
In these BATWING estimates, mutation rate priors were those
previously proposed [63] based on the effective mutation rates
previously cited [64]. Between 1.5 and 3.5 million Monte Carlo
(MC) samples were collected, generally accepting equilibration
following 500,000 MC samples and being determined by decay to
equilibrium of global estimates of effective population size and
relative constancy of quantile measurements extracted from the
equilibrated regions. Times associated with clusters identified by
RM networks as indicating evolution within populations were
estimated using UEPtmin and UEPtmax estimates within BATW-
ING. When computing population splits, large numbers of
populations tend to produce cross-talk between bifurcations on
different branches. A way to resolve this cross-talk is to set up
multiple runs with the various branches pooled except for the
primary branch under consideration. This approach also provides
an opportunity to check the consistency of split times of the parent
branches common to the pooled topologies. Composite trees may
then be constructed from the results of the multiple runs. SNPs
selected as unique evolutionary polymorphisms (UEPs) in compu-
tations of population split times depended on the representation of
variation through each of the populations being considered, or
through the pooled populations for UEP time estimates.
Results
NRY landscape of Tamil Nadu reveals predominantlyautochthonous lineagesA total of 21 Y chromosome HGs were identified in the study
populations (Table 2). The overall HG diversity among popula-
tions was 0.88660.003; of these, tribal populations exhibited lower
diversity (0.79660.013) than non-tribal populations
(0.88160.004). The majority of this genetic variation (82%) was
accounted for by seven HGs: H1-M52 (17.4%), F*-M89 (16.3%),
L1-M27 (14.0%), R1a1-M17 (12.7%), J2-M172 (9.4%), R2-M124
(8.2%) and H-M69 (4.7%). It should be noted that 90% of the C-
M130 samples reported here (66 out of 74) were positive for C5-
M356 while the rest were negative for both C3-M217 and C5-
M356 (Table S1).
Genetic Structure of Southern Indian Populations
PLOS ONE | www.plosone.org 6 November 2012 | Volume 7 | Issue 11 | e50269
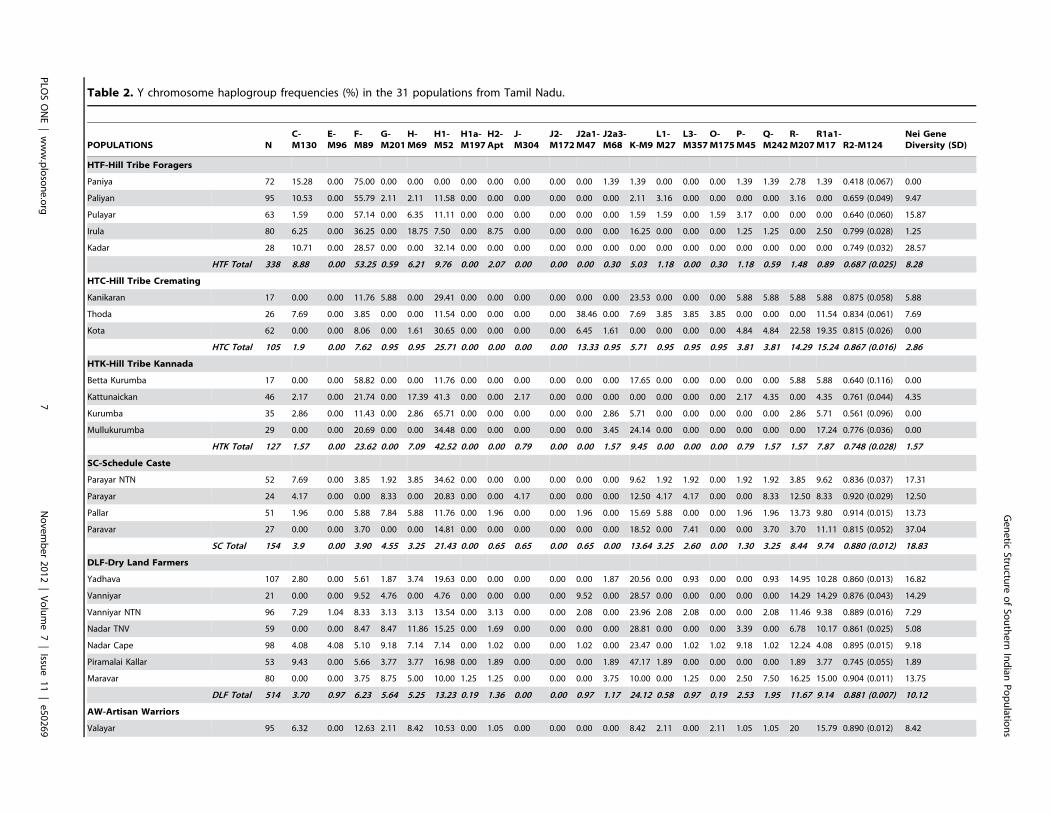
Table 2. Y chromosome haplogroup frequencies (%) in the 31 populations from Tamil Nadu.
POPULATIONS N
C-
M130
E-
M96
F-
M89
G-
M201
H-
M69
H1-
M52
H1a-
M197
H2-
Apt
J-
M304
J2-
M172
J2a1-
M47
J2a3-
M68 K-M9
L1-
M27
L3-
M357
O-
M175
P-
M45
Q-
M242
R-
M207
R1a1-
M17 R2-M124
Nei Gene
Diversity (SD)
HTF-Hill Tribe Foragers
Paniya 72 15.28 0.00 75.00 0.00 0.00 0.00 0.00 0.00 0.00 0.00 0.00 1.39 1.39 0.00 0.00 0.00 1.39 1.39 2.78 1.39 0.418 (0.067) 0.00
Paliyan 95 10.53 0.00 55.79 2.11 2.11 11.58 0.00 0.00 0.00 0.00 0.00 0.00 2.11 3.16 0.00 0.00 0.00 0.00 3.16 0.00 0.659 (0.049) 9.47
Pulayar 63 1.59 0.00 57.14 0.00 6.35 11.11 0.00 0.00 0.00 0.00 0.00 0.00 1.59 1.59 0.00 1.59 3.17 0.00 0.00 0.00 0.640 (0.060) 15.87
Irula 80 6.25 0.00 36.25 0.00 18.75 7.50 0.00 8.75 0.00 0.00 0.00 0.00 16.25 0.00 0.00 0.00 1.25 1.25 0.00 2.50 0.799 (0.028) 1.25
Kadar 28 10.71 0.00 28.57 0.00 0.00 32.14 0.00 0.00 0.00 0.00 0.00 0.00 0.00 0.00 0.00 0.00 0.00 0.00 0.00 0.00 0.749 (0.032) 28.57
HTF Total 338 8.88 0.00 53.25 0.59 6.21 9.76 0.00 2.07 0.00 0.00 0.00 0.30 5.03 1.18 0.00 0.30 1.18 0.59 1.48 0.89 0.687 (0.025) 8.28
HTC-Hill Tribe Cremating
Kanikaran 17 0.00 0.00 11.76 5.88 0.00 29.41 0.00 0.00 0.00 0.00 0.00 0.00 23.53 0.00 0.00 0.00 5.88 5.88 5.88 5.88 0.875 (0.058) 5.88
Thoda 26 7.69 0.00 3.85 0.00 0.00 11.54 0.00 0.00 0.00 0.00 38.46 0.00 7.69 3.85 3.85 3.85 0.00 0.00 0.00 11.54 0.834 (0.061) 7.69
Kota 62 0.00 0.00 8.06 0.00 1.61 30.65 0.00 0.00 0.00 0.00 6.45 1.61 0.00 0.00 0.00 0.00 4.84 4.84 22.58 19.35 0.815 (0.026) 0.00
HTC Total 105 1.9 0.00 7.62 0.95 0.95 25.71 0.00 0.00 0.00 0.00 13.33 0.95 5.71 0.95 0.95 0.95 3.81 3.81 14.29 15.24 0.867 (0.016) 2.86
HTK-Hill Tribe Kannada
Betta Kurumba 17 0.00 0.00 58.82 0.00 0.00 11.76 0.00 0.00 0.00 0.00 0.00 0.00 17.65 0.00 0.00 0.00 0.00 0.00 5.88 5.88 0.640 (0.116) 0.00
Kattunaickan 46 2.17 0.00 21.74 0.00 17.39 41.3 0.00 0.00 2.17 0.00 0.00 0.00 0.00 0.00 0.00 0.00 2.17 4.35 0.00 4.35 0.761 (0.044) 4.35
Kurumba 35 2.86 0.00 11.43 0.00 2.86 65.71 0.00 0.00 0.00 0.00 0.00 2.86 5.71 0.00 0.00 0.00 0.00 0.00 2.86 5.71 0.561 (0.096) 0.00
Mullukurumba 29 0.00 0.00 20.69 0.00 0.00 34.48 0.00 0.00 0.00 0.00 0.00 3.45 24.14 0.00 0.00 0.00 0.00 0.00 0.00 17.24 0.776 (0.036) 0.00
HTK Total 127 1.57 0.00 23.62 0.00 7.09 42.52 0.00 0.00 0.79 0.00 0.00 1.57 9.45 0.00 0.00 0.00 0.79 1.57 1.57 7.87 0.748 (0.028) 1.57
SC-Schedule Caste
Parayar NTN 52 7.69 0.00 3.85 1.92 3.85 34.62 0.00 0.00 0.00 0.00 0.00 0.00 9.62 1.92 1.92 0.00 1.92 1.92 3.85 9.62 0.836 (0.037) 17.31
Parayar 24 4.17 0.00 0.00 8.33 0.00 20.83 0.00 0.00 4.17 0.00 0.00 0.00 12.50 4.17 4.17 0.00 0.00 8.33 12.50 8.33 0.920 (0.029) 12.50
Pallar 51 1.96 0.00 5.88 7.84 5.88 11.76 0.00 1.96 0.00 0.00 1.96 0.00 15.69 5.88 0.00 0.00 1.96 1.96 13.73 9.80 0.914 (0.015) 13.73
Paravar 27 0.00 0.00 3.70 0.00 0.00 14.81 0.00 0.00 0.00 0.00 0.00 0.00 18.52 0.00 7.41 0.00 0.00 3.70 3.70 11.11 0.815 (0.052) 37.04
SC Total 154 3.9 0.00 3.90 4.55 3.25 21.43 0.00 0.65 0.65 0.00 0.65 0.00 13.64 3.25 2.60 0.00 1.30 3.25 8.44 9.74 0.880 (0.012) 18.83
DLF-Dry Land Farmers
Yadhava 107 2.80 0.00 5.61 1.87 3.74 19.63 0.00 0.00 0.00 0.00 0.00 1.87 20.56 0.00 0.93 0.00 0.00 0.93 14.95 10.28 0.860 (0.013) 16.82
Vanniyar 21 0.00 0.00 9.52 4.76 0.00 4.76 0.00 0.00 0.00 0.00 9.52 0.00 28.57 0.00 0.00 0.00 0.00 0.00 14.29 14.29 0.876 (0.043) 14.29
Vanniyar NTN 96 7.29 1.04 8.33 3.13 3.13 13.54 0.00 3.13 0.00 0.00 2.08 0.00 23.96 2.08 2.08 0.00 0.00 2.08 11.46 9.38 0.889 (0.016) 7.29
Nadar TNV 59 0.00 0.00 8.47 8.47 11.86 15.25 0.00 1.69 0.00 0.00 0.00 0.00 28.81 0.00 0.00 0.00 3.39 0.00 6.78 10.17 0.861 (0.025) 5.08
Nadar Cape 98 4.08 4.08 5.10 9.18 7.14 7.14 0.00 1.02 0.00 0.00 1.02 0.00 23.47 0.00 1.02 1.02 9.18 1.02 12.24 4.08 0.895 (0.015) 9.18
Piramalai Kallar 53 9.43 0.00 5.66 3.77 3.77 16.98 0.00 1.89 0.00 0.00 0.00 1.89 47.17 1.89 0.00 0.00 0.00 0.00 1.89 3.77 0.745 (0.055) 1.89
Maravar 80 0.00 0.00 3.75 8.75 5.00 10.00 1.25 1.25 0.00 0.00 0.00 3.75 10.00 0.00 1.25 0.00 2.50 7.50 16.25 15.00 0.904 (0.011) 13.75
DLF Total 514 3.70 0.97 6.23 5.64 5.25 13.23 0.19 1.36 0.00 0.00 0.97 1.17 24.12 0.58 0.97 0.19 2.53 1.95 11.67 9.14 0.881 (0.007) 10.12
AW-Artisan Warriors
Valayar 95 6.32 0.00 12.63 2.11 8.42 10.53 0.00 1.05 0.00 0.00 0.00 0.00 8.42 2.11 0.00 2.11 1.05 1.05 20 15.79 0.890 (0.012) 8.42
Genetic
Structu
reofSo
uthern
Indian
Populatio
ns
PLO
SONE|www.plosone.org
7November2012
|Volume7
|Issu
e11
|e50269
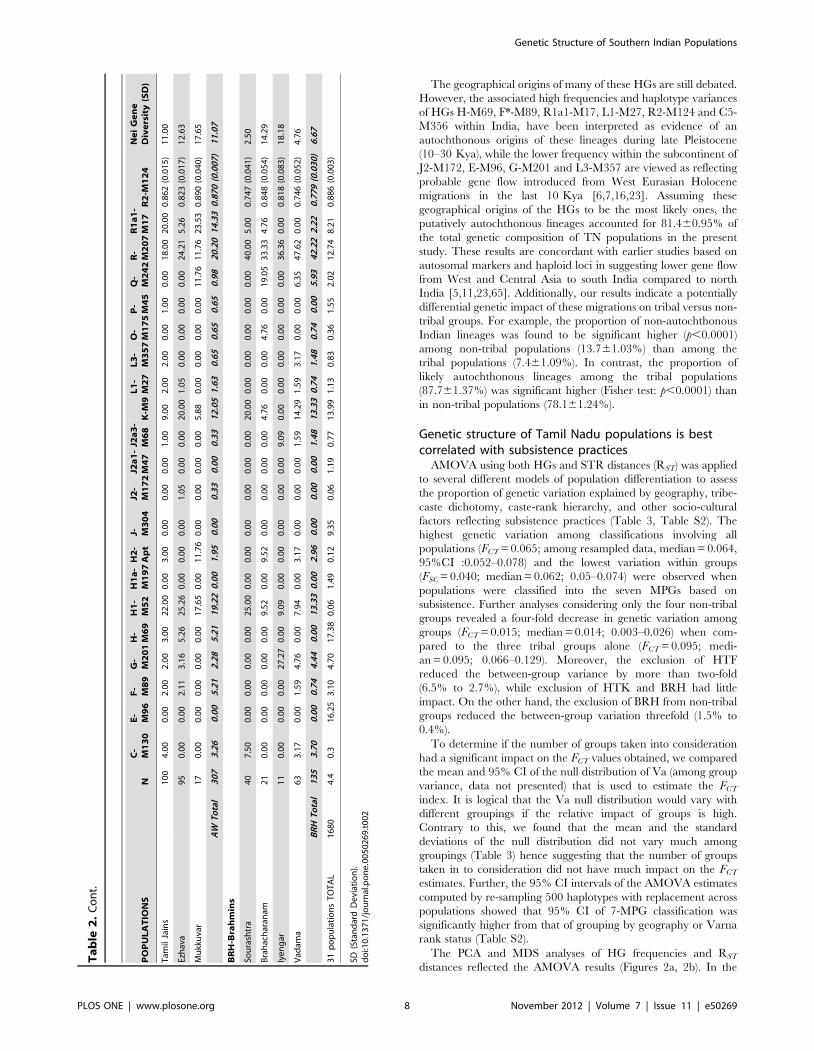
The geographical origins of many of these HGs are still debated.
However, the associated high frequencies and haplotype variances
of HGs H-M69, F*-M89, R1a1-M17, L1-M27, R2-M124 and C5-
M356 within India, have been interpreted as evidence of an
autochthonous origins of these lineages during late Pleistocene
(10–30 Kya), while the lower frequency within the subcontinent of
J2-M172, E-M96, G-M201 and L3-M357 are viewed as reflecting
probable gene flow introduced from West Eurasian Holocene
migrations in the last 10 Kya [6,7,16,23]. Assuming these
geographical origins of the HGs to be the most likely ones, the
putatively autochthonous lineages accounted for 81.460.95% of
the total genetic composition of TN populations in the present
study. These results are concordant with earlier studies based on
autosomal markers and haploid loci in suggesting lower gene flow
from West and Central Asia to south India compared to north
India [5,11,23,65]. Additionally, our results indicate a potentially
differential genetic impact of these migrations on tribal versus non-
tribal groups. For example, the proportion of non-autochthonous
Indian lineages was found to be significant higher (p,0.0001)
among non-tribal populations (13.761.03%) than among the
tribal populations (7.461.09%). In contrast, the proportion of
likely autochthonous lineages among the tribal populations
(87.761.37%) was significant higher (Fisher test: p,0.0001) than
in non-tribal populations (78.161.24%).
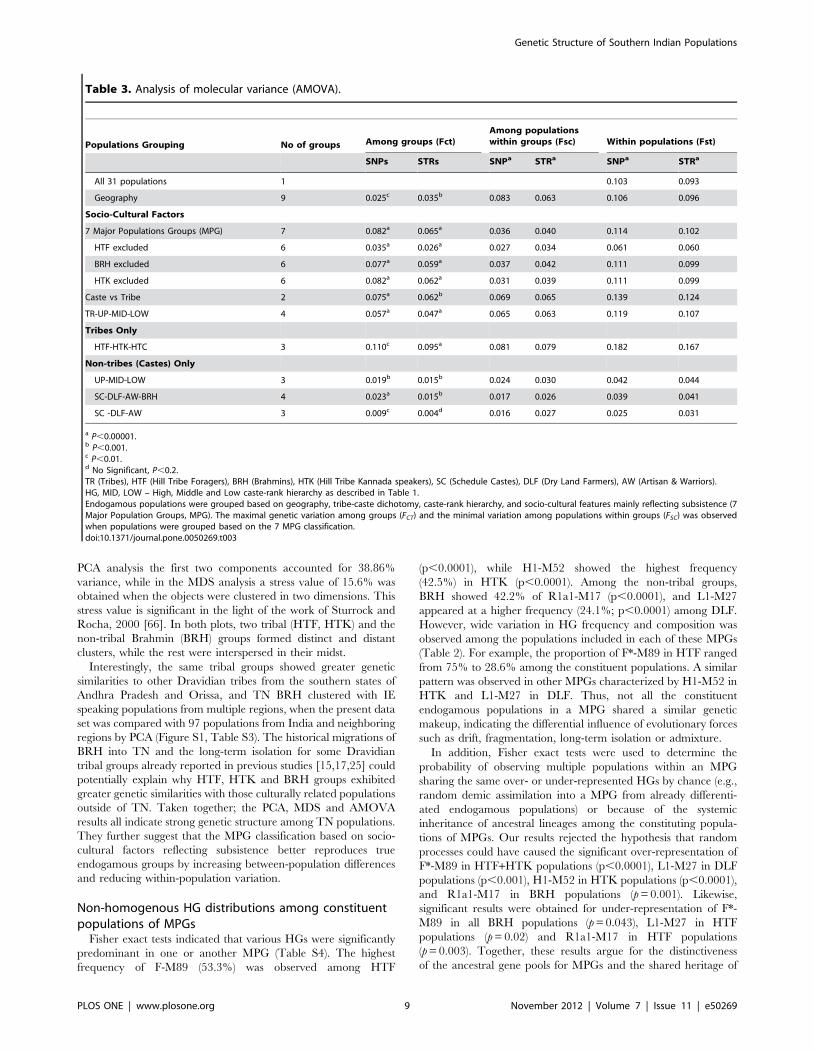
Genetic structure of Tamil Nadu populations is bestcorrelated with subsistence practicesAMOVA using both HGs and STR distances (RST) was applied
to several different models of population differentiation to assess
the proportion of genetic variation explained by geography, tribe-
caste dichotomy, caste-rank hierarchy, and other socio-cultural
factors reflecting subsistence practices (Table 3, Table S2). The
highest genetic variation among classifications involving all
populations (FCT=0.065; among resampled data, median = 0.064,
95%CI :0.052–0.078) and the lowest variation within groups
(FSC=0.040; median= 0.062; 0.05–0.074) were observed when
populations were classified into the seven MPGs based on
subsistence. Further analyses considering only the four non-tribal
groups revealed a four-fold decrease in genetic variation among
groups (FCT=0.015; median = 0.014; 0.003–0.026) when com-
pared to the three tribal groups alone (FCT=0.095; medi-
an = 0.095; 0.066–0.129). Moreover, the exclusion of HTF
reduced the between-group variance by more than two-fold
(6.5% to 2.7%), while exclusion of HTK and BRH had little
impact. On the other hand, the exclusion of BRH from non-tribal
groups reduced the between-group variation threefold (1.5% to
0.4%).
To determine if the number of groups taken into consideration
had a significant impact on the FCT values obtained, we compared
the mean and 95% CI of the null distribution of Va (among group
variance, data not presented) that is used to estimate the FCTindex. It is logical that the Va null distribution would vary with
different groupings if the relative impact of groups is high.
Contrary to this, we found that the mean and the standard
deviations of the null distribution did not vary much among
groupings (Table 3) hence suggesting that the number of groups
taken in to consideration did not have much impact on the FCTestimates. Further, the 95% CI intervals of the AMOVA estimates
computed by re-sampling 500 haplotypes with replacement across
populations showed that 95% CI of 7-MPG classification was
significantly higher from that of grouping by geography or Varna
rank status (Table S2).
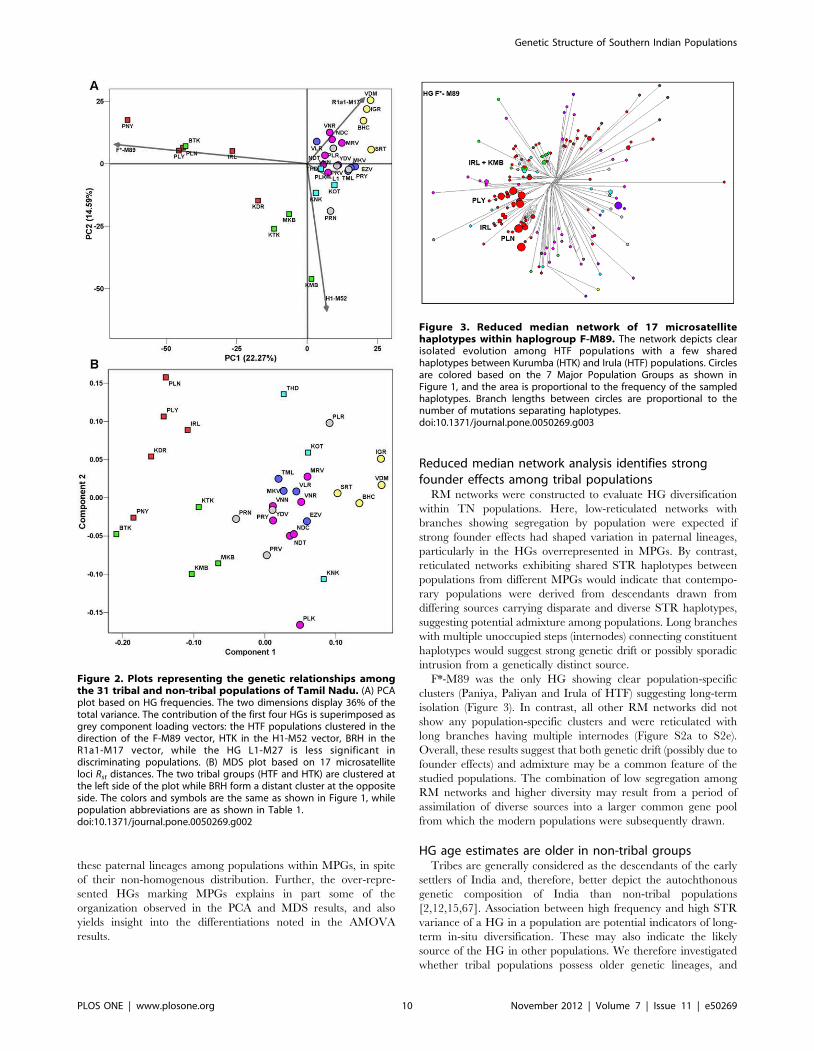
The PCA and MDS analyses of HG frequencies and RST
distances reflected the AMOVA results (Figures 2a, 2b). In the
Table
2.Cont.
POPULATIO
NS
N
C-
M130
E-
M96
F-
M89
G-
M201
H-
M69
H1-
M52
H1a-
M197
H2-
Apt
J- M304
J2-
M172
J2a1-
M47
J2a3-
M68
K-M
9
L1-
M27
L3-
M357
O-
M175
P-
M45
Q-
M242
R-
M207
R1a1-
M17
R2-M
124
NeiGene
Diversity(SD)
Tam
ilJains
100
4.00
0.00
2.00
2.00
3.00
22.00
0.00
3.00
0.00
0.00
0.00
1.00
9.00
2.00
2.00
0.00
1.00
0.00
18.00
20.00
0.862(0.015)
11.00
Ezhava
95
0.00
0.00
2.11
3.16
5.26
25.26
0.00
0.00
0.00
1.05
0.00
0.00
20.00
1.05
0.00
0.00
0.00
0.00
24.21
5.26
0.823(0.017)
12.63
Mukkuvar
17
0.00
0.00
0.00
0.00
0.00
17.65
0.00
11.76
0.00
0.00
0.00
0.00
5.88
0.00
0.00
0.00
0.00
11.76
11.76
23.53
0.890(0.040)
17.65
AW
Total
307
3.26
0.00
5.21
2.28
5.21
19.22
0.00
1.95
0.00
0.33
0.00
0.33
12.05
1.63
0.65
0.65
0.65
0.98
20.20
14.33
0.870(0.007)
11.07
BRH-Brahmins
Sourashtra
40
7.50
0.00
0.00
0.00
0.00
25.00
0.00
0.00
0.00
0.00
0.00
0.00
20.00
0.00
0.00
0.00
0.00
0.00
40.00
5.00
0.747(0.041)
2.50
Brahacharan
am21
0.00
0.00
0.00
0.00
0.00
9.52
0.00
9.52
0.00
0.00
0.00
0.00
4.76
0.00
0.00
4.76
0.00
19.05
33.33
4.76
0.848(0.054)
14.29
Iyengar
11
0.00
0.00
0.00
27.27
0.00
9.09
0.00
0.00
0.00
0.00
0.00
9.09
0.00
0.00
0.00
0.00
0.00
0.00
36.36
0.00
0.818(0.083)
18.18
Vad
ama
63
3.17
0.00
1.59
4.76
0.00
7.94
0.00
3.17
0.00
0.00
0.00
1.59
14.29
1.59
3.17
0.00
0.00
6.35
47.62
0.00
0.746(0.052)
4.76
BRH
Total
135
3.70
0.00
0.74
4.44
0.00
13.33
0.00
2.96
0.00
0.00
0.00
1.48
13.33
0.74
1.48
0.74
0.00
5.93
42.22
2.22
0.779(0.030)
6.67
31populationsTOTAL
1680
4.4
0.3
16.25
3.10
4.70
17.38
0.06
1.49
0.12
9.35
0.06
1.19
0.77
13.99
1.13
0.83
0.36
1.55
2.02
12.74
8.21
0.886(0.003)
SD(StandardDeviation).
doi:10.1371/journal.pone.0050269.t002
Genetic Structure of Southern Indian Populations
PLOS ONE | www.plosone.org 8 November 2012 | Volume 7 | Issue 11 | e50269
PCA analysis the first two components accounted for 38.86%
variance, while in the MDS analysis a stress value of 15.6% was
obtained when the objects were clustered in two dimensions. This
stress value is significant in the light of the work of Sturrock and
Rocha, 2000 [66]. In both plots, two tribal (HTF, HTK) and the
non-tribal Brahmin (BRH) groups formed distinct and distant
clusters, while the rest were interspersed in their midst.
Interestingly, the same tribal groups showed greater genetic
similarities to other Dravidian tribes from the southern states of
Andhra Pradesh and Orissa, and TN BRH clustered with IE
speaking populations from multiple regions, when the present data
set was compared with 97 populations from India and neighboring
regions by PCA (Figure S1, Table S3). The historical migrations of
BRH into TN and the long-term isolation for some Dravidian
tribal groups already reported in previous studies [15,17,25] could
potentially explain why HTF, HTK and BRH groups exhibited
greater genetic similarities with those culturally related populations
outside of TN. Taken together; the PCA, MDS and AMOVA
results all indicate strong genetic structure among TN populations.
They further suggest that the MPG classification based on socio-
cultural factors reflecting subsistence better reproduces true
endogamous groups by increasing between-population differences
and reducing within-population variation.
Non-homogenous HG distributions among constituentpopulations of MPGsFisher exact tests indicated that various HGs were significantly
predominant in one or another MPG (Table S4). The highest
frequency of F-M89 (53.3%) was observed among HTF
(p,0.0001), while H1-M52 showed the highest frequency
(42.5%) in HTK (p,0.0001). Among the non-tribal groups,
BRH showed 42.2% of R1a1-M17 (p,0.0001), and L1-M27
appeared at a higher frequency (24.1%; p,0.0001) among DLF.
However, wide variation in HG frequency and composition was
observed among the populations included in each of these MPGs
(Table 2). For example, the proportion of F*-M89 in HTF ranged
from 75% to 28.6% among the constituent populations. A similar
pattern was observed in other MPGs characterized by H1-M52 in
HTK and L1-M27 in DLF. Thus, not all the constituent
endogamous populations in a MPG shared a similar genetic
makeup, indicating the differential influence of evolutionary forces
such as drift, fragmentation, long-term isolation or admixture.
In addition, Fisher exact tests were used to determine the
probability of observing multiple populations within an MPG
sharing the same over- or under-represented HGs by chance (e.g.,
random demic assimilation into a MPG from already differenti-
ated endogamous populations) or because of the systemic
inheritance of ancestral lineages among the constituting popula-
tions of MPGs. Our results rejected the hypothesis that random
processes could have caused the significant over-representation of
F*-M89 in HTF+HTK populations (p,0.0001), L1-M27 in DLF
populations (p,0.001), H1-M52 in HTK populations (p,0.0001),
and R1a1-M17 in BRH populations (p=0.001). Likewise,
significant results were obtained for under-representation of F*-
M89 in all BRH populations (p=0.043), L1-M27 in HTF
populations (p=0.02) and R1a1-M17 in HTF populations
(p=0.003). Together, these results argue for the distinctiveness
of the ancestral gene pools for MPGs and the shared heritage of
Table 3. Analysis of molecular variance (AMOVA).
Populations Grouping No of groups Among groups (Fct)
Among populations
within groups (Fsc) Within populations (Fst)
SNPs STRs SNPa STRa SNPa STRa
All 31 populations 1 0.103 0.093
Geography 9 0.025c 0.035b 0.083 0.063 0.106 0.096
Socio-Cultural Factors
7 Major Populations Groups (MPG) 7 0.082a 0.065a 0.036 0.040 0.114 0.102
HTF excluded 6 0.035a 0.026a 0.027 0.034 0.061 0.060
BRH excluded 6 0.077a 0.059a 0.037 0.042 0.111 0.099
HTK excluded 6 0.082a 0.062a 0.031 0.039 0.111 0.099
Caste vs Tribe 2 0.075a 0.062b 0.069 0.065 0.139 0.124
TR-UP-MID-LOW 4 0.057a 0.047a 0.065 0.063 0.119 0.107
Tribes Only
HTF-HTK-HTC 3 0.110c 0.095a 0.081 0.079 0.182 0.167
Non-tribes (Castes) Only
UP-MID-LOW 3 0.019b 0.015b 0.024 0.030 0.042 0.044
SC-DLF-AW-BRH 4 0.023a 0.015b 0.017 0.026 0.039 0.041
SC -DLF-AW 3 0.009c 0.004d 0.016 0.027 0.025 0.031
aP,0.00001.
bP,0.001.
cP,0.01.
d No Significant, P,0.2.TR (Tribes), HTF (Hill Tribe Foragers), BRH (Brahmins), HTK (Hill Tribe Kannada speakers), SC (Schedule Castes), DLF (Dry Land Farmers), AW (Artisan & Warriors).HG, MID, LOW – High, Middle and Low caste-rank hierarchy as described in Table 1.Endogamous populations were grouped based on geography, tribe-caste dichotomy, caste-rank hierarchy, and socio-cultural features mainly reflecting subsistence (7Major Population Groups, MPG). The maximal genetic variation among groups (FCT) and the minimal variation among populations within groups (FSC) was observedwhen populations were grouped based on the 7 MPG classification.doi:10.1371/journal.pone.0050269.t003
Genetic Structure of Southern Indian Populations
PLOS ONE | www.plosone.org 9 November 2012 | Volume 7 | Issue 11 | e50269
these paternal lineages among populations within MPGs, in spite
of their non-homogenous distribution. Further, the over-repre-
sented HGs marking MPGs explains in part some of the
organization observed in the PCA and MDS results, and also
yields insight into the differentiations noted in the AMOVA
results.
Reduced median network analysis identifies strongfounder effects among tribal populationsRM networks were constructed to evaluate HG diversification
within TN populations. Here, low-reticulated networks with
branches showing segregation by population were expected if
strong founder effects had shaped variation in paternal lineages,
particularly in the HGs overrepresented in MPGs. By contrast,
reticulated networks exhibiting shared STR haplotypes between
populations from different MPGs would indicate that contempo-
rary populations were derived from descendants drawn from
differing sources carrying disparate and diverse STR haplotypes,
suggesting potential admixture among populations. Long branches
with multiple unoccupied steps (internodes) connecting constituent
haplotypes would suggest strong genetic drift or possibly sporadic
intrusion from a genetically distinct source.
F*-M89 was the only HG showing clear population-specific
clusters (Paniya, Paliyan and Irula of HTF) suggesting long-term
isolation (Figure 3). In contrast, all other RM networks did not
show any population-specific clusters and were reticulated with
long branches having multiple internodes (Figure S2a to S2e).
Overall, these results suggest that both genetic drift (possibly due to
founder effects) and admixture may be a common feature of the
studied populations. The combination of low segregation among
RM networks and higher diversity may result from a period of
assimilation of diverse sources into a larger common gene pool
from which the modern populations were subsequently drawn.
HG age estimates are older in non-tribal groupsTribes are generally considered as the descendants of the early
settlers of India and, therefore, better depict the autochthonous
genetic composition of India than non-tribal populations
[2,12,15,67]. Association between high frequency and high STR
variance of a HG in a population are potential indicators of long-
term in-situ diversification. These may also indicate the likely
source of the HG in other populations. We therefore investigated
whether tribal populations possess older genetic lineages, and
Figure 2. Plots representing the genetic relationships amongthe 31 tribal and non-tribal populations of Tamil Nadu. (A) PCAplot based on HG frequencies. The two dimensions display 36% of thetotal variance. The contribution of the first four HGs is superimposed asgrey component loading vectors: the HTF populations clustered in thedirection of the F-M89 vector, HTK in the H1-M52 vector, BRH in theR1a1-M17 vector, while the HG L1-M27 is less significant indiscriminating populations. (B) MDS plot based on 17 microsatelliteloci Rst distances. The two tribal groups (HTF and HTK) are clustered atthe left side of the plot while BRH form a distant cluster at the oppositeside. The colors and symbols are the same as shown in Figure 1, whilepopulation abbreviations are as shown in Table 1.doi:10.1371/journal.pone.0050269.g002
Figure 3. Reduced median network of 17 microsatellitehaplotypes within haplogroup F-M89. The network depicts clearisolated evolution among HTF populations with a few sharedhaplotypes between Kurumba (HTK) and Irula (HTF) populations. Circlesare colored based on the 7 Major Population Groups as shown inFigure 1, and the area is proportional to the frequency of the sampledhaplotypes. Branch lengths between circles are proportional to thenumber of mutations separating haplotypes.doi:10.1371/journal.pone.0050269.g003
Genetic Structure of Southern Indian Populations
PLOS ONE | www.plosone.org 10 November 2012 | Volume 7 | Issue 11 | e50269
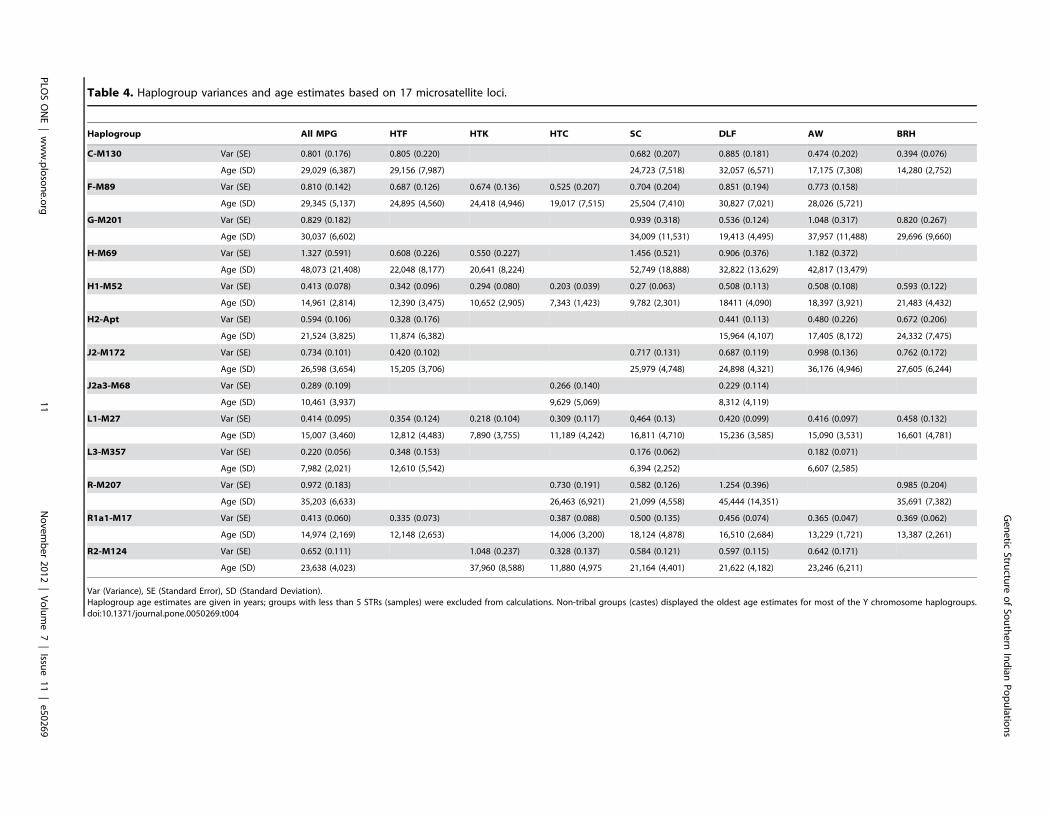
Table 4. Haplogroup variances and age estimates based on 17 microsatellite loci.
Haplogroup All MPG HTF HTK HTC SC DLF AW BRH
C-M130 Var (SE) 0.801 (0.176) 0.805 (0.220) 0.682 (0.207) 0.885 (0.181) 0.474 (0.202) 0.394 (0.076)
Age (SD) 29,029 (6,387) 29,156 (7,987) 24,723 (7,518) 32,057 (6,571) 17,175 (7,308) 14,280 (2,752)
F-M89 Var (SE) 0.810 (0.142) 0.687 (0.126) 0.674 (0.136) 0.525 (0.207) 0.704 (0.204) 0.851 (0.194) 0.773 (0.158)
Age (SD) 29,345 (5,137) 24,895 (4,560) 24,418 (4,946) 19,017 (7,515) 25,504 (7,410) 30,827 (7,021) 28,026 (5,721)
G-M201 Var (SE) 0.829 (0.182) 0.939 (0.318) 0.536 (0.124) 1.048 (0.317) 0.820 (0.267)
Age (SD) 30,037 (6,602) 34,009 (11,531) 19,413 (4,495) 37,957 (11,488) 29,696 (9,660)
H-M69 Var (SE) 1.327 (0.591) 0.608 (0.226) 0.550 (0.227) 1.456 (0.521) 0.906 (0.376) 1.182 (0.372)
Age (SD) 48,073 (21,408) 22,048 (8,177) 20,641 (8,224) 52,749 (18,888) 32,822 (13,629) 42,817 (13,479)
H1-M52 Var (SE) 0.413 (0.078) 0.342 (0.096) 0.294 (0.080) 0.203 (0.039) 0.27 (0.063) 0.508 (0.113) 0.508 (0.108) 0.593 (0.122)
Age (SD) 14,961 (2,814) 12,390 (3,475) 10,652 (2,905) 7,343 (1,423) 9,782 (2,301) 18411 (4,090) 18,397 (3,921) 21,483 (4,432)
H2-Apt Var (SE) 0.594 (0.106) 0.328 (0.176) 0.441 (0.113) 0.480 (0.226) 0.672 (0.206)
Age (SD) 21,524 (3,825) 11,874 (6,382) 15,964 (4,107) 17,405 (8,172) 24,332 (7,475)
J2-M172 Var (SE) 0.734 (0.101) 0.420 (0.102) 0.717 (0.131) 0.687 (0.119) 0.998 (0.136) 0.762 (0.172)
Age (SD) 26,598 (3,654) 15,205 (3,706) 25,979 (4,748) 24,898 (4,321) 36,176 (4,946) 27,605 (6,244)
J2a3-M68 Var (SE) 0.289 (0.109) 0.266 (0.140) 0.229 (0.114)
Age (SD) 10,461 (3,937) 9,629 (5,069) 8,312 (4,119)
L1-M27 Var (SE) 0.414 (0.095) 0.354 (0.124) 0.218 (0.104) 0.309 (0.117) 0,464 (0.13) 0.420 (0.099) 0.416 (0.097) 0.458 (0.132)
Age (SD) 15,007 (3,460) 12,812 (4,483) 7,890 (3,755) 11,189 (4,242) 16,811 (4,710) 15,236 (3,585) 15,090 (3,531) 16,601 (4,781)
L3-M357 Var (SE) 0.220 (0.056) 0.348 (0.153) 0.176 (0.062) 0.182 (0.071)
Age (SD) 7,982 (2,021) 12,610 (5,542) 6,394 (2,252) 6,607 (2,585)
R-M207 Var (SE) 0.972 (0.183) 0.730 (0.191) 0.582 (0.126) 1.254 (0.396) 0.985 (0.204)
Age (SD) 35,203 (6,633) 26,463 (6,921) 21,099 (4,558) 45,444 (14,351) 35,691 (7,382)
R1a1-M17 Var (SE) 0.413 (0.060) 0.335 (0.073) 0.387 (0.088) 0.500 (0.135) 0.456 (0.074) 0.365 (0.047) 0.369 (0.062)
Age (SD) 14,974 (2,169) 12,148 (2,653) 14,006 (3,200) 18,124 (4,878) 16,510 (2,684) 13,229 (1,721) 13,387 (2,261)
R2-M124 Var (SE) 0.652 (0.111) 1.048 (0.237) 0.328 (0.137) 0.584 (0.121) 0.597 (0.115) 0.642 (0.171)
Age (SD) 23,638 (4,023) 37,960 (8,588) 11,880 (4,975 21,164 (4,401) 21,622 (4,182) 23,246 (6,211)
Var (Variance), SE (Standard Error), SD (Standard Deviation).Haplogroup age estimates are given in years; groups with less than 5 STRs (samples) were excluded from calculations. Non-tribal groups (castes) displayed the oldest age estimates for most of the Y chromosome haplogroups.doi:10.1371/journal.pone.0050269.t004
Genetic
Structu
reofSo
uthern
Indian
Populatio
ns
PLO
SONE|www.plosone.org
11
November2012
|Volume7
|Issu
e11
|e50269
could thus be the potential sources of these lineages for other
populations, by computing HG age estimates based on Y-STR
variances (Table 4). The age estimates for all HGs exceeded 10–
15 Kya with overlapping confidence intervals among MPGs.
Further, MPG exhibiting high frequencies of specific HGs did not
show the oldest age estimates. Interestingly, non-tribal groups
exhibited older age estimates than tribal groups for all HGs,
excepting R2-M124. These results indicated that tribal and non-
tribal populations share a genetic heritage dating back to at least
the late Pleistocene (10–30 Kya). The HG age estimates presented
here are similar to those generated for the same HGs in earlier
studies involving a similar or lesser number of samples taken from
a broader geographic region of India [7,23].
BATWING estimates of genetic affinity and ancestryWe configured several BATWING runs using different subsets
of data to estimate the dates of population differentiation and
explore the different demographic processes and affinities among
the MPGs and their constituent populations. The first set of
BATWING runs analyzed haplotypes from all HGs among all of
the MPGs to investigate whether tribal and non-tribal MPGs have
an independent origin or instead descended from a common
ancestral gene pool. If tribal and non-tribal groups have
independent origins, then it would be expected that population
tree bifurcations marking the differentiation of these two groupings
would exhibit very old divergence time estimates and non-
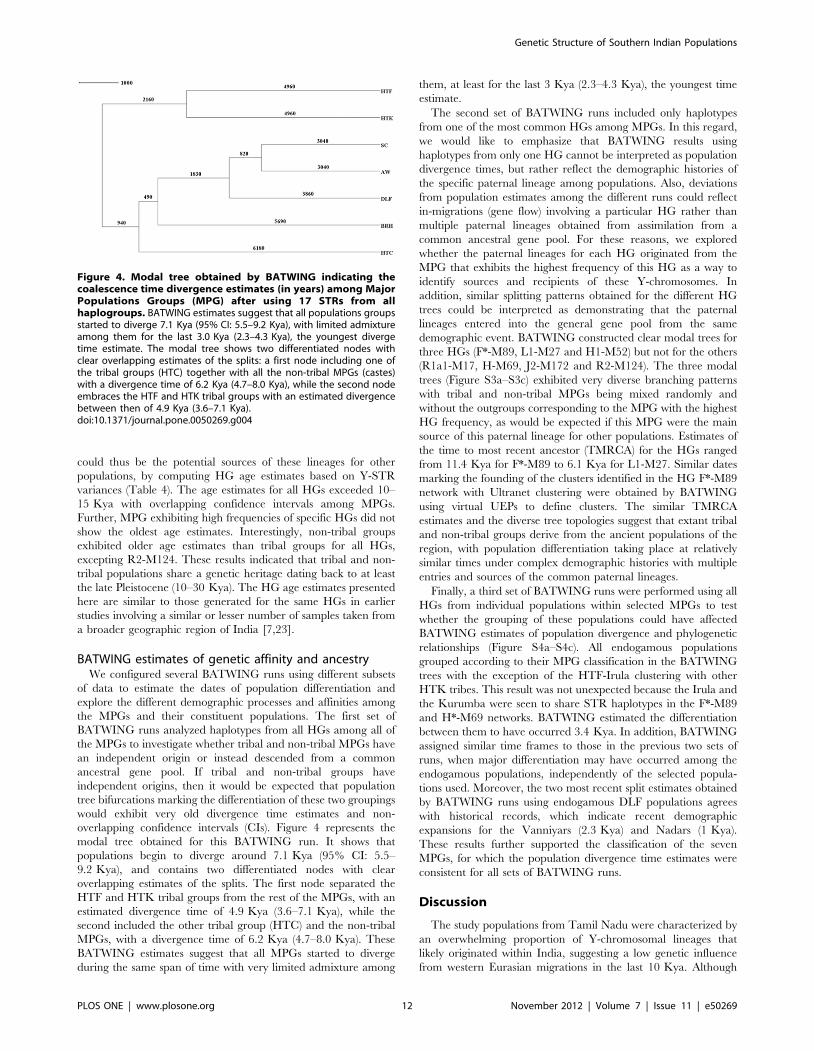
overlapping confidence intervals (CIs). Figure 4 represents the
modal tree obtained for this BATWING run. It shows that
populations begin to diverge around 7.1 Kya (95% CI: 5.5–
9.2 Kya), and contains two differentiated nodes with clear
overlapping estimates of the splits. The first node separated the
HTF and HTK tribal groups from the rest of the MPGs, with an
estimated divergence time of 4.9 Kya (3.6–7.1 Kya), while the
second included the other tribal group (HTC) and the non-tribal
MPGs, with a divergence time of 6.2 Kya (4.7–8.0 Kya). These
BATWING estimates suggest that all MPGs started to diverge
during the same span of time with very limited admixture among
them, at least for the last 3 Kya (2.3–4.3 Kya), the youngest time
estimate.
The second set of BATWING runs included only haplotypes
from one of the most common HGs among MPGs. In this regard,
we would like to emphasize that BATWING results using
haplotypes from only one HG cannot be interpreted as population
divergence times, but rather reflect the demographic histories of
the specific paternal lineage among populations. Also, deviations
from population estimates among the different runs could reflect
in-migrations (gene flow) involving a particular HG rather than
multiple paternal lineages obtained from assimilation from a
common ancestral gene pool. For these reasons, we explored
whether the paternal lineages for each HG originated from the
MPG that exhibits the highest frequency of this HG as a way to
identify sources and recipients of these Y-chromosomes. In
addition, similar splitting patterns obtained for the different HG
trees could be interpreted as demonstrating that the paternal
lineages entered into the general gene pool from the same
demographic event. BATWING constructed clear modal trees for
three HGs (F*-M89, L1-M27 and H1-M52) but not for the others
(R1a1-M17, H-M69, J2-M172 and R2-M124). The three modal
trees (Figure S3a–S3c) exhibited very diverse branching patterns
with tribal and non-tribal MPGs being mixed randomly and
without the outgroups corresponding to the MPG with the highest
HG frequency, as would be expected if this MPG were the main
source of this paternal lineage for other populations. Estimates of
the time to most recent ancestor (TMRCA) for the HGs ranged
from 11.4 Kya for F*-M89 to 6.1 Kya for L1-M27. Similar dates
marking the founding of the clusters identified in the HG F*-M89
network with Ultranet clustering were obtained by BATWING
using virtual UEPs to define clusters. The similar TMRCA
estimates and the diverse tree topologies suggest that extant tribal
and non-tribal groups derive from the ancient populations of the
region, with population differentiation taking place at relatively
similar times under complex demographic histories with multiple
entries and sources of the common paternal lineages.
Finally, a third set of BATWING runs were performed using all
HGs from individual populations within selected MPGs to test
whether the grouping of these populations could have affected
BATWING estimates of population divergence and phylogenetic
relationships (Figure S4a–S4c). All endogamous populations
grouped according to their MPG classification in the BATWING
trees with the exception of the HTF-Irula clustering with other
HTK tribes. This result was not unexpected because the Irula and
the Kurumba were seen to share STR haplotypes in the F*-M89
and H*-M69 networks. BATWING estimated the differentiation
between them to have occurred 3.4 Kya. In addition, BATWING
assigned similar time frames to those in the previous two sets of
runs, when major differentiation may have occurred among the
endogamous populations, independently of the selected popula-
tions used. Moreover, the two most recent split estimates obtained
by BATWING runs using endogamous DLF populations agrees
with historical records, which indicate recent demographic
expansions for the Vanniyars (2.3 Kya) and Nadars (1 Kya).
These results further supported the classification of the seven
MPGs, for which the population divergence time estimates were
consistent for all sets of BATWING runs.
Discussion
The study populations from Tamil Nadu were characterized by
an overwhelming proportion of Y-chromosomal lineages that
likely originated within India, suggesting a low genetic influence
from western Eurasian migrations in the last 10 Kya. Although
Figure 4. Modal tree obtained by BATWING indicating thecoalescence time divergence estimates (in years) among MajorPopulations Groups (MPG) after using 17 STRs from allhaplogroups. BATWING estimates suggest that all populations groupsstarted to diverge 7.1 Kya (95% CI: 5.5–9.2 Kya), with limited admixtureamong them for the last 3.0 Kya (2.3–4.3 Kya), the youngest divergetime estimate. The modal tree shows two differentiated nodes withclear overlapping estimates of the splits: a first node including one ofthe tribal groups (HTC) together with all the non-tribal MPGs (castes)with a divergence time of 6.2 Kya (4.7–8.0 Kya), while the second nodeembraces the HTF and HTK tribal groups with an estimated divergencebetween then of 4.9 Kya (3.6–7.1 Kya).doi:10.1371/journal.pone.0050269.g004
Genetic Structure of Southern Indian Populations
PLOS ONE | www.plosone.org 12 November 2012 | Volume 7 | Issue 11 | e50269
non-tribal groups exhibited a slightly higher proportion of non-
autochthonous lineages than tribal populations, the common
paternal lineages shared by TN populations are likely drawn from
the same ancestral genetic pool that emerged in the late
Pleistocene and early Holocene. We also noted that the current
modes of subsistence have shaped the genetic structure of TN
groups, with non-tribal populations being more genetically
homogeneous than tribal populations likely due to differential
levels of genetic isolation among them. Coalescence methods,
employed to identify specific and distinctive periods when genetic
differentiation among populations occurred, indicated a time scale
of ,6,000 years. We discuss below whether the timing of the male
genetic differentiation of the populations fits better with arche-
ological and historical records for the implementation of the
Hindu Varna system or with agriculture expansions in the TN
region.
Endogamous social stratification preexisted the VarnasystemPrevious studies of Indian populations have grouped and
analyzed the genetic data in the light of the Hindu Varna system
[14,15,16] even though its origin and antiquity are still an ongoing
topic of debate. One of the theories that has acquired wide support
relates the establishment of the caste system to Indo-Aryan
expansions from Western Eurasia into India around 3 Kya. An
alternative view would see an earlier Indo-Aryan expansion with
an introduction of cereal farming into Pakistan/North India
around 8–7 kya. Genetic evidence reported by other studies that
support these theories are mainly based on the high frequency of
HG R1a1-M17 in Brahmin castes and their closer genetic affinity
with West Eurasian populations compared to other Indian non-
Brahmin castes and tribes [10,20]. However, admixture analyses
supporting a West Eurasian origin of the Brahmin may be biased
due to the high frequencies of R1a1-M17 shared between these
populations, as the rest of their Y-chromosomal variation shows
little similarity [6,7,16]. Moreover, the recent discovery of new
markers within R1a1-M17 has allowed Eastern European Y-
lineages to be differentiated from those in Central/South Asia,
locating the oldest expansion times with this lineage in Indus
Valley populations, suggesting an earlier, possibly autochthonous
origin of this HG in South Asia [68]. The Brahmin populations in
the present study are also characterized by a significantly higher
frequency of R1a1-M17 relative to other TN groups, but without
any significant frequencies for HGs having a likely origin outside
India. The TN Brahmin populations also present a very similar
package of the most common HGs observed in 600 Brahmin
individuals from all over India [16]. We noted that the highest
STR variances for HG R1a1-M17 observed in SC and DLF,
along with the lack of population-specific clusters in the R1a1-
M17 network and the failure of BATWING to generate a
definitive modal tree for this HG, all argue against the
introduction of these paternal haplotypes through a single wave
of Brahmin (i.e. Indo-Aryan) migration into the region.
Literary works from the Sangam period (300 BCE to 300 CE)
describes a heterogeneous society that predates incorporation of
already established populations into the Hindu Varna system [22]
in TN. Ancient Tamil society was highly structured by habitat and
occupation, where endogamy was practiced among populations
known as kudi [37]. Many of the populations, such as the Valayar
(meaning net weavers), Pulayar, Paliyan and Kadar, are cited in
the Sangam literature using the same names that are employed
today. Thus, a structured society practicing endogamy pre-existed
in TN prior to the inferred arrival of the Indo-Aryans to this
region. It is therefore most likely that the Varna system was
superimposed on the pre-existing and historically attested social
system without significant population transfer or input, imple-
menting a new social hierarchy and order during the Pallava/
Chola period from the 6th through 12th centuries CE [15,22].
However, the implementation of the Varna system may have not
been uniform across preexisting non-tribal populations since many
of the populations within DLF and tribes do not practice either
Vedic rituals or have very definite patrilineal system and clan
exogamy. Overall, our results suggest that the genetic impact of
Brahmin migrations into TN has been minimal and had no major
effect on the establishment of the genetic structure currently
detected in the region
Models of agricultural expansions in the study regioncorrelate with patterns of genetic diversityThe present study shows that the MPG classification reflects the
genetic structure of the TN populations slightly better than other
models, and that both tribal and non-tribal populations possess
predominantly autochthonous lineages derived from a common
gene pool established during the Late Pleistocene and Early
Holocene. The distribution of over- and under-represented HGs
suggests that populations within MPGs tend to share common
genetic backgrounds. Using BATWING analysis, we estimate that
social stratification for both tribal and non-tribal MPGs began
between 6 Kya and 4 Kya, and detectable admixture between
them has not occurred over the past 3 Kya, thereby allowing them
to retain their genetic identity through cultural endogamy.
Both the overall Y-chromosomal HG distribution and the
divergence estimates for tribal and non-tribal groups, are
consistent with the archaeological dates and the demographic
processes involved in the expansion of agriculture in South Asia.
The South Deccan region near southern Karnataka and southwest
Andhra Pradesh contains the earliest evidence for an integrated
agro-pastoral system in South India, and likely acted as
agricultural center and source of dispersion around 5 Kya
[30,31,34,69]. The genetic impact of the demographic processes
involved during the development and spread of agriculture in
India have been invoked under the Frontier theory framework
[30]. According to this model, agricultural groups rapidly
expanding into new environments suitable for farming created
moving frontiers where autochthonous lineages from multiple pre-
existing hunting and gathering forager populations were assimi-
lated into the new agriculturalist populations, thereby producing
centers of greater genetic diversity with less evidence of isolated
evolution than observed in foraging populations. This mechanism
was proposed by Semino et al, for convergence of multiple E-M123
founders into Turkey prior to re-expansion into Europe in order to
explain the high diversity for that haplogroup [70]. The genetic
patterns observed in this study, such as the presence of the oldest
age estimates of autochthonous HGs found among the agricul-
turalist non-tribal populations (DLF), could reflect assimilated
paternal lineages from genetically diverse pre-existing populations
into common gene pools, as well as to suggest that today’s tribal
groups are not the sole source of these lineages.
In addition to this moving frontier, broader and more static
agricultural frontier zones could also have arisen at later stages. In
this area, stable and growing farming populations interacted with
local foragers and created new cultural traditions, with some
potential inter-marriage and assimilation through trade taking
place. Southern Tamil Nadu and the Kerala zone represent one
such agricultural frontier zone that has persisted to the present
after local foragers began to adopt cultivation based on
agricultural sedentism around 3 Kya [30]. Nowadays, TN tribes
exhibit a wide variety of occupations and subsistence strategies,
Genetic Structure of Southern Indian Populations
PLOS ONE | www.plosone.org 13 November 2012 | Volume 7 | Issue 11 | e50269
and mostly inhabit the Western Ghats Mountains, which harbor
tropical and semi-tropical rain forests. In this context, two of the
three tribal groups associated with foraging lifestyles (HTF and
HTK) show the clearest signals of genetic drift, most likely due to
strong founder effects and long-term isolation. They exhibit the
lowest HG diversities (HTF: 0.687; HTK: 0.748), the highest
proportion of putative autochthonous lineages (HTF: 95.3%;
HTK: 88.5%), and the lowest ancestral effective population sizes
estimated by BATWING (results not shown). In addition, the
persistence of stronger genetic structure among HTF and HTK
tribal populations, as seen in AMOVA, PCA and MDS analyses,
suggests limited admixture with other TN populations. The
absence of any human habitation sites in the Western Ghats until
the Neolithic, and the late paleo-botanical evidence for cultivation,
suggest a relatively late occupation of these mountains [34]. It is
therefore possible that, upon agricultural expansion into previously
non-cultivated areas, the present day tribal populations were
displaced to more isolated regions, where they retained their mode
of subsistence and genetic distinctiveness until the present day.
The overall Y-chromosomal landscape of TN suggests a
complex process of agricultural expansion, which can be explained
in terms of the formation of moving and static frontiers since
6 Kya, followed by migrations structured by habitat and
occupation. However, because gene flow and differential assim-
ilation of incoming migrations could alter the estimated divergence
dates, they should be treated with caution. Our BATWING
simulations and others from a previous study [62] have shown that
topologies and population splits for modal trees are susceptible to
admixture between already differentiated populations, which
considerably reduces the times of split, but insensitive to migration
into a region bringing new paternal lineages. This means that the
divergence time estimates presented here likely reflect the latest
major admixture that occurred among the populations being
sampled from the TN region. In this regard, it is important to note
that our BATWING estimates are concordant with historical
records of major splits between two Vanniyar and between two
Nadar populations, thereby supporting the ability of BATWING
to detect recent demographic events. Thus, the main limitation of
BATWING is related to its lack of power to detect earlier
demographic events and its bias in clearly detecting recent gene
flow among the populations studied. In any case, our conclusions
supporting a common autochthonous Indian genetic heritage from
the late Pleistocene/early Holocene for both tribal and non-tribal
populations and refuting the hypothesis of the establishment of a
structured and endogamous system due to an Indo-Aryan
migration or implementation of the Varna System, still hold even
if the BATWING divergence times are underestimates.
Although previous genetic studies have already drawn some of
the conclusions presented here [6,7,16,23], this is the first time
(which we are aware of) that a genetic study showed clear
evidences of the existence of long-standing endogamous popula-
tion identities within a highly structured Indian society established
prior to the regional implementation of the Varna system. Further,
these paternal genetic identities likely resulted as a byproduct of
demographic processes that occurred during the creation of
moving and static frontiers of agricultural expansions into TN
[30,69]. The meticulous sampling strategy focused on a local area,
and comparison of genetic data with the paleoclimatic, arche-
ological, and historical background information available for the
region, allowed us to address these questions at a deeper level than
previous studies have. Moreover, this approach reduced consid-
erably the confounding relationships among socio-cultural factors
allowing us to further explore and test in detail the relationships
between ethnography and genetics. Indeed, the pattern of long-
term separation among populations within and between MPGs,
and the genetic affinities of the constituent populations within
MPGs, are significant features that would be lost if populations
were pooled by other proxies based on broad classifications such as
tribal versus non-tribal categories or Varna rank-caste hierarchy.
We were also able to show that not all of the tribal populations
reflect the oldest genetic legacy of the region and that each tribal
population has a unique and distinct evolutionary history.
Thus, the sampling and analytical approach employed here
suggest that detailed local genetic studies within India could give
us new insights about the relative influences of past demographic
events in relation to other socio-cultural and economic factors that
might have influenced the population structure of the whole of
India that is observed today. Nevertheless, it cannot be assumed
that the same demographic processes or socio-cultural factors
affected Indian populations from different regions in a similar
manner. Whether corresponding Y chromosome genetic patterns
can be also detected in other tribal and non-tribal populations
within the South Deccan or in other Indian regions that have
already been identified as centers of agricultural expansions, are
open questions that future studies could potentially address using
the methods presented here. Finally, it would also be important to
investigate the relative impact of the processes explained here on
the diversity patterns in other genomic regions by studying
mtDNA and autosomal variation.
Supporting Information
Figure S1 PCA plot showing the first two principalcomponents of haplogroup frequencies for 97 non-tribal(circles) and tribal (squares) populations of India andnearby regions from previous publications, compared tothe non-tribal (horizontal ovals) and tribal (diamonds)populations from the present study. Symbols have been
colored according to linguistic classification. Population codes and
references are shown in Table S3.
(TIF)
Figure S2 Reduced median network of 17 microsatellitehaplotypes within haplogroup. (a) HG C-M130 using 74
chromosomes, (b) HG H1-M52 using 292 chromosomes (c) HG
H- M69 using 79 chromosomes, (d) HG L1 – M27/M76 using 235
chromosomes, (e) HG R1a1-M17 using 214 chromosomes. Circles
are colored based on the 7 Major Population Groups as shown in
Figure 1, and the area is proportional to the frequency of the
sampled haplotypes. Branch lengths between circles are propor-
tional to the number of mutations separating haplotypes.
(TIFF)
Figure S3 Modal tree obtained by BATWING indicatingthe coalescence time divergence estimates (in years)among Major Populations Groups (MPG) using 17 STRsfrom haplogroup (a) F-M89, (b) H1-M52, (c) L1-M26/M72.(TIFF)
Figure S4 Modal tree obtained by BATWING indicatingthe coalescence time divergence estimates (in years)among endogamous populations within (a) HTF andHTK groups, (b) DLF, (c) BRH and HTC, using 17 STRsfrom all haplogroups.(TIFF)
Table S1 List of Y chromosome SNPS and haplotypedata for the 1680 individuals from 31 tribal and non-tribal populations presented in this study.(XLS)
Genetic Structure of Southern Indian Populations
PLOS ONE | www.plosone.org 14 November 2012 | Volume 7 | Issue 11 | e50269
Table S2 AMOVA analysis of various population group-ings based on the 17STR haplotype & 95%CI based onre-sampling of the samples across populations.(XLS)
Table S3 List of population codes and their publicationreferences used in Figure S1.(XLS)
Table S4 Fishers exact test p-values for the NRY HGfrequencies among the 7 Major Populations Groups andamong the 31 sampled populations.(XLS)
Acknowledgments
The authors gratefully acknowledge all participants from Tamil Nadu,
whose collaboration made this study possible. We thank all the field work
assistants who helped us with sampling in various expeditions. We thank
Prof N. Sukumaran and Dr. D.Ramesh for their help in sampling logistics
at Tirunelveli and north Tamil Nadu, respectively. We thank Chella
Software, Madurai, for developing and providing the ‘‘Input’’ programs for
Arlequin and Network softwares. We also thank Prof. Francesc Calafell,
Late Prof. V.Sudarsen and Dr. Sumathi for helpful discussions, Dr. Peter
Forster for kindly providing the Network Publisher software and Mrs.
Mathuram for the secretarial assistance at the Madurai Genographic
Center.
Genographic Consortium MembersChristina J. Adler (University of Adelaide, South Australia, Australia),
Elena Balanovska (Research Centre for Medical Genetics, Russian
Academy of Medical Sciences, Moscow, Russia), Oleg Balanovsky
(Research Centre for Medical Genetics, Russian Academy of Medical
Sciences, Moscow, Russia), Jaume Bertranpetit (Universitat Pompeu
Fabra, Barcelona, Spain), Andrew C. Clarke (University of Otago,
Dunedin, New Zealand), David Comas (Universitat Pompeu Fabra,
Barcelona, Spain), Alan Cooper (University of Adelaide, South Australia,
Australia), Clio S. I. Der Sarkissian (University of Adelaide, South
Australia, Australia), Matthew C. Dulik (University of Pennsylvania,
Philadelphia, Pennsylvania, United States), Jill B. Gaieski (University of
Pennsylvania, Philadelphia, Pennsylvania, United States), Wolfgang Haak
(University of Adelaide, South Australia, Australia), Marc Haber (Lebanese
American University, Chouran, Beirut, Lebanon), Angela Hobbs (National
Health Laboratory Service, Johannesburg, South Africa), Asif Javed (IBM,
Yorktown Heights, New York, United States), Li Jin (Fudan University,
Shanghai, China), Matthew E. Kaplan (University of Arizona, Tucson,
Arizona, United States), Shilin Li (Fudan University, Shanghai, China),
Begona Martınez-Cruz (Universitat Pompeu Fabra, Barcelona, Spain),
Elizabeth A. Matisoo-Smith (University of Otago, Dunedin, New Zealand),
Marta Mele (Universitat Pompeu Fabra, Barcelona, Spain), Nirav C.
Merchant (University of Arizona, Tucson, Arizona, United States), R. John
Mitchell (La Trobe University, Melbourne, Victoria, Australia), Amanda
C. Owings (University of Pennsylvania, Philadelphia, Pennsylvania, United
States), Lluis Quintana-Murci (Institut Pasteur, Paris, France), Daniela R.
Lacerda (Universidade Federal de Minas Gerais, Belo Horizonte, Minas
Gerais, Brazil), Fabrıcio R. Santos (Universidade Federal de Minas Gerais,
Belo Horizonte, Minas Gerais, Brazil), Himla Soodyall (National Health
Laboratory Service, Johannesburg, South Africa), Pandikumar Swamik-
rishnan (IBM, Somers, New York, United States), Pedro Paulo Vieira
(Universidade Federal do Rio de Janeiro, Rio de Janeiro, Brazil), Miguel
G. Vilar (University of Pennsylvania, Philadelphia, Pennsylvania, United
States), Pierre A. Zalloua (Lebanese American University, Chouran,
Beirut, Lebanon).
Author Contributions
Conceived and designed the experiments: VJK AKR RSW RMP.
Performed the experiments: GA VJK VSA AS KSA JSZ RMP. Analyzed
the data: GA VJK DFSH LP CTS DEP RMP. Contributed reagents/
materials/analysis tools: DFSH JSZ LP DEP. Wrote the paper: GA DFSH
CR TGS CTS DEP RMP. Field work, sample identification and collection
of samples and demographic data: GA VJK VSA AS KSA KTG KV MN
MJ RMP.
References
1. Cavalli-Sforza LL, Menozzi P, Piazza A (1994) The History and Geography of
Human Genes. Princeton, NJ.: Princeton University Press.
2. Majumder PP (2010) The human genetic history of South Asia. Curr Biol 20:
R184–187.
3. Singh KS (2002) People of India: An Introduction, Revised edition: Oxford
Uniersity Press.
4. Metspalu M, Kivisild T, Metspalu E, Parik J, Hudjashov G, et al. (2004) Most of
the extant mtDNA boundaries in south and southwest Asia were likely shaped
during the initial settlement of Eurasia by anatomically modern humans. BMC
genetics 5: 26.
5. Kivisild T, Rootsi S, Metspalu M, Mastana S, Kaldma K, et al. (2003) The
genetic heritage of the earliest settlers persists both in Indian tribal and caste
populations. Am J Hum Genet 72: 313–332.
6. Sahoo S, Singh A, Himabindu G, Banerjee J, Sitalaximi T, et al. (2006) A
prehistory of Indian Y chromosomes: evaluating demic diffusion scenarios. Proc
Natl Acad Sci U S A 103: 843–848.
7. Sengupta S, Zhivotovsky LA, King R, Mehdi SQ, Edmonds CA, et al. (2006)
Polarity and temporality of high-resolution y-chromosome distributions in India
identify both indigenous and exogenous expansions and reveal minor genetic
influence of Central Asian pastoralists. Am J Hum Genet 78: 202–221.
8. Chaubey G, Metspalu M, Kivisild T, Villems R (2007) Peopling of South Asia:
investigating the caste-tribe continuum in India. Bioessays 29: 91–100.
9. Quintana-Murci L, Semino O, Bandelt HJ, Passarino G, McElreavey K, et al.
(1999) Genetic evidence of an early exit of Homo sapiens sapiens from Africa
through eastern Africa. Nat Genet 23: 437–441.
10. Cordaux R, Aunger R, Bentley G, Nasidze I, Sirajuddin SM, et al. (2004)
Independent origins of Indian caste and tribal paternal lineages. Curr Biol 14:
231–235.
11. Indian Genome Variation Consortium (2008) Genetic landscape of the people of
India: a canvas for disease gene exploration. Journal of genetics 87: 3–20.
12. Majumder PP (2008) Genomic inferences on peopling of south Asia. Current
opinion in genetics & development 18: 280–284.
13. Basu A, Mukherjee N, Roy S, Sengupta S, Banerjee S, et al. (2003) Ethnic India:
a genomic view, with special reference to peopling and structure. Genome
research 13: 2277–2290.
14. Dirks NB (2001) Castes of Mind: Colonialism and the Making of Modern India.
Princeton, NJ: Princeton University Press.
15. Sanghvi LD, Balakrishnan V, Karve I (1981) Biology of the People of Tamil
Nadu.; Prune, editor. Calcutta: Indian Society of Human Genetics and IndianAnthropological Society.
16. Sharma S, Rai E, Sharma P, Jena M, Singh S, et al. (2009) The Indian origin ofpaternal haplogroup R1a1(*) substantiates the autochthonous origin of Brahmins
and the caste system. J Hum Genet 54: 47–55.
17. Champaklakshmi R (2001) Reappraisal of a Brahmanical Institution: The
Brahmadeya and its Ramifications in Early Midieval South India. In: Hall KR,
editor. Structure and Society in Early South India: Essays in Honour of NoboruKarashima. Delhi: Oxford University Press. pp. 59–84.
18. Krishnan KG (1984) Karandai Tamil Sangam Plates of Rajendrachola I. NewDelhi: Archaeological Survey of India.
19. Wells RS, Yuldasheva N, Ruzibakiev R, Underhill PA, Evseeva I, et al. (2001)
The Eurasian heartland: a continental perspective on Y-chromosome diversity.Proc Natl Acad Sci U S A 98: 10244–10249.
20. Bamshad M, Kivisild T, Watkins WS, Dixon ME, Ricker CE, et al. (2001)Genetic evidence on the origins of Indian caste populations. Genome research
11: 994–1004.
21. Zhao Z, Khan F, Borkar M, Herrera R, Agrawal S (2009) Presence of three
different paternal lineages among North Indians: a study of 560 Y chromosomes.
Annals of human biology 36: 46–59.
22. Shastri KAN (1976) A history of South India : from prehistoric times to the fall of
Vijayanagar. Madras: Oxford University Press. xii, 521 p., [512] leaves ofplates p.
23. Trivedi R, Sahoo S, Singh A, Bindu GH, Banerjee J, et al. (2008) Genetic
Imprints of Pleistocene Origin of Indian Populations: A ComprehensivePhylogeographic Sketch of Indian Y-Chromosomes. Internation Journal of
Human Genetics 8(1–2): 97–118.
24. Carvalho-Silva DR, Tyler-Smith C (2008) The Grandest Genetic Experiment
Ever Performed on Man? - A Y-Chromosomal Perspective on Genetic Variationin India. International journal of human genetics 8: 21–29.
25. Thanseem I, Thangaraj K, Chaubey G, Singh VK, Bhaskar LV, et al. (2006)
Genetic affinities among the lower castes and tribal groups of India: inferencefrom Y chromosome and mitochondrial DNA. BMC genetics 7: 42.
26. McCrindle JW (2000) Ancient India as described by Megasthenes and Arrian:Munshirm Manoharial Pub Pvt Ltd.
27. Silverberg J (1969) Social Mobility in the Caste System in India: An
Interdisciplinary Symposium. The American Journal of Sociology 75: 443–444.
Genetic Structure of Southern Indian Populations
PLOS ONE | www.plosone.org 15 November 2012 | Volume 7 | Issue 11 | e50269
28. Srinivas MN (1952) Religion and Society among the Coorgs of South India.Oxford: Clarendon Press.
29. Pappu S, Gunnell Y, Taieb M, Brugal J-P, Touchard Y (2003) Excavations atthe Paleolithic Site of Attirampakkam, South India: Preliminary Findings.Current Antrhopology 44: 591–598.
30. Fuller DQ (2006) Agricultural origins and frontiers in South Asia: a workingsynthesis. J World Prehist 20: 1–86.
31. Fuller DQ (2007) Non-human genetics, agricultural origins and historicallinguistics in South Asia. In: Petraglia MD, Allchin B, editors. The Evolutionand History of Human Populations in South Asia. Dordrecht, The Netherlands:Springer. pp. 393–443.
32. Haslam M, Korisettar R, Petraglia M, Smith T, Shipton C, et al. (2010) InFoote’s Steps: The History, Significance and Recent Archaeological Investiga-tion of the Billa Surgam Caves in South India. South Asian Studies 26: 1–19.
33. Misra VN (2001) Prehistoric human colonization of India. J Biosci 26: 491–531.34. Morrison KD (2007) Non-human genetics, agricultural origins and historical
linguistics in South Asia. In: Petraglia MD, Allchin B, editors. The Evolutionand History of Human Populations in South Asia. Dordrecht, The Netherlands:Springer. pp. 321–339.
35. Selvakumar V (2002) Hunter-Gatherer Adaptations in Madurai Region, TamilNadu, India: From c. 10,000 BP to c. A.D. 500. Asians Perspectives 40: 71–102.
36. Ramaswamy V (1994) Matallurgy and traditional metal crafts in Tamil Nadu(with special reference to bronze). Indian Journal of History of Science 29: 445–476.
37. Kanakasabhai V (1904) The Tamils Eighteen Hundred Years Ago. Madras andBangalore: Higginbotham and Co.
38. Thurston E, Rangachari K (1909) Castes and tribes of southern India. Madras:Government Press.
39. Keay J (2001) India: a history. New York: Grove Press.40. Pitchappan RM, Kakkanaiah VN, Rajashekar R, Arulraj N, Muthukkaruppan
VR (1984) HLA antigens in South India: I. Major groups of Tamil Nadu. Tissueantigens 24: 190–196.
41. Rajasekar R, Kakkanaiah VN, Pitchappan R (1987) HLA antigens in SouthIndia. II: Selected caste groups of Tamil Nadu. Tissue antigens 30: 113–118.
42. Pitchappan RM, Balakrishnan K, Sudarsen V, Brahmajothi V, Mahendran V,et al. (1997) Sociobiology and HLA genetic polymorphism in hill tribes, the Irulaof the Nilgiri hills and the Malayali of the Shevroy hills, south India. Humanbiology 69: 59–74.
43. Balakrishnan K, Pitchappan RM, Suzuki K, Kumar US, Santhakumari R, et al.(1996) HLA affinities of Iyers, a Brahmin population of Tamil Nadu, SouthIndia. Human biology 68: 523–537.
44. Watkins WS, Thara R, Mowry BJ, Zhang Y, Witherspoon DJ, et al. (2008)Genetic variation in South Indian castes: evidence from Y-chromosome,mitochondrial, and autosomal polymorphisms. BMC genetics 9: 86.
45. Ramana GV, Su B, Jin L, Singh L, Wang N, et al. (2001) Y-chromosome SNPhaplotypes suggest evidence of gene flow among caste, tribe, and the migrantSiddi populations of Andhra Pradesh, South India. European journal of humangenetics : EJHG 9: 695–700.
46. Kumar V, Reddy AN, Babu JP, Rao TN, Langstieh BT, et al. (2007) Y-chromosome evidence suggests a common paternal heritage of Austro-Asiaticpopulations. BMC Evol Biol 7: 47.
47. Lokur Committee (1965) The Advisory Committee on the Revision of the Listsof Scheduled Castes and Scheduled Tribes (Lokur Committee). New Delhi:India, Government of.
48. Constituent Assembly (1949) Constitution of India. In: Ministry of Law andJustice, editor. New Delhi, India: Ministry of Law and Justice, India.
49. Mandal BP (1979) Mandal Commission,. New Delhi.50. Kalelkar K (1955) First Backward Classes Commission. New Delhi.
51. Balanovsky O, Dibirova K, Dybo A, Mudrak O, Frolova S, et al. (2011) ParallelEvolution of Genes and Languages in the Caucasus Region. Molecular biologyand evolution 28: 2905–2920.
52. Karafet TM, Mendez FL, Meilerman MB, Underhill PA, Zegura SL, et al.(2008) New binary polymorphisms reshape and increase resolution of the humanY chromosomal haplogroup tree. Genome research 18: 830–838.
53. Excoffier L, Laval G, Schneider S (2005) Arlequin (version 3.0): An integratedsoftware package for population genetics data analysis. Evol Bioinform Online 1:47–50.
54. Excoffier L, Smouse PE, Quattro JM (1992) Analysis of molecular varianceinferred from metric distances among DNA haplotypes: application to humanmitochondrial DNA restriction data. Genetics 131: 479–491.
55. Jolliffe I (1986) Principal Coponents Analysis, Second Edition. New York, NY:Springer.
56. Nelson MR, Bryc K, King KS, Indap A, Boyko AR, et al. (2008) The PopulationReference Sample, POPRES: a resource for population, disease, andpharmacological genetics research. Am J Hum Genet 83: 347–358.
57. Cattell R (1966) The scree test for the number of factors. Multiv Behav Res 1:245–276.
58. Kruskal JB (1964) Multidimensional scaling by optimizing goodness of fit to anonmetric hypothesis. Psychometrika 29: 1–27.
59. Bandelt HJ, Forster P, Rohl A (1999) Median-joining networks for inferringintraspecific phylogenies. Molecular biology and evolution 16: 37–48.
60. Forster P, Rohl A, Lunnemann P, Brinkmann C, Zerjal T, et al. (2000) A shorttandem repeat-based phylogeny for the human Y chromosome. Am J HumGenet 67: 182–196.
61. Wilson I, Balding D, Weale M (2003) Inferences from DNA Data: PopulationHistories, Evolutionary Processes and Forensic Probabilities. Journal of theRoyal Statistical Society: Series A (Statistics in Society) 166: 155–188.
62. Haber M, Platt DE, Badro DA, Xue Y, El-Sibai M, et al. (2011) Influences ofhistory, geography, and religion on genetic structure: the Maronites in Lebanon.European journal of human genetics : EJHG 19: 334–340.
63. Xue Y, Zerjal T, Bao W, Zhu S, Shu Q, et al. (2006) Male demography in EastAsia: a north-south contrast in human population expansion times. Genetics172: 2431–2439.
64. Zhivotovsky LA, Underhill PA, Cinnioglu C, Kayser M, Morar B, et al. (2004)The effective mutation rate at Y chromosome short tandem repeats, withapplication to human population-divergence time. Am J Hum Genet 74: 50–61.
65. Reich D, Thangaraj K, Patterson N, Price AL, Singh L (2009) ReconstructingIndian population history. Nature 461: 489–494.
66. Sturrock K, Rocha J (2000) A Multidimensional Scaling Stress EvaluationTable. Field Methods 12: 49–60.
67. Krithika S, Maji S, Vasulu TS (2009) A microsatellite study to disentangle theambiguity of linguistic, geographic, ethnic and genetic influences on tribes ofIndia to get a better clarity of the antiquity and peopling of South Asia.American journal of physical anthropology 139: 533–546.
68. Underhill PA, Myres NM, Rootsi S, Metspalu M, Zhivotovsky LA, et al. (2010)Separating the post-Glacial coancestry of European and Asian Y chromosomeswithin haplogroup R1a. European journal of human genetics : EJHG 18: 479–484.
69. Morrison KD (2007) Foragers and forager-traders in South Asian worlds: somethoughts from the last 10,000 years. In: Petraglia MD, Allchin B, editors. TheEvolution and History of Human Populations in South Asia. Dordrecht, TheNetherlands: Springer. pp. 321–339.
70. Semino O, Magri C, Benuzzi G, Lin AA, Al-Zahery N, et al. (2004) Origin,diffusion, and differentiation of Y-chromosome haplogroups E and J: inferenceson the neolithization of Europe and later migratory events in the Mediterraneanarea. American journal of human genetics 74: 1023–1034.
Genetic Structure of Southern Indian Populations
PLOS ONE | www.plosone.org 16 November 2012 | Volume 7 | Issue 11 | e50269
Related Documents