Population definitions for comparative surveys in education Martin Murphy Australian Council for Educational Research January 2016

Welcome message from author
This document is posted to help you gain knowledge. Please leave a comment to let me know what you think about it! Share it to your friends and learn new things together.
Transcript

Population definitions for
comparative surveys in education
Martin Murphy
Australian Council for Educational Research
January 2016

Population definitions for comparative surveys in education
P a g e | 2
The Australian Council for Educational Research Ltd
19 Prospect Hill Road, Camberwell, Victoria, 3124, Australia.
Copyright © 2016 Australian Council for Educational Research

Population definitions for comparative surveys in education
P a g e | 3
Contents
Introduction .............................................................................................................................. 5
The target population ............................................................................................................. 6
A model for defining the population .................................................................................... 6
Examples of population definitions ....................................................................................... 8
The primary unit of comparison ......................................................................................... 8
Statement of eligibility ......................................................................................................... 9
International reference points ......................................................................................... 10
Coverage and Exclusions ................................................................................................. 10
Implications of decisions surrounding population definition ........................................... 12
The units of comparison .................................................................................................... 12
Age-based versus grade-based eligibility ...................................................................... 14
Comparing outcomes from the TIMSS and PISA surveys ................................................. 17
The institution .......................................................................................................................... 18
Coverage and exclusions .................................................................................................... 19
Survey response ..................................................................................................................... 21
Survey reporting ..................................................................................................................... 22
Reporting Example 1: TIMSS 2011 Grade 8 ..................................................................... 22
Reporting Example 2: AHELO Engineering Strand Institutional Report ....................... 26
Conclusion .............................................................................................................................. 30
References ............................................................................................................................. 32

Population definitions for comparative surveys in education
P a g e | 4
Table of Figures
Figure 1: Relationship between desired populations and exclusions .............................. 7
Table 1: Percentage of students per grade and ISCED level, by country (PISA 2006) 16
Table 2: Variations in rates of exclusion at a school level, within-school level and
overall for PISA 2012 .............................................................................................................. 21
Table 3: Coverage of TIMSS 2011 target population – grade 8 (extract) ...................... 22
Table 4: Weighted school, class and student participation rates – TIMSS – grade 8
(extract) .................................................................................................................................. 23
As shown in Table 4, England experienced a relatively low rate of school
participation. The data flag for England notes that they required replacement
schools to ‘nearly satisfy’ the guidelines for participation rates. ................................... 23
Table 5: Information about the students assessed in TIMSS 2011 (extract) .................... 23
Table 6: School sample sizes from TIMSS 2011 (extract) ................................................... 24
Table 7: Student sample sizes – TIMSS 2011 (extract) ........................................................ 25
Figure 2: Croatia’s TIMSS 2011 sampling summary ............................................................ 26
Table 8: AHELO Engineering Strand participation statistics ............................................. 27
Table 9: AHELO Engineering Strand institution characteristics and scores .................... 27
Table 10: AHELO Engineering Strand demographic characteristics and scores ......... 28
Figure 3: AHELO Engineering Strand mean scores for all participating institutions and
this institution .......................................................................................................................... 29
Table 11: AHELO Engineering Strand education characteristics and scores ............... 30

Population definitions for comparative surveys in education
P a g e | 5
Introduction
This paper provides an overview of population definitions for large-scale
comparative educational surveys. It has been prepared to help inform the
development of a population definition and sampling framework that will be used in
the British Council Global English research project. This paper examines a number of
large-scale surveys including the Trends in International Mathematics and Science
Study (TIMSS), which is conducted by the International Association for the Evaluation
of Educational Achievement (IEA), as well as the Programme for International
Student Assessment (PISA), and the Assessment of Higher Education Learning
Outcomes (AHELO), both of which the Organisation for Economic Co-operation and
Development (OECD) conduct. TIMSS and PISA have each been conducted over
multiple administrations over many years, and are regarded very highly for their
quality. At the present, AHELO has only been administered once as part of a
feasibility study, so it is less fully developed compared to TIMSS and PISA. However, it
provides interesting insights into the possibilities of survey work in the higher
education area.
All of the surveys discussed in this paper are assessments of students. However,
comparisons are not made between individual students’ results. Rather, data
collected from students sampled to participate in the assessment are used to make
inferences to a clearly defined population. By doing this, the results can be used to
make comparisons between different populations. These comparisons can help
identify factors such as teaching practices that may lead to better outcomes for a
particular population compared to others. These comparisons can also help inform
governments and policymakers about survey participants as well as more broadly
about potential areas for improvement.
There are many potential populations that might be inferred to, for example an
entire country, a region or a single institution. Comparisons are of most interest when
the populations being compared are as similar to each other as possible.
Populations such as countries or institutions are structured very differently and it
therefore becomes necessary to have a very clear common starting point for
comparison, as well as to thoroughly document and quantify any departures from
that common starting point. While differences often exist between populations
being compared, reports of survey findings will allow the reader to evaluate the
similarities or differences between populations across a number of dimensions to
better understand the differences observed in student outcomes.
The paper will examine how populations are defined in these large-scale
international comparative educational surveys, examples of how some of these
have evolved over time, and the implications of these definitions and evolutions on
the interpretation of outcomes. It will also examine the implications of decisions
about population definitions on the way in which the survey is conducted as well as
the impact on data analysis. Finally the paper will provide some examples of how
findings from these surveys are reported.

Population definitions for comparative surveys in education
P a g e | 6
The target population
Particularly for comparative surveys, it is vital that a clear understanding of the target
population is reached well in advance of commencing survey fieldwork. Surveys are
complex, challenging and expensive activities. Without a clear target population,
resources will likely be wasted. Moreover, a lack of clarity in the population definition
may lead to misunderstanding and dissatisfaction among survey participants.
Most of the surveys mentioned above seek to monitor trends over time. Any changes
to the population definition over time will impact the capacity to measure those
trends. A key principle of large-scale survey work is that ‘if you want to measure
change, don’t change your measure’. This principle certainly extends to the
population definition. If we alter the population definition in a later cycle of the
survey, we are surveying a differently specified population to earlier cycles. This
means it will be much harder to know the extent to which any observed change is
just the result of this difference, or is a true trend. Investing the time required to
develop a clear and appropriate population definition in the first instance in order to
minimise changes later on will pay off handsomely over time.
Although changing the population definition can impact the measurement of
trends, there are some instances when change is required. The population definitions
used in TIMSS and PISA have both changed over time, and some of these changes
have been quite significant. Some of these changes have addressed technical
issues; some have been the result of discussions and debates following the
publication of outcomes. Changes have also occurred due to the success of the
surveys. For example PISA has seen participation broaden far beyond its initial focus
on OECD member countries. Currently more than 70 countries participate in PISA.
The changes required to broaden the population definition in PISA have not been
without controversy, and they have invariably added significant additional
operational and analytical complexity to the survey. Some of those changes will be
discussed in detail in this paper.
Survey population definitions will evolve somewhat over time. In the context of
increasing globalisation and change, this is not surprising. However, developing a
very clear understanding of what a survey intends to measure at the very start of
planning a survey will greatly improve the chances that the population definition will
be sufficiently robust to survive that evolution.
A model for defining the population
The graphic shown in Figure 1, taken from the chapter on sampling design in the
2006 PIRLS Technical Report(Joncas, 2007), provides a model for how populations
are typically defined in internationally comparative surveys.

Population definitions for comparative surveys in education
P a g e | 7
Figure 1: Relationship between desired populations and exclusions
Source. (Joncas, 2007, p. 39).
As shown in Figure 1, the starting point is the International Desired Target Population
which is typically quite concise and transferable across participating countries. From
this starting point, for various reasons – political, geographical and others – exclusions
are identified across a series of levels until the actual population that will be
targeted – here described as the Effective Target Population- is arrived at.
It is of course desirable that exclusions be minimised because the distinction
between the International Desired Target Population and the Effective Target
Population will tend to be overlooked in the reporting of outcomes. As discussed
further below, most surveys will set limits on the amount of the population that can
be excluded for particular reasons.
It is important that any national departures from the target population such as
regional, institution level or student level exclusions are clearly documented and
quantified. Technical Reports from large scale surveys will typically include many
tables that reflect various aspects of a country’s participation, including the way in
which they have defined the target population. This information assists the reader to
evaluate the quality and comparability of outcomes. Examples of these reports will
be discussed later in the paper.
Ultimately the task of accurately defining the population and identifying and
quantifying exclusions is the responsibility of the participant. However, at the
international level considerable effort needs to be made to ensure that the
expectations around population definition and comparability are clearly understood
by all participants.

Population definitions for comparative surveys in education
P a g e | 8
Examples of population definitions
A discussion of the population that a survey seeks to target is included in survey
reports. These discussions will typically include:
an indication of the primary unit of comparison;
a statement of eligibility with respect to the desired population;
where appropriate, some form of internationally agreed reference point; and
some statement about anticipated exclusions and acceptable limits of such
exclusions.
The following section discusses each of these aspects of population definitions in
detail.
The primary unit of comparison
A key component of the reports of international surveys are comparison tables,
where participants are ranked alongside each other across a whole range of survey
outcomes. In early administrations of these surveys, participants were generally
members of the IEA and OECD respectively, most commonly countries. For example
PISA was initially designed as a comparative survey of OECD member states. The
population definition for the first cycle of PISA referred simply to ‘the country’ as the
comparative unit. This was presumably intended to mean ‘what we typically mean
as the country in our work within the OECD’. But even something that is at first
glance conceptually simple, like a country can be difficult to clearly define, for
example are overseas territories such as Puerto Rico included as part of the United
States ‘country’ sample in this definition?.
As the PISA survey cycles have progressed there has been considerable evolution in
the scope of participation. OECD membership has expanded. Within OECD member
states, many sub-national entities sought participation as separate entities and as
separate entries in comparison tables, for example Scotland, the Flemish community
of Belgium, and regions of Spain. Many countries that are not within the OECD have
started participating in the survey. In more recent years, sub-national entities such as
states (e.g. Tamil Nadu from India) or economies (e.g. Shanghai in China) have
been included as survey participants.
In its latest documentation, the comparative unit used in PISA is described more
broadly as an ‘adjudicated entity’:
Adjudicated Entity - a country, geographic region, or similarly defined
population, for which the International Contractors fully implements
quality assurance and quality control mechanisms and endorses, or
otherwise, the publication of separate PISA results(OECD, 2015, p. 23).
Most IEA documentation refers to the primary comparison unit as the country. As
with the OECD, membership status to the organisation tends to define the primary
comparison units. However, there are some reporting differences between IEA and
OECD surveys. For example, in TIMSS 2007 which is conducted by IEA, England and
Scotland are listed as participating countries, whereas in PISA, the primary point of

Population definitions for comparative surveys in education
P a g e | 9
reference is the United Kingdom, with Scotland separately listed as an additional
adjudicated region. In IEA studies, non-member states and sub-national entities such
as states of the USA or Canadian provinces also participate and are published in IEA
reports separately as ‘benchmarking participants’.
In the AHELO feasibility study, there was no attempt to infer results to the country
level. For this study, outcomes for each participating higher education institution
(HEI) were compared with outcomes across all HEIs internationally. Means and
distributions of outcomes across all institutions were provided, as was a list of all
participating institutions, but it was not possible to directly compare outcomes from
one institution to another. Nor was it possible to compare outcomes for an institution
with the distribution of outcomes from all participating institutions from that country.
These comparisons were beyond the scope of the feasibility study – for example the
sampling of HEIs was selected by judgement, and was understood to at best be only
broadly representative of the HEIs from the country. For these reasons, it was not
seen as appropriate to report the results from the feasibility study at a country level.
For the purposes of this paper, the experiences of AHELO are interesting with respect
to two possible designs for surveys of higher education students: surveys of the
institutions themselves; or a country or regional level survey of higher education
students accessed through their institution of study (in the same manner that PISA
and TIMSS access their sample through schools). In the former design, the higher
education institution becomes the primary unit of comparison and all of the political
and operational considerations associated with ensuring comparability between
units at a country or regional level are extended to this level. In the latter design, the
institutions serve a similar role to schools in PISA and TIMSS. In this case it becomes
important in this case to reflect on how the different nature of institutions can impact
on the conduct of the survey and the analysis of outcomes.
Statement of eligibility
The statement of eligibility refers to the description of who is included and excluded
from the target population. The PISA population definition is based on the age of
participating students:
PISA Target Population – students aged between 15 years and 3
(completed) months and 16 years and 2 (completed) months at the
beginning of the testing period, attending educational institutions
located within the adjudicated entity, and in grade 7 or higher. The
age range of the population may vary up to one month, either older or
younger, but the age range must remain 12 months in length (OECD,
2012b, p. 380).
The eligibility for TIMSS is based primarily on number of years of schooling, although
with some reference to the average age of students in that year. For example:
All students enrolled in the grade that represents eight years of
schooling counting from the first year of ISCED Level 1, providing the
mean age at the time of testing is at least 13.5 years (Joncas & Foy,
2012, p. 4).

Population definitions for comparative surveys in education
P a g e | 10
The AHELO statement of eligibility was also based on stage of studies rather than
age of students. The target population for the Engineering strand of AHELO was
defined as:
The target population for the Engineering strand comprises all full-time
students at the end of a three- or four-year undergraduate degree in
civil engineering of the Engineering department or faculty. It also
comprises all full-time students at the end of a three- or four-year
undergraduate degree in a multidisciplinary program, who significantly
majored in Civil Engineering (Dumais, Coates, & Richardson, 2011, p.
10).
The choice between an age-based versus a ‘stage of studies’ based population
definition has far-reaching consequences with respect to the administration of the
survey, the analyses of survey data and the interpretation of results. These
consequences will be discussed later in this paper.
International reference points
International reference points help standardise some of the differences between
participants’ target populations. Countries define their levels of schooling in different
ways, and so the TIMSS eligibility makes reference to the UNESCO International
Standard Classification of Education (ISCED). However, these levels are defined
within participating countries. Participants must determine – with guidance from the
international study centre – which level is the starting point for ISCED level 1 and
count up eight years from that point to identify students that meet the eligibility
criteria.
Similarly, taking the example of AHELO, civil engineering courses appear in a very
wide range of tertiary settings, and their curricula can vary from very academic to
very vocational. For these reasons, an international framework was necessary in the
AHELO survey to be sure that the same types of civil engineering courses were being
included in the Engineering strand across participating countries. Once again,
reference was made to the ISCED framework:
The programs are referenced by the UNESCO International Standard
Classification of Education (ISCED) as level 5A or 5B… Although the
ISCED level 5 programs’ duration typically ranges from less than 3 years
to up to 6 years, the appropriate focus for the feasibility study is on the
first range category, i.e. programs with a total cumulative duration of 3
to 4 years (Dumais et al., 2011, p. 7).
Coverage and Exclusions
While the intention is to maximise coverage of the desired target population for any
survey, there will usually be parts of the population that for various reasons cannot
be covered. In the TIMSS and PIRLS sample design documentation, the types of
potential exclusions are described as follows:

Population definitions for comparative surveys in education
P a g e | 11
… in some rare situations, certain groups of schools and students may
have to be excluded from the national target population. For
example, it may be that a particular geographical region, educational
sub-system, or language group cannot be covered...
Even countries with complete population coverage find it necessary to
exclude at least some students from the target population because
they attend very small schools, have intellectual or functional
disabilities, or are non-native language speakers(Joncas & Foy, 2012, p.
5).
To maximise comparability between participants, limits are set with regard to the
amount of the population that can be excluded from the survey. In TIMSS for
example, these are stated as:
The overall number of excluded students must not account for more than 5%
of the national target population of students in a country. The overall number
includes both school-level and within-school exclusions.
The number of students excluded because they attend very small schools
must not account for more than 2% of the national target population of
students (Joncas & Foy, 2012, p. 6).
In the higher education context, exclusions can be due to a variety of reasons.
These could be due to unit-level (as distinct from whole-course) enrolments, part-
time study, gaps in students’ study and that some units may be offered at different
levels or stages of students’ course. The issues surrounding which students are
counted within the target population can become extremely complex:
… selected students … absent for the duration of the assessment
period but who would likely be present if the collection period were
shifted a little (e.g. absent due to short-term illness) are not exclusions
but are rather non-respondents. Selected students and faculty who
would refuse or would otherwise be unable to take part in the
assessment are also to be considered as non-respondents. However,
in-scope individuals who are unavailable for the duration of the
assessment regardless of the actual collection window (e.g. parental
or sabbatical leave, internship) are excluded. Exclusions are to be
determined before the sample of students and faculty is selected and
the assessment takes place. Exclusions cannot be a by-product of the
assessment (Dumais et al., 2011, p. 10).
A key activity prior to fieldwork is negotiating with participants to reach a common
understanding of the institutions and individuals to be counted as ‘in-scope’ and to
identify and quantify exclusions from the target population. This is typically managed
through the completion of a series of standardised forms where all proposed
exclusions and reductions in coverage are documented, quantified and negotiated
between the participant and the coordinating centre.
During data collection, students may be sampled who are subsequently identified
as valid exclusions. These exclusions need to be identified and coded accurately,

Population definitions for comparative surveys in education
P a g e | 12
and distinguished from other exclusions – for example eligible students who are
absent or who refuse to participate – so that accurate estimates of the extent of
exclusions overall for each participant can be reported.
Implications of decisions surrounding population definition
The units of comparison
As noted above, both TIMSS and PISA have had increased levels of participation in
their surveys, such that participation now extends beyond the member states of their
respective organisations. In addition to ‘countries’, there are now ‘adjudicated
regions’ and ‘benchmarking participants’ who take part in the surveys. For each
survey, the distinctions between member countries and non-member participants is
maintained in reporting. For example, these are shown by divisions within
comparison tables or the use of colours or other graphic elements in publication.
However, the reporting does make some comparisons across these units where
appropriate and possible.
Participants, be they countries, regions or institutions are understandably very
sensitive to being compared against others. This is particularly the case when
comparisons may suggest that their students are not performing as well as others.
They will have many questions that relate to the way in which comparisons are
being made. Has the local context been adequately accounted for? Are the
comparisons ‘fair’ across participants? Are the necessary structures in place with
respect to the governance of the survey to ensure that any comparisons are valid?
These can be very difficult challenges and controversies can, and do arise with
respect to these issues.
The inclusion of Shanghai – as an adjudicated entry – in PISA is one example of a
recent controversy. In PISA 2012, Shanghai’s outcomes were at the very top of the
international comparison tables across Mathematics, Science and Reading.
Questions have been raised about how the Shanghai economy is defined for the
purposes of PISA, who is included in the population of ‘Shanghai 15 year olds’, who
makes these population decisions, and on what basis those decisions are made, see
Loveless (2014). On the one hand, as noted in OECD (2013a), there is considerable
interest in knowing more about the education systems of important emerging
economies of the world. On the other hand, as the education community is
encouraged to look towards Shanghai as a leading ‘strong performer and
successful reformer in education(OECD, 2013a) there are legitimate concerns about
whether the comparisons being made are truly ‘like for like’. Loveless (2014) argues
that this brings into question the whole governance and decision-making structure of
the PISA survey.
It is important to keep in mind that different groups, both internationally and within
participating countries, will have different perspectives on survey outcomes. While all
of the surveys being discussed in this paper are fundamentally about improving
educational policy and provision by identifying the factors that appear most related
to improvements in student outcomes, there is no doubt that broader political
considerations can be at play. Instances of ‘TIMSS shock’ and ‘PISA shock’ caused

Population definitions for comparative surveys in education
P a g e | 13
by countries being placed in an unexpectedly low position on comparison tables of
results from these surveys have been well documented (Döbert, Klieme, & Sroka,
2004). Those coordinating the survey internationally must be able to demonstrate
that every opportunity was afforded to the various stakeholders to ensure that local
contexts and circumstances were adequately taken into account and that
comparisons are ‘fair’. One must also expect that some participants, under pressure
to be ‘favourably located’ with respect to particular comparisons may seek to
subvert the conduct of the survey, and provision must be made for sufficient
monitoring and quality control to avoid the publication of false or misleading
outcomes. These issues also apply to any survey where results from participants will
be made publicly available, including surveys of institutions rather than countries.
From an international perspective, the focus of reporting is on the outcomes for the
country as a whole, but within many countries the main responsibility for the
provision of education does not lie at the national level but rather at lower levels of
government. In the case of Australia for example, the national estimates from
surveys like PISA provide a snapshot of the ‘educational health’ of the country as a
whole, and how this compares to others. However education in Australia is primarily
the responsibility of States and Territories and it would most likely be state
educational departments who would enact changes to education policy or
practice. For example, they would likely be actioning any recommended changes
to practices or reallocating resources with respect to the effective teaching of
foreign languages in schools. So while the international report limits comparisons to
the country level, there will often be supplementary national reporting that provides
more detailed analyses by state and territory to assist relevant levels of government
and policymakers. Often sample sizes will be boosted for these subpopulations so
that reliable estimates can be obtained at these levels.
The evolution of large scale surveys such as TIMSS and PISA over the last two
decades shows that the unit of comparison of most value towards meeting the
needs of individual participants and also of the survey overall is not necessarily a
country. Sub-populations, including adjudicated regions, benchmarking
participants, economies, and oversampled regions, are now all very much a part of
the picture of these surveys.
There appears to be increasing recognition that useful information from an
international perspective can be obtained about educational systems that do not
necessarily extend to a whole country. It is also clear that within many countries
themselves, participation and comparisons of subgroups of the population can be
at least as relevant as comparisons for the country as a whole.
As argued by Wu (2009), there can be a risk that participants in these complex and
expensive assessments, by trying to ‘solve it all’, fail to achieve outcomes at levels of
most relevance to policy reform.
Focused studies may well be more suited to establish the effectiveness
of a particular intervention, or a particular policy change. Smaller,
purposeful and targeted assessment programs may achieve a narrow
Population definitions for comparative surveys in education
P a g e | 14
but well-defined set of objectives rather than a large-scale assessment
system that does not providing any useful data(Wu, 2009).
While it is essential to address any political or operational concerns of participants
with respect to comparisons that will be made, designs which allow for reliable
reporting at the levels at which policies and reforms are most likely to be enacted
are most likely to meet participants’ needs.
Age-based versus grade-based eligibility
A key point of difference between the population definition for TIMSS and PIRLS, and
the PISA population definition is that the TIMSS and PIRLS populations are both
defined according to a particular grade of schooling, whereas the PISA population
is defined according to the age of the student. The focus of the IEA studies is on
measuring student outcomes and linking these to the curricula taught in schools.
PISA instead seeks to investigate the preparedness of students, typically at the end
of the compulsory levels of schooling, to meet the challenges of their post-school
lives. These different population definitions have important implications for sample
design, survey administration, and the analysis of outcomes.
A challenge with the grade-based approach is that of aligning the grade level
structures of participants to an international framework. As observed in the TIMSS
population definition, this is done via alignment with the ISCED framework, but also
with reference to the mean age of students at the particular grade:
… because educational systems vary in structure and in policies and
practices with regard to age of starting school and promotion and
retention, there are differences across countries in how the target
grades are labelled and in the average age of students…(Joncas &
Foy, 2012, p. 4)
TIMSS surveys students from two grades – fourth grade and eighth grade. In relation
to TIMSS conducted with fourth grade students, this meant that for the countries
England, Malta and New Zealand, whose students begin schooling at an earlier
age, the most comparative year level was actually the fifth year of schooling. Even
then, the students from this target grade were relatively young compared to other
countries (Joncas, 2012c)
While there are some complexities associated with a grade-based population
definition, they pale in significance when compared to an age-based population
definition, such as the one used in PISA. With a grade-based definition, it is typically
quite straightforward to determine who is eligible and who is not. The whole notion of
an ‘eligible educational institution’ is also clearer – the institution either does or does
not offer that grade. In contrast, defining the population based on an age-range will
mean the potential inclusion of many more institutions. There are relatively few 15
year olds in ‘junior schools’, or in senior secondary schools but there will be some.
There will be other institutions offering educational programs – for example work-
based vocationally oriented programs – that include some 15 year old students.
Should students attending these institutions be considered ‘PISA-eligible’?

Population definitions for comparative surveys in education
P a g e | 15
A comparison between an age-based and a grade-based population brings into
focus two contrasting explanatory variables for measuring outcomes – age and
years of schooling. With different student entry points into formal education, younger
students who have had more time in school might, at least at some points in time,
perform better than newer entrants to the school system who are older. Clearly
these issues will affect the validity of comparisons. Inevitably whether age- or grade-
based, some control with respect to the other variable becomes important. As
noted above, while the TIMSS population definition is predominantly grade-based,
there is reference made to the average age of students in the target grade and
adjustments made when the difference of a population with respect to age is
considered too great. In the PISA context, the issue is more focused on the timing of
the assessment. It would, for example, affect comparisons if most 15 year olds in one
country are at the start of their tenth year of schooling, whereas in another country
are at the end of their tenth year of schooling. For this reason, there are some
controls on testing windows, with most Northern hemisphere countries conducting
assessments between March to May, and Southern hemisphere countries testing
later in the calendar year, reflecting the differences in academic year timings across
different parts of the world. In addition, it is a PISA standard that the testing period is
not held within the first six weeks of the national school academic year. This is to
avoid so-called ‘holiday effects’ experienced by students at that time of year.
These issues would also be relevant in the context of a survey at the senior
secondary or higher educational levels. There would clearly be concerns about the
comparability of a population definition that meant that in some countries most
students in their second year of higher education were being assessed, while in other
countries most students were in their third or later years. This is one reason why AHELO
pursued a ‘stage of studies’ model for their population definition, rather than using
an age-based definition. On the other hand, in the higher education context, it can
be very difficult for institutions to clearly identify individual students within a particular
year of study because of the way in which students enrol. Students often enrol in
modules rather than whole degrees, they sometimes study on a part-time basis, and
they may have gaps in study. In addition, different HEIs have different semester
structures, with teaching periods starting at different times, and some offering
courses across two semesters, while others have a trimester system. These differences
can make it difficult to make comparisons between institutions.
Table 1 shows the distribution of eligible students by grade level and by school type
(lower secondary (ISCED 2) versus upper secondary (ISCED 3)) for the PISA 2006
survey.

Population definitions for comparative surveys in education
P a g e | 16
Table 1: Percentage of students per grade and ISCED level, by country (PISA
2006)
Source. (OECD, 2009, p. 144).
For some countries, e.g. the Scandinavian countries, Japan and New Zealand there
is a strong relationship between age and grade, with a high proportion of 15 year
olds in the same grade. In other countries, the distribution across grade is more
mixed. In some cases, for example France, the Czech Republic and Mexico, there
are substantial proportions of 15 year olds attending different types of schools. These
factors lead to significant additional analytical complexities. For example, where the
population substantially divides into different school types, one would expect, and
often finds, that the 15 year olds in lower level school types would generally have
different performance outcomes than the 15 year olds in upper level school types.
The impact of grade retention – a common practice in some countries and vary rare
in others – is a major additional complicating factor (OECD, 2013b, p. 73). Analyses
that involve variance components such as multi-level modelling are made
considerably more complex in these situations.

Population definitions for comparative surveys in education
P a g e | 17
In relation to the possibility of a target population at the upper secondary level for
the Global English study, similar problems will arise, particularly in countries which
have a significant separate ‘senior secondary school’ component within their
educational structures.
Following data collection, weights will be calculated for each participating student
reflecting sample selection probabilities and adjusting for non-response. The
weighting calculation is made much more complex in the PISA environment due to
the age-based population definition. The formation of weighting classes in PISA for
example takes grade level and sex into account with higher priority than the school
itself, so that in some cases eligible students from the upper grades of a school might
reside in a different weighting class than students from the lower grades of the same
school.
The field operations are also much more complex with an age-based sample
design. For a grade-based study, the sample design commonly involves the equal
probability selection of an intact class from the list of classes at the target grade
from the sampled school. For an age-based design with eligible students across
multiple year levels (as shown in Table 1) the sampling operation required involves
the preparation of a list of all eligible students at the school from which an equal
probability sample is selected, a considerably more complex operation. With
students selected across multiple grades and multiple year levels, the disruption to
the school is also much greater, as students are likely to come from several different
classes, and this may impact upon survey response.
Comparing outcomes from the TIMSS and PISA surveys
One observation that has been quite clearly identified and has been the subject of
a number of papers, for example Hutchison and Schagen (2007) and Wu (2010) is
that countries’ relative outcomes on the TIMSS and PISA surveys and their locations
on comparison tables can differ. These differences in relative performance are at
least partly explained by the differences arising from how the respective populations
are defined. Wu for example concludes that:
…. a country with a high score in PISA shows that the students are
good at “everyday mathematics”, while a high score in TIMSS shows
that the students are good at “school mathematics”. … The fact that
there are differences in country rankings between PISA and TIMSS
results suggests that, at least in some countries, school mathematics
has not prepared students as well in the application of mathematics as
in academic mathematics. Conversely, there are countries that have
not prepared students as well in specialist areas of mathematics, such
as algebra and geometry, as they have prepared students in solving
mathematics problems in everyday life. The question of which
approach is better or which curriculum balance is the best will be for
the education policy makers in each country to consider in their own
context, and, certainly, neither PISA nor TIMSS alone should set the
directions for future mathematics curriculum reform(Wu, 2010, p. 96).

Population definitions for comparative surveys in education
P a g e | 18
Once again, the message here is that prior to launching a large-scale comparative
survey, a very clear understanding of the aims and objectives needs to be
achieved. These will feed into the development of a population definition. Another
important message is that how the outcomes from a survey are used to inform policy
change may vary from country to country, and will depend on a much deeper
understanding of local contexts and priorities than is obtained by only reviewing the
outcomes from a particular survey.
The institution
While three of the surveys discussed above – PISA, TIMSS and AHELO – are expressly
surveys of students, for each survey, the ‘educational institution’ is a component of
the population definition for each.
The sample designs for both PISA and TIMSS involve accessing the target
population from within educational institutions. The samples are designed to
be optimised towards the selection of students. Both studies sample schools
with the probability of being selected proportional to enrolment size. This
optimises the sample with respect to students as students from a stratum are
sampled with equal probability, the most efficient design. However, as the
term ‘probability proportional to size’ indicates larger schools are included
with higher probability than smaller schools. Particularly in the case of an age-
based design with significant portions of the population in different school
types, this adds further analytical burdens to the survey. These are discussed
further below.
In the case of the AHELO feasibility study, the institution was used as the
primary unit of comparison. There was no attempt to infer outcomes to
countries or economies in this survey.
As noted above, one issue is determining the institutions in-scope for the survey. With
respect to the upper secondary levels of schooling, there is a diversity of provision for
students at this level, with schools and programmes aimed towards higher
education, vocational programs, tertiary education and ‘post-secondary non-
tertiary education’ (Wu, 2010). Indeed the distinction between ‘education’ and
‘work’ is sometimes not clear cut, for example the case of Austria where students
enrolled in vocational educational programs spend periods of the year in school
and other times in work environments. This issue led to bias in the outcomes for
Austria in the 2000 PISA cycle and comparability problems for subsequent PISA
cycles.
Perhaps more importantly, the notion of what constitutes ‘a school’ itself, i.e. the first-
stage sampling unit, can be quite complex. The preferred unit is a ‘whole school’ but
for various reasons there are cases where programs within schools are identified as
separate schools for sampling, and alternatively in other cases the school is a larger
administrative unit with multiple campuses. Another complicating factor is whether
different shifts using the same buildings should be considered as separate schools. In
some cases, for example completely separate staffing and management in each
shift, this may be more appropriate. When staffing and management is shared
across the different shifts, the decision becomes more complex.

Population definitions for comparative surveys in education
P a g e | 19
Decisions about what constitutes the first-stage sampling unit might vary for different
parts of a country, or for different school types. For example, in PISA 2012 the
description of the sampling units used for Belgium was: ‘A combination of whole
schools (French- and German-speaking communities) and implantations
(Tracks/programmes taught on a single address/location [administrative address])
(Flemish Community)(OECD, 2014, p. 86). For Slovenia the units were described:
‘Study program in ISCED3 schools and whole ISCED2 schools’(OECD, 2014, p. 86).
Once again, these different arrangements lead to complexities in the analysis of
data:
The structure of education systems also affects the school variance
and any multilevel regression analyses. Indeed, the distinction between
upper and lower secondary education is part of the within-school
variance in some countries where both lower and upper secondary
education are provided in one educational institution. On the
contrary, in other countries where lower and upper secondary
education are provided in separate educational institutions (e.g. in
France), this distinction will contribute to the between-school variance
(OECD, 2009, p. 32).
Coverage and exclusions
It is essential for comparability purposes that exclusions are applied on the same
basis across participating countries. The process for achieving this outcome begins
with an internationally-agreed classification of exclusion categories. For example,
the international categories of exclusions identified under PISA were:
“Intellectually disabled students are students who have a mental or
emotional disability and who, in the professional opinion of qualified staff, are
cognitively delayed such that they cannot be validly assessed in the PISA
testing setting. This category includes students who are emotionally or
mentally unable to follow even the general instructions of the test. Students
were not to be excluded solely because of poor academic performance or
normal discipline problems.
Functionally disabled students are students who are permanently physically
disabled in such a way that they cannot be validly assessed in the PISA
testing setting. Functionally disabled students who could provide responses
were to be included in the testing.
Students with insufficient assessment language experience are students who
need to meet all of the following criteria: i) are not native speakers of the
assessment language(s); ii) have limited proficiency in the assessment
language(s); and iii) have received less than one year of instruction in the
assessment language(s). Students with insufficient assessment language
experience could be excluded.
Students not assessable for other reasons as agreed upon. A nationally-
defined within-school exclusion category was permitted if agreed upon by
the PISA Consortium. A specific sub-group of students (for example students

Population definitions for comparative surveys in education
P a g e | 20
with dyslexia, dysgraphia, or dyscalculia) could be identified for whom
exclusion was necessary but for whom the previous three within school
exclusion categories did not explicitly apply, so that a more specific within-
school exclusion definition was needed” (OECD, 2012b, p. 67).
Students whose language of instruction for mathematics (the major domain
for 2012), was one for which no PISA assessment materials were available.
Standard 2.1 of the PISA 2012 Technical Standards “…notes that the PISA test
is administered to a student in a language of instruction provided by the
sampled school to that sampled student in the major domain of the test. Thus,
if no test materials were available in the language in which the sampled
student is taught, the student was excluded” (OECD, 2012b, p. 67).
These categories must then be adapted to suit local contexts. It will generally be a
person at the sampled school, in conjunction with the centre coordinating the
survey within the country, who will be making these exclusion decisions. It can be
quite challenging in some contexts to address the need to limit exclusions overall to
meet internationally imposed limits on exclusions, while also addressing national and
local needs and expectations. For example, when PISA was conducted in the United
States, it was not permissible to administer assessments to students who were under
individualised educational plans (IEPs) without special accommodations being
offered. In addition to these national requirements, schools and teachers may also
have different views about the merits of participation for individuals or groups of
students.
While the issue of negotiating adaptations to international exclusions categories to
suit local contexts is primarily a role for those in charge of field operations, it is
important to be able to distinguish between students who were sampled but were
subsequently identified as ineligible for the survey from sampled students who were
absent or were otherwise non-respondents. Part of the field operation therefore
involves the collection and the careful classification of these data about sampled
students via tracking forms completed by school level and/or test administration
staff.
Inevitably there will be some differences across participants in how exclusions are
applied and these of course affect comparability. Table 2 shows an extract from the
exclusion rate tables published in the PISA 2012 Technical Report (OECD, 2014) that
provides an example of the variations in rates of exclusion across selected countries.
This highlights that exclusion rates are an important consideration when comparing,
for example, Korea’s outcomes with those of Canada or Norway.

Population definitions for comparative surveys in education
P a g e | 21
Table 2: Variations in rates of exclusion at a school level, within-school level and
overall for PISA 2012
Source. (OECD, 2014).
Survey response
A key point of comparison between participants will be the rates of response of
sampled institutions and students to the survey. With non-response comes the
possibility of bias in the estimates derived from the responses. In other words, the
possibility that respondents and non-respondents differ with respect to survey
outcomes. The lower the response rate, the greater the chance of non-response
bias. While measures are taken – particularly through the weighting of survey data –
to address non-response, these can only attempt to ameliorate the potential effects
and are no guarantee against the possibility of non-response bias.
The surveys discussed in this paper set response rate standards prior to survey
fieldwork commencement that participants strive to achieve. When response rates
are not achieved by a participant, options to address this include providing further
evidence to show that the responding sample is unbiased, attaching ‘data flags’ to
outcomes in comparison tables, ‘above- and below the line’ reporting, or the
removal of a participant’s outcomes from comparison tables.
In PISA, for example, response rate standards are clearly presented to participants at
the start of the survey. There are response rates which are identified as clearly
meeting the standard, and other rates that clearly do not meet the standard. Then
there is an area in between, where participants have the opportunity to present
further evidence that their responding sample is not biased. Those cases are
assessed by the sampling contractor, the separately appointed international
sampling referee and the Technical Advisory Group as part of the PISA Data
Adjudication process. The outcomes of data adjudication decisions are reported in
the PISA Technical Report (see for example, OECD, 2014).
In PISA, there have been a number of cases where a participant’s data has been
deemed of insufficient quality for inclusion in the international comparison tables. For
example the Netherlands was removed from international comparison tables in 2000
and the United Kingdom in 2003.

Population definitions for comparative surveys in education
P a g e | 22
Survey reporting
As illustrated in this paper, while the basic population definition that forms the basis
of the survey will be concise and transferable across multiple contexts, the key
components that underpin that definition lead to international, national and local
variations in participation. An important part of the reporting of these surveys is to
quantify these variations in as much detail as possible.
Below are some examples of reporting with respect to the TIMSS 2011 survey of
students at Grade 8. With such a long experience in comparative survey work in
education, reports from the IEA studies give an excellent insight into how local
variations to international population definitions can be reported. (The same also
applies with respect to the reports from the PISA survey).
Following the examples from TIMSS reporting are some extracts from an institutional
report developed for the AHELO study. The AHELO reporting compares an individual
institution with all institutions that participated internationally, as well as making
comparisons against various profile markers such as the size of the institution, the
source of funding or the highest degree offered.
Reporting Example 1: TIMSS 2011 Grade 8
Table 3: Coverage of TIMSS 2011 target population – grade 8 (extract)
Source. (Joncas, 2012b).
The information included in Table 3 summarises the overall rate of coverage of each
countries’ target population and the rates of exclusions at a school-level, within-
sample level and overall for each country. As shown here, the coverage of students
in Georgia has been reduced to students taught in the national language. This
reduction in coverage has been quantified to help aid in the interpretation of
comparisons. Note that a much higher rate of exclusions occurred in Israel at both

Population definitions for comparative surveys in education
P a g e | 23
the school-level and within–school level. This clearly will affect comparability
between Israel and other participants.
Table 4: Weighted school, class and student participation rates – TIMSS – grade 8
(extract)
Source. (Joncas, 2012a).
As shown in Table 4, England experienced a relatively low rate of school
participation. The data flag for England notes that they required replacement
schools to ‘nearly satisfy’ the guidelines for participation rates. Table 5:
Information about the students assessed in TIMSS 2011 (extract)
Source. (Mullis, Martin, Foy, & Arora, 2012).

Population definitions for comparative surveys in education
P a g e | 24
TIMSS provides quite detailed information, as shown in Table 5, about the national
name for the grade, the average age at the time of testing, and details regarding
entry age and promotion and retention.
Table 6: School sample sizes from TIMSS 2011 (extract)
Source. (Mullis et al., 2012).
Table 6 includes a summary of the school sample, participation and number of
replacement schools. This shows that Chile, Italy and Japan each used a relatively
high number of replacement schools in their participation relative to other countries.
Population definitions for comparative surveys in education
P a g e | 25
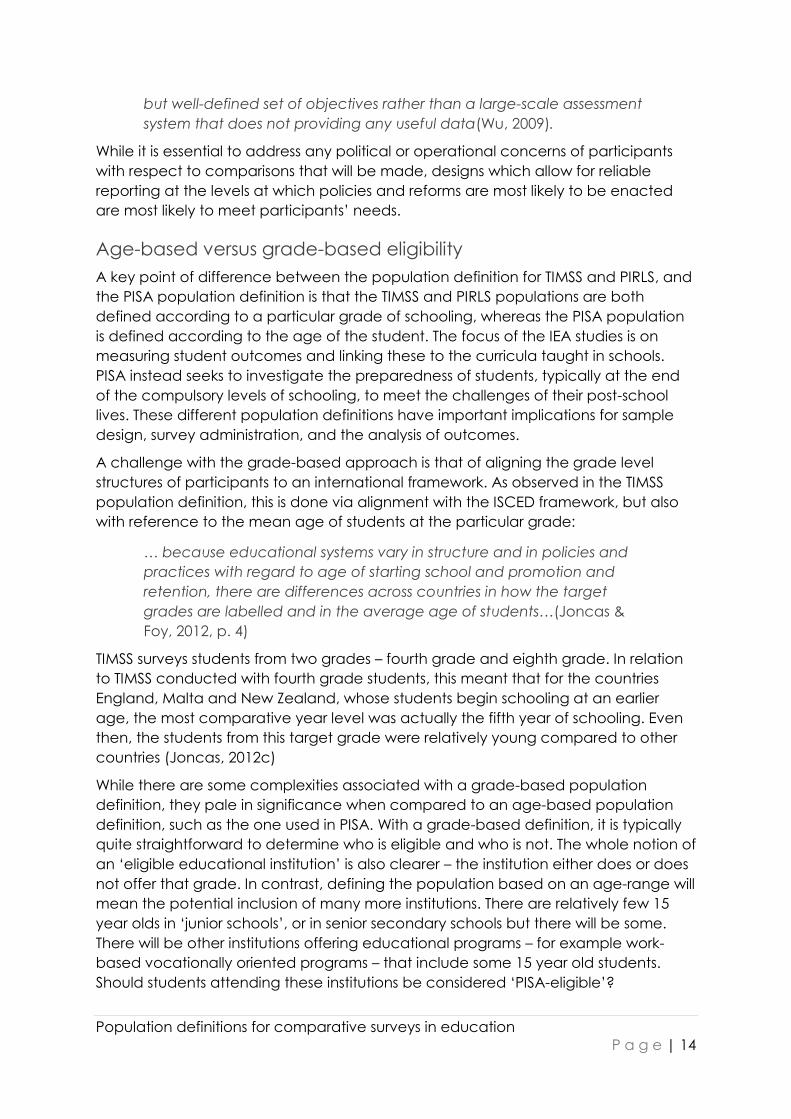
Table 7: Student sample sizes – TIMSS 2011 (extract)
Source. (Mullis et al., 2012).
Table 7 shows the student sample sizes by country, and includes information on the
participation rates of students, the number of students sampled, number of students
who withdrew from the class or school, the number of exclusions, the number of
absent students and the total number of students who participated in the
assessment. This information shows that the numbers of students withdrawn,
excluded or absent vary quite considerably between participating countries.

Population definitions for comparative surveys in education
P a g e | 26
Figure 2: Croatia’s TIMSS 2011 sampling summary
Source. (Joncas, 2012d)
TIMSS provides a report for each country with quite detailed information about
coverage and exclusions, stratification, institution type and participation over the
sampled strata. An example of the type of information given to countries is shown in
Figure 2.
Reporting Example 2: AHELO Engineering Strand Institutional
Report
This section includes extracts from the AHELO Engineering strand institutional reports.
These extracts provide an example of the type of information that institutions receive
about sampling, participation and results. The extracts are taken from one of the
participating institution’s report.

Population definitions for comparative surveys in education
P a g e | 27
Table 8: AHELO Engineering Strand participation statistics
Source. (OECD, 2012a).
As shown in Table 8, internationally, 92 institutions participated in the Engineering
strand of the AHELO feasibility study. The names of the participating institutions and
their countries are provided at the end of the institution report1. This table shows that
the populations of Engineering students and staff from these 92 institutions were
10,875 and 2,312 respectively. This institution had 174 students and 22 faculties in the
target population, with all participating in the survey.
Table 9: AHELO Engineering Strand institution characteristics and scores
Source. (OECD, 2012a).
The institution’s performance on the Engineering assessment (the mean (X) and
standard deviation (SD) in the top row) is shown in Table 9. This also shows these
1 In the case of Japan, the institution names are provided as ‘Institution 1’, ‘Institution 2’, etc.
Population definitions for comparative surveys in education
P a g e | 28
results compared against aggregated results for all participating institutions by
different institutional profiles. The institution can identify its profile among the different
profiles and use this to compare its performance with others of a similar profile, as a
way of evaluating its performance relative to others similar institutions. There are
several such profile comparisons provided in the full report.
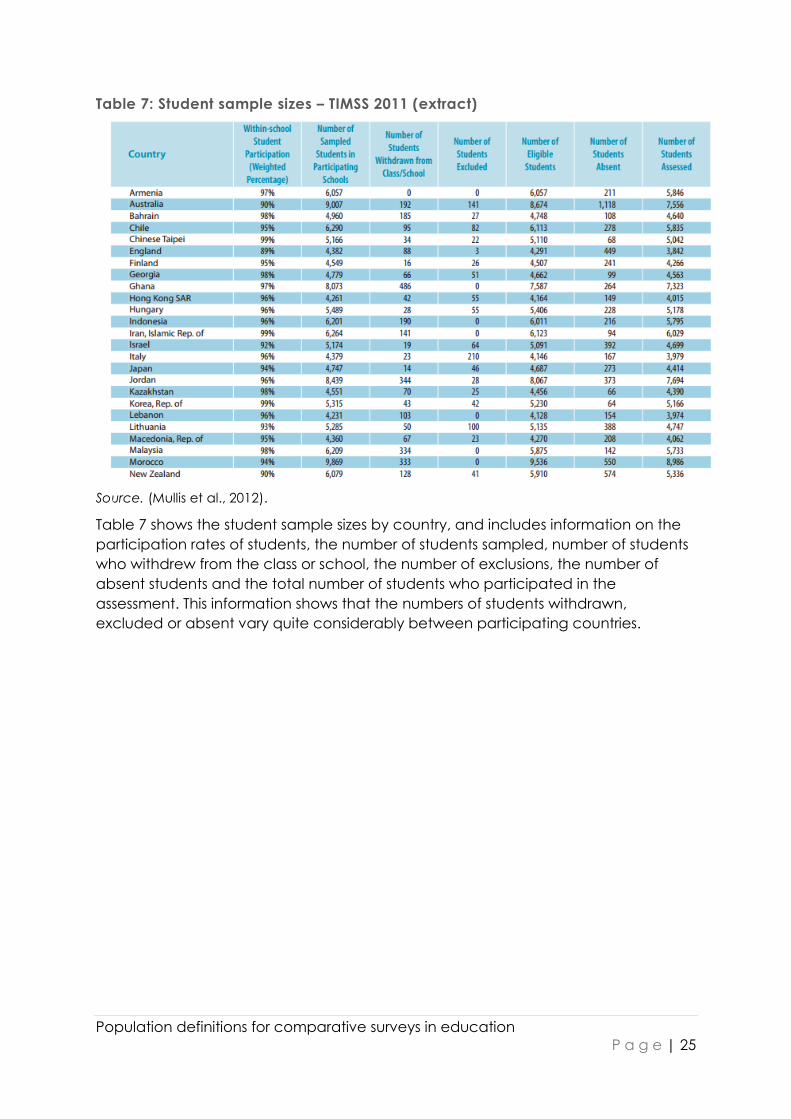
Table 10: AHELO Engineering Strand demographic characteristics and scores
Source. (OECD, 2012a).
Table 10 provides an indication of the demographic profile of students who
participated in the AHELO feasibility study at this particular institution as well as all
other institutions that participated in the survey.

Population definitions for comparative surveys in education
P a g e | 29
Figure 3: AHELO Engineering Strand mean scores for all participating institutions
and this institution
Source. (OECD, 2012a).
Figure 3 displays the mean score of the institution (shown as a larger point on the
graph). This is shown compared with the means for all other participating institutions.
This graph also indicates whether the student sample for the institution was random
or non-random.

Population definitions for comparative surveys in education
P a g e | 30
Table 11: AHELO Engineering Strand education characteristics and scores
Source. (OECD, 2012a).
Table 11 provides a summary of students’ overall score for this particular institution
reported by student responses relating to their course experience, the extent to
which they report they have developed professional skills and knowledge, and their
future plans. These comparisons also help institutions to contextualise the results from
the survey, and to understand differences among their student cohort.
Conclusion
Population definitions have evolved in the major international comparative surveys
in education – TIMSS, PISA, PIRLS, AHELO and others – over time. As these surveys
have matured, and as participation has broadened beyond the member states of
the IEA and the OECD, the surveys have better been able to accommodate sub-
national as well as national comparisons. At least in some cases, those comparisons
involving sub-national entities – for example states or provinces of a country – are
likely to provide insights at least as useful to policy makers within those countries
because these levels are where much of the educational policy development and
practice is driven. Along with the benefits and experiences that come from
participating in these high quality surveys at the international level – such as building
capacity in the conduct of large scale surveys for national survey work; building
networks with like-minded colleagues; obtaining useful insights into outcomes
nationally and how they relate to educational structures and other background
Population definitions for comparative surveys in education
P a g e | 31
factors – countries can consider more specific national needs and consider
participation of sub-national entities.
How a survey population is defined can lead to profound consequences in the
operations of a survey and with respect to data analysis and reporting. The
difference between the grade-based, curriculum-based IEA studies and the age-
based PISA survey for example has led to different interpretations of outcomes: one
more focussed on schools and curriculum, the other with a broader ‘literacy’
perspective. Both have resonated strongly with the educational community
internationally as evidenced by the continued strong participation in these surveys.
A key component of the success of these surveys has been the extensive work in
documenting national variations to the international population definition
framework. These allow the reader to evaluate comparability across a wide range
of factors. Given the sheer scale of the activity of these international surveys,
outcomes are necessarily somewhat ‘broad brush’. But with the very detailed
reporting of national variations within the international framework, researchers and
policy makers from a particular country or sub-national entity have a much better
chance of identifying similarities and differences with other countries and contexts
and be motivated to investigate these contexts more deeply as part of their efforts
to improve the provision of education within their own system.

Population definitions for comparative surveys in education
P a g e | 32
References
Döbert, H., Klieme, E., & Sroka, W. (Eds.). (2004). Conditions of school performance in
seven countries: A quest for understanding the international variation of PISA
results. Münster, Germany: Waxmann Verlag.
Dumais, J., Coates, H., & Richardson, S. (2011). AHELO sampling manual. Assessment
of Higher Education Learning Outcomes (AHELO). Paris, France. Retrieved from
http://search.oecd.org/officialdocuments/displaydocumentpdf/?cote=EDU/IM
HE/AHELO/GNE(2011)21/ANN3/FINAL&doclanguage=en
Hutchison, D., & Schagen, I. (2007). Comparisons between PISA and TIMSS: Are we
the man with two watches? In T. Loveless (Ed.), Lessons learned: What
international assessments tell us about math achievement (pp. 227–262).
Washington, DC: Brookings Institution Press. http://doi.org/10.7864/j.ctt12800b.13
Joncas, M. (2007). PIRLS 2006 sample design. In M. O. Martin, I. V. S. Mullis, & A. M.
Kennedy (Eds.), PIRLS 2006 Technical Report. Chestnut Hill, MA: TIMSS & PIRLS
International Study Center, Boston College. Retrieved from
http://timss.bc.edu/PDF/P06_TR_Chapter4.pdf
Joncas, M. (2012a). Meeting TIMSS 2011 standards for sampling participation. In M.
O. Martin & I. V. S. Mullis (Eds.), Methods and Procedures in TIMSS and PIRLS 2011.
Chestnut Hill, MA: TIMSS & PIRLS International Study Center, Boston College.
Retrieved from
http://timssandpirls.bc.edu/methods/pdf/T11_Standards_Sampling.pdf
Joncas, M. (2012b). TIMSS 2011 population coverage and exclusions. In M. O. Martin
& I. V. S. Mullis (Eds.), Methods and Procedures in TIMSS and PIRLS 2011. Chestnut
Hill, MA: TIMSS & PIRLS International Study Center, Boston College. Retrieved from
http://timssandpirls.bc.edu/methods/pdf/T11_Pop_Coverage.pdf
Joncas, M. (2012c). TIMSS 2011 target population sizes. In M. O. Martin & I. V. S. Mullis
(Eds.), Methods and Procedures in TIMSS and PIRLS 2011. Chestnut Hill, MA: TIMSS
& PIRLS International Study Center, Boston College. Retrieved from
http://timss.bc.edu/methods/pdf/T11_Pop_Sizes.pdf
Joncas, M. (2012d). TIMSS 2011: Characteristics of national samples. In M. O. Martin &
I. V. S. Mullis (Eds.), Methods and Procedures in TIMSS and PIRLS 2011. Chestnut
Hill, MA: TIMSS & PIRLS International Study Center, Boston College. Retrieved from
http://timssandpirls.bc.edu/methods/pdf/T11_Characteristics.pdf
Joncas, M., & Foy, P. (2012). Sample design in TIMSS and PIRLS. In M. O. Martin & I. V.
S. Mullis (Eds.), Methods and Procedures in TIMSS and PIRLS 2011. Chestnut Hill,
MA: TIMSS & PIRLS International Study Center, Boston College. Retrieved from
http://timssandpirls.bc.edu/methods/pdf/TP_Sampling_Design.pdf
Loveless, T. (2014). The 2014 Brown Center report on American education: How well
are American students learning? 2014 Brown Center Report on American
Education. Washington, DC. Retrieved from
http://www.brookings.edu/~/media/research/files/reports/2014/03/18-brown-
center-report/2014-brown-center-report_final.pdf
Mullis, I. V. S., Martin, M. O., Foy, P., & Arora, A. (2012). TIMSS 2011 international results
in mathematics. Chestnut Hill, MA: TIMSS & PIRLS International Study Center,

Population definitions for comparative surveys in education
P a g e | 33
Boston College. Retrieved from
http://timssandpirls.bc.edu/timss2011/downloads/T11_IR_M_FrontMatter.pdf
OECD. (2009). PISA data analysis manual: SPSS (2nd ed.). Paris: PISA, OECD
Publishing. http://doi.org/10.1787/9789264056275-en
OECD. (2012a). AHELO feasibility study institution report: AHELO Engineering
University: Civil engineering learning outcomes. Unpublished report.
OECD. (2012b). PISA 2009 technical report. PISA, OECD Publishing.
http://doi.org/10.1787/9789264167872-en
OECD. (2013a). Lessons from PISA 2012 for the United States, strong performers and
successful reformers in education. OECD Publishing.
http://doi.org/10.1787/9789264207585-en
OECD. (2013b). PISA 2012 results: What makes schools successful? Resources, policies
and practices (Volume IV). PISA, OECD Publishing.
http://doi.org/10.1787/9789264201156-en
OECD. (2014). PISA 2012 technical report. PISA, OECD Publishing. Retrieved from
http://www.oecd.org/pisa/pisaproducts/PISA-2012-technical-report-final.pdf
OECD. (2015). PISA 2015 technical standards. Paris, France. Retrieved from
http://www.oecd.org/pisa/pisaproducts/PISA-2015-Technical-Standards.pdf
Wu, M. (2009). Issues in large-scale assessments. In Pacific Rim Objective
Measurement Symposium 2009. Hong Kong. Retrieved from
http://www.edmeasurement.com.au/_publications/margaret/Issues_in_large_sc
ale_assessments.pdf
Wu, M. (2010). Comparing the similarities and differences of PISA 2003 and TIMSS
(OECD Education Working Papers No. 32). Paris: OECD Publishing. Retrieved
from http://dx.doi.org/10.1787/5km4psnm13nx-en
Related Documents