REPORT Population connectivity and the effectiveness of marine protected areas to protect vulnerable, exploited and endemic coral reef fishes at an endemic hotspot M. H. van der Meer • M. L. Berumen • J.-P. A. Hobbs • L. van Herwerden Received: 23 April 2014 / Accepted: 3 November 2014 Ó Springer-Verlag Berlin Heidelberg 2014 Abstract Marine protected areas (MPAs) aim to mitigate anthropogenic impacts by conserving biodiversity and pre- venting overfishing. The effectiveness of MPAs depends on population connectivity patterns between protected and non- protected areas. Remote islands are endemism hotspots for coral reef fishes and provide rare examples of coral reefs with limited fishing pressure. This study explored popula- tion genetic connectivity across a network of protected and non-protected areas for the endemic wrasse, Coris bulbi- frons, which is listed as ‘‘vulnerable’’ by the IUCN due to its small, decreasing geographic range and declining abun- dance. Mitochondrial DNA (mtDNA) and microsatellite DNA (msatDNA) markers were used to estimate historic and contemporary gene flow to determine the level of population self-replenishment and to measure genetic and genotypic diversity among all four locations in the species range (south-west Pacific Ocean)—Middleton Reef (MR), Eliza- beth Reef (ER), Lord Howe Island (LHI) and Norfolk Island (NI). MPAs exist at MR and LHI and are limited or non- existent at ER and NI, respectively. There was no obvious differentiation in mtDNA among locations, however, msatDNA revealed differentiation between the most peripheral (NI) and all remaining locations (MR, ER and LHI). Despite high mtDNA connectivity (M = 259–1,144), msatDNA connectivity was limited (M = 3–9) with high self-replenishment (68–93 %) at all locations. NI is the least connected and heavily reliant on self-replenishment, and the absence of MPAs at NI needs to be rectified to ensure the persistence of endemic species at this location. Other endemic fishes exhibit similar patterns of high self-replen- ishment across the four locations, indicating that a single spatial management approach consisting of a MPA network protecting part of each location could provide reasonable protection for these species. Thus, the existing network of MPAs at this endemic hotspot appears adequate at some locations, but not at all. Keywords Endemic hotspot Á Lord Howe Island Á Marine protected areas Á Management Á Overfishing Introduction Coral reefs worldwide have been impacted by disease, hurricanes, human overpopulation, eutrophication and global climate change (Hughes et al. 2003). However, fishing has had the most direct and wide-ranging influence Communicated by Biology Editor Dr. Mark Vermeij Electronic supplementary material The online version of this article (doi:10.1007/s00338-014-1242-2) contains supplementary material, which is available to authorized users. M. H. van der Meer (&) Á L. van Herwerden Molecular Ecology and Evolution Laboratory, School of Marine and Tropical Biology, James Cook University, Townsville 4811, Australia e-mail: [email protected] M. H. van der Meer ARC Centre of Excellence for Coral Reef Studies, James Cook University, Townsville 4811, Australia M. L. Berumen Red Sea Research Center, King Abdullah University of Science and Technology, Thuwal 23955, Saudi Arabia J.-P. A. Hobbs Department of Environment and Agriculture, Curtin University, Perth, WA 6845, Australia L. van Herwerden Centre for Sustainable Tropical Fisheries and Aquaculture, James Cook University, Townsville 4811, Australia 123 Coral Reefs DOI 10.1007/s00338-014-1242-2

Welcome message from author
This document is posted to help you gain knowledge. Please leave a comment to let me know what you think about it! Share it to your friends and learn new things together.
Transcript
REPORT
Population connectivity and the effectiveness of marine protectedareas to protect vulnerable, exploited and endemic coral reeffishes at an endemic hotspot
M. H. van der Meer • M. L. Berumen •
J.-P. A. Hobbs • L. van Herwerden
Received: 23 April 2014 / Accepted: 3 November 2014
� Springer-Verlag Berlin Heidelberg 2014
Abstract Marine protected areas (MPAs) aim to mitigate
anthropogenic impacts by conserving biodiversity and pre-
venting overfishing. The effectiveness of MPAs depends on
population connectivity patterns between protected and non-
protected areas. Remote islands are endemism hotspots for
coral reef fishes and provide rare examples of coral reefs
with limited fishing pressure. This study explored popula-
tion genetic connectivity across a network of protected and
non-protected areas for the endemic wrasse, Coris bulbi-
frons, which is listed as ‘‘vulnerable’’ by the IUCN due to its
small, decreasing geographic range and declining abun-
dance. Mitochondrial DNA (mtDNA) and microsatellite
DNA (msatDNA) markers were used to estimate historic and
contemporary gene flow to determine the level of population
self-replenishment and to measure genetic and genotypic
diversity among all four locations in the species range
(south-west Pacific Ocean)—Middleton Reef (MR), Eliza-
beth Reef (ER), Lord Howe Island (LHI) and Norfolk Island
(NI). MPAs exist at MR and LHI and are limited or non-
existent at ER and NI, respectively. There was no obvious
differentiation in mtDNA among locations, however,
msatDNA revealed differentiation between the most
peripheral (NI) and all remaining locations (MR, ER and
LHI). Despite high mtDNA connectivity (M = 259–1,144),
msatDNA connectivity was limited (M = 3–9) with high
self-replenishment (68–93 %) at all locations. NI is the least
connected and heavily reliant on self-replenishment, and the
absence of MPAs at NI needs to be rectified to ensure the
persistence of endemic species at this location. Other
endemic fishes exhibit similar patterns of high self-replen-
ishment across the four locations, indicating that a single
spatial management approach consisting of a MPA network
protecting part of each location could provide reasonable
protection for these species. Thus, the existing network of
MPAs at this endemic hotspot appears adequate at some
locations, but not at all.
Keywords Endemic hotspot � Lord Howe Island �Marine
protected areas � Management � Overfishing
Introduction
Coral reefs worldwide have been impacted by disease,
hurricanes, human overpopulation, eutrophication and
global climate change (Hughes et al. 2003). However,
fishing has had the most direct and wide-ranging influence
Communicated by Biology Editor Dr. Mark Vermeij
Electronic supplementary material The online version of thisarticle (doi:10.1007/s00338-014-1242-2) contains supplementarymaterial, which is available to authorized users.
M. H. van der Meer (&) � L. van Herwerden
Molecular Ecology and Evolution Laboratory, School of Marine
and Tropical Biology, James Cook University, Townsville 4811,
Australia
e-mail: [email protected]
M. H. van der Meer
ARC Centre of Excellence for Coral Reef Studies, James Cook
University, Townsville 4811, Australia
M. L. Berumen
Red Sea Research Center, King Abdullah University of Science
and Technology, Thuwal 23955, Saudi Arabia
J.-P. A. Hobbs
Department of Environment and Agriculture, Curtin University,
Perth, WA 6845, Australia
L. van Herwerden
Centre for Sustainable Tropical Fisheries and Aquaculture,
James Cook University, Townsville 4811, Australia
123
Coral Reefs
DOI 10.1007/s00338-014-1242-2
on coral reefs and other marine ecosystems (Jackson et al.
2001). With anthropogenic pressures increasing (Steffen
et al. 2007), natural resource managers have established
marine protected areas (MPAs) to conserve biodiversity
and protect fisheries stocks from overfishing. When
designing MPAs, managers rarely have empirical evidence
of levels of genetic connectivity among locations, forcing
implementations based on ‘‘best guesses’’ (McCook et al.
2009).
Remote islands often represent rare examples of coral
reefs with limited fishing pressure and thus provide a
unique opportunity to assess how coral reef ecosystems
function with limited human impacts. For example, the
remote and lightly fished north-west Hawaiian Islands
support significantly more fish biomass than the heavily
fished main Hawaiian Islands (Friedlander and DeMartini
2002). Remote islands are also hotspots for coral reef fish
endemicity (Jones et al. 2002), with a high proportion of
their communities comprised of endemic species. While
terrestrial endemics on remote islands are well known for
their vulnerability to extinction (Whittaker 1998), much
less is known about the vulnerability of their marine
counterparts. The presence of endemic hotspots on isolated
islands with lesser human impacts provides an ideal
opportunity to examine inherent vulnerabilities of marine
endemics.
In the Pacific, the locations with the greatest proportion
of endemic coral reef fishes include: Hawaii (25 % ende-
mism), Easter Island (22.2 %), the Marquesas (11.6 %),
Lord Howe and Norfolk Islands (7.2 %) and Rapa Iti
(5.5 %) (Randall 1998, 2001, 2007). The Lord Howe Island
region in the south-west Pacific Ocean consists of four
oceanic features: Middleton Reef (MR), Elizabeth Reef
(ER), Lord Howe Island (LHI) and Norfolk Island (NI)
(Fig. 1). These remote locations harbour tropical habitats
dominated by scleractinian corals that transition into tem-
perate habitats dominated by macroalgae (Johannes et al.
1983). The remoteness and transition between habitats
makes these islands and reefs endemism hotspots for both
coral and algae reef fishes. Lastly, these locations present
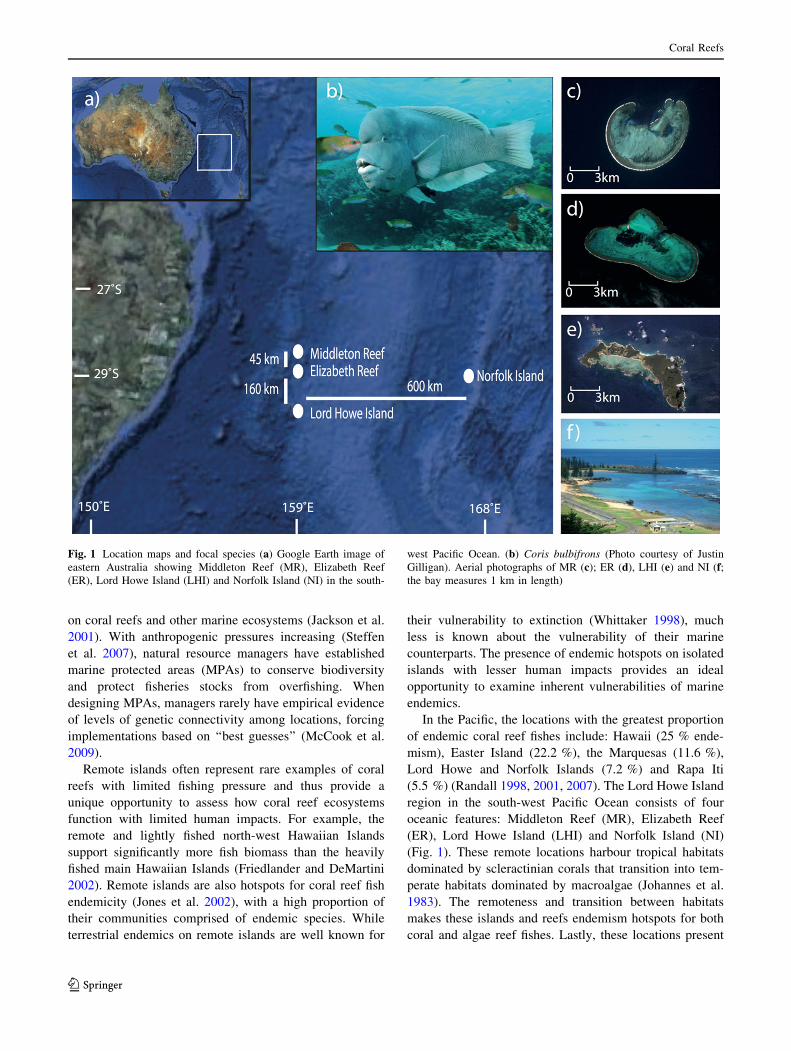
Fig. 1 Location maps and focal species (a) Google Earth image of
eastern Australia showing Middleton Reef (MR), Elizabeth Reef
(ER), Lord Howe Island (LHI) and Norfolk Island (NI) in the south-
west Pacific Ocean. (b) Coris bulbifrons (Photo courtesy of Justin
Gilligan). Aerial photographs of MR (c); ER (d), LHI (e) and NI (f;the bay measures 1 km in length)
Coral Reefs
123
an ideal study system for genetic connectivity (i.e., gene
flow) of endemic species since reef fishes occur on only
four discrete islands/reefs that are separated by known
distances (45–600 km).
The doubleheader wrasse (Coris bulbifrons, Randall and
Kuiter 1982) is an iconic reef fish endemic to MR, ER, LHI
and NI (Francis 1993). This large wrasse (maximum total
length = 65 cm, Choat et al. 2006a) is targeted for food in
recreational fisheries. It is locally abundant in sheltered
habitats at MR (0.33/100 m2), ER (0.28/100 m2) and LHI
(0.35/100 m2) (Choat et al. 2006a; Hobbs and Feary 2007;
Hobbs et al. 2009), but rare at NI (0.007/100 m2; authors
pers obs). The current network of MPAs provides diverse
levels of protection to C. bulbifrons: MR is fully protected
with no fishing allowed. ER allows recreational line and
spearfishing of ten C. bulbifrons per person per day, but no
commercial or charter fishing. However, there are very few
boats capable of travelling out to ER and combined with
poor weather for the majority of the year, few fish are
thought to be caught at ER. LHI has MPAs (no take areas)
and catch restrictions of one C. bulbifrons per person per
day in areas open to linefishing (but no spearfishing is
allowed). While fishing of C. bulbifrons does occur at Lord
Howe Island, very few individuals are kept because there is
a programme of catch and release. At NI, there are no
MPAs and no catch restrictions for C. bulbifrons. Despite
no protection or bag limits at NI, C. bulbifrons is not tar-
geted due to the abundance of other higher quality fish.
C. bulbifrons is listed as vulnerable by the IUCN due to
the (1) small area of occupancy (\2,000 km2), (2) severely
fragmented distribution (occurs at only four isolated loca-
tions), (3) declining area of occupancy and (4) declining
number of mature individuals (Choat and Pollard 2010).
Determining the temporal and spatial scales of genetic
connectivity (gene flow) between the four locations where
C. bulbifrons occurs is essential to establish how popula-
tions are maintained, replenished and in the event of a local
extinction, what rescue options would be best. It is clear
that this vulnerable species requires effective conservation
management, especially in light of rapid population
declines seen in other large wrasses following minimal
fishing (Choat et al. 2006b).
Complete sampling throughout the entire range of a
species distribution is rare in studies of coral reef fishes
despite its importance to accurately estimate gene flow
(historic and contemporary). Historic gene flow uses
mtDNA to determine genetic exchange between popula-
tions that may have been isolated over thousands of gen-
erations (Hellberg 2009). Contemporary gene flow uses
msatDNA to determine genetic exchange over a single or
few generations by estimating either self-replenishment
(i.e., contemporary timescales of 2–3 generations; inferred
indirectly from a small sample size using genetic markers
and subsequent assignment tests, in a population genetics
context) or self-recruitment (i.e., current time scales of one
generation; inferred directly by natural or artificial otolith
tags, or nearly complete sampling of whole populations
from various locations) to determine if populations are
contemporarily open, closed or intermediate (e.g., Swearer
et al. 1999; Planes 2002).
In this study, we estimate both historic and contempo-
rary gene flow to establish which locations export and
which locations import migrants and to identify genetic
diversity of different subpopulations. The latter can serve
as a potential indicator of genetic resilience (or lack
thereof) to environmental change and extinction (Johan-
nesson and Andre 2006). Such information will inform
management agencies how to target conservation efforts by
determining which location(s) are most vulnerable and
therefore need the greatest levels of protection. Previous
research on two other endemic species within this system
(MR, ER, LHI, and NI) found concordant patterns in
population genetic connectivity (van der Meer et al. 2012a,
b, 2013a). Combining results from three endemic species
that differ in biological and ecological traits provides a
valuable framework to test population genetic connectivity
across this endemic hotspot. Collectively, this information
provides important guidance as to whether the same man-
agement approach could successfully protect a wide range
of species.
Four primary aims underpin this study: (1) to estimate
patterns of gene flow among locations/subpopulations of C.
bulbifrons using mtDNA and msatDNA; (2) to estimate
levels of self-replenishment (a proxy for self-recruitment)
based on msatDNA assignment and exclusion analyses of
C. bulbifrons; (3) to estimate C. bulbifrons population
genetic diversities at all locations/subpopulations as a
measure of genetic resilience to environmental change; and
(4) to place the above results into a general framework that
compares genetic estimates of patterns and levels of gene
flow, levels of self-replenishment and genetic diversity,
among different species from this endemism hotspot. This
information will determine whether a single spatial man-
agement strategy is appropriate for conserving endemic
reef fishes within the Lord Howe–Norfolk Island endemic
hotspot.
Materials and methods
We combined estimates of historic (mtDNA) and con-
temporary (msatDNA) gene flow to provide a compre-
hensive overview of genetic dispersal over a range of
timescales (Hellberg 2009; Leis et al. 2011). Using 17
polymorphic microsatellite loci, (van der Meer et al.
2013b) helped to compensate for small sample sizes
Coral Reefs
123
(Selkoe and Toonen 2006), while sampling all known
locations left no unsampled ‘‘ghost’’ populations which can
affect key contemporary genetic estimates (Beerli 2004).
Our estimates for ‘‘self-replenishment’’ inferred indirectly
from genetic markers are merely a proxy for self-recruit-
ment, which is typically assessed using direct methods
(e.g., natural or artificial otolith tags), such as those used by
Swearer et al. (1999) and Jones et al. (2005). Lastly, dif-
ferences in mortality (natural and anthropogenic) between
locations can alter estimates of realised connectivity (Co-
wen and Sponaugle 2009). It is unclear if there are dif-
ferences in natural mortality between the four locations,
however, fishing mortality rates are probably low at all
locations. If natural mortality rates are similar between the
four locations, then the patterns of realised connectivity
described here are likely to reflect patterns of larval dis-
persal. However, while fishing mortality is currently low at
the four locations, future fishing mortality may pose a risk
at some locations because the four locations have varying
levels of protection in place.
Ethics statement
Fishes were collected by spearfishing and fin clipped or
were anaesthetised underwater with clove oil, fin clipped
in situ and released alive: MR (n = 20), ER (n = 10), LHI
(n = 37) and NI (n = 16) (Permit Numbers: LHIMP08/
R01, 003-RRRWN-110211-02, P11/0035-1.0; Animal
ethics: A1605).
Study system
We sampled C. bulbifrons throughout its entire geo-
graphic range. MR, ER and LHI are referred to as the
‘‘western region’’ for C. bulbifrons because they occur on
the same geographic feature (Lord Howe Island Rise) are
relatively close to each other (Fig. 1) and support higher
abundances (Choat et al. 2006a; Hobbs et al. 2009). In
contrast, NI is referred to as the ‘‘peripheral location’’ for
this species because it is the only location situated on a
separate geographic feature (Norfolk Island Rise), which
is isolated by more than 600 km of deep water from the
western region (Fig. 1) and has a much lower abundance
(authors pers. obs.). Coris bulbifrons inhabits shallow
(\40 m) reef habitats and adults will not traverse deep
oceanic waters to disperse between the four locations.
However, C. bulbifrons has a relatively long Pelagic
Larval Duration (PLD; mean duration 36 days; authors
pers comm) suggesting that it is capable of dispersing
between locations (e.g., Shanks 2009) especially when
aided by the complex regional oceanographic currents
(Suthers et al. 2011).
Gene flow between locations: mtDNA
mtDNA phylogenetic analysis
To identify any clear divisions in population genetic
structure in C. bulbifrons, the non-coding (D loop) was
sequenced following van der Meer et al. (2012a, b, 2013a).
Fin clips from three Coris gaimard individuals were col-
lected from Christmas Island (Indian Ocean) to use as an
outgroup (Barber and Bellwood 2005). jModeltest (Posada
2008) identified a GTR?G model based on AIC
(c = 0.271). Three commonly used phylogenetic analyses
[Maximum Likelihood (ML), Maximum Parsimony (MP)
and Bayesian Inference (MrBayes, MB, BEAST)] were
performed on aligned mtDNA sequence data. A Minimum
Spanning Tree (MST) was generated based on output
obtained from ARLEQUIN 3.5 (Excoffier et al. 2005) in
order to explicitly identify shared haplotypes among C.
bulbifrons from the four locations (MR, ER, LHI and NI).
Patterns of gene flow (mtDNA)
To obtain reliable estimates of mtDNA gene flow given
low sample sizes, samples from ER were pooled with MR,
which was appropriate because pairwise Fst, Discriminant
Analysis of Principal Components (DAPC), STRUCTURE
and GeneClass analyses could not genetically differentiate
the two populations. Thus, C. bulbifrons mtDNA migration
rates (M; number of migrants) were estimated among, and
effective population sizes (h) were estimated within, each
of the three areas (MR–ER, LHI and NI) using MIGRATE-
n 2.4.3 (Beerli 2004).
Gene flow between locations: msatDNA
Patterns of gene flow (msatDNA)
To determine spatial population partitioning based on
msatDNA, we used three molecular analytical tools: (1)
DAPC (Jombart et al. 2010) uses allelic states to discrim-
inate between the four locations, yielding scatterplots of
discriminant functions based on the spatial distributions of
microsatellite genotypes. DAPC also provided posterior
probabilities of population assignments for each individual.
(2) A likelihood-based assignment method was used in
GeneClass2 (Piry et al. 2004) to determine significant inter-
location gene flow. (3) STRUCTURE V2.3 (Pritchard et al.
2000; Hubisz et al. 2009) places individuals into clusters
that minimise Hardy–Weinberg Equilibrium (HWE) and
can be used to identify contemporary gene flow among the
four locations.
As above, to obtain reliable estimates of msatDNA gene
flow given low sample sizes, samples from ER were pooled
Coral Reefs
123
with MR to estimate C. bulbifrons msatDNA migration
rates (M; number of migrants) among, and effective pop-
ulation sizes (h) within, each of the three areas (MR–ER,
LHI, and NI) using MIGRATE-n 2.4.3.
Inferred levels of self-replenishment and recent migration
To determine self-replenishment and recent migration
(both given as a percentage) among locations, we used
BAYESASS v3 (Wilson and Rannala 2003) with a Markov
Chain Monte Carlo (MCMC) method, consisting of a total
of 11 million steps with a 2 million step burn in. Ten
separate runs assessed convergence of the MCMC in order
to evaluate the consistency of results obtained from these
inferences.
Population genetic diversities
To explore differences between locations in molecular
diversity, indices were calculated for mtDNA (haplotype
diversity, h; nucleotide diversity, p) and msatDNA (genetic
diversity, gd) for each location (and as a total of all pooled
samples) in ARLEQUIN 3.5 (Excoffier et al. 2005). Hap-
lotype and nucleotide diversities of the data were inter-
preted as either low with specified cut-off values of h and p(%) \ 0.5 or high if values of h and p (%) were [0.5
(Grant and Bowen 1998).
Results
Gene flow between locations: mtDNA
Patterns of gene flow (mtDNA)
To determine gene flow between the four locations, 341
base pairs of mtDNA (D Loop) were sequenced for 81
C. bulbifrons individuals with a total of 56 polymorphic
sites (parsimony informative = 37). A total of 13 spa-
tially intermixed clades were identified (bootstrap values
[50 %), with Clade 13 comprising 38 % of the entire
sample (n = 31/81) suggesting that mtDNA gene flow
exists between all locations occupied by C. bulbifrons
(Fig. 2a). A Minimum Spanning Tree (MST) identified 56
haplotypes in total, many of which were unique (n = 44;
Fig. 2b).
AMOVA of the mtDNA data revealed little structure
among locations. Comparing the western region (MR, ER
and LHI) with the peripheral location (NI) indicated no
significant genetic variation between regions, Uct = 0.002
(p = 0.752); or among locations within regions,
Usc = 0.004 (p = 0.618; Electronic Supplementary Mate-
rial, ESM S1). All genetic variation occurs within locations,
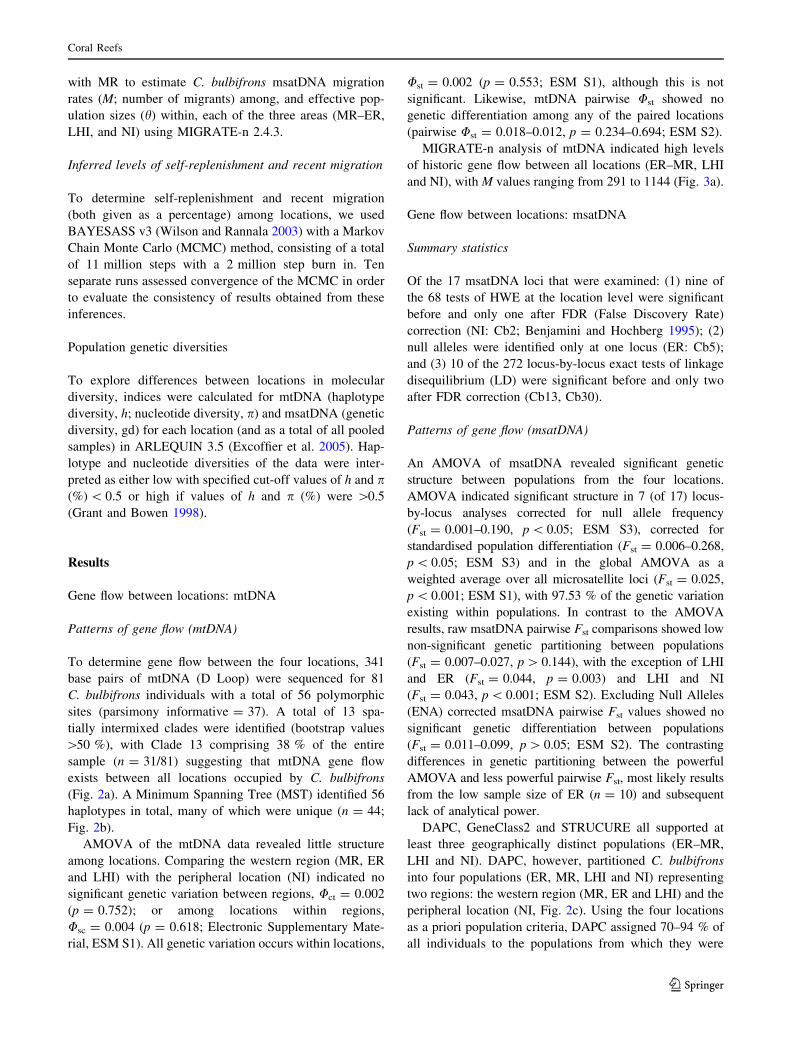
Ust = 0.002 (p = 0.553; ESM S1), although this is not
significant. Likewise, mtDNA pairwise Ust showed no
genetic differentiation among any of the paired locations
(pairwise Ust = 0.018–0.012, p = 0.234–0.694; ESM S2).
MIGRATE-n analysis of mtDNA indicated high levels
of historic gene flow between all locations (ER–MR, LHI
and NI), with M values ranging from 291 to 1144 (Fig. 3a).
Gene flow between locations: msatDNA
Summary statistics
Of the 17 msatDNA loci that were examined: (1) nine of
the 68 tests of HWE at the location level were significant
before and only one after FDR (False Discovery Rate)
correction (NI: Cb2; Benjamini and Hochberg 1995); (2)
null alleles were identified only at one locus (ER: Cb5);
and (3) 10 of the 272 locus-by-locus exact tests of linkage
disequilibrium (LD) were significant before and only two
after FDR correction (Cb13, Cb30).
Patterns of gene flow (msatDNA)
An AMOVA of msatDNA revealed significant genetic
structure between populations from the four locations.
AMOVA indicated significant structure in 7 (of 17) locus-
by-locus analyses corrected for null allele frequency
(Fst = 0.001–0.190, p \ 0.05; ESM S3), corrected for
standardised population differentiation (Fst = 0.006–0.268,
p \ 0.05; ESM S3) and in the global AMOVA as a
weighted average over all microsatellite loci (Fst = 0.025,
p \ 0.001; ESM S1), with 97.53 % of the genetic variation
existing within populations. In contrast to the AMOVA
results, raw msatDNA pairwise Fst comparisons showed low
non-significant genetic partitioning between populations
(Fst = 0.007–0.027, p [ 0.144), with the exception of LHI
and ER (Fst = 0.044, p = 0.003) and LHI and NI
(Fst = 0.043, p \ 0.001; ESM S2). Excluding Null Alleles
(ENA) corrected msatDNA pairwise Fst values showed no
significant genetic differentiation between populations
(Fst = 0.011–0.099, p [ 0.05; ESM S2). The contrasting
differences in genetic partitioning between the powerful
AMOVA and less powerful pairwise Fst, most likely results
from the low sample size of ER (n = 10) and subsequent
lack of analytical power.
DAPC, GeneClass2 and STRUCURE all supported at
least three geographically distinct populations (ER–MR,
LHI and NI). DAPC, however, partitioned C. bulbifrons
into four populations (ER, MR, LHI and NI) representing
two regions: the western region (MR, ER and LHI) and the
peripheral location (NI, Fig. 2c). Using the four locations
as a priori population criteria, DAPC assigned 70–94 % of
all individuals to the populations from which they were
Coral Reefs
123
sampled (assignment per population, ER = 70 %,
MR = 85 %, LHI = 92 %, NI = 94 %; Fig. 4). Geo-
graphical structure in msatDNA was confirmed by Gene-
Class2, where only 16 individuals were grouped with
populations from which they were not sampled MR
(n = 3), ER (n = 4), LHIL (n = 6) and NI (n = 3).
MIGRATE-n indicated gene flow several orders of
magnitude lower using msatDNA when compared to
mtDNA gene flow among populations (MR–ER, LHI and
NI), with number of migrants (M values) ranging from 3 to
20 (Fig. 3b).
Inferred levels of self-replenishment and migrant exchange
Contemporary independence (i.e., gene flow among popu-
lations that is \10 %; Waples and Gaggiotti 2006) is
suggested for five of seven population pair comparisons:
exceptions being ER to LHI (M = 14 %) and MR to LHI
(M = 27 %; Fig. 3c). Conversely, high levels of self-
replenishment (68–93 %) were inferred at all four popu-
lations (Fig. 3c).
Population genetic diversities
Coris bulbifrons showed high haplotype (h), medium
nucleotide (p %) and medium–high genotypic diversities
(gd %) at all locations (h = 0.98–1.00, p % = 1.94–2.54,
gd % = 3.51–4.37; Fig. 2c). The haplotype, nucleotide
and genotypic diversities totalled across all locations were
also high (h = 0.99, p % = 1.95, gd % = 3.84; ESM S1).
Discussion
Studying endemic species geographically restricted to a
small number of discrete and remote locations offers
0.2
Coris gaimard
LHI20
MR2
Coris gaimardCoris gaimard
90/71/100/94
92/0/100/100
99/99/100/100
53/0/0/51
75/0/0/89
52/0/65/67
92/59/0/98
77/0/0/68
84/60/0/92
52/0/0/61
98/95/100/100
90/68/100/95
95/80/100/99
91/0/100/92
77/0/0/76
56/0/99/0
91/0/66/92
93/57/100/100
65/0/100/98
61/66/100/51
MB/ML/MP/BEAST
0.8
0.8
Norfolk Island (NI)
Lord Howe Island (LHI)
Elizabeth Reef (ER)
Middleton Reef (MR)
Clade 1 (n = 6)
Clade 2 (n = 3)
Clade 3 (n = 9)
Clade 4 (n = 4)
Clade 5 (n = 2)
Clade 6 (n = 4)
Clade 7 (n = 3)
Clade 8 (n = 5)
Clade 9 (n = 2)
Clade 10 (n = 3)
Clade 11 (n = 6)
Clade 12 (n = 6)
Clade 13 (n = 31)
551
MR
ER
LHI LH
NI
DA eigenvalues
h = 0.98π% = 1.50gd% = 4.25
h = 0.99π% = 2.04gd% = 3.51
h = 0.96π% = 1.94gd% = 4.37h = 1.00
π% = 2.54gd% = 3.97
ER ER
(a)
(c)
(b)
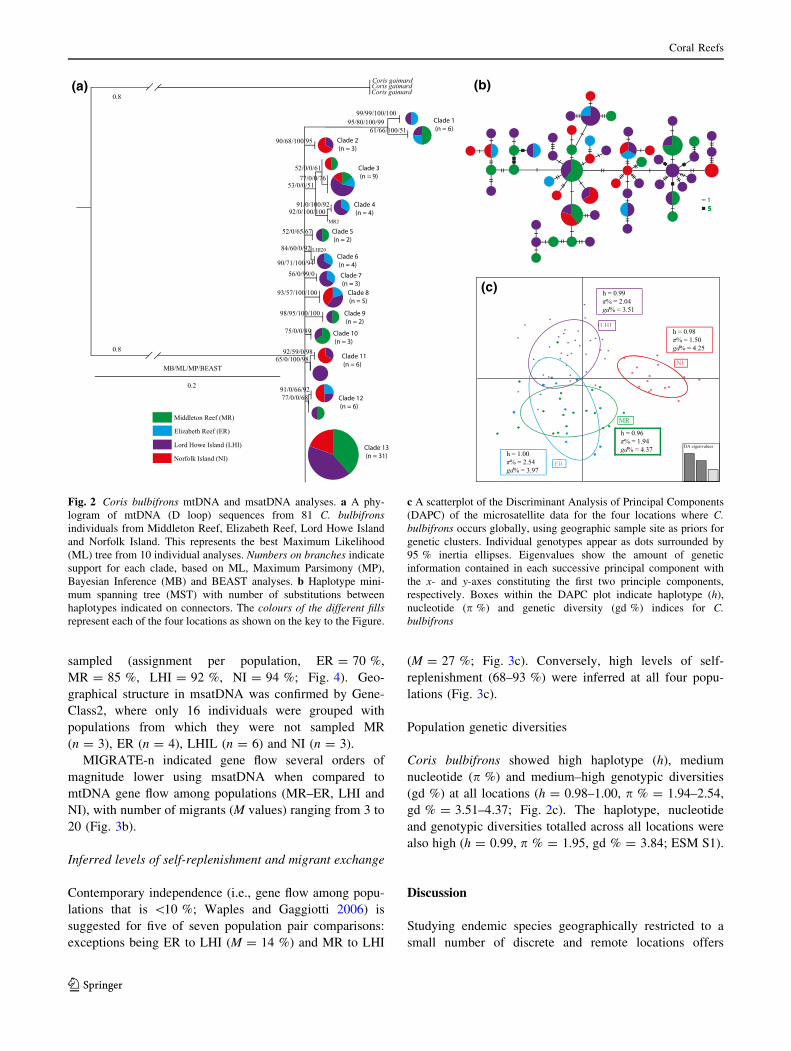
Fig. 2 Coris bulbifrons mtDNA and msatDNA analyses. a A phy-
logram of mtDNA (D loop) sequences from 81 C. bulbifrons
individuals from Middleton Reef, Elizabeth Reef, Lord Howe Island
and Norfolk Island. This represents the best Maximum Likelihood
(ML) tree from 10 individual analyses. Numbers on branches indicate
support for each clade, based on ML, Maximum Parsimony (MP),
Bayesian Inference (MB) and BEAST analyses. b Haplotype mini-
mum spanning tree (MST) with number of substitutions between
haplotypes indicated on connectors. The colours of the different fills
represent each of the four locations as shown on the key to the Figure.
c A scatterplot of the Discriminant Analysis of Principal Components
(DAPC) of the microsatellite data for the four locations where C.
bulbifrons occurs globally, using geographic sample site as priors for
genetic clusters. Individual genotypes appear as dots surrounded by
95 % inertia ellipses. Eigenvalues show the amount of genetic
information contained in each successive principal component with
the x- and y-axes constituting the first two principle components,
respectively. Boxes within the DAPC plot indicate haplotype (h),
nucleotide (p %) and genetic diversity (gd %) indices for C.
bulbifrons
Coral Reefs
123
unique opportunities to examine gene flow throughout a
species entire range. Island systems such as examined in
this study provide valuable empirical data on gene flow
(historic and contemporary) among isolated locations,
separated by known distances and deep oceanic waters.
Here, C. bulbifrons was found to have similar patterns and
levels of mtDNA and msatDNA genetic connectivity, self-
replenishment and genetic diversity as other endemic spe-
cies from this area. This indicates that a single spatial
management approach consisting of an MPA network
protecting part of each location could provide reasonable
protection for these species. Thus, the existing network of
MPAs at this endemic hotspot appears adequate at some,
but not all locations.
Gene flow among locations: mtDNA
MtDNA suggested a complete lack of spatial genetic
structure for C. bulbifrons. This is likely the result of a
small number of recruits per generation maintaining spatial
genetic homogeneity (Shulman 1998; Planes 2002). Inter-
estingly, the peripheral location (NI) shows no genetic
break from the western region, in contrast with peripheral
locations of other widespread reef fishes at larger spatial
scales (Drew et al. 2008; Winters et al. 2010). Thus,
mtDNA gene flow has apparently been sufficient or recent
enough to suggest that all locations are connected over
historic timescales as the presumed neutral mtDNA marker
has not (yet) accumulated genetic differences under either
genetic drift or selection.
Gene flow among locations: msatDNA
MsatDNA suggested spatial genetic structure for C.
bulbifrons with high levels of self-replenishment ([68 %).
The apparent discrepancy between mtDNA and msatDNA
likely results from few recruits per generation maintaining
mtDNA genetic homogeneity over historical timescales,
whereas populations at isolated locations require sub-
stantial amounts of self-recruitment on contemporary
timescales to maintain viable populations. This discrepancy
between mtDNA and msatDNA is increasingly being
documented in other coral reef fishes (e.g., Evans et al.
2010; Harrison et al. 2012) and within the LHI region (van
der Meer et al. 2012a, b, 2013a). Interestingly, some
individuals at the peripheral location (NI) show phenotypic
differences (stripes and patterns around the eye, authors
pers obs) suggesting that NI is at the very least, a geneti-
cally distinct and unique subpopulation (Drew et al. 2008)
or at an early stage of peripheral speciation (sensu Rocha
2004; Bowen et al. 2013).
Currently, the MPAs in the western region (MR, ER and
LHI) encompass suitable habitat for C. bulbifrons (and
other coral reef fish) and when combined with greater
abundance and higher levels of contemporary gene flow
(i.e., larger number of migrants and lower self-replenish-
ment), decreases the risk of local extinction and facilitates
recovery should populations decline or go locally extinct.
However, the lack of an MPA at the peripheral region (NI),
low abundance and extremely low levels of contemporary
gene flow between regions all increase the risk of local
MRMR
888259
ERER
LHILHI
NINI
(0.026)
(0.048)
(0.016)
291
1144
680
376
msatDNA gene flow (Migrate-n)mtDNA gene flow msatDNA self-replenishment and recent gene flow (BAYESASS)
MRMR
127
4 2
14
ERER
LHILHI
NINI
81
93
93
4
1
2
1
68
MRMR
96
ERER
LHILHI
NINI
(3.22)
(2.02)
(0.58)
4
9
20
3
(a) (b) (c)
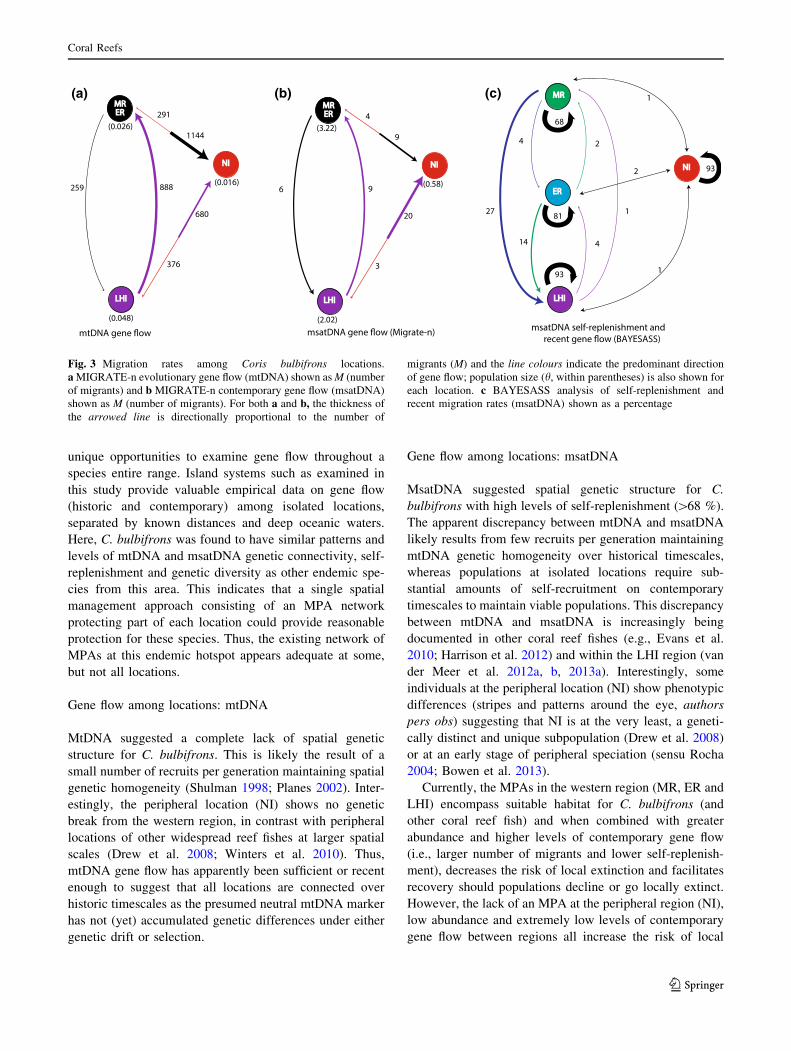
Fig. 3 Migration rates among Coris bulbifrons locations.
a MIGRATE-n evolutionary gene flow (mtDNA) shown as M (number
of migrants) and b MIGRATE-n contemporary gene flow (msatDNA)
shown as M (number of migrants). For both a and b, the thickness of
the arrowed line is directionally proportional to the number of
migrants (M) and the line colours indicate the predominant direction
of gene flow; population size (h, within parentheses) is also shown for
each location. c BAYESASS analysis of self-replenishment and
recent migration rates (msatDNA) shown as a percentage
Coral Reefs
123

extinction and the potential loss of unique colour and
genotype variants at this peripheral location. Lastly, high
levels of self-replenishment (i.e., limited contemporary
gene flow) at all locations and fishing pressure at ER (and
in some areas at LHI) is concerning since populations may
still decline even with minimal fishing effort (Choat et al.
2006b).
Population genetic diversities
C. bulbifrons showed high haplotype (h), medium nucle-
otide (p %) and medium–high msatDNA genotypic (gd %)
diversities at all locations. Given that mtDNA diversity
tracks nuclear genetic diversity in many marine species
(Johannesson and Andre 2006), this is encouraging since
maintaining genetic diversity is an IUCN priority (McNe-
ely et al. 1990). High genetic and genotypic diversity
provides the raw material for natural selection to act on
over historical (Johannesson and Andre 2006) and con-
temporary timescales (Bell and Okamura 2005), decreases
the risk of inbreeding depression (Reed and Frankham
2003) and allows greater adaptive capacity to better cope
with the impacts of environmental change than species
with low genetic diversity (Avise 2000). However, a
genomic approach that identifies ‘‘outlier’’ loci that may be
under selection is required, since loci under selection will
have reduced genetic diversity within divergent popula-
tions for the relevant loci (Luikart et al. 2003).
Population connectivity in endemic fishes
within the LHI region
The LHI (and NI) region is a hotspot for endemic coral reef
fishes with the fourth highest percent endemism (7.2 %) in
the Indo-Pacific (Randall 1998, 2001, 2007). Currently, an
MPA network consisting of three isolated locations (MR,
ER and LHI) aims to protect this unique diversity. Whilst
the current network of MPAs within the western region
may provide adequate protection for endemic reef fishes,
the lack of protection at NI is concerning. Furthermore,
many of the endemics at NI have low abundance (author’s
pers obs), which together with reduced input from the
populations to the west (i.e., ER, MR and LHI), increases
their vulnerability to local extinction. Given the elevated
risk of extinction of endemics at NI and the genetic
uniqueness of NI endemic populations, establishing pro-
tective measures (MPAs and fishing regulations) should be
a management priority at this location.
Genetic studies across three taxonomically distinct
groups having different ecologies (A. mccullochi—an
anemone habitat specialist and generalist planktivore; C.
tricinctus—a coral feeding specialist; and C. bulbifrons—
an invertebrate feeding habitat generalist) and/or life his-
tories (mean PLD: A. mccullochi = 12 days, C. tricinc-
tus = 35 days, C. bulbifrons = 36 days, authors. pers obs)
show similar patterns of population genetic connectivity
and genetic diversity (van der Meer et al. 2012a, b, 2013a).
This indicates that a single management strategy within
this region may be appropriate for the design of MPAs to
protect endemic reef fishes in the LHI–NI endemic hotspot.
If other remote islands with high levels of reef fish ende-
mism (e.g., Hawaiian Islands, Easter Island, the Marquesas,
Rapa Iti) also show similar patterns of population genetic
connectivity and replenishment among endemics, regard-
less of ecology and/or life history, then this advocates for
the use of a single spatial management strategy to protect a
wide range of species in these endemic hotspots (Toonen
et al. 2011). A management strategy involving a network of
MPAs that protects part of each genetically distinct popu-
lation in the geographic range of endemics is likely to be
effective at conserving the unique biodiversity of ende-
mism hotspots.
Although isolation buffers remote locations from many
anthropogenic impacts, it can also increase vulnerability
because of limited contemporary genetic connectivity and
replenishment among populations, as shown here. Given
that remote reefs are also hotspots of endemism in coral
Fig. 4 Posterior probability of assignment of each individual geno-
type to four Coris bulbifrons populations as indicated by DAPC. The
abbreviations of the possible assignment populations are given on the
x-axis 83 genotypes are listed on the y-axis, along with the population
from which they were sampled. Light to dark shaded bars,
respectively, correspond to a 0.2–0.8 probability of assignment across
all colour schemes
Coral Reefs
123
reef fishes (Jones et al. 2002), if widespread impacts occur,
endemic species may be particularly vulnerable due to their
small and fragmented geographic distribution. Island en-
demics have the highest rates of extinction in the terrestrial
environment (Whittaker 1998), and globally coral reefs are
experiencing a rapid increase in anthropogenic stresses
(Steffen et al. 2007). These observations provide the
impetus to establish broadly applicable management
strategies that are effective in conserving multiple endemic
species at endemic hotspots, in order to stem the likely loss
of biodiversity that may result without such protective
measures.
Acknowledgments We thank the LHI Board, LHI Park, Envirofund
Australia (Natural Heritage Trust), Australian Department of the
Environment and Water Resources and the Capricorn Star for either
financial and/or logistical support. We also thank Sallyann Gudge and
Ian Kerr (LHI Marine Park), Gary Crombie (donation of 15 Coris
samples, LHI), Sivakumar Neelamegam (KAUST) and at NI: Dave
Biggs (Charter Marine), James Edward (Bounty Divers), Doug Creek,
Michael Smith, Jack Marges, Karlene Christian and Judith and Peter
Davidson (Reserves and Forestry) for their assistance.
References
Avise JC (2000) Phylogeography: the history and formation of
species. Harvard University Press, Cambridge
Barber PH, Bellwood DR (2005) Biodiversity hotspots: Evolutionary
origins of biodiversity in wrasses Halichoeres in the Indo–
Pacific and New World Tropics. Mol Phylogenet Evol
35:235–253
Beerli P (2004) Effect of unsampled populations on the estimation of
population sizes and migration rates between sampled popula-
tions. Mol Ecol 13:827–836
Bell JJ, Okamura B (2005) Low genetic diversity in a marine nature
reserve: re-evaluating diversity criteria in reserve design. Proc R
Soc B 272:1067–1074
Benjamini Y, Hochberg Y (1995) Controlling the false discovery rate:
a practical and powerful approach to multiple testing. J R Stat
Soc B 57:289–300
Bowen BW, Rocha LA, Toonen RJ, Karl SA, ToBo Laboratory
(2013) The origins of tropical marine biodiversity. Trends Ecol
Evol 28:359–366
Choat JH, Pollard D (2010) Coris bulbifrons. In: IUCN 2012 IUCN
Red List of Threatened Species, Version 2012.1. http://www.
iucnredlist.org/details/187392/0
Choat JH, Davies CR, Ackerman JL, Mapstone BD (2006a) Age
structure and growth in a large teleost, Cheilinus undulatus, with
a review of size distribution in labrid fishes. Marine Ecol Prog
Ser 318:237–246
Choat JH, van Herwerden L, Robbins WD, Hobbs J-PA, Ayling AM
(2006b) A report on the ecological surveys conducted at
Middleton and Elizabeth Reefs, February 2006. Report to the
Australian Government Department of Environment and Heri-
tage, Canberra
Cowen RK, Sponaugle Su (2009) Larval dispersal and marine
population connectivity. Annu Rev Mar Sci 1:443–466
Drew J, Allen G, Kaufman L, Barber PH (2008) Endemism and
regional color and genetic differences in five putatively cosmo-
politan reef fishes. Conserv Biol 22:965–975
Evans RD, Russ L, van Herwerden GR, Frisch AJ (2010) Strong
genetic but not spatial subdivision of two reef fish species
targeted by fishers on the Great Barrier Reef. Fish Res
102:16–25
Excoffier L, Laval G, Schneider S (2005) Arlequin version 30, an
integrated software package for population genetics data
analysis. Evol Bioinform Online 1:47–50
Francis MP (1993) Checklist of the coastal fishes of Lord Howe,
Norfolk, and Kermadec Islands, south-west Pacific Ocean
Pacific. Pac Sci 47:136–170
Friedlander AM, DeMartini EE (2002) Contrasts in density, size, and
biomass of reef fishes between the northwestern and the main
Hawaiian islands: the effects of fishing down apex predators.
Mar Ecol Prog Ser 230:253–264
Grant WS, Bowen BM (1998) Shallow population histories in deep
evolutionary lineages of marine fishes, insights from the
sardines and anchovies and lessons for conservation. J Hered
89:415–426
Harrison HB, Williamson DH, Evans RD, Almany GR, Thorrold SR,
Russ GR, Feldheim KA, van Herwerden L, Planes S, Srinivasan
M, Berumen ML, Jones GP (2012) Larval export from marine
reserves and the recruitment benefit for fish and fisheries. Curr
Biol 22:1023–1028
Hellberg ME (2009) Gene flow and isolation among populations of
marine Aanimals. Annual Review of Ecology, Evolution and
Systematics 40:291–310
Hobbs J-PA, Feary DA (2007) Monitoring the ecological status of
Elizabeth and Middleton Reefs. Report to Australian Govern-
ment Department of The Environment and Water Resources,
Canberra
Hobbs J-PA, Neilson J, Gilligan JJ (2009) Distribution, abundance,
habitat association and extinction risk of marine fishes endemic
to the Lord Howe Island region. Report to Lord Howe Island
Marine Park
Hubisz MJ, Falush D, Stephens M, Pritchard JK (2009) Inferring
weak population structure with the assistance of sample group
information. Mol Ecol Res 9:1322–1332
Hughes TP, Baird AH, Bellwood DR, Card M, Connolly SR, Folke C,
Grosberg R, Hoegh-Guldberg O, Jackson JBC, Kleypas J, Lough
JM, Marshall P, Nystrom M, Palumbi SR, Pandolfi JM, Rosen B,
Roughgarden J (2003) Climate change, human impacts, and the
resilience of coral reefs. Science 301:929–933
Jackson JB, Kirby MX, Berger WH, Bjorndal KA, Botsford LW,
Bourque BJ, Bradbury RH, Cooke R, Erlandson J, Estes JA,
Hughes TP, Kidwell S, Lange CB, Lenihan HS, Pandolfi JM,
Peterson CH, Steneck RS, Tegner MJ, Warner RR (2001)
Historical overfishing and the recent collapse of coastal ecosys-
tems. Science 293:629–637
Johannes RE, Weibe WJ, Crossland CJ, Rimmer DW, Smith SAV
(1983) Latitudinal limits of coral reef growth. Mar Ecol Prog Ser
11:105–111
Johannesson K, Andre C (2006) Life on the margin: genetic isolation
and diversity loss in a peripheral marine ecosystem, the Baltic
Sea. Mol Ecol 15:2013–2029
Jombart T, Devillard S, Balloux F (2010) Discriminant analysis of
principal components: a new method for the analysis of
genetically structured populations. BMC Genet 11:94
Jones GP, Caley MJ, Munday PL (2002) Rarity in coral reef fish
communities. In: Sale PF (ed) Coral reef fishes: dynamics and
diversity in a complex ecosystem. Academic Press, San Diego,
pp 81–101
Jones GP, Planes S, Thorrold SR (2005) Coral reef fish larvae settle
close to home. Curr Biol 15:1314–1318
Leis JM, van Herwerden L, Patterson HM (2011) Estimating
connectivity in marine fish populations: What works best?
Oceanogr Mar Biol 49:193–234
Coral Reefs
123
Luikart G, England PR, Tallmon D, Jordan S, Taberlet P (2003) The
power and promise of population genomics: from genotyping to
genome typing. Genetics 4:981–994
McCook LJ, Almany GR, Berumen ML, Day JC, Green AL, Jones
GP, Leis JM, Planes S, Russ GR, Sale PF, Thorrold SR (2009)
Management under uncertainty: guide-lines for incorporating
connectivity into the protection of coral reefs. Coral Reefs
28:353–366
McNeely JA, Miller KR, Reid WV, Mittermeier RA, Werner TB
(1990) Conserving the world’s biological diversity. World
Conservation Union, World Resources Institute, Conservation
International, World Wildlife Fund-US, and the World Bank,
Washington, DC
Piry S, Alapetite A, Cornuet JM, Paetkau D, Baudouin L, Estoup A
(2004) GENECLASS2: a software for genetic assignment and
first generation migrants detection. J Hered 95:536–539
Planes S (2002) Biogeography and larval dispersal inferred from
population genetic analysis. In: Sale PF (ed) Coral reef fishes:
dynamics and diversity in a complex ecosystem. Academic
Press, San Diego, pp 201–220
Pritchard JK, Stephens M, Donnelly P (2000) Inference of population
structure using multilocus genotype data. Genetics 155:945–959
Posada D (2008) jModelTest: Phylogenetic Model Averaging. Mol
Biol Evol 25:1253–1256
Randall JE (1998) Zoogeography of shore fishes of the Indo-Pacific
region. Zool Stud 37:227–268
Randall JE (2001) Four new cardinalfishes Perciformes: Apogonidae
from the Marquesas Islands. Pac Sci 55:47–64
Randall JE (2007) Reef and shore fishes of the Hawaiian Islands. Sea
Grant College Program, University of Hawaii, Honolulu
Randall JE, Kuiter RH (1982) Three new labrid fishes of the Genus
Coris from the Western Pacific. Pac Sci 36:159–173
Reed DH, Frankham R (2003) Correlation between fitness and genetic
diversity. Conserv Biol 17:230–237
Rocha LA (2004) Mitochondrial DNA and color pattern variation in
three western Atlantic Halichoeres Labridae, with the revalida-
tion of two species. Copeia 2004:770–782
Selkoe KA, Toonen RJ (2006) Microsatellites for ecologists: a
practical guide to using and evaluating microsatellite markers.
Ecol Lett 9:615–629
Shanks AL (2009) Pelagic larval duration and dispersal distance
revisited. Biol Bull 216:373–385
Shulman MJ (1998) What can population genetics tell us about
dispersal and biogeographic history of coral–reef fishes. Aust J
Ecol 23:216–225
Steffen W, Crutzen PJ, McNeill JR (2007) The Anthropocene: Are
humans now overwhelming the great forces of nature. Ambio
36:614–621
Suthers IM, Young JM, Roughan MR, Everett JD, Brassington GB,
Byrne M, Condie SA, Hartog JR, Hassler CS, Hobday AJ,
Holbrook NJ, Malcolm HA, Oke PR, Thompson PA, Ridgway K
(2011) The strengthening East Australian Current, its eddies and
biological effects–an introduction and overview. Deep–Sea Res
58:538–546
Swearer SE, Caselle JE, Lea DW, Warner RR (1999) Larval retention
and recruitment in an island population of coral-reef fish. Nature
402:799–802
Toonen RJ, Andrews KR, Baums IB, Bird CE, Concepcion GT, Daly-
Engel TS, Eble JE, Faucci A, Gaither MR, Iacchei M, Puritz JB,
Schultz JK, Skillings DJ, Timmers MA, Bowen BW (2011)
Defining boundaries for ecosystem-based management: A mul-
tispecies case study of marine connectivity across the Hawaiian
Archipelago. Mar Biol 2011:1–13
van der Meer MH, Hobbs J-PA, Jones GP, van Herwerden L (2012a)
Genetic connectivity among and self-replenishment within island
populations of a restricted range subtropical reef fish. PLoS ONE
7(11): e49660. doi:10.1371/journalpone0049660
van der Meer MH, Hobbs J-PA, Jones GP, van Herwerden L (2012b)
Historic hybridisation between two Australian anemonefish
species Amphiprion and present–day patterns of connectivity.
Ecol Evol 2:1592–1604
van der Meer MH, Gardner MG, Berumen ML, Hobbs J-PA, van
Herwerden L (2013a) Identification of seventeen microsatellite
loci for conservation genetic studies of the endemic wrasse Coris
bulbifrons. Conserv Genet Res 4:243–246
van der Meer MH, Horne JB, Gardner MG, Hobbs J-PA, Pratchett M,
van Herwerden L (2013b) Limited contemporary gene flow and
high self-replenishment drives peripheral isolation in an endemic
coral reef fish. Ecol Evol 3:1653–1666
Waples RS, Gaggiotti O (2006) What is a population? An empirical
evaluation of some genetic methods for identifying the number
of gene pools and their degree of connectivity. Mol Ecol
15:1419–1439
Whittaker RJ (1998) Islands biogeography: Ecology, evolution, and
conservation. Oxford University Press, Oxford
Wilson GA, Rannala B (2003) Bayesian inference of recent migration
rates using multilocus genotypes. Genetics 163:1177–1191
Winters KL, van Herwerden L, Choat JH, Robertson DR (2010)
Phylogeography of the Indo-Pacific parrotfish Scarus psittacus,
isolation generates distinctive peripheral populations in two
oceans. Mar Biol 157:1679–1691
Coral Reefs
123
Related Documents


![[Austria] ZigBee exploited](https://static.cupdf.com/doc/110x72/587cfa411a28ab1e7e8b4ab5/austria-zigbee-exploited.jpg)