Population Change in Texas: Implications for Human and Socioeconomic Resources in the 21st Century by Steve H. Murdock Department of Rural Sociology Texas Agricultural Experiment Station Texas A&M University System

Welcome message from author
This document is posted to help you gain knowledge. Please leave a comment to let me know what you think about it! Share it to your friends and learn new things together.
Transcript

Population Change in Texas:Implications for Human and Socioeconomic
Resources in the 21st Century
by
Steve H. Murdock
Department of Rural Sociology
Texas Agricultural Experiment Station
Texas A&M University System
Major Demographic Trends Affecting the Future
• Change in Rates and Sources of Population Growth
• Increase in the Non-Anglo Population
• Aging of the Population

Total Population Change
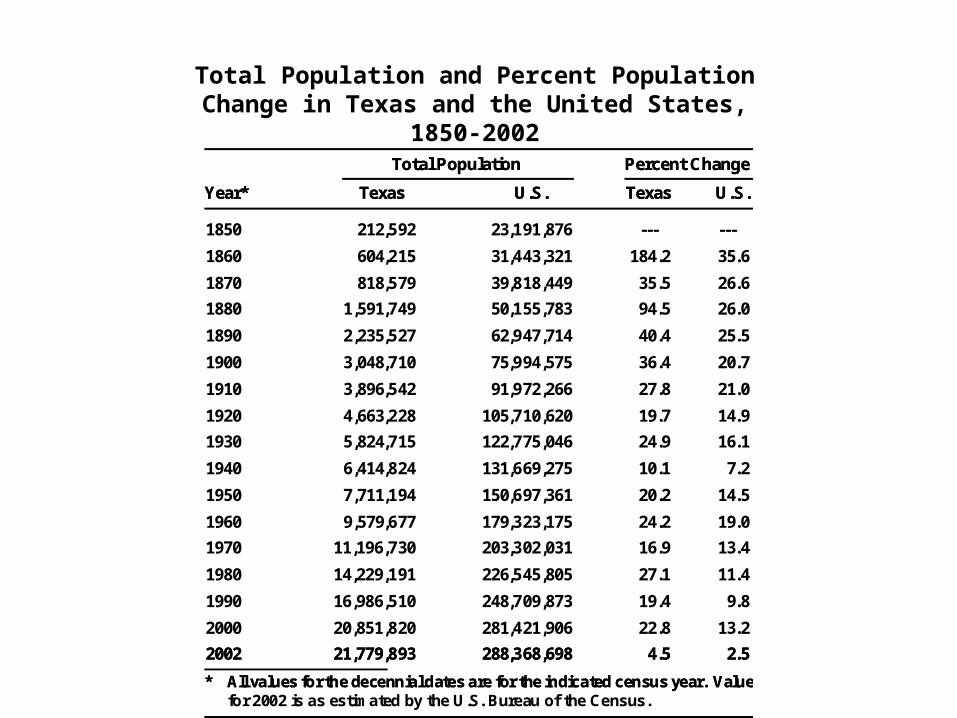
Total Population and Percent Population Change in Texas and the United States, 1850-2002
Total Population Percent Change
Year* Texas U.S. Texas U.S.
1850 212,592 23,191,876 --- ---
1860 604,215 31,443,321 184.2 35.6
1870 818,579 39,818,449 35.5 26.6
1880 1,591,749 50,155,783 94.5 26.0
1890 2,235,527 62,947,714 40.4 25.5
1900 3,048,710 75,994,575 36.4 20.7
1910 3,896,542 91,972,266 27.8 21.0
1920 4,663,228 105,710,620 19.7 14.9
1930 5,824,715 122,775,046 24.9 16.1
1940 6,414,824 131,669,275 10.1 7.2
1950 7,711,194 150,697,361 20.2 14.5
1960 9,579,677 179,323,175 24.2 19.0
1970 11,196,730 203,302,031 16.9 13.4
1980 14,229,191 226,545,805 27.1 11.4
1990 16,986,510 248,709,873 19.4 9.8
2000 20,851,820 281,421,906 22.8 13.2
2002 21,779,893 288,368,698 4.5 2.5 * All values for the decennial dates are for the indicated census year. Value
for 2002 is as estimated by the U.S. Bureau of the Census.
Total Population Percent Change Year* Texas U.S. Texas U.S.
2002 21,779,893 288,368,698 4.5 2.5 * All values for the decennial dates are for the indicated census year. Value
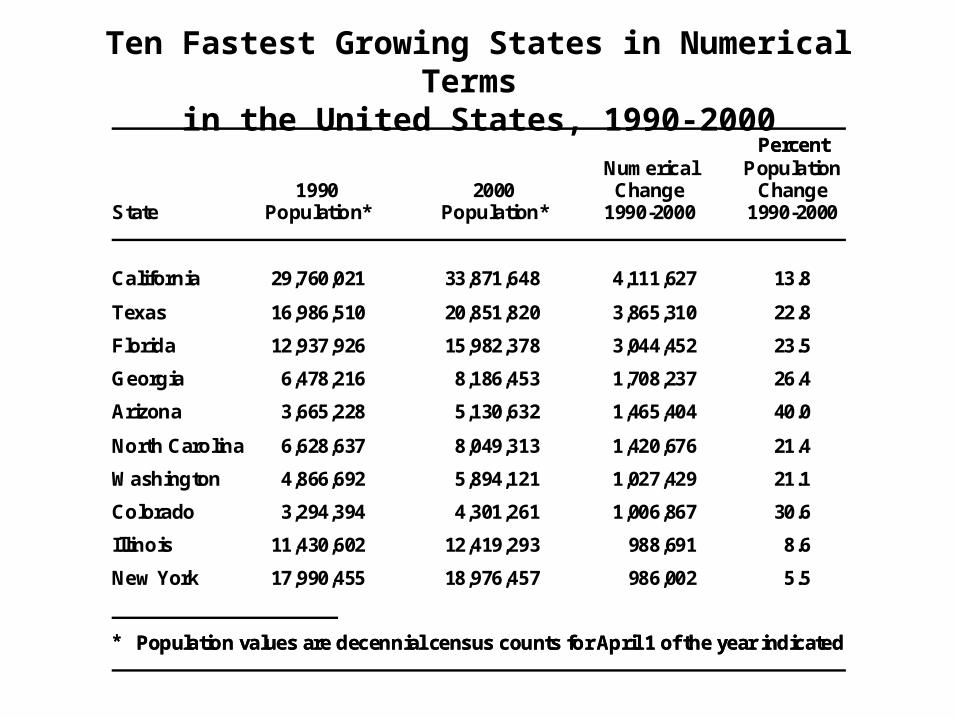
Ten Fastest Growing States in Numerical Terms in the United States, 1990-2000
Percent
Numerical Population1990 2000 Change Change
State Population* Population* 1990-2000 1990-2000
California 29,760,021 33,871,648 4,111,627 13.8
Texas 16,986,510 20,851,820 3,865,310 22.8
Florida 12,937,926 15,982,378 3,044,452 23.5
Georgia 6,478,216 8,186,453 1,708,237 26.4
Arizona 3,665,228 5,130,632 1,465,404 40.0
North Carolina 6,628,637 8,049,313 1,420,676 21.4
Washington 4,866,692 5,894,121 1,027,429 21.1
Colorado 3,294,394 4,301,261 1,006,867 30.6
Illinois 11,430,602 12,419,293 988,691 8.6
New York 17,990,455 18,976,457 986,002 5.5
* Population values are decennial census counts for April 1 of the year indicated
Percent
* Population values are decennial census counts for April 1 of the year indicated
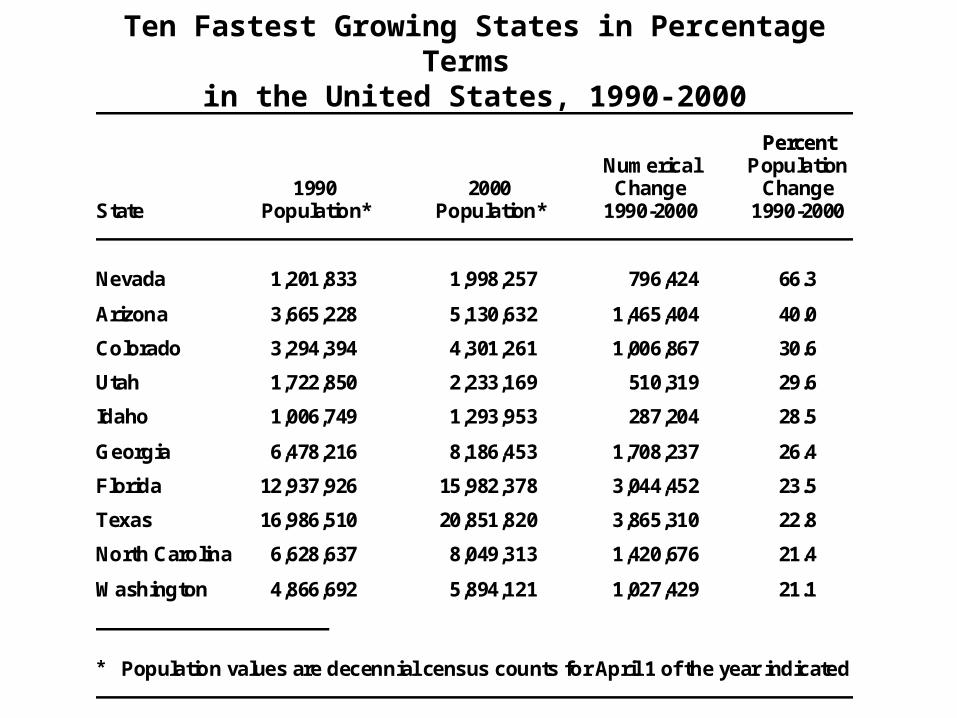
Ten Fastest Growing States in Percentage Terms in the United States, 1990-2000
PercentNumerical Population
1990 2000 Change ChangeState Population* Population* 1990-2000 1990-2000
Nevada 1,201,833 1,998,257 796,424 66.3
Arizona 3,665,228 5,130,632 1,465,404 40.0
Colorado 3,294,394 4,301,261 1,006,867 30.6
Utah 1,722,850 2,233,169 510,319 29.6
Idaho 1,006,749 1,293,953 287,204 28.5
Georgia 6,478,216 8,186,453 1,708,237 26.4
Florida 12,937,926 15,982,378 3,044,452 23.5
Texas 16,986,510 20,851,820 3,865,310 22.8
North Carolina 6,628,637 8,049,313 1,420,676 21.4
Washington 4,866,692 5,894,121 1,027,429 21.1
* Population values are decennial census counts for April 1 of the year indicated
Percent

Racial/Ethnic Change in Texas

Texas Rank Among States on Selected Characteristics of Race/Ethnicity Groups
Texas Texas ComparisonGroup Value Rank Areas
By Size in 2000
Anglo 11,074,716 3 California; 17.0 millionNew York; 12.5 million
Black 2,421,653 2 New York; 2.9 million
Hispanic 6,669,666 2 California; 11.0 million
Other 685,785 4 California; 4.2 millionNew York; 1.2 millionHawaii; 733,000

Texas Texas ComparisonGroup Value Rank Areas
By Numerical Change, 1990-2000
Anglo 783,036 2 Florida; 1.1 million
Black 445,293 3 Florida; 665,000Georgia; 627,000
Hispanic 2,329,761 2 California; 3.3 million
Other 307,220 3 California; 1.2 millionNew York; 493,000
Texas Rank Among States on Selected Characteristics of Race/Ethnicity Groups
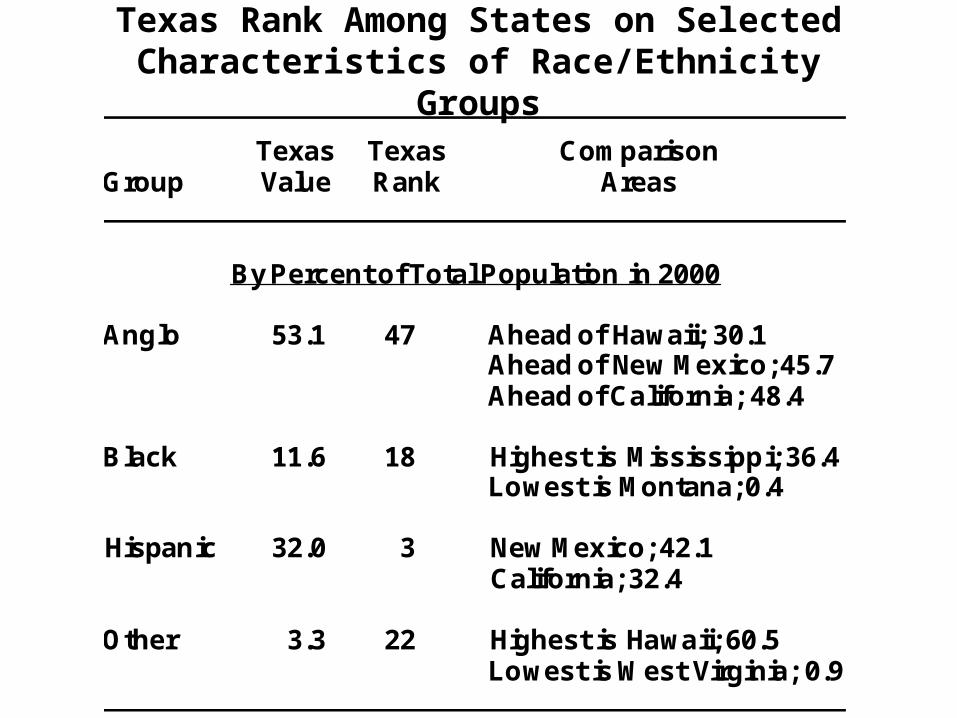
Texas Texas ComparisonGroup Value Rank Areas
By Percent of Total Population in 2000
Anglo 53.1 47 Ahead of Hawaii; 30.1Ahead of New Mexico; 45.7Ahead of California; 48.4
Black 11.6 18 Highest is Mississippi; 36.4Lowest is Montana; 0.4
Hispanic 32.0 3 New Mexico; 42.1California; 32.4
Other 3.3 22 Highest is Hawaii; 60.5Lowest is West Virginia; 0.9
Texas Rank Among States on Selected Characteristics of Race/Ethnicity Groups

Numerical Change in Population by Race/Ethnicity in Texas for 1980-1990 and 1990-2000
941,383
283,818
1,354,081
178,037
783,036
445,293
2,329,761
307,220
Anglo Black Hispanic Other0
500,000
1,000,000
1,500,000
2,000,000
2,500,000
1980-1990 1990-2000

Percent Change in Population by Race/Ethnicity for 1980-1990 and 1990-2000 in Texas
10.077.61
16.77
22.53
45.35
53.68
88.78
81.15
1980-1990 1990-20000
20
40
60
80
100Percent Change
Anglo Black Hispanic Other

Proportion of Net Population Change Attributable to Each Race/Ethnicity Group in Texas for 1980-
1990 and 1990-2000
34.14
20.26
10.29 11.52
49.11
60.27
6.467.95
1980-1990 1990-20000
10
20
30
40
50
60
70
Anglo Black Hispanic Other
Major Changes in Population Composition(Characteristics)
• Age
Median Age in the United States and Texas, 1900-2000
22.924.1
25.326.5
2930.1 29.5
28.130
32.9
35.3
18.720.2
2223.7
26.827.9
27 26.428
30.832.3
1900 1910 1920 1930 1940 1950 1960 1970 1980 1990 20000
10
20
30
40Median Age
United States Texas
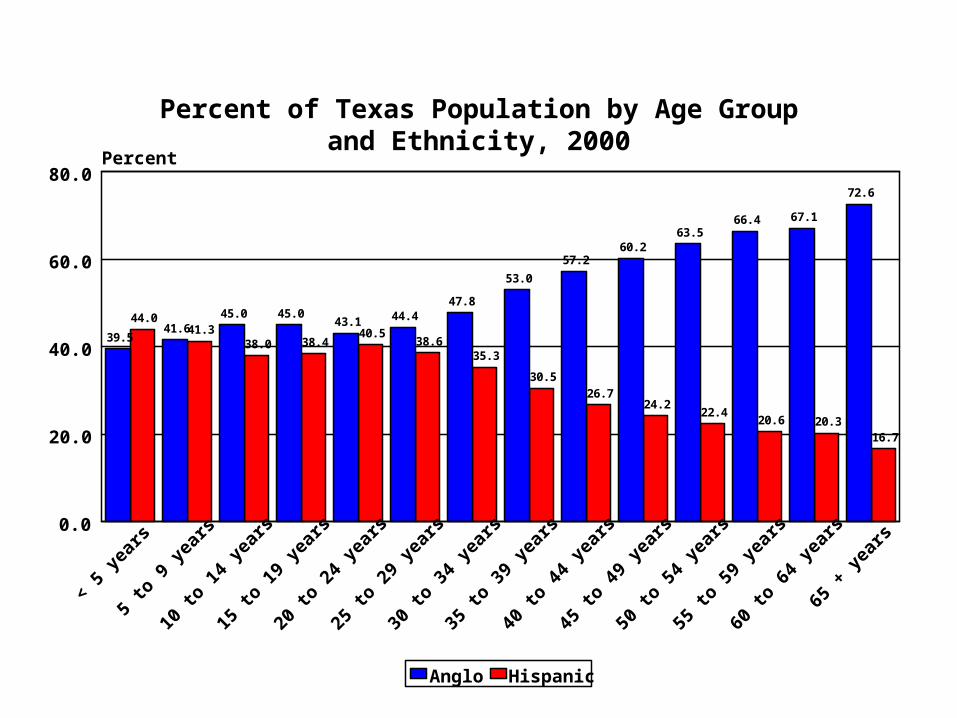
Percent of Texas Population by Age Groupand Ethnicity, 2000
39.541.6
45.0 45.043.1 44.4
47.8
53.0
57.260.2
63.566.4 67.1
72.6
44.041.3
38.0 38.440.5
38.635.3
30.526.7
24.222.4
20.6 20.316.7
< 5
year
s
5 to
9 y
ears
10 to
14
year
s
15 to
19
year
s
20 to
24
year
s
25 to
29
year
s
30 to
34
year
s
35 to
39
year
s
40 to
44
year
s
45 to
49
year
s
50 to
54
year
s
55 to
59
year
s
60 to
64
year
s
65 +
yea
rs0.0
20.0
40.0
60.0
80.0Percent
Anglo Hispanic

Percent of Texas Population by Age Groupand Ethnicity, 2040*
* Projections are shown for the 1.0 scenario
17.719.3 19.9 20.3 19.8 19.3 19.4 20.5 20.6 21.9
25.3 26.5 27.2
39.8
69.967.8 66.5 65.5 66.0 66.8 66.4
64.362.6
60.6
56.7 55.252.3
37.1
< 5 y
ears
5 to
9 y
ears
10 to
14
year
s
15 to
19
year
s
20 to
24
year
s
25 to
29
year
s
30 to
34
year
s
35 to
39
year
s
40 to
44
year
s
45 to
49
year
s
50 to
54
year
s
55 to
59
year
s
60 to
64
year
s
65 +
yea
rs0.0
10.0
20.0
30.0
40.0
50.0
60.0
70.0
80.0Percent
Anglo Hispanic

POPULATION CHARACTERISTICS AND SOCIOECONOMIC
CONDITIONS
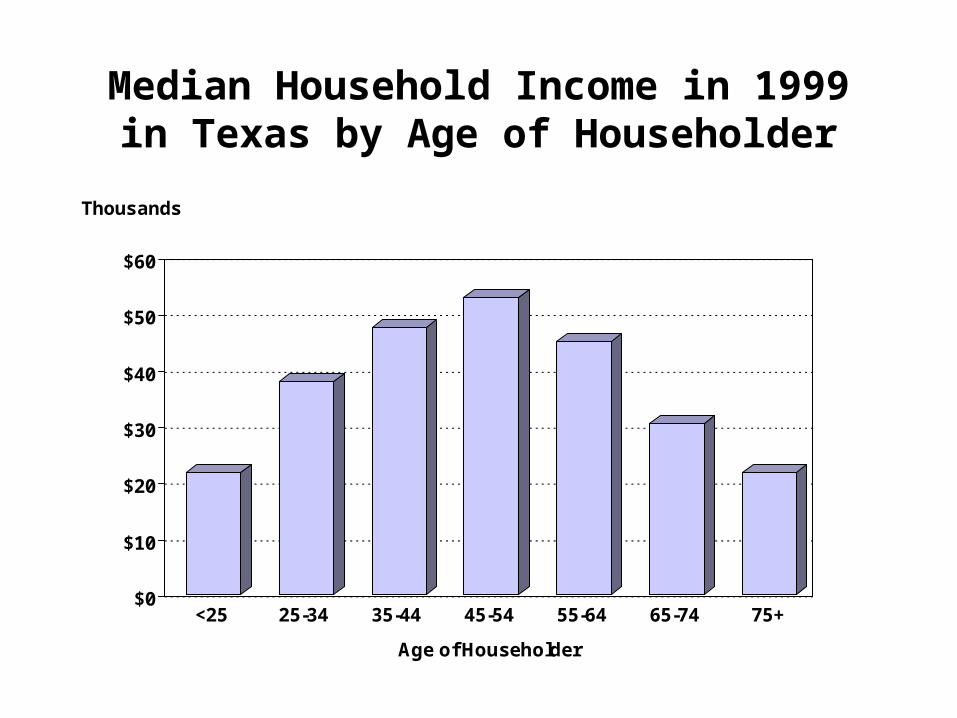
Median Household Income in 1999 in Texas by Age of Householder
$0
$10
$20
$30
$40
$50
$60
<25 25-34 35-44 45-54 55-64 65-74 75+
Age of Householder
Thousands

Median Household Income In 1999 in Texas by Race/Ethnicity of Householder
$47,162
$29,305 $29,873
$50,049
$0
$10,000
$20,000
$30,000
$40,000
$50,000
$60,000
Anglo Black Hispanic Asian
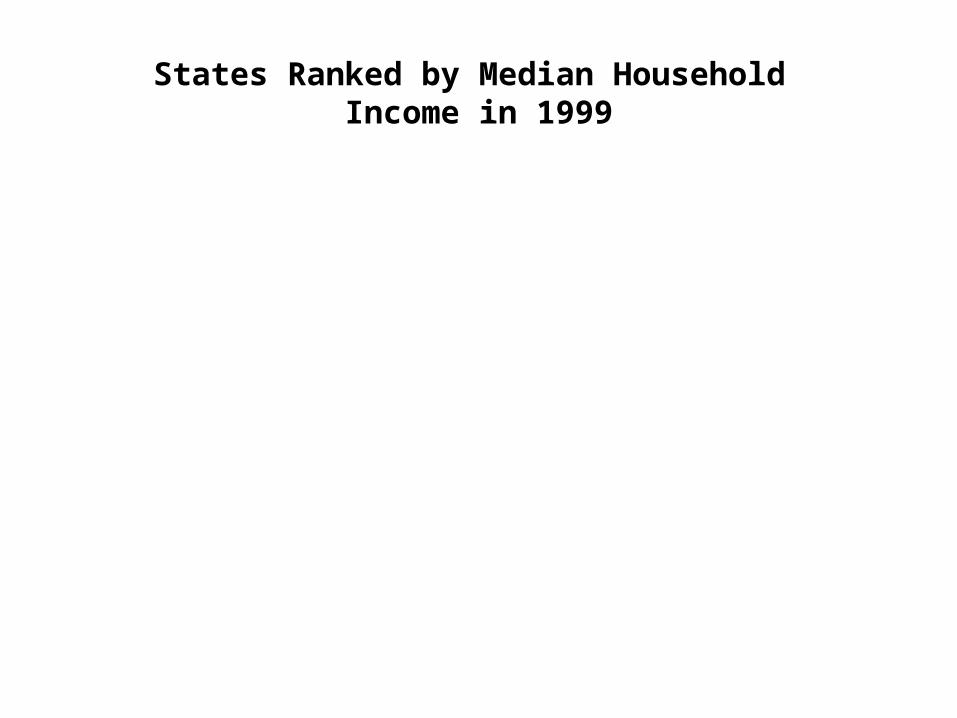
States Ranked by Median Household Income in 1999
$55,146
$53,935
$52,868
$51,571
$50,502
$49,820
$49,467
$47,493
$47,381
$47,203
$39,927
$41,994
New Jersey (1)
Connecticut (2)
Maryland (3)
Alaska (4)
Massachusetts (5)
Hawaii (6)
New Hampshire (7)
California (8)
Delaware (9)
Colorado (10)
Texas (30)
United States
$0 $10,000 $20,000 $30,000 $40,000 $50,000 $60,000 $70,000
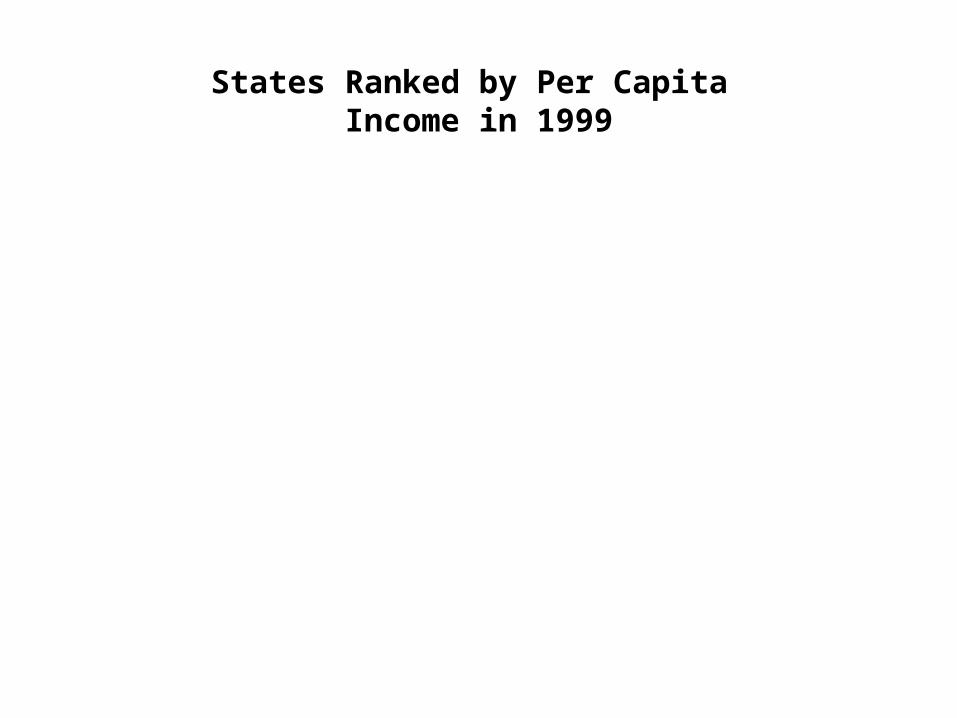
States Ranked by Per Capita Income in 1999
$28,766
$28,659
$27,006
$25,952
$25,614
$24,049
$23,975
$23,844
$23,389
$23,305
$19,617
$21,587
Connecticut (1)
District of Columbia (2)
New Jersey (3)
Massachusetts (4)
Maryland (5)
Colorado (6)
Virgina (7)
New Hampshire (8)
New York (9)
Delaware (10)
Texas (33)
United States
$0 $5,000 $10,000 $15,000 $20,000 $25,000 $30,000 $35,000

Educational Attainment in 2000 in Texas for Persons 25+ Years
of Age By Race/Ethnicity
0 10 20 30 40 50 60
< High School
High School
Some College
College or More
Hispanic
Black
Anglo
Asian
Percent
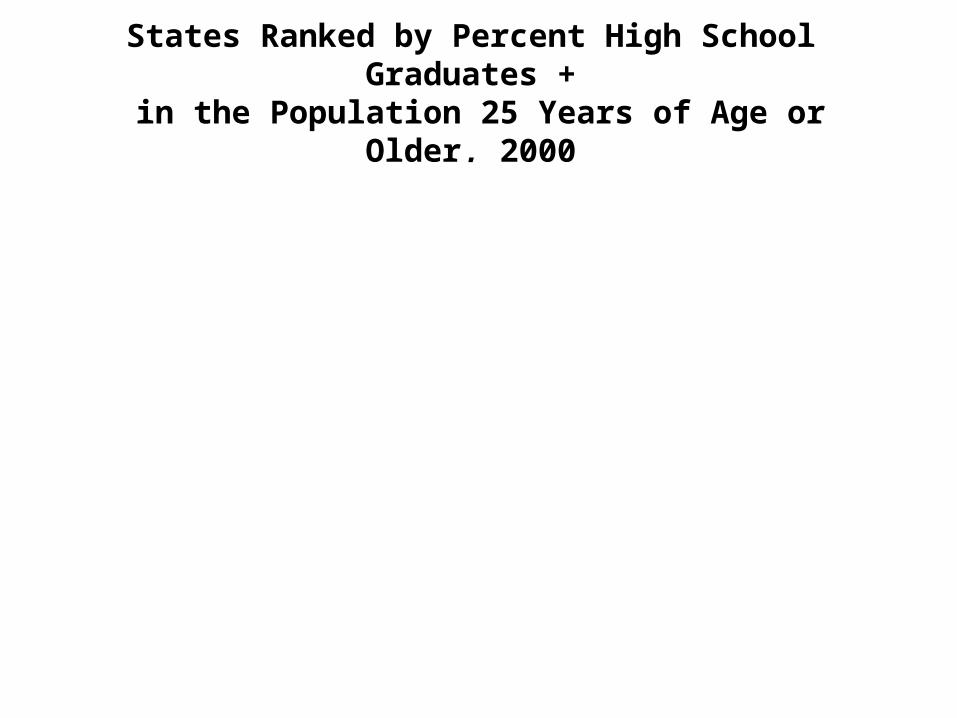
States Ranked by Percent High School Graduates + in the Population 25 Years of Age or Older, 2000
88.3
87.9
87.9
87.7
87.4
87.2
87.1
86.9
86.6
86.4
75.7
80.4
Alaska(1)
Minnesota (3)
Wyoming (3)
Utah (4)
New Hampshire (5)
Montana (6)
Washington (7)
Colorado (8)
Nebraska (9)
Vermont (10)
Texas (45)
United States
0.0 20.0 40.0 60.0 80.0 100.0
Percent

States Ranked by Percent College Graduates +in the Population 25 Years of Age or Older, 2000
39.1
33.2
32.7
31.4
31.4
29.8
29.5
29.4
28.7
27.7
23.2
24.4
District of Columbia (1)
Massachusetts (2)
Colorado (3)
Connecticut (5)
Maryland (5)
New Jersey (6)
Virginia (7)
Vermont (8)
New Hampshire (9)
Washington (10)
Texas (27)
United States
0.0 10.0 20.0 30.0 40.0 50.0
Percent

PROJECTIONS

Year Anglo Black Hispanic Other Total 2000 11,074,716 2,421,653 6,669,666 685,785 20,851,820
Assuming Zero Migration
2010 11,292,858 2,604,162 7,986,640 776,088 22,659,7482020 11,320,857 2,727,365 9,220,971 828,786 24,097,9792030 11,086,475 2,756,470 10,406,060 856,437 25,105,4422040 10,599,190 2,697,888 11,408,456 856,047 25,561,581
Assuming Rates of Net Migration Equal toOne-Half of 1990-2000
2010 11,494,673 2,730,659 8,999,827 953,348 24,178,5072020 11,735,043 3,004,173 11,742,820 1,256,342 27,738,3782030 11,701,065 3,191,230 14,900,692 1,596,578 31,389,5652040 11,382,992 3,283,413 18,391,333 1,954,592 35,012,330
Assuming Rates of Net Migration Equal to 1990-2000
2010 11,700,471 2,863,397 10,164,378 1,168,772 25,897,0182020 12,165,004 3,309,068 15,056,028 1,897,182 32,427,2822030 12,350,427 3,694,283 21,533,219 2,960,361 40,538,2902040 12,225,486 3,995,349 29,926,210 4,435,916 50,582,961
Population in Texas by Race/Ethnicity in 2000 and Projections of the Population in Texas by Race/Ethnicity from 2010 to 2040

Percent Change for Selected Time Periods for Projected Population in Texas by Racial/Ethnic Status Under Alternative Assumptions of
Migration Scenarios Year Anglo Black Hispanic Other Total
Assuming Zero Migration
2000-2010 2.0 7.5 19.7 13.2 8.72010-2020 0.2 4.7 15.5 6.8 6.32020-2030 -2.1 1.1 12.9 3.3 4.22030-2040 -4.4 -2.1 9.6 0.0 1.82000-2040 -4.3 11.4 71.0 24.8 22.6
Assuming Rates of Net Migration Equal toOne-Half of 1990-2000
2000-2010 3.8 12.8 34.9 39.0 16.02010-2020 2.1 10.0 30.5 31.8 14.72020-2030 -0.3 6.2 26.9 27.1 13.22030-2040 -2.7 2.9 23.4 22.4 11.52000-2040 2.8 35.6 175.7 185.0 67.9
Assuming Rates of Net Migration Equal to 1990-2000
2000-2010 5.7 18.2 52.4 70.4 24.22010-2020 4.0 15.6 48.1 62.3 25.22020-2030 1.5 11.6 43.0 56.0 25.02030-2040 -1.0 8.1 39.0 49.8 24.82000-2040 10.4 65.0 348.7 546.8 142.6

Year Anglo Black Hispanic Other
2000 53.1 11.6 32.0 3.3
Assuming Zero Migration
2010 49.9 11.5 35.2 3.42020 47.0 11.3 38.3 3.42030 44.2 11.0 41.4 3.42040 41.5 10.6 44.6 3.3
Assuming Rates of Net Migration Equal toOne-Half of 1990-2000
2010 47.6 11.3 37.2 3.92020 42.4 10.8 42.3 4.52030 37.2 10.2 47.5 5.12040 32.5 9.4 52.5 5.6
Assuming Rates of Net MigrationEqual to 1990-2000
2010 45.2 11.1 39.2 4.52020 37.5 10.2 46.4 5.92030 30.5 9.1 53.1 7.32040 24.2 7.9 59.1 8.8
Percent of Population in Texas by Race/Ethnicity in 2000 and Projections of the Percent of the Population in Texas by
Race/Ethnicity from 2010 to 2040
Projected Proportion of Population by Race/Ethnicity in Texas, 2000-2040*
* Using U.S. Census count for 2000 and Texas State Data Center 1.0 population projection scenario for 2010-2040
53.1
45.2
37.5
30.5
24.2
11.6 11.1 10.2 9.1 7.9
32.0
39.2
46.4
53.1
59.1
3.3 4.5 5.9 7.3 8.8
2000 2010 2020 2030 2040
Year
0.0
10.0
20.0
30.0
40.0
50.0
60.0
70.0Percent
Anglo Black Hispanic Other

AgeGroup Anglo Black Hispanic Other Total
All Scenarios2000
<18 23.0 31.7 35.8 26.1 28.218-24 8.8 11.2 13.2 11.2 10.625-44 30.1 32.1 31.8 37.7 31.145-64 24.4 17.7 14.0 20.1 20.265+ 13.7 7.3 5.2 4.9 9.9
Assuming Zero Migration
2020
<18 19.9 24.1 31.4 20.7 24.818-24 8.1 10.2 11.1 9.1 9.625-44 24.9 29.8 27.2 24.4 26.345-64 27.6 25.3 21.8 30.2 25.165+ 19.5 10.6 8.5 15.6 14.2
2040
<18 17.4 19.8 27.4 17.0 22.118-24 7.7 8.9 10.1 6.7 8.825-44 24.0 27.3 26.7 23.8 25.645-64 25.2 27.0 20.8 22.9 23.365+ 25.7 17.0 15.0 29.6 20.2
(Continued)
Percent of the Projections of the Population by Race/Ethnicity and Age Groups in Texas from 2000-2040 Under Alternative
Migration Scenarios

Projected Percent of Net Change Attributable to Each Race/Ethnicity Group in Texas for 2000-2040*
* Using U.S. Census count for 2000 and Texas State Data Center 1.0 population projection scenario for 2040.
Anglo3.9%
Black5.3%
Hispanic78.2%
Other12.6%
The Texas Challenge in the Twenty-First Century: Implications of
Population Change for the Future of Texas
by
Steve H. Murdock
The Center for Demographic and
Socioeconomic Research and Education
Department of Rural Sociology
Texas A&M University System
The Center for
Demographic and
Socioeconomic
Research and Education
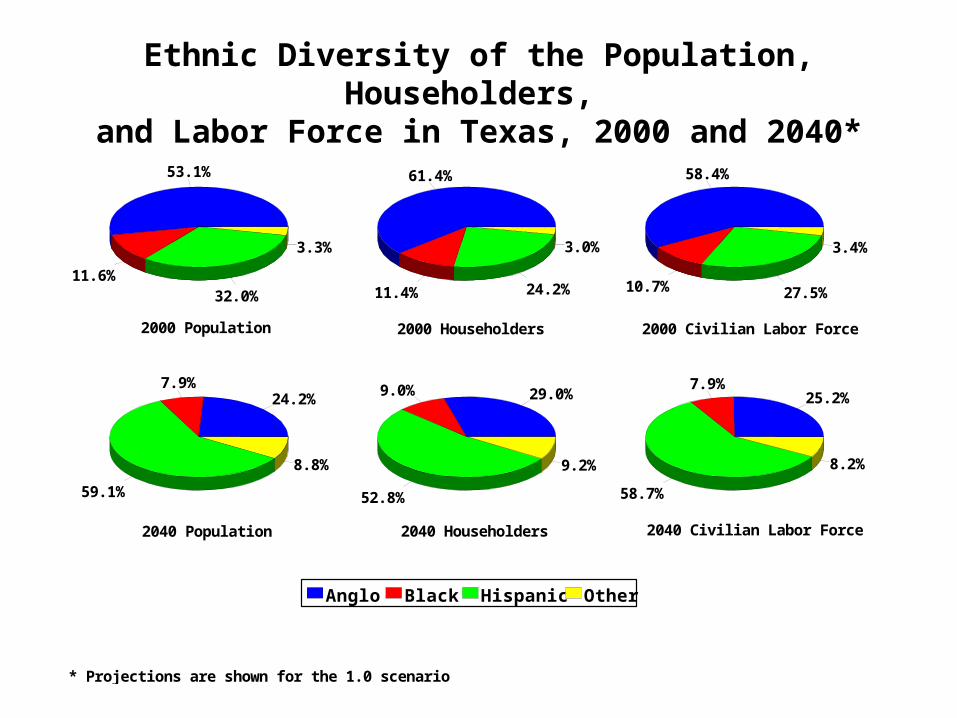
Ethnic Diversity of the Population, Householders, and Labor Force in Texas, 2000 and 2040*
* Projections are shown for the 1.0 scenario
53.1%
11.6%32.0%
3.3%
61.4%
11.4% 24.2%
3.0%
58.4%
10.7% 27.5%
3.4%
24.2%7.9%
59.1%
8.8%
29.0%9.0%
52.8%
9.2%
25.2%7.9%
58.7%
8.2%
Anglo Black Hispanic Other
2000 Population
2040 Population
2000 Householders
2040 Householders
2000 Civilian Labor Force
2040 Civilian Labor Force
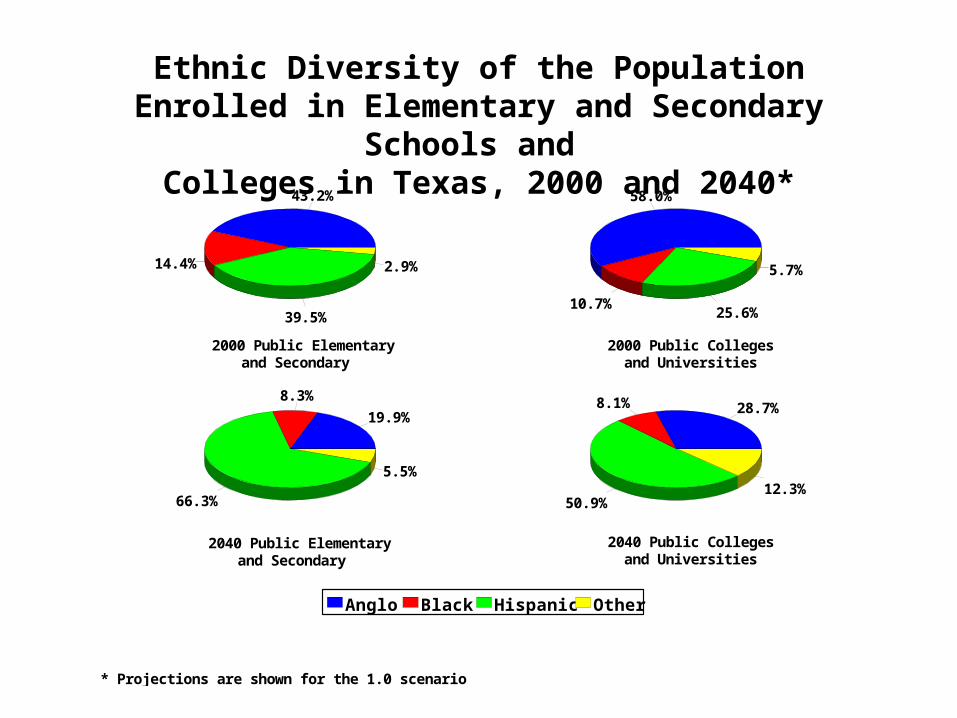
Ethnic Diversity of the Population Enrolled in Elementary and Secondary Schools and
Colleges in Texas, 2000 and 2040*
* Projections are shown for the 1.0 scenario
43.2%
14.4%
39.5%
2.9%
58.0%
10.7%25.6%
5.7%
19.9%
8.3%
66.3%
5.5%
28.7%8.1%
50.9%12.3%
Anglo Black Hispanic Other
2000 Public Elementaryand Secondary
2040 Public Elementaryand Secondary
2000 Public Collegesand Universities
2040 Public Collegesand Universities

Ethnic Diversity of Household Income and Consumer Expenditures in Texas, 2000 and 2040*
* Projections are shown for the 1.0 scenario
71.2%
8.2%17.3%
3.3%
66.4%
8.7%21.9%
3.0%
38.2%
7.4%
42.8%
11.6%
31.9%7.1%
51.7%
9.3%
Anglo Black Hispanic Other
2000 AggregateHousehold Income
2040 AggregateHousehold Income
2000 Consumer Expenditures
2040 Consumer Expenditures

State Tax Revenues in Texas Proportioned by Race/Ethnicity in 2000 and Projections to 2040* Assuming 2000 Decile Tax Rates
*Projections are shown for the 1.0 scenario
38.2%7.4%
42.8%11.6%
Anglo Black Hispanic Other
2040* Projected Tax Revenues
71.2%
8.2%
17.3%3.3%
2000 Tax Revenues

Projected Percent of Labor Force by Educational Attainment in Texas, 2000 and 2040
* Projections are shown for the 1.0 scenario
18.8
29 28.7
18.2
5.3
30.128.7
23.9
12.9
4.4
No High School Diploma
High School Graduate
Some College
Bachelor's Degree
Graduate/Prof.Degree
0
5
10
15
20
25
30
35
Percent
2000 2040

Average Household Income in Texas, 2000-2040*
(in 2000 Dollars)
* Projections are shown for the 1.0 scenario
$54,441
$52,639
$50,903
$49,326
$47,883
2000 2010 2020 2030 2040$30,000
$40,000
$50,000
$60,000
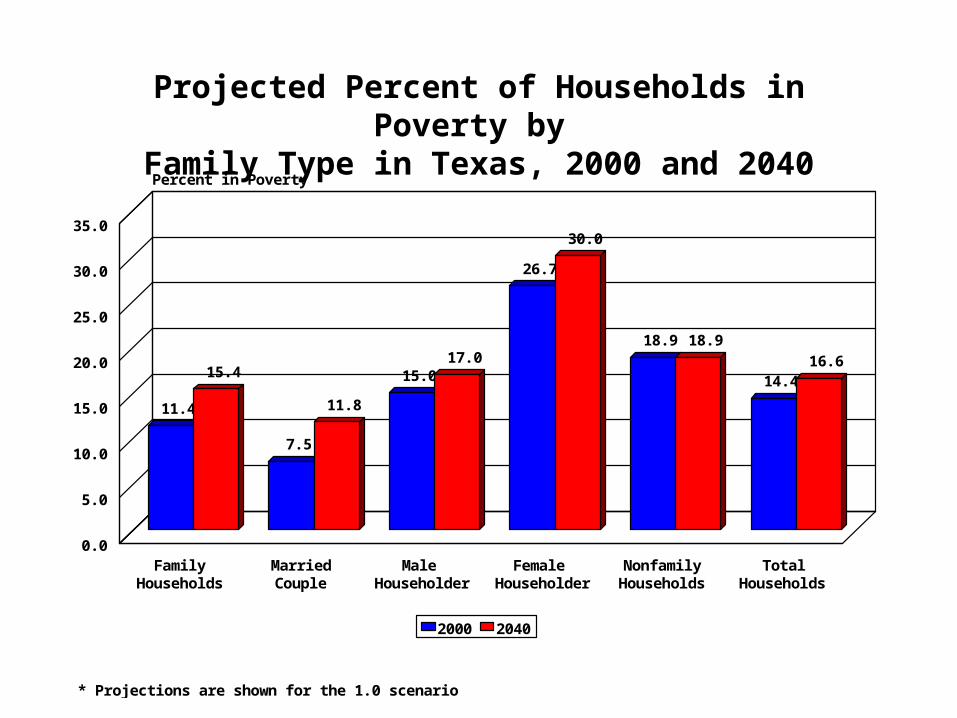
Projected Percent of Households in Poverty by Family Type in Texas, 2000 and 2040
* Projections are shown for the 1.0 scenario
11.4
7.5
15.0
26.7
18.9
14.415.4
11.8
17.0
30.0
18.9
16.6
Family Households
Married Couple
Male Householder
Female Householder
Nonfamily Households
Total Households
0.0
5.0
10.0
15.0
20.0
25.0
30.0
35.0
Percent in Poverty
2000 2040

EDUCATION

Percent of Population 25 Years of Age or Older in Texas Who Are High School Graduates and Higher or
College Graduates and Higher by Race/Ethnicity, and Percent Change, 1990-2000
Percent PercentHigh School College
Race/ Graduates GraduatesEthnicity and Higher and Higher
1990
Anglo 81.5 25.2Black 66.2 12.0Hispanic 44.6 7.3Asian 79.1 41.3Total 72.1 20.3
2000
Anglo 87.2 30.0Black 75.8 15.3Hispanic 49.3 8.9Asian 80.7 47.8Total 75.7 23.2
Percent Change in Percent
Anglo 7.0 19.0Black 14.5 27.5Hispanic 10.5 21.9Asian 2.0 15.7Total 5.0 14.3

Public Community College and University Enrollment Rates (Per 100 Persons Ages 18 to 35)
in Texas by Race/Ethnicity, 1990 and 2000
Year Anglo Black Hispanic Other Total
Community College
1990 6.3 4.1 4.4 5.6 5.52000 6.5 5.2 4.8 6.8 5.7
Public University
1990 7.4 4.0 3.5 10.0 6.02000 7.5 4.7 3.3 10.3 5.7

Enrollment in Public Community Colleges andPublic Universities in Texas, 2000-2040*
* Projections are shown for the 1.0 scenario
371
445
495
581
677
421
510
589
710
849
2000 2010 2020 2030 2040
Years
0
200
400
600
800
1,000Thousands
Public Community Colleges Public Universities
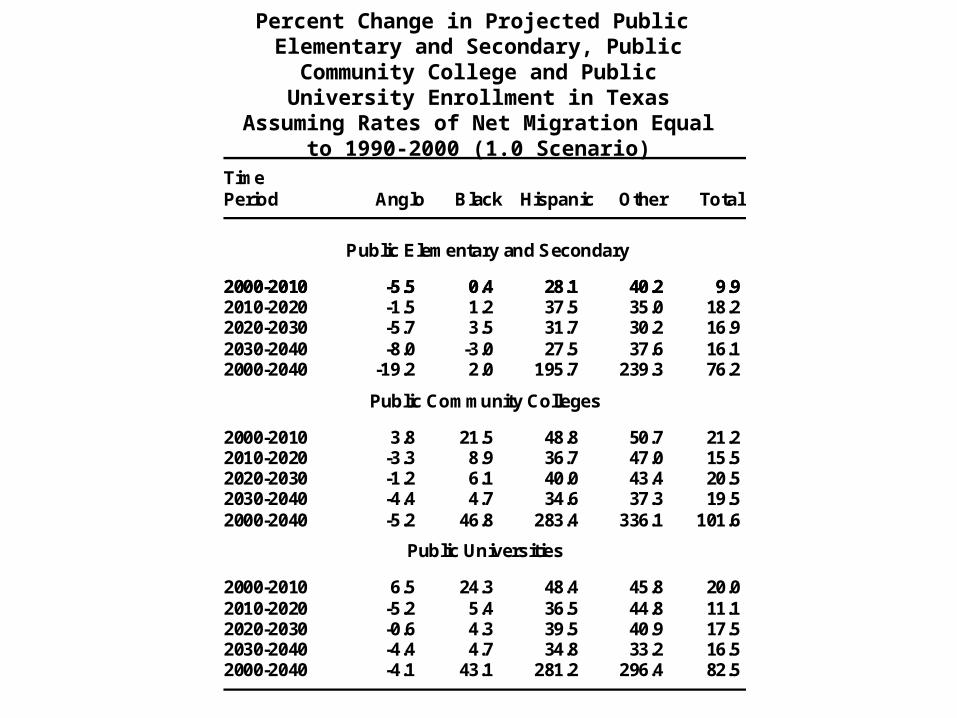
Percent Change in Projected Public Elementary and Secondary, Public Community
College and Public University Enrollment in Texas Assuming Rates of Net Migration Equal to 1990-2000
(1.0 Scenario)
TimePeriod Anglo Black Hispanic Other Total
Public Elementary and Secondary
2000-2010 -5.5 0.4 28.1 40.2 9.92010-2020 -1.5 1.2 37.5 35.0 18.22020-2030 -5.7 3.5 31.7 30.2 16.92030-2040 -8.0 -3.0 27.5 37.6 16.12000-2040 -19.2 2.0 195.7 239.3 76.2
Public Community Colleges
2000-2010 3.8 21.5 48.8 50.7 21.22010-2020 -3.3 8.9 36.7 47.0 15.52020-2030 -1.2 6.1 40.0 43.4 20.52030-2040 -4.4 4.7 34.6 37.3 19.52000-2040 -5.2 46.8 283.4 336.1 101.6
Public Universities
2000-2010 6.5 24.3 48.4 45.8 20.02010-2020 -5.2 5.4 36.5 44.8 11.12020-2030 -0.6 4.3 39.5 40.9 17.52030-2040 -4.4 4.7 34.8 33.2 16.52000-2040 -4.1 43.1 281.2 296.4 82.5
2000-2010 -5.5 0.4 28.1 40.2 9.9
Projected Percent of Public Community College Enrollment by Race/Ethnicity in 2000 and Projections for 2040*
* Projections are shown for the 1.0 scenario
54.7
25.7
11.18.1
29.5
56.0
4.7
10.2
2000 2040
Projection Year
0.0
10.0
20.0
30.0
40.0
50.0
60.0
70.0
Percent
Anglo Black Hispanic Other
Projected Percent of Public University Enrollment by Race/Ethnicity in 2000 and Projections for 2040*
* Projections are shown for the 1.0 scenario
61.5
32.3
10.38.1
21.3
44.5
6.9
15.1
2000 2040
Projection Year
0.0
10.0
20.0
30.0
40.0
50.0
60.0
70.0
Percent
Anglo Black Hispanic Other
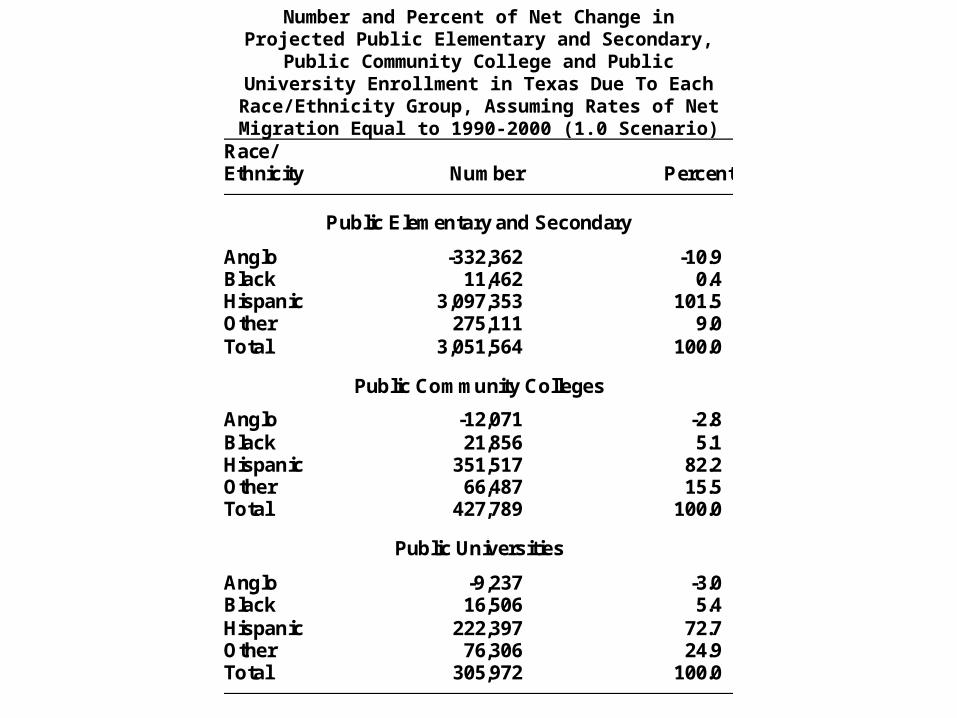
Number and Percent of Net Change in Projected Public Elementary and Secondary, Public Community College and
Public University Enrollment in Texas Due To Each Race/Ethnicity Group, Assuming Rates of Net Migration
Equal to 1990-2000 (1.0 Scenario)
Race/Ethnicity Number Percent
Public Elementary and Secondary
Anglo -332,362 -10.9Black 11,462 0.4Hispanic 3,097,353 101.5Other 275,111 9.0Total 3,051,564 100.0
Public Community Colleges
Anglo -12,071 -2.8Black 21,856 5.1Hispanic 351,517 82.2Other 66,487 15.5Total 427,789 100.0
Public Universities
Anglo -9,237 -3.0Black 16,506 5.4Hispanic 222,397 72.7Other 76,306 24.9Total 305,972 100.0

$28,974
$45,368
$58,133
$84,029
$112,004
Less Than High School
High SchoolGraduate
Some College orAssociate Degree
Bachelor's Degree
Graduate/ProfessionalDegree
$0
$20,000
$40,000
$60,000
$80,000
$100,000
$120,000
Average Income
*From March 2001 Current Population Survey
Average Annual Household Income in the United States by Educational Attainment* in 2000

$1,158,960
$1,814,720
$2,325,320
$3,361,160
$4,480,160
Less Than High School
High SchoolGraduate
Some College orAssociate Degree
Bachelor's Degree
Graduate/ProfessionalDegree
$0
$500,000
$1,000,000
$1,500,000
$2,000,000
$2,500,000
$3,000,000
$3,500,000
$4,000,000
$4,500,000
$5,000,000
Lifetime Income
*From March 2001 Current Population Survey
Lifetime Household Income in the United States by Educational Attainment* in 2000

Working Lifetime (40 Years) Consumer Expenditures by Educational Attainment
(in 2000 Dollars)
$1,095,640
$1,533,960
$1,818,440
$2,628,520
$3,503,600
Less ThanHigh School
High SchoolGraduate
Some College Bachelor'sDegree
Graduate/ProfessionalDegree
$0
$1,000,000
$2,000,000
$3,000,000
$4,000,000
Working Lifetime Expenditures

$106,400
$145,160
$167,440
$212,440
$283,160
Less Than High School
High SchoolGraduate
Some College Bachelor's Degree
Graduate/ProfessionalDegree
$0
$50,000
$100,000
$150,000
$200,000
$250,000
$300,000
State and Local Taxes
Working Lifetime (40 Years) Total State and Local Taxes for Households by Educational Attainment of Householder
(in 2000 Dollars)

Percent of Persons 25 Years of Age or Older by Level of Educational Attainment and Race/Ethnicity in 2000 and Projected to 2040* Assuming 1990-2000 Trends in Educational Attainment Rates
*Projections are shown for the 1.0 scenario
12.7
25.7
31.6
30.0
24.0
29.9
30.6
15.5
50.7
22.0
18.4
8.9
21.0
16.1
20.6
42.3
2.2
16.6
33.4
47.8
4.3
25.6
40.5
29.6
32.1
25.8
24.1
18.0
13.4
7.6
11.0
68.0
< High School
High School
Some Coll/Assoc
Bachelor's +
< High School
High School
Some Coll/Assoc.
Bachelor's +
< High School
High School
Some Coll/Assoc
Bachelor's +
< High School
High School
Some Coll/Assoc
Bachelor's +
0.0 10.0 20.0 30.0 40.0 50.0 60.0 70.0 80.0
Percent
2000 2040
Black
Hispanic
Other
Anglo

Aggregate Income and Consumer Expenditures for Population 25 Years of Age or Older in Texas in 2000 and Projected Under
Alternative Educational Attainment Assumptions for 2040*
*Projections are shown for the 1.0 scenario
$251
$621
$765
$938
$210
$528
$629
$752
2000Base Values
2040 Assuming2000 Attainment
Differentials
2040 Assuming1990-2000 Trends
in Differentials
2040 AssumingAnglo Trends
Apply to all Groups
$0
$200
$400
$600
$800
$1,000
$1,200
Billions
Aggregate Income Consumer Expenditures

Percent Change in Projected Aggregate Income and Consumer Expenditures for Population 25 Years of Age or Older in Texas Under Alternative
Educational Attainment Assumptions, 2000 to 2040*
*Projections are shown for the 1.0 scenario
147.6 151.1
204.7 199.0
273.9257.3
Aggregate Income Consumer Expenditures0.0
50.0
100.0
150.0
200.0
250.0
300.0
Percent Change
2000 AttainmentDifferentials
1990-2000 Trends in Differentials
Anglo TrendsApply to all Groups

Prison Population and Prison Costs for Population 25 Years of Age or Older in Texas in 2000 and Projected Under
Alternative Educational Attainment Assumptions for 2040*
*Projections are shown for the 1.0 scenario
126,515
341,068
227,969
134,539$1.9
$5.1
$3.4
$2.0
2000Base Values
2040 Assuming2000 Attainment
Differentials
2040 Assuming1990-2000 Trends
in Differentials
2040 AssumingAnglo Trends
Apply to all Groups
0
50,000
100,000
150,000
200,000
250,000
300,000
350,000
400,000Prison Population
$0.0
$1.0
$2.0
$3.0
$4.0
$5.0
$6.0 Costs (Billions)
Prison Population Prison Costs

Medicaid Participants and Medicaid Costs for Population 25 Years of Age or Older in Texas in 2000 and Projected Under Alternative Educational Attainment Assumptions for 2040*
*Projections are shown for the 1.0 scenario
397,959
1,353,742
950,713
485,228
$1.0
$3.4
$2.4
$1.2
2000Base Values
2040 Assuming2000 Attainment
Differentials
2040 Assuming1990-2000 Trends
in Differentials
2040 AssumingAnglo Trends
Apply to all Groups
0
250,000
500,000
750,000
1,000,000
1,250,000
1,500,000Medicaid Participants
$0.0
$1.0
$2.0
$3.0
$4.0 Costs (Billions)
Medicaid Participants Medicaid Costs

TANF Participants and TANF Costs for Population 25 Years of Age or Older in Texas in 2000 and Projected Under
Alternative Educational Attainment Assumptions for 2040*
*Projections are shown for the 1.0 scenario
122,772
469,976
356,127
179,697
$90.3
$345.8
$262.1
$132.2
2000Base Values
2040 Assuming2000 Attainment
Differentials
2040 Assuming1990-2000 Trends
in Differentials
2040 AssumingAnglo Trends
Apply to all Groups
0
100,000
200,000
300,000
400,000
500,000
TANF Participants
$0.0
$100.0
$200.0
$300.0
$400.0 Costs (Millions)
TANF Participants TANF Costs
Food Stamp Participants and Food Stamp Costs for Population 25 Years of Age or Older in Texas in 2000 and Projected Under
Alternative Educational Attainment Assumptions for 2040*
*Projections are shown for the 1.0 scenario
323,194
1,256,109
959,744
481,898
$51.2
$199.2
$152.2
$76.4
2000 Base Values
2040 Assuming2000 Attainment
Differentials
2040 Assuming1990-2000 Trends
in Differentials
2040 AssumingAnglo Trends
Apply to all Groups
0
250,000
500,000
750,000
1,000,000
1,250,000
Food Stamp Participants
$0.0
$100.0
$200.0
$300.0
$400.0 Costs (Millions)
Food Stamp Participants Food Stamp Costs

Percent Change in Projected Prison, TANF, Food Stamp, and Medicaid Participants and Costs for Population 25 Years of Age or Older in Texas Under
Alternative Educational Attainment Assumptions, 2000 to 2040*
*Projections are shown for the 1.0 scenario
169.6
282.8 288.7
240.2
80.2
190.1 197.0
138.9
6.3
46.4 49.121.9
Prisons TANF Food Stamps Medicaid0.0
50.0
100.0
150.0
200.0
250.0
300.0
350.0Percent Change
2000 AttainmentDifferentials
1990-2000Trends inDifferentials
Anglo TrendsApply to all Groups

Steve MurdockTexas State Data Center
Phone (CS) 979 - 845 - 5332Phone (AUS) 512 - 463 - 7659Fax 979 - 845 - 8529Website txsdc.tamu.edu
Related Documents