Population and Hunger – Global Issues Estimated Sessions: 1 class day (50 minute period) Grade Level(s): 9 / 11 Purpose: 1. This lesson is a simulation that will give the students a better understanding of the distribution of population among continents verses the distribution of the world food supply. 2. How human actions modify the physical environment. 3. How physical systems effect human systems 4. Identify regional resource issues that may impair sustainability, economic expansion, and/or diversification. 5. Assess the impact of these issues on the physical and human environments of specific regions. 6. Strategies for dealing with regional resources issues. 7. Identify ways in which humans have used technology to modify the physical environment in order to settle areas in different world regions. 8. Evaluate the impact of these technologies on the physical and human environments affected. Objectives: 1. Upon completion of this lesson/activity, students will be able to 2. Identify the regions scarce food supply and 3. Propose strategies to correct the imbalance of the world food distribution. Background: 1. This lesson builds upon world population distribution ideas and concepts previously learned. Procedures: 1. Instruct: There are 6 billion people in the world. To this point we examined population and distribution among countries and continents and some concepts that affect population. Now we are going to look at population distribution among continents and the ability to feed all the people. The class will help out with this simulation. 2. Write on the board or put on overhead, the following statistics: Six Billion people breaks down to the following: o North America 508,915,979 = 8%

Welcome message from author
This document is posted to help you gain knowledge. Please leave a comment to let me know what you think about it! Share it to your friends and learn new things together.
Transcript
Population and Hunger – Global Issues
Estimated Sessions: 1 class day (50 minute period) Grade Level(s): 9 / 11
Purpose:
1. This lesson is a simulation that will give the students a better understanding of the distribution of population among continents verses the distribution of the world food supply.
2. How human actions modify the physical environment.3. How physical systems effect human systems4. Identify regional resource issues that may impair sustainability, economic expansion, and/or
diversification. 5. Assess the impact of these issues on the physical and human environments of specific regions. 6. Strategies for dealing with regional resources issues.7. Identify ways in which humans have used technology to modify the physical environment in
order to settle areas in different world regions. 8. Evaluate the impact of these technologies on the physical and human environments affected.
Objectives:
1. Upon completion of this lesson/activity, students will be able to2. Identify the regions scarce food supply and3. Propose strategies to correct the imbalance of the world food distribution.
Background:
1. This lesson builds upon world population distribution ideas and concepts previously learned.
Procedures: 1. Instruct: There are 6 billion people in the world. To this point we examined population and
distribution among countries and continents and some concepts that affect population. Now we are going to look at population distribution among continents and the ability to feed all the people. The class will help out with this simulation.
2. Write on the board or put on overhead, the following statistics: Six Billion people breaks down to the following:
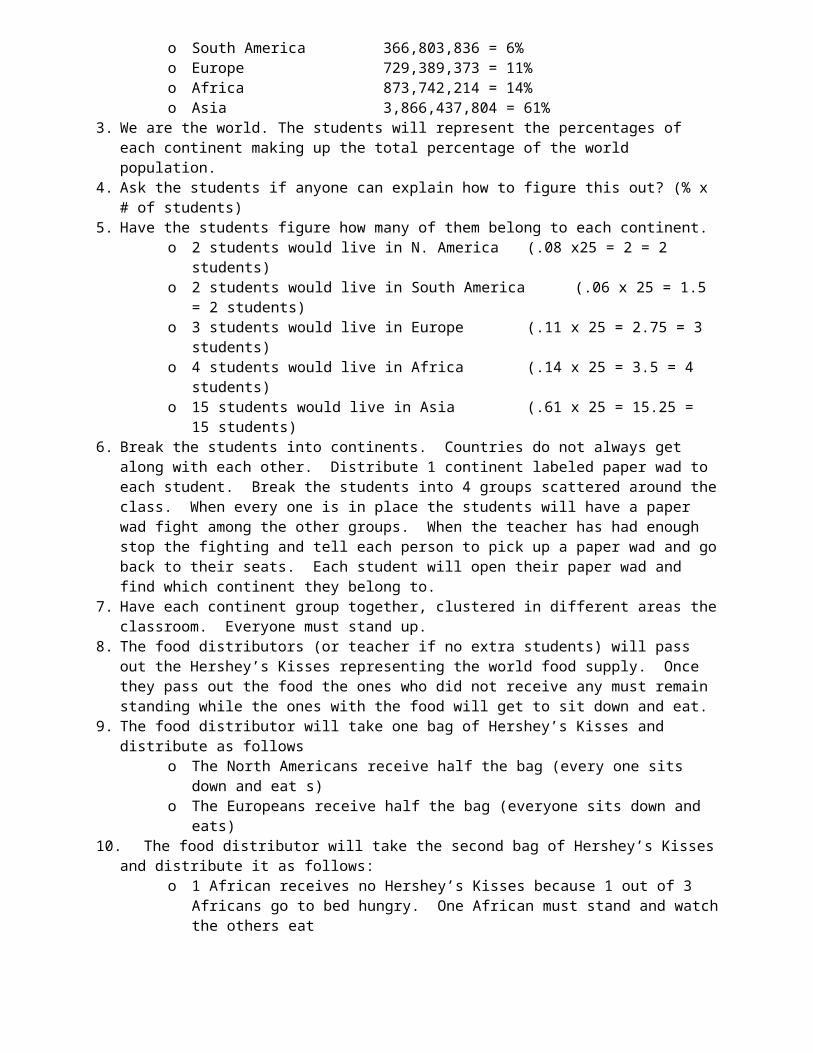
o North America 508,915,979 = 8%o South America 366,803,836 = 6%o Europe 729,389,373 = 11%o Africa 873,742,214 = 14%o Asia 3,866,437,804 = 61%
3. We are the world. The students will represent the percentages of each continent making up the total percentage of the world population.
4. Ask the students if anyone can explain how to figure this out? (% x # of students)5. Have the students figure how many of them belong to each continent.
o 2 students would live in N. America (.08 x25 = 2 = 2 students)o 2 students would live in South America (.06 x 25 = 1.5 = 2 students)o 3 students would live in Europe (.11 x 25 = 2.75 = 3 students)o 4 students would live in Africa (.14 x 25 = 3.5 = 4 students)o 15 students would live in Asia (.61 x 25 = 15.25 = 15 students)
6. Break the students into continents. Countries do not always get along with each other. Distribute 1 continent labeled paper wad to each student. Break the students into 4 groups scattered around the class. When every one is in place the students will have a paper wad fight among the other groups. When the teacher has had enough stop the fighting and tell each person to pick up a paper wad and go back to their seats. Each student will open their paper wad and find which continent they belong to.
7. Have each continent group together, clustered in different areas the classroom. Everyone must stand up.
8. The food distributors (or teacher if no extra students) will pass out the Hershey’s Kisses representing the world food supply. Once they pass out the food the ones who did not receive any must remain standing while the ones with the food will get to sit down and eat.
9. The food distributor will take one bag of Hershey’s Kisses and distribute as follows o The North Americans receive half the bag (every one sits down and eat s) o The Europeans receive half the bag (everyone sits down and eats)
10. The food distributor will take the second bag of Hershey’s Kisses and distribute it as follows:o 1 African receives no Hershey’s Kisses because 1 out of 3 Africans go to bed hungry.
One African must stand and watch the others eato 3 Asians receive no Hershey’s Kisses because 1 out of 5 Asians go to bed hungry, Three
Asians must stand and watch the others eat.o One South American does not receive any and the other one receives only a couple of
Hershey’s Kisses because 1 out of 8 South Americans go to bed hungry11. After the food has been distributed, review the total population numbers of each continent that had
been posted on the board or overhead and add the ratio that go to bed hungry. o Africa 873,742,214 = 1 out of 3 go to bed hungryo Asia 3,866,437,804 = 1 out of 5 go to bed hungryo South America 366,803,836 = 1 out of 8 go to bed hungry
12. Using the information, ask the students to figure the total number of population in each continent that go to bed hungry.
o (The one African standing represents 291,247,405 people who go to bed hungry) o (The three Asians standing represents 773,287,561 people who go to bed hungry)o (The one South American standing represents 45,850,480 people who go to bed hungry)
13. Students will return to their seats and take out a piece of paper and answer the following questions:o Where do most people live? (Over half in Asia)o Where is there a surplus of food? (N. America and Europe, where farmers are high-tech)o Where is there a shortage of food? (Africa, Asia, and S. America. Farmers are low-tech)o Where are the worst food shortages? (Africa – the only continent with two giant deserts)o If Africa and Europe have the roughly around the same populations, then why is one
hungry and the other not? (Africa’s population is growing faster than its food production. Africa has two deserts and a rainforest that cannot produce food. Farming is more high tech in Europe with land capable of producing more food)
o What can be done to help the people going to bed hungry? (Europe and N. America could share their food. Africans and Asians could increase their food production by using fertilizer to improve soil, irrigate to water the crops and use high tech machines to do the work)
o What else can be done? (In the long range, a country’s population should be roughly equal to its food production. In the short range the U.S. sends food to Africa, Asia, and South America)
14. Students will turn in their answers. After all have been collected discuss the questions and answers.

What is a Population Pyramid?
Estimated Sessions: 1 class day (50 minute period) Grade Level(s): 9 / 11
Purpose:
1. This lesson introduces the concept of population pyramids2. How to use maps and other geographic representations 3. Report information from a spatial perspective. 4. The physical and human characteristics of places.5. The characteristics, distribution, and migration of human populations on Earth’s surface.6. Map the distribution of the world’s human population for different time periods. Analyze
changes in population characteristics and population density in specific regions.
Objectives: Upon completion of this lesson/activity, students will be able to:
1. Explain population pyramids and2. Make generalizations based upon the shape of a population pyramid model.
Background: This lesson builds upon the previous introduction to population and demographics lessons.
Materials Required: 1. Graphing paper for each student to practice graphing 2. “Population Pyramid” article by Pennsylvania Department of Health; Health Statistics -
Technical Assistance Tools of the Trade
Procedures: 1. Review Population Indicator. Read the following statements and have the students write the concept
it describes.a. In Bangladesh, out of 1,000 people, 30 babies are born. In the U.S., 14 babies are born. (Birth
Rate)b. In Spain: out of every 1,000 people, 10 babies are born and 10 will die of old age. (Zero
population growth)c. A baby boy born in China lives to be 70. A baby born in Guinea-Bissau lives to be 45. (Life
Expectancy)d. In Rwanda, out of every 1,000, babies, 102 die. In the U.S. 7 babies will die. (Infant mortality
rate)e. Kenya’s population will double in 33 years. The U.S. will double in 143 years. (Population
Doubling Time)f. Somalia’s population increases 3% a year, while the U.S. grows at less than 1%. (Population
Growth Rate)g. Mexico City is the most populous city in the world. Water is sometimes too polluted to drink and
the air too polluted to breathe. (Population pressure on land)h. The world has 6 billion people. How much is one Billion? Well, if you rich uncle left you $1
billion (on the condition that you count it at a dollar a second, 8 hours a day), would you accept the money? Why or why not? (You’d better not: At that rate it would take you 95 years!)
2. Trade papers and go over answers. Hand back to students and keep for later use.3. Instruct: We have determined the world population distribution according to continents and the top
individual most populous countries and we explored some of the factors that determine a country’s populations. We are now going to examine individual country’s population structure. We are going to examine Population Pyramids.

4. Speculate: On the same piece of paper used earlier, write Population Pyramid and describe what it is.5. Have the students discuss their answers. 6. Explain Population Pyramids are a visual and graphic way to study, compare, 7. and analyze population growth of various countries throughout the world. Population Pyramids are
age structure diagrams that allow users to compare population distributions by age and sex to make generalizations of the world's population growth.
a. Explain that the graphed data will form a shape that will have meaning. “Pyramid means poor”
Lots of Babies Few seniors Workers have a tough time supporting all those babies
“Straight and shapeless means rich” Medium babies Medium seniors Medium workers A population that has no bulges- it is steady and predictable
8. Closure: On the same piece of paper from the opener, write three things that you learned and something that you need or want more information.
Assessment: Formal assessment with opening review quiz Informal assessment through observation, discussions, and quick write

POPULATION PYRAMIDS
There are many different ways to graphically present population data. However, the use of a population pyramid is considered the best way to graphically illustrate the age and sex distribution of a given population. A population pyramid, using a paired bar chart-type graphic, shows the numbers or percentages of males and females in each age group. This type of graphic provides a very clear picture of a population's age-sex composition. It can also be used for displaying future trends in a population.
The fertility rate of a population is the single most important influence on the shape of a population pyramid. The more children per parent, the broader will be the base of the pyramid. The median age of the population will also be younger. Mortality will also have an influence on the shape; however, it will be far less important an influence than fertility but also somewhat more complex. One would assume that lower mortality rates in a population would result in an older age distribution. However, just the opposite is true -- a population with lower mortality rates will display a slightly younger age distribution. This is due to the fact that any -disparities in the mortality rates of a population are more likely a result of variations within the younger age groups (usually infants and children).
There are generally 3 types of population pyramids created from age-sex distributions: expanding, stationary, contracting and constrictive.
Definitions of the 3 types follow:
1. EXPANDING population pyramids show larger numbers or percentages of the population in the younger age groups, usually with each age group smaller in size or proportion than the one born before it. These types of pyramids are usually found in populations with very large fertility rates and lower than average life expectancies. The age-sex distributions of Latin American and many Third World countries would probably display expansive population pyramids. There are 2 sub categories:
1. Early expanding – remote regions – Amazon Basin, parts of Africa2. Expanding – Tanzania, Egypt, Kenya, India
2. CONTRACTING population pyramids display lower numbers or percentages of younger people. The age-sex distributions of the Canada, Germany, Italy and Japan fall into this type of pyramid.
3. STATIONARY or near-stationary population pyramids display somewhat equal numbers or percentages for almost all age groups. Of course, smaller figures are still to be expected at the oldest age groups. The age-sex distributions of some European countries, especially Scandinavian ones and the US will tend to fall into this category.
Population projections (or percentages of population growth or decline over periods of time) can also be plotted and displayed on a pyramid along with the current or historical population figures, thus allowing for easy comparison of future or-historical trends. This type of pyramid is especially dramatic when large, consistent increases or decreases occur. On the next page is an example of this type of population age pyramid.

Population pyramids are quite handy tools when working with age-sex distributions and should be used as often as possible. They provide very effective graphic presentations. Probably their greatest asset is that they are so easily understandable to almost everyone, regardless of statistical skills.
TYPES of POPULATION PYRAMIDS

Graphing Population Pyramids
Estimated Sessions: 1 class day (50 minute period) Grade Level(s): 9 / 11
Purpose:
1. This lesson is designed to teach the student how to plot age/sex data into a population pyramid model.
2. How to use maps and other geographic representations, tools, and technologies to acquire, process, and report information from a spatial perspective.
3. How to analyze the spatial organization of people, places, and environments on Earth’s surface.4. Map the distribution of the world’s human population for different time periods. Analyze changes
in population characteristics and population density in specific regions.5. Identify regional resource issues that may impair sustainability, economic expansion, and/or
diversification. 6. Assess the impact of these issues on the physical and human environments of specific regions. 7. Propose strategies for dealing with regional resources issues.
Objectives: Upon completion of this lesson/activity, students will be able to:
1. explain population pyramids,2. gather and plot population age/sex data, and3. compare future or-historical trends.
Background: This lesson builds upon the understanding of population pyramid structure and meanings.
Procedures:
1. Opening Review Quiz: You can tell a lot about a country’s current events simply by looking at the shape of its population. Shapes can tell you secrets…
2. Pass out grid paper. Draw freehand and answer the following questions:a. Draw the shape of a rich country which is having a baby boom.
(Shapeless, except lots of 0-4 years old)b. Draw the shape of a poor country which has had a civil war.
(Pyramid with few in the fighting age)c. Draw the shape of a poor country which has had an epidemic among babies.
(Pyramid with very few babies)d. Draw a rich country which has excellent health care for senior citizens.
(Shapeless: same # for every age group)e. Draw a rich country which has excellent health care for senior citizens.
(Pyramid with few 0-4 and 6-9 year olds)f. Draw a poor country where the workers have migrated to other countries.
(Pyramid with few 15-50 year olds)3. When everyone is finished have 6 volunteers to go to the board and recreate their chart. Discuss each
individually and make corrections if needed. Have the students check their answers.
4. Explain to the class they will be making population pyramid models to analyze the city of Surrey population models.

5. Pass-out grid paper (or pre-made blank computer generated population pyramid grid) and a copy of the Statistics Canada information on Surrey.
6. The students will plot this information on three different charts
7. Then answer the following questions on the worksheet.
8. If they are having trouble understanding the pattern that they are seeing place the examples of population pyramids on the board for a reference and again discuss the meaning of each of the shapes.
9. Closure: ticket out the door – does looking at Surrey help in understanding that population pyramids are useful tools?
Assessment: Students will self-assess through the opening review quiz. Informal assessment through closing quick write.

How to use the Demographic Transition Model
Estimated Sessions: 1 class day
Grade level: 11
Purpose:
1. To understand the concepts of how the model works and the origins of the model and that it can still be used today
2. Population statistics are the basis to understand the type of issues or concerns a country, government or region may have at any of the different stages
Objectives: Upon completion of this lesson/activity students will be able to:
3. identify and explain potential effects of the different stages4. they will be able to explain where various countries and regions around the world are
located on the model and why
Procedure:
1. This needs to be front loaded to make sure they understand the purpose of the model2. Each students will get a hand out of a table and together the class with the teacher will fill in
the required information 3. Have the students work on the second part on their own and discuss as a class
Demographic Transition Model

Demographic Transition Model

Demographic Transition Model Worksheet
Read the incident and then try to figure out which stage and country this example belongs to. There is more than one answer.
Incident Stage
Region
1 Politicians worry about the oldies vote 2 The immigration of skilled workers and
their families are encouraged3 Baby booms produce larger school years
in a population pyramid4 People are encouraged to emigrate to
colonies5 Grandparents are rare6 Children have to work7 Cities with extreme wealth and extreme
poverty8 Population is in decline
Baby Boomers and the Big Bulge
Estimated Sessions: 1 class day (50 minute period) Grade Level(s): 9 / 11
Purpose:
4. To give a visual hands-on simulation for a better understanding of what happens in a society when they have a bulge in their population pyramid.
5. Analyze population trends in the local community and suggest the impact of these trends on the future of the community in relation to issues such as development, employment, health, cultural diversity, schools, political representation, and sanitation. Propose strategies for dealing with the issues identified.
Objectives: Upon completion of this lesson/activity, students will be able to:
1. identify and explain the effects of a baby boom over time.
Materials Required: For this simulation you can use one or more groups. For two groups you will need:
o Pantyhose – cut both legs off at both endso Two large grapefruit (representing baby boomers)o Two large bags of peanuts representing the rest of the population)o Each student will use their U.S. population pyramid models they produced from the day
before for reference.
Procedures: 1. Review the U.S. population pyramid models produced from the day before. 2. Instruct: Being a developed country, we are not suppose to have a BIG BULGE. We do because of
the Baby Boom – the great number of babies born between 1945 and 1965. The following exercise shows you why the most developed countries do not want to have a baby boom.
o Once upon a time, when World War II was over, soldiers came home, got married, and Mom raised a bunch of kids. As you can see from the chart you produced, there is a bulge in the middle. These are the Baby Boomers, now 40-60 years old.
3. Simulation: As for four volunteers, two groups of two. Each group will do the same thing. Step one: Put the grapefruit in the middle of the pantyhose leg. Put a bunch of peanuts on top of
it. Ask a short student to hold the pantyhose from the bottom, so the grapefruit does not fall out. Ask a tall student to hold the pantyhose from the top.
o Ask: When the Boomers were first born, what did the nation’s families spend their money on?
(Hospital bills, diapers, cribs, baby carriages, baby toys, etc.) Step two: Ask the lower student to push the grapefruit up, add some peanuts below it, hold the
thing upright.o Ask: When the Boomers became teenagers, what did the nation spend its money on?
(Schools, teachers, televisions, saddle shoes, bicycles, baseball cards, hoola hoops, Fizzies, and Kool-Aid, plastic swimming pools, dentist, Barbie dolls, etc.)
Step three: Ask the lower student to push the grapefruit up, add more peanuts below, hold the thing upright.
o Ask: When the Boomers became teenagers what did the nation spend its money on? (Records, record players, movies, poodle skirts, bikinis, French Fries, etc. Mothers started to work to pay the bills)
Step four: Ask the lower student to push the grapefruit up, add more peanuts below, hold the thing upright.
o Ask: When the Boomers entered the job market, what happened? (There were too many people for too few jobs. Wages dropped significantly.
People spent their money on houses, cars, stereos, etc.)
Step five: Ask the lower student to push the grapefruit up, add more peanuts below, hold the thing upright.
o Ask: Today, as the Boomers have hit middle age, what does the nation spend its money on?
(Houses, cars, motorboats, RV campers, vacations, spa resorts, and face lifts)o On January 1, 1996 the Baby Boomers began turning 50. Every 30 seconds a boomer has
a birthday. Step six: Take out half the peanuts at the top and push the grapefruit to the very top. Add
peanuts below.o In the year 2020, the Boomers will retire. Then what will YOU be spending YOUR
money on? (the Boomers’ Social Security checks, nursing homes, false teeth, elder care, etc.)
o When the Boomers die, there will be a surplus of houses and stocks for sale. There will not be enough people to buy them. These will drop in value. The peanuts may inherit peanuts.
Conclude the simulation by having the students answer the following questions on an exit ticket.
o Which is better – having a baby boom or not having one? (Not having one. It is a pain to push that grapefruit upward toward the top of the pyramid. )
So is it better to live before or after a baby boom? (Before. After a baby boom, the resources go to the Boomers. It puts a strain on future generations. The grapefruit crushes the peanuts below it.)
Collect the exit ticket from each student then go over the answers as a class.
Assessment: Informal assessment through the exit ticket to check for understanding. The students will self assess their understanding when we discuss the answers to the concept in
class.
Adaptations/Extensions/Call-Out:
Students research the demographic profiles of a neighborhood in a large urban center or community; retrieving data that will help them analyze the job market for babysitters. They will develop a better understanding of how population dynamics can affect them, either directly or indirectly.

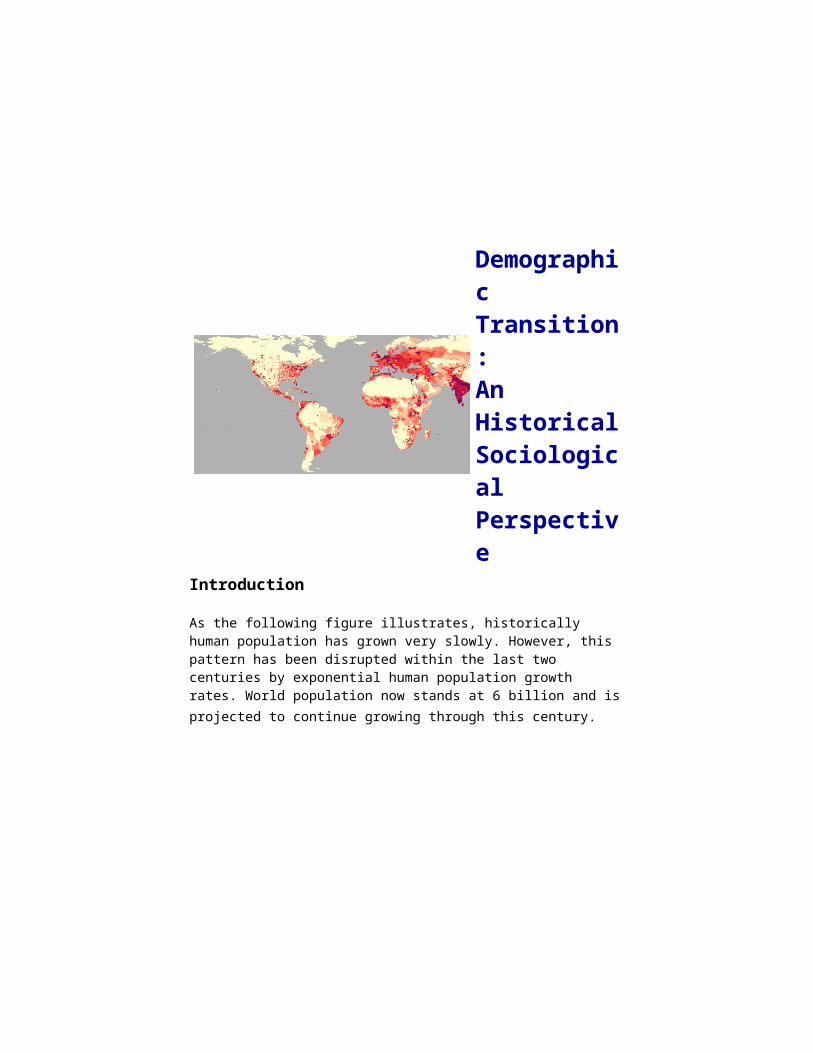
Demographic Transition:
An Historical Sociological Perspective
Introduction
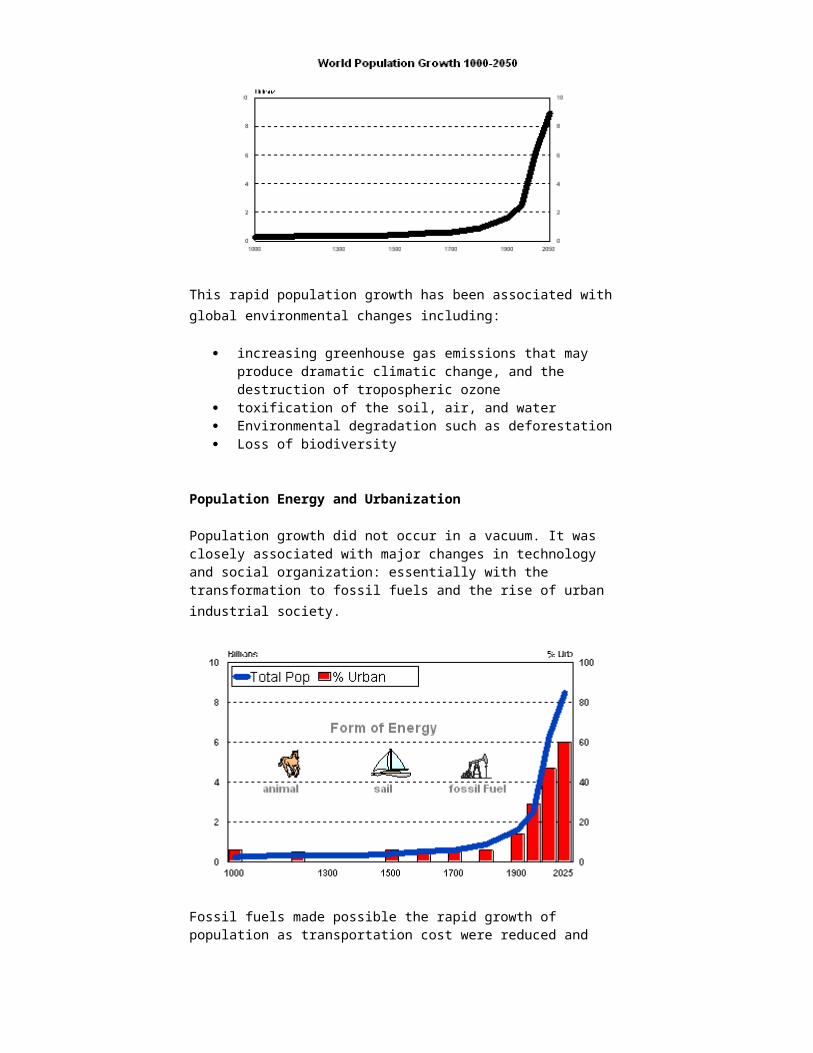
As the following figure illustrates, historically human population has grown very slowly. However, this pattern has been disrupted within the last two centuries by exponential human population growth rates. World population now stands at 6 billion and is projected to continue growing through this century.
This rapid population growth has been associated with global environmental changes including:
increasing greenhouse gas emissions that may produce dramatic climatic change, and the destruction of tropospheric ozone
toxification of the soil, air, and water Environmental degradation such as deforestation Loss of biodiversity
Population Energy and Urbanization

Population growth did not occur in a vacuum. It was closely associated with major changes in technology and social organization: essentially with the transformation to fossil fuels and the rise of urban industrial society.
Fossil fuels made possible the rapid growth of population as transportation cost were reduced and human productivity increased greatly. Along with population growth came increased demands for energy, while urbanization and the resulting industrial revolution provided the setting for increased human productivity. Together, increased energy consumption and population growth have produced major forms of environmental degradation.
Two Demographic Transitions
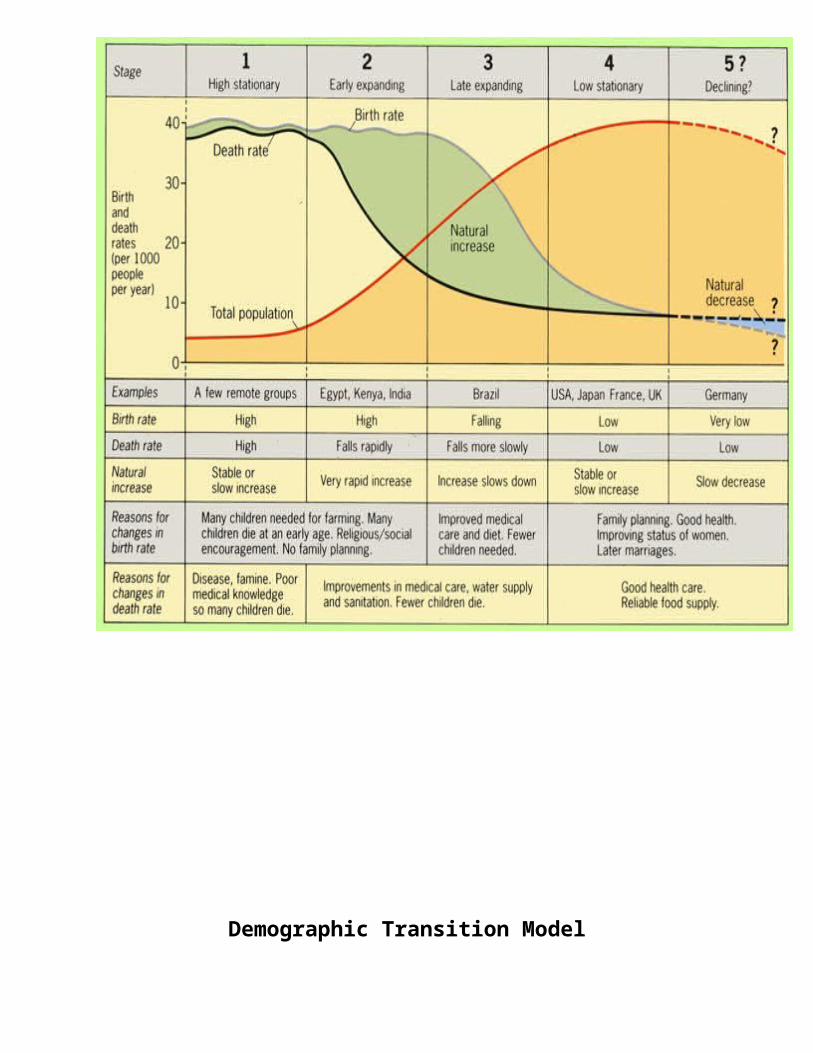
To understand this overall pattern of population growth, it is useful to review a basic condition of demographic history, known as the demographic transition: the change of a population from high birth and death rates to low birth and death rates. It is a simple definition, but an exceedingly powerful one, for it shows clearly a major transformation of human reproduction. The demographic transition generally occurs in four stages. In the initial stage, both birth and death rates are high, causing only slow and steady population growth. In the next stage, death rates begin to decline and birth rates remain high, resulting in faster population growth. In stage three, the birth rate begins to decline, and in the final stage, birth rates balance death rates. Population growth stabilizes in this final stage. In some cases, such as Italy, population growth may cease altogether.
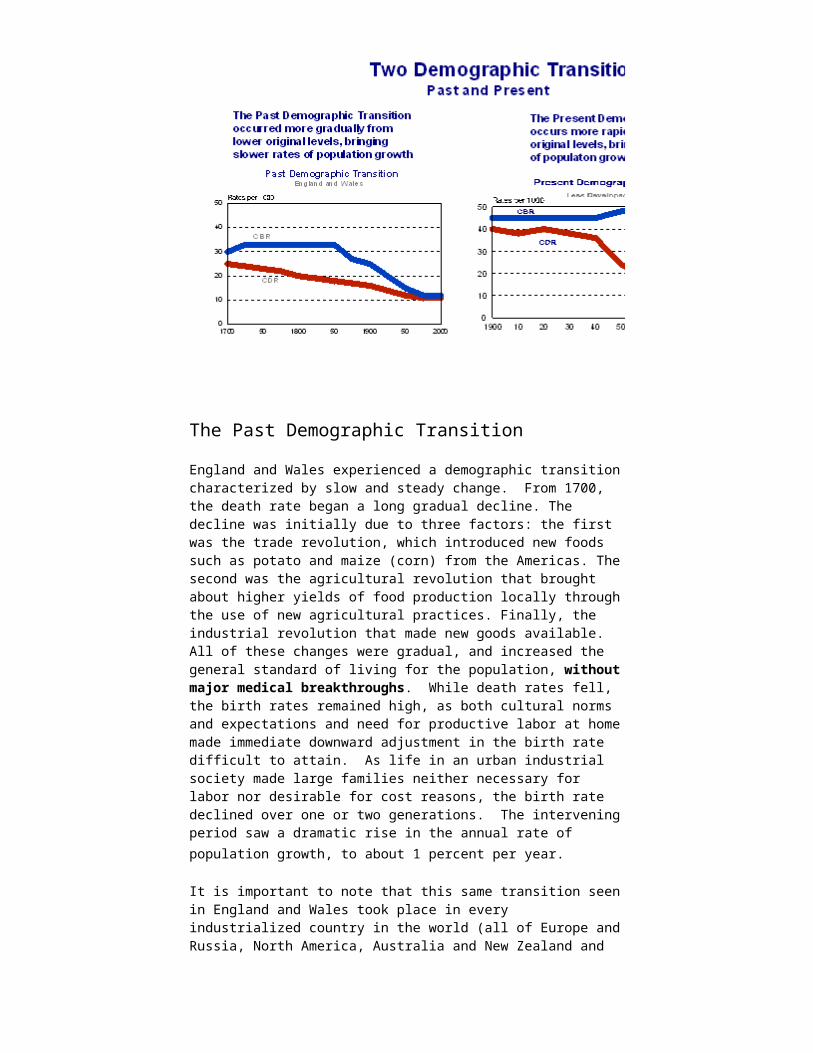
The following two charts illustrate this change.

The Past Demographic Transition
England and Wales experienced a demographic transition characterized by slow and steady change. From 1700, the death rate began a long gradual decline. The decline was initially due to three factors: the first was the trade revolution, which introduced new foods such as potato and maize (corn) from the Americas. The second was the agricultural revolution that brought about higher yields of food production locally through the use of new agricultural practices. Finally, the industrial revolution that made new goods available. All of these changes were gradual, and increased the general standard of living for the population, without major medical breakthroughs. While death rates fell, the birth rates remained high, as both cultural norms and expectations and need for productive labor at home made immediate downward adjustment in the birth rate difficult to attain. As life in an urban industrial society made large families neither necessary for labor nor desirable for cost reasons, the birth rate declined over one or two generations. The intervening period saw a dramatic rise in the annual rate of population growth, to about 1 percent per year.
It is important to note that this same transition seen in England and Wales took place in every industrialized country in the world (all of Europe and Russia, North America, Australia and New Zealand and Japan). All went from high birth and death rates in traditional, rural-agrarian societies to low birth and death rates in modern urban-industrial societies, though the dates and rates of change vary considerably.
The Present Demographic Transition
Today, the same demographic transition is occurring throughout

the world’s less developed countries, though the chart shows some dramatic differences with the past transition. First, birth and death rates start at higher levels, for reasons that are not at all clear. Second, death rates have declined much more drastically, moving as much in one generation as it had in the past in two centuries. Third, the cause of the mortality decline lies in the development of new medical and public health technologies, based on anti-bacterial chemicals and insecticides that reduce disease vectors. Rapid mortality declines without concomitant fertility declines means higher rates of population growth are occurring. Where growth rates reached one percent per year in Europe, they have recently reached over 3 percent per year in parts of Asia, Africa and Latin America. The birth rate is now beginning to fall. When this happens, as it has in parts of Asia and Latin America, it can come very quickly, declining from traditional to modern levels in a decade or two, rather than in a generation or two. Along the same lines as the mortality declines, the fertility declines are in large part the result of new medical, mainly contraceptive, technologies.
The mortality declines and the new contraceptive technology have also produced some revolutionary changes in public policy. Up until 1952 most governments of the world were pro-natalist, and were actively opposed to any form of birth control. In 1952 India became the first country to adopt an official policy to reduce population growth by reducing fertility within marriage. This called for the formation of a national family planning program to spread the new contraceptive technology. Since 1952, almost all less developed regions have undergone the same or a similar policy change: they now officially permit or are actively attempting to reduce population growth by reducing fertility.
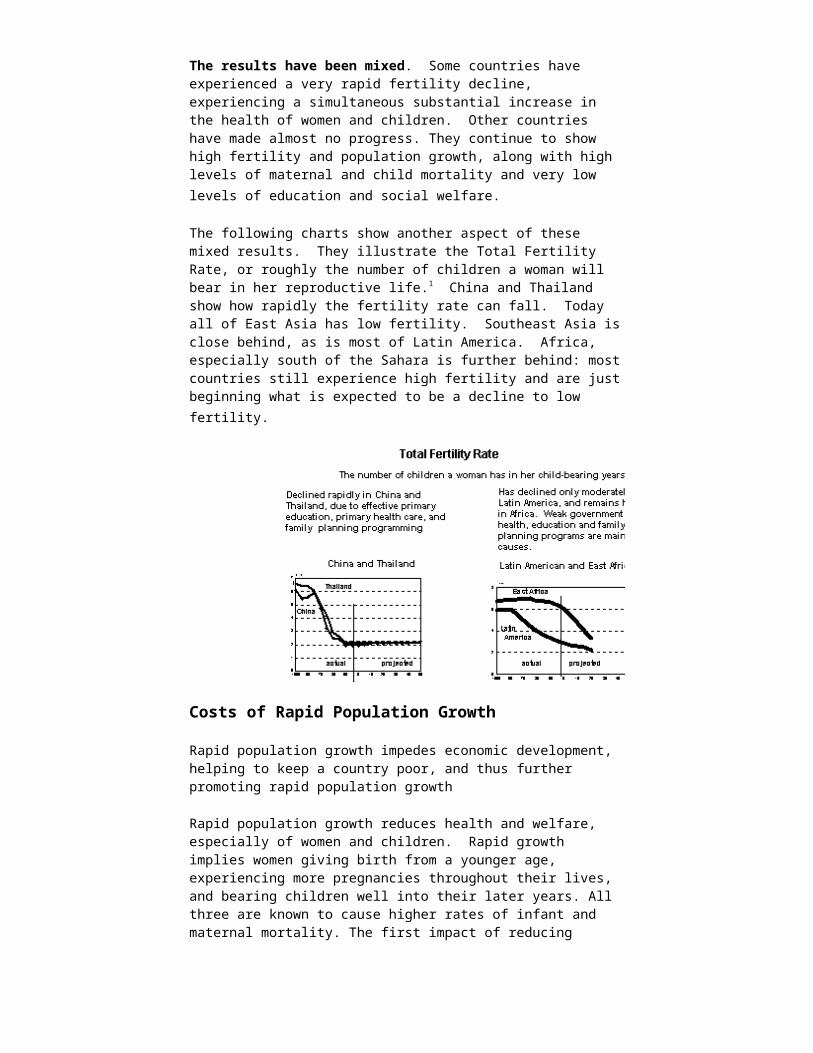
The results have been mixed. Some countries have experienced a very rapid fertility decline, experiencing a simultaneous substantial increase in the health of women and children. Other countries have made almost no progress. They continue to show high fertility and population growth, along with high levels of maternal and child mortality and very low levels of education and social welfare.
The following charts show another aspect of these mixed results. They illustrate the Total Fertility Rate, or roughly the number of children a woman will bear in her reproductive life.1 China and Thailand show how rapidly the fertility rate can fall. Today all of East Asia has low fertility. Southeast Asia is close behind, as is most of Latin America. Africa, especially south of the Sahara is further behind: most countries still experience high fertility and are just beginning what is expected to be a decline to low fertility.

Costs of Rapid Population Growth
Rapid population growth impedes economic development, helping to keep a country poor, and thus further promoting rapid population growth
Rapid population growth reduces health and welfare, especially of women and children. Rapid growth implies women giving birth from a younger age, experiencing more pregnancies throughout their lives, and bearing children well into their later years. All three are known to cause higher rates of infant and maternal mortality. The first impact of reducing fertility is increasing the health and welfare of women and children.
Rapid population growth increases number and proportion of young people in the society. This increases the demand for education and jobs. Where education and jobs are not available, young people, especially young males, who constitute a highly volatile population, can easily be swayed to violence by demagogic leaders.
The following chart shows how fertility is related to the growth of the young (15-19 year olds) male population.
Both Thailand and the Philippines began with roughly the same sized population in 1950, 20 million, of which young males accounted for about 10 percent, or 2 million. Thailand had a slightly lower fertility rate in the 1950s, but the real difference came in the 1960s when Thailand began what has become one of the world’s most successful national family planning programs. The Philippines lagged behind because its family planning program was held hostage to religious resistance. It also had weak overall public services – education, health and other things – held back by a pervasive weakness of government. By 1970 Philippines young males were a third larger in number than their Philippine counterparts (1.7 to 1.4 million). Today (2000) there are 4 million young male Filipinos against only 2.8 million Thais. Which country bears greater costs of providing education and jobs? By 2025, Young Filipino males will number 4.7 million against 2.7 million young Thais. The Philippines is fostering a large cohort of young men who need schools and jobs to keep them in society; without those amenities, this population will be vulnerable to leaders who can use them for their own purposes, ostensibly through providing work and a sense of belonging.
Wealth and Population
“Population growth, urban industrial society, economic development, environmental degradation, and loss of biodiversity form a seamless web. Each is both the cause and effect of the others. None can be effectively addressed in the absence of the others” (IUCN 1997). We shall examine some relationships between population measures and economic measures. These will demonstrate some surprisingly strong relations, which should not be interpreted as simple cause-and-effect, but rather of the interdependence of economic development and human population. But first, a brief digression to define our economic measures.
Adam Smith changed how we think about the measurement of wealth. In his book, “The Wealth of Nations” (1776), he argued
that a country’s wealth lies not in its gold, but in what it produces. This stimulated efforts to measure the output of a country, leading to National Income Accounting and the idea of Gross National Product. He also argued that reducing government restrictions and opening a country to free trade would help make it wealthy.
The Gross National Product of a country is an estimate of the market value of all the goods and services produced in a given period (usually a year).
The economy is circular: the price paid for a good or service goes to pay the factors that produced it: Labor earns wages; capital earns interest; land earns rent; and entrepreneurship earns profit. Thus we can add up all the earnings of the factors of production, and that will (theoretically) equal the cost people pay for all the goods and services produced.
Gross National or Gross Domestic Product?
For the most part, we shall treat them as interchangeable, but they are different, and their differences can be used to examine certain aspects of an economy.
Gross National Product is the sum of all goods and services produced by the factors of production owned by citizens of a nation.
Gross Domestic Product is the sum of all goods and services produced in the territory of the nation, regardless of who owns the means of production that generate the goods or services.
For example, if I invest some money in Mexico and it earns interest for me, it is a part of the US GNP, since it is produced by US owned capital. But that interest is a part of Mexico’s GDP, since it was produced in Mexican territory.
If a laborer comes from Mexico to work in the US, his earnings are part of the US GDP, since they are produced here. But if he sends his earnings back to Mexico, they are part of the Mexican GNP, since they are wages of a Mexican national.
We can compare countries using their GDP per capita (GDP/cap), and this will show that there are many more poor countries than rich countries. Statistically, the frequency distribution is skewed to the low end (think of a grade distribution skewed toward very low grades – but don’t worry, this won’t happen in our course). We often use a log transformation of skewed data to better “see” the pattern, and so we will graph the log (GDP/cap) against some population measures.
Consider the relationship between infant mortality rate and wealth. Wealth means higher welfare, or lower infant mortality rates. When looking at such a graph, always ask yourself: (1) what is the pattern here? (2) what might be the

explanation of outlying points. The “deviant cases” are those with higher or lower IMR than expected given their level of economic development. Using a regression line, the diagonal line across the chart, helps to see these clearly. A (linear) regression line is the one straight line that is closest to all of the points on the chart. Why are Mali and Sierra Leone higher than expected? Why are Cuba and Vietnam lower than expected?
The quote just above stated that urbanization is intertwined as well. The next graph documents that wealthy countries are more urbanized than poor countries.
Here is another example: Wealthy countries are growing more slowly than poorer countries. The problem of population growth is located in the poor countries.
Wealthy countries are growing more slowly because they have lower fertility than poor countries.
Wealthy countries have lower fertility because more of their people are using contraceptives. But also look at the deviant cases. Why is Japan using contraceptives less effectively than expected? Which other rich countries are using fewer contraceptives than expected? How do you explain this? Which countries are using more than expected? How do you explain this?

We close this lecture by emphasizing that the level of economic development of a country is intimately related to the status of its human population. Furthermore, Economic development has a very large impact on the global environment. Keep the following ideas in the back of your mind for the rest of the semester.
* Rich countries produce, consume, and pollute far more than do poor countries.
* The rapid population growth of the poor countries is overbalanced by the high individual consumption of the fewer people in the rich countries.
* HOWEVER: Rich countries are becoming more efficient in energy use, and are slowing the growth of consumption. Poor countries are increasing energy consumption and CO2 emissions, and are often getting less efficient in energy use.
SUMMARY
Human population rates have skyrocketed within the past two centuries and closely correlate to economic growth and technological advancements. The past demographic transition of the 1800's can be seen in many of today's developing countries, however, population stabilization is occurring at a much slower rate. There has been much concern on the implied socio and environmental impacts of these population growth rates and their entailed consumption rates. Economic measurements, such as GDP and GNP, are possible ways to assess these issues. They can be used as proxies for indicating which nations are in need of the greatest attention for mediation between the demands of a growing population and the pressures put on their natural
resources. However, there is much speculation as to how accurate and relevant these measurements are.
Related Documents