In the following report, Hanover Research assesses international student demand for degree programs at higher education institutions in Australia, the United States, and the United Kingdom. In particular, the report identifies the most popular fields of study for international students at the undergraduate and graduate levels and assesses international student enrolment trends in these fields. The report also evaluates international student demand for specific program types, and analyses trends in Chinese student participation in international education. Popular Programs for International Students June 2014

Welcome message from author
This document is posted to help you gain knowledge. Please leave a comment to let me know what you think about it! Share it to your friends and learn new things together.
Transcript

In the following report, Hanover Research assesses international student demand for
degree programs at higher education institutions in Australia, the United States, and the
United Kingdom. In particular, the report identifies the most popular fields of study for
international students at the undergraduate and graduate levels and assesses international
student enrolment trends in these fields. The report also evaluates international student
demand for specific program types, and analyses trends in Chinese student participation in
international education.
Popular Programs for International Students
June 2014
Hanover Research | June 2014
© 2014 Hanover Research | Academy Administration Practice 2
TABLE OF CONTENTS
Executive Summary and Key Findings ................................................................................ 3
KEY FINDINGS ............................................................................................................................. 3
Section I: Popular Degree Programs for International Students .......................................... 5
TRENDS IN INTERNATIONAL STUDENT PARTICIPATION AT AUSTRALIAN AND U.S. INSTITUTIONS .................... 5
Enrolment and Completions Trends at Institutions in Australia ....................................... 5
Enrolment and Completions Trends at Institutions in the United States ......................... 7
INTERNATIONAL STUDENT DEMAND FOR SPECIFIC PROGRAMS ............................................................ 10
Demand for Select Bachelor’s and Master’s Degree Programs ...................................... 10
Potential Demand for Graduate Certificates ................................................................... 12
Section II: International Student Regions and Countries of Origin .................................... 14
REGIONAL ENROLMENT TRENDS ................................................................................................... 14
TRENDS IN CHINESE STUDENT DEMAND FOR OVERSEAS EDUCATION .................................................... 16
Hanover Research | June 2014
© 2014 Hanover Research | Academy Administration Practice 3
EXECUTIVE SUMMARY AND KEY FINDINGS In the following report, Hanover Research assesses international student demand for degree programs at higher education institutions in Australia, the United States, and the United Kingdom. The report is divided into two sections:
Section I assesses international student demand for undergraduate and graduate degree programs in broad educational fields. This section uses recent international student enrolment data from Australia and the United States to comparatively analyse trends in international student demand. Additionally, this section evaluates international student demand for specific degree programs.
Section II analyses variation in international student demand for degree programs in Australia, the United States, and the U.K. according to student region of origin. In addition, this section assesses Chinese student demand for programs in Australia the United States, and discusses factors that may influence Chinese student demand in the coming years.
KEY FINDINGS
Overall, business and management degree programs have been the most popular course of study for international students for the last five years, at both the undergraduate and graduate levels. In Australia, 56.2 percent of all bachelor’s degree completions by international students were in the field of “Management and Commerce,” as were 58.1 percent of all master’s degree completions among international students. In the United States, across all levels of study, enrolments in business and management programs account for 21.8 percent of enrolments by international students.
Despite the overall popularity of business and management programs among international students, demand for programs in other fields is growing at a significant rate as international student interests diversify. Across all Australian higher education institutions, programs in agriculture, environmental and related studies are among the fastest growing at both the undergraduate and graduate levels. Engineering programs and programs in the field of “Society and Culture” are also growing quickly at the undergraduate level. At the graduate level, master’s programs in architecture, the natural and physical sciences, and health related programs are the fastest growing fields of study, after agriculture. Notably, although completions in management and commerce increased at a CAGR of 10.5 percent over the last five years at the undergraduate level, at the graduate level completions scarcely increased (0.0 percent CAGR).
Many of the programs reviewed in this report are among the most popular fields of study for international students in both Australia and the United States. Notably, bachelor’s degree programs in business, management and biological

Hanover Research | June 2014
© 2014 Hanover Research | Academy Administration Practice 4
sciences have shown relatively high volumes of completions in recent years. By contrast, bachelor’s degrees in the fields of astronomy and youth work/childhood studies have proven less popular among internationals students. At the graduate level, almost all of the reviewed program types evinced positive growth; in particular, programs in biology and chemistry, computer science and computer systems networking, and law programs for foreign lawyers were the high‐volume program types with the greatest growth from 2008 through 2012.
Students from China continue to constitute the largest percentage of international students from a single country at institutions in Australia, the U.S. and the U.K. Although some industry observers predict that Chinese demand for overseas higher education will abate somewhat by 2020, as the domestic supply of colleges and universities increases, enrolments and completions by Chinese students have been increasing since 2008 in all three major English‐speaking countries. Moreover, despite the predicted decrease in demand from China, observers note that the international market for higher education will not undergo significant change, and the main English‐speaking countries will continue to lead the market.
Although the educational preferences of students from China still largely conform to established norms there are indications that these preferences are becoming more diverse. Business, engineering, and mathematics and computer sciences remain the most popular fields of study for Chinese students, but experts suggest that more and more students from China are interested in alternative fields, such as the humanities and social sciences. Moreover, the increasingly competitive domestic job market for college graduates in China is likely to impact patterns of demand for undergraduate and graduate programs of study.

Hanover Research | June 2014
© 2014 Hanover Research | Academy Administration Practice 5
SECTION I: POPULAR DEGREE PROGRAMS FOR
INTERNATIONAL STUDENTS This section assesses international student demand for undergraduate and graduate‐level degree programs. Specifically, this analysis identifies the most popular fields of study for international students in Australia and the United States over the last five years, and evaluates enrolment trends in bachelor’s and master’s degree programs in those fields.
TRENDS IN INTERNATIONAL STUDENT PARTICIPATION AT AUSTRALIAN AND U.S. INSTITUTIONS
In order to identify the most popular fields of study for international students, Hanover assesses bachelor’s and master’s degree program enrolment and completions data for higher education institutions in Australia and the United States. These enrolment and completions data illustrate the rates of participation by international students across various fields and levels of study over the past five years. Where data for all five years in this range are available, Hanover calculates the following three metrics:
Compound Annual Growth Rate (CAGR): CAGR approximates annual growth based on the percentage change between the first and final years in the data series without incorporating yearly variation. It gives an impression of a theoretical, steady growth rate.
Average Annual Change (AAC): AAC indicates the average value of year‐to‐year numeric changes. It allows for an analysis of both directional trends and volume because programs with very large completions numbers and higher growth will generally have larger AACs.
Standard Deviation of Annual Changes (SDAC): SDAC reflects the consistency of growth over time. A larger standard deviation indicates a trend that is overall less consistent, and may indicate volatility, while a standard deviation of zero would indicate perfectly consistent change. Standard Deviation is a useful metric for better understanding the variance between the AAC and numerical year‐to‐year changes.
This section primarily relies on two sources for enrolment and completions data reported by higher education institutions in the United States: the Institute for International Education and the National Centre for Education Statistics’ (NCES) Integrated Postsecondary Data System (IPEDS). Enrolment and completions data pertaining to international students in Australia are provided by the Australian Government Department of Industry.
ENROLMENT AND COMPLETIONS TRENDS AT INSTITUTIONS IN AUSTRALIA
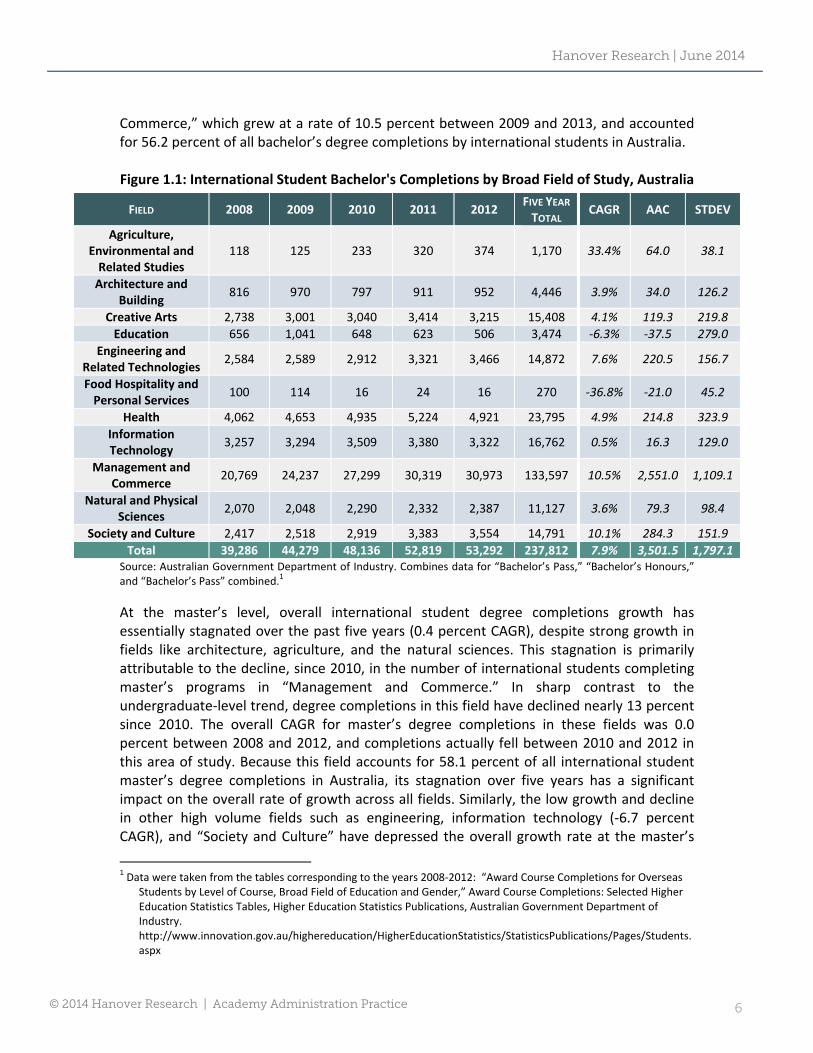
In Australia, the overall number of bachelor’s degree completions by international students has increased steadily since the 2008‐2009 academic year, at a CAGR of 7.9 percent. That growth has been driven largely by increasing completions in the field of “Management and
Hanover Research | June 2014
© 2014 Hanover Research | Academy Administration Practice 6
Commerce,” which grew at a rate of 10.5 percent between 2009 and 2013, and accounted for 56.2 percent of all bachelor’s degree completions by international students in Australia. Figure 1.1: International Student Bachelor's Completions by Broad Field of Study, Australia
FIELD 2008 2009 2010 2011 2012 FIVE YEAR TOTAL
CAGR AAC STDEV
Agriculture, Environmental and Related Studies
118 125 233 320 374 1,170 33.4% 64.0 38.1
Architecture and Building
816 970 797 911 952 4,446 3.9% 34.0 126.2
Creative Arts 2,738 3,001 3,040 3,414 3,215 15,408 4.1% 119.3 219.8
Education 656 1,041 648 623 506 3,474 ‐6.3% ‐37.5 279.0
Engineering and Related Technologies
2,584 2,589 2,912 3,321 3,466 14,872 7.6% 220.5 156.7
Food Hospitality and Personal Services
100 114 16 24 16 270 ‐36.8% ‐21.0 45.2
Health 4,062 4,653 4,935 5,224 4,921 23,795 4.9% 214.8 323.9
Information Technology
3,257 3,294 3,509 3,380 3,322 16,762 0.5% 16.3 129.0
Management and Commerce
20,769 24,237 27,299 30,319 30,973 133,597 10.5% 2,551.0 1,109.1
Natural and Physical Sciences
2,070 2,048 2,290 2,332 2,387 11,127 3.6% 79.3 98.4
Society and Culture 2,417 2,518 2,919 3,383 3,554 14,791 10.1% 284.3 151.9
Total 39,286 44,279 48,136 52,819 53,292 237,812 7.9% 3,501.5 1,797.1Source: Australian Government Department of Industry. Combines data for “Bachelor’s Pass,” “Bachelor’s Honours,” and “Bachelor’s Pass” combined.1
At the master’s level, overall international student degree completions growth has essentially stagnated over the past five years (0.4 percent CAGR), despite strong growth in fields like architecture, agriculture, and the natural sciences. This stagnation is primarily attributable to the decline, since 2010, in the number of international students completing master’s programs in “Management and Commerce.” In sharp contrast to the undergraduate‐level trend, degree completions in this field have declined nearly 13 percent since 2010. The overall CAGR for master’s degree completions in these fields was 0.0 percent between 2008 and 2012, and completions actually fell between 2010 and 2012 in this area of study. Because this field accounts for 58.1 percent of all international student master’s degree completions in Australia, its stagnation over five years has a significant impact on the overall rate of growth across all fields. Similarly, the low growth and decline in other high volume fields such as engineering, information technology (‐6.7 percent CAGR), and “Society and Culture” have depressed the overall growth rate at the master’s
1 Data were taken from the tables corresponding to the years 2008‐2012: “Award Course Completions for Overseas
Students by Level of Course, Broad Field of Education and Gender,” Award Course Completions: Selected Higher Education Statistics Tables, Higher Education Statistics Publications, Australian Government Department of Industry. http://www.innovation.gov.au/highereducation/HigherEducationStatistics/StatisticsPublications/Pages/Students.aspx

Hanover Research | June 2014
© 2014 Hanover Research | Academy Administration Practice 7
level. Figure 1.2, on the next page, shows the international student master’s degree completions data for the five most recent academic years in Australia. Figure 1.2: International Student Master's Completions by Broad Field of Study, Australia
FIELD 2008 2009 2010 2011 2012 FIVE YEAR TOTAL
CAGR AAC STDEV
Agriculture, Environmental and Related Studies
268 324 342 375 425 1,734 12.2% 39.3 14.9
Architecture and Building
445 503 583 655 741 2,927 13.6% 74.0 10.5
Creative Arts 824 929 1,113 1,057 949 4,872 3.6% 31.3 118.1
Education 1,804 1,760 2,030 1,945 1,965 9,504 2.2% 40.3 137.8
Engineering and Related Technologies
2,289 2,432 2,757 2,906 2,371 12,755 0.9% 20.5 328.9
Health 1,188 1,109 1,408 1,492 1,447 6,644 5.1% 64.8 148.3
Information Technology
3,671 3,471 4,434 3,919 2,782 18,277 ‐6.7% ‐222.3 762.9
Management and Commerce
20,105 21,445 23,081 22,593 20,132 107,356 0.0% 6.8 1,640.6
Natural and Physical Sciences
731 818 1,077 1,141 991 4,758 7.9% 65.0 145.2
Society and Culture 3,245 3,304 3,422 3,450 3,282 16,703 0.3% 9.3 107.3
Total 34,489 35,938 40,058 39,362 34,984 184,831 0.4% 123.8 3,109.0Source: Australian Government Department of Industry. Includes data for “Master’s by Research” and “Master’s by Coursework” combined.
2
ENROLMENT AND COMPLETIONS TRENDS AT INSTITUTIONS IN THE UNITED STATES
Although the fields of “Business and Management” and engineering, have remained the most popular fields for international students in the United States in recent years, in terms of enrolment volume, the field that has grown the most since the 2008‐2009 academic year is “Intensive English Language.” International student enrolments in this field increased at a CAGR of 19.1 percent between 2008‐2009 and 2012‐2013. Enrolments in “Math and Computer Science,” the next fastest growing field, increased at a CAGR of 8.3 percent, as shown in Figure 1.3, on the next page.
2 Ibid.

Hanover Research | June 2014
© 2014 Hanover Research | Academy Administration Practice 8
Figure 1.3: International Student Enrolments at U.S. Institutions, by Broad Field of Study, All Tertiary Levels
FIELD 2008/09 2009/10 2010/11 2011/12 2012/13 CAGR AAC STDEV
Agriculture 8,961 10,317 9,888 9,750 10,463 4.0% 375.5 704.7
Business and Management
138,565 145,514 155,769 166,733 178,984 6.6% 10,104.8 1,957.4
Education 18,120 18,299 16,933 17,200 17,011 ‐1.6% ‐277.3 651.5
Engineering 118,980 127,441 135,592 141,285 154,186 6.7% 8,801.5 2,598.5
Fine and Applied Arts 34,854 35,801 37,237 41,710 45,850 7.1% 2,749.0 1,571.5
Health Professions 35,064 32,111 32,526 29,535 31,222 ‐2.9% ‐960.5 2,061.2
Humanities 19,179 17,985 16,263 16,294 17,121 ‐2.8% ‐514.5 1,002.1
Intensive English Language
19,898 22,315 32,306 38,887 39,990 19.1% 5,023.0 3,509.5
Math and Computer Science
56,367 60,780 64,588 71,364 77,560 8.3% 5,298.3 1,224.2
Other Fields of Study 73,011 76,743 75,459 77,252 79,876 2.3% 1,716.3 1,863.8
Physical and Life Sciences
61,699 61,285 63,471 66,007 69,152 2.9% 1,863.3 1,358.8
Social Sciences 57,348 59,865 63,347 66,163 73,274 6.3% 3,981.5 1,840.3
Undeclared 20,944 18,707 19,898 22,315 24,955 4.5% 1,002.8 1,950.1Source: Institute of International Education3
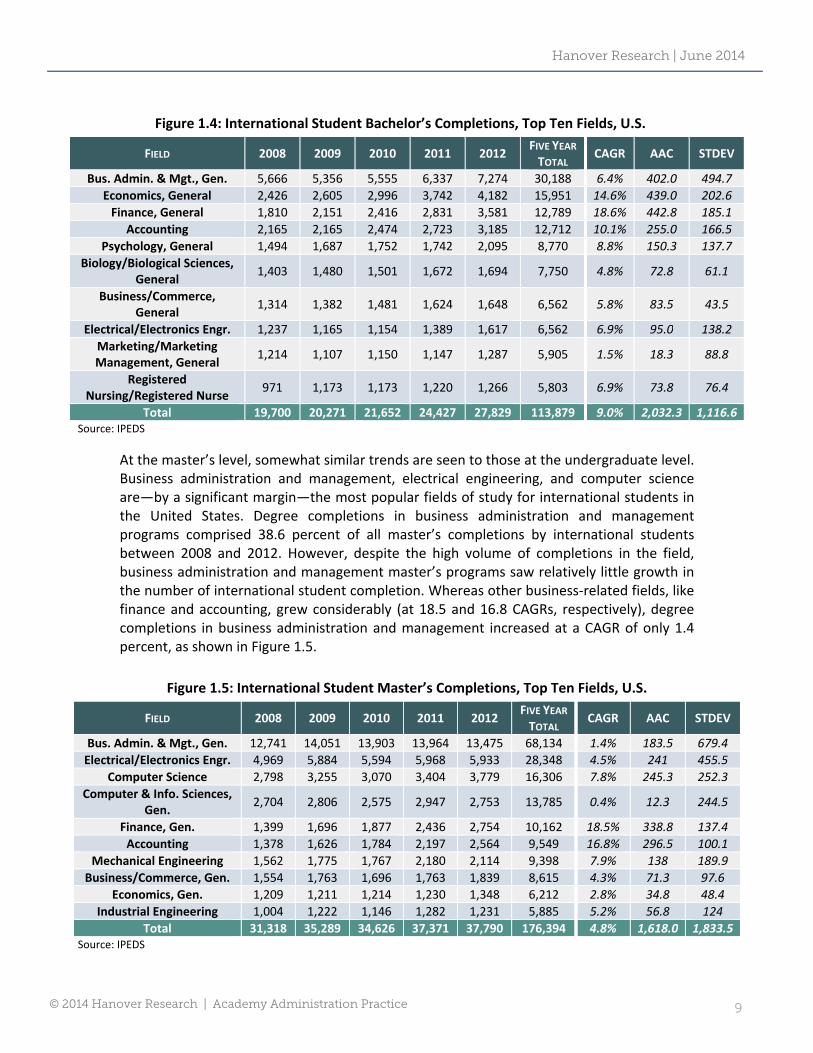
At the undergraduate level, programs related to business and economics have largely been the most popular over the last five years in the United States for international students. Other notably popular programs include those in biology, electrical engineering, and nursing. Some of the top ten subjects have seen significant growth in the number of bachelor’s degree completions between 2008 and 2010. The fields of economics and finance have both seen growth that is near or above a CAGR of 15 percent during this period.
3 Data were taken from the tables corresponding to the years 2009‐2013: “International Students: Fields of Study,”
Open Doors Data, Institute of International Education. http://www.iie.org/Research‐and‐Publications/Open‐Doors/Data/International‐Students/Fields‐of‐Study
Hanover Research | June 2014
© 2014 Hanover Research | Academy Administration Practice 9
Figure 1.4: International Student Bachelor’s Completions, Top Ten Fields, U.S.
FIELD 2008 2009 2010 2011 2012 FIVE YEAR TOTAL
CAGR AAC STDEV
Bus. Admin. & Mgt., Gen. 5,666 5,356 5,555 6,337 7,274 30,188 6.4% 402.0 494.7
Economics, General 2,426 2,605 2,996 3,742 4,182 15,951 14.6% 439.0 202.6
Finance, General 1,810 2,151 2,416 2,831 3,581 12,789 18.6% 442.8 185.1
Accounting 2,165 2,165 2,474 2,723 3,185 12,712 10.1% 255.0 166.5
Psychology, General 1,494 1,687 1,752 1,742 2,095 8,770 8.8% 150.3 137.7
Biology/Biological Sciences, General
1,403 1,480 1,501 1,672 1,694 7,750 4.8% 72.8 61.1
Business/Commerce, General
1,314 1,382 1,481 1,624 1,648 6,562 5.8% 83.5 43.5
Electrical/Electronics Engr. 1,237 1,165 1,154 1,389 1,617 6,562 6.9% 95.0 138.2
Marketing/Marketing Management, General
1,214 1,107 1,150 1,147 1,287 5,905 1.5% 18.3 88.8
Registered Nursing/Registered Nurse
971 1,173 1,173 1,220 1,266 5,803 6.9% 73.8 76.4
Total 19,700 20,271 21,652 24,427 27,829 113,879 9.0% 2,032.3 1,116.6Source: IPEDS
At the master’s level, somewhat similar trends are seen to those at the undergraduate level. Business administration and management, electrical engineering, and computer science are—by a significant margin—the most popular fields of study for international students in the United States. Degree completions in business administration and management programs comprised 38.6 percent of all master’s completions by international students between 2008 and 2012. However, despite the high volume of completions in the field, business administration and management master’s programs saw relatively little growth in the number of international student completion. Whereas other business‐related fields, like finance and accounting, grew considerably (at 18.5 and 16.8 CAGRs, respectively), degree completions in business administration and management increased at a CAGR of only 1.4 percent, as shown in Figure 1.5.
Figure 1.5: International Student Master’s Completions, Top Ten Fields, U.S.
FIELD 2008 2009 2010 2011 2012 FIVE YEAR TOTAL
CAGR AAC STDEV
Bus. Admin. & Mgt., Gen. 12,741 14,051 13,903 13,964 13,475 68,134 1.4% 183.5 679.4
Electrical/Electronics Engr. 4,969 5,884 5,594 5,968 5,933 28,348 4.5% 241 455.5
Computer Science 2,798 3,255 3,070 3,404 3,779 16,306 7.8% 245.3 252.3
Computer & Info. Sciences, Gen.
2,704 2,806 2,575 2,947 2,753 13,785 0.4% 12.3 244.5
Finance, Gen. 1,399 1,696 1,877 2,436 2,754 10,162 18.5% 338.8 137.4
Accounting 1,378 1,626 1,784 2,197 2,564 9,549 16.8% 296.5 100.1
Mechanical Engineering 1,562 1,775 1,767 2,180 2,114 9,398 7.9% 138 189.9
Business/Commerce, Gen. 1,554 1,763 1,696 1,763 1,839 8,615 4.3% 71.3 97.6
Economics, Gen. 1,209 1,211 1,214 1,230 1,348 6,212 2.8% 34.8 48.4
Industrial Engineering 1,004 1,222 1,146 1,282 1,231 5,885 5.2% 56.8 124
Total 31,318 35,289 34,626 37,371 37,790 176,394 4.8% 1,618.0 1,833.5Source: IPEDS

Hanover Research | June 2014
© 2014 Hanover Research | Academy Administration Practice 10
INTERNATIONAL STUDENT DEMAND FOR SPECIFIC PROGRAMS
National enrolments and completions data collected by Australia and the United Kingdom are not specific enough to identify trends in international student demand beyond general fields of study. In particular, neither county disaggregates international student enrolments or completions at the program level. Thus, in order to assess international student demand for specific academic programs, Hanover uses completions data for institutions of higher education in the United States. These data enable Hanover to assess international student demand trends by specific program type and level of study in These data, like the completions data used in the previous subsection, are sourced from IPEDS. The NCES uses a taxonomic system of numeric codes to classify higher education academic programs, known as the Classification of Instructional Programs (CIP). All institutions of higher education in the U.S. submit degree completions data, classified by CIP code and academic award level, to IPEDS. When analysing IPEDS completions data in terms of student demand for specific program types, as opposed to considering them in terms of student demand for broader fields of study, number of limitations must be taken into account:
Institutions classify their programs independently, so two programs that are identical in all respects could, hypothetically, be classified under two different CIP codes. Consequently, IPEDS data for a given CIP codes can sometimes fail to capture completions and programs reported under another code.
Due to international differences in legal education and related credentials, Hanover has omitted Juris Doctor‐level completions from its analysis of international student demand for master’s programs in Laws. Instead, Hanover has analysed completions for two CIP codes—“Legal Studies, General” and “Programs for Foreign Lawyers”—to illustrate student demand for master’s level programs in law.
The CIP system was revised by IPEDS in 2010. At this point, a number of new CIP categories were introduced while others were renamed or omitted. This reorganization resulted in some institutions re‐classifying their degree programs under different or new (often more specific) CIP categories, while others did not. In some cases this shift can falsely suggest a spike or drop in student interest for a certain subject area. Hanover’s methodology for collecting and organizing IPEDS data is designed to avoid such misrepresentations.
DEMAND FOR SELECT BACHELOR’S AND MASTER’S DEGREE PROGRAMS
At the undergraduate level, a few of the reviewed program types are among the top ten most popular programs for international students, as identified in the previous subsection. For example, bachelor’s programs in business administration and management, the program type that correlates most closely with leadership and management in the CIP system, have been the most popular among international students from 2008 through 2012.

Hanover Research | June 2014
© 2014 Hanover Research | Academy Administration Practice 11
Similarly, undergraduate programs in biology/biological sciences have seen a large number of completions in recent years. It should also be noted that there were a low volume of completions in certain degree fields, such as bachelor’s degrees in youth work and astronomy/atmospheric sciences. Other program types with relatively low numbers of aggregate completions over five years include child development, astronomy and criminology, as Figure 1.6, on the next page, demonstrates.
Figure 1.6: International Student Bachelor’s Completions, Specific Fields
FIELD 2008 2009 2010 2011 2012 FIVE YEAR TOTAL
CAGR AAC STDEV
Bus. Admin. & Mgt., Gen. 5,666 5,356 5,555 6,337 7,274 30,188 6.4% 402.0 494.7
International Relations and Affairs
735 688 681 740 695 3,539 ‐1.4% ‐10.0 42.9
International/Global Studies 173 236 192 248 264 1,113 11.1% 22.8 42.5
English Lang. & Lit., Gen. 351 345 394 398 431 1,919 5.3% 20.0 22.0
History, Gen. 257 283 272 292 292 1,396 3.2% 8.8 14.9
Political Science and Government, Gen.
743 818 846 1,048 1,059 4,514 9.3% 79.0 74.8
Philosophy 118 126 139 175 194 752 13.2% 19.0 10.6
Youth Services/Administration 0 0 0 0 2 2 N/A 0.5 0.9
Child Development 9 9 13 8 11 50 5.1% 0.5 3.5
Biology/Biological Sciences, Gen.
1,403 1,480 1,501 1,672 1,694 7,750 4.8% 72.8 61.1
Chemistry, General 472 545 565 609 618 2,809 7.0% 36.5 24.6
Physics, Gen. 267 236 241 287 355 1,386 7.4% 22.0 38.0
Astronomy 6 8 6 14 2 36 ‐24.0% ‐1.0 7.3
Atmospheric Sciences and Meteorology, Gen.
2 5 3 2 6 18 31.6% 1.0 2.5
Geology/Earth Science, Gen. 52 60 75 83 78 348 10.7% 6.5 7.2
Criminology 30 40 29 39 47 185 11.9% 4.3 8.8
Total 10,284 10,235 10,512 11,952 13,022 56,005 6.1% 684.5 596.5Source: IPEDS
At the master’s level, demand for several of the reviewed program types places them among the top ten most popular programs for international students. As previously noted, business administration and management programs are the most popular types of master’s degree programs among international students. Computing degree programs, such as those in computer science and information sciences, are also highly popular among international students. Likewise, programs in computer networking have become increasingly popular and evince the fastest growth among all programs for which more than 1,000 completions were reported between 2008 and 2012. Notably, the growth rates for the selected individual program types are generally higher than they are for the selected bachelor’s programs, as Figure 1.7, on the next page, illustrates.

Hanover Research | June 2014
© 2014 Hanover Research | Academy Administration Practice 12
Figure 1.7: International Student Master’s Completions, Specific Fields
FIELD 2008 2009 2010 2011 2012 FIVE YEAR TOTAL
CAGR AAC STDEV
Bus. Admin. & Mgt., Gen. 12,741 14,051 13,903 13,964 13,475 68,134 1.4% 183.5 679.4
Legal Studies, Gen. 19 103 40 118 149 429 67.3% 32.5 58.8
Programs for Foreign Lawyers 608 645 700 699 735 3,387 4.9% 31.8 20.4
Biology/Biol. Sciences, Gen. 386 425 446 501 484 2,242 5.8% 24.5 26.8
Chemistry, Gen. 670 645 685 757 800 3,557 4.5% 32.5 35.5
Physics, Gen. 610 550 566 556 638 2,920 1.1% 7.0 51.2
Astronomy 19 14 21 41 19 114 0.0% 0.0 15.5
Atmospheric Sciences and Meteorology, Gen.
22 21 38 19 34 134 11.5% 3.0 14.5
Geology/Earth Science, Gen. 100 130 116 122 162 630 12.8% 15.5 21.0
Comp./Info. Sciences, Gen. 2,704 2,806 2,575 2,947 2,753 13,785 0.4% 12.3 244.5
Computer Science 2,798 3,255 3,070 3,404 3,779 16,306 7.8% 245.3 252.3
Computer Systems Networking and Telecommunications
174 258 291 248 284 1,255 13.0% 27.5 45.5
Total 20,851 22,903 22,451 23,376 23,312 109,506 2.8% 615.3 969.6Source: IPEDS
POTENTIAL DEMAND FOR GRADUATE CERTIFICATES
In Australia, management and commerce certificate programs—as with bachelor’s and master’s degree programs—are the most popular graduate certificates among international students. Education, society and culture, and health certificate programs are the next most popular, as indicated by the total number of completions in each program type between 2008 and 2012. Over this five‐year period, the number of students enrolling in graduate certificate programs in Australia has increased significantly. Almost 900 more completions were reported in 2012 than were reported in 2008, as Figure 1.8 demonstrates.
Figure 1.8: International Student Graduate Certificate Completions, Australia
FIELD 2008 2009 2010 2011 2012 FIVE YEAR TOTAL
CAGR AAC STDEV
Natural/Phys. Sciences 23 28 59 39 41 190 15.5% 4.5 18.1
Information Technology 152 79 114 87 153 585 0.2% 0.3 53.9
Engr. & Related Tech. 57 58 87 113 72 387 6.0% 3.8 28.0
Architecture/Building 4 2 19 15 10 50 25.7% 3.7 9.5
Agric., Environ. & Related Studies 11 6 33 28 43 121 40.6% 8.0 13.7
Health 55 51 183 159 152 600 28.9% 24.3 62.7
Education 105 75 198 240 195 813 16.7% 22.5 66.7
Management/Commerce 809 885 1,319 1,372 1,298 5,683 12.5% 122.3 188.8
Society and Culture 67 106 207 188 194 762 30.4% 31.8 45.0
Creative Arts 13 15 48 46 38 160 30.8% 6.3 15.8
Food, Hosp. & Personal Serv. 1 3 0 0 0 4 ‐100.0% ‐0.3 1.8
Total 1,297 1,308 2,267 2,287 2,196 9,355 14.1% 224.8 426.2Source: Australian Government Department of Industry4
4 See: “Award Course Completions for Overseas Students by Level of Course, Broad Field of Education and Gender,”
Award Course Completions: Selected Higher Education Statistics Tables, Higher Education Statistics Publications,

Hanover Research | June 2014
© 2014 Hanover Research | Academy Administration Practice 13
In the United States, the most popular postgraduate certificate programs differ somewhat from those in Australia. In particular, more certificates were awarded in music performance programs than for any other program type. However, programs in business administration and management, the second most popular postgraduate certificate, grew much faster (8.0 percent CAGR) than music performance programs (0.7 percent CAGR). Figure 1.9 shows completions data for the top ten graduate certificate program types at the graduate level.
Figure 1.9: Graduate Certificate Completions, Top Ten Program Types, U.S.
FIELD 2008 2009 2010 2011 2012 FIVE YEAR TOTAL
CAGR AAC STDEV
Music Performance, General
141 130 158 172 145 746 0.7% 1.0 21.4
Business Administration and Management, Gen.
89 124 119 139 121 592 8.0% 8.0 20.7
Advanced Legal Research/Studies,
Gen. 160 142 ‐ ‐ ‐ 302 ‐‐ ‐‐ ‐‐
Mechanical Engineering
21 16 21 164 80 302 39.7% 14.8 81.7
Multi‐/ Interdisciplinary Studies, Other
67 85 78 43 25 298 ‐21.8% ‐10.5 19.2
Engineering, Other 28 55 192 6 10 291 ‐22.7% ‐4.5 116.2
Economics, Gen. 53 68 48 43 38 250 ‐8.0% ‐3.8 12.4
Elementary Education and
Teaching 143 82 4 12 4 245 ‐59.1% ‐34.8 35.7
Theology/Theological Studies
41 34 57 59 43 234 1.2% 0.5 14.5
Finance, Gen. 17 22 15 77 97 228 54.6% 20.0 26.1
Total 760 758 692 715 563 3,488 ‐7.2% ‐49.3 67.6Source: IPEDS ‐Data unavailable
Australian Government Department of Industry. http://www.innovation.gov.au/highereducation/HigherEducationStatistics/StatisticsPublications/Pages/Students.aspx

Hanover Research | June 2014
© 2014 Hanover Research | Academy Administration Practice 14
SECTION II: INTERNATIONAL STUDENT
REGIONS AND COUNTRIES OF ORIGIN
This section assesses regional variations in international student demand for tertiary‐level programs of study at overseas institutions. The analysis in this section compares international student enrolment data—for higher education institutions in Australia, the United States, and the United Kingdom—to identify trends demand based on students’ regional and national origins, with a particular focus on Asia and China.
REGIONAL ENROLMENT TRENDS
Overseas enrolments by students from Asia represent 52 percent of all international student enrolments worldwide.5 At higher education institutions in the United States, the percentage of international students from Asia is even higher. At the undergraduate level, students from Asia made up 68.9 percent of all international student enrolments between 2008‐2009 and 2012‐2013; at the graduate level international students from Asia comprised 58.4 percent of all international student enrolments, as shown in Figure 2.1.
Figure 2.1: International Student Enrolments at U.S. Institutions, by Region of Origin
REGION 2008/09 2009/10 2010/11 2011/12 2012/13 FIVE YEAR TOTAL
CAGR AAC STDEV
Undergraduate
Sub‐Saharan Africa 21,058 20,059 19,496 18,335 16,999 57,245 ‐5.2% ‐1,014.8 1,183.7
Asia 150,850 156,056 172,133 186,739 205,986 1,029,007 8.1% 13,784.0 5,228.8
Europe 36,489 32,231 31,318 32,359 33,612 159,378 ‐2.0% ‐719.3 2,210.7
Latin America 38,195 34,414 34,573 34,081 34,894 101,972 ‐2.2% ‐825.3 1,767.8
North Africa & Middle East
14,044 15,200 17,800 23,976 32,088 79,267 22.9% 4,511.0 2,768.0
North America 14,581 13,942 13,456 12,866 13,395 59,210 ‐2.1% ‐296.5 479.8
Oceania 2,697 2,523 2,743 2,694 3,008 7,329 2.8% 77.8 197.2
Total 277,914 274,425 291,519 309,336 339,982 1,493,408 5.2% 15,517.0 12,225.9
Graduate
Sub‐Saharan Africa 11,802 12,094 12,248 11,970 9,131 94,233 ‐6.2% ‐667.8 1,271.1
Asia 199,051 201,734 204,402 207,974 215,846 871,764 2.1% 4,198.8 2,152.1
Europe 34,026 32,943 32,288 30,831 29,290 166,009 ‐3.7% ‐1,184.0 350.7
Latin America 20,903 21,376 20,111 19,793 19,789 176,157 ‐1.4% ‐278.5 635.4
North Africa & Middle East
10,860 12,302 14,358 17,084 24,663 103,108 22.8% 3,450.8 2,426.3
North America 13,259 12,019 11,685 11,265 10,982 68,240 ‐4.6% ‐569.3 390.3
Oceania 1,424 1,412 1,479 1,512 1,502 13,665 1.3% 19.5 32.8
Total 291,325 293,880 296,571 300,429 311,203 1,493,176 1.7% 4,969.5 3,389.3Source: Institute of International Education.6 *Beginning with Open Doors 2013, the Africa region was changed to Sub‐Saharan Africa and North Africa was grouped with the Middle East to create a Middle East & North Africa region. Bermuda has been moved from North America to the Caribbean.”
5 Lawton, W. et. al. “Horizon Scanning: What Will Higher Education Look Like in 2020?,” Observatory on Borderless
Higher Education, September 2013, pp‐15‐17. http://www.obhe.ac.uk/documents/view_details?id=934 6 Data were taken from the tables corresponding to the years 2009‐2013: “International Students: Academic Level
and Place of Origin,” Open Doors Data, Institute of International Education. http://www.iie.org/Research‐and‐Publications/Open‐Doors/Data/International‐Students/By‐Academic‐Level‐and‐Place‐of‐Origin
Hanover Research | June 2014
© 2014 Hanover Research | Academy Administration Practice 15
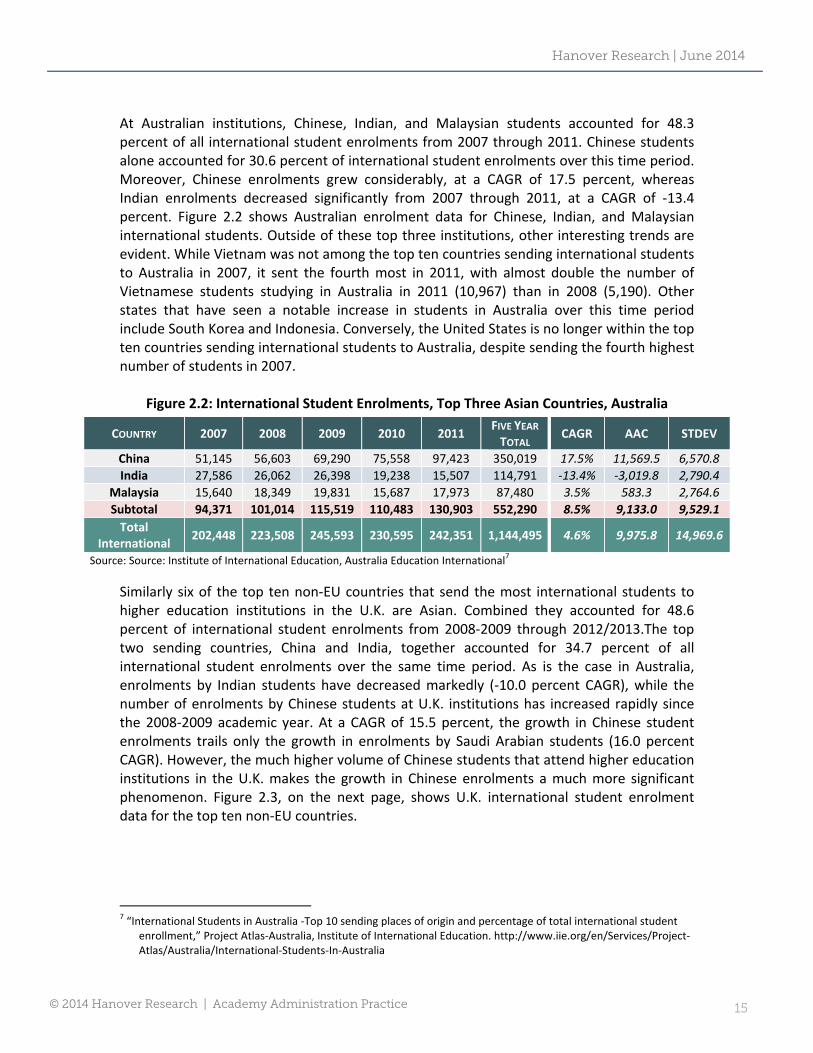
At Australian institutions, Chinese, Indian, and Malaysian students accounted for 48.3 percent of all international student enrolments from 2007 through 2011. Chinese students alone accounted for 30.6 percent of international student enrolments over this time period. Moreover, Chinese enrolments grew considerably, at a CAGR of 17.5 percent, whereas Indian enrolments decreased significantly from 2007 through 2011, at a CAGR of ‐13.4 percent. Figure 2.2 shows Australian enrolment data for Chinese, Indian, and Malaysian international students. Outside of these top three institutions, other interesting trends are evident. While Vietnam was not among the top ten countries sending international students to Australia in 2007, it sent the fourth most in 2011, with almost double the number of Vietnamese students studying in Australia in 2011 (10,967) than in 2008 (5,190). Other states that have seen a notable increase in students in Australia over this time period include South Korea and Indonesia. Conversely, the United States is no longer within the top ten countries sending international students to Australia, despite sending the fourth highest number of students in 2007.
Figure 2.2: International Student Enrolments, Top Three Asian Countries, Australia
COUNTRY 2007 2008 2009 2010 2011 FIVE YEAR TOTAL
CAGR AAC STDEV
China 51,145 56,603 69,290 75,558 97,423 350,019 17.5% 11,569.5 6,570.8
India 27,586 26,062 26,398 19,238 15,507 114,791 ‐13.4% ‐3,019.8 2,790.4
Malaysia 15,640 18,349 19,831 15,687 17,973 87,480 3.5% 583.3 2,764.6
Subtotal 94,371 101,014 115,519 110,483 130,903 552,290 8.5% 9,133.0 9,529.1
Total International
202,448 223,508 245,593 230,595 242,351 1,144,495 4.6% 9,975.8 14,969.6
Source: Source: Institute of International Education, Australia Education International7
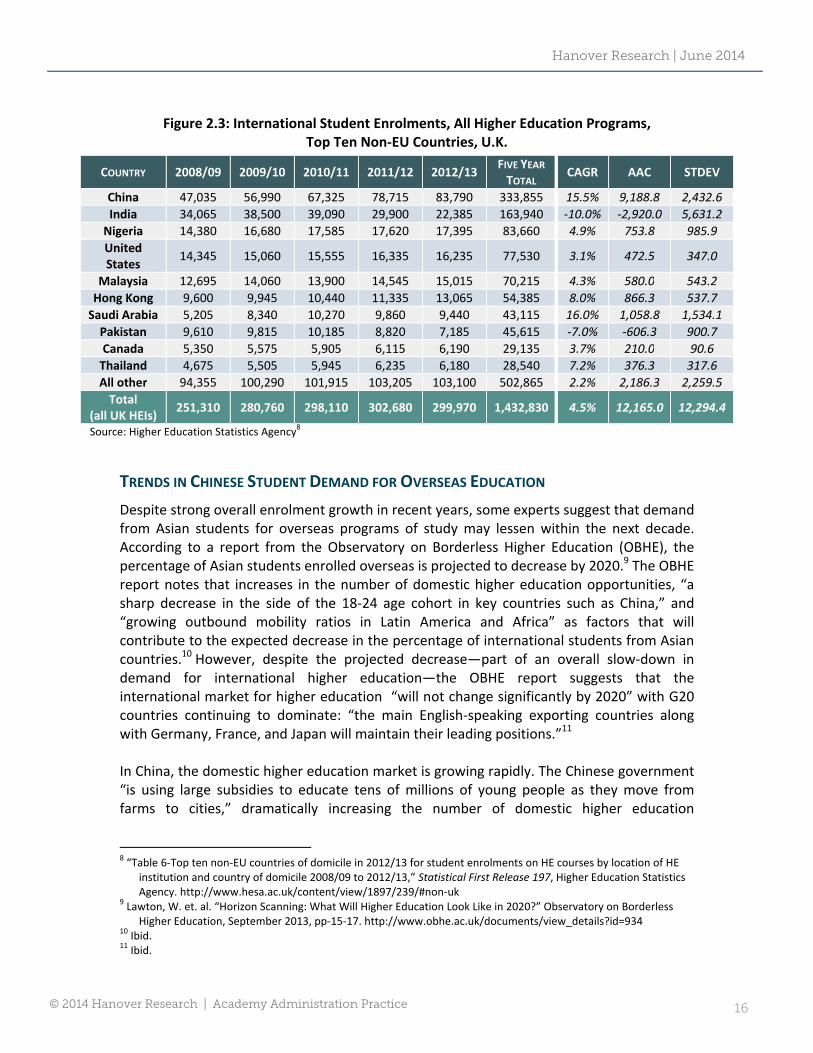
Similarly six of the top ten non‐EU countries that send the most international students to higher education institutions in the U.K. are Asian. Combined they accounted for 48.6 percent of international student enrolments from 2008‐2009 through 2012/2013.The top two sending countries, China and India, together accounted for 34.7 percent of all international student enrolments over the same time period. As is the case in Australia, enrolments by Indian students have decreased markedly (‐10.0 percent CAGR), while the number of enrolments by Chinese students at U.K. institutions has increased rapidly since the 2008‐2009 academic year. At a CAGR of 15.5 percent, the growth in Chinese student enrolments trails only the growth in enrolments by Saudi Arabian students (16.0 percent CAGR). However, the much higher volume of Chinese students that attend higher education institutions in the U.K. makes the growth in Chinese enrolments a much more significant phenomenon. Figure 2.3, on the next page, shows U.K. international student enrolment data for the top ten non‐EU countries.
7 “International Students in Australia ‐Top 10 sending places of origin and percentage of total international student
enrollment,” Project Atlas‐Australia, Institute of International Education. http://www.iie.org/en/Services/Project‐Atlas/Australia/International‐Students‐In‐Australia
Hanover Research | June 2014
© 2014 Hanover Research | Academy Administration Practice 16
Figure 2.3: International Student Enrolments, All Higher Education Programs, Top Ten Non‐EU Countries, U.K.
COUNTRY 2008/09 2009/10 2010/11 2011/12 2012/13 FIVE YEAR TOTAL
CAGR AAC STDEV
China 47,035 56,990 67,325 78,715 83,790 333,855 15.5% 9,188.8 2,432.6
India 34,065 38,500 39,090 29,900 22,385 163,940 ‐10.0% ‐2,920.0 5,631.2
Nigeria 14,380 16,680 17,585 17,620 17,395 83,660 4.9% 753.8 985.9
United States
14,345 15,060 15,555 16,335 16,235 77,530 3.1% 472.5 347.0
Malaysia 12,695 14,060 13,900 14,545 15,015 70,215 4.3% 580.0 543.2
Hong Kong 9,600 9,945 10,440 11,335 13,065 54,385 8.0% 866.3 537.7
Saudi Arabia 5,205 8,340 10,270 9,860 9,440 43,115 16.0% 1,058.8 1,534.1
Pakistan 9,610 9,815 10,185 8,820 7,185 45,615 ‐7.0% ‐606.3 900.7
Canada 5,350 5,575 5,905 6,115 6,190 29,135 3.7% 210.0 90.6
Thailand 4,675 5,505 5,945 6,235 6,180 28,540 7.2% 376.3 317.6
All other 94,355 100,290 101,915 103,205 103,100 502,865 2.2% 2,186.3 2,259.5
Total (all UK HEIs)
251,310 280,760 298,110 302,680 299,970 1,432,830 4.5% 12,165.0 12,294.4
Source: Higher Education Statistics Agency8
TRENDS IN CHINESE STUDENT DEMAND FOR OVERSEAS EDUCATION
Despite strong overall enrolment growth in recent years, some experts suggest that demand from Asian students for overseas programs of study may lessen within the next decade. According to a report from the Observatory on Borderless Higher Education (OBHE), the percentage of Asian students enrolled overseas is projected to decrease by 2020.9 The OBHE report notes that increases in the number of domestic higher education opportunities, “a sharp decrease in the side of the 18‐24 age cohort in key countries such as China,” and “growing outbound mobility ratios in Latin America and Africa” as factors that will contribute to the expected decrease in the percentage of international students from Asian countries.10 However, despite the projected decrease—part of an overall slow‐down in demand for international higher education—the OBHE report suggests that the international market for higher education “will not change significantly by 2020” with G20 countries continuing to dominate: “the main English‐speaking exporting countries along with Germany, France, and Japan will maintain their leading positions.”11 In China, the domestic higher education market is growing rapidly. The Chinese government “is using large subsidies to educate tens of millions of young people as they move from farms to cities,” dramatically increasing the number of domestic higher education
8 “Table 6‐Top ten non‐EU countries of domicile in 2012/13 for student enrolments on HE courses by location of HE
institution and country of domicile 2008/09 to 2012/13,” Statistical First Release 197, Higher Education Statistics Agency. http://www.hesa.ac.uk/content/view/1897/239/#non‐uk
9 Lawton, W. et. al. “Horizon Scanning: What Will Higher Education Look Like in 2020?” Observatory on Borderless Higher Education, September 2013, pp‐15‐17. http://www.obhe.ac.uk/documents/view_details?id=934
10 Ibid. 11 Ibid.
Hanover Research | June 2014
© 2014 Hanover Research | Academy Administration Practice 17
opportunities.12 In the last decade, China has quadrupled “its output of college graduates” and “now produces eight million graduates a year from universities and community colleges,” although questions persist about the quality of instruction at many higher education institutions in the country.13 The increasing number of university graduates in China has led to much greater competition in the labour market for positions that require a university degree. Some observers suggest that increasing number of graduates, in combination “with the Chinese economy downshifting in the past year to a slower growth rate, the country faces a glut of college graduates with high expectations and limited opportunities.”14 Already, “unemployment among recent graduates” has increased to 16 percent—four times the normal rate—and wage premiums for university graduates have decreased 19 percent.15 Moreover, a recent study indicates that, compared to the 94 million university graduates China is expected to produce by 2020, only 46 million positions that require a college degree will become available.16 According to the Hu Yifan of the Peterson Institute for International Economics,
The increasing difficulty for college graduates in the job market is caused by multiple factors, including distorted job expectations toward openings at the public sector and SOEs, structural labour mismatch across sectors and regions, and a larger mismatch between the national education system and labour demand.17
In particular, with regard to the larger mismatch, for the last decade “the excess of college‐educated workers has created a structural mismatch in the labour market leading to an oversupply of college graduates and a shortage of vocational and technical school graduates.”18 However, although it is clear that the supply of college graduates exceeds the domestic demand in China, the ramifications of this imbalance with regard to Chinese student demand for overseas higher education remains uncertain. This is especially true with respect to the fields of study and the academic levels of specific degree programs currently popular with Chinese students studying in Australia and the United States. In keeping with broader trends in international student demand—which, it should be noted, are heavily influenced by Chinese students studying overseas—by far the most popular field of study for Chinese students in Australia is business and management. More than 64,500 Chinese students, across all levels of tertiary study, enrolled in programs in business and
12 Bradsher, Keith. “Next Made‐in‐China Boom: College Graduates,” The New York Times, January, 16, 2013.
http://www.nytimes.com/2013/01/17/business/chinas‐ambitious‐goal‐for‐boom‐in‐college‐graduates.html?pagewanted=1
13 Ibid 14 Ibid. 15 Huang, Yukon and Canyon Bosler. “China’s Dangerous Graduate Glut” Bloomberg View, May 13, 2014.
http://www.bloombergview.com/articles/2014‐05‐13/china‐s‐dangerous‐graduate‐glut 16 Song, Sophie. “Future Of Chinese College Graduates Is Bleak: More Than Half Will Have To Take Blue‐Collar Jobs By
2020,” International Business Times, June, 10, 2013. http://www.ibtimes.com/future‐chinese‐college‐graduates‐bleak‐more‐half‐will‐have‐take‐blue‐collar‐jobs‐2020‐1298875
17 Hu, Yifan. “Oversupply of College Graduates? Structural Mismatch!,” China Economic Watch, Peterson Institute for International Economics, July 10, 2013. http://blogs.piie.com/china/?p=2876
18 Ibid.

Hanover Research | June 2014
© 2014 Hanover Research | Academy Administration Practice 18
management in 2011, or 66 percent of all enrolments by Chinese students. As Figure 2.4 demonstrates, engineering was the next most popular field of study, but enrolments in the field accounted for only 7.8 percent of all enrolments by Chinese students in Australia.
Figure 2.4: Chinese Student Enrolments at Australian Institutions, by Broad Field of Study, 2011
FIELD 2011
Business and Management 64,569
Engineering 7,581
Mathematics and Computer Sciences 5,378
Social Sciences 4,841
Fine and Applied Arts 4,642
Health Professions 3,469
Other/Unspecified Subject Areas 2,906
Physical and Life Sciences 2,156
Education 1,120
Agriculture 761
Total 97,423Source: Institute of International Education, Australia Education International19 *Note that 2011 is the only year for which data are available.
As is more broadly true of the international student enrolments at Australian institutions, Chinese students participate in higher education in greater numbers at the undergraduate, degree‐seeking level than at the graduate level. As shown in Figure 2.5, 51.7 percent of Chinese students in Australia in 2011 were enrolled at the undergraduate, degree‐seeking level, as opposed to 33 percent enrolled at the graduate, degree‐seeking level.
Figure 2.5: Chinese Student Enrolments at Australian Institutions, by Level of Study, 2011
LEVEL 2011
Undergraduate Degree‐seeking International Students
50,410
Undergraduate Non‐degree‐seeking International Students
12,825
Graduate Degree‐seeking International Students
32,173
Graduate Non‐degree‐seeking International Students
2,015
Total 97,423Source: Institute of International Education, Australia Education International20 *Note that 2011 is the only year for which data are available.
19 “International Students in Australia‐Field of study information for the top 10 places of origin,” Project Atlas‐
Australia, Institute of International Education. http://www.iie.org/en/Services/Project‐Atlas/Australia/International‐Students‐In‐Australia
20 Ibid.
Hanover Research | June 2014
© 2014 Hanover Research | Academy Administration Practice 19
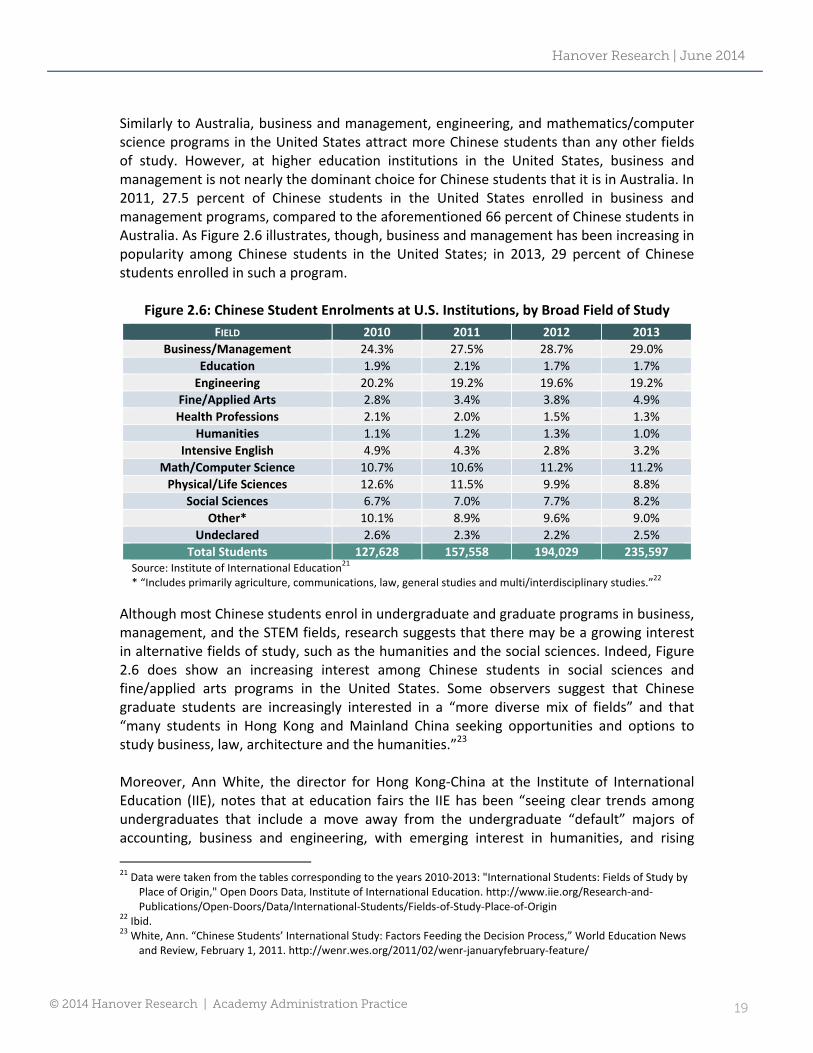
Similarly to Australia, business and management, engineering, and mathematics/computer science programs in the United States attract more Chinese students than any other fields of study. However, at higher education institutions in the United States, business and management is not nearly the dominant choice for Chinese students that it is in Australia. In 2011, 27.5 percent of Chinese students in the United States enrolled in business and management programs, compared to the aforementioned 66 percent of Chinese students in Australia. As Figure 2.6 illustrates, though, business and management has been increasing in popularity among Chinese students in the United States; in 2013, 29 percent of Chinese students enrolled in such a program.
Figure 2.6: Chinese Student Enrolments at U.S. Institutions, by Broad Field of Study
FIELD 2010 2011 2012 2013
Business/Management 24.3% 27.5% 28.7% 29.0%
Education 1.9% 2.1% 1.7% 1.7%
Engineering 20.2% 19.2% 19.6% 19.2%
Fine/Applied Arts 2.8% 3.4% 3.8% 4.9%
Health Professions 2.1% 2.0% 1.5% 1.3%
Humanities 1.1% 1.2% 1.3% 1.0%
Intensive English 4.9% 4.3% 2.8% 3.2%
Math/Computer Science 10.7% 10.6% 11.2% 11.2%
Physical/Life Sciences 12.6% 11.5% 9.9% 8.8%
Social Sciences 6.7% 7.0% 7.7% 8.2%
Other* 10.1% 8.9% 9.6% 9.0%
Undeclared 2.6% 2.3% 2.2% 2.5%
Total Students 127,628 157,558 194,029 235,597Source: Institute of International Education21 * “Includes primarily agriculture, communications, law, general studies and multi/interdisciplinary studies.”22
Although most Chinese students enrol in undergraduate and graduate programs in business, management, and the STEM fields, research suggests that there may be a growing interest in alternative fields of study, such as the humanities and the social sciences. Indeed, Figure 2.6 does show an increasing interest among Chinese students in social sciences and fine/applied arts programs in the United States. Some observers suggest that Chinese graduate students are increasingly interested in a “more diverse mix of fields” and that “many students in Hong Kong and Mainland China seeking opportunities and options to study business, law, architecture and the humanities.”23 Moreover, Ann White, the director for Hong Kong‐China at the Institute of International Education (IIE), notes that at education fairs the IIE has been “seeing clear trends among undergraduates that include a move away from the undergraduate “default” majors of accounting, business and engineering, with emerging interest in humanities, and rising
21 Data were taken from the tables corresponding to the years 2010‐2013: "International Students: Fields of Study by
Place of Origin," Open Doors Data, Institute of International Education. http://www.iie.org/Research‐and‐Publications/Open‐Doors/Data/International‐Students/Fields‐of‐Study‐Place‐of‐Origin
22 Ibid. 23 White, Ann. “Chinese Students’ International Study: Factors Feeding the Decision Process,” World Education News
and Review, February 1, 2011. http://wenr.wes.org/2011/02/wenr‐januaryfebruary‐feature/
Hanover Research | June 2014
© 2014 Hanover Research | Academy Administration Practice 20
awareness of community colleges as pathways.”24 White suggests that “Chinese students, and their very influential parents, are becoming more confident that they no longer need purely ‘vocational’ study paths,” such as business or engineering, and that “students from China are becoming comfortable with the humanities at the undergraduate and graduate levels.”25 According to the British Council’s Education Intelligence Unit, there have been notable shifts in the patterns of Chinese student demand. Although Chinese students are “still most likely to study business administration and engineering and technology at overseas universities,” growth in these areas has slowed.26 At the same time, there has been stronger growth in the number of “students from China wanting to study mass communication and documentation, and creative arts and design.”27 A 2011 report indicated that28
Students from China saying they want to study mass communication has risen by 81% since 2008 (“the third most popular choice for Chinese students wanting to study overseas, rising from 8th most popular in 2006‐07”);
Prospective Chinese students wanting to study creative arts has risen by 54% during the same period; and
Architecture, building and planning has seen 35% growth in interest from China in the last two years.
24 Ibid. 25 Ibid. 26 Sharma, Yojan. “GLOBAL: What international students want to study,” University World News, March 20, 2011.
http://www.universityworldnews.com/article.php?story=20110318130504251 27 Ibid. 28 Bullet points quoted from: Ibid.
Hanover Research | June 2014
© 2014 Hanover Research | Academy Administration Practice 21
PROJECT EVALUATION FORM Hanover Research is committed to providing a work product that meets or exceeds partner expectations. In keeping with that goal, we would like to hear your opinions regarding our reports. Feedback is critically important and serves as the strongest mechanism by which we tailor our research to your organization. When you have had a chance to evaluate this report, please take a moment to fill out the following questionnaire. http://www.hanoverresearch.com/evaluation/index.php
CAVEAT The publisher and authors have used their best efforts in preparing this brief. The publisher and authors make no representations or warranties with respect to the accuracy or completeness of the contents of this brief and specifically disclaim any implied warranties of fitness for a particular purpose. There are no warranties which extend beyond the descriptions contained in this paragraph. No warranty may be created or extended by representatives of Hanover Research or its marketing materials. The accuracy and completeness of the information provided herein and the opinions stated herein are not guaranteed or warranted to produce any particular results, and the advice and strategies contained herein may not be suitable for every partner. Neither the publisher nor the authors shall be liable for any loss of profit or any other commercial damages, including but not limited to special, incidental, consequential, or other damages. Moreover, Hanover Research is not engaged in rendering legal, accounting, or other professional services. Partners requiring such services are advised to consult an appropriate professional.

Hanover Research | June 2014
© 2014 Hanover Research | Academy Administration Practice 22
1700 K Street, NW, 8th Floor
Washington, DC 20006
P 202.559.0500 F 866.808.6585
www.hanoverresearch.com
Related Documents