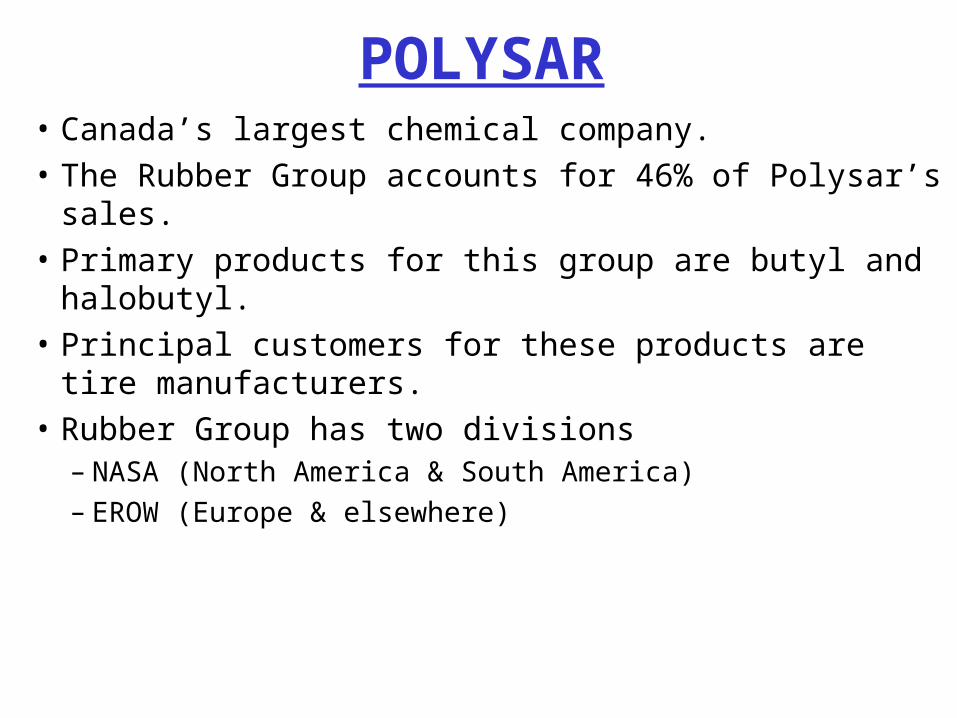
POLYSAR • Canada’s largest chemical company. • The Rubber Group accounts for 46% of Polysar’s sales. • Primary products for this group are butyl and halobutyl. • Principal customers for these products are tire manufacturers. • Rubber Group has two divisions – NASA (North America & South America) – EROW (Europe & elsewhere)

Polysar Case Analysis
Oct 15, 2014
Welcome message from author
This document is posted to help you gain knowledge. Please leave a comment to let me know what you think about it! Share it to your friends and learn new things together.
Transcript
POLYSAR• Canada’s largest chemical company.• The Rubber Group accounts for 46% of Polysar’s
sales.• Primary products for this group are butyl and
halobutyl.• Principal customers for these products are tire
manufacturers.• Rubber Group has two divisions
– NASA (North America & South America)– EROW (Europe & elsewhere)

POLYSAR• Butyl is manufactured by NASA at its Sarnia
2 plant, and by EROW at its Antwerp plant.• Sarnia 2 is a relatively new facility,
dedicated entirely to butyl production.• The Antwerp plant makes both butyl and
halobutyl.• EROW’s demand exceeds its manufacturing
capacity, so EROW “buys” butyl from NASA.

POLYSAR
S A R N IA 1 P L A N TH alob u tyl
S A R N IA 2 P L A N TB u tyl
N A S A
A N TW E R P P L A N TB u tyl & H a lob u tyl
E R O W
R U B B E R G R O U P
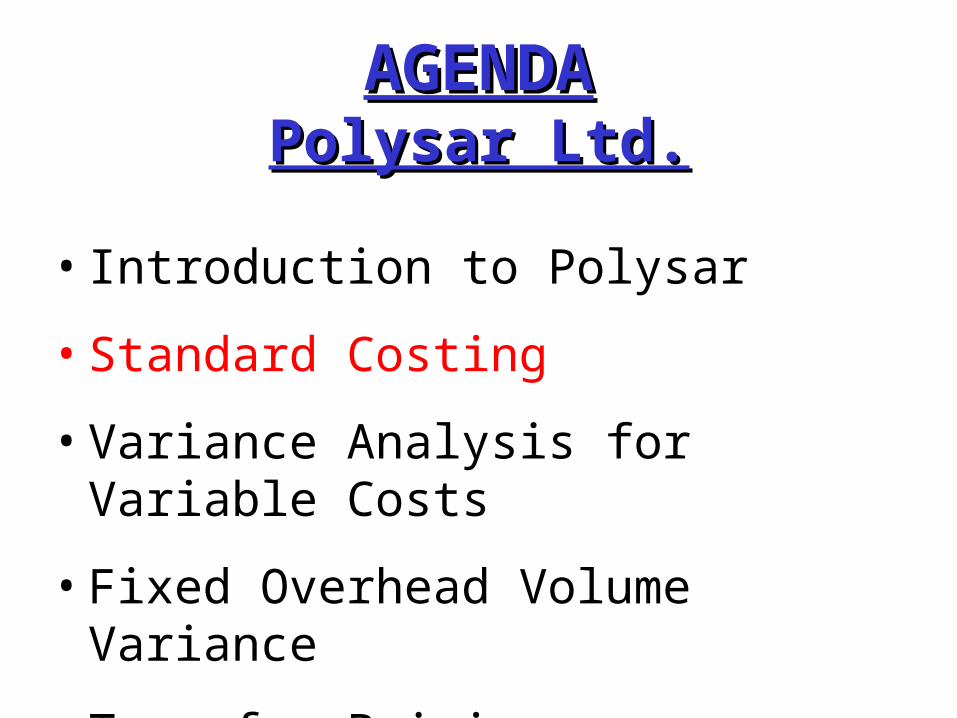
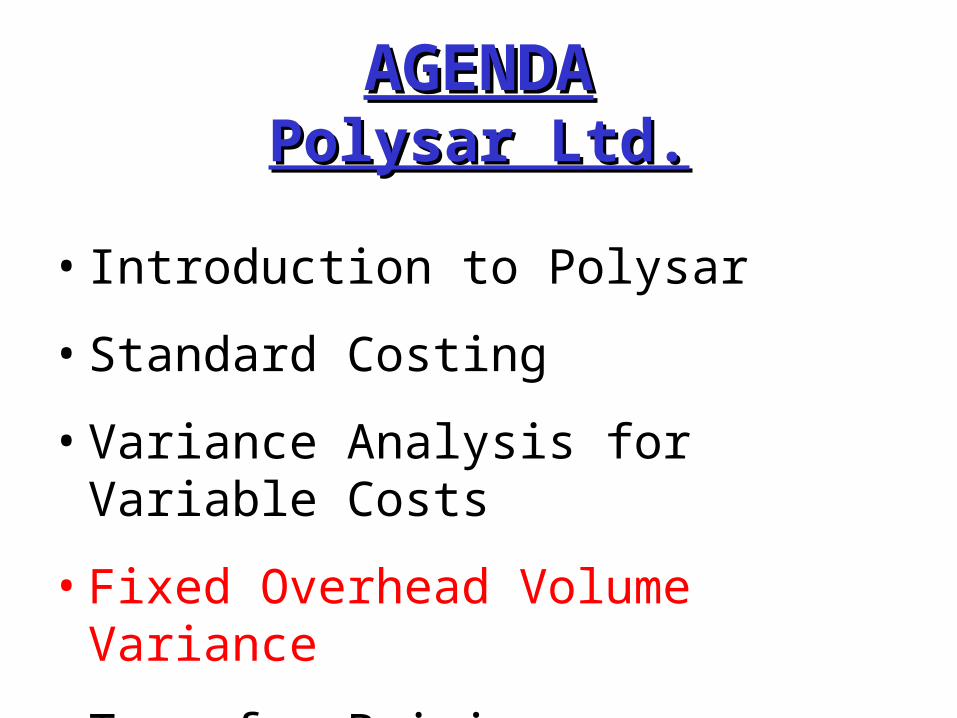
AGENDAAGENDAPolysar Ltd.Polysar Ltd.
• Introduction to Polysar
• Standard Costing
• Variance Analysis for Variable Costs
• Fixed Overhead Volume Variance
• Transfer Pricing
POLYSAR1a) What evidence do we have that Polysar
is on a standard costing system?
1b) Interpret the amount $22,589 on Exhibit 2, for variable costs.
1c) Interpret the amount $21,450 on Exhibit 2, for variable costs.

POLYSAR
1d) Evaluate NASA’s performance relative to budget for sales price and volume.
1e) Evaluate NASA’s performance relative to budget for plant efficiency, raw materials prices, fixed manufacturing expenses, and non-manufacturing expenses.
POLYSAR
1a) What evidence do we have that Polysar is on a standard costing system?

Product Costing and Transfer Prices –
Butyl rubbers were costed using standard rates for variable and fixed costs.
Variable costs included feedstocks, chemicals, and energy. Standard variable cost per ton of butyl was calculated by multiplying the standard utilization factor (i.e., the standard quantity of inputs used) by a standard price established for each unit of input. Since feedstock prices varied with worldwide market conditions and represented the largest component of costs, it was impossible to establish standard input prices that remained valid for extended periods. Therefore, the company reset standard costs each month to a price that reflected market prices. Chemical and energy standard costs were established annually.

POLYSAR1b) Interpret the amount $22,589 on
Exhibit 2, for variable costs.

Exhibit 2NASA RUBBER DIVISION
Regular Butyl RubberStatement of Net Contribution
September 1986
9 Months ended Sept. 30, 1986
Actual(‘000's)
Budget(‘000's)
Deviation(‘000's)
Sales Revenue - Third Party - Diversified Product Group - TotalDelivery CostNet Sales Revenue
Variable Costs Standard Cost Adjustments Efficiency Variance Total
Gross Margin - $
Fixed Costs Standard Cost Adjustments Spending Variance Volume Variance TotalGross Profit - $
Period Costs Administration, Selling, Distribution Technical Service Other Income/Expense Total
Business ContributionInterest on Working CapitalNet Contribution
65,872160
66,032- 2,79363,239
-22,58954
241-22,294
40,945
-25,060168498
-11,375-35,769
5,176
- 4,163- 222
208- 4,177
999-1,875- 876
61,050210
61,260- 2,60058,660
-21,450- -
-21,450
37,210
-23,10080-
- 6,125-29,145
8,065
- 4,000- 210
50- 4,160
3,905-1,9002,005
4,822- 504,722
- 1934,579
- 1,13954
241- 844
3,735
-1,96088
498-5,250-6,624-2,889
- 163- 12
158- 17
-2,90625
- 2,881
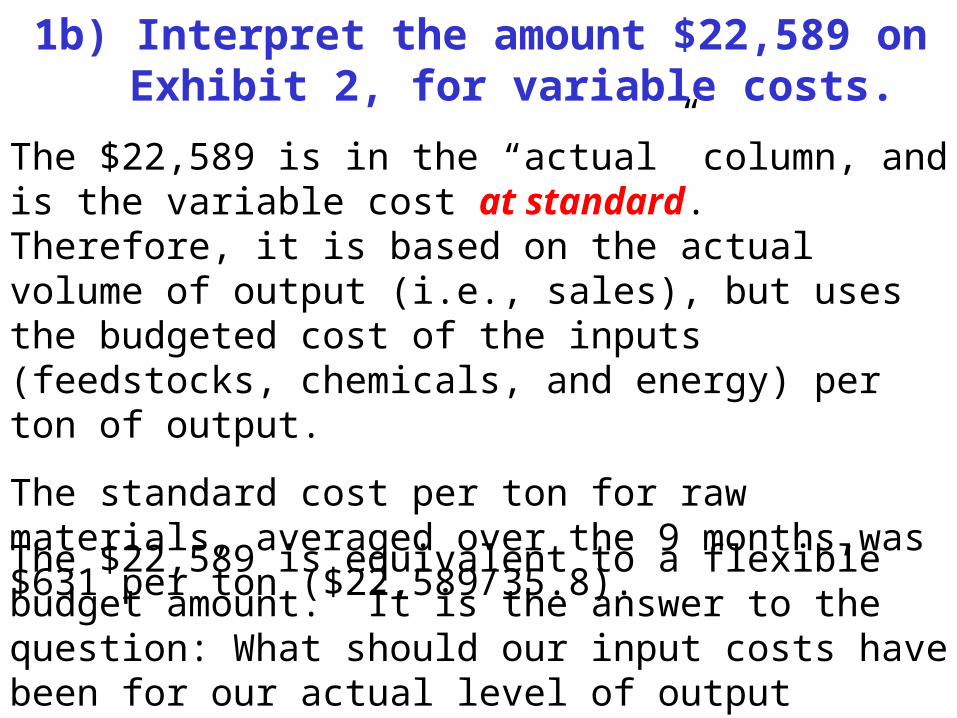
1b) Interpret the amount $22,589 on Exhibit 2, for variable costs.
The $22,589 is in the “actual” column, and is the variable cost at standard. Therefore, it is based on the actual volume of output (i.e., sales), but uses the budgeted cost of the inputs (feedstocks, chemicals, and energy) per ton of output.
The standard cost per ton for raw materials, averaged over the 9 months,was $631 per ton ($22,589/35.8).
The $22,589 is equivalent to a flexible budget amount. It is the answer to the question: What should our input costs have been for our actual level of output (sales)?

POLYSAR1c) Interpret the amount $21,450 on
Exhibit 2, for variable costs.

Exhibit 2NASA RUBBER DIVISION
Regular Butyl RubberStatement of Net Contribution
September 1986
9 Months ended Sept. 30, 1986
Actual(‘000's)
Budget(‘000's)
Deviation(‘000's)
Sales Revenue - Third Party - Diversified Product Group - TotalDelivery CostNet Sales Revenue
Variable Costs Standard Cost Adjustments Efficiency Variance Total
Gross Margin - $
Fixed Costs Standard Cost Adjustments Spending Variance Volume Variance TotalGross Profit - $
Period Costs Administration, Selling, Distribution Technical Service Other Income/Expense Total
Business ContributionInterest on Working CapitalNet Contribution
65,872160
66,032- 2,79363,239
-22,58954
241-22,294
40,945
-25,060168498
-11,375-35,769
5,176
- 4,163- 222
208- 4,177
999-1,875- 876
61,050210
61,260- 2,60058,660
-21,450- -
-21,450
37,210
-23,10080-
- 6,125-29,145
8,065
- 4,000- 210
50- 4,160
3,905-1,9002,005
4,822- 504,722
- 1934,579
- 1,13954
241- 844
3,735
-1,96088
498-5,250-6,624-2,889
- 163- 12
158- 17
-2,90625
- 2,881

1c) Interpret the amount $21,450 on Exhibit 2, for variable costs.
This is the static budget number for variable costs (feedstocks, chemicals, energy). Since it is the static budget, it is based on the original, projected level of sales. From Exhibit 1, the projected level of sales was 33,000 tons.
Hence, the standard cost per ton for variable costs, as of the beginning of the year, was $650 per ton ($21,450/33).

How can the standard cost per ton for variable costs differ from the beginning of the year to the end of the year?
I.e.: $650 per ton vs. $631 per ton.
POLYSAR

POLYSARProduct Costing and transfer Prices –
Butyl rubbers were costed using standard rates for variable and fixed costs.
Variable costs included feedstocks, chemicals, and energy. Standard variable cost per ton of butyl was calculated by multiplying the standard utilization factor (i.e., the standard quantity of inputs used) by a standard price established for each unit of input. Since feedstock prices varied with worldwide market conditions and represented the largest component of costs, it was impossible to establish standard input prices that remained valid for extended periods. Therefore, the company reset standard costs each month to a price that reflected market prices. Chemical and energy standard costs were established annually.

AGENDAAGENDAPolysar Ltd.Polysar Ltd.
• Introduction to Polysar
• Standard Costing
• Variance Analysis for Variable Costs
• Fixed Overhead Volume Variance
• Transfer Pricing

POLYSAR1d) Evaluate NASA’s performance
relative to budget for sales price and volume.

Exhibit 2NASA RUBBER DIVISION
Regular Butyl RubberStatement of Net Contribution
September 1986
9 Months ended Sept. 30, 1986
Actual(‘000's)
Budget(‘000's)
Deviation(‘000's)
Sales Revenue - Third Party - Diversified Product Group - TotalDelivery CostNet Sales Revenue
Variable Costs Standard Cost Adjustments Efficiency Variance Total
Gross Margin - $
Fixed Costs Standard Cost Adjustments Spending Variance Volume Variance TotalGross Profit - $
Period Costs Administration, Selling, Distribution Technical Service Other Income/Expense Total
Business ContributionInterest on Working CapitalNet Contribution
65,872160
66,032- 2,79363,239
-22,58954
241-22,294
40,945
-25,060168498
-11,375-35,769
5,176
- 4,163- 222
208- 4,177
999-1,875- 876
61,050210
61,260- 2,60058,660
-21,450- -
-21,450
37,210
-23,10080-
- 6,125-29,145
8,065
- 4,000- 210
50- 4,160
3,905-1,9002,005
4,822- 504,722
- 1934,579
- 1,13954
241- 844
3,735
-1,96088
498-5,250-6,624-2,889
- 163- 12
158- 17
-2,90625
- 2,881

Exhibit 1
NASA RUBBER DIVISIONRegular Butyl RubberStatistics and Analyses
September 1986
9 Months ended September 30, 1986
Volume - Tonnes Actual(‘000's)
Budget(‘000's)
Deviation(‘000's)
Sales
Production
Transfers to EROW from EROW
35.8
47.5
12.22.1
33.0
55.0
19.51.0
2.8
-7.5
-7.31.1
Production Costs ($ ‘000's) ($ ‘000's) ($ ‘000's)
Fixed Cost - Direct - Allocated Cash - Allocated Non-CashFixed Cost to Production
Transfers to/from FG InventoryTransfers to EROWTransfers from EROW
Fixed Cost of Sales
-21,466- 7,036-15,625-44,127
1,1208,540
-1,302
-35,769
-21,900- 7,125-15,600-44,625
2,45013,650
-620
-29,145
43489
- 25498
-1,330-5,110- 682
-6,624
Note: as indicated on p. 1 of the case, financial data have been disguisedand do not represent the true financial results of the company.
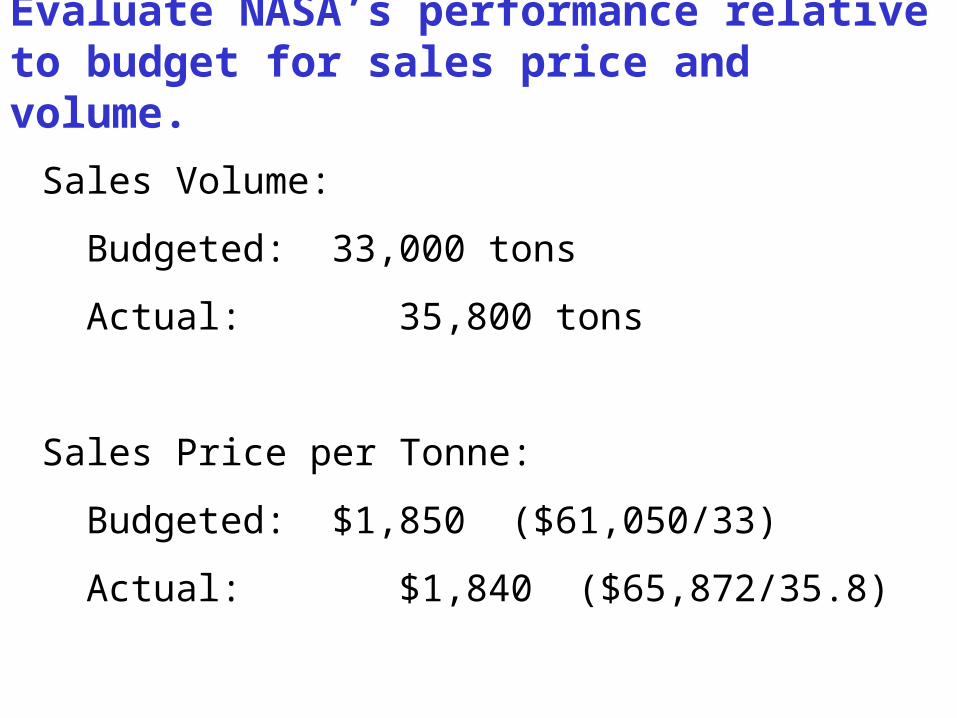
Evaluate NASA’s performance relative to budget for sales price and volume.
Sales Volume:
Budgeted: 33,000 tons
Actual: 35,800 tons
Sales Price per Tonne:
Budgeted: $1,850 ($61,050/33)
Actual: $1,840 ($65,872/35.8)

POLYSAR1e) Evaluate NASA’s performance
relative to budget for plant efficiency, raw materials prices, fixed manufacturing expenses, and non-manufacturing expenses.

Exhibit 2NASA RUBBER DIVISION
Regular Butyl RubberStatement of Net Contribution
September 1986
9 Months ended Sept. 30, 1986
Actual(‘000's)
Budget(‘000's)
Deviation(‘000's)
Sales Revenue - Third Party - Diversified Product Group - TotalDelivery CostNet Sales Revenue
Variable Costs Standard Cost Adjustments Efficiency Variance Total
Gross Margin - $
Fixed Costs Standard Cost Adjustments Spending Variance Volume Variance TotalGross Profit - $
Period Costs Administration, Selling, Distribution Technical Service Other Income/Expense Total
Business ContributionInterest on Working CapitalNet Contribution
65,872160
66,032- 2,79363,239
-22,58954
241-22,294
40,945
-25,060168498
-11,375-35,769
5,176
- 4,163- 222
208- 4,177
999-1,875- 876
61,050210
61,260- 2,60058,660
-21,450- -
-21,450
37,210
-23,10080-
- 6,125-29,145
8,065
- 4,000- 210
50- 4,160
3,905-1,9002,005
4,822- 504,722
- 1934,579
- 1,13954
241- 844
3,735
-1,96088
498-5,250-6,624-2,889
- 163- 12
158- 17
-2,90625
- 2,881
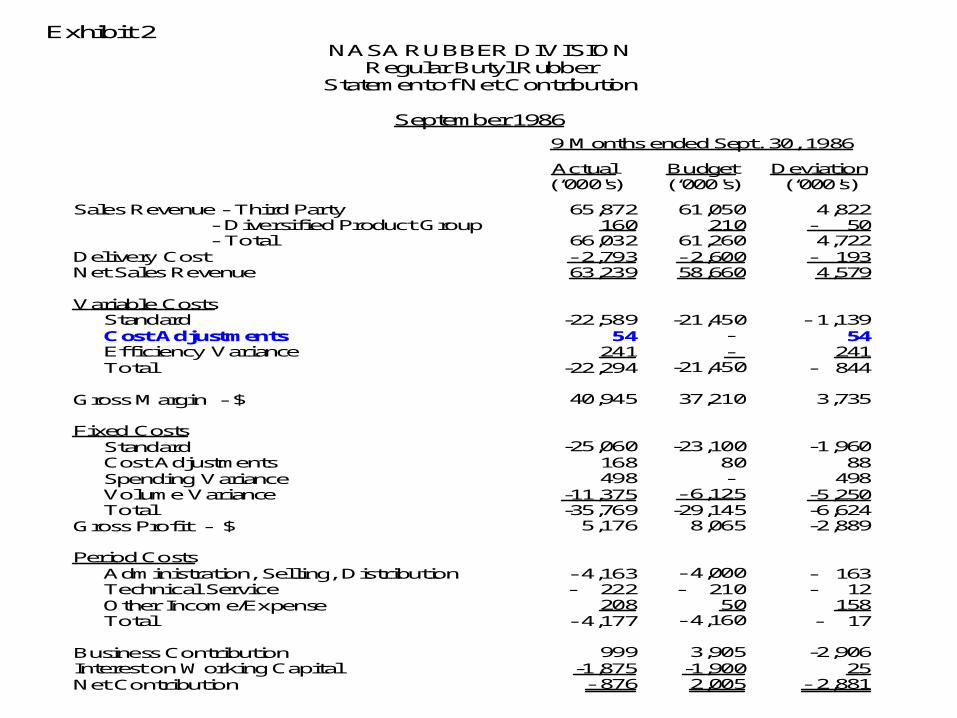

Price and Efficiency Variances for Feedstocks, Chemicals and Energy
S.P.
A.P.
A.Q.* S.Q.*
$22,294KACTUAL COST
$241KFAV.
$54K FAVORABLE“COST ADJUSTMENT”
EFF
ICIE
NC
Y V
AR
IAN
CE
*For actual output
The outer box represents the flexible budget amount of $22,589.
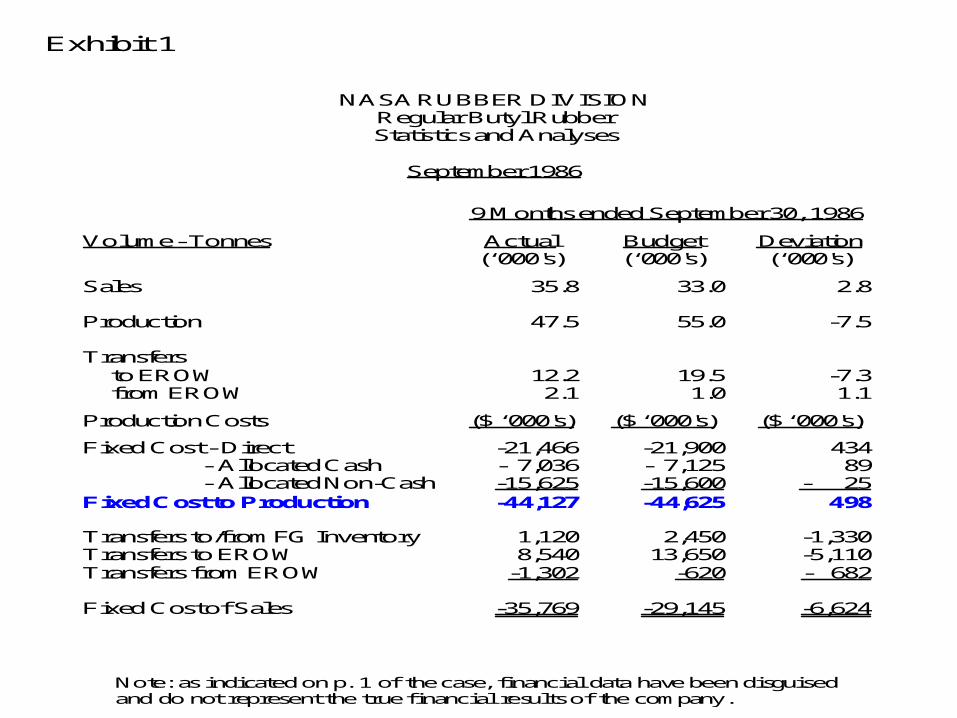
Exhibit 1
NASA RUBBER DIVISIONRegular Butyl RubberStatistics and Analyses
September 1986
9 Months ended September 30, 1986
Volume - Tonnes Actual(‘000's)
Budget(‘000's)
Deviation(‘000's)
Sales
Production
Transfers to EROW from EROW
35.8
47.5
12.22.1
33.0
55.0
19.51.0
2.8
-7.5
-7.31.1
Production Costs ($ ‘000's) ($ ‘000's) ($ ‘000's)
Fixed Cost - Direct - Allocated Cash - Allocated Non-CashFixed Cost to Production
Transfers to/from FG InventoryTransfers to EROWTransfers from EROW
Fixed Cost of Sales
-21,466- 7,036-15,625-44,127
1,1208,540
-1,302
-35,769
-21,900- 7,125-15,600-44,625
2,45013,650
-620
-29,145
43489
- 25498
-1,330-5,110- 682
-6,624
Note: as indicated on p. 1 of the case, financial data have been disguisedand do not represent the true financial results of the company.

Exhibit 2NASA RUBBER DIVISION
Regular Butyl RubberStatement of Net Contribution
September 1986
9 Months ended Sept. 30, 1986
Actual(‘000's)
Budget(‘000's)
Deviation(‘000's)
Sales Revenue - Third Party - Diversified Product Group - TotalDelivery CostNet Sales Revenue
Variable Costs Standard Cost Adjustments Efficiency Variance Total
Gross Margin - $
Fixed Costs Standard Cost Adjustments Spending Variance Volume Variance TotalGross Profit - $
Period Costs Administration, Selling, Distribution Technical Service Other Income/Expense Total
Business ContributionInterest on Working CapitalNet Contribution
65,872160
66,032- 2,79363,239
-22,58954
241-22,294
40,945
-25,060168498
-11,375-35,769
5,176
- 4,163- 222
208- 4,177
999-1,875- 876
61,050210
61,260- 2,60058,660
-21,450- -
-21,450
37,210
-23,10080-
- 6,125-29,145
8,065
- 4,000- 210
50- 4,160
3,905-1,9002,005
4,822- 504,722
- 1934,579
- 1,13954
241- 844
3,735
-1,96088
498-5,250-6,624-2,889
- 163- 12
158- 17
-2,90625
- 2,881

POLYSAR• Sales price per ton is slightly below budget.• Sales volume is almost 10% above budget.• The efficiency variance for variable costs is very small.• The price variance for variable costs is very small, due
in part to the fact that standards are revised monthly.• Fixed manufacturing expenses are within 2% of
budget.• Non-manufacturing expenses are within 1% of budget.

POLYSAR• Why do 80% of manufacturing companies use Standard
Costing Systems?
• Survey data shows that the most important reason is to help control costs.
• How does a standard costing system help Polysar control costs?
• In a standard costing system, all variances flow through the accounting system, and appear on the monthly income statements.

Exhibit 2NASA RUBBER DIVISION
Regular Butyl RubberStatement of Net Contribution
September 1986
9 Months ended Sept. 30, 1986
Actual(‘000's)
Budget(‘000's)
Deviation(‘000's)
Sales Revenue - Third Party - Diversified Product Group - TotalDelivery CostNet Sales Revenue
Variable Costs Standard Cost Adjustments Efficiency Variance Total
Gross Margin - $
Fixed Costs Standard Cost Adjustments Spending Variance Volume Variance TotalGross Profit - $
Period Costs Administration, Selling, Distribution Technical Service Other Income/Expense Total
Business Contribution
65,872160
66,032- 2,79363,239
-22,58954
241-22,294
40,945
-25,060168498
-11,375-35,769
5,176
- 4,163- 222
208- 4,177
999
61,050210
61,260- 2,60058,660
-21,450- -
-21,450
37,210
-23,10080-
- 6,125-29,145
8,065
- 4,000- 210
50- 4,160
3,905
4,822- 504,722
- 1934,579
- 1,13954
241- 844
3,735
-1,96088
498-5,250-6,624-2,889
- 163- 12
158- 17
-2,906
AGENDAAGENDAPolysar Ltd.Polysar Ltd.
• Introduction to Polysar
• Standard Costing
• Variance Analysis for Variable Costs
• Fixed Overhead Volume Variance
• Transfer Pricing
POLYSAR
2. Calculate NASA’s rate for allocating manufacturing overhead costs to Butyl.

POLYSAR
Fixed Manufacturing Overhead
Demonstrated Capacity
=
$44,625K .
85,000 tons per year x 9/12
=
$700 per ton

POLYSAR3. Use the rate calculated above to show
that the following amounts have been calculated correctly:
– Fixed Costs of Sales on Exhibit 2
– Transfers to Finished Goods Inventory on Exhibit 1
– Transfers to EROW on Exhibit 1
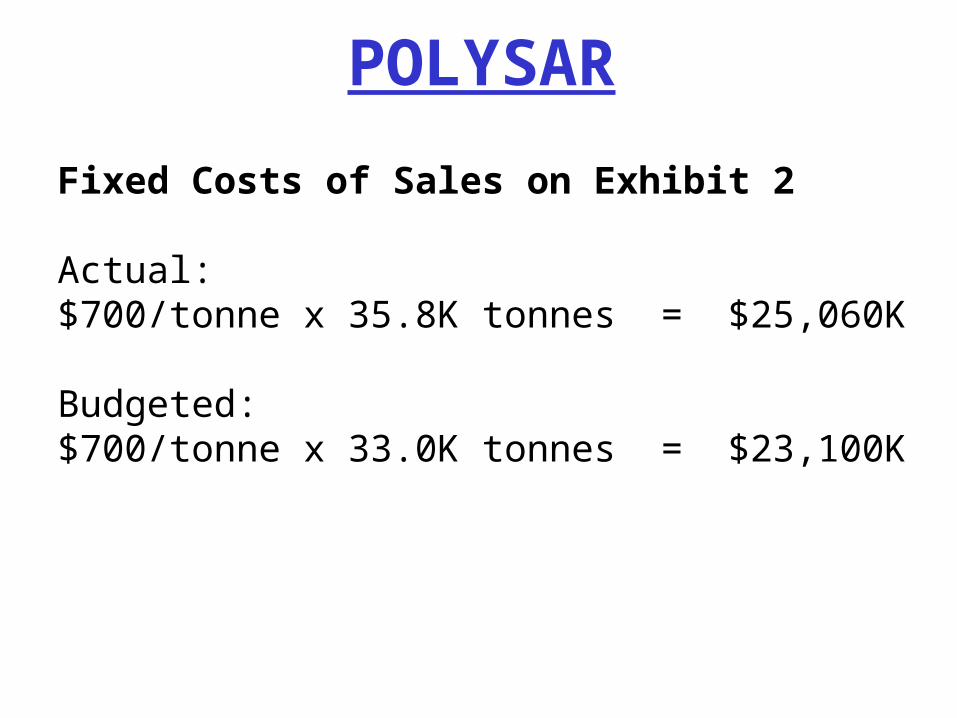
POLYSAR
Fixed Costs of Sales on Exhibit 2
Actual:$700/tonne x 35.8K tonnes = $25,060K
Budgeted:$700/tonne x 33.0K tonnes = $23,100K

POLYSAR
Transfers to Finished Goods Inventory on Exhibit 1
Actual:$700 x (47.5 + 2.1 - 35.8 - 12.2) = $700 x 1.6K tonnes = $1,120K
Budgeted:$700 x (55 + 1 - 33 - 19.5) = $700 x 3.5K = $2,450K

POLYSARTransfers to EROW on Exhibit 1
Actual:$700/tonne x 12.2K tonnes = $8,540K
Budget:$700/tonne x 19.5K tonnes = $13,650K
POLYSAR
4. Does Polysar close out variances to Cost of Goods Sold, or allocate variances between Cost of Goods Sold and Inventory?

POLYSAR
In the previous question, we were able to recalculate the fixed cost component of butyl added to ending inventory, and butyl transferred to EROW, using the budgeted $700 per ton rate.
Therefore, no variances are included in these amounts, and all variances closed out to the income statement (Exhibit 2). These variances appear on the line items for “Cost Adjustments,” “Spending Variance,” and “Volume Variance.”

POLYSAR
5. Using the information on Exhibit 1, identify EROW’s rate for applying fixed manufacturing costs to Butyl.
What might explain the difference in the fixed overhead rates of the two divisions?

POLYSARFrom the Budgeted column on Exhibit 1, we know that NASA planned to take 1K tonnes of butyl from EROW, at a cost (i.e., fixed cost component) of $620K, or $620 per ton.
EROW’s fixed cost rate of $620 is lower than NASA’s rate of $700, probably because EROW’s facility is older. Note that the difference in rates cannot be due to differences in capacity utilization.

POLYSAR
6. What do the budgeted and actual volume variances of $6,125 and $11,375 represent?

POLYSARBudget
Capacity for 9 mo.s of 63,750 tons
Budgeted production of 55,000
(63,750 - 55,000) x $700 = $6,125K
Actual
Capacity for 9 months of 63,750 tons
Actual production of 47,500
(63,750 - 47,500) x $700
= 16,250 x $700 = $11,375K

POLYSAR
7. Now assume NASA decided to use budgeted utilization in the
denominator for calculating the fixed cost rate. What would the rate be now? What would the actual and budgeted volume variances now be.
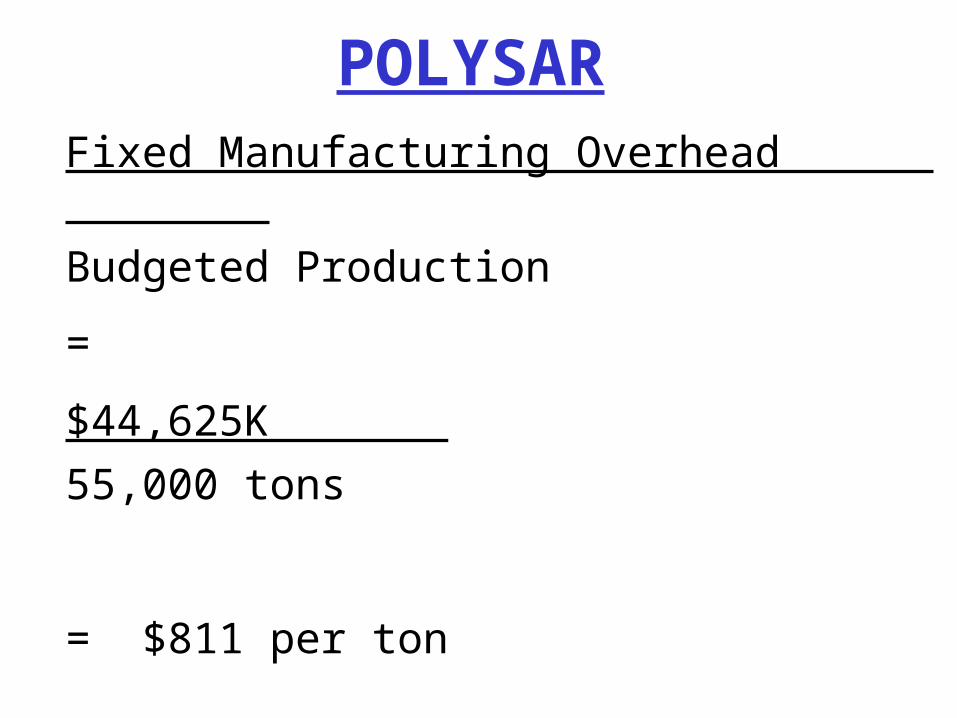
POLYSARFixed Manufacturing Overhead
Budgeted Production
=
$44,625K .
55,000 tons
= $811 per ton

POLYSAR
Using this $811 per ton rate:
There would be no budgeted volume variance, since
$811/ton x 55K tons = $44,625K
Actual volume variance would be
$811 x (55,000 - 47,500) = $6,085

AGENDAAGENDAPolysar Ltd.Polysar Ltd.
• Introduction to Polysar
• Standard Costing
• Variance Analysis for Variable Costs
• Fixed Overhead Volume Variance
• Transfer Pricing

POLYSAR8a) What type of transfer price does Polysar use?8b) What is the transfer price for butyl?8c) What is the effect on NASA when EROW takes less butyl
than planned, if NASA produces for actual demand?8d) What is the effect on NASA when EROW takes less butyl
than planned, if NASA produces for budgeted demand?8e) What is the best butyl sourcing strategy for Polysar?8f) What is the best butyl sourcing strategy for EROW?

POLYSAR8a. What type of transfer price does
Polysar use?

Transfer Pricing Options
•Market-Based Transfer Price
•Cost-Based Transfer Price
•Negotiated Transfer Price
•Dual Transfer Price
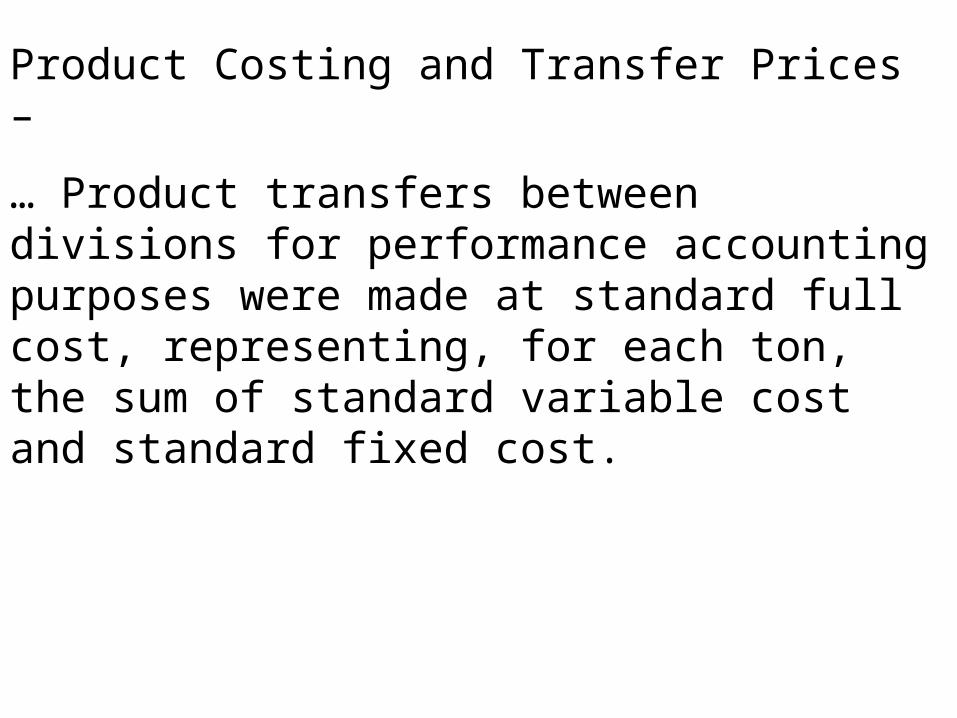
Product Costing and Transfer Prices –
… Product transfers between divisions for performance accounting purposes were made at standard full cost, representing, for each ton, the sum of standard variable cost and standard fixed cost.

POLYSAR
• Polysar uses a cost-based transfer price.
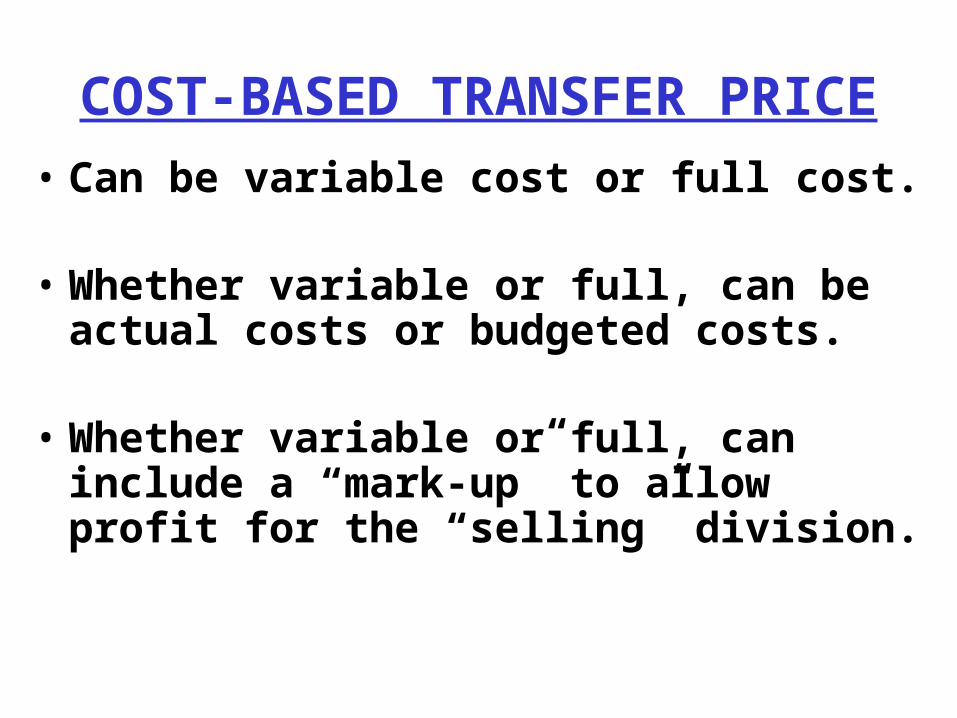
COST-BASED TRANSFER PRICE• Can be variable cost or full cost.
• Whether variable or full, can be actual costs or budgeted costs.
• Whether variable or full, can include a “mark-up” to allow profit for the “selling” division.
POLYSAR
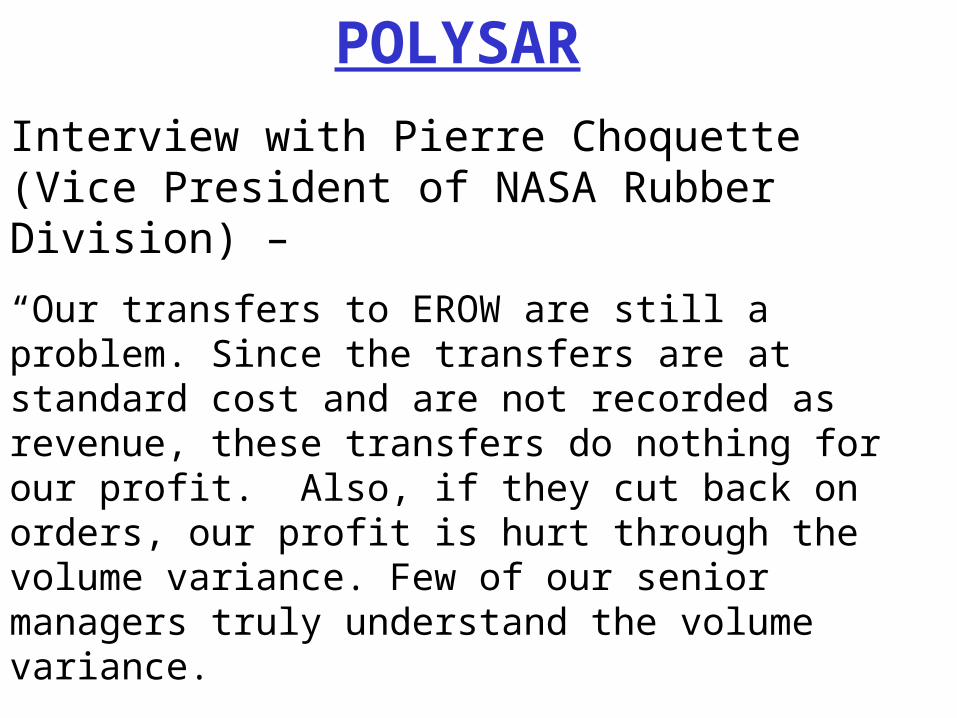
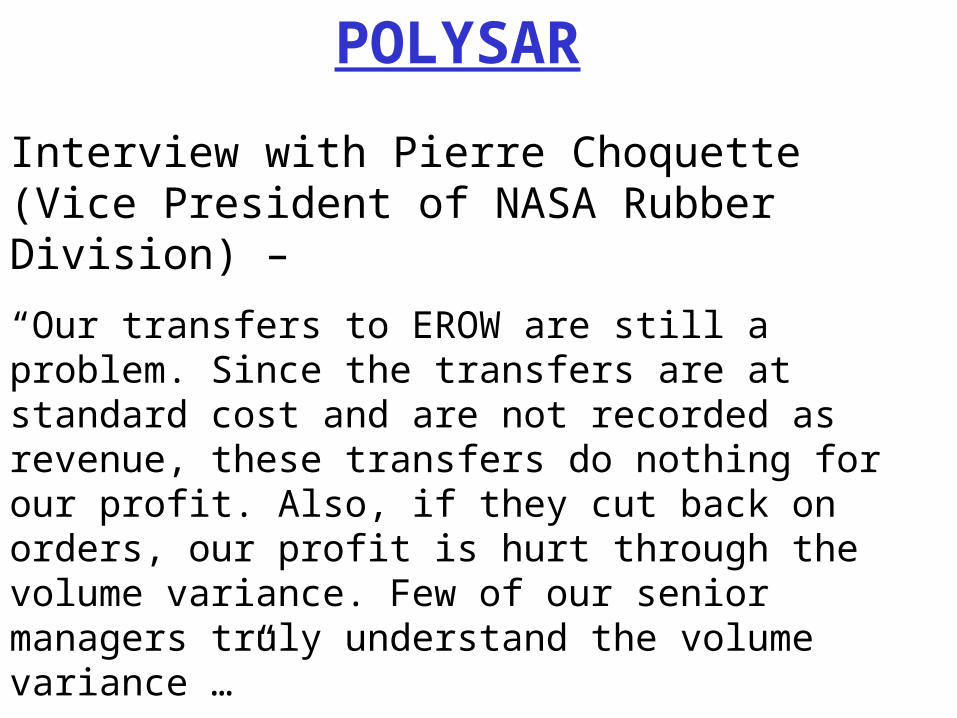
Interview with Pierre Choquette (Vice President of NASA Rubber Division) –
“Our transfers to EROW are still a problem. Since the transfers are at standard cost and are not recorded as revenue, these transfers do nothing for our profit. Also, if they cut back on orders, our profit is hurt through the volume variance. Few of our senior managers truly understand the volume variance.
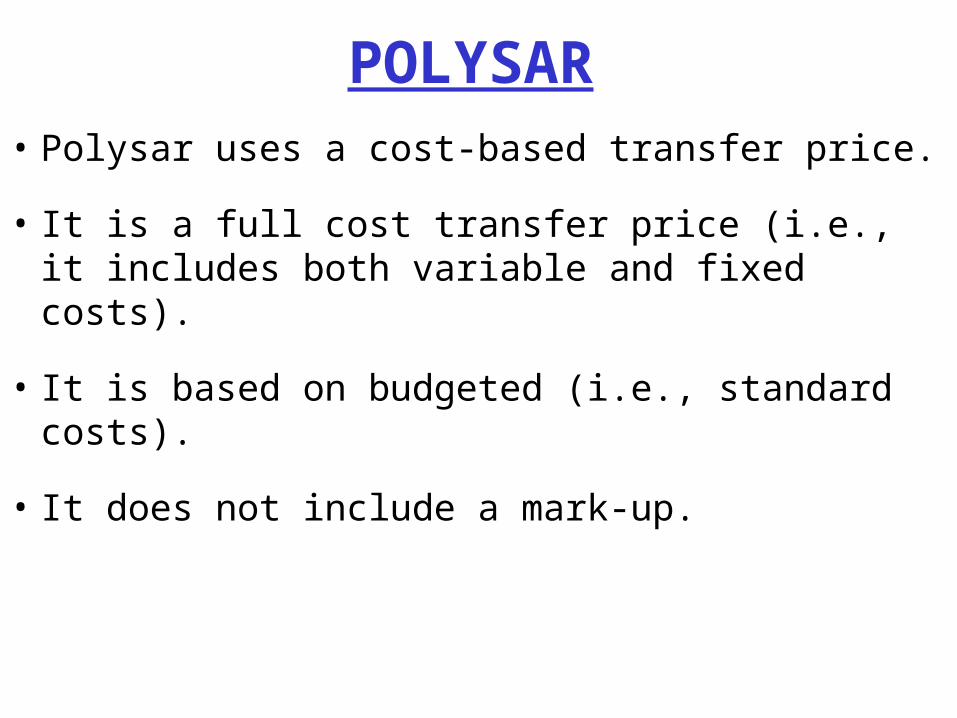
POLYSAR• Polysar uses a cost-based transfer price.
• It is a full cost transfer price (i.e., it includes both variable and fixed costs).
• It is based on budgeted (i.e., standard costs).
• It does not include a mark-up.

POLYSAR
8b. What is the transfer price for butyl?
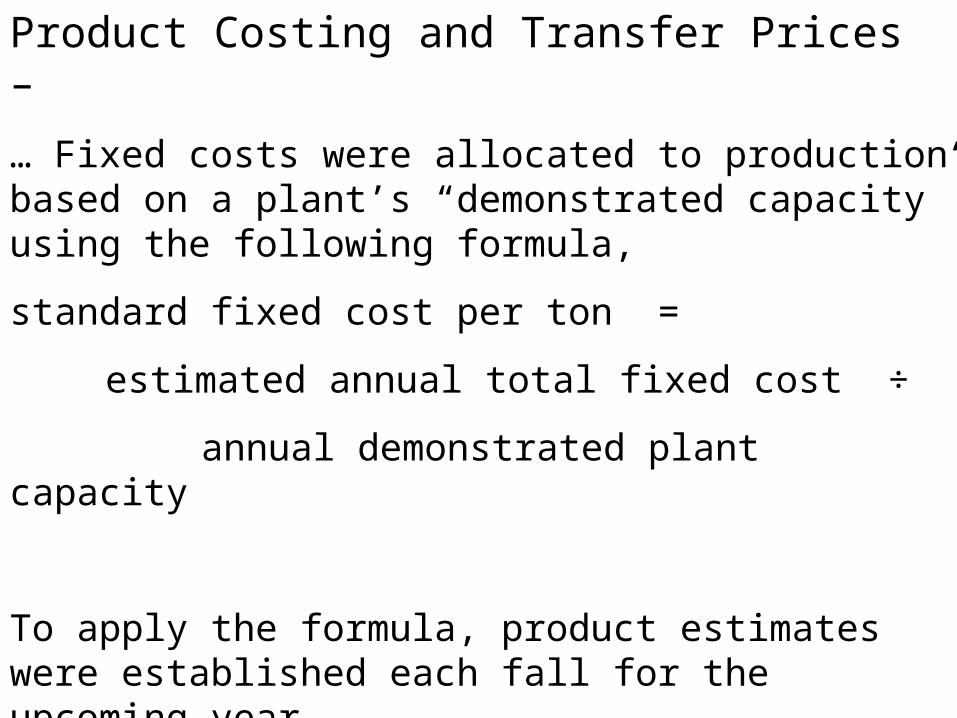
Product Costing and Transfer Prices –
… Fixed costs were allocated to production based on a plant’s “demonstrated capacity” using the following formula,
standard fixed cost per ton =
estimated annual total fixed cost ÷
annual demonstrated plant capacity
To apply the formula, product estimates were established each fall for the upcoming year.

Exhibit 5
POLYSAR LIMITED – CONTROLLER’S GUIDE
DEFINITIONS
Demonstrated capacity is the actual annualized production of a plant which wasrequired to run full out within the last fiscal year for a sufficiently long period toassess production capability after adjusting for abnormally low or high unscheduledshutdowns, scheduled shutdowns, and unusual or annualized items which impactedeither favourably or unfavourably on the period’s production. The resultingadjusted historical base should be further modified for changes planned to beimplemented within the current fiscal year.
a) Where a plant has not been required to run full out within the last fiscalyear, production data may be used for a past period afer adjusting forchanges (debottleneckings/inefficiencies) since that time affectingproduction.
b) Where a plant has never been required to run full out, demonstratedcapacity could be reasonably considered as “name plate” capacity afteradjusting for
i) known invalid assumptions in arriving at “name plate”ii) changes to original design affecting “name plate”iii) a reasonable negative allowance for error

CALCULATION OF TRANSFER PRICE FOR BUTYL
Total Fixed Costs were budgeted at $44,625K (from Exhibit 1).
Denominator is “demonstrated capacity.” This is 85,000 tons per year, or 63,750 tonnes for 9 months.
$44,625K/63,750 = $700 per ton

POLYSAR
8c. What is the effect on NASA when EROW takes less butyl than
planned, if NASA produces for actual demand?

POLYSAR Each ton of butyl transferred to EROW
has $700 in fixed costs attached to it. EROW covers $700 of NASA’s fixed costs with each ton “purchased” from NASA.
When EROW takes less butyl than planned, and NASA cuts back on production accordingly, NASA’s volume variance increases, and its net contribution (i.e., income) decreases, relative to plan.

POLYSAR
8d. What is the effect on NASA when EROW takes less butyl than
planned, if NASA produces for budgeted demand?

POLYSAR If NASA produces at budgeted demand, and EROW purchases
less butyl than planned, NASA will increase its ending inventory.
In this case, the fact that EROW takes less butyl than planned will have no effect on NASA’s net contribution. The $700 per ton in fixed costs that NASA thought would be covered by EROW, will now be capitalized in ending inventory.

POLYSAR
8c. What is the best butyl sourcing strategy for Polysar?

POLYSARPolysar should allocate production of butyl and halobutyl
to EROW and NASA to minimize total production and shipping costs, while still meeting customer demand.
In making this determination, fixed costs are irrelevant, since they are either sunk costs, or are unavoidable unless the plant is closed down.
Polysar should manufacture butyl as long as the sales price is more than the variable costs of production and distribution.

Product Costing and Transfer Prices –
… Fixed costs comprised three categories of cost. Direct costs included direct labor, maintenance, chemicals required to keep the plant bubbling, and fixed utilities. Allocated cash costs included plant management, purchasing department costs, engineering, planning, and accounting. Allocated non-cash costs represented primarily depreciation.

Exhibit 7EROW RUBBER DIVISION
Regular Butyl RubberCondensed Statement of Net Contribution
September 1986
9 Months Ended September 30, 1986
Sales Volume -- Tonnes
Sales RevenueDelivery CostNet Sales Revenue
Variable Costs Standard Purchase Price Variance Inventory Revaluation Efficiency Variance Total
Gross Margin - $
Fixed Cost to Production Depreciation Other
Transfers to/from F.G. Inventory Transfers to/from NASA
Gross Profit - $
Period CostsBusiness ContributionInterest on Working CapitalNet Contribution
47,850($’000's)
94,504- 4,584
89,920
- 28,662203
- 4632
- 28,473
61,447
- 4,900- 16,390- 21,290- 775- 7,238- 29,303
32,144
- 7,560 24,584
- 1,92322,661
Notes: Fixed costs are allocated between regular butyl production (above)and halobutyl production (reported separately).
POLYSAR
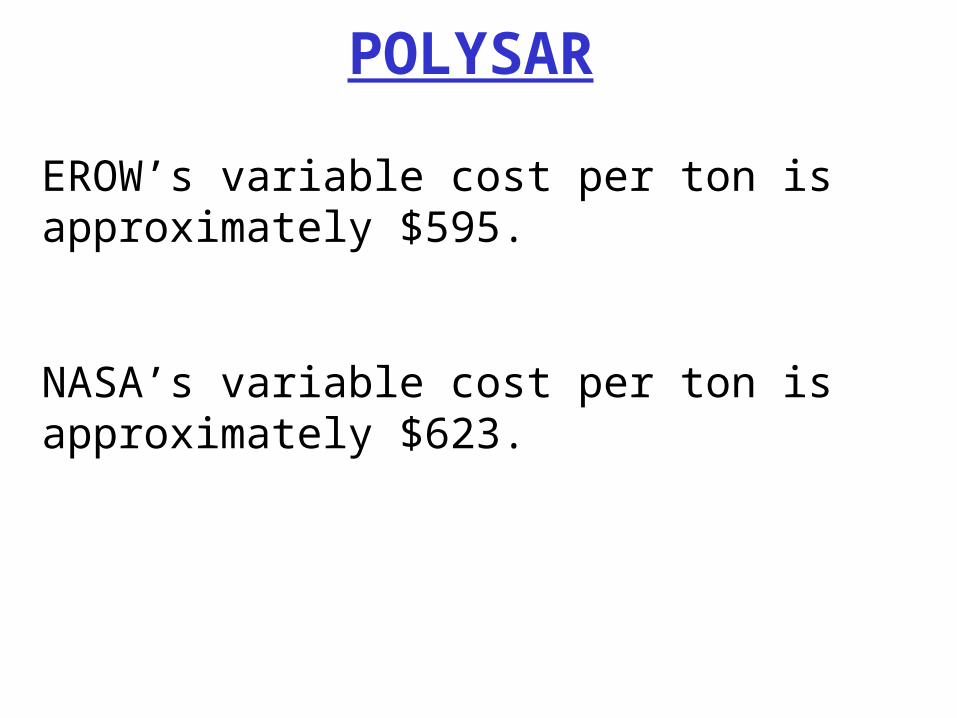
EROW’s variable cost per ton is approximately $595.
NASA’s variable cost per ton is approximately $623.
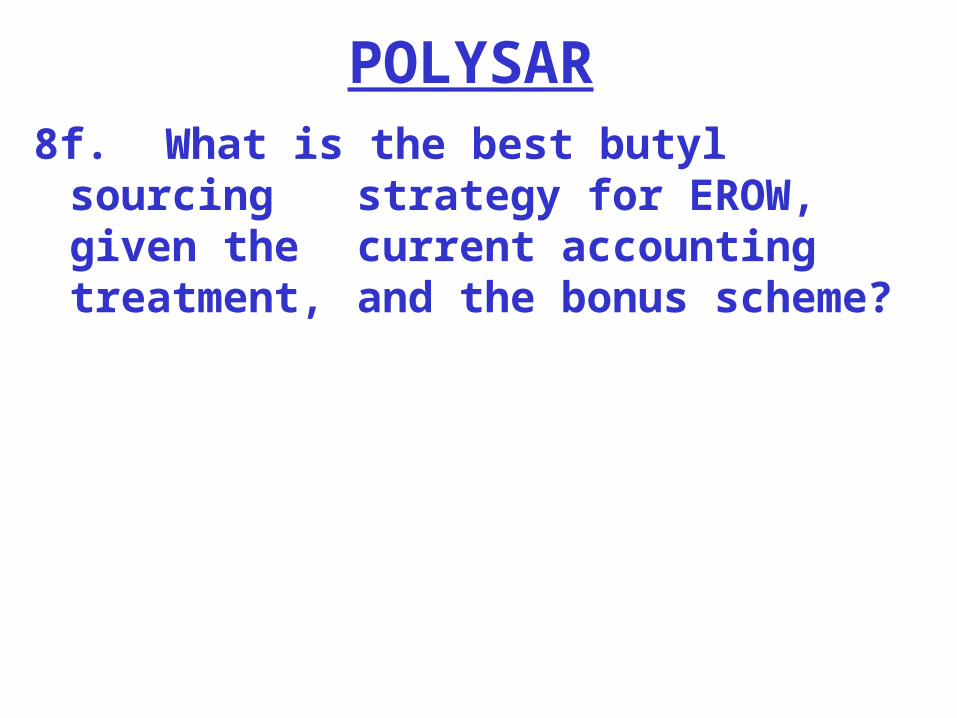
POLYSAR8f. What is the best butyl sourcing
strategy for EROW, given the current accounting treatment, and the bonus scheme?

POLYSAR From EROW’s point of view, the $700 per
tonne allocation of fixed costs is a variable cost. If EROW can manufacture an extra ton of butyl in Antwerp, instead of buying the butyl from NASA, EROW saves $700.
EROW should manufacture as much butyl in Antwerp as possible, before buying butyl from NASA.

POLYSAR If EROW can sell one more ton of butyl, at
a price equal to NASA’s variable costs, plus shipping, plus $699, will they want to?
In the above situation, will the company want EROW to make the sale?

POLYSARCompensation
Management –
For managers, the percent of remuneration received through annual bonuses was greater than 12% and increased with responsibility levels.
The bonuses of top Division management in 1985 were calculated by a formula that awarded 50% of bonus potential to meeting or exceeding Divisional profit targets and 50% to meeting or exceeding corporate profit targets.

POLYSAR
Product SchedulingAlthough NASA served customers in North and South America and EROW served customers in Europe and the rest of the world, regular butyl could be shipped from either the Sarnia 2 or Antwerp plant. NASA shipped approximately 1/3 of its regular butyl output to EROW. Also, customers located in distant locations could receive shipments from either plant due to certain cost or logistical advantages. For example, Antwerp sometimes shipped to Brazil and Sarnia sometimes shipped to the Far East. …

POLYSAR
Product Scheduling … In September and October of each year, NASA and EROW divisions prepared production estimates for the upcoming year. These estimates were based on estimated sales volumes and plant loadings (i.e., capacity utilization). Since the Antwerp plant operated at capacity, the planning exercise was largely for the benefit of the managers of the Sarnia 2 plant, who needed to know how much regular butyl Antwerp would need from the Sarnia 2 plant.
POLYSAR What are EROW’s incentives in the
budgeting process?
What happens if EROW estimates greater demand for butyl than EROW actually needs?
POLYSAR
Interview with Pierre Choquette (Vice President of NASA Rubber Division) –
“Our transfers to EROW are still a problem. Since the transfers are at standard cost and are not recorded as revenue, these transfers do nothing for our profit. Also, if they cut back on orders, our profit is hurt through the volume variance. Few of our senior managers truly understand the volume variance …”

Exhibit 6
Schedule of Regular Butyl Shipments from NASA to EROW
Actual BudgetTonnes Tonnes
1985 21,710 23,500
1984 12,831 13,700
1983 1,432 4,000
1982 792 600
1981 1,069 700

PRODUCT COSTING AND TRANSFER PRICES -
A purchase price variance (were input prices above or below standardprices?) and an efficiency variance (did production require more or less inputs thanstandard?) were calculated for variable costs each accounting period.
Fixed costs comprised three categories of cost. Direct costs included directlabor, maintenance, chemicals required to keep the plant bubbling, and fixedutilities. Allocated cash costs included plant management, purchasing departmentcosts, engineering, planning, and accounting. Allocated non-cash costs representedprimarily depreciation.
Fixed costs were allocated to production based on a plant’s “demonstratedcapacity” using the following formula,
Standard Fixed = Estimated Annual Total Fixed CostsCosts per Tonne Annual Demonstrated Plant Capacity
To apply the formula, production estimates were established each fall for theupcoming year. Then, the amount of total fixed costs applicable to this level ofproduction was estimated. The amount of total fixed cost to be allocated to eachtonne of output was calculated by dividing total fixed cost by the plant’sdemonstrated capacity. Exhibit 5 reproduces a section of the Controller’s Guidethat defines demonstrated capacity.
Each accounting period, two variances were calculated for fixed costs. Thefirst was a spending variance calculated as the simple difference between actualtotal fixed costs and estimated total fixed costs. The second variance was a volumevariance calculated using the formula:
Volume Variance = Standard Fixed Cost per Tonne x (Actual Tonnes Produced - Demonstrated Capacity)
Product transfers between divisions for performance accounting purposeswere made at standard full cost, representing, for each tonne, the sum of standardvariable cost and standard fixed cost.

Exhibit 2NASA RUBBER DIVISION
Regular Butyl RubberStatement of Net Contribution
September 1986
9 Months ended Sept. 30, 1986
Actual(‘000's)
Budget(‘000's)
Deviation(‘000's)
Sales Revenue - Third Party - Diversified Product Group - TotalDelivery CostNet Sales Revenue
Variable Costs Standard Cost Adjustments Efficiency Variance Total
Gross Margin - $
Fixed Costs Standard Cost Adjustments Spending Variance Volume Variance TotalGross Profit - $
Period Costs Administration, Selling, Distribution Technical Service Other Income/Expense Total
Business ContributionInterest on Working CapitalNet Contribution
65,872160
66,032- 2,79363,239
-22,58954
241-22,294
40,945
-25,060168498
-11,375-35,769
5,176
- 4,163- 222
208- 4,177
999-1,875- 876
61,050210
61,260- 2,60058,660
-21,450- -
-21,450
37,210
-23,10080-
- 6,125-29,145
8,065
- 4,000- 210
50- 4,160
3,905-1,9002,005
4,822- 504,722
- 1934,579
- 1,13954
241- 844
3,735
-1,96088
498-5,250-6,624-2,889
- 163- 12
158- 17
-2,90625
- 2,881
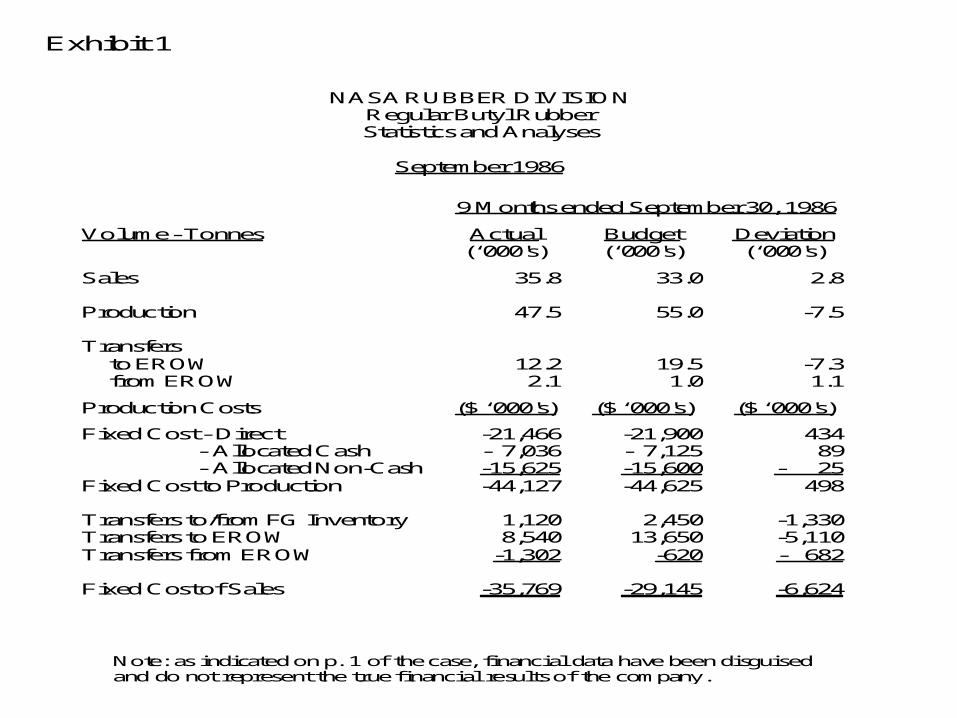
Exhibit 1
NASA RUBBER DIVISIONRegular Butyl RubberStatistics and Analyses
September 1986
9 Months ended September 30, 1986
Volume - Tonnes Actual(‘000's)
Budget(‘000's)
Deviation(‘000's)
Sales
Production
Transfers to EROW from EROW
35.8
47.5
12.22.1
33.0
55.0
19.51.0
2.8
-7.5
-7.31.1
Production Costs ($ ‘000's) ($ ‘000's) ($ ‘000's)
Fixed Cost - Direct - Allocated Cash - Allocated Non-CashFixed Cost to Production
Transfers to/from FG InventoryTransfers to EROWTransfers from EROW
Fixed Cost of Sales
-21,466- 7,036-15,625-44,127
1,1208,540
-1,302
-35,769
-21,900- 7,125-15,600-44,625
2,45013,650
-620
-29,145
43489
- 25498
-1,330-5,110- 682
-6,624
Note: as indicated on p. 1 of the case, financial data have been disguisedand do not represent the true financial results of the company.
Related Documents