Combining NMR and LC/MS Using Backward Variable Elimination: Metabolomics Analysis of Colorectal Cancer, Polyps, and Healthy Controls Lingli Deng †,‡ , Haiwei Gu ‡,§,* , Jiangjiang Zhu ‡ , G. A. Nagana Gowda ‡ , Danijel Djukovic ‡ , E. Gabriela Chiorean ||,⊥ , and Daniel Raftery ‡,#,@,* † Department of Information Engineering, East China University of Technology, 418 Guanglan Avenue, Nanchang, Jiangxi Province 330013, China ‡ Northwest Metabolomics Research Center, Department of Anesthesiology and Pain Medicine, University of Washington, 850 Republican Street, Seattle, Washington 98109, United States § Jiangxi Key Laboratory for Mass Spectrometry and Instrumentation, East China University of Technology, 418 Guanglan Avenue, Nanchang, Jiangxi Province 330013, China || Department of Medicine, University of Washington, 825 Eastlake Avenue East, Seattle, Washington 98109, United States ⊥ Indiana University Melvin and Bren Simon Cancer Center, 535 Barnhill Drive, Indianapolis, Indiana 46202, United States # Department of Chemistry, Purdue University, 560 Oval Drive, West Lafayette, Indiana 47907, United States @ Public Health Sciences Division, Fred Hutchinson Cancer Research Center, 1100 Fairview Avenue North, Seattle, Washington 98109, United States Abstract Both nuclear magnetic resonance (NMR) spectroscopy and mass spectrometry (MS) play important roles in metabolomics. The complementary features of NMR and MS make their combination very attractive; however, currently the vast majority of metabolomics studies use either NMR or MS separately, and variable selection that combines NMR and MS for biomarker identification and statistical modeling is still not well developed. In this study focused on methodology, we developed a backward variable elimination partial least-squares discriminant * Corresponding Authors: Telephone: 206-685-4753. Fax: 206-616-4819. [email protected]. Telephone: 206-543-9709. Fax: 206-616-4819. [email protected]. Author Contributions L.D. and H.G. contributed equally to this work. The authors declare the following competing financial interest(s): D.R. serves as an executive officer for and holds equity in Matrix- Bio, Inc. ASSOCIATED CONTENT Supporting Information The Supporting Information is available free of charge on the ACS Publications website at DOI: 10.1021/acs.anal-chem.6b00885. Additional data and spectra (PDF) List of NMR-detected metabolies (XLSX) List of MS-detected metabolites (XLSX) HHS Public Access Author manuscript Anal Chem. Author manuscript; available in PMC 2017 May 31. Published in final edited form as: Anal Chem. 2016 August 16; 88(16): 7975–7983. doi:10.1021/acs.analchem.6b00885. Author Manuscript Author Manuscript Author Manuscript Author Manuscript

Welcome message from author
This document is posted to help you gain knowledge. Please leave a comment to let me know what you think about it! Share it to your friends and learn new things together.
Transcript

Combining NMR and LC/MS Using Backward Variable Elimination: Metabolomics Analysis of Colorectal Cancer, Polyps, and Healthy Controls
Lingli Deng†,‡, Haiwei Gu‡,§,*, Jiangjiang Zhu‡, G. A. Nagana Gowda‡, Danijel Djukovic‡, E. Gabriela Chiorean||,⊥, and Daniel Raftery‡,#,@,*
†Department of Information Engineering, East China University of Technology, 418 Guanglan Avenue, Nanchang, Jiangxi Province 330013, China
‡Northwest Metabolomics Research Center, Department of Anesthesiology and Pain Medicine, University of Washington, 850 Republican Street, Seattle, Washington 98109, United States
§Jiangxi Key Laboratory for Mass Spectrometry and Instrumentation, East China University of Technology, 418 Guanglan Avenue, Nanchang, Jiangxi Province 330013, China
||Department of Medicine, University of Washington, 825 Eastlake Avenue East, Seattle, Washington 98109, United States
⊥Indiana University Melvin and Bren Simon Cancer Center, 535 Barnhill Drive, Indianapolis, Indiana 46202, United States
#Department of Chemistry, Purdue University, 560 Oval Drive, West Lafayette, Indiana 47907, United States
@Public Health Sciences Division, Fred Hutchinson Cancer Research Center, 1100 Fairview Avenue North, Seattle, Washington 98109, United States
Abstract
Both nuclear magnetic resonance (NMR) spectroscopy and mass spectrometry (MS) play
important roles in metabolomics. The complementary features of NMR and MS make their
combination very attractive; however, currently the vast majority of metabolomics studies use
either NMR or MS separately, and variable selection that combines NMR and MS for biomarker
identification and statistical modeling is still not well developed. In this study focused on
methodology, we developed a backward variable elimination partial least-squares discriminant
*Corresponding Authors: Telephone: 206-685-4753. Fax: 206-616-4819. [email protected]. Telephone: 206-543-9709. Fax: 206-616-4819. [email protected] ContributionsL.D. and H.G. contributed equally to this work.
The authors declare the following competing financial interest(s): D.R. serves as an executive officer for and holds equity in Matrix-Bio, Inc.
ASSOCIATED CONTENTSupporting InformationThe Supporting Information is available free of charge on the ACS Publications website at DOI: 10.1021/acs.anal-chem.6b00885.Additional data and spectra (PDF)List of NMR-detected metabolies (XLSX)List of MS-detected metabolites (XLSX)
HHS Public AccessAuthor manuscriptAnal Chem. Author manuscript; available in PMC 2017 May 31.
Published in final edited form as:Anal Chem. 2016 August 16; 88(16): 7975–7983. doi:10.1021/acs.analchem.6b00885.
Author M
anuscriptA
uthor Manuscript
Author M
anuscriptA
uthor Manuscript

analysis algorithm embedded with Monte Carlo cross validation (MCCV-BVE-PLSDA), to
combine NMR and targeted liquid chromatography (LC)/MS data. Using the metabolomics
analysis of serum for the detection of colorectal cancer (CRC) and polyps as an example, we
demonstrate that variable selection is vitally important in combining NMR and MS data. The
combined approach was better than using NMR or LC/MS data alone in providing significantly
improved predictive accuracy in all the pairwise comparisons among CRC, polyps, and healthy
controls. Using this approach, we selected a subset of metabolites responsible for the improved
separation for each pairwise comparison, and we achieved a comprehensive profile of altered
metabolite levels, including those in glycolysis, the TCA cycle, amino acid metabolism, and other
pathways that were related to CRC and polyps. MCCV-BVE-PLSDA is straightforward, easy to
implement, and highly useful for studying the contribution of each individual variable to
multivariate statistical models. On the basis of these results, we recommend using an appropriate
variable selection step, such as MCCV-BVE-PLSDA, when analyzing data from multiple
analytical platforms to obtain improved statistical performance and a more accurate biological
interpretation, especially for biomarker discovery. Importantly, the approach described here is
relatively universal and can be easily expanded for combination with other analytical technologies.
Graphical abstract
Metabolomics provides an important approach in systems biology to investigate biological
states as well as the effects of internal and external perturbations through the study of
changes in metabolite concentrations and fluxes.1–9 Complex metabolic processes in living
systems respond to many stimuli, including diseases and drugs, resulting in alterations in
metabolic profiles; metabolomics aims to detect these changes at the molecular level using
advanced analytical chemistry techniques and multivariate statistical analysis. Metabolomics
studies have resulted in a number of important findings, including a deeper understanding of
cancer metabolism10,11 and drug toxicity,12,13 the potential for improved early disease
detection14–16 or therapy monitoring,4,17 and successful applications in environmental
science,18 nutrition,19 etc.
The two most commonly used analytical technologies in metabolomics are nuclear magnetic
resonance (NMR) spectroscopy and mass spectrometry (MS).20,21 NMR is well-known as a
premier method for structural identification and for the analysis of multicomponent mixtures
as it is rapid and nondestructive, requires little or no sample preparation, and provides highly
reproducible (coefficients of variation, CVs, of a few percent) and quantitative results.22–25
MS is another essential method for identifying and quantifying metabolites, especially those
of low abundance in complex biosamples, because of its intrinsically high sensitivity and
Deng et al. Page 2
Anal Chem. Author manuscript; available in PMC 2017 May 31.
Author M
anuscriptA
uthor Manuscript
Author M
anuscriptA
uthor Manuscript

high selectivity.26,27 Notably, metabolomics data from NMR and MS experiments are
complex because they usually contain signals from many metabolites; therefore, multivariate
statistical analysis plays an important role in metabolomics for reducing data dimensions,
differentiating similar spectra, building predictive models, etc.28,29
NMR and MS generate different metabolic profiles from the same sample; thus, their
combination can be very valuable in metabolomics. One thereby can obtain a more
comprehensive profile of detectable metabolites, and as shown below, one can potentially
improve the reliability and predictive accuracy of statistical models. However, currently the
vast majority of metabolomics studies use either NMR or MS separately, although a growing
number of studies do combine NMR and MS analysis to advantage.30–44 For example, we
developed principal component (PC)-directed partial least-squares (PLS) analysis to
combine one-dimensional (1D) 1H NMR and direct analysis in real time (DART) MS data to
improve breast cancer detection.31 Powers and co-workers and Karaman et al. have proposed
multiblock PLS approaches to integrate data from MS and NMR.43,44 Thus far, however, the
potential benefits of combining NMR and MS for biomarker discovery and statistical
modeling are still not well recognized. In particular, optimizing variable selection is one of
the major challenges for multiblock data because of the extra number of variables. Variable
selection is often performed using univariate analysis or as a byproduct of full-scale
multivariate statistical analysis;32,43 the contribution of each individual variable to
multivariate modeling is rarely studied. Therefore, it is highly desirable to further investigate
and develop approaches in metabolomics to make better use of both NMR and MS data.
In this study focused on method development, we examined the performance of
combining 1H NMR and targeted LC/MS/MS metabolite profiles from patients with
colorectal cancer (CRC), patients with polyps, and healthy controls. It is important to
improve CRC and polyp detection, as CRC is one of the most prevalent and deadly cancers
in the United States and worldwide.45 To date, numerous metabolic alterations have been
found in CRC tissue,37,46–48 serum,49–55 urine,56 and fecal water57 from the metabolite
profiles measured by NMR and/or MS, and therefore, one might surmise that combining
NMR and MS data could result in improved metabolite panels. Here, we analyzed a total of
127 serum samples from three groups of subjects, and potential biomarkers were selected
using a backward variable elimination58 approach that was incorporated into multiblock PLS
discriminant analysis (BVE-PLSDA). Monte Carlo cross validation (MCCV)59,60 was
performed and demonstrated the robust diagnostic power of this NMR-and MS-based
metabolomics approach in differentiating healthy controls from patients with CRC and
polyps.
EXPERIMENTAL PROCEDURES
Chemicals
Deuterium oxide (D2O, 99.9% D), L-tyrosine-13C2, and sodium L-lactate-13C3 were
purchased from Cambridge Isotope Laboratories, Inc. (Andover, MA).
Trimethylsilylpropionic-2,2,3,3-d4 acid sodium salt (TSP) was obtained from Sigma-Aldrich
(Milwaukee, WI). Acetonitrile (LC/MS grade), ammonium acetate (LC/MS grade),
methanol (LC/MS grade), and acetic acid (LC/MS grade) were all purchased from Fisher
Deng et al. Page 3
Anal Chem. Author manuscript; available in PMC 2017 May 31.
Author M
anuscriptA
uthor Manuscript
Author M
anuscriptA
uthor Manuscript

Scientific (Pittsburgh, PA). Deionized (DI) water was provided in house by a Synergy
Ultrapure Water System from EMD Millipore (Billerica, MA).
Serum Samples
All work was conducted in accordance with protocols approved by the Indiana University
School of Medicine and Purdue University Institutional Review Boards. All subjects in the
study provided informed consent according to institutional guidelines. Patients undergoing
colonoscopy for CRC screening or CRC surgery were evaluated, and blood from the patients
was obtained after overnight fasting and identical bowel preparation but prior to their
procedure (colonoscopy or surgery). Healthy or polyp status was determined after screening.
In total, blood samples from 28 CRC patients, 44 individuals with polyps, and 55 healthy
controls were collected and analyzed by NMR and MS. The detailed demographic and
clinical parameters for the patients and healthy controls included in this study are listed in
Table 1. Each blood sample was allowed to clot for 45 min and then centrifuged at 2000 rpm
for 10 min. Sera were collected, aliquoted into separate vials, transported under dry ice, and
then stored at −80 °C until they were used.
1H NMR Spectroscopy
Five hundred thirty microliters of each serum sample was transferred into a 5 mm NMR
tube. To minimize the interference of macromolecules with the TSP signal, a 60 μL TSP
solution (20.9 nmol in D2O) sealed in a coaxial glass capillary that served as a chemical shift
reference (δ 0.00) was placed in the NMR tube during the experiment. All 1H NMR
experiments were performed at 25 °C on a Bruker DRX 500 MHz NMR spectrometer
equipped with a TXI probe. 1H NMR data for each sample were acquired using the one-
dimensional CPMG (Carr–Purcell–Meiboom–Gill) pulse sequence with water presaturation.
For each spectrum, 128 transients were collected and 16K data points were acquired using a
spectral width of 6000 Hz. The data were Fourier transformed after an exponential
weighting function corresponding to 0.5 Hz line broadening had been applied. The spectra
were phased and baseline corrected using Bruker TopSpin software (version 3.5). The
spectral data were deposited into The Metabolomics Consortium Data Repository and
Coordinating Center (DRCC, Study ST000285).61 We performed manual metabolite
identification and peak integration (based on characteristic chemical shift and multiplicity).
Table S1 shows the list of metabolites detected by NMR and their chemical shift regions
used for peak integration.23,24
LC/MS/MS
A robust targeted LC/MS/MS method has recently been developed and used in a number of
studies in the Northwest Metabolomics Research Center (NW-MRC).11,15,53,62–67 In this
study, the MS data from the same samples as those measured by NMR, collected in our
previous study,15 were used to demonstrate the performance of the NMR–MS combination.
Briefly, the LC/MS/MS experiments were performed on an Agilent 1260 LC (Agilent
Technologies, Santa Clara, CA) AB Sciex QTrap 5500 MS (AB Sciex, Toronto, ON) system.
Table S2 shows the LC gradient conditions. We monitored 99 and 59 MRM transitions in
negative and positive mode, respectively (158 transitions in total). The optimized MS
conditions are listed in Table S3. The extracted MRM peaks were integrated using
Deng et al. Page 4
Anal Chem. Author manuscript; available in PMC 2017 May 31.
Author M
anuscriptA
uthor Manuscript
Author M
anuscriptA
uthor Manuscript

MultiQuant version 2.1 (AB Sciex). The LC/MS/MS data were also deposited into the
DRCC (Study ST000284).61
Data Analysis
A TSP solution of known concentration contained in a separate glass capillary was used to
provide a chemical shift reference and to normalize the NMR data. In this study, we used the
same MS data that have been investigated in a previous study;15 however, here we analyzed
the samples that were measured by both NMR and MS. In the published study,15 we
observed that normalization using the QC data on a metabolite-by-metabolite basis reduced
technical variation in the data. For example, we obtained a median QC CV of 8%, ranging
from 5 to 31% with ~80% metabolites having a CV of <15% after QC normalization. Both
NMR and MS data were autoscaled prior to multivariate statistical analysis.
Figure 1 shows the flowchart of MCCV-BVE-PLSDA, describing the process of identifying
a mixed panel of NMR and MS markers to improve CRC and polyp detection. We compared
the performance of NMR and MS data, both individually and in combination (NMR–MS).
On the basis of the concept of BVE,58 we developed a MCCV-BVE-PLSDA algorithm to
obtain the variable subset that generated improved prediction. The analysis started by
including all metabolite signals (variables) and stopped once every variable had been
examined. In each iteration, one variable (metabolite) was removed, and the remaining
variables were used for PLS-DA. The variables with the highest prediction accuracy for the
test samples in MCCV59,60 were kept for the next iteration. During MCCV (which was
repeated 500 times for each variable), all samples were randomly divided into two sets, 70%
as the training set and 30% as the test set. PLS-DA was performed on the training set, and
then the resulting model was used to predict the classification of test set samples. The
sample membership could be either correctly assigned, termed true class, or randomly
assigned (permutation). Several metrics were used to estimate and compare the performance
of the models. First, classification accuracy was used to measure the performance; for
example, if 1 was assigned as the dummy index for the CRC group and 0 was used for the
control group, 0.5 would be used as the threshold to determine the classification for both the
training and test samples. Classification accuracy was calculated as the ratio between the
number of correctly predicted samples and the total number of samples, which takes both
false positives and false negatives into consideration. In addition, the area under the receiver
operator characteristics curve (AUROC) was also used as a performance metric.
All analyses were conducted in Matlab (R2008a, Mathworks, Natick, MA) installed with the
PLS Toolbox (version 4.11, Eigenvector Research, Inc., Wenatchee, WA) using scripts
written in house.
RESULTS AND DISCUSSION1H NMR and MS Spectra
Figure S1a shows a typical 500 MHz 1D 1H NMR spectrum of a serum sample from a colon
cancer patient. The spectrum contained NMR signals from small molecules, including
formate, phenylalanine, tyrosine, histidine, glucose, lactate, creatinine, glutamine, alanine,
Deng et al. Page 5
Anal Chem. Author manuscript; available in PMC 2017 May 31.
Author M
anuscriptA
uthor Manuscript
Author M
anuscriptA
uthor Manuscript
valine, isoleucine, leucine, etc. In total, 70 metabolite variables (Table S1) were obtained
from the 1H NMR spectra by manual peak integration.
The targeted LC/MS/MS system allowed the detection of 158 (including two 13C-labeled
internal standards) MRM transitions (Table S3), for the metabolites from more than 20
different metabolite classes (e.g., amino acids, carboxylic acids, pyridines, etc.) and from
>25 important metabolic pathways (e.g., TCA cycle, amino acid metabolism, glycolysis,
etc.). Panels b and c of Figure S1 show the overlapped extracted ion chromatograms (EICs)
of the metabolites that were detected in the serum sample from a colon cancer patient with
positive and negative ionization, respectively. In total, we detected 113 metabolites that were
present in the serum samples, and they are highlighted in the ID column of Table S3.
It can be clearly seen that NMR and MS metabolic profiles have some overlap (Tables S1
and S3), such as lactate and glucose that were detected on both instruments. Meanwhile,
many metabolites were detected only on one platform or the other; for example, citrate could
be detected by only NMR, and reduced glutathione was measured by LC/MS/MS alone. In
Figure 2a, we show the correlation between all the NMR and MS variables, while Figure 2b
presents the correlation between the subset of metabolites that can be detected by both NMR
and MS. Many metabolites had low correlation values between NMR and MS in Figure 2a;
however, most of the overlapped metabolites had large correlation coefficients (Figure 2b).
Nevertheless, a few metabolites in Figure 2b had weak correlations, which are probably in
part due to the presence of matrix effects in the MS data or peak overlap in the NMR
spectra.
CRC versus Healthy Controls
Panels a and b of Figure 3 show the results of MCCV-BVE-PLSDA in selecting a subset of
metabolite markers for differentiating CRC patients from healthy controls, using NMR, MS,
and NMR–MS data. As shown in Figure 3a, the highest classification accuracy of the NMR–
MS data was clearly better than that using the models derived from either NMR or MS
alone. As could be anticipated, an excessive number of variables led to the deterioration of
statistical models, and there was a number and/or range of variables that could produce the
best statistical performance. This was consistently observed for all the NMR-, MS-, and
NMR–MS-based models.
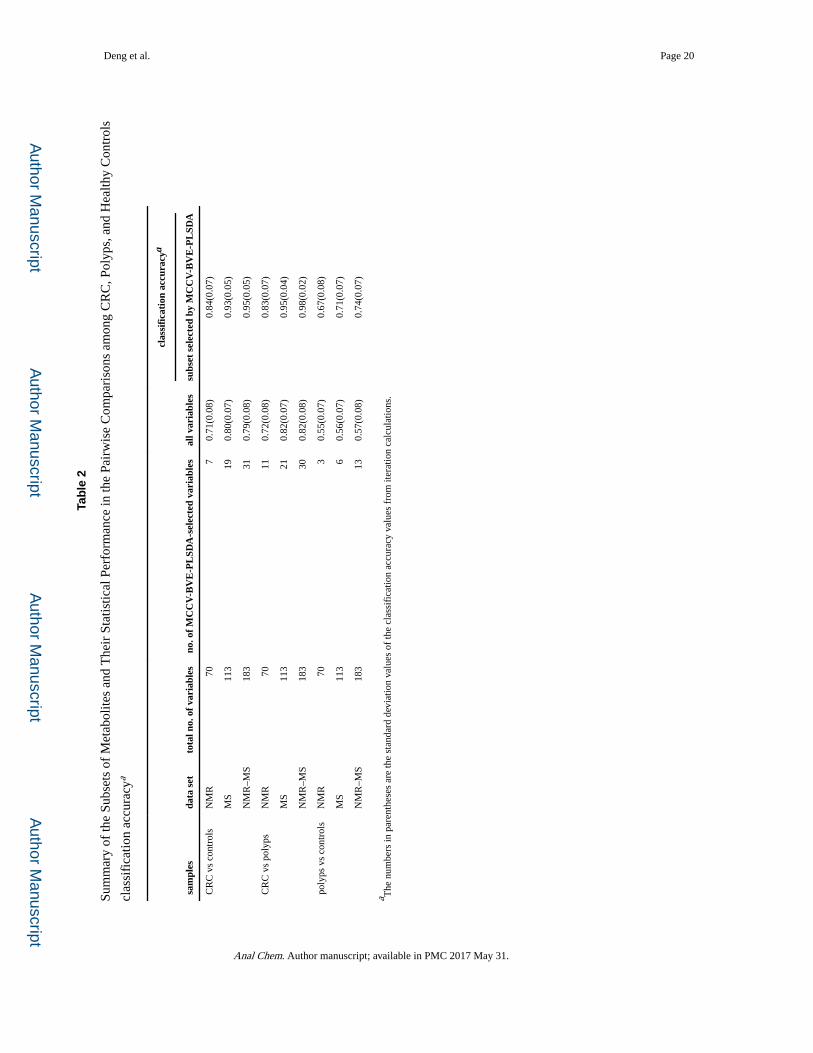
Table 2 summarizes the selected sets of metabolites resulting from MCCV-BVE-PLSDA and
their statistical performance in the pairwise comparisons among CRC, polyps, and healthy
controls. In the case of CRC versus healthy controls, a set of seven NMR variables provided
the best classification accuracy of 0.84 ± 0.07, compared to 0.71 ± 0.08 for all 70 variables.
The MS data generated a classification accuracy of 0.93 ± 0.05 using 19 variables compared
to a value of 0.80 ± 0.07 for all 113 variables. Interestingly, it was observed that simply
putting the NMR and MS data together does not guarantee better statistical performance
(0.79 ± 0.08 for all 183 variables), because too many poorly performing variables will
reduce prediction accuracy. However, after MCCV-BVE-PLSDA using the combined set of
NMR–MS data, the highest classification accuracy of 0.95 ± 0.05 was achieved using 31
variables. The complementary information provided by NMR and MS was beneficial in
improving the statistical analysis. Therefore, we recommend incorporating appropriate
Deng et al. Page 6
Anal Chem. Author manuscript; available in PMC 2017 May 31.
Author M
anuscriptA
uthor Manuscript
Author M
anuscriptA
uthor Manuscript
variable selection in multivariate statistical analysis to minimize data redundancy, a step that
is currently not often performed.
Figure 3b compares the classification accuracy of true class models and random
permutations in MCCV, when the selected set of variables was used in MCCV-BVE-
PLSDA. As expected, the average classification accuracy of random permutations was very
close to 0.5, regardless of whether NMR, MS, or NMR–MS data were used. The
classification accuracy values of true class models were clearly higher than those of random
permutations, which further confirmed that the NMR and/or MS variables did contain
variations related to CRC.
Table S4 shows the alterations of selected metabolite markers by MCCV-BVE-PLSDA from
the NMR and/or MS data that were involved in the comparison between CRC patients and
healthy controls. The metabolite markers from the combined NMR–MS data had a
significant overlap with those derived from the models based on NMR or MS data alone. It
can be seen that both NMR (seven variables) and MS (24 variables) contributed to the mixed
panel of biomarker candidates (NMR–MS). The important NMR and MS metabolites
showed no overlap, with the exception of histidine (which decreased in CRC serum for both
NMR and MS), providing the evidence that NMR and MS can make unique contributions to
statistical modeling in metabolomics. The unpaired Student’s t test was also performed on
each metabolite to assess its statistical significance between the two groups. In the NMR–
MS data, five NMR variables and nine MS variables had P values of <0.05. We also list the
adjusted P values in Table S4, with the false discovery rate (FDR) controlled at 0.05.
CRC versus Polyps
Similarly, we examined this combined NMR–MS metabolomics approach to differentiate
CRC from polyp patients. As shown in Figure S2a and Table 2, 11 NMR variables were
required to obtain the highest classification accuracy of 0.83 ± 0.07 in MCCV-BVE-PLSDA,
and 21 selected MS variables provided a classification accuracy of 0.95 ± 0.04. The
combination of 30 NMR and MS variables from the NMR–MS data produced a significantly
better classification accuracy of 0.98 ± 0.02. The NMR–MS combination was more efficient
in improving CRC and polyp separation compared to NMR or MS alone. It was also seen in
Figure S2a that more variables did not necessarily provide better statistical performance, for
NMR, MS, or NMR–MS data. Again, the use of variable selection in the statistical analysis
of metabolomics data is highly effective in improving the modeling.
The results of MCCV for the selected variables from each data set showed that the average
classification accuracy of random permutations (~0.5) was clearly lower than that of the true
class models (Figure S2b). This result again indicated that the NMR and/or MS variables
extracted a high degree of the biological variation related to CRC or polyps. From Table S5,
one can see that the 30 metabolite markers from the NMR–MS data included 11 NMR
variables and 19 MS variables. Most of the NMR (MS) variables selected by MCCV-BVE-
PLSDA from the NMR–MS data overlapped with those from the NMR (MS) data alone,
while a number of important variables were unique to the different data sets.
Deng et al. Page 7
Anal Chem. Author manuscript; available in PMC 2017 May 31.
Author M
anuscriptA
uthor Manuscript
Author M
anuscriptA
uthor Manuscript

Polyps versus Healthy Controls
Although of great importance for preventing the development of CRC, the metabolic profiles
of polyp patients and healthy controls have not been compared as often as those for CRC.68
Differentiating polyp patients from healthy controls is a challenging problem, and diagnostic
tests other than colonoscopy generally show poor performance. Using the approach
described above, classification accuracies of 0.67 ± 0.08, 0.71 ± 0.07, and 0.74 ± 0.07 were
achieved using the selected NMR (three variables), MS (six variables), and NMR–MS (13
variables) data sets, respectively (see Figure 3c and Table 2). Again, the statistical
performance of NMR–MS data was significantly better than that of NMR or MS data alone,
and variable selection was successful in producing a subset of metabolites that provided the
best classification accuracy. The MCCV results shown in Figure 3d indicate that the
classification accuracy of true class models was clearly higher than that of random
permutations, although the performance is not as good as it is for distinguishing CRC. Table
S6 shows the 13 important variables (four from NMR and nine from MS) identified in the
NMR–MS data for separating polyps and healthy controls. For example, the level of lipids
[NMR (1.209–1.302 ppm)] was increased in polyp patient serum while the level of orotate
(MS) was decreased.
Interestingly, a number of important metabolites overlapped in the pairwise comparisons
among polyps, CRC, and controls (Tables S4–S6). For example, proline (NMR–MS data)
was important in the comparisons of CRC versus controls (Table S4) and CRC versus polyps
(Table S5). However, we did not observe a metabolite that was important in the NMR–MS
data for all the three pairwise comparisons, although lactate was important in all the MS
analyses alone, as indicated in Tables S4–S6. CRC had the lowest adenosine level (NMR–
MS data), and polyp patient serum had the highest level of adenosine. The level of orotate
was increased in CRC compared to that in polyps, and it was decreased in polyps compared
to controls, such that polyp patients had the lowest levels of orotate. The level of this
metabolite (and a few others) did not continuously increase or decrease from controls to
polyps, and then to CRC, which indicates that CRC disease progression, as reflected in
metabolism, is likely a very complex process.
Figure 4 shows the results of MCCV-BVE-PLSDA, but based on AUROC to estimate the
classification performance. These results confirmed that variable selection is highly useful
for improving multivariate statistical analysis, and the combination of NMR and MS has a
better diagnosis performance than NMR or MS alone. While AUROC and classification
accuracy are highly correlated, they do not measure performance identically.
Metabolic Pathways
Although detailed biological analysis is beyond the scope of this paper, a number of
metabolite changes in important metabolic pathways were observed in this study that are of
potential significance to CRC and polyp and are consistent with those reported in previous
studies.15,49–52 These pathways include glycolysis, the TCA cycle, fatty acid metabolism,
amino acid metabolism, glutaminolysis, etc. In Figure 5, biomarker candidates discovered
from the NMR–MS data are highlighted for the pairwise comparisons among CRC, polyps,
and controls. Both NMR (red stars) and MS (blue circles) significantly contribute to the
Deng et al. Page 8
Anal Chem. Author manuscript; available in PMC 2017 May 31.
Author M
anuscriptA
uthor Manuscript
Author M
anuscriptA
uthor Manuscript

altered metabolism shown in Figure 5, which should be helpful for improving our
understanding of metabolite perturbations and the mechanisms related to CRC and polyp
development.
In particular, glucose (detected by NMR) was found to be upregulated in CRC compared to
controls (Table S4). This could be due to the need for cancer cells to take up glucose to
maintain a high rate of glycolysis, which produces lactate even under aerobic conditions to
fulfill the cells’ large demand for carbon substrates.10,69 In fact, some other glycolysis
intermediates, such as PEP (MS) and pyruvate (MS), are also highlighted in Figure 5.
Cancer cells also use glutamine as an important energy source (glutamine addiction or
glutaminolysis),10,70 which explains the perturbed glutamine levels (MS) indicated in Figure
5. Amino acid metabolism was significantly impacted by CRC and polyps, as well. For
example, changes in alanine (MS), histidine (NMR and MS), aspartate (MS), etc., were
emphasized in our statistical modeling. Alterations of amino acid levels can indicate the
altered cancer cell activities, e.g., synthesis of proteins or catabolism to provide energy
and/or other metabolite substrates. Fumarate (MS), citrate (NMR), and oxaloacetate (MS)
are important metabolites in the TCA cycle, and their altered levels (Figure 5) fit well with
the hypothesis that the TCA cycle is altered by CRC and polyp formation. Purine
metabolism and fatty acid/lipid metabolism changes are also linked to CRC and polyps,
based on the significant changes in the levels of adenosine (MS), lipids (NMR), and
linolenic acid (MS). It is clear from Figure 5 that both NMR and MS are valuable methods
for identifying metabolic changes that occur in patients with CRC and polyps.
Overall, both NMR and MS have advantages and disadvantages as predominant analytical
methods in metabolomics, and their combination can make use of their strengths that include
NMR’s reproducibility and quantitative nature, along with MS’s high sensitivity and broad
coverage. In this study, considering the complementary analytical features of NMR and MS,
we believe that leveraging both methods will provide new insights for biomarker discovery
and disease diagnosis. Given the large number of detectable metabolites, we recommend
using an appropriate variable selection step, such as MCCV-BVE-PLSDA, to extract a
useful set of metabolite markers from both the NMR and MS data, instead of simply
concatenating them together. This new approach can improve statistical performance and
provide more comprehensive biological interpretation. While performing both NMR and MS
experiments requires more effort and expense, on the basis of the examples provided in this
study, we believe that the benefits outweigh the costs, especially at the biomarker discovery
stage.
The aim of this study was not to determine the best variable selection method, but to
demonstrate the importance of variable selection, especially in the case of combining NMR
and MS data, which is infrequently investigated in metabolomics. MCCV-BVE-PLSDA in
this study is an expansion of the BVE-PLSDA approach based on leave-one-out cross
validation.58 Notably, MCCV-BVE-PLSDA is different from the methods based on a
predefined variable ranking list,71,72 which may lead to filtering out a variable that performs
poorly alone but becomes highly useful when combined with other variables. In each
iteration of MCCV-BVE-PLSDA, each variable is combined with n – 2 other variables (n is
the total number of variables in this iteration) in PLSDA modeling n – 1 times (each time a
Deng et al. Page 9
Anal Chem. Author manuscript; available in PMC 2017 May 31.
Author M
anuscriptA
uthor Manuscript
Author M
anuscriptA
uthor Manuscript
different variable is excluded from our analysis). We remove the variable (one for each
iteration) without which the remaining variables produce the highest prediction accuracy. In
addition, we performed regression analysis with a number of previous variable selection
methods.73–77 For example, Figure S3 shows the results of MCCV-BVE-hierarchical
PLSDA, and Figure S4 shows the results of the variable importance in the projection (VIP)-
based stepwise selection method [MCCV-BVE-PLSDA (VIP) comparing healthy controls vs
polyps]. All these results indicated that variable selection is very important in multivariate
statistical analysis in picking a subset of variables that provide the best prediction accuracy.
These results also show that the combination of NMR and MS exhibits a statistical
performance better than that of NMR or MS alone. MCCV-BVE-PLSDA is thus a valuable
and complementary approach to previous variation selection methods,73–77 especially for
combining NMR and MS data, and provides a set of significant variables worth further
investigation. MCCV-BVE-PLSDA is also straightforward, is easy to implement, and can
identify the contribution of each individual variable to multivariate statistical models.
Because of the limited number of samples, MCCV was used for internal cross validation in
this study; however, it can be easily adapted to external cross validation when a larger
number of samples is available. In addition, our data analysis approach is relatively universal
and can be expanded to combine other analytical technologies.
CONCLUSIONS
In this study, we developed and applied the MCCV-BVE-PLSDA approach to examine the
performance of combining NMR and MS for discovery metabolomics. We profiled serum
metabolites from CRC patients, patients with polyps, and healthy controls, which were
measured by NMR and LC/MS/MS. MCCV-BVE-PLSDA identified the subsets of
metabolites with good diagnostic performance that could be initially validated using MCCV.
Further validation will require more samples and would benefit from additional efforts to
fully quantify the metabolite biomarkers and verify their robustness, which we are pursuing.
Importantly, it was found that the combination of NMR and MS showed a statistical
performance better than that of NMR or MS alone. Both NMR and MS contributed
significantly to the achievement of a comprehensive biological interpretation for
understanding CRC and polyp development mechanisms. Therefore, when possible, we
recommend the combined use of NMR and MS along with appropriate variable selection
methods in metabolomics, especially for the purpose of discovering biomarker candidates.
Supplementary Material
Refer to Web version on PubMed Central for supplementary material.
Acknowledgments
This work was supported in part by the National Institutes of Health (Grants 2R01 GM085291 and 2P30 CA015704), AMRMC Grant W81XWH-10-0540, the China Scholarship Council, the Chinese National Instrumentation Program (2011YQ170067), the PCSIRT program (IRT13054), the National Natural Science Foundation of China (21365001), the Science and Technology Planning Project at the Ministry of Science and Technology of Jiangxi Province, China (No. 20152ACH80010), the ITHS Rising Stars Program (UL1TR000423), and the University of Washington. The authors also thank Dr. Lin Lin (Department of Statistics, The Pennsylvania State University, University Park, PA) for her help with data analysis and the reviewers for their helpful comments.
Deng et al. Page 10
Anal Chem. Author manuscript; available in PMC 2017 May 31.
Author M
anuscriptA
uthor Manuscript
Author M
anuscriptA
uthor Manuscript

References
1. Lindon JC, Nicholson JK. Expert Opin Drug Metab Toxicol. 2014; 10:915–919. [PubMed: 24905565]
2. Griffin JL, Atherton H, Shockcor J, Atzori L. Nat Rev Cardiol. 2011; 8:630–643. [PubMed: 21931361]
3. Nagana Gowda GA, Raftery D. Curr Metabolomics. 2013; 1:227–240. [PubMed: 27134822]
4. Halama A, Riesen N, Möller G, Hrabedě Angelis M, Adamski J. J Intern Med. 2013; 274:425–439. [PubMed: 24127940]
5. Scalbert A, Brennan L, Fiehn O, Hankemeier T, Kristal BS, van Ommen B, Pujos-Guillot E, Verheij E, Wishart D, Wopereis S. Metabolomics. 2009; 5:435–458. [PubMed: 20046865]
6. Gu H, Gowda GAN, Raftery D. Future Oncol. 2012; 8:1207–1210. [PubMed: 23130920]
7. Dunn WB, Broadhurst DI, Atherton HJ, Goodacre R, Griffin JL. Chem Soc Rev. 2011; 40:387–426. [PubMed: 20717559]
8. Bain JR, Stevens RD, Wenner BR, Ilkayeva O, Muoio DM, Newgard CB. Diabetes. 2009; 58:2429–2443. [PubMed: 19875619]
9. Fiehn O. Plant Mol Biol. 2002; 48:155–171. [PubMed: 11860207]
10. Vander Heiden MG, Cantley LC, Thompson CB. Science. 2009; 324:1029–1033. [PubMed: 19460998]
11. Carroll PA, Diolaiti D, McFerrin L, Gu H, Djukovic D, Du J, Cheng PF, Anderson S, Ulrich M, Hurley JB, Raftery D, Ayer DE, Eisenman RN. Cancer Cell. 2015; 27:271–285. [PubMed: 25640402]
12. Griffin JL. Curr Opin Chem Biol. 2003; 7:648–654. [PubMed: 14580571]
13. Kumar B, Prakash A, Ruhela RK, Medhi B. Pharmacol Rep. 2014; 66:956–963. [PubMed: 25443721]
14. Roberts LD, Gerszten RE. Cell Metab. 2013; 18:43–50. [PubMed: 23770128]
15. Zhu J, Djukovic D, Deng L, Gu H, Himmati F, Chiorean EG, Raftery D. J Proteome Res. 2014; 13:4120–4130. [PubMed: 25126899]
16. Wang ZN, Klipfell E, Bennett BJ, Koeth R, Levison BS, Dugar B, Feldstein AE, Britt EB, Fu XM, Chung YM, Wu YP, Schauer P, Smith JD, Allayee H, Tang WHW, DiDonato JA, Lusis AJ, Hazen SL. Nature. 2011; 472:57–63. [PubMed: 21475195]
17. Nicholson JK, Holmes E, Kinross JM, Darzi AW, Takats Z, Lindon JC. Nature. 2012; 491:384–392. [PubMed: 23151581]
18. Bundy JG, Davey MP, Viant MR. Metabolomics. 2009; 5:3–21.
19. Rezzi S, Ramadan Z, Fay LB, Kochhar S. J Proteome Res. 2007; 6:513–525. [PubMed: 17269708]
20. Dunn WB, Ellis DI. TrAC, Trends Anal Chem. 2005; 24:285–294.
21. Pan ZZ, Raftery D. Anal Bioanal Chem. 2007; 387:525–527. [PubMed: 16955259]
22. Pan, Z., Gu, H., Raftery, D. Encyclopedia of Chemical Biology. Wiley Online Library; New York: 2008.
23. Nagana Gowda GA, Gowda YN, Raftery D. Anal Chem. 2015; 87:706–715. [PubMed: 25485990]
24. Nagana Gowda GA, Raftery D. Anal Chem. 2014; 86:5433–5440. [PubMed: 24796490]
25. Nagana Gowda GA, Raftery D. J Magn Reson. 2015; 260:144–160. [PubMed: 26476597]
26. Dettmer K, Aronov PA, Hammock BD. Mass Spectrom Rev. 2007; 26:51–78. [PubMed: 16921475]
27. Raftery, D. Mass Spectrometry in Metabolomics: Methods and Protocols. Springer; New York: 2014.
28. Eriksson L, Antti H, Gottfries J, Holmes E, Johansson E, Lindgren F, Long I, Lundstedt T, Trygg J, Wold S. Anal Bioanal Chem. 2004; 380:419–429. [PubMed: 15448969]
29. Blekherman G, Laubenbacher R, Cortes DF, Mendes P, Torti FM, Akman S, Torti SV, Shulaev V. Metabolomics. 2011; 7:329–343. [PubMed: 21949492]
30. Atherton HJ, Bailey NJ, Zhang W, Taylor J, Major H, Shockcor J, Clarke K, Griffin JL. Physiol Genomics. 2006; 27:178–186. [PubMed: 16868074]
Deng et al. Page 11
Anal Chem. Author manuscript; available in PMC 2017 May 31.
Author M
anuscriptA
uthor Manuscript
Author M
anuscriptA
uthor Manuscript

31. Gu HW, Pan ZZ, Xi BW, Asiago V, Musselman B, Raftery D. Anal Chim Acta. 2011; 686:57–63. [PubMed: 21237308]
32. Asiago VM, Alvarado LZ, Shanaiah N, Gowda GAN, Owusu-Sarfo K, Ballas RA, Raftery D. Cancer Res. 2010; 70:8309–8318. [PubMed: 20959483]
33. Pan ZZ, Gu HW, Talaty N, Chen HW, Shanaiah N, Hainline BE, Cooks RG, Raftery D. Anal Bioanal Chem. 2007; 387:539–549. [PubMed: 16821030]
34. Zhang J, Bowers J, Liu L, Wei S, Gowda GAN, Hammoud Z, Raftery D. PLoS One. 2012; 7:e30181. [PubMed: 22291914]
35. Dai H, Xiao CN, Liu HB, Tang HR. J Proteome Res. 2010; 9:1460–1475. [PubMed: 20044832]
36. Lanza IR, Zhang SC, Ward LE, Karakelides H, Raftery D, Nair KS. PLoS One. 2010; 5:e10538. [PubMed: 20479934]
37. Chan ECY, Koh PK, Mal M, Cheah PY, Eu KW, Backshall A, Cavill R, Nicholson JK, Keun HC. J Proteome Res. 2009; 8:352–361. [PubMed: 19063642]
38. Fanos V, Caboni P, Corsello G, Stronati M, Gazzolo D, Noto A, Lussu M, Dessi A, Giuffre M, Lacerenza S, Serraino F, Garofoli F, Serpero LD, Liori B, Carboni R, Atzori L. Early Hum Dev. 2014; 90:S78–S83. [PubMed: 24709468]
39. Cai HL, Li HD, Yan XZ, Sun B, Zhang Q, Yan M, Zhang WY, Jiang P, Zhu RH, Liu YP, Fang PF, Xu P, Yuan HY, Zhang XH, Hu L, Yang W, Ye HS. J Proteome Res. 2012; 11:4338–4350. [PubMed: 22800120]
40. Lane AN, Fan TWM, Xie ZZ, Moseley HNB, Higashi RM. Anal Chim Acta. 2009; 651:201–208. [PubMed: 19782812]
41. Biais B, Allwood JW, Deborde C, Xu Y, Maucourt M, Beauvoit B, Dunn WB, Jacob D, Goodacre R, Rolin D, Moing A. Anal Chem. 2009; 81:2884–2894. [PubMed: 19298059]
42. Forshed J, Idborg H, Jacobsson SP. Chemom Intell Lab Syst. 2007; 85:102–109.
43. Karaman, Ib, Nørskov, NP., Yde, CC., Hedemann, MS., Bach Knudsen, KE., Kohler, A. Metabolomics. 2015; 11:367–379.
44. Marshall DD, Lei S, Worley B, Huang Y, Garcia-Garcia A, Franco R, Dodds ED, Powers R. Metabolomics. 2015; 11:391–402. [PubMed: 25774104]
45. Siegel RL, Miller KD, Jemal A. Ca-Cancer J Clin. 2015; 65:5–29. [PubMed: 25559415]
46. Piotto M, Moussallieh FM, Dillmann B, Imperiale A, Neuville A, Brigand C, Bellocq JP, Elbayed K, Namer IJ. Metabolomics. 2009; 5:292–301.
47. Denkert C, Budczies J, Weichert W, Wohlgemuth G, Scholz M, Kind T, Niesporek S, Noske A, Buckendahl A, Dietel M, Fiehn O. Mol Cancer. 2008; 7:72. [PubMed: 18799019]
48. Lean CL, Newland RC, Ende DA, Bokey EL, Smith ICP, Mountford CE. Magn Reson Med. 1993; 30:525–533. [PubMed: 8259052]
49. Qiu YP, Cai GX, Su MM, Chen TL, Zheng XJ, Xu Y, Ni Y, Zhao AH, Xu LX, Cai SJ, Jia W. J Proteome Res. 2009; 8:4844–4850. [PubMed: 19678709]
50. Ritchie SA, Ahiahonu PWK, Jayasinghe D, Heath D, Liu J, Lu YS, Jin W, Kavianpour A, Yamazaki Y, Khan AM, Hossain M, Su-Myat KK, Wood PL, Krenitsky K, Takemasa I, Miyake M, Sekimoto M, Monden M, Matsubara H, Nomura F, Goodenowe DB. BMC Med. 2010; 8:13. [PubMed: 20156336]
51. Leichtle AB, Nuoffer JM, Ceglarek U, Kase J, Conrad T, Witzigmann H, Thiery J, Fiedler GM. Metabolomics. 2012; 8:643–653. [PubMed: 22833708]
52. Tan BB, Qiu YP, Zou X, Chen TL, Xie GX, Cheng Y, Dong TT, Zhao LJ, Feng B, Hu XF, Xu LX, Zhao AH, Zhang MH, Cai GX, Cai SJ, Zhou ZX, Zheng MH, Zhang Y, Jia W. J Proteome Res. 2013; 12:3000–3009. [PubMed: 23675754]
53. Gu H, Zhang P, Zhu J, Raftery D. Anal Chem. 2015; 87:12355–12362. [PubMed: 26579731]
54. Gu H, Du J, Carnevale Neto F, Carroll PA, Turner SJ, Chiorean EG, Eisenman RN, Raftery D. Analyst. 2015; 140:2726–2734. [PubMed: 25699545]
55. Chen C, Deng L, Wei S, Nagana Gowda GA, Gu H, Chiorean EG, Abu Zaid M, Harrison ML, Pekny JF, Loehrer PJ, Zhang D, Zhang M, Raftery D. J Proteome Res. 2015; 14:2492–2499. [PubMed: 25919433]
Deng et al. Page 12
Anal Chem. Author manuscript; available in PMC 2017 May 31.
Author M
anuscriptA
uthor Manuscript
Author M
anuscriptA
uthor Manuscript

56. Qiu YP, Cai GX, Su MM, Chen TL, Liu YM, Xu Y, Ni Y, Zhao AH, Cai SJ, Xu LX, Jia W. J Proteome Res. 2010; 9:1627–1634. [PubMed: 20121166]
57. Monleon D, Morales JM, Barrasa A, Lopez JA, Vazquez C, Celda B. NMR Biomed. 2009; 22:342–348. [PubMed: 19006102]
58. Fernández Pierna JA, Abbas O, Baeten V, Dardenne P. Anal Chim Acta. 2009; 642:89–93. [PubMed: 19427462]
59. Rocha, CuM, Carrola, J., Barros, AnS, Gil, AM., Goodfellow, BJ., Carreira, IM., Bernardo, Jo, Gomes, A., Sousa, V., Carvalho, L., Duarte, IF. J Proteome Res. 2011; 10:4314–4324. [PubMed: 21744875]
60. Wei S, Suryani Y, Gowda GAN, Skill N, Maluccio M, Raftery D. Metabolites. 2012; 2:701–716. [PubMed: 24957758]
61. http://www.metabolomicsworkbench.org/.
62. Reyes NL, Banks GB, Tsang M, Margineantu D, Gu H, Djukovic D, Chan J, Torres M, Liggitt HD, Hirenallur-S DK, Hockenbery DM, Raftery D, Iritani BM. Proc Natl Acad Sci U S A. 2015; 112:424–429. [PubMed: 25548157]
63. Sood RF, Gu H, Djukovic D, Deng L, Ga M, Muffley LA, Raftery D, Hocking AM. Wound Repair Regen. 2015; 23:423–434. [PubMed: 25845676]
64. Zhu J, Djukovic D, Deng L, Gu H, Himmati F, Abu Zaid M, Chiorean EG, Raftery D. Anal Bioanal Chem. 2015; 407:7857–7863. [PubMed: 26342311]
65. Barton S, Navarro SL, Buas MF, Schwarz Y, Gu HW, Djukovic D, Raftery D, Kratz M, Neuhouser ML, Lampe JW. Food Funct. 2015; 6:2949–2956. [PubMed: 26165375]
66. Heitkemper MM, Han CJ, Jarrett ME, Gu H, Djukovic D, Shulman RJ, Raftery D, Henderson WA, Cain KC. Biol Res Nurs. 2016; 18:193–198. [PubMed: 26156003]
67. Sperber H, Mathieu J, Wang YL, Ferreccio A, Hesson J, Xu ZJ, Fischer KA, Devi A, Detraux D, Gu HW, Battle SL, Showalter M, Valensisi C, Bielas JH, Ericson NG, Margaretha L, Robitaille AM, Margineantu D, Fiehn O, Hockenbery D, Blau CA, Raftery D, Margolin AA, Hawkins RD, Moon RT, Ware CB, Ruohola-Baker H. Nat Cell Biol. 2015; 17:1523–1535. [PubMed: 26571212]
68. Eisner R, Greiner R, Tso V, Wang HL, Fedorak RN. BioMed Res Int. 2013; 2013:303982. [PubMed: 24307992]
69. Warburg O. Science. 1956; 123:309–314. [PubMed: 13298683]
70. DeBerardinis RJ, Mancuso A, Daikhin E, Nissim I, Yudkoff M, Wehrli S, Thompson CB. Proc Natl Acad Sci U S A. 2007; 104:19345–19350. [PubMed: 18032601]
71. Ratner B. J Target Meas Anal Marketing. 2010; 18:65–75.
72. Guyon I, Elisseeff A. J Mach Learn Res. 2003; 3:1157–1182.
73. Lin L, Finak G, Ushey K, Seshadri C, Hawn TR, Frahm N, Scriba TJ, Mahomed H, Hanekom W, Bart PA, Pantaleo G, Tomaras GD, Rerks-Ngarm S, Kaewkungwal J, Nitayaphan S, Pitisuttithum P, Michael NL, Kim JH, Robb ML, O’Connell RJ, Karasavvas N, Gilbert P, De Rosa SC, McElrath MJ, Gottardo R. Nat Biotechnol. 2015; 33:610–616. [PubMed: 26006008]
74. Acharjee A, Finkers R, Visser RG, Maliepaard C. Metabolomics: Open Access. 2013; 3:1000126.
75. O’Hara RB, Sillanpaa MJ. Bayesian Anal. 2009; 4:85–117.
76. Fan JQ, Lv JC. Stat Sin. 2010; 20:101–148. [PubMed: 21572976]
77. Wold S, Kettaneh N, Tjessem K. J Chemom. 1996; 10:463–482.
Deng et al. Page 13
Anal Chem. Author manuscript; available in PMC 2017 May 31.
Author M
anuscriptA
uthor Manuscript
Author M
anuscriptA
uthor Manuscript

Figure 1. Flowchart indicating the steps for MCCV-BVE-PLSDA.
Deng et al. Page 14
Anal Chem. Author manuscript; available in PMC 2017 May 31.
Author M
anuscriptA
uthor Manuscript
Author M
anuscriptA
uthor Manuscript

Figure 2. (a) Correlation between all NMR and MS variables. (b) Correlation between the subset of
metabolites (labeled in the figure) that can be detected by both NMR and MS. The X axis
provides an index of all NMR variables in the data matrix, and the Y axis provides an index
of all MS variables in the data matrix. The metabolites are listed in Tables S1 (NMR) and S3
(MS, highlighted).
Deng et al. Page 15
Anal Chem. Author manuscript; available in PMC 2017 May 31.
Author M
anuscriptA
uthor Manuscript
Author M
anuscriptA
uthor Manuscript

Figure 3. (a) Results of MCCV-BVE-PLSDA for selecting a subset of variables to differentiate CRC
from healthy controls, using NMR (solid red line), MS (dashed green line), and NMR–MS
(dotted blue line) data. (b) Classification accuracy of true class (red dots) and random
permutation (blue squares) models in MCCV, when the selected set of variables was used for
MCCV-BVE-PLSDA modeling in panel a. (c) Results of MCCV-BVE-PLSDA for selecting
a subset of variables to differentiate healthy controls from polyp patients, using NMR (solid
red line), MS (dashed green line), and NMR–MS (dotted blue line) data. (d) Classification
accuracy of true class (red dots) and random permutation (blue squares) models in MCCV,
when the selected set of variables was used for MCCV-BVE-PLSDA modeling in panel c.
Deng et al. Page 16
Anal Chem. Author manuscript; available in PMC 2017 May 31.
Author M
anuscriptA
uthor Manuscript
Author M
anuscriptA
uthor Manuscript

Figure 4. Results of MCCV-BVE-PLSDA (AUROC) in selecting a subset of variables using the NMR
(solid red line), MS (dashed green line), and NMR–MS (dotted blue line) data to compare
(a) healthy controls vs CRC, (b) polyps vs CRC, and (c) healthy controls vs polyps. MCCV-
BVE-PLSDA (AUROC) is the same as MCCV-BVE-PLSDA but uses AUROC values to
estimate the classification performance.
Deng et al. Page 17
Anal Chem. Author manuscript; available in PMC 2017 May 31.
Author M
anuscriptA
uthor Manuscript
Author M
anuscriptA
uthor Manuscript

Figure 5. Metabolism pathway diagram showing important metabolites in the NMR–MS data for the
pairwise comparisons among CRC, polyps, and healthy controls. The NMR metabolites are
highlighted with red stars; the MS metabolites are highlighted with blue circles.
Deng et al. Page 18
Anal Chem. Author manuscript; available in PMC 2017 May 31.
Author M
anuscriptA
uthor Manuscript
Author M
anuscriptA
uthor Manuscript

Author M
anuscriptA
uthor Manuscript
Author M
anuscriptA
uthor Manuscript
Deng et al. Page 19
Table 1
Summary of Demographic and Clinical Information of Subjects Recruited and Analyzed for This Study
healthy controls polyps CRC
no. of samples (no. of patients) 55 (55) 44 (44) 28 (28)
age, mean (range) 52.8 (21–74) 56.1 (39–68) 55.3 (27–86)
gender
male 25 23 16
female 30 21 12
no. of polyps
0–5 – 26 –
6–9 – 4 –
10–15 – 3 –
≥16 – 11 –
cancer stage
stage I/II – – 3
stage III – – 8
stage IV – – 17
diagnosis
colon cancer – 19
rectal cancer – 9
ethnicity
Caucasian 50 23 15
African American 4 1 2
Asian 0 1 0
NAa 1 19 11
aInformation not available.
Anal Chem. Author manuscript; available in PMC 2017 May 31.
Author M
anuscriptA
uthor Manuscript
Author M
anuscriptA
uthor Manuscript
Deng et al. Page 20
Tab
le 2
Sum
mar
y of
the
Subs
ets
of M
etab
olite
s an
d T
heir
Sta
tistic
al P
erfo
rman
ce in
the
Pair
wis
e C
ompa
riso
ns a
mon
g C
RC
, Pol
yps,
and
Hea
lthy
Con
trol
s
clas
sifi
catio
n ac
cura
cya
sam
ples
data
set
tota
l no.
of
vari
able
sno
. of
MC
CV
-BV
E-P
LSD
A-s
elec
ted
vari
able
sal
l var
iabl
es
clas
sifi
cati
on a
ccur
acya
subs
et s
elec
ted
by M
CC
V-B
VE
-PL
SDA
CR
C v
s co
ntro
lsN
MR
707
0.71
(0.0
8)0.
84(0
.07)
MS
113
190.
80(0
.07)
0.93
(0.0
5)
NM
R–M
S18
331
0.79
(0.0
8)0.
95(0
.05)
CR
C v
s po
lyps
NM
R70
110.
72(0
.08)
0.83
(0.0
7)
MS
113
210.
82(0
.07)
0.95
(0.0
4)
NM
R–M
S18
330
0.82
(0.0
8)0.
98(0
.02)
poly
ps v
s co
ntro
lsN
MR
703
0.55
(0.0
7)0.
67(0
.08)
MS
113
60.
56(0
.07)
0.71
(0.0
7)
NM
R–M
S18
313
0.57
(0.0
8)0.
74(0
.07)
a The
num
bers
in p
aren
thes
es a
re th
e st
anda
rd d
evia
tion
valu
es o
f th
e cl
assi
fica
tion
accu
racy
val
ues
from
iter
atio
n ca
lcul
atio
ns.
Anal Chem. Author manuscript; available in PMC 2017 May 31.
Related Documents