Polymorphisms in the WNK1 Gene Are Associated with Blood Pressure Variation and Urinary Potassium Excretion Stephen Newhouse 1 , Martin Farrall 2 , Chris Wallace 1 , Mimoza Hoti 1 , Beverley Burke 1 , Philip Howard 1 , Abiodun Onipinla 1 , Kate Lee 1 , Sue Shaw-Hawkins 1 , Richard Dobson 1 , Morris Brown 3 , Nilesh J. Samani 4 , Anna F. Dominiczak 5 , John M. Connell 5 , G. Mark Lathrop 6 , Jaspal Kooner 7 , John Chambers 7 , Paul Elliott 7 , Robert Clarke 8 , Rory Collins 8 , Maris Laan 9 , Elin Org 9 , Peeter Juhanson 9 , Gudrun Veldre 10,11 , Margus Viigimaa 11 , Susana Eyheramendy 12 , Francesco P. Cappuccio 13 , Chen Ji 13 , Roberto Iacone 14 , Pasquale Strazzullo 14 , Meena Kumari 15 , Michael Marmot 15 , Eric Brunner 15 , Mark Caulfield 1 , Patricia B. Munroe 1 * 1 Clinical Pharmacology and Barts and the London Genome Centre, William Harvey Research Institute, Barts and the London School of Medicine, Queen Mary University of London, London, United Kingdom, 2 Department of Cardiovascular Medicine, University of Oxford, Wellcome Trust Centre for Human Genetics, Oxford, United Kingdom, 3 Clinical Pharmacology and the Cambridge Institute of Medical Research, University of Cambridge, Addenbrooke’s Hospital, Cambridge, United Kingdom, 4 Department of Cardiovascular Sciences, University of Leicester, Glenfield Hospital, Leicester, United Kingdom, 5 BHF Glasgow Cardiovascular Research Centre, Division of Cardiovascular and Medical Sciences, University of Glasgow, Western Infirmary, Glasgow, United Kingdom, 6 Centre National de Genotypage, Evry, France, 7 National Heart and Lung Institute, Faculty of Medicine, Imperial College London, London, United Kingdom, 8 Clinical Trial Service Unit and Epidemiological Studies Unit, University of Oxford, Oxford, United Kingdom, 9 Institute of Molecular and Cell Biology, University of Tartu, Tartu, Estonia, 10 Department of Cardiology and Institute of Molecular and Cell Biology, University of Tartu, Tartu, Estonia, 11 Centre of Cardiology, North Estonia Medical Centre, Tallinn, Estonia, 12 Department of Statistics, Pontificia Universidad Catolica de Chile, Santiago, Chile, 13 Clinical Sciences Research Institute, Warwick Medical School, Coventry, United Kingdom, 14 Department of Clinical & Experimental Medicine, Federico II University of Naples Medical School, Naples, Italy, 15 Department of Epidemiology and Public Health, University College London, London, United Kingdom Abstract WNK1 - a serine/threonine kinase involved in electrolyte homeostasis and blood pressure (BP) control - is an excellent candidate gene for essential hypertension (EH). We and others have previously reported association between WNK1 and BP variation. Using tag SNPs (tSNPs) that capture 100% of common WNK1 variation in HapMap, we aimed to replicate our findings with BP and to test for association with phenotypes relating to WNK1 function in the British Genetics of Hypertension (BRIGHT) study case-control resource (1700 hypertensive cases and 1700 normotensive controls). We found multiple variants to be associated with systolic blood pressure, SBP (7/28 tSNPs min-p = 0.0005), diastolic blood pressure, DBP (7/28 tSNPs min-p = 0.002) and 24 hour urinary potassium excretion (10/28 tSNPs min-p = 0.0004). Associations with SBP and urine potassium remained significant after correction for multiple testing (p = 0.02 and p = 0.01 respectively). The major allele (A) of rs765250, located in intron 1, demonstrated the strongest evidence for association with SBP, effect size 3.14 mmHg (95%CI:1.23–4.9), DBP 1.9 mmHg (95%CI:0.7–3.2) and hypertension, odds ratio (OR: 1.3 [95%CI: 1.0–1.7]).We genotyped this variant in six independent populations (n = 14,451) and replicated the association between rs765250 and SBP in a meta-analysis (p = 7 6 10 23 , combined with BRIGHT data-set p = 2 6 10 24 , n = 17,851). The associations of WNK1 with DBP and EH were not confirmed. Haplotype analysis revealed striking associations with hypertension and BP variation (global permutation p,10 27 ). We identified several common haplotypes to be associated with increased BP and multiple low frequency haplotypes significantly associated with lower BP (.10 mmHg reduction) and risk for hypertension (OR,0.60). Our data indicates that multiple rare and common WNK1 variants contribute to BP variation and hypertension, and provide compelling evidence to initiate further genetic and functional studies to explore the role of WNK1 in BP regulation and EH. Citation: Newhouse S, Farrall M, Wallace C, Hoti M, Burke B, et al. (2009) Polymorphisms in the WNK1 Gene Are Associated with Blood Pressure Variation and Urinary Potassium Excretion. PLoS ONE 4(4): e5003. doi:10.1371/journal.pone.0005003 Editor: Florian Kronenberg, Innsbruck Medical University, Austria Received December 16, 2008; Accepted February 5, 2009; Published April 4, 2009 Copyright: ß 2009 Newhouse et al. This is an open-access article distributed under the terms of the Creative Commons Attribution License, which permits unrestricted use, distribution, and reproduction in any medium, provided the original author and source are credited. Funding: The HYPEST sample collection was financed by Wellcome Trust International Senior Research Fellowship to Maris Laan (grant no. 070191/Z/03/Z) in Biomedical Science in Central Europe and by Estonian Ministry of Education and Science core grant no. 0182721s06. The BRIGHT study and current work are supported by the Medical Research Council of Great Britain (grant number; G9521010D) and the British Heart Foundation (grant number PG02/128). CW is funded by the British Heart Foundation (grant number: FS/05/061/19501). SJN is funded by the Medical Research Council and The William Harvey Research Foundation. Profs Dominiczak and Samani are British Heart Foundation Chairholders. The LOLIPOP Study was funded by the British Heart Foundation. The Whitehall II study has been supported by grants from the Medical Research Council; Economic and Social Research Council; British Heart Foundation; Health and Safety Executive; Department of Health; National Heart Lung and Blood Institute (HL36310), US, NIH: National Institute on Aging (AG13196), US, NIH; Agency for Health Care Policy Research (HS06516); and the John D and Catherine T MacArthur Foundation Research Networks on Successful Midlife Development and Socio-economic Status and Health. Samples from the English Longitudinal Study of Ageing (ELSA) DNA Repository (EDNAR), received support under a grant (AG1764406S1) awarded by the National Institute on Aging (NIA). ELSA was developed by a team of researchers based at the National Centre for Social Research, University College London and the Institute of Fiscal Studies. The data were collected by the National Centre for Social Research. The developers and funders of ELSA and the Archive do not bear any responsibility for the analyses or interpretations presented here. Michael Marmot is supported by a MRC Research Professorship. The Whitehall-1 study was supported by the British Heart Foundation and Medical Research Council. The funders of this work did not take part in study design, data collection, or analysis of these data. In addition, none of the funders took part in the decision to publish, or in preparation of this manuscript. Competing Interests: The authors have declared that no competing interests exist. * E-mail: [email protected] PLoS ONE | www.plosone.org 1 April 2009 | Volume 4 | Issue 4 | e5003

Welcome message from author
This document is posted to help you gain knowledge. Please leave a comment to let me know what you think about it! Share it to your friends and learn new things together.
Transcript
Polymorphisms in the WNK1 Gene Are Associated withBlood Pressure Variation and Urinary Potassium ExcretionStephen Newhouse1, Martin Farrall2, Chris Wallace1, Mimoza Hoti1, Beverley Burke1, Philip Howard1,
Abiodun Onipinla1, Kate Lee1, Sue Shaw-Hawkins1, Richard Dobson1, Morris Brown3, Nilesh J. Samani4,
Anna F. Dominiczak5, John M. Connell5, G. Mark Lathrop6, Jaspal Kooner7, John Chambers7, Paul Elliott7,
Robert Clarke8, Rory Collins8, Maris Laan9, Elin Org9, Peeter Juhanson9, Gudrun Veldre10,11, Margus
Viigimaa11, Susana Eyheramendy12, Francesco P. Cappuccio13, Chen Ji13, Roberto Iacone14, Pasquale
Strazzullo14, Meena Kumari15, Michael Marmot15, Eric Brunner15, Mark Caulfield1, Patricia B. Munroe1*
1 Clinical Pharmacology and Barts and the London Genome Centre, William Harvey Research Institute, Barts and the London School of Medicine, Queen Mary University of
London, London, United Kingdom, 2 Department of Cardiovascular Medicine, University of Oxford, Wellcome Trust Centre for Human Genetics, Oxford, United Kingdom,
3 Clinical Pharmacology and the Cambridge Institute of Medical Research, University of Cambridge, Addenbrooke’s Hospital, Cambridge, United Kingdom, 4 Department
of Cardiovascular Sciences, University of Leicester, Glenfield Hospital, Leicester, United Kingdom, 5 BHF Glasgow Cardiovascular Research Centre, Division of
Cardiovascular and Medical Sciences, University of Glasgow, Western Infirmary, Glasgow, United Kingdom, 6 Centre National de Genotypage, Evry, France, 7 National
Heart and Lung Institute, Faculty of Medicine, Imperial College London, London, United Kingdom, 8 Clinical Trial Service Unit and Epidemiological Studies Unit, University
of Oxford, Oxford, United Kingdom, 9 Institute of Molecular and Cell Biology, University of Tartu, Tartu, Estonia, 10 Department of Cardiology and Institute of Molecular
and Cell Biology, University of Tartu, Tartu, Estonia, 11 Centre of Cardiology, North Estonia Medical Centre, Tallinn, Estonia, 12 Department of Statistics, Pontificia
Universidad Catolica de Chile, Santiago, Chile, 13 Clinical Sciences Research Institute, Warwick Medical School, Coventry, United Kingdom, 14 Department of Clinical &
Experimental Medicine, Federico II University of Naples Medical School, Naples, Italy, 15 Department of Epidemiology and Public Health, University College London,
London, United Kingdom
Abstract
WNK1 - a serine/threonine kinase involved in electrolyte homeostasis and blood pressure (BP) control - is an excellent candidategene for essential hypertension (EH). We and others have previously reported association between WNK1 and BP variation.Using tag SNPs (tSNPs) that capture 100% of common WNK1 variation in HapMap, we aimed to replicate our findings with BPand to test for association with phenotypes relating to WNK1 function in the British Genetics of Hypertension (BRIGHT) studycase-control resource (1700 hypertensive cases and 1700 normotensive controls). We found multiple variants to be associatedwith systolic blood pressure, SBP (7/28 tSNPs min-p = 0.0005), diastolic blood pressure, DBP (7/28 tSNPs min-p = 0.002) and24 hour urinary potassium excretion (10/28 tSNPs min-p = 0.0004). Associations with SBP and urine potassium remainedsignificant after correction for multiple testing (p = 0.02 and p = 0.01 respectively). The major allele (A) of rs765250, located inintron 1, demonstrated the strongest evidence for association with SBP, effect size 3.14 mmHg (95%CI:1.23–4.9), DBP 1.9 mmHg(95%CI:0.7–3.2) and hypertension, odds ratio (OR: 1.3 [95%CI: 1.0–1.7]).We genotyped this variant in six independentpopulations (n = 14,451) and replicated the association between rs765250 and SBP in a meta-analysis (p = 761023, combinedwith BRIGHT data-set p = 261024, n = 17,851). The associations of WNK1 with DBP and EH were not confirmed. Haplotypeanalysis revealed striking associations with hypertension and BP variation (global permutation p,1027). We identified severalcommon haplotypes to be associated with increased BP and multiple low frequency haplotypes significantly associated withlower BP (.10 mmHg reduction) and risk for hypertension (OR,0.60). Our data indicates that multiple rare and common WNK1variants contribute to BP variation and hypertension, and provide compelling evidence to initiate further genetic and functionalstudies to explore the role of WNK1 in BP regulation and EH.
Citation: Newhouse S, Farrall M, Wallace C, Hoti M, Burke B, et al. (2009) Polymorphisms in the WNK1 Gene Are Associated with Blood Pressure Variation and UrinaryPotassium Excretion. PLoS ONE 4(4): e5003. doi:10.1371/journal.pone.0005003
Editor: Florian Kronenberg, Innsbruck Medical University, Austria
Received December 16, 2008; Accepted February 5, 2009; Published April 4, 2009
Copyright: � 2009 Newhouse et al. This is an open-access article distributed under the terms of the Creative Commons Attribution License, which permitsunrestricted use, distribution, and reproduction in any medium, provided the original author and source are credited.
Funding: The HYPEST sample collection was financed by Wellcome Trust International Senior Research Fellowship to Maris Laan (grant no. 070191/Z/03/Z) inBiomedical Science in Central Europe and by Estonian Ministry of Education and Science core grant no. 0182721s06. The BRIGHT study and current work aresupported by the Medical Research Council of Great Britain (grant number; G9521010D) and the British Heart Foundation (grant number PG02/128). CW is fundedby the British Heart Foundation (grant number: FS/05/061/19501). SJN is funded by the Medical Research Council and The William Harvey Research Foundation.Profs Dominiczak and Samani are British Heart Foundation Chairholders. The LOLIPOP Study was funded by the British Heart Foundation. The Whitehall II studyhas been supported by grants from the Medical Research Council; Economic and Social Research Council; British Heart Foundation; Health and Safety Executive;Department of Health; National Heart Lung and Blood Institute (HL36310), US, NIH: National Institute on Aging (AG13196), US, NIH; Agency for Health Care PolicyResearch (HS06516); and the John D and Catherine T MacArthur Foundation Research Networks on Successful Midlife Development and Socio-economic Statusand Health. Samples from the English Longitudinal Study of Ageing (ELSA) DNA Repository (EDNAR), received support under a grant (AG1764406S1) awarded bythe National Institute on Aging (NIA). ELSA was developed by a team of researchers based at the National Centre for Social Research, University College Londonand the Institute of Fiscal Studies. The data were collected by the National Centre for Social Research. The developers and funders of ELSA and the Archive do notbear any responsibility for the analyses or interpretations presented here. Michael Marmot is supported by a MRC Research Professorship. The Whitehall-1 studywas supported by the British Heart Foundation and Medical Research Council. The funders of this work did not take part in study design, data collection, oranalysis of these data. In addition, none of the funders took part in the decision to publish, or in preparation of this manuscript.
Competing Interests: The authors have declared that no competing interests exist.
* E-mail: [email protected]
PLoS ONE | www.plosone.org 1 April 2009 | Volume 4 | Issue 4 | e5003
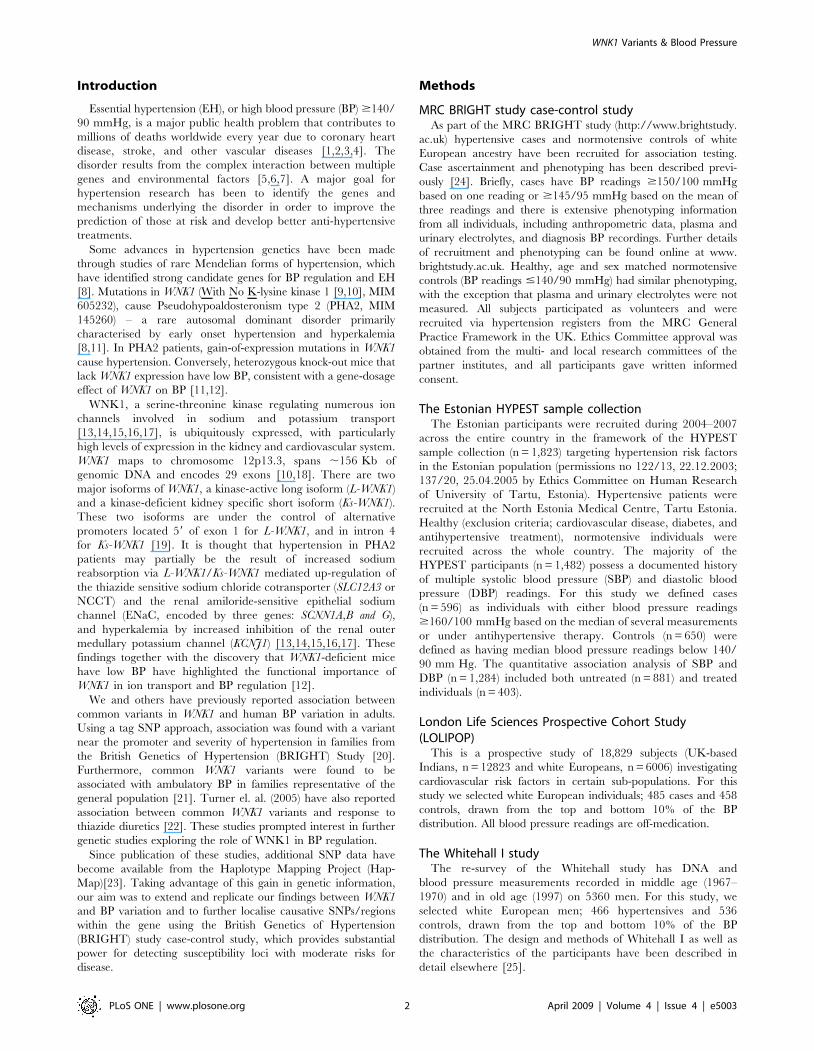
Introduction
Essential hypertension (EH), or high blood pressure (BP) $140/
90 mmHg, is a major public health problem that contributes to
millions of deaths worldwide every year due to coronary heart
disease, stroke, and other vascular diseases [1,2,3,4]. The
disorder results from the complex interaction between multiple
genes and environmental factors [5,6,7]. A major goal for
hypertension research has been to identify the genes and
mechanisms underlying the disorder in order to improve the
prediction of those at risk and develop better anti-hypertensive
treatments.
Some advances in hypertension genetics have been made
through studies of rare Mendelian forms of hypertension, which
have identified strong candidate genes for BP regulation and EH
[8]. Mutations in WNK1 (With No K-lysine kinase 1 [9,10], MIM
605232), cause Pseudohypoaldosteronism type 2 (PHA2, MIM
145260) – a rare autosomal dominant disorder primarily
characterised by early onset hypertension and hyperkalemia
[8,11]. In PHA2 patients, gain-of-expression mutations in WNK1
cause hypertension. Conversely, heterozygous knock-out mice that
lack WNK1 expression have low BP, consistent with a gene-dosage
effect of WNK1 on BP [11,12].
WNK1, a serine-threonine kinase regulating numerous ion
channels involved in sodium and potassium transport
[13,14,15,16,17], is ubiquitously expressed, with particularly
high levels of expression in the kidney and cardiovascular system.
WNK1 maps to chromosome 12p13.3, spans ,156 Kb of
genomic DNA and encodes 29 exons [10,18]. There are two
major isoforms of WNK1, a kinase-active long isoform (L-WNK1)
and a kinase-deficient kidney specific short isoform (Ks-WNK1).
These two isoforms are under the control of alternative
promoters located 59 of exon 1 for L-WNK1, and in intron 4
for Ks-WNK1 [19]. It is thought that hypertension in PHA2
patients may partially be the result of increased sodium
reabsorption via L-WNK1/Ks-WNK1 mediated up-regulation of
the thiazide sensitive sodium chloride cotransporter (SLC12A3 or
NCCT) and the renal amiloride-sensitive epithelial sodium
channel (ENaC, encoded by three genes: SCNN1A,B and G),
and hyperkalemia by increased inhibition of the renal outer
medullary potassium channel (KCNJ1) [13,14,15,16,17]. These
findings together with the discovery that WNK1-deficient mice
have low BP have highlighted the functional importance of
WNK1 in ion transport and BP regulation [12].
We and others have previously reported association between
common variants in WNK1 and human BP variation in adults.
Using a tag SNP approach, association was found with a variant
near the promoter and severity of hypertension in families from
the British Genetics of Hypertension (BRIGHT) Study [20].
Furthermore, common WNK1 variants were found to be
associated with ambulatory BP in families representative of the
general population [21]. Turner el. al. (2005) have also reported
association between common WNK1 variants and response to
thiazide diuretics [22]. These studies prompted interest in further
genetic studies exploring the role of WNK1 in BP regulation.
Since publication of these studies, additional SNP data have
become available from the Haplotype Mapping Project (Hap-
Map)[23]. Taking advantage of this gain in genetic information,
our aim was to extend and replicate our findings between WNK1
and BP variation and to further localise causative SNPs/regions
within the gene using the British Genetics of Hypertension
(BRIGHT) study case-control study, which provides substantial
power for detecting susceptibility loci with moderate risks for
disease.
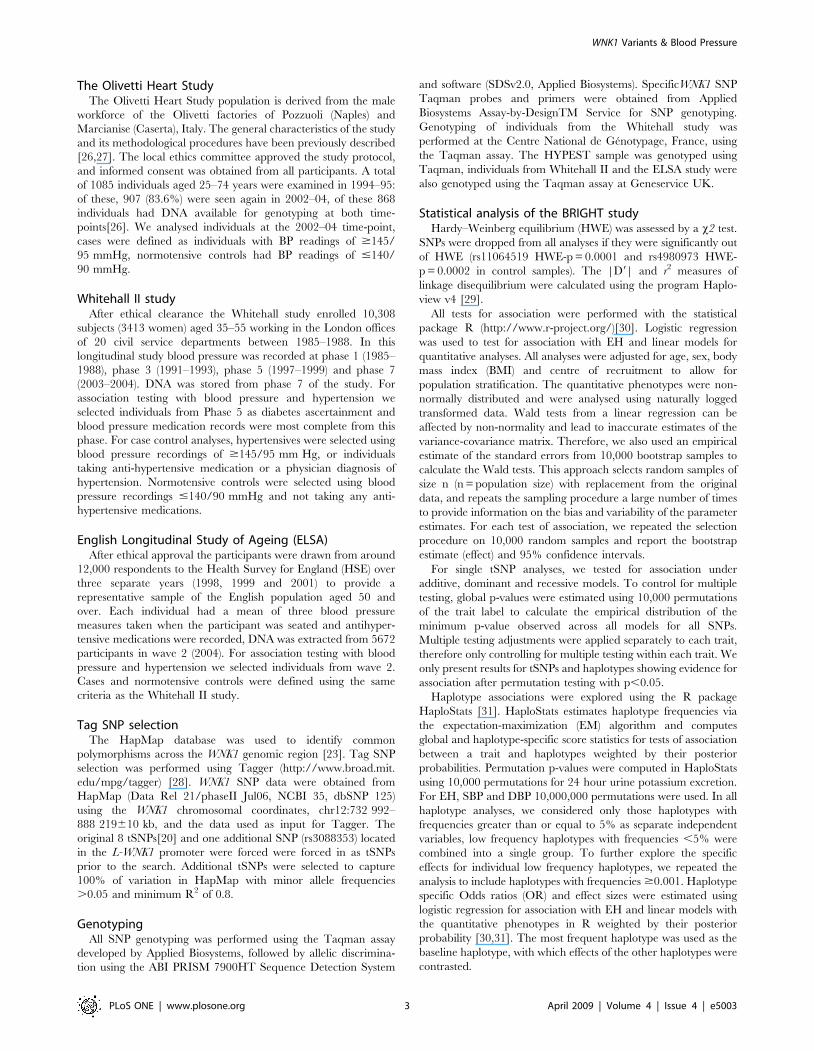
Methods
MRC BRIGHT study case-control studyAs part of the MRC BRIGHT study (http://www.brightstudy.
ac.uk) hypertensive cases and normotensive controls of white
European ancestry have been recruited for association testing.
Case ascertainment and phenotyping has been described previ-
ously [24]. Briefly, cases have BP readings $150/100 mmHg
based on one reading or $145/95 mmHg based on the mean of
three readings and there is extensive phenotyping information
from all individuals, including anthropometric data, plasma and
urinary electrolytes, and diagnosis BP recordings. Further details
of recruitment and phenotyping can be found online at www.
brightstudy.ac.uk. Healthy, age and sex matched normotensive
controls (BP readings #140/90 mmHg) had similar phenotyping,
with the exception that plasma and urinary electrolytes were not
measured. All subjects participated as volunteers and were
recruited via hypertension registers from the MRC General
Practice Framework in the UK. Ethics Committee approval was
obtained from the multi- and local research committees of the
partner institutes, and all participants gave written informed
consent.
The Estonian HYPEST sample collectionThe Estonian participants were recruited during 2004–2007
across the entire country in the framework of the HYPEST
sample collection (n = 1,823) targeting hypertension risk factors
in the Estonian population (permissions no 122/13, 22.12.2003;
137/20, 25.04.2005 by Ethics Committee on Human Research
of University of Tartu, Estonia). Hypertensive patients were
recruited at the North Estonia Medical Centre, Tartu Estonia.
Healthy (exclusion criteria; cardiovascular disease, diabetes, and
antihypertensive treatment), normotensive individuals were
recruited across the whole country. The majority of the
HYPEST participants (n = 1,482) possess a documented history
of multiple systolic blood pressure (SBP) and diastolic blood
pressure (DBP) readings. For this study we defined cases
(n = 596) as individuals with either blood pressure readings
$160/100 mmHg based on the median of several measurements
or under antihypertensive therapy. Controls (n = 650) were
defined as having median blood pressure readings below 140/
90 mm Hg. The quantitative association analysis of SBP and
DBP (n = 1,284) included both untreated (n = 881) and treated
individuals (n = 403).
London Life Sciences Prospective Cohort Study(LOLIPOP)
This is a prospective study of 18,829 subjects (UK-based
Indians, n = 12823 and white Europeans, n = 6006) investigating
cardiovascular risk factors in certain sub-populations. For this
study we selected white European individuals; 485 cases and 458
controls, drawn from the top and bottom 10% of the BP
distribution. All blood pressure readings are off-medication.
The Whitehall I studyThe re-survey of the Whitehall study has DNA and
blood pressure measurements recorded in middle age (1967–
1970) and in old age (1997) on 5360 men. For this study, we
selected white European men; 466 hypertensives and 536
controls, drawn from the top and bottom 10% of the BP
distribution. The design and methods of Whitehall I as well as
the characteristics of the participants have been described in
detail elsewhere [25].
WNK1 Variants & Blood Pressure
PLoS ONE | www.plosone.org 2 April 2009 | Volume 4 | Issue 4 | e5003
The Olivetti Heart StudyThe Olivetti Heart Study population is derived from the male
workforce of the Olivetti factories of Pozzuoli (Naples) and
Marcianise (Caserta), Italy. The general characteristics of the study
and its methodological procedures have been previously described
[26,27]. The local ethics committee approved the study protocol,
and informed consent was obtained from all participants. A total
of 1085 individuals aged 25–74 years were examined in 1994–95:
of these, 907 (83.6%) were seen again in 2002–04, of these 868
individuals had DNA available for genotyping at both time-
points[26]. We analysed individuals at the 2002–04 time-point,
cases were defined as individuals with BP readings of $145/
95 mmHg, normotensive controls had BP readings of #140/
90 mmHg.
Whitehall II studyAfter ethical clearance the Whitehall study enrolled 10,308
subjects (3413 women) aged 35–55 working in the London offices
of 20 civil service departments between 1985–1988. In this
longitudinal study blood pressure was recorded at phase 1 (1985–
1988), phase 3 (1991–1993), phase 5 (1997–1999) and phase 7
(2003–2004). DNA was stored from phase 7 of the study. For
association testing with blood pressure and hypertension we
selected individuals from Phase 5 as diabetes ascertainment and
blood pressure medication records were most complete from this
phase. For case control analyses, hypertensives were selected using
blood pressure recordings of $145/95 mm Hg, or individuals
taking anti-hypertensive medication or a physician diagnosis of
hypertension. Normotensive controls were selected using blood
pressure recordings #140/90 mmHg and not taking any anti-
hypertensive medications.
English Longitudinal Study of Ageing (ELSA)After ethical approval the participants were drawn from around
12,000 respondents to the Health Survey for England (HSE) over
three separate years (1998, 1999 and 2001) to provide a
representative sample of the English population aged 50 and
over. Each individual had a mean of three blood pressure
measures taken when the participant was seated and antihyper-
tensive medications were recorded, DNA was extracted from 5672
participants in wave 2 (2004). For association testing with blood
pressure and hypertension we selected individuals from wave 2.
Cases and normotensive controls were defined using the same
criteria as the Whitehall II study.
Tag SNP selectionThe HapMap database was used to identify common
polymorphisms across the WNK1 genomic region [23]. Tag SNP
selection was performed using Tagger (http://www.broad.mit.
edu/mpg/tagger) [28]. WNK1 SNP data were obtained from
HapMap (Data Rel 21/phaseII Jul06, NCBI 35, dbSNP 125)
using the WNK1 chromosomal coordinates, chr12:732 992–
888 219610 kb, and the data used as input for Tagger. The
original 8 tSNPs[20] and one additional SNP (rs3088353) located
in the L-WNK1 promoter were forced were forced in as tSNPs
prior to the search. Additional tSNPs were selected to capture
100% of variation in HapMap with minor allele frequencies
.0.05 and minimum R2 of 0.8.
GenotypingAll SNP genotyping was performed using the Taqman assay
developed by Applied Biosystems, followed by allelic discrimina-
tion using the ABI PRISM 7900HT Sequence Detection System
and software (SDSv2.0, Applied Biosystems). SpecificWNK1 SNP
Taqman probes and primers were obtained from Applied
Biosystems Assay-by-DesignTM Service for SNP genotyping.
Genotyping of individuals from the Whitehall study was
performed at the Centre National de Genotypage, France, using
the Taqman assay. The HYPEST sample was genotyped using
Taqman, individuals from Whitehall II and the ELSA study were
also genotyped using the Taqman assay at Geneservice UK.
Statistical analysis of the BRIGHT studyHardy–Weinberg equilibrium (HWE) was assessed by a x2 test.
SNPs were dropped from all analyses if they were significantly out
of HWE (rs11064519 HWE-p = 0.0001 and rs4980973 HWE-
p = 0.0002 in control samples). The |D9| and r2 measures of
linkage disequilibrium were calculated using the program Haplo-
view v4 [29].
All tests for association were performed with the statistical
package R (http://www.r-project.org/)[30]. Logistic regression
was used to test for association with EH and linear models for
quantitative analyses. All analyses were adjusted for age, sex, body
mass index (BMI) and centre of recruitment to allow for
population stratification. The quantitative phenotypes were non-
normally distributed and were analysed using naturally logged
transformed data. Wald tests from a linear regression can be
affected by non-normality and lead to inaccurate estimates of the
variance-covariance matrix. Therefore, we also used an empirical
estimate of the standard errors from 10,000 bootstrap samples to
calculate the Wald tests. This approach selects random samples of
size n (n = population size) with replacement from the original
data, and repeats the sampling procedure a large number of times
to provide information on the bias and variability of the parameter
estimates. For each test of association, we repeated the selection
procedure on 10,000 random samples and report the bootstrap
estimate (effect) and 95% confidence intervals.
For single tSNP analyses, we tested for association under
additive, dominant and recessive models. To control for multiple
testing, global p-values were estimated using 10,000 permutations
of the trait label to calculate the empirical distribution of the
minimum p-value observed across all models for all SNPs.
Multiple testing adjustments were applied separately to each trait,
therefore only controlling for multiple testing within each trait. We
only present results for tSNPs and haplotypes showing evidence for
association after permutation testing with p,0.05.
Haplotype associations were explored using the R package
HaploStats [31]. HaploStats estimates haplotype frequencies via
the expectation-maximization (EM) algorithm and computes
global and haplotype-specific score statistics for tests of association
between a trait and haplotypes weighted by their posterior
probabilities. Permutation p-values were computed in HaploStats
using 10,000 permutations for 24 hour urine potassium excretion.
For EH, SBP and DBP 10,000,000 permutations were used. In all
haplotype analyses, we considered only those haplotypes with
frequencies greater than or equal to 5% as separate independent
variables, low frequency haplotypes with frequencies ,5% were
combined into a single group. To further explore the specific
effects for individual low frequency haplotypes, we repeated the
analysis to include haplotypes with frequencies $0.001. Haplotype
specific Odds ratios (OR) and effect sizes were estimated using
logistic regression for association with EH and linear models with
the quantitative phenotypes in R weighted by their posterior
probability [30,31]. The most frequent haplotype was used as the
baseline haplotype, with which effects of the other haplotypes were
contrasted.
WNK1 Variants & Blood Pressure
PLoS ONE | www.plosone.org 3 April 2009 | Volume 4 | Issue 4 | e5003
For the quantitative analyses with diagnosis BP (off-medication
and therefore not confounded by the effects of drug treatment),
data were available on 1183 cases and 1700 controls. These blood
pressure readings were obtained from GP records at the time of
their diagnosis. Mean BP levels from three readings for the 1183
cases and 1700 controls were used. For the biochemical
phenotypes, analyses were performed in cases only, and these
were on medication measures. No biochemical data were available
for the control population. We did not have acidified urine for
measuring urinary calcium or measures of serum potassium in the
BRIGHT cases.
Statistical analyses in replication cohorts and metaanalyses
For quantitative association analysis of SBP and DBP, we
corrected BP values for the effects of BP lowering therapies
(where appropriate) using the method described by Tobin and
colleagues [32,33] -. for individuals on antihypertensive medi-
cation, we adjusted systolic and diastolic blood pressure
measures by adding 15 mm Hg to systolic and 10 mm Hg to
diastolic readings.
We then tested for association with BP variation and EH in each
cohort separately using 10,000 bootstrap samples. To avoid multiple
testing issues we analysed the data under a dominant model with the
prior hypothesis that carriers of rs765250 [A] (A/A+A/G verses G/
G) would have higher BP levels and be at increased risk for EH
compared to G/G homozygotes, as determined from our primary
analysis in the BRIGHT study case-control resource. As we are
testing a specific hypothesis we report one-tailed p-values for the
replication cohorts. We declare replication if the association is in the
same direction with one-tailed p,0.05. Results were combined in a
meta-analysis under a fixed effect model in R. Tests of heterogeneity
were also evaluated using the I2 statistic [34]. If there was any
statistical evidence for heterogeneity (p,0.05) then the analysis was
repeated using a random-effects model, which includes a measure of
variance between studies.
Results
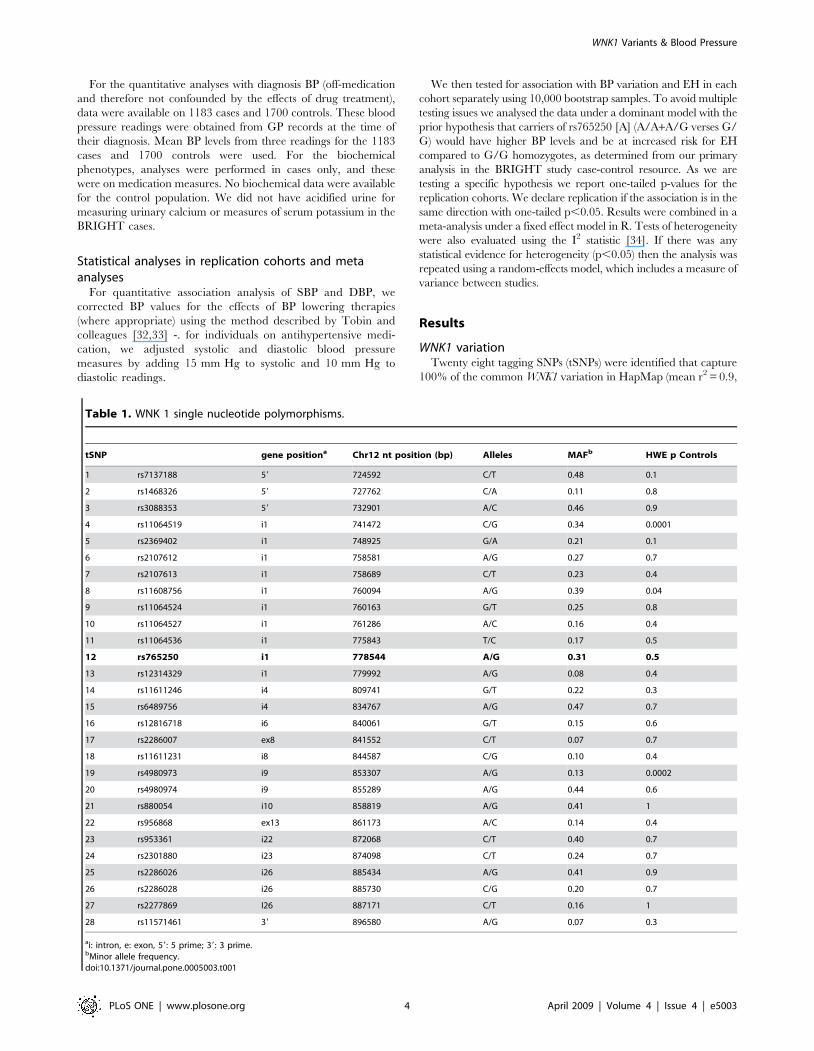
WNK1 variationTwenty eight tagging SNPs (tSNPs) were identified that capture
100% of the common WNK1 variation in HapMap (mean r2 = 0.9,
Table 1. WNK 1 single nucleotide polymorphisms.
tSNP gene positiona Chr12 nt position (bp) Alleles MAFb HWE p Controls
1 rs7137188 59 724592 C/T 0.48 0.1
2 rs1468326 59 727762 C/A 0.11 0.8
3 rs3088353 59 732901 A/C 0.46 0.9
4 rs11064519 i1 741472 C/G 0.34 0.0001
5 rs2369402 i1 748925 G/A 0.21 0.1
6 rs2107612 i1 758581 A/G 0.27 0.7
7 rs2107613 i1 758689 C/T 0.23 0.4
8 rs11608756 i1 760094 A/G 0.39 0.04
9 rs11064524 i1 760163 G/T 0.25 0.8
10 rs11064527 i1 761286 A/C 0.16 0.4
11 rs11064536 i1 775843 T/C 0.17 0.5
12 rs765250 i1 778544 A/G 0.31 0.5
13 rs12314329 i1 779992 A/G 0.08 0.4
14 rs11611246 i4 809741 G/T 0.22 0.3
15 rs6489756 i4 834767 A/G 0.47 0.7
16 rs12816718 i6 840061 G/T 0.15 0.6
17 rs2286007 ex8 841552 C/T 0.07 0.7
18 rs11611231 i8 844587 C/G 0.10 0.4
19 rs4980973 i9 853307 A/G 0.13 0.0002
20 rs4980974 i9 855289 A/G 0.44 0.6
21 rs880054 i10 858819 A/G 0.41 1
22 rs956868 ex13 861173 A/C 0.14 0.4
23 rs953361 i22 872068 C/T 0.40 0.7
24 rs2301880 i23 874098 C/T 0.24 0.7
25 rs2286026 i26 885434 A/G 0.41 0.9
26 rs2286028 i26 885730 C/G 0.20 0.7
27 rs2277869 I26 887171 C/T 0.16 1
28 rs11571461 39 896580 A/G 0.07 0.3
ai: intron, e: exon, 59: 5 prime; 39: 3 prime.bMinor allele frequency.doi:10.1371/journal.pone.0005003.t001
WNK1 Variants & Blood Pressure
PLoS ONE | www.plosone.org 4 April 2009 | Volume 4 | Issue 4 | e5003
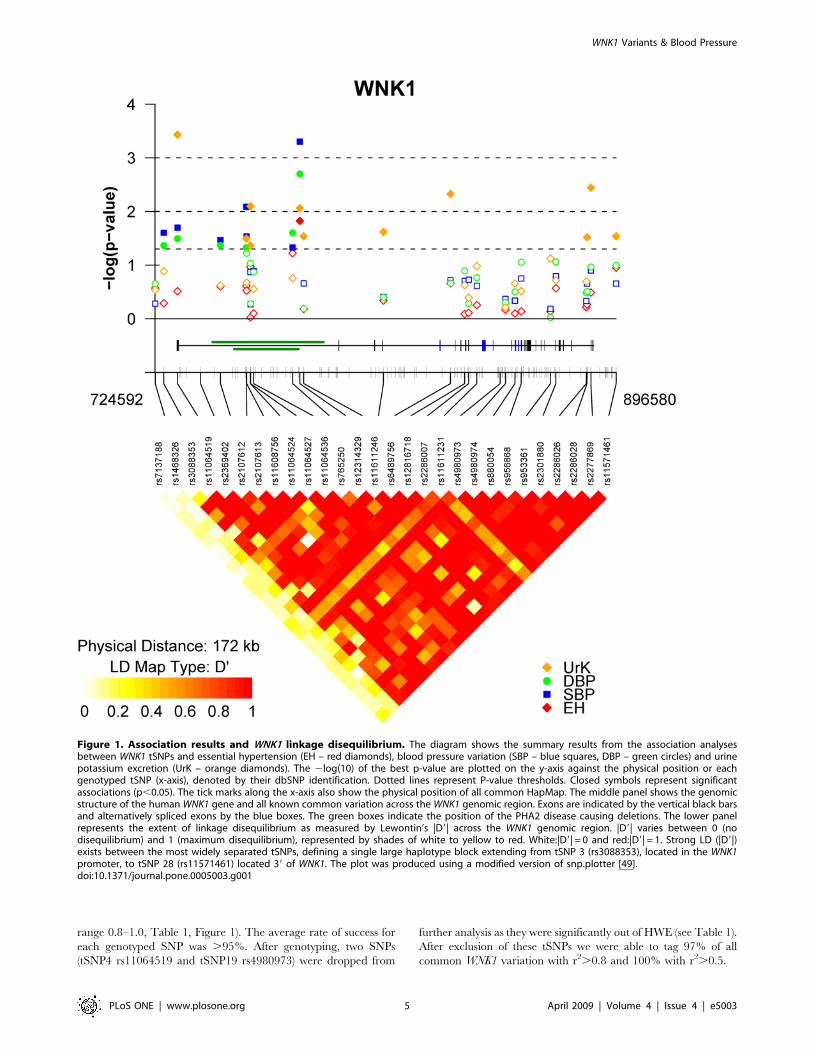
range 0.8–1.0, Table 1, Figure 1). The average rate of success for
each genotyped SNP was .95%. After genotyping, two SNPs
(tSNP4 rs11064519 and tSNP19 rs4980973) were dropped from
further analysis as they were significantly out of HWE (see Table 1).
After exclusion of these tSNPs we were able to tag 97% of all
common WNK1 variation with r2.0.8 and 100% with r2.0.5.
Figure 1. Association results and WNK1 linkage disequilibrium. The diagram shows the summary results from the association analysesbetween WNK1 tSNPs and essential hypertension (EH – red diamonds), blood pressure variation (SBP – blue squares, DBP – green circles) and urinepotassium excretion (UrK – orange diamonds). The 2log(10) of the best p-value are plotted on the y-axis against the physical position or eachgenotyped tSNP (x-axis), denoted by their dbSNP identification. Dotted lines represent P-value thresholds. Closed symbols represent significantassociations (p,0.05). The tick marks along the x-axis also show the physical position of all common HapMap. The middle panel shows the genomicstructure of the human WNK1 gene and all known common variation across the WNK1 genomic region. Exons are indicated by the vertical black barsand alternatively spliced exons by the blue boxes. The green boxes indicate the position of the PHA2 disease causing deletions. The lower panelrepresents the extent of linkage disequilibrium as measured by Lewontin’s |D9| across the WNK1 genomic region. |D9| varies between 0 (nodisequilibrium) and 1 (maximum disequilibrium), represented by shades of white to yellow to red. White:|D9| = 0 and red:|D9| = 1. Strong LD (|D9|)exists between the most widely separated tSNPs, defining a single large haplotype block extending from tSNP 3 (rs3088353), located in the WNK1promoter, to tSNP 28 (rs11571461) located 39 of WNK1. The plot was produced using a modified version of snp.plotter [49].doi:10.1371/journal.pone.0005003.g001
WNK1 Variants & Blood Pressure
PLoS ONE | www.plosone.org 5 April 2009 | Volume 4 | Issue 4 | e5003
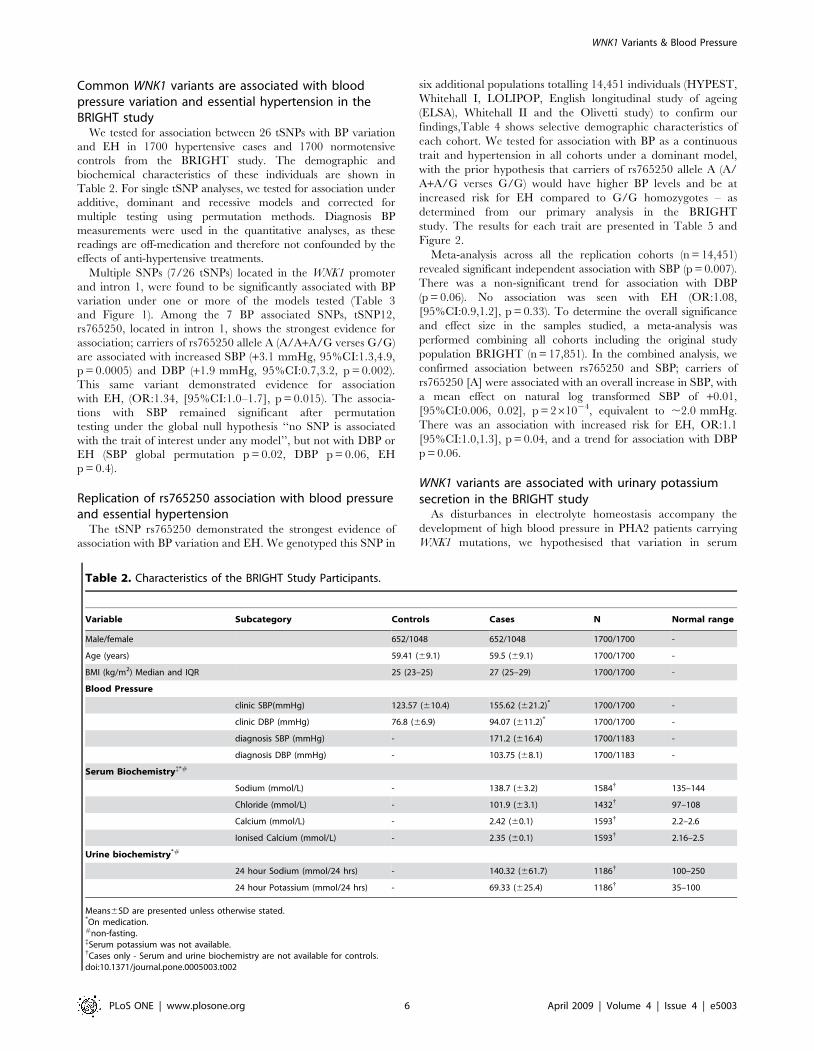
Common WNK1 variants are associated with bloodpressure variation and essential hypertension in theBRIGHT study
We tested for association between 26 tSNPs with BP variation
and EH in 1700 hypertensive cases and 1700 normotensive
controls from the BRIGHT study. The demographic and
biochemical characteristics of these individuals are shown in
Table 2. For single tSNP analyses, we tested for association under
additive, dominant and recessive models and corrected for
multiple testing using permutation methods. Diagnosis BP
measurements were used in the quantitative analyses, as these
readings are off-medication and therefore not confounded by the
effects of anti-hypertensive treatments.
Multiple SNPs (7/26 tSNPs) located in the WNK1 promoter
and intron 1, were found to be significantly associated with BP
variation under one or more of the models tested (Table 3
and Figure 1). Among the 7 BP associated SNPs, tSNP12,
rs765250, located in intron 1, shows the strongest evidence for
association; carriers of rs765250 allele A (A/A+A/G verses G/G)
are associated with increased SBP (+3.1 mmHg, 95%CI:1.3,4.9,
p = 0.0005) and DBP (+1.9 mmHg, 95%CI:0.7,3.2, p = 0.002).
This same variant demonstrated evidence for association
with EH, (OR:1.34, [95%CI:1.0–1.7], p = 0.015). The associa-
tions with SBP remained significant after permutation
testing under the global null hypothesis ‘‘no SNP is associated
with the trait of interest under any model’’, but not with DBP or
EH (SBP global permutation p = 0.02, DBP p = 0.06, EH
p = 0.4).
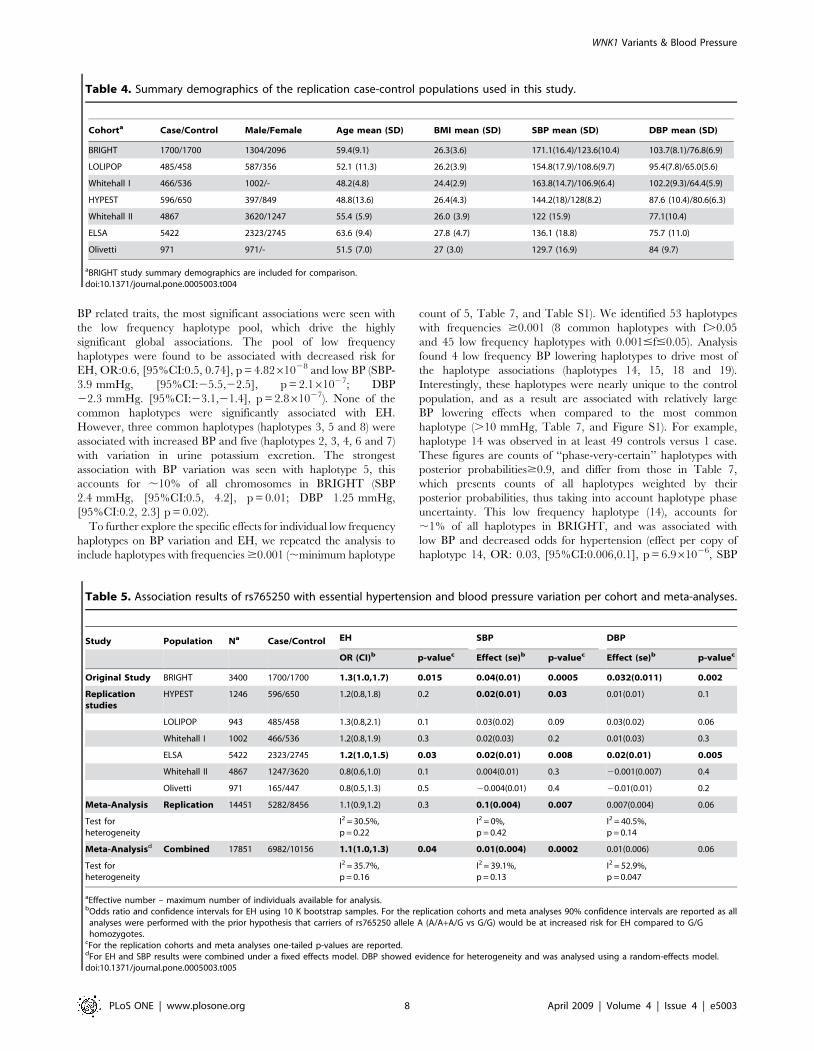
Replication of rs765250 association with blood pressureand essential hypertension
The tSNP rs765250 demonstrated the strongest evidence of
association with BP variation and EH. We genotyped this SNP in
six additional populations totalling 14,451 individuals (HYPEST,
Whitehall I, LOLIPOP, English longitudinal study of ageing
(ELSA), Whitehall II and the Olivetti study) to confirm our
findings,Table 4 shows selective demographic characteristics of
each cohort. We tested for association with BP as a continuous
trait and hypertension in all cohorts under a dominant model,
with the prior hypothesis that carriers of rs765250 allele A (A/
A+A/G verses G/G) would have higher BP levels and be at
increased risk for EH compared to G/G homozygotes – as
determined from our primary analysis in the BRIGHT
study. The results for each trait are presented in Table 5 and
Figure 2.
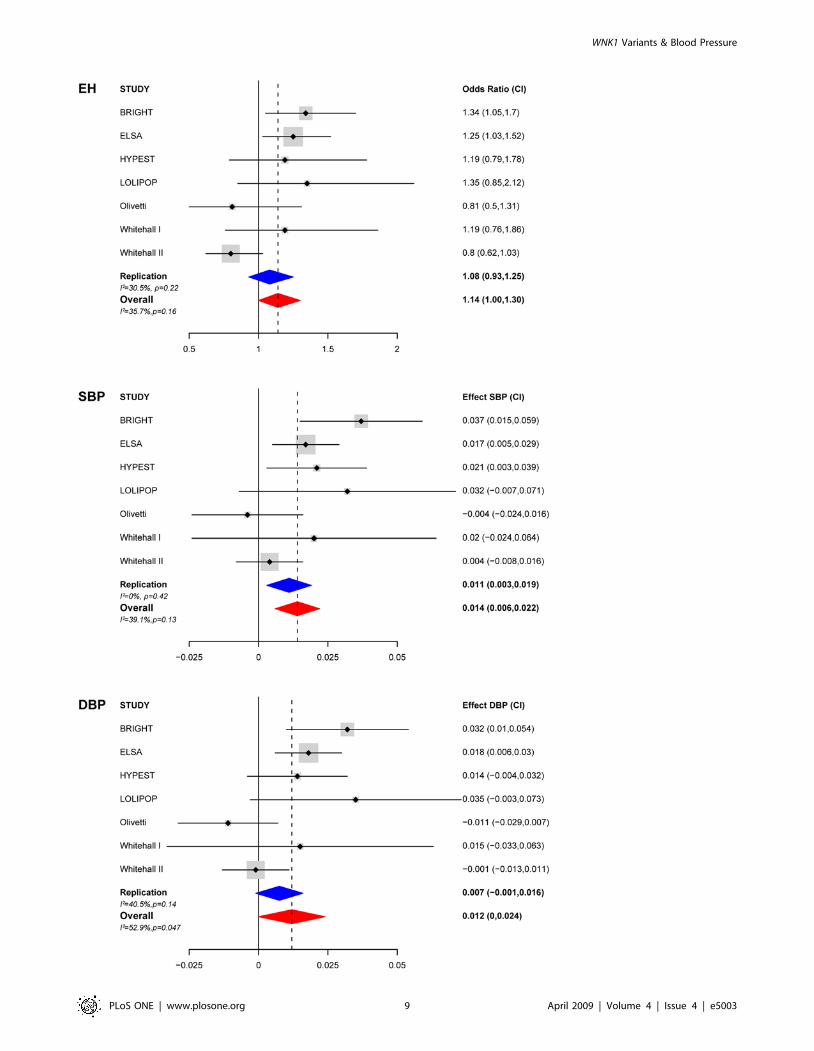
Meta-analysis across all the replication cohorts (n = 14,451)
revealed significant independent association with SBP (p = 0.007).
There was a non-significant trend for association with DBP
(p = 0.06). No association was seen with EH (OR:1.08,
[95%CI:0.9,1.2], p = 0.33). To determine the overall significance
and effect size in the samples studied, a meta-analysis was
performed combining all cohorts including the original study
population BRIGHT (n = 17,851). In the combined analysis, we
confirmed association between rs765250 and SBP; carriers of
rs765250 [A] were associated with an overall increase in SBP, with
a mean effect on natural log transformed SBP of +0.01,
[95%CI:0.006, 0.02], p = 261024, equivalent to ,2.0 mmHg.
There was an association with increased risk for EH, OR:1.1
[95%CI:1.0,1.3], p = 0.04, and a trend for association with DBP
p = 0.06.
WNK1 variants are associated with urinary potassiumsecretion in the BRIGHT study
As disturbances in electrolyte homeostasis accompany the
development of high blood pressure in PHA2 patients carrying
WNK1 mutations, we hypothesised that variation in serum
Table 2. Characteristics of the BRIGHT Study Participants.
Variable Subcategory Controls Cases N Normal range
Male/female 652/1048 652/1048 1700/1700 -
Age (years) 59.41 (69.1) 59.5 (69.1) 1700/1700 -
BMI (kg/m2) Median and IQR 25 (23–25) 27 (25–29) 1700/1700 -
Blood Pressure
clinic SBP(mmHg) 123.57 (610.4) 155.62 (621.2)* 1700/1700 -
clinic DBP (mmHg) 76.8 (66.9) 94.07 (611.2)* 1700/1700 -
diagnosis SBP (mmHg) - 171.2 (616.4) 1700/1183 -
diagnosis DBP (mmHg) - 103.75 (68.1) 1700/1183 -
Serum Biochemistry{*#
Sodium (mmol/L) - 138.7 (63.2) 1584{ 135–144
Chloride (mmol/L) - 101.9 (63.1) 1432{ 97–108
Calcium (mmol/L) - 2.42 (60.1) 1593{ 2.2–2.6
Ionised Calcium (mmol/L) - 2.35 (60.1) 1593{ 2.16–2.5
Urine biochemistry*#
24 hour Sodium (mmol/24 hrs) - 140.32 (661.7) 1186{ 100–250
24 hour Potassium (mmol/24 hrs) - 69.33 (625.4) 1186{ 35–100
Means6SD are presented unless otherwise stated.*On medication.#non-fasting.{Serum potassium was not available.{Cases only - Serum and urine biochemistry are not available for controls.doi:10.1371/journal.pone.0005003.t002
WNK1 Variants & Blood Pressure
PLoS ONE | www.plosone.org 6 April 2009 | Volume 4 | Issue 4 | e5003
and/or urinary electrolytes would be indicative of altered
WNK1 function or expression, and this may help to identify
polymorphisms that also affect BP. Therefore, we also explored
associations with phenotypes related to WNK1 function in
the BRIGHT cases; measures of serum and urine biochemistry
were not available for the BRIGHT controls. The biochemical
characteristics of the hypertensive cases are presented in Table 2.
We found multiple tSNPs spanning the length of the gene to
be associated with variation in 24 hour urine K+ excretion
(Table 3). These associations remained significant after
correction for multiple testing (p = 0.01). The majority of
cases were on medication at the time of phenotyping, therefore
data were reanalysed including presence or absence of
medication as a covariate in the regression analyses.
After adjusting for medication, the evidence for association
with 24 hour urine K+ remained (p$0.001, data not shown).
After permutation testing, no association was found with
variation in serum Na+, Cl2, Ca2+ or urine Na+ excretion (data
not shown).
Haplotype analysis reveals striking associations withessential hypertension, blood pressure variation andurine potassium excretion
Using |D9| as a measure of linkage disequilibrium (LD) across
the WNK1 region, we identified a single large haplotype block
extending from rs3088353 (tSNP3) located in the WNK1
promoter, to rs11571461 (tSNP28) located 39 of WNK1
(Figure 1). WNK1 haplotypes were constructed using 24/26 tSNPs
that fall within this block (2 tSNPs were dropped as they were out
of HWE – see WNK1 variation). There are 8 common WNK1
haplotypes with frequencies (f).5% that account for ,79% of all
haplotypes in the BRIGHT case-control resource (Table 6);
collectively the low frequency haplotypes account for the
remaining ,21% of haplotypic variation.
Table 7 shows the results of the haplotype analysis, it reveals
striking associations with EH (global permutation p,1027), BP
variation (global permutation p,1027), and 24 hour urine
potassium excretion (global permutation p = 1024). Across the
Table 3. Single tSNP association analyses with EH, BP variation and 24 hour urinary potassium in BRIGHT.
Trait tSNP SNP IDgenepositiona Majorb Minorb RAFc Modeld Effecte 95% CIe perm-pe globaL-pf
EH (Odds ratio) 12 rs765250 i1 A G 0.69 Dom 1.3 1.0,1.7 0.01 0.4
SBP (mmHg) 2 rs1468326 59 C A 0.11 Rec 5.1 0.6,9.2 0.02
3 rs3088353 59 A C 0.46 Rec 1.6 0.2,2.8 0.02
5 rs2369402 i1 G A 0.21 Dom 1.2 0.1,2.2 0.03
6 rs2107612 i1 A G 0.73 Add 1.2 0.2,2.0 0.008
7 rs2107613 i1 C T 0.23 Dom 1.2 0.1,2.3 0.03
11 rs11064536 i1 T C 0.83 Dom 3.1 0,6.1 0.05
12 rs765250 i1 A G 0.69 Dom 3.1 1.3,4.9 0.0005 0.02
DBP (mmHg) 2 rs1468326 59 C A 0.11 Rec 3.1 0.01,5.8 0.04
3 rs3088353 59 A C 0.46 Rec 0.9 0.1,1.8 0.03
5 rs2369402 i1 G A 0.21 Dom 0.8 0,1.5 0.04
6 rs2107612 i1 A G 0.73 Add 0.6 0.01,1.2 0.05
7 rs2107613 i1 C T 0.23 Dom 0.7 0.06,1.4 0.06
11 rs11064536 i1 T C 0.83 Dom 2.5 0.2,4.8 0.02
12 rs765250 i1 A G 0.69 Dom 1.9 0.7,3.2 0.002 0.06
24 hour urine K+(mmol/24 hour)
3 rs3088353 59 A C 0.46 Dom 25.9 22.5,29.2 0.0004
6 rs2107612 i1 A G 0.73 Add 22.6 24.8,20.3 0.03
8 rs11608756 i1 G A 0.61 Add 22.3 24.3,20.1 0.04
9 rs11064524 i1 T G 0.25 Dom 27.3 212.1,22.2 0.008
12 rs765250 i1 A G 0.69 Add 23.1 25.4,20.8 0.009
13 rs12314329 i1 A G 0.08 Add 24.3 27.8,20.5 0.03
14 rs11611246 i4 G T 0.78 Add 22.9 25.3,20.4 0.02
15 rs6489756 i4 A G 0.47 Add 23.2 25.6,20.9 0.005
27 rs2277869 i26 T C 0.84 Add 24.5 27.6,21.5 0.004
28 rs11571461 39 A G 0.07 Add 24.7 28.7,20.5 0.03 0.01
ai: intron, 59: 5 prime; 39: 3 prime.bIndicates major or minor alleles, bold indicates the allele increasing blood pressure.cRAF: Risk Allele Frequency – refers to the allele increasing blood pressure or decreasing urinary potassium.dBest Model; Add: Additive, Dom: Dominant, Rec: Recessive.eLinear effect estimate, 95% confidence intervals for EH, diagnosis SBP, DBP and 24 hour urine potassium using 10 K bootstrap samples. P-vaules are based on 10,000permutations.
fGlobal p-value based on 10,000 permutations - adjusting for testing multiple SNPs and multiple models.doi:10.1371/journal.pone.0005003.t003
WNK1 Variants & Blood Pressure
PLoS ONE | www.plosone.org 7 April 2009 | Volume 4 | Issue 4 | e5003
BP related traits, the most significant associations were seen with
the low frequency haplotype pool, which drive the highly
significant global associations. The pool of low frequency
haplotypes were found to be associated with decreased risk for
EH, OR:0.6, [95%CI:0.5, 0.74], p = 4.8261028 and low BP (SBP-
3.9 mmHg, [95%CI:25.5,22.5], p = 2.161027; DBP
22.3 mmHg. [95%CI:23.1,21.4], p = 2.861027). None of the
common haplotypes were significantly associated with EH.
However, three common haplotypes (haplotypes 3, 5 and 8) were
associated with increased BP and five (haplotypes 2, 3, 4, 6 and 7)
with variation in urine potassium excretion. The strongest
association with BP variation was seen with haplotype 5, this
accounts for ,10% of all chromosomes in BRIGHT (SBP
2.4 mmHg, [95%CI:0.5, 4.2], p = 0.01; DBP 1.25 mmHg,
[95%CI:0.2, 2.3] p = 0.02).
To further explore the specific effects for individual low frequency
haplotypes on BP variation and EH, we repeated the analysis to
include haplotypes with frequencies $0.001 (,minimum haplotype
count of 5, Table 7, and Table S1). We identified 53 haplotypes
with frequencies $0.001 (8 common haplotypes with f.0.05
and 45 low frequency haplotypes with 0.001#f#0.05). Analysis
found 4 low frequency BP lowering haplotypes to drive most of
the haplotype associations (haplotypes 14, 15, 18 and 19).
Interestingly, these haplotypes were nearly unique to the control
population, and as a result are associated with relatively large
BP lowering effects when compared to the most common
haplotype (.10 mmHg, Table 7, and Figure S1). For example,
haplotype 14 was observed in at least 49 controls versus 1 case.
These figures are counts of ‘‘phase-very-certain’’ haplotypes with
posterior probabilities$0.9, and differ from those in Table 7,
which presents counts of all haplotypes weighted by their
posterior probabilities, thus taking into account haplotype phase
uncertainty. This low frequency haplotype (14), accounts for
,1% of all haplotypes in BRIGHT, and was associated with
low BP and decreased odds for hypertension (effect per copy of
haplotype 14, OR: 0.03, [95%CI:0.006,0.1], p = 6.961026, SBP
Table 4. Summary demographics of the replication case-control populations used in this study.
Cohorta Case/Control Male/Female Age mean (SD) BMI mean (SD) SBP mean (SD) DBP mean (SD)
BRIGHT 1700/1700 1304/2096 59.4(9.1) 26.3(3.6) 171.1(16.4)/123.6(10.4) 103.7(8.1)/76.8(6.9)
LOLIPOP 485/458 587/356 52.1 (11.3) 26.2(3.9) 154.8(17.9)/108.6(9.7) 95.4(7.8)/65.0(5.6)
Whitehall I 466/536 1002/- 48.2(4.8) 24.4(2.9) 163.8(14.7)/106.9(6.4) 102.2(9.3)/64.4(5.9)
HYPEST 596/650 397/849 48.8(13.6) 26.4(4.3) 144.2(18)/128(8.2) 87.6 (10.4)/80.6(6.3)
Whitehall II 4867 3620/1247 55.4 (5.9) 26.0 (3.9) 122 (15.9) 77.1(10.4)
ELSA 5422 2323/2745 63.6 (9.4) 27.8 (4.7) 136.1 (18.8) 75.7 (11.0)
Olivetti 971 971/- 51.5 (7.0) 27 (3.0) 129.7 (16.9) 84 (9.7)
aBRIGHT study summary demographics are included for comparison.doi:10.1371/journal.pone.0005003.t004
Table 5. Association results of rs765250 with essential hypertension and blood pressure variation per cohort and meta-analyses.
Study Population Na Case/Control EH SBP DBP
OR (CI)b p-valuec Effect (se)b p-valuec Effect (se)b p-valuec
Original Study BRIGHT 3400 1700/1700 1.3(1.0,1.7) 0.015 0.04(0.01) 0.0005 0.032(0.011) 0.002
Replicationstudies
HYPEST 1246 596/650 1.2(0.8,1.8) 0.2 0.02(0.01) 0.03 0.01(0.01) 0.1
LOLIPOP 943 485/458 1.3(0.8,2.1) 0.1 0.03(0.02) 0.09 0.03(0.02) 0.06
Whitehall I 1002 466/536 1.2(0.8,1.9) 0.3 0.02(0.03) 0.2 0.01(0.03) 0.3
ELSA 5422 2323/2745 1.2(1.0,1.5) 0.03 0.02(0.01) 0.008 0.02(0.01) 0.005
Whitehall II 4867 1247/3620 0.8(0.6,1.0) 0.1 0.004(0.01) 0.3 20.001(0.007) 0.4
Olivetti 971 165/447 0.8(0.5,1.3) 0.5 20.004(0.01) 0.4 20.01(0.01) 0.2
Meta-Analysis Replication 14451 5282/8456 1.1(0.9,1.2) 0.3 0.1(0.004) 0.007 0.007(0.004) 0.06
Test forheterogeneity
I2 = 30.5%,p = 0.22
I2 = 0%,p = 0.42
I2 = 40.5%,p = 0.14
Meta-Analysisd Combined 17851 6982/10156 1.1(1.0,1.3) 0.04 0.01(0.004) 0.0002 0.01(0.006) 0.06
Test forheterogeneity
I2 = 35.7%,p = 0.16
I2 = 39.1%,p = 0.13
I2 = 52.9%,p = 0.047
aEffective number – maximum number of individuals available for analysis.bOdds ratio and confidence intervals for EH using 10 K bootstrap samples. For the replication cohorts and meta analyses 90% confidence intervals are reported as all
analyses were performed with the prior hypothesis that carriers of rs765250 allele A (A/A+A/G vs G/G) would be at increased risk for EH compared to G/Ghomozygotes.
cFor the replication cohorts and meta analyses one-tailed p-values are reported.dFor EH and SBP results were combined under a fixed effects model. DBP showed evidence for heterogeneity and was analysed using a random-effects model.doi:10.1371/journal.pone.0005003.t005
WNK1 Variants & Blood Pressure
PLoS ONE | www.plosone.org 8 April 2009 | Volume 4 | Issue 4 | e5003
WNK1 Variants & Blood Pressure
PLoS ONE | www.plosone.org 9 April 2009 | Volume 4 | Issue 4 | e5003
215.9 mmHg, [95%CI:219.9,211.7], p = 9.9610213, DBP
29.2 mmHg, [95%CI:211.5,26.7], p = 1.5610212); these asso-
ciation remained highly significant after permutation testing –
global p,1027 for EH and both BP traits.
Discussion
We found multiple WNK1 tSNPs and haplotypes to be
significantly associated with BP, EH and urinary potassium
excretion. The strong prior functional and genetic evidence for
the role of WNK1 in BP regulation [11] together with replication in
additional populations, provides further support for the role of
WNK1 in BP regulation in both hypertensives and the general
population. Although environmental effects, such as diet and drug
treatment will confound the reported associations and may lead to
inaccurate estimates of effect size, our data supports observations
that WNK1 regulates BP and K+ excretion in vivo, however, the
association with K+ homoeostasis remains to be confirmed
[16,35].
In the BRIGHT study resource, the strongest tSNP association
was seen between rs765250 and SBP. This association was
replicated in additional populations, suggesting that the original
association is unlikely to be a false positive. This association,
however, was not replicated in all cohorts tested. Failure to
replicate the effect of rs765250 on EH and BP in every
population could be due to genetic heterogeneity across
populations, small effect sizes or low power. Although the
associations did not reach statistical significance in some of the
individual cohorts, for the majority of populations, the direction
of the effect was consistent with that seen in BRIGHT, with
overlapping 95% confidence intervals. Encouragingly, in the
combined meta-analyses, the evidence for association with SBP
increased. Notably, this same SNP has previously been
associated with ambulatory SBP and DBP in the families from
the GRAPHIC study (min p = 0.001) [21], and more recently,
with DBP gradient (p = 0.02) in children from the Avon
Longitudinal Study of Parent and Children Study [36], lending
further support to the reported findings.
In the single tSNP analyses, our primary associations with BP
variation and EH were observed with variants located in the
WNK1 promoter regions and intron 1. In contrast to this, the
tSNPS associated with urinary K+ excretion span the entire length
of the gene. However, there is some overlap between those tSNPs
associated with BP and variation in urinary K+. In particular, the
variant rs765250, located in intron 1, which demonstrated the
strongest evidence for association with EH and BP variation, is
also associated with decreased in urinary K+ excretion. These
novel genetic data correlate well with what is known about WNK1
function, especially in relation to the primary phenotypes that
characterise PHA2 - hyperkalemia and hypertension [37]. That is,
we would expect true functional variants (or those in LD with these
polymorphisms) to be associated with both BP and altered
potassium excretion; this is what we observe.
Although there is some overlap between those tSNPs associated
with BP and urinary potassium excretion (eg. 3/7 BP SNPs are
also associated with variation in urinary potassium), not all BP
associated variants were associated with urinary potassium and
vice-versa. Furthermore, haplotypes associated with increased BP
were not also associated with decreased urine potassium excretion.
This discrepancy may represent complex interactions between
WNK1 polymorphisms and may also reflect the complexity of
WNK1 regulation and its role in electrolyte homeostasis.
There are two major isoforms of WNK1: L-WNK1 and Ks-
WNK1. L-WNK1 is ubiquitously expressed, but Ks-WNK1 has so far
only been found to be expressed in the kidney [38]. Both L-WNK1
and Ks-WNK1 interact with each other to regulate common
downstream targets involved in electrolyte homeostasis and BP
regulation, via both kinase dependent and independent mecha-
nisms [(e.g., sodium chloride co-transporter (SLC12A3), epithelial
sodium channel (ENaC) and the renal outer medullary potassium
channel (KCNJ1)]. These isoforms are under the control of
alternative promoters – one located 59 of the gene for L-WNK1,
and the other in intron 4, controlling expression of Ks-WNK1 [19].
Furthermore, both isoforms undergo tissue specific splicing and
further variation is achieved by the use of two polyadenylation sites
[18,19,39]. These data imply that there are multiple functional
sites along the gene through which genetic variation could effect
WNK1 expression and function. Furthermore, it has been observed
in some PHA2 patients carrying the WNK1 deletion mutations,
that the development of hyperkalemia may be separate from
hypertension, and often precedes the development of high BP in
these patients i.e., there may be no clear ‘‘cause and effect’’
relationship between the two phenotypes [40]. Therefore, it is
possible that different WNK1 polymorphisms, either singly or in
combination, could contribute to the two different phenotypes.
This could account for some of our observations and will need to
be explored with further studies.
We found multiple tSNPs spanning the entire length of the gene
and several haplotypes to be associated with the traits of interest,
suggesting there may be multiple causal variants across the WNK1
locus. Even though we used a comprehensive tSNP set that
captured all known common WNK1 variation in HapMap,
HapMap does not contain a complete catalogue of all genetic
variation, thus fine mapping will be required to identify the true
causal variants. Interestingly, all common HapMap SNPs in strong
LD (r2.0.8) with rs765250 and the other BP associated tSNPs,
map to the L-WNK1 promoter, the Ks-WNK1 promoter located in
intron 4 [19] and regions in intron 1 that span the sites of the
PHA2 deletions (Figure S2), thus highlighting a few potential
regions for targeted re-sequencing.
The most striking observations from our analyses were the
identification of low frequency haplotypes with large BP lowering
effects and their increased prevalence in the control population.
Loss of WNK1 function is deleterious, as demonstrated by
homozygous knockout mice which are embryonic lethal [12].
On the other hand, heterozygous knockout mice have low blood
pressure, and this is associated with decreased WNK1 expression at
the mRNA and protein level. Therefore, we can hypothesise that
loss of function/expression mutations in WNK1 would be selected
against and be rare in the general population. More subtle
mutations, however, that lead to decreased WNK1 expression or
Figure 2. Meta-analysis plot showing the effect of rs765250 [A] carriers on risk for EH and blood pressure in 17,851 adults. A) Metaanalysis of rs765250 with essential hypertension (EH), B) with systolic blood pressure (SBP), and C) with diastolic blood pressure (BBP). The size of thegrey box is proportional to population size. Odds ratio/effect sizes and confidence intervals are from 10 K bootstrap samples. For the replicationcohorts 90% confidence intervals are reported as all analyses were performed with the prior hypothesis that carriers of rs765250 allele A (A/A+A/G vsG/G) would have increased BP and be at increased risk for EH compared to G/G homozygotes. For EH and SBP, results were combined in a meta-analysis under a fixed effect model. Analysis of DBP revealed evidence for heterogeneity therefore results were combined in a meta-analysis using arandom-effects model, which includes a measure of variance between studies.doi:10.1371/journal.pone.0005003.g002
WNK1 Variants & Blood Pressure
PLoS ONE | www.plosone.org 10 April 2009 | Volume 4 | Issue 4 | e5003
Ta
ble
6.
WN
K1
Hap
loty
pe
s.
rs3088353
rs2369402
rs2107612
rs2107613
rs11608756
rs11064524
rs11064527
rs11064536
rs765250
rs12314329
rs11611246
rs6489756
rs12816718
rs2286007
rs11611231
rs4980974
rs880054
rs956868
rs953361
rs2301880
rs2286026
rs2286028
rs2277869
rs11571461
Co
mm
on
F3
56
78
91
01
11
21
31
41
51
61
71
82
02
12
22
32
42
52
62
72
8
10
.15
11
11
11
11
11
12
11
12
11
21
11
11
20
.13
21
11
21
21
11
11
21
11
12
11
11
11
30
.12
21
11
12
11
11
22
11
12
11
21
12
11
40
.12
12
22
21
12
21
11
11
11
21
12
21
11
50
.10
11
11
11
11
11
12
11
11
21
11
21
21
60
.06
12
22
21
11
21
11
12
11
21
12
21
11
70
.06
21
21
11
11
22
11
11
12
11
11
11
12
80
.05
21
11
12
11
11
22
11
22
11
21
12
11
Lo
wfr
eq
ue
ncy
14
0.0
08
21
11
12
11
11
12
11
12
11
21
12
11
15
0.0
08
11
11
11
11
11
12
11
11
21
11
21
11
18
0.0
04
21
11
12
11
11
12
11
22
11
21
12
11
19
0.0
04
11
11
11
11
11
22
11
12
11
21
11
11
All
tSN
Ps
are
de
no
ted
nu
me
rica
llyw
ith
refe
ren
ceto
Tab
le2
.M
ino
ral
lele
s‘‘2
’’ar
eh
igh
ligh
ted
inb
old
.F:
Fre
qu
en
cy.
Hap
loty
pe
cou
nts
inca
ses
and
con
tro
lsar
ee
stim
ate
sw
eig
hte
db
yth
eir
po
ste
rio
rp
rob
abili
tie
sas
de
term
ine
db
yh
aplo
.sta
ts.
do
i:10
.13
71
/jo
urn
al.p
on
e.0
00
50
03
.t0
06
WNK1 Variants & Blood Pressure
PLoS ONE | www.plosone.org 11 April 2009 | Volume 4 | Issue 4 | e5003
Ta
ble
7.
Hap
loty
pe
asso
ciat
ion
anal
yse
sin
BR
IGH
T.
Ha
plo
typ
eC
on
tro
laC
ase
aF
aE
HS
BP
DB
P2
4h
rU
rin
ep
ota
ssiu
md
CO
MM
ON
aO
R(9
5%
CI)
bp
-va
lue
cE
ffe
ct(9
5%
CI)
bp
-va
lue
cE
ffe
ct(9
5%
CI)
bp
-va
lue
cE
ffe
ct(9
5%
CI)
bp
-va
lue
c
14
77
.55
13
.90
.15
refe
ren
ce-
--
--
--
24
05
.64
51
.90
.13
1.0
(0.8
,1.2
)0
.81
.7(2
0.1
,3.4
)0
.06
0.9
(20
.1,1
.9)
0.0
95
.4(2
.6,8
.3)
9.86
10
25
33
68
.34
51
.10
.12
1.1
(0.9
,1.4
)0
.22
.1(0
.3,3
.9)
0.0
21
.2(0
.2,2
.2)
0.0
27
.1(4
.2,1
0.1
)5
.76
10
27
44
07
.94
00
.90
.12
0.9
(0.7
,1.1
)0
.42
0.9
(22
.7,,0
.8)
0.3
20
.8(2
1.8
,0.2
)0
.16
.1(3
.2,9
.1)
2.76
10
25
53
07
.34
06
.00
.10
1.1
(0.9
,1.4
)0
.22
.4(0
.5,4
.2)
0.0
11
.2(0
.2,2
.3)
0.0
22
0.0
(22
.8,2
.8)
0.9
8
61
93
.12
05
.30
.06
1.0
(0.8
,1.3
)0
.92
1.3
(23
.4,0
.9)
0.2
0(2
1.2
,1.3
)0
.96
.2(2
.6,9
.9)
4.76
10
24
71
88
.71
94
.70
.06
1.0
(0.8
,1.3
)0
.92
0.5
(22
.7,1
.8)
0.7
0.3
(21
.0,1
.6)
0.7
9.1
(5.3
,13
.1)
1.06
10
26
81
63
.31
95
.20
.05
1.0
(0.8
,1.4
)0
.72
.5(0
.1,4
.9)
0.0
41
.5(0
.2,2
.9)
0.0
33
.4(2
0.2
,7.3
)0
.07
Low
fre
qu
en
cyp
oo
l8
74
.35
62
.60
.21
0.6
(0.5
,0.7
)4
.86
10
28
24
.0(2
5.5
,22
.5)
2.16
10
27
22
.3(2
3.1
,21
.4)
2.86
10
27
5.8
(3.1
,8.6
)1
.896
10
25
LO
WF
RE
QU
EN
CY
aC
on
tro
laC
ase
aF
aO
R(9
5%
CI)
bp
-va
lue
cE
ffe
ct(9
5%
CI)
bp
-va
lue
cE
ffe
ct(9
5%
CI)
bp
-va
lue
cE
ffe
ct(9
5%
CI)
p-v
alu
e
14
54
.11
.70
.00
80
.03
(0.0
06
,0.1
)6
.96
10
26
21
5.9
(21
9.9
,21
1.7
)9
.96
10
21
32
9.2
(21
1.5
,26
.7)
1.56
10
21
2-
-
15
53
.81
.60
.00
80
.03
(0.0
1,0
.2)
3.96
10
25
21
3.9
(21
8.1
,29
.5)
1.56
10
29
27
.7(2
10
.2,2
5.2
)5
.46
10
29
--
18
26
.50
.40
.00
40
.01
(0.0
00
5,0
.4)
0.0
12
16
.0(2
21
.5,2
10
.3)
1.56
10
27
21
1.2
(21
4.4
,28
.0)
1.06
10
21
0-
-
19
23
.91
.60
.00
40
.06
(0.0
1,0
.3)
6.46
10
24
21
7.9
(22
3.9
,21
1.6
)1
.16
10
27
21
0.2
(21
3.7
,26
.5)
1.86
10
27
--
Glo
ba
lp
-va
lue
b,
10
27
,1
02
7,
10
27
16
10
24
aH
aplo
typ
es
are
nu
mb
ere
dw
ith
refe
ren
ceto
Tab
le4
.Lo
wfr
eq
ue
ncy
hap
loty
pe
sar
en
um
be
red
wit
hre
fere
nce
toT
able
4an
dSu
pp
lem
en
tary
Tab
le1
.H
aplo
typ
eco
un
tsin
case
san
dco
ntr
ols
are
est
imat
es
we
igh
ted
by
the
irp
ost
eri
or
pro
bab
iliti
es
asd
ete
rmin
ed
by
hap
lost
ats.
F:Fr
eq
ue
ncy
.b
Lin
ear
eff
ect
est
imat
e,
95
%co
nfi
de
nce
inte
rval
sfo
rEH
,SB
P,
DB
Pan
d2
4h
ou
ru
rin
ep
ota
ssiu
m.
Th
ee
ffe
ctsi
zes
are
calc
ula
ted
by
com
par
ing
eac
hh
aplo
typ
eag
ain
sth
aplo
typ
e1
:th
em
ost
com
mo
nh
aplo
typ
eo
rw
ild-t
ype
.cG
lob
alp
-val
ue
bas
ed
on
10
,00
0p
erm
uta
tio
ns
for
24
ho
ur
uri
ne
K+
and
10
,00
0,0
00
for
EHan
dSB
P/D
BP
-ad
just
ing
for
test
ing
mu
ltip
leh
aplo
typ
es.
dA
sso
ciat
ion
wit
h2
4h
ou
ru
rin
ep
ota
ssiu
me
xcre
tio
nw
asp
erf
orm
ed
inca
ses
on
ly.A
sso
ciat
ion
anal
ysis
wit
hu
rin
ep
ota
ssiu
mw
asn
ot
po
ssib
lefo
rth
era
reh
aplo
typ
es.
Th
eas
soci
ate
dra
reh
aplo
typ
es
are
alm
ost
un
iqu
ely
dis
trib
ute
dam
on
gst
the
con
tro
lp
op
ula
tio
n,
for
wh
ich
asm
eas
ure
so
f2
4h
ou
ru
rin
ep
ota
ssiu
me
xcre
tio
nar
en
ot
avai
lab
le.
do
i:10
.13
71
/jo
urn
al.p
on
e.0
00
50
03
.t0
07
WNK1 Variants & Blood Pressure
PLoS ONE | www.plosone.org 12 April 2009 | Volume 4 | Issue 4 | e5003
function may be ‘protective’ against hypertension, and preserved
at low frequencies in the general population. However, the effects
of genetic drift should not be underestimated in terms of allowing
slightly deleterious alleles to persist in human populations [41].
This may explain some of our observations. The ability of
common tSNPs/haplotypes to capture rare functional variants has
previously been demonstrated for the angiotensinogen (AGT) gene
[42]. It is possible that our tSNP analysis set is capturing rare loss-
of-function mutations that may be embedded in these low
frequency haplotype backgrounds, thus highlighting the need to
re-sequence individuals carrying these low frequency haplotypes.
Our data suggest that multiple common WNK1 variants, with
relatively weak effects, and multiple rare variants with large effects
may be associated with blood pressure variation, and this should
be explored further. Our findings are consistent with recent studies
by Ji et al (2008) [43] and Tobin et al (2008) [44]. Both groups
have performed a systematic analysis of the effect of variants in
genes involved in renal salt handling on blood pressure and the
development of hypertension. Many of which are regulated by
WNK1 – SLC12A2, SLC12A1 and KCNJ1. Ji et al (2008) have
identified rare variants in these genes that are associated with
significantly lower blood pressure and protect from the develop-
ment of hypertension in members of the Framingham Heart Study
(FHS) [43]. In addition, Tobin et. al. (2008) have reported
associations between common variants in these genes and blood
pressure in families from the general population [44]. The findings
suggest that both common and rare variants in genes responsible
for some Mendelian disorders of hypertension and hypotension
may also affect blood pressure variation in the general population.
Our data lends further support to these observations.
The importance of rare variants to quantitative trait variability
and susceptibility to disease has now been demonstrated for a
number of other important phenotypes; including high density
lipoprotein cholesterol (HDL-C), low density lipoprotein choles-
terol (LDL-C) plasma triglycerides and body weight [45,46,47,48].
We believe there is now compelling evidence to initiate further
studies to identify functional WNK1 variants that have a significant
impact on BP variation, electrolyte homeostasis and risk of EH in
the general population; thus taking an important step forward in
our understanding of the pathogenesis of human essential
hypertension.
Supporting Information
Figure S1 Distribution of low frequency blood pressure lowering
haplotypes The plot of systolic blood pressure (SBP)/diastolic
blood pressure (DBP) values for each individual, showing the
distribution of the associated low frequency haplotypes with
posterior probabilities $0.9. The plot shows how the low
frequency haplotypes are mainly found in low BP individuals.
Found at: doi:10.1371/journal.pone.0005003.s001 (1.08 MB TIF)
Figure S2 The genomic structure of the human WNK1 gene is
presented at the bottom of the panel. Exons are indicated by the
vertical black bars and alternatively spliced exons by the red boxes.
The yellow boxes indicate the position of the PHA2 disease
causing deletions. For each of the blood pressure associated SNPs
(red circles) located in intron 1, the r2 for each HapMap SNP with
r2.0.8 is plotted on the y-axis against physical position (x-axis).
The vertical dashed lines indicate the positions of the statistically
similar SNPs.
Found at: doi:10.1371/journal.pone.0005003.s002 (0.90 MB TIF)
Table S1 Haplotype association analysis
Found at: doi:10.1371/journal.pone.0005003.s003 (0.04 MB
XLS)
Acknowledgments
We would like to thank the participants of the Olivetti Study, the BRIGHT
study, the Estonian HYPEST sample collection, Whitehall 1 study,
Whitehall 2 Study and English Longitudinal Study of Ageing, and the
London Life Sciences Prospective Population Cohort who enabled these
studies. We are also extremely grateful to the BRIGHT nursing team. We
would also like to thank The Barts and The London Charity funded the
Barts and The London Genome Centre. We also thank Piret Kelgo, Tiina
Rebane, Anne Speek, Aino Hallik and Kersti Kivi; Drs Karel Tomberg,
Mai Rosenberg and Tiina Ristimae for assistance in subject recruitment
and data collection for the Estonian HYPEST sample collection.
Author Contributions
Conceived and designed the experiments: SJN MF PM. Performed the
experiments: SJN MH BB PH AKO KL SSH. Analyzed the data: SJN MF
CW RD SE PM. Contributed reagents/materials/analysis tools: SJN MF
CW MB NJS AFD JC ML JK JC PE RC RC ML EO PJ GV MV FPC CJ
RI PS MK MM EB MC PM. Wrote the paper: SJN MF PM. Contributed
to editing the paper: ML ML FPC MC.
References
1. Kannel WB, Schwartz MJ, McNamara PM (1969) Blood pressure and risk of
coronary heart disease: the Framingham study. Dis Chest 56: 43–52.
2. MacMahon S, Peto R, Cutler J, Collins R, Sorlie P, et al. (1990) Blood pressure,
stroke, and coronary heart disease. Part 1, Prolonged differences in blood
pressure: prospective observational studies corrected for the regression dilution
bias. Lancet 335: 765–774.
3. Lewington S, Clarke R, Qizilbash N, Peto R, Collins R (2002) Age-specific
relevance of usual blood pressure to vascular mortality: a meta-analysis of
individual data for one million adults in 61 prospective studies. Lancet 360:
1903–1913.
4. Petersen S PV, Rayner M, Leal J, Luengo-Fernandez R, Gray A (2005)
European cardiovascular disease statistics 2005 edition. European cardiovascu-
lar disease statistics, British Heart Foundation.
5. Ward R (1995) Familial aggregation and genetic epidemiology of blood pressure.
In: Laragh JH, Brenner BM, eds. Hypertension : pathophysiology, diagnosis,
and management. 2nd ed. New York: Raven Press.
6. Appel LJ, Moore TJ, Obarzanek E, Vollmer WM, Svetkey LP, et al. (1997) A
clinical trial of the effects of dietary patterns on blood pressure. DASH
Collaborative Research Group. N Engl J Med 336: 1117–1124.
7. Stevens VJ, Obarzanek E, Cook NR, Lee IM, Appel LJ, et al. (2001) Long-term
weight loss and changes in blood pressure: results of the Trials of Hypertension
Prevention, phase II. Ann Intern Med 134: 1–11.
8. Lifton RP, Gharavi AG, Geller DS (2001) Molecular mechanisms of human
hypertension. Cell 104: 545–556.
9. Xu B, English JM, Wilsbacher JL, Stippec S, Goldsmith EJ, et al. (2000) WNK1,
a novel mammalian serine/threonine protein kinase lacking the catalytic lysine
in subdomain II. J Biol Chem 275: 16795–16801.
10. Verissimo F, Jordan P (2001) WNK kinases, a novel protein kinase subfamily in
multi-cellular organisms. Oncogene 20: 5562–5569.
11. Wilson FH, Disse-Nicodeme S, Choate KA, Ishikawa K, Nelson-Williams C, et
al. (2001) Human hypertension caused by mutations in WNK kinases. Science
293: 1107–1112.
12. Zambrowicz BP, Abuin A, Ramirez-Solis R, Richter LJ, Piggott J, et al. (2003)
Wnk1 kinase deficiency lowers blood pressure in mice: a gene-trap screen to
identify potential targets for therapeutic intervention. Proc Natl Acad Sci U S A
100: 14109–14114.
13. Naray-Fejes-Toth A, Snyder PM, Fejes-Toth G (2004) The kidney-specific
WNK1 isoform is induced by aldosterone and stimulates epithelial sodium
channel-mediated Na+ transport. Proc Natl Acad Sci U S A 101: 17434–17439.
14. Cope G, Murthy M, Golbang AP, Hamad A, Liu CH, et al. (2006) WNK1
affects surface expression of the ROMK potassium channel independent of
WNK4. J Am Soc Nephrol 17: 1867–1874.
15. Golbang AP, Cope G, Hamad A, Murthy M, Liu CH, et al. (2006) Regulation of
the Expression of the Na/Cl cotransporter (NCCT) by WNK4 and WNK1:
evidence that accelerated dynamin-dependent endocytosis is not involved.
Am J Physiol Renal Physiol.
16. Lazrak A, Liu Z, Huang CL (2006) Antagonistic regulation of ROMK by long
and kidney-specific WNK1 isoforms. Proc Natl Acad Sci U S A 103: 1615–1620.
WNK1 Variants & Blood Pressure
PLoS ONE | www.plosone.org 13 April 2009 | Volume 4 | Issue 4 | e5003
17. Subramanya AR, Yang CL, Zhu X, Ellison DH (2006) Dominant-negative
regulation of WNK1 by its kidney-specific kinase-defective isoform. Am J PhysiolRenal Physiol 290: F619–624.
18. Shekarabi M, Girard N, Riviere JB, Dion P, Houle M, et al. (2008) Mutations in
the nervous system–specific HSN2 exon of WNK1 cause hereditary sensoryneuropathy type II. J Clin Invest 118: 2496–2505.
19. Delaloy C, Lu J, Houot AM, Disse-Nicodeme S, Gasc JM, et al. (2003) Multiplepromoters in the WNK1 gene: one controls expression of a kidney-specific
kinase-defective isoform. Mol Cell Biol 23: 9208–9221.
20. Newhouse SJ, Wallace C, Dobson R, Mein C, Pembroke J, et al. (2005)Haplotypes of the WNK1 gene associate with blood pressure variation in a
severely hypertensive population from the British Genetics of Hypertensionstudy. Hum Mol Genet 14: 1805–1814.
21. Tobin MD, Raleigh SM, Newhouse S, Braund P, Bodycote C, et al. (2005)Association of WNK1 gene polymorphisms and haplotypes with ambulatory
blood pressure in the general population. Circulation 112: 3423–3429.
22. Turner ST, Schwartz GL, Chapman AB, Boerwinkle E (2005) WNK1 kinasepolymorphism and blood pressure response to a thiazide diuretic. Hypertension
46: 758–765.23. Gibbs RA, Belmont JW, Hardenbol P, Willis TD, Yu F, et al. (2003) The
International HapMap Project. Nature 426: 789–796.
24. Caulfield M, Munroe P, Pembroke J, Samani N, Dominiczak A, et al. (2003)Genome-wide mapping of human loci for essential hypertension. Lancet 361:
2118–2123.25. Clarke R, Emberson JR, Parish S, Palmer A, Shipley M, et al. (2007) Cholesterol
fractions and apolipoproteins as risk factors for heart disease mortality in oldermen. Arch Intern Med 167: 1373–1378.
26. Strazzullo P, Barbato A, Galletti F, Barba G, Siani A, et al. (2006) Abnormalities
of renal sodium handling in the metabolic syndrome. Results of the OlivettiHeart Study. J Hypertens 24: 1633–1639.
27. Galletti F, Barbato A, Versiero M, Iacone R, Russo O, et al. (2007) Circulatingleptin levels predict the development of metabolic syndrome in middle-aged
men: an 8-year follow-up study. J Hypertens 25: 1671–1677.
28. de Bakker PI, Yelensky R, Pe’er I, Gabriel SB, Daly MJ, et al. (2005) Efficiencyand power in genetic association studies. Nat Genet 37: 1217–1223.
29. Barrett JC, Fry B, Maller J, Daly MJ (2005) Haploview: analysis andvisualization of LD and haplotype maps. Bioinformatics 21: 263–265.
30. Ihaka R, Gentleman R (1996) R: A Language for Data Analysis and Graphics.Journal of Computational and Graphical Statistics 5: 219–314.
31. Schaid DJ, Rowland CM, Tines DE, Jacobson RM, Poland GA (2002) Score
tests for association between traits and haplotypes when linkage phase isambiguous. Am J Hum Genet 70: 425–434.
32. Tobin MD, Sheehan NA, Scurrah KJ, Burton PR (2005) Adjusting for treatmenteffects in studies of quantitative traits: antihypertensive therapy and systolic
blood pressure. Stat Med 24: 2911–2935.
33. Cui JS, Hopper JL, Harrap SB (2003) Antihypertensive treatments obscurefamilial contributions to blood pressure variation. Hypertension 41: 207–210.
34. Higgins JP, Thompson SG, Deeks JJ, Altman DG (2003) Measuring
inconsistency in meta-analyses. Bmj 327: 557–560.35. Fu Y, Subramanya A, Rozansky D, Cohen DM (2006) WNK kinases influence
TRPV4 channel function and localization. Am J Physiol Renal Physiol.
36. Tobin MD, Timpson NJ, Wain LV, Ring S, Jones LR, et al. (2008) CommonVariation in the WNK1 Gene and Blood Pressure in Childhood. The Avon
Longitudinal Study of Parents and Children. Hypertension.37. Gordon RD (1986) Syndrome of hypertension and hyperkalemia with normal
glomerular filtration rate. Hypertension 8: 93–102.
38. Delaloy C, Hadchouel J, Imbert-Teboul M, Clemessy M, Houot AM, et al.(2006) Cardiovascular expression of the mouse WNK1 gene during development
and adulthood revealed by a BAC reporter assay. Am J Pathol 169: 105–118.39. O’Reilly M, Marshall E, Speirs HJ, Brown RW (2003) WNK1, a gene within a
novel blood pressure control pathway, tissue-specifically generates radicallydifferent isoforms with and without a kinase domain. J Am Soc Nephrol 14:
2447–2456.
40. Achard JM, Warnock DG, Disse-Nicodeme S, Fiquet-Kempf B, Corvol P, et al.(2003) Familial hyperkalemic hypertension: phenotypic analysis in a large family
with the WNK1 deletion mutation. Am J Med 114: 495–498.41. Modiano G, Bombieri C, Ciminelli BM, Belpinati F, Giorgi S, et al. (2005) A
large-scale study of the random variability of a coding sequence: a study on the
CFTR gene. Eur J Hum Genet 13: 184–192.42. Zhu X, Fejerman L, Luke A, Adeyemo A, Cooper RS (2005) Haplotypes
produced from rare variants in the promoter and coding regions ofangiotensinogen contribute to variation in angiotensinogen levels. Hum Mol
Genet 14: 639–643.43. Ji W, Foo JN, O’Roak BJ, Zhao H, Larson MG, et al. (2008) Rare independent
mutations in renal salt handling genes contribute to blood pressure variation.
Nat Genet 40: 592–599.44. Tobin MD, Tomaszewski M, Braund PS, Hajat C, Raleigh SM, et al. (2008)
Common variants in genes underlying monogenic hypertension and hypotensionand blood pressure in the general population. Hypertension 51: 1658–1664.
45. Cohen JC, Kiss RS, Pertsemlidis A, Marcel YL, McPherson R, et al. (2004)
Multiple rare alleles contribute to low plasma levels of HDL cholesterol. Science305: 869–872.
46. Cohen JC, Pertsemlidis A, Fahmi S, Esmail S, Vega GL, et al. (2006) Multiplerare variants in NPC1L1 associated with reduced sterol absorption and plasma
low-density lipoprotein levels. Proc Natl Acad Sci U S A 103: 1810–1815.47. Ahituv N, Kavaslar N, Schackwitz W, Ustaszewska A, Martin J, et al. (2007)
Medical sequencing at the extremes of human body mass. Am J Hum Genet 80:
779–791.48. Romeo S, Yin W, Kozlitina J, Pennacchio LA, Boerwinkle E, et al. (2009) Rare
loss-of-function mutations in ANGPTL family members contribute to plasmatriglyceride levels in humans. J Clin Invest 119: 70–79.
49. Luna A, Nicodemus KK (2007) snp.plotter: an R-based SNP/haplotype
association and linkage disequilibrium plotting package. Bioinformatics 23:774–776.
WNK1 Variants & Blood Pressure
PLoS ONE | www.plosone.org 14 April 2009 | Volume 4 | Issue 4 | e5003
Related Documents