Polymorphisms in Stromal Genes and Susceptibility to Serous Epithelial Ovarian Cancer: A Report from the Ovarian Cancer Association Consortium Ernest K. Amankwah 1 , Qinggang Wang 1 , Joellen M. Schildkraut 2 , Ya-Yu Tsai 3 , Susan J. Ramus 4 , Brooke L. Fridley 5 , Jonathan Beesley 6 , Sharon E. Johnatty 6 , Penelope M. Webb 6 , Georgia Chenevix-Trench 6 , Australian Ovarian Cancer Study Group 6,7 , Laura C. Dale 1 , Diether Lambrechts 8 , Frederic Amant 9 , Evelyn Despierre 9 , Ignace Vergote 9 , Simon A. Gayther 4 , Aleksandra Gentry-Maharaj 4 , Usha Menon 4 , Jenny Chang-Claude 10 , Shan Wang-Gohrke 11 , Hoda Anton-Culver 12 , Argyrios Ziogas 12 , Thilo Do ¨ rk 13 , Matthias Du ¨ rst 14 , Natalia Antonenkova 15 , Natalia Bogdanova 13,15 , Robert Brown 16 , James M. Flanagan 16 , Stanley B. Kaye 17 , James Paul 18 , Ralf Bu ¨ tzow 19 , Heli Nevanlinna 20 , Ian Campbell 7,21 , Diana M. Eccles 22 , Beth Y. Karlan 23 , Jenny Gross 23 , Christine Walsh 23 , Paul D. P. Pharoah 24 , Honglin Song 24 , Susanne Kru ¨ ger Kjær 25,26 , Estrid Høgdall 27 , Claus Høgdall 26 , Lene Lundvall 26 , Lotte Nedergaard 28 , Lambertus A. L. M. Kiemeney 29 , Leon F. A. G. Massuger 30 , Anne M. van Altena 30 , Sita H. H. M. Vermeulen 29 , Nhu D. Le 31 , Angela Brooks-Wilson 32,33 , Linda S. Cook 1,34 , Catherine M. Phelan 3 , Julie M. Cunningham 35 , Celine M. Vachon 5 , Robert A. Vierkant 5 , Edwin S. Iversen 2 , Andrew Berchuck 2 , Ellen L. Goode 5 , Thomas A. Sellers 3 , Linda E. Kelemen 1,36 * 1 Department of Population Health Research, Alberta Health Services-Cancer Care, Calgary, Alberta, Canada, 2 Department of Community and Family Medicine, Duke University Medical Center, Durham, North Carolina, United States of America, 3 Division of Cancer Prevention and Control, H. Lee Moffitt Cancer Center and Research Institute, Tampa, Florida, United States of America, 4 Department of Gynaecological Oncology, UCL EGA Institute for Women’s Health, University College London, London, United Kingdom, 5 Department of Health Sciences Research, Mayo Clinic, Rochester, Minnesota, United States of America, 6 The Queensland Institute of Medical Research, Post Office Royal Brisbane Hospital, Australia, 7 Peter MacCallum Cancer Centre, Melbourne, Australia, 8 Vesalius Research Center, VIB and KU Leuven, Leuven, Belgium, 9 Department of Obstetrics and Gynecology, University Hospitals Leuven, Leuven, Belgium, 10 Division of Cancer Epidemiology, German Cancer Research Center, Heidelberg, Germany, 11 Department of Obstetrics and Gynecology, University of Ulm, Ulm, Germany, 12 Department of Epidemiology, School of Medicine, University of California Irvine, Irvine, California, United States of America, 13 Clinics of Obstetrics and Gynaecology, Hannover Medical School, Hannover, Germany, 14 Department of Gynaecology, Jena University Hospital, Jena, Germany, 15 Byelorussian Institute for Oncology and Medical Radiology Aleksandrov N.N., Minsk, Belarus, 16 Epigenetics Unit, Department of Surgery and Cancer, Imperial College London, London, United Kingdom, 17 Section of Medicine, Institute Cancer Research, Sutton, United Kingdom, 18 The Beatson West of Scotland Cancer Centre, Glasgow University, Glasgow, United Kingdom, 19 Department of Pathology, University of Helsinki, Haartman Insitute, Helsinki, Finland, 20 Department of Obstetrics and Gynecology, Helsinki University, Central Hospital, Helsinki, Finland, 21 Department of Pathology, University of Melbourne, Parkville, Australia, 22 Wessex Clinical Genetics Service, Princess Anne Hospital, Southampton, United Kingdom, 23 Women’s Cancer Research Institute at the Samuel Oschin Comprehensive Cancer Institute, Cedars-Sinai Medical Center, Los Angeles, California, United States of America, 24 Strangeways Research Laboratory, Cancer Research United Kingdom, Department of Oncology, University of Cambridge, Cambridge, United Kingdom, 25 Danish Cancer Society, Copenhagen, Denmark, 26 Gynecologic Clinic, Rigshospitalet, University of Copenhagen, Copenhagen, Denmark, 27 Danish Cancer Biobank, Copenhagen and Department of Pathology, Herlev Hospital, University of Copenhagen, Copenhagen, Denmark, 28 Department of Pathology, Rigshospitalet, University of Copenhagen, Copenhagen, Denmark, 29 Department of Epidemiology, Biostatistics, and Health Technology Assessment, Radboud University Nijmegen Medical Centre, Nijmegen, The Netherlands, 30 Department of Obstetrics and Gynaecology, Radboud University Nijmegen Medical Centre, Nijmegen, The Netherlands, 31 Cancer Control Research, British Columbia Cancer Agency, Vancouver, British Columbia, Canada, 32 Genome Sciences Centre, British Columbia Cancer Agency, Vancouver, British Columbia, Canada, 33 Department of Biomedical Physiology and Kinesiology, Simon Fraser University, Burnaby, British Columbia, Canada, 34 Division of Epidemiology and Biostatistics, University of New Mexico, Albuquerque, New Mexico, United States of America, 35 Department of Pathology and Laboratory Medicine, Mayo Clinic, Rochester, Minnesota, United States of America, 36 Departments of Oncology and Medical Genetics, University of Calgary, Calgary, Alberta, Canada Abstract Alterations in stromal tissue components can inhibit or promote epithelial tumorigenesis. Decorin (DCN) and lumican (LUM) show reduced stromal expression in serous epithelial ovarian cancer (sEOC). We hypothesized that common variants in these genes associate with risk. Associations with sEOC among Caucasians were estimated with odds ratios (OR) among 397 cases and 920 controls in two U.S.-based studies (discovery set), 436 cases and 1,098 controls in Australia (replication set 1) and a consortium of 15 studies comprising 1,668 cases and 4,249 controls (replication set 2). The discovery set and replication set 1 (833 cases and 2,013 controls) showed statistically homogeneous (P heterogeneity $0.48) decreased risks of sEOC at four variants: DCN rs3138165, rs13312816 and rs516115, and LUM rs17018765 (OR = 0.6 to 0.9; P trend = 0.001 to 0.03). Results from replication set 2 were statistically homogeneous (P heterogeneity $0.13) and associated with increased risks at DCN rs3138165 and rs13312816, and LUM rs17018765: all ORs = 1.2; P trend #0.02. The ORs at the four variants were statistically heterogeneous across all 18 studies (P heterogeneity #0.03), which precluded combining. In post-hoc analyses, interactions were observed between each variant and recruitment period (P interaction #0.003), age at diagnosis (P interaction = 0.04), and year of diagnosis (P interaction = 0.05) in the five studies with available information (1,044 cases, 2,469 controls). We conclude that variants in DCN and LUM are not directly associated with sEOC, and that confirmation of possible effect modification of the variants by non-genetic factors is required. PLoS ONE | www.plosone.org 1 May 2011 | Volume 6 | Issue 5 | e19642

Welcome message from author
This document is posted to help you gain knowledge. Please leave a comment to let me know what you think about it! Share it to your friends and learn new things together.
Transcript

Polymorphisms in Stromal Genes and Susceptibility toSerous Epithelial Ovarian Cancer: A Report from theOvarian Cancer Association ConsortiumErnest K. Amankwah1, Qinggang Wang1, Joellen M. Schildkraut2, Ya-Yu Tsai3, Susan J. Ramus4, Brooke L.
Fridley5, Jonathan Beesley6, Sharon E. Johnatty6, Penelope M. Webb6, Georgia Chenevix-Trench6,
Australian Ovarian Cancer Study Group6,7, Laura C. Dale1, Diether Lambrechts8, Frederic Amant9, Evelyn
Despierre9, Ignace Vergote9, Simon A. Gayther4, Aleksandra Gentry-Maharaj4, Usha Menon4, Jenny
Chang-Claude10, Shan Wang-Gohrke11, Hoda Anton-Culver12, Argyrios Ziogas12, Thilo Dork13, Matthias
Durst14, Natalia Antonenkova15, Natalia Bogdanova13,15, Robert Brown16, James M. Flanagan16,
Stanley B. Kaye17, James Paul18, Ralf Butzow19, Heli Nevanlinna20, Ian Campbell7,21, Diana M. Eccles22,
Beth Y. Karlan23, Jenny Gross23, Christine Walsh23, Paul D. P. Pharoah24, Honglin Song24, Susanne
Kruger Kjær25,26, Estrid Høgdall27, Claus Høgdall26, Lene Lundvall26, Lotte Nedergaard28,
Lambertus A. L. M. Kiemeney29, Leon F. A. G. Massuger30, Anne M. van Altena30, Sita H. H. M.
Vermeulen29, Nhu D. Le31, Angela Brooks-Wilson32,33, Linda S. Cook1,34, Catherine M. Phelan3, Julie M.
Cunningham35, Celine M. Vachon5, Robert A. Vierkant5, Edwin S. Iversen2, Andrew Berchuck2, Ellen L.
Goode5, Thomas A. Sellers3, Linda E. Kelemen1,36*
1 Department of Population Health Research, Alberta Health Services-Cancer Care, Calgary, Alberta, Canada, 2 Department of Community and Family Medicine, Duke
University Medical Center, Durham, North Carolina, United States of America, 3 Division of Cancer Prevention and Control, H. Lee Moffitt Cancer Center and Research
Institute, Tampa, Florida, United States of America, 4 Department of Gynaecological Oncology, UCL EGA Institute for Women’s Health, University College London, London,
United Kingdom, 5 Department of Health Sciences Research, Mayo Clinic, Rochester, Minnesota, United States of America, 6 The Queensland Institute of Medical Research,
Post Office Royal Brisbane Hospital, Australia, 7 Peter MacCallum Cancer Centre, Melbourne, Australia, 8 Vesalius Research Center, VIB and KU Leuven, Leuven, Belgium,
9 Department of Obstetrics and Gynecology, University Hospitals Leuven, Leuven, Belgium, 10 Division of Cancer Epidemiology, German Cancer Research Center,
Heidelberg, Germany, 11 Department of Obstetrics and Gynecology, University of Ulm, Ulm, Germany, 12 Department of Epidemiology, School of Medicine, University of
California Irvine, Irvine, California, United States of America, 13 Clinics of Obstetrics and Gynaecology, Hannover Medical School, Hannover, Germany, 14 Department of
Gynaecology, Jena University Hospital, Jena, Germany, 15 Byelorussian Institute for Oncology and Medical Radiology Aleksandrov N.N., Minsk, Belarus, 16 Epigenetics
Unit, Department of Surgery and Cancer, Imperial College London, London, United Kingdom, 17 Section of Medicine, Institute Cancer Research, Sutton, United Kingdom,
18 The Beatson West of Scotland Cancer Centre, Glasgow University, Glasgow, United Kingdom, 19 Department of Pathology, University of Helsinki, Haartman Insitute,
Helsinki, Finland, 20 Department of Obstetrics and Gynecology, Helsinki University, Central Hospital, Helsinki, Finland, 21 Department of Pathology, University of
Melbourne, Parkville, Australia, 22 Wessex Clinical Genetics Service, Princess Anne Hospital, Southampton, United Kingdom, 23 Women’s Cancer Research Institute at the
Samuel Oschin Comprehensive Cancer Institute, Cedars-Sinai Medical Center, Los Angeles, California, United States of America, 24 Strangeways Research Laboratory,
Cancer Research United Kingdom, Department of Oncology, University of Cambridge, Cambridge, United Kingdom, 25 Danish Cancer Society, Copenhagen, Denmark,
26 Gynecologic Clinic, Rigshospitalet, University of Copenhagen, Copenhagen, Denmark, 27 Danish Cancer Biobank, Copenhagen and Department of Pathology, Herlev
Hospital, University of Copenhagen, Copenhagen, Denmark, 28 Department of Pathology, Rigshospitalet, University of Copenhagen, Copenhagen, Denmark,
29 Department of Epidemiology, Biostatistics, and Health Technology Assessment, Radboud University Nijmegen Medical Centre, Nijmegen, The Netherlands,
30 Department of Obstetrics and Gynaecology, Radboud University Nijmegen Medical Centre, Nijmegen, The Netherlands, 31 Cancer Control Research, British Columbia
Cancer Agency, Vancouver, British Columbia, Canada, 32 Genome Sciences Centre, British Columbia Cancer Agency, Vancouver, British Columbia, Canada, 33 Department
of Biomedical Physiology and Kinesiology, Simon Fraser University, Burnaby, British Columbia, Canada, 34 Division of Epidemiology and Biostatistics, University of New
Mexico, Albuquerque, New Mexico, United States of America, 35 Department of Pathology and Laboratory Medicine, Mayo Clinic, Rochester, Minnesota, United States of
America, 36 Departments of Oncology and Medical Genetics, University of Calgary, Calgary, Alberta, Canada
Abstract
Alterations in stromal tissue components can inhibit or promote epithelial tumorigenesis. Decorin (DCN) and lumican (LUM)show reduced stromal expression in serous epithelial ovarian cancer (sEOC). We hypothesized that common variants inthese genes associate with risk. Associations with sEOC among Caucasians were estimated with odds ratios (OR) among 397cases and 920 controls in two U.S.-based studies (discovery set), 436 cases and 1,098 controls in Australia (replication set 1)and a consortium of 15 studies comprising 1,668 cases and 4,249 controls (replication set 2). The discovery set andreplication set 1 (833 cases and 2,013 controls) showed statistically homogeneous (Pheterogeneity$0.48) decreased risks ofsEOC at four variants: DCN rs3138165, rs13312816 and rs516115, and LUM rs17018765 (OR = 0.6 to 0.9; Ptrend = 0.001 to 0.03).Results from replication set 2 were statistically homogeneous (Pheterogeneity$0.13) and associated with increased risks at DCNrs3138165 and rs13312816, and LUM rs17018765: all ORs = 1.2; Ptrend#0.02. The ORs at the four variants were statisticallyheterogeneous across all 18 studies (Pheterogeneity#0.03), which precluded combining. In post-hoc analyses, interactionswere observed between each variant and recruitment period (Pinteraction#0.003), age at diagnosis (Pinteraction = 0.04), andyear of diagnosis (Pinteraction = 0.05) in the five studies with available information (1,044 cases, 2,469 controls). We concludethat variants in DCN and LUM are not directly associated with sEOC, and that confirmation of possible effect modification ofthe variants by non-genetic factors is required.
PLoS ONE | www.plosone.org 1 May 2011 | Volume 6 | Issue 5 | e19642

Citation: Amankwah EK, Wang Q, Schildkraut JM, Tsai Y-Y, Ramus SJ, et al. (2011) Polymorphisms in Stromal Genes and Susceptibility to Serous Epithelial OvarianCancer: A Report from the Ovarian Cancer Association Consortium. PLoS ONE 6(5): e19642. doi:10.1371/journal.pone.0019642
Editor: John D. Minna, Univesity of Texas Southwestern Medical Center at Dallas, United States of America
Received December 8, 2010; Accepted April 12, 2011; Published May 2 , 2011
Copyright: � 2011 Amankwah et al. This is an open-access article distributed under the terms of the Creative Commons Attribution License, which permitsunrestricted use, distribution, and reproduction in any medium, provided the original author and source are credited.
Funding: Australia: National Health and Medical Research Council (199600), Cancer Council Tasmania, Cancer Foundation of Western Australia; Belgium: NationalCancer Plan - Action 29; Canada: Alberta Heritage Foundation for Medical Research, Worksafe BC, Canadian Institutes of Health Research, Michael SmithFoundation for Health Research; Denmark: Mermaid 1, The Danish Cancer Society; Finland: Helsinki University Central Hospital Research Fund, Academy ofFinland, the Finnish Cancer Society; Germany: European Community’s Seventh Framework Programme (HEALTH-F2-2009-223175), Federal Ministry of Educationand Research, Programme of Clinical Biomedical Research (01 GB 9401), University of Ulm (P.685); Netherlands: Radboud University Nijmegen Medical Centre, themunicipality and community health service of Nijmegen; U.K.: Cancer Research UK, Association for International Cancer Research, St Andrews, Lon V. SmithFoundation grant LVS-39420, Eve Appeal, OAK Foundation; National Institute for Health Research Biomedical Research Centre; U.S.: Ovarian Cancer ResearchFund, National Institutes of Health (R01-CA-61107, R01-CA-122443, R01-CA-76016,CA-58860, CA-92044, P50 CA83636), Department of Defense (W81XWH-06-1-0220, W81XWH-09-OCRP-CONDEV), American Cancer Society California Division (S10P-06-258-01-CCE), Mayo Foundation, L&S Milken Family Foundation. Thefunders had no role in study design, data collection and analysis, decision to publish, or preparation of the manuscript.
Competing Interests: The authors have declared that no competing interests exist.
* E-mail: [email protected]
Introduction
Cancers at the ovary are the most lethal gynecologic cancer, with
21,650 new cases and 15,520 deaths in the U.S. in 2008 [1]. Most
(.95%) ovarian cancers are epithelial in origin, affecting cells on the
surface of the ovary [2], which are separated from the underlying
ovarian stromal tissue by a basal lamina. The stroma is the
supportive framework of biologic tissue consisting of an extracellular
matrix (ECM) and soluble growth factors that mediate epithelial-
stromal interactions and regulate intercellular communication [3].
Activation of oncogenes and inhibition of tumor suppressor genes in
the epithelium were previously considered to be the only alterations
required for the development of epithelial cancers [4]; however,
alterations in stromal components that disrupt normal cell functions
can lead to morphologic changes that manifest as tumors through
perturbation of the epithelium [3]. For example, radiation-induced
changes in the stromal microenvironment have been shown to
contribute to neoplastic progression of initiated mammary epithelial
cells in vivo [5], and may include processes that activate transforming
growth factor-beta (TGF-b) and initiate ECM remodelling [6,7].
The ECM is composed of different proteins: decorin and lumican
are members of the small leucine-rich proteoglycan family that bind
to collagen in the stroma and are involved in matrix assembly and
structure, and in the control of cell proliferation [8]. The expression
of both decorin and lumican is altered in various cancers [9,10],
including serous epithelial ovarian cancer [11–14]. Conceivably,
factors that alter epithelial-stromal interactions or the cross-talk
among growth factors like TGF-b may also influence expression
and/or activity of decorin or lumican, or vice versa. Such factors
may include inherited genetic susceptibility. This could be
particularly germane to decorin, which binds to TGF-b and serves
as a regulatory control for TGF-b release and activation [15].
In view of the important role of the stroma in epithelial cancers
and the role of decorin and lumican in tumorigenesis, we tested
the hypothesis that inherited variation in DCN and LUM may
influence the risk of serous epithelial ovarian cancer in 18
independent study populations: a discovery set that included
studies from Mayo Clinic (MAY) and the North Carolina Ovarian
Cancer (NCO) study, replication set 1 from Australia (AUS), and
replication set 2 comprised of 12 matched studies from the
Ovarian Cancer Association Consortium (OCAC).
Results
The distributions of selected covariates between cases and
controls in the discovery set and replication set 1 are listed in
Table 1. Covariates were distributed similarly between the
discovery set and replication set 1, including the proportion of
serous carcinomas across tumor stage. The MAFs for the 10
tagSNPs in the discovery set ranged from 0.08 to 0.29 among
controls and were similar in replication set 1 for those SNPs in
common (Table S1).
In the discovery set, decreased risks were associated with serous
epithelial ovarian cancer under both co-dominant and ordinal
models at DCN rs3138165, DCN rs13312816, DCN rs516115 and
LUM rs17018765 (all four SNPs: Ptrend = 0.06) (Table 2). Associ-
ations at all SNPs interrogated in the discovery set are in Table S2.
No statistically significant associations were found in haplotype
analyses (Table S3).
In replication set 1, decreased risk associations were found
under both co-dominant and ordinal models at DCN rs3138165
(Ptrend = 0.009), DCN rs13312816 (Ptrend = 0.01) and LUM
rs17018765 (Ptrend = 0.008) but not at DCN rs516115
(Ptrend = 0.20) or DCN rs741212 (Ptrend = 0.61) (Table 2). Imputed
genotypes tended to assume similar risk associations as typed
SNPs, likely from high LD among these variants (Figure S1). The
squared correlation between imputed and true genotypes was 0.73
for DCN rs3138165, 0.73 for DCN rs13312816, and 0.68 for LUM
rs17018765.
The discovery set and replication set 1 were combined in the
absence of OR heterogeneity (Pheterogeneity$0.48) to increase
statistical power. The decreased risk associations remained evident
at DCN rs3138165 (OR = 0.7; Ptrend = 0.002), DCN rs13312816
(OR = 0.7; Ptrend = 0.002), DCN rs516115 (OR = 0.9; Ptrend = 0.03)
and LUM rs17018765 (OR = 0.6; Ptrend = 0.001) under both co-
dominant and ordinal models (Table 2).
Associations at these four SNPs were tested further in the
OCAC replication set 2, and DCN rs3138165 and rs13312816,
and LUM rs17018765 showed statistically significant increased
risks (Figure 1, Table S4). Within the OCAC replication set 2, the
ORs were statistically homogeneous (Pheterogeneity$0.13), but not
when combined with the discovery set and replication set 1
(Pheterogeneity = 0.001 to 0.03). Heterogeneous ORs were not due to
errors in allele coding.
Information on age at diagnosis (or age at interview for controls)
and on years of study recruitment was available for all studies and
was used to test for SNP interactions in post-hoc analyses in an
effort to explain the OR heterogeneity across studies (Table 3). For
example, the interaction between DCN rs3138165 and age group
was suggestive (Pinteraction with age = 0.04) and per-minor allele
associations were highest among women age,40 years (OR = 2.1;
P = 0.01; 104 cases) and lowest among women $70 years
Decorin and Lumican SNPs and Serous Ovarian Cancer
PLoS ONE | www.plosone.org 2 May 2011 | Volume 6 | Issue 5 | e19642
7

(OR = 0.8; P = 0.24; 510 cases). Results were similar for the three
other SNPs (Pinteraction with age = 0.07 to 0.08; data not shown).
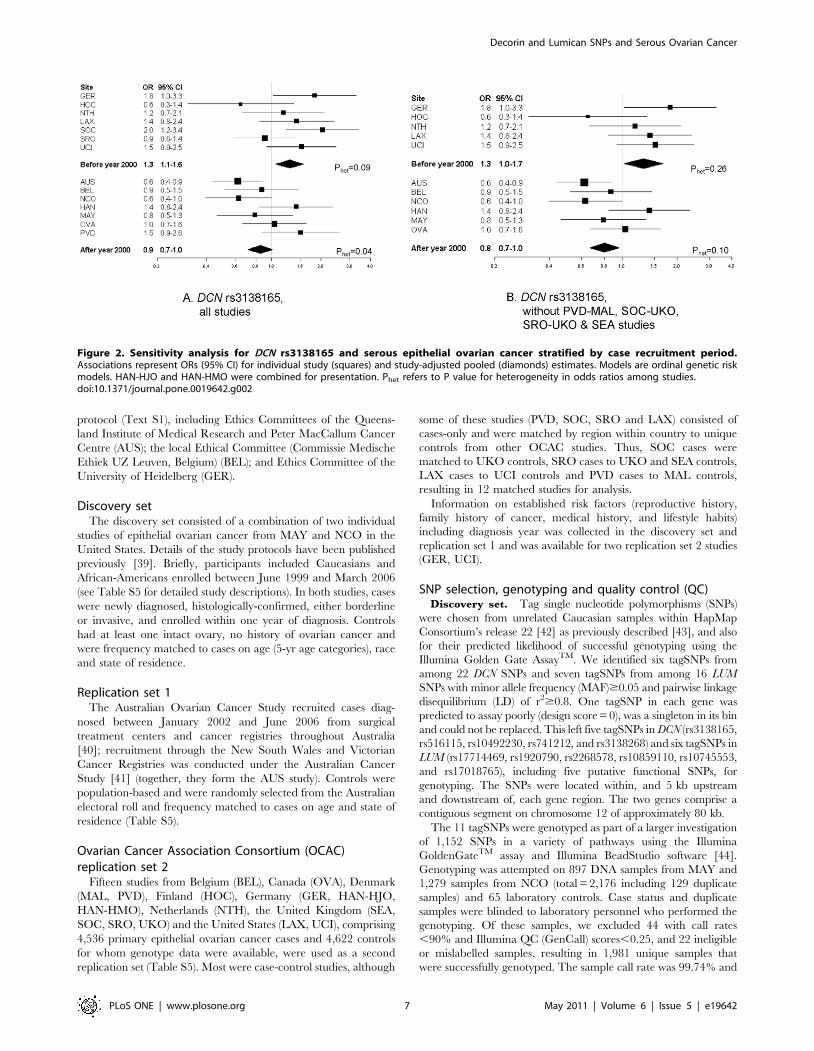
Associations at DCN rs3138165, stratified by period of recruit-
ment, are shown in Figure 2A, and in Figures S2A, S3A and S4A
for the three other SNPs. The per-minor allele summary OR was
1.3 (P = 0.01; 1,007 cases) for studies with a median year of
recruitment before 2000, and 0.9 (P = 0.07; 1,494 cases) after 2000
(all SNPs: Pinteraction with period = 0.002 to 0.01). Because of the
modifying effects of period of recruitment and potentially of age,
we performed a sensitivity analysis by excluding those case-only
studies that were not matched on age and year of recruitment to
controls from other studies. As shown in Figure 2B for DCN
rs3138165, and Figures S2B, S3B and S4B for the three other
SNPs, the per-minor allele summary ORs were relatively
unchanged for studies with a median year of recruitment before
2000 (OR = 1.3; P = 0.03; 612 cases), and after 2000 (OR = 0.8;
P = 0.01; 1,340 cases) (all SNPs: Pinteraction with period = 0.002 to
0.003). However, there was a 20% change in the coefficient for the
interaction term. Likewise, changes in the coefficient for the
interaction term were 19% for DCN rs13312816, 38% for DCN
rs516115 and 16% for LUM rs17018765, consistent with the
definition of an important change-in-estimate effect [16]. This is
particularly true for DCN rs516115, which showed no statistically
significant association in the OCAC replication set 2.
Five studies also had detailed information on covariates (Table 3).
Interactions are presented between DCN rs3138165 and diagnosis year
(Pinteraction for continuous years = 0.07 and Pinteraction for binary variable =
0.05), OC use (Pinteraction = 0.31), parity (Pinteraction = 0.16), BMI
(Pinteraction = 0.12), menopausal status (Pinteraction = 0.41), age at
menarche (Pinteraction = 0.62) and family history (Pinteraction = 0.24).
Per-minor allele associations by diagnosis year mimicked those of
recruitment period (diagnoses prior to year 2000: OR = 1.5; P = 0.14;
148 cases and diagnoses after year 2000: OR = 0.8; P = 0.02; 896
cases). Although the interactions were not statistically significant, per-
minor allele associations at DCN rs3138165 were associated with
lower risk among women who ever took OC hormones (OR = 0.7;
P = 0.03; 604 cases), among women with $3 full-term births
(OR = 0.7; P = 0.01; 573 cases), and among lean women
(OR = 0.6; P = 0.03; 272 cases). Associations were similar for the
three other SNPs (data not shown). Diagnosis year (1993–1999 vs
2000–2006) was associated with OC use (P,0.0001), parity
(P,0.0001), BMI (P,0.0001), menopausal status (P,0.0001), age
at menarche (P,0.0001) and family history (P,0.0001), but not with
age group (P = 0.32) or DCN rs3138165 (P = 0.54), in unadjusted
models. In a model fitting all covariates including DCN rs3138165
and site, only site (P,0.0001) and age at menarche (P = 0.02) were
significantly associated with diagnosis year (data not shown).
Discussion
We could not confirm the associations of SNPs in two stromal
genes, DCN and LUM, with the risk of serous epithelial ovarian
cancer, the most common histological type of ovarian cancer,
using a multi-stage replication approach within the OCAC. We
found decreased risks at four SNPs in the discovery set and
replication set 1, and increased risks in a larger sample of cases in
the OCAC replication set 2. The heterogeneity in associations
Table 1. DistributionA of selected characteristics between cases and controls.
Discovery Set (MAY-NCO) Replication Set 1 (AUS)
Characteristic Cases Controls Characteristic Cases Controls
N 397 920 N 436 1098
Age, yr [mean (SD)] 59.9 (11.2) 57.2 (12.7) Age, yr [mean (SD)] 59.9 (9.95) 57.2 (11.8)
Age at menarche, yr Age at menarche, yr
,12 83 (23.6) 152 (16.8) ,12 77 (17.9) 192 (17.9)
12 84 (23.9) 239 (26.4) 12 102 (23.7) 234 (21.8)
13 97 (27.6) 266 (29.3) 13 109 (25.4) 289 (23.9)
$14 88 (25.0) 250 (27.6) $14 142 (33.0) 358 (33.4)
Oral contraceptive use, mo Oral contraceptive use
Never 168 (43.6) 314 (34.7) No 143 (32.8) 219 (20.0)
1–48 108 (28.1) 223 (24.6) Yes 292 (67.0) 879 (80.1)
$48 109 (28.3) 368 (40.7)
Parity, n/age at first birth, yr Full-term births, n
Nulliparous 64 (16.1) 128 (14.0) 0 61 (14.0) 117 (10.7)
1–2/#20 42 (10.6) 81 (8.8) 1 45 (10.3) 91 (8.3)
1–2/$20 127 (32.0) 341 (37.2) 2 124 (28.5) 359 (32.7)
$3/#20 76 (19.1) 124 (13.5) 3 109 (25.1) 311 (28.3)
$3/$20 88 (22.2) 242 (26.4) .3 96 (27.1) 220 (20.0)
Tumor stage Tumor stage
I 26 (6.7) I 27 (6.5)
II 21 (5.4) II 26 (6.2)
III 282 (72.5) III 320 (76.7)
IV 60 (15.4) IV 44 (10.6)
AData are counts (%) except for age. Sample is 1,317 Caucasian subjects in the discovery set and 1,534 Caucasian subjects in replication set 1.doi:10.1371/journal.pone.0019642.t001
Decorin and Lumican SNPs and Serous Ovarian Cancer
PLoS ONE | www.plosone.org 3 May 2011 | Volume 6 | Issue 5 | e19642
across studies was statistically significant and was explained, in
part, by the period of case recruitment, with the four SNPs
imparting up to a 30% increased risk for diagnoses before the year
2000 and up to a 20% decreased risk after the year 2000. Weaker
interactions were seen with age at diagnosis and with diagnosis
year in post-hoc analyses. Non-statistically significant modifying
effects of OC use, parity and BMI were also observed.
Age-adjusted incidence rates of epithelial ovarian cancer have
been trending lower in most of North America and Europe since
the 1990s [17,18], and since our gene pool is not changing over
such a short period, we speculated that our results reflect changes
in the environment. As expected, there was no statistically
significant association of diagnosis year with DCN rs3138165,
although there were significant associations with several of the
covariates and one of these, age at menarche, remained
statistically significant with diagnosis year in the multivariable-
adjusted model. Our findings may suggest that temporal changes
in risk factors are modifiers of inherited susceptibility in DCN and
LUM. However, we cannot exclude the role of unmeasured factors
that are related to diagnosis year or to study site, or that our
findings are due to chance. Several of the 15 studies in replication
set 2 are new to OCAC, and epidemiological variables for subjects
have not yet been submitted to the central Data Coordinating
Center. We were, therefore, under-powered to evaluate gene-
environment interactions and can only speculate that age,
increasing obesity [19], changing trends in OC hormone
preparation and use [20,21], or increasing age at pregnancy/
decreasing parity [22] may be obvious candidates for future testing
of temporal changes that may modify risk associations of these
SNPs. Each of these hormonally-related factors is associated with
ovarian cancer [23–26]. Studies examining the response of normal
ovarian epithelium to hormonal factors reported that macaque
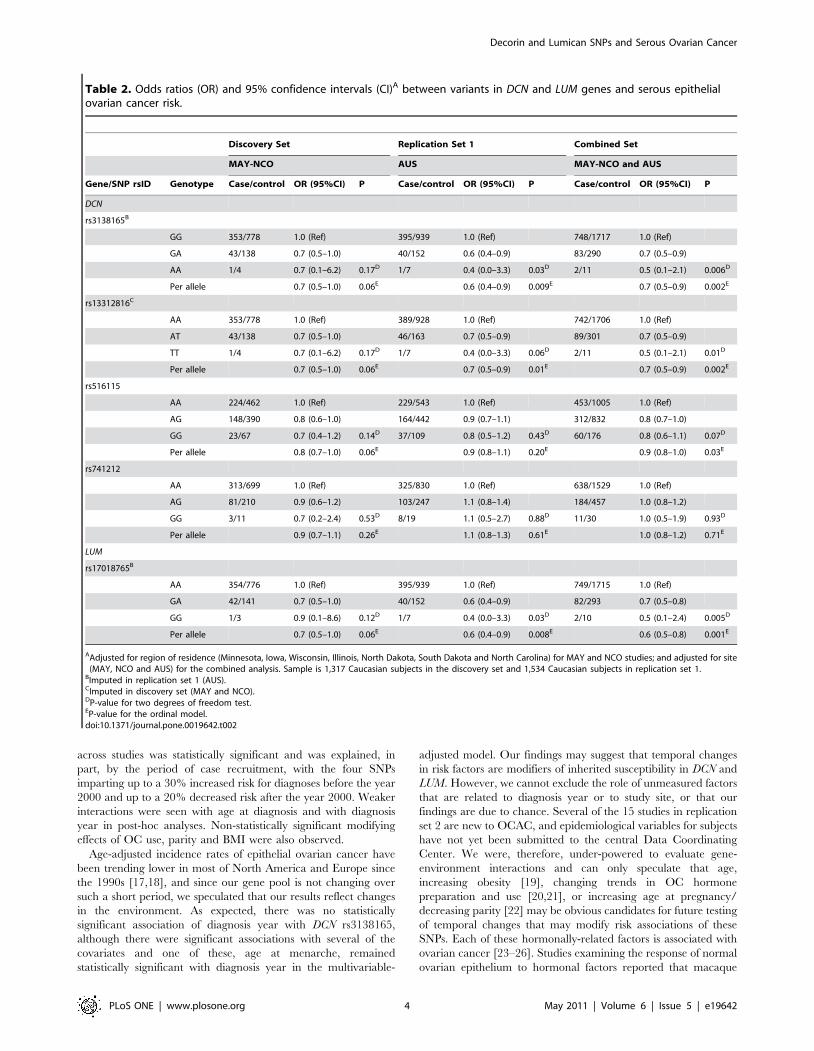
Table 2. Odds ratios (OR) and 95% confidence intervals (CI)A between variants in DCN and LUM genes and serous epithelialovarian cancer risk.
Discovery Set Replication Set 1 Combined Set
MAY-NCO AUS MAY-NCO and AUS
Gene/SNP rsID Genotype Case/control OR (95%CI) P Case/control OR (95%CI) P Case/control OR (95%CI) P
DCN
rs3138165B
GG 353/778 1.0 (Ref) 395/939 1.0 (Ref) 748/1717 1.0 (Ref)
GA 43/138 0.7 (0.5–1.0) 40/152 0.6 (0.4–0.9) 83/290 0.7 (0.5–0.9)
AA 1/4 0.7 (0.1–6.2) 0.17D 1/7 0.4 (0.0–3.3) 0.03D 2/11 0.5 (0.1–2.1) 0.006D
Per allele 0.7 (0.5–1.0) 0.06E 0.6 (0.4–0.9) 0.009E 0.7 (0.5–0.9) 0.002E
rs13312816C
AA 353/778 1.0 (Ref) 389/928 1.0 (Ref) 742/1706 1.0 (Ref)
AT 43/138 0.7 (0.5–1.0) 46/163 0.7 (0.5–0.9) 89/301 0.7 (0.5–0.9)
TT 1/4 0.7 (0.1–6.2) 0.17D 1/7 0.4 (0.0–3.3) 0.06D 2/11 0.5 (0.1–2.1) 0.01D
Per allele 0.7 (0.5–1.0) 0.06E 0.7 (0.5–0.9) 0.01E 0.7 (0.5–0.9) 0.002E
rs516115
AA 224/462 1.0 (Ref) 229/543 1.0 (Ref) 453/1005 1.0 (Ref)
AG 148/390 0.8 (0.6–1.0) 164/442 0.9 (0.7–1.1) 312/832 0.8 (0.7–1.0)
GG 23/67 0.7 (0.4–1.2) 0.14D 37/109 0.8 (0.5–1.2) 0.43D 60/176 0.8 (0.6–1.1) 0.07D
Per allele 0.8 (0.7–1.0) 0.06E 0.9 (0.8–1.1) 0.20E 0.9 (0.8–1.0) 0.03E
rs741212
AA 313/699 1.0 (Ref) 325/830 1.0 (Ref) 638/1529 1.0 (Ref)
AG 81/210 0.9 (0.6–1.2) 103/247 1.1 (0.8–1.4) 184/457 1.0 (0.8–1.2)
GG 3/11 0.7 (0.2–2.4) 0.53D 8/19 1.1 (0.5–2.7) 0.88D 11/30 1.0 (0.5–1.9) 0.93D
Per allele 0.9 (0.7–1.1) 0.26E 1.1 (0.8–1.3) 0.61E 1.0 (0.8–1.2) 0.71E
LUM
rs17018765B
AA 354/776 1.0 (Ref) 395/939 1.0 (Ref) 749/1715 1.0 (Ref)
GA 42/141 0.7 (0.5–1.0) 40/152 0.6 (0.4–0.9) 82/293 0.7 (0.5–0.8)
GG 1/3 0.9 (0.1–8.6) 0.12D 1/7 0.4 (0.0–3.3) 0.03D 2/10 0.5 (0.1–2.4) 0.005D
Per allele 0.7 (0.5–1.0) 0.06E 0.6 (0.4–0.9) 0.008E 0.6 (0.5–0.8) 0.001E
AAdjusted for region of residence (Minnesota, Iowa, Wisconsin, Illinois, North Dakota, South Dakota and North Carolina) for MAY and NCO studies; and adjusted for site(MAY, NCO and AUS) for the combined analysis. Sample is 1,317 Caucasian subjects in the discovery set and 1,534 Caucasian subjects in replication set 1.
BImputed in replication set 1 (AUS).CImputed in discovery set (MAY and NCO).DP-value for two degrees of freedom test.EP-value for the ordinal model.doi:10.1371/journal.pone.0019642.t002
Decorin and Lumican SNPs and Serous Ovarian Cancer
PLoS ONE | www.plosone.org 4 May 2011 | Volume 6 | Issue 5 | e19642

primates receiving progestin alone had higher frequencies of
apoptotic ovarian epithelial cells compared to control animals or
those receiving estrogen alone [27]. Furthermore, the protective
effect of parity may be from exposure to pregnancy hormones such
as progesterone that have been speculated to clear the ovarian
epithelium of precancerous cells [28]. In the macaque study, the
increase in apoptotic cells correlated highly with a shift in
expression from TGF-b1 isoform to TGF-b2 and -b3 isoforms in
the ovarian surface epithelium [29]. TGF-b isoforms appear to be
regulated by a variety of steroid hormones in a tissue-specific
manner (reviewed in [29]). In contrast, ovarian carcinomas are
frequently resistant to TGF-b-mediated growth inhibition [30,31]
and express higher levels of TGF-b1 and TGF-b3, and lower
levels of TGF-b2, than normal human ovarian specimens [30], the
significance of which is unclear.
Decorin and lumican have multiple biological roles including
control of cell proliferation [32]. Interestingly, decorin belongs to
the family of secretory glycoproteins known as latent TGF-b-
binding proteins (LTBPs) that sequesters the pro-hormone or
latent form of TGF-b and prevents it from interacting with its
signaling receptors, TbRI and TbRII [15,33]. LTBPs may
facilitate the secretion, storage or activation of latent TGF-bs
and serve as a reservoir for concentrated delivery of TGF-bs to
receptors [15]. TGF-bs [33] and decorin [34] have been
implicated as potent tumor suppressors; however, the diverse
array of cellular processes regulated by TGF-bs seems to depend
on the microenvironment: for example, promoting apoptosis and
inhibiting epithelial growth in normal cells and promoting
proliferation and angiogenesis in various cancer models [15,35].
The link between progesterone, TGF-bs and decorin is particu-
larly intriguing within the context of our SNP-environment
associations. However, this investigation was not designed to
examine SNP-environment interactions and the power to detect
significant effect modification with the available sample size was
low.
We also compared our results to unpublished findings from two
recent genome wide association (GWA) studies of ovarian cancer,
but there was no clear support for associations at the SNPs. For
example, the four SNPs were not associated statistically with
serous epithelial ovarian cancer (ORs = 0.93–0.96; P = 0.28–0.76)
Figure 1. Forest plots for DCN and LUM SNPs and serous epithelial ovarian cancer. Associations represent ORs (95% CI) for the individualstudy (squares) and study-adjusted pooled (diamonds) estimates. Models are ordinal genetic risk model. HAN-HJO and HAN-HMO were combined forpresentation.doi:10.1371/journal.pone.0019642.g001
Decorin and Lumican SNPs and Serous Ovarian Cancer
PLoS ONE | www.plosone.org 5 May 2011 | Volume 6 | Issue 5 | e19642

in phase 1 of a GWA study comprising 870 Caucasian cases from
the United Kingdom [36]. Among 3,248 serous epithelial ovarian
cancers in a GWA study of Caucasians from the United States, of
which approximately 12% were composed of the 397 cases in our
discovery dataset, we observed modest associations at the DCN
SNPs (ORs = 0.82–0.87; P = 0.02–0.06) and at the LUM SNP
(OR = 1.20; 95% CI = 0.97–1.48; P = 0.09) (unpublished findings).
The discrepancies in results likely reflect similar challenges in
interpretation as the OCAC results and underscore the impor-
tance of understanding the distribution of individual-level
environmental exposures in genetic studies [37].
The strengths of this study include the multi-stage replication
strategy, representing 2,501 total serous epithelial ovarian cancer
cases. To reduce the impact of population stratification, our
analyses were restricted to known or presumed Caucasians.
Although one study (SRO) consisted of mostly Caucasians, our
results were unchanged when this study was excluded in sensitivity
analyses. The characteristics of the samples from the discovery set
and replication set 1 were similarly distributed, as was the period
of recruitment, thus reducing the impact of effect modification on
the SNP-disease associations in these three studies. By restricting
the samples to serous epithelial ovarian cancers, we reduced
etiologic heterogeneity that may exist among different histological
types of ovarian cancer [38]. Finally, we used statistical techniques
to impute untyped SNPs as an efficient approach to include these
SNPs in a combined analysis of samples from the discovery set and
replication set 1.
The major limitation of this investigation is the absence of
epidemiological information for most of the OCAC studies
included in this report. Thus, our findings in the post-hoc
analyses, while intriguing, require a tempered interpretation.
Although MAFs of SNPs were generally similar across OCAC
studies, occasionally a 1.5 to 2-fold difference was observed, which
might suggest population structure influences on associations.
Furthermore, we genotyped tagSNPs, which are likely only proxies
for the putative causal SNP(s).
In summary, our multi-stage replication investigation suggests
that SNPs in DCN and LUM are not associated with serous
epithelial ovarian cancer. Verification of possible effect modifica-
tion by age and other unconfirmed temporal effects is underway in
an OCAC investigation of 10,000 cases and 10,000 controls.
Materials and Methods
Ethics statementParticipants in all the studies provided written informed consent
and each site’s institutional review board approved the study
Table 3. Per-allele odds ratios (OR) and 95% confidenceintervals (CI) at DCN rs3138165 with serous epithelial ovariancancer across strata of risk factors.
Cases/Controls OR (95% CI) P value
Pinteraction
Age at diagnosis/interview, yrsA
0.04
,40 104/938 2.1 (1.2–3.5) 0.01
40–49 406/1,205 1.2 (0.9–1.7) 0.18
50–59 723/1,652 1.0 (0.8–1.3) 0.92
60–69 753/1,643 1.0 (0.8–1.3) 0.97
$70 510/811 0.8 (0.6–1.1) 0.24
Missing 5/18
Diagnosis year,continuousB
1,044/2,469 – – 0.07
Missing 7/62
Diagnosis year,categoriesB
0.09
1993–1995 58/72 1.5 (0.6–3.9) 0.40
1996–1999 90/290 1.6 (0.8–3.1) 0.15
2000–2003 465/1,130 0.9 (0.7–1.2) 0.55
2004–2006 431/977 0.6 (0.4–0.9) 0.01
Missing 7/62
Diagnosis year, binaryB 0.05
1993–1999 148/362 1.5 (0.9–2.5) 0.14
2000–2006 896/2,107 0.8 (0.6–0.9) 0.02
Missing 7/62
Oral contraceptive useB 0.31
Ever 604/1,770 0.7 (0.6–1.0) 0.03
Never 423/728 1.0 (0.7–1.4) 0.84
Don’t know or missing 24/33
Parity, nB 0.16
Nulliparous 98/191 1.2 (0.6–2.2) 0.62
1–2 376/929 1.0 (0.7–1.4) 0.88
$3 573/1,402 0.7 (0.5–0.9) 0.01
Don’t know or missing 4/9
BMI, kg/m2B 0.12
15–22.9 272/674 0.6 (0.4–1.0) 0.03
23–25.9 271/656 0.8 (0.6–1.2) 0.35
26–28.9 198/470 0.8 (0.5–1.3) 0.43
29–34.5 189/477 0.8 (0.5–1.3) 0.49
35–49.9 84/194 1.3 (0.7–2.6) 0.43
,15 or $50 37/60
Menopausal statusB 0.41
Pre- or peri-menopausal 214/758 1.1 (0.7–1.6) 0.63
Post-menopausal 798/1,735 0.8 (0.6–1.0) 0.07
Don’t know or missing 39/38
Age at menarche, yrsB 0.62
8–10 34/59 0.7 (0.2–2.2) 0.57
11 163/359 1.0 (0.6–1.8) 0.96
12 223/579 0.6 (0.4–1.0) 0.05
13 255/686 0.8 (0.5–1.2) 0.30
$14 and #21 312/784 1.0 (0.7–1.4) 0.95
,8 or .21 64/64 1.0 (0.3–3.7) 0.97
Cases/Controls OR (95% CI) P value
Pinteraction
Family historyB,C 0.24
No 313/811 0.6 (0.4–0.9) 0.02
Yes 88/168 0.7 (0.3–1.5) 0.35
No sisters/daughters 187/386 1.0 (0.6–1.7) 0.86
Don’t know or missing 463/1,166 1.0 (0.7–1.3) 0.86
AAmong 18 participating studies.BAmong AUS, GER, MAY, NCO and UCI studies only.CBreast or ovarian cancer in mother, sisters or daughters.doi:10.1371/journal.pone.0019642.t003
Table 3. Cont.
Decorin and Lumican SNPs and Serous Ovarian Cancer
PLoS ONE | www.plosone.org 6 May 2011 | Volume 6 | Issue 5 | e19642
protocol (Text S1), including Ethics Committees of the Queens-
land Institute of Medical Research and Peter MacCallum Cancer
Centre (AUS); the local Ethical Committee (Commissie Medische
Ethiek UZ Leuven, Belgium) (BEL); and Ethics Committee of the
University of Heidelberg (GER).
Discovery setThe discovery set consisted of a combination of two individual
studies of epithelial ovarian cancer from MAY and NCO in the
United States. Details of the study protocols have been published
previously [39]. Briefly, participants included Caucasians and
African-Americans enrolled between June 1999 and March 2006
(see Table S5 for detailed study descriptions). In both studies, cases
were newly diagnosed, histologically-confirmed, either borderline
or invasive, and enrolled within one year of diagnosis. Controls
had at least one intact ovary, no history of ovarian cancer and
were frequency matched to cases on age (5-yr age categories), race
and state of residence.
Replication set 1The Australian Ovarian Cancer Study recruited cases diag-
nosed between January 2002 and June 2006 from surgical
treatment centers and cancer registries throughout Australia
[40]; recruitment through the New South Wales and Victorian
Cancer Registries was conducted under the Australian Cancer
Study [41] (together, they form the AUS study). Controls were
population-based and were randomly selected from the Australian
electoral roll and frequency matched to cases on age and state of
residence (Table S5).
Ovarian Cancer Association Consortium (OCAC)replication set 2
Fifteen studies from Belgium (BEL), Canada (OVA), Denmark
(MAL, PVD), Finland (HOC), Germany (GER, HAN-HJO,
HAN-HMO), Netherlands (NTH), the United Kingdom (SEA,
SOC, SRO, UKO) and the United States (LAX, UCI), comprising
4,536 primary epithelial ovarian cancer cases and 4,622 controls
for whom genotype data were available, were used as a second
replication set (Table S5). Most were case-control studies, although
some of these studies (PVD, SOC, SRO and LAX) consisted of
cases-only and were matched by region within country to unique
controls from other OCAC studies. Thus, SOC cases were
matched to UKO controls, SRO cases to UKO and SEA controls,
LAX cases to UCI controls and PVD cases to MAL controls,
resulting in 12 matched studies for analysis.
Information on established risk factors (reproductive history,
family history of cancer, medical history, and lifestyle habits)
including diagnosis year was collected in the discovery set and
replication set 1 and was available for two replication set 2 studies
(GER, UCI).
SNP selection, genotyping and quality control (QC)Discovery set. Tag single nucleotide polymorphisms (SNPs)
were chosen from unrelated Caucasian samples within HapMap
Consortium’s release 22 [42] as previously described [43], and also
for their predicted likelihood of successful genotyping using the
Illumina Golden Gate AssayTM. We identified six tagSNPs from
among 22 DCN SNPs and seven tagSNPs from among 16 LUM
SNPs with minor allele frequency (MAF)$0.05 and pairwise linkage
disequilibrium (LD) of r2$0.8. One tagSNP in each gene was
predicted to assay poorly (design score = 0), was a singleton in its bin
and could not be replaced. This left five tagSNPs in DCN (rs3138165,
rs516115, rs10492230, rs741212, and rs3138268) and six tagSNPs in
LUM (rs17714469, rs1920790, rs2268578, rs10859110, rs10745553,
and rs17018765), including five putative functional SNPs, for
genotyping. The SNPs were located within, and 5 kb upstream
and downstream of, each gene region. The two genes comprise a
contiguous segment on chromosome 12 of approximately 80 kb.
The 11 tagSNPs were genotyped as part of a larger investigation
of 1,152 SNPs in a variety of pathways using the Illumina
GoldenGateTM assay and Illumina BeadStudio software [44].
Genotyping was attempted on 897 DNA samples from MAY and
1,279 samples from NCO (total = 2,176 including 129 duplicate
samples) and 65 laboratory controls. Case status and duplicate
samples were blinded to laboratory personnel who performed the
genotyping. Of these samples, we excluded 44 with call rates
,90% and Illumina QC (GenCall) scores,0.25, and 22 ineligible
or mislabelled samples, resulting in 1,981 unique samples that
were successfully genotyped. The sample call rate was 99.74% and
Figure 2. Sensitivity analysis for DCN rs3138165 and serous epithelial ovarian cancer stratified by case recruitment period.Associations represent ORs (95% CI) for individual study (squares) and study-adjusted pooled (diamonds) estimates. Models are ordinal genetic riskmodels. HAN-HJO and HAN-HMO were combined for presentation. Phet refers to P value for heterogeneity in odds ratios among studies.doi:10.1371/journal.pone.0019642.g002
Decorin and Lumican SNPs and Serous Ovarian Cancer
PLoS ONE | www.plosone.org 7 May 2011 | Volume 6 | Issue 5 | e19642
the concordance for duplicate samples was 99.99%. DCN
rs3138268, a nonsynonymous SNP, was monomorphic and was
excluded from further analyses. The remaining 10 tagSNPs were
genotyped successfully.Replication set 1. Three tagSNPs in DCN (rs13312816,
rs516115, and rs741212) were genotyped as part of a larger assay
of 1,536 SNPs in AUS (LUM SNPs were not genotyped).
Genotyping was attempted on 1,674 samples using the Illumina
GoldenGateTM assay and Illumina BeadStudio software [44]. One
non-template control and two DNA samples per 96-well plate
were blindly duplicated (n = 18). Samples with call rates ,95%
and SNPs with call rates ,98% were excluded. SNPs with
GenTrain scores (a metric of genotype clustering),0.5 were
manually checked and adjusted according to Illumina guidelines.
Greater than 97% of SNPs passed this initial QC and .84% of all
SNPs passed all QC criteria, resulting in 550 cases and 1,101
controls (93% Caucasians) with genotype data on 1,292 SNPs,
including the three tagSNPs in DCN included in this analysis.Imputation. SNPs genotyped in the discovery set were not
necessarily the same SNPs genotyped in replication set 1 and vice
versa (e.g., only DCN rs516115 and DCN rs741212 were genotyped
in both datasets). Genotypes at SNPs showing significant
associations with ovarian cancer in either dataset were imputed
so that datasets could be combined for analysis. Thus, we imputed
DCN rs13312816 in the discovery set and DCN rs3138165 and
LUM rs17018765 in replication set 1 using the MACH software
[45]. Briefly, genotype data from the discovery set and replication
set 1 were combined with the phase II HapMap data for
Caucasian samples and the unobserved genotypes were then
inferred probabilistically using a hidden Markov model [45].OCAC replication set 2. We genotyped four SNPs (DCN
SNPs rs3138165, rs13312816 and rs516115 and LUM
rs17018765) showing significant associations in the discovery set
and replication set 1 in the 12 matched OCAC studies using the
Fluidigm EP1 system (Fluidigm, San Francisco, CA) at a central
laboratory. Genotyping was performed on 96.96 dynamic arrays
in a run of 96 SNPs using inventoried and Custom Assay-by-
Design TaqMan probes (Applied Biosystems, Foster City, CA).
Genotyping used 10 ng DNA following the manufacturer’s
conditions using the pre-amplification protocol. Analysis was
performed using Genotyping SNP Analysis software. Samples with
call rates ,80% were excluded immediately. The following
criteria were used as measures of acceptable genotyping for each
SNP and each matched study set: (i) $2% sample duplicates
included, (ii) concordance for duplicate samples $96% and overall
concordance for duplicate samples across all SNPs $98%, (iii) pass
rate per plate of .90%, (iv) ,25% overall failed plates, (v) overall
SNP call rate by study $95%, and (vi) a difference in call rate
between cases and controls of ,5%. Studies failing one of these
criteria were excluded for that particular SNP, resulting in 8,886
unique samples (4,419 cases and 4,467 controls) that were
successfully genotyped. Excellent concordance (100%) in
genotype calls was found between study samples and those of 95
HapMap genotyped DNAs (Coriell, Camden, NJ, USA).
For all studies, genotyping quality was further assessed using tests
for Hardy-Weinberg equilibrium (HWE). SNPs with significant
deviations from HWE in Caucasian controls (0.001,P,0.05) were
assessed and excluded if the clustering was suboptimal. SNPs with
HWE P,0.001 were excluded from analysis.
Statistical AnalysisWe restricted analyses to subjects who were self-reported or
presumed Caucasian and cases with invasive epithelial ovarian
cancer of serous histology, resulting in a final sample size of 1,317
participants in the discovery set (397 cases and 920 controls), 1,534
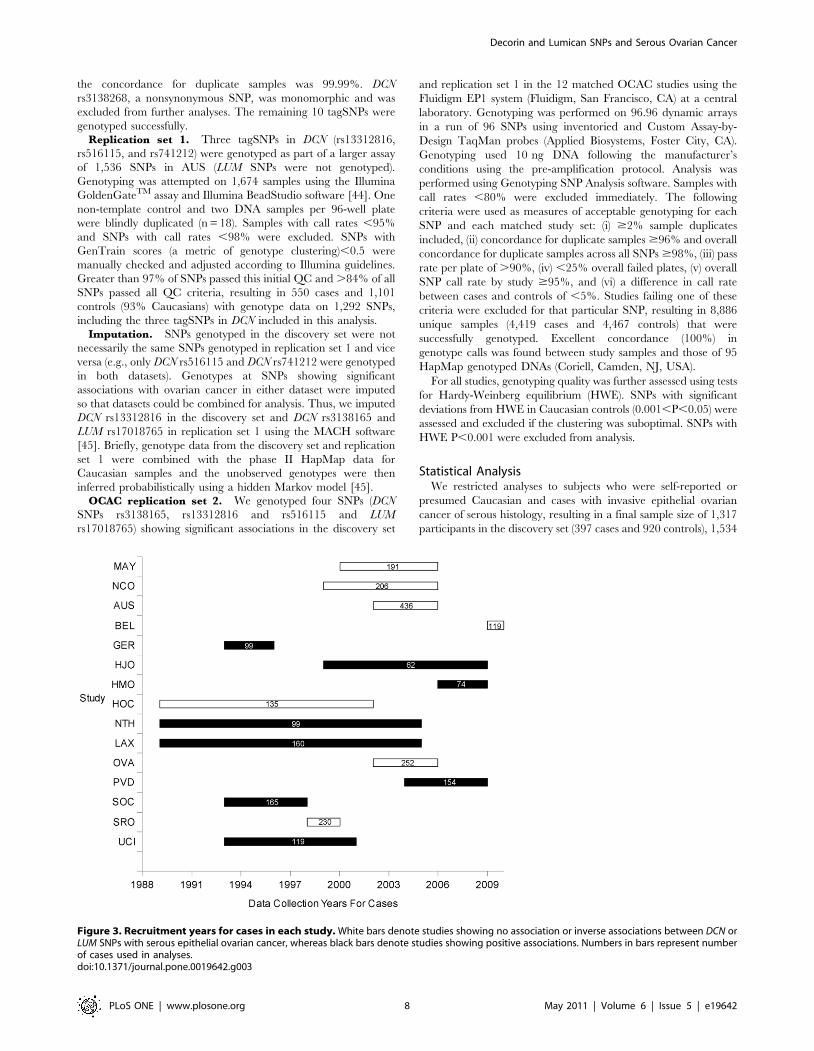
Figure 3. Recruitment years for cases in each study. White bars denote studies showing no association or inverse associations between DCN orLUM SNPs with serous epithelial ovarian cancer, whereas black bars denote studies showing positive associations. Numbers in bars represent numberof cases used in analyses.doi:10.1371/journal.pone.0019642.g003
Decorin and Lumican SNPs and Serous Ovarian Cancer
PLoS ONE | www.plosone.org 8 May 2011 | Volume 6 | Issue 5 | e19642

participants in replication set 1 (436 cases and 1,098 controls) and
5,917 participants in OCAC replication set 2 (1,668 cases and
4,249 controls). Genotypes were used to estimate allele frequencies
and pair-wise LD between SNPs was estimated with r2 values
using Haploview version 4.1 [46].
We estimated odds ratios (OR) and 95% confidence intervals
(CI) at each SNP using unconditional logistic regression under
both co-dominant and ordinal genetic models. In the discovery set
only, we also estimated haplotype frequencies for each gene and
tested the global statistical significance (P,0.05) for haplotype
association [47]. Individual haplotype associations evaluated the
risk of serous epithelial ovarian cancer compared to all other
haplotypes combined.
Prior to combining data, statistical tests of heterogeneity in the
ORs between studies were evaluated. Where heterogeneity existed,
statistical significance of interaction in post-hoc analyses was assessed
with the Wald test in models that included a product term for the
ordinal coding of genotype and categories of age or period of
recruitment (before the year 2000 or after the year 2000 based on the
median year of the recruitment duration for each study, Figure 3)
while adjusting for study. Among the five studies (AUS, GER, MAY,
NCO and UCI) with detailed information on covariates, we also
examined SNP interactions with diagnosis year, oral contraceptive
(OC) use, parity, body mass index (BMI), menopausal status, age at
menarche and family history of breast or ovarian cancer in first
degree relatives. Missing observations were represented as a separate
category within each variable. Associations representing the ordinal
genetic model at each SNP were then stratified by the covariate. All
models were adjusted for region of residence (discovery set only) or
study. Additional adjustment for age categories did not alter
associations, so models are presented without age.
All statistical tests were two-sided with an alpha level,0.05
considered statistically significant, and were implemented with
SAS (SAS Institute, NC).
Supporting Information
Figure S1 Linkage disequilibrium blocks for tagSNPs inDCN and LUM. Analysis is based on total number of controls
from the discovery set and replication set 1. The two genes
comprise a contiguous segment on chromosome 12 of approxi-
mately 80 kb. Numbers in the squares on the LD block indicate
the correlation (r2) between SNPs. * indicates SNPs that were
significantly associated with serous ovarian cancer.
(TIF)
Figure S2 Sensitivity analysis for DCN rs13312816 andserous epithelial ovarian cancer stratified by case recruit-ment period. Forest plots represent associations represent ORs
(95% CI) for individual study (squares) and study-adjusted pooled
(diamonds) estimates. Models are ordinal genetic risk models. HAN-
HJO and HAN-HMO were combined for presentation. Phet refers to
P value for heterogeneity in odds ratios among studies.
(TIF)
Figure S3 Sensitivity analysis for DCN rs516115 andserous epithelial ovarian cancer stratified by case recruit-ment period. Forest plots represent associations represent ORs
(95% CI) for individual study (squares) and study-adjusted pooled
(diamonds) estimates. Models are ordinal genetic risk models. HAN-
HJO and HAN-HMO were combined for presentation. Phet refers to
P value for heterogeneity in odds ratios among studies.
(TIF)
Figure S4 Sensitivity analysis for LUM rs17018765 andserous epithelial ovarian cancer stratified by case
recruitment period. Forest plots represent associations repre-
sent ORs (95% CI) for individual study (squares) and study-
adjusted pooled (diamonds) estimates. Models are ordinal genetic
risk models. HAN-HJO and HAN-HMO were combined for
presentation. Phet refers to P value for heterogeneity in odds ratios
among studies.
(TIF)
Table S1 SNP and location, HWE test P-value and MAF for
variants in DCN and LUM in 920 controls in the discovery set and
1,098 controls in replication set 1.
(DOC)
Table S2 Odds ratios (OR) and 95% confidence intervals (CI)
for the association between genetic polymorphisms in DCN and
LUM and serous epithelial ovarian cancer risk among 1,317
Caucasian subjects in the discovery set.
(DOC)
Table S3 Haplotype analysis of decorin and lumican genes and
invasive serous epithelial ovarian cancer risk among 1,317
Caucasian subjects in the discovery set.
(DOC)
Table S4 Genotype counts, MAF and HWE statistics and
associations between genotypes and risk of ovarian carcinoma for
DCN and LUM SNPs among Caucasian subjects in OCAC
replication set 2.
(DOC)
Table S5 Overview of 18 OCAC studies with serous epithelial
ovarian cancer cases and controls.
(DOC)
Text S1 Ethics statement.
(DOC)
Acknowledgments
We thank Amber Burt for assistance with OCAC data management and
Dr Harvey Risch for insightful comments on the hormonal etiology of
ovarian cancer. The AOCS Management Group (D Bowtell, G Chenevix-
Trench, A deFazio, D Gertig, A Green, and P Webb) gratefully
acknowledges the contribution of all the clinical and scientific collaborators
(see http://www.aocstudy.org/). The AOCS and ACS Management
Group (A Green, P Parsons, N Hayward, P Webb, and D Whiteman)
thank all of the project staff, collaborating institutions and study
participants. The HAN-HJO study gratefully acknowledges the contribu-
tion of Drs Frauke Kramer and Wen Zheng to the recruitment of patients
at Hannover Medical School. The HAN-HMO study gratefully acknowl-
edges the help of Lena Gacucova in sample preparation. The OVA study
gratefully acknowledges Barbara Jamieson, Donna Kan and Rozmin
Janoo-Gilani for their assistance with data management and sample
preparation. The SEA investigators thank the SEARCH team and the
Eastern Cancer Registration and Information Centre for patient
recruitment. SRO gratefully acknowledges support from Scottish Gynae-
cological Clinical Trials Group investigators. The UKO investigators thank
Ian Jacobs, Eva Wozniak, Andy Ryan, Jeremy Ford, Nayala Balogun and
Martin Widschwendter for their contribution to the study, and Clarissa
Ganda, Eva Wozniak and Chris Jones who preformed the replication set 2
genotyping and bioinformatics.
Author Contributions
Conceived and designed the experiments: TAS ELG JMS AB PMW GC-T
SAG PDPP LEK. Performed the experiments: JMC JB SEJ SJR. Analyzed
the data: QW Y-YT BLF SJR LCD RAV ESI LEK. Wrote the manuscript:
LEK EKA. Collected the samples: DL FA ED IV AG-M UM JC-C SW-G
HA-C AZ TD MD NA NB R. Brown JMF SBK JP R. Butzow HN IC DME
BYK JG CW HS SKK EH CH LL LN LALMK LFAGM AMvA SHHMV
NDL AB-W LSC CMP CMV.
Decorin and Lumican SNPs and Serous Ovarian Cancer
PLoS ONE | www.plosone.org 9 May 2011 | Volume 6 | Issue 5 | e19642
References
1. Jemal A, Siegel R, Ward E, Hao Y, Xu J, et al. (2008) Cancer statistics, 2008.
CA Cancer J Clin 58: 71–96.2. Piver MS, Baker TR, Piedmonte M, Sandecki AM (1991) Epidemiology and
etiology of ovarian cancer. Semin Oncol 18: 177–185.3. Ronnov-Jessen L, Petersen OW, Bissell MJ (1996) Cellular changes involved in
conversion of normal to malignant breast: importance of the stromal reaction.Physiol Rev 76: 69–125.
4. Bishop JM (1995) Cancer: the rise of the genetic paradigm. Genes Dev 9:
1309–1315.5. Barcellos-Hoff MH, Ravani SA (2000) Irradiated mammary gland stroma
promotes the expression of tumorigenic potential by unirradiated epithelial cells.Cancer Res 60: 1254–1260.
6. Barcellos-Hoff MH (1993) Radiation-induced transforming growth factor beta
and subsequent extracellular matrix reorganization in murine mammary gland.Cancer Res 53: 3880–3886.
7. Barcellos-Hoff MH, Derynck R, Tsang ML, Weatherbee JA (1994) Transform-ing growth factor-beta activation in irradiated murine mammary gland. J Clin
Invest 93: 892–899.
8. Iozzo RV (1997) The family of the small leucine-rich proteoglycans: keyregulators of matrix assembly and cellular growth. Crit Rev Biochem Mol Biol
32: 141–174.9. Koninger J, Giese NA, di Mola FF, Berberat P, Giese T, et al. (2004)
Overexpressed decorin in pancreatic cancer: potential tumor growth inhibitionand attenuation of chemotherapeutic action. Clin Cancer Res 10: 4776–4783.
10. Leygue E, Snell L, Dotzlaw H, Troup S, Hiller-Hitchcock T, et al. (2000)
Lumican and decorin are differentially expressed in human breast carcinoma.J Pathol 192: 313–320.
11. Shridhar V, Lee J, Pandita A, Iturria S, Avula R, et al. (2001) Genetic analysis ofearly- versus late-stage ovarian tumors. Cancer Res 61: 5895–5904.
12. Nash MA, Deavers MT, Freedman RS (2002) The expression of decorin in
human ovarian tumors. Clin Cancer Res 8: 1754–1760.13. Grisaru D, Hauspy J, Prasad M, Albert M, Murphy KJ, et al. (2007) Microarray
expression identification of differentially expressed genes in serous epithelialovarian cancer compared with bulk normal ovarian tissue and ovarian surface
scrapings. Oncol Rep 18: 1347–1356.14. Grazio D, Pichler I, Fuchsberger C, Zolezzi F, Guarnieri P, et al. (2008)
Differential gene expression analysis of ovarian cancer in a population isolate.
Eur J Gynaecol Oncol 29: 357–363.15. Massague J, Chen YG (2000) Controlling TGF-beta signaling. Genes Dev 14:
627–644.16. Greenland S (1989) Modeling and variable selection in epidemiologic analysis.
Am J Public Health 79: 340–349.
17. National Cancer Institute Surveillance Epidemiology and End Results CancerStatistics Review 1975–2007. http://seer.cancer.gov/csr/1975_2007/browse_
csr.php.18. Bray F, Loos AH, Tognazzo S, La Vecchia C (2005) Ovarian cancer in Europe:
Cross-sectional trends in incidence and mortality in 28 countries, 1953–2000.Int J Cancer 113: 977–990.
19. Flegal KM, Carroll MD, Ogden CL, Curtin LR (2010) Prevalence and trends in
obesity among US adults, 1999–2008. JAMA 303: 235–241.20. Gerstman BB, Gross TP, Kennedy DL, Bennett RC, Tomita DK, et al. (1991)
Trends in the content and use of oral contraceptives in the United States, 1964–88. Am J Public Health 81: 90–96.
21. Gerstman BB, Burke L, Delaney J, McLellan B (1996) Steroidal contraceptive
use update, United States, 1989–1994. Pharmacoepidemiol Drug Saf 5:141–147.
22. Matthews TJ, Hamilton BE (2009) Delayed childbearing: more women arehaving their first child later in life. NCHS Data Brief. pp 1–8.
23. Reeves GK, Pirie K, Beral V, Green J, Spencer E, et al. (2007) Cancer incidence
and mortality in relation to body mass index in the Million Women Study:cohort study. BMJ 335: 1134.
24. Beral V, Doll R, Hermon C, Peto R, Reeves G (2008) Ovarian cancer and oralcontraceptives: collaborative reanalysis of data from 45 epidemiological studies
including 23,257 women with ovarian cancer and 87,303 controls. Lancet 371:
303–314.25. Whiteman DC, Siskind V, Purdie DM, Green AC (2003) Timing of pregnancy
and the risk of epithelial ovarian cancer. Cancer Epidemiol Biomarkers Prev 12:42–46.
26. Risch HA, Marrett LD, Howe GR (1994) Parity, contraception, infertility, andthe risk of epithelial ovarian cancer. Am J Epidemiol 140: 585–597.
27. Rodriguez GC, Walmer DK, Cline M, Krigman H, Lessey BA, et al. (1998)
Effect of progestin on the ovarian epithelium of macaques: cancer preventionthrough apoptosis? J Soc Gynecol Investig 5: 271–276.
28. Adami HO, Hsieh CC, Lambe M, Trichopoulos D, Leon D, et al. (1994) Parity,age at first childbirth, and risk of ovarian cancer. Lancet 344: 1250–1254.
29. Rodriguez GC, Nagarsheth NP, Lee KL, Bentley RC, Walmer DK, et al. (2002)
Progestin-induced apoptosis in the Macaque ovarian epithelium: differentialregulation of transforming growth factor-beta. J Natl Cancer Inst 94: 50–60.
30. Bristow RE, Baldwin RL, Yamada SD, Korc M, Karlan BY (1999) Alteredexpression of transforming growth factor-beta ligands and receptors in primary
and recurrent ovarian carcinoma. Cancer 85: 658–668.
31. Yamada SD, Baldwin RL, Karlan BY (1999) Ovarian carcinoma cell culturesare resistant to TGF-beta1-mediated growth inhibition despite expression of
functional receptors. Gynecol Oncol 75: 72–77.32. Zafiropoulos A, Tzanakakis GN (2008) Decorin-mediated effects in cancer cell
biology. Connect Tissue Res 49: 244–248.33. Shi Y, Massague J (2003) Mechanisms of TGF-beta signaling from cell
membrane to the nucleus. Cell 113: 685–700.
34. De Luca A, Santra M, Baldi A, Giordano A, Iozzo RV (1996) Decorin-inducedgrowth suppression is associated with up-regulation of p21, an inhibitor of
cyclin-dependent kinases. J Biol Chem 271: 18961–18965.35. Siegel PM, Massague J (2003) Cytostatic and apoptotic actions of TGF-beta in
homeostasis and cancer. Nat Rev Cancer 3: 807–821.
36. Song H, Ramus SJ, Tyrer J, Bolton KL, Gentry-Maharaj A, et al. (2009) Agenome-wide association study identifies a new ovarian cancer susceptibility
locus on 9p22.2. Nat Genet 41: 996–1000.37. Ioannidis JP, Thomas G, Daly MJ (2009) Validating, augmenting and refining
genome-wide association signals. Nat Rev Genet 10: 318–329.38. Kobel M, Kalloger SE, Boyd N, McKinney S, Mehl E, et al. (2008) Ovarian
carcinoma subtypes are different diseases: implications for biomarker studies.
PLoS Med 5: e232.39. Sellers TA, Schildkraut JM, Pankratz VS, Vierkant RA, Fredericksen ZS, et al.
(2005) Estrogen bioactivation, genetic polymorphisms, and ovarian cancer.Cancer Epidemiol Biomarkers Prev 14: 2536–2543.
40. Beesley J, Jordan SJ, Spurdle AB, Song H, Ramus SJ, et al. (2007) Association
between single-nucleotide polymorphisms in hormone metabolism and DNArepair genes and epithelial ovarian cancer: results from two Australian studies
and an additional validation set. Cancer Epidemiol Biomarkers Prev 16:2557–2565.
41. Merritt MA, Green AC, Nagle CM, Webb PM (2008) Talcum powder, chronicpelvic inflammation and NSAIDs in relation to risk of epithelial ovarian cancer.
Int J Cancer 122: 170–176.
42. The International HapMap Consortium (2003) The International HapMapProject. Nature 426: 789–796.
43. Kelemen LE, Sellers TA, Schildkraut JM, Cunningham JM, Vierkant RA, et al.(2008) Genetic variation in the one-carbon transfer pathway and ovarian cancer
risk. Cancer Res 68: 2498–2506.
44. Oliphant A, Barker DL, Stuelpnagel JR, Chee MS (2002) BeadArraytechnology: enabling an accurate, cost-effective approach to high-throughput
genotyping. Biotechniques Suppl: 56–58, 60–51.45. Li Y, Willer C, Sanna S, Abecasis G (2009) Genotype imputation. Annu Rev
Genomics Hum Genet 10: 387–406.
46. Barrett JC, Fry B, Maller J, Daly MJ (2005) Haploview: analysis andvisualization of LD and haplotype maps. Bioinformatics 21: 263–265.
47. Scaid DJ (2010) Haplo.stats. Available from: http://mayoresearch.mayo.edu/mayo/research/biostat/schaid.cfm. Accessed 2010.
Decorin and Lumican SNPs and Serous Ovarian Cancer
PLoS ONE | www.plosone.org 10 May 2011 | Volume 6 | Issue 5 | e19642
Related Documents