International Journal of Biological Macromolecules 65 (2014) 346–356 Contents lists available at ScienceDirect International Journal of Biological Macromolecules j ourna l ho me pa g e: www.elsevier.com/locate/ijbiomac Polymers derived from Xanthomonas campesteris and Cyamopsis tetragonolobus used as retardant materials for the formulation of sustained release floating matrix tablet of atenolol Sanjay Dey a,b , Bhaskar Mazumder a,∗ , Sankha Chattopadhyay c , Malay Kanti Das c , Samarendu Sinha d , Shantanu Ganguly d , Kakali De e , Mridula Mishra e a Department of Pharmaceutical Sciences, Dibrugarh University, Dibrugarh 786004, Assam, India b Bengal College of Pharmaceutical Sciences & Research, B.R.B. Sarani, Bidhannagar, Durgapur 713212, West Bengal, India c Radiopharmaceuticals Laboratory, Board of Radiation and Isotope Technology, Variable Energy Cyclotron Centre, Kolkata 700064, West Bengal, India d Regional Radiation and Medicine Centre, Variable Energy Cyclotron Centre, Kolkata 700064, West Bengal, India e Infectious Diseases and Immunology, Indian Institute of Chemical Biology, Jadavpur, Kolkata 700032, West Bengal, India a r t i c l e i n f o Article history: Received 24 September 2013 Received in revised form 16 January 2014 Accepted 19 January 2014 Available online 25 January 2014 Keywords: Atenolol Floating matrix tablet Guar gum Optimization Xanthan gum a b s t r a c t The objective of the present study was to develop, optimize, in vitro, and in vivo evaluation of floating matrix tablet of atenolol using polymer blend derived from Xanthomonas campesteris and Cyamop- sis tetragonolobus that are characterized by release requirements of sustained-release product and to improve the oral bioavailability of the drug. A 3 2 full factorial design was employed to optimize the tablets, where content of polymer blend (X 1 ) and ratio of xanthan gum-to-guar gum (X 2 ) were consid- ered as independent variables. The effects of independent variables on dependent variables, i.e. floating time, diffusion exponent, and time to release 50% of atenolol were evaluated. The in vivo pharmacokinetic parameters of the optimized formulation were compared with the marketed sustained release formula- tion of atenolol (Aten ® ). The optimized formulation containing 20% (w/w) of polymer blend and 50:50 ratio of xanthan gum-to-guar gum was able to float more than 12 h and showed the desired sustained drug release from the tablets. In vivo retention studies in rabbit stomach showed the gastric residence of tablet up to 6 h. The in vivo study of optimized tablets illustrated significant improvement in the oral bioavailability of atenolol in rabbits. It can be concluded that floating matrix tablet of atenolol prepared by using xanthan gum and guar gum has potential for sustained release of the drug as well as improved oral bioavailability through enhanced gastric residence time of formulation in stomach. © 2014 Elsevier B.V. All rights reserved. 1. Introduction Atenolol is a cardioselective beta-1 adrenoceptor blocker devoid of intrinsic sympathomimetic and membrane-stabilizing activities [1,2]. This compound has been widely used for treatment of hyper- tension, cardiac arrhythmia, and angina [3,4]. Half-life and oral bioavailability of atenolol has been reported to be 6–8 h and 50%, respectively [5,6]. It has lower absorption window in the lower gastrointestinal tract [7]. Thus, it seems that an increase in gastric residence time may increase the extent of absorption and bioavail- ability of drug. Dose dumping of certain drugs in plasma results in side effects or a reduction in drug concentration at receptor site. Formulation of sustained release dosage form of that particular drug may not only reduce the dose dumping of the drug but also improve the therapeutic efficacy. The short biological half life of ∗ Corresponding author. Tel.: +919435256182. E-mail address: [email protected] (B. Mazumder). atenolol makes it suitable a candidate for development of sustained release formulations. Natural gums are biodegradable and non toxic, which hydrate and swell on contact with aqueous media and these have been used for the preparation of dosage form [8]. Xanthan gum is a linear, high molecular weight extracellular heteropolysaccharide, produced commercially by fermentation of Gram negative bac- terium Xanthomonas campesteris. It is a hydrophilic polymer widely used as thickening agent in the food industry, and in the pharma- ceutical industry [9]. Xanthan gum has also been used as effective excipients for sustained release formulation; it not only retards drug release, but also provides time-independent release kinetics [10,11]. Guar gum is a polysaccharide, found in the seeds of the plant Cyamopsis tetragonolobus. Researchers have been using guar gum, either alone [12,13], or in combination [14,15] for fabricating sustained release dosage forms. Systemic optimization techniques have been frequently employed for the design and development of controlled-release pharmaceutical dosage forms [16,17]. Such studies are usually 0141-8130/$ – see front matter © 2014 Elsevier B.V. All rights reserved. http://dx.doi.org/10.1016/j.ijbiomac.2014.01.049

Welcome message from author
This document is posted to help you gain knowledge. Please leave a comment to let me know what you think about it! Share it to your friends and learn new things together.
Transcript
Pts
SSa
b
c
d
e
a
ARRAA
KAFGOX
1
o[tbrgrasFdi
0h
International Journal of Biological Macromolecules 65 (2014) 346–356
Contents lists available at ScienceDirect
International Journal of Biological Macromolecules
j ourna l ho me pa g e: www.elsev ier .com/ locate / i jb iomac
olymers derived from Xanthomonas campesteris and Cyamopsisetragonolobus used as retardant materials for the formulation ofustained release floating matrix tablet of atenolol
anjay Deya,b, Bhaskar Mazumdera,∗, Sankha Chattopadhyayc, Malay Kanti Dasc,amarendu Sinhad, Shantanu Gangulyd, Kakali Dee, Mridula Mishrae
Department of Pharmaceutical Sciences, Dibrugarh University, Dibrugarh 786004, Assam, IndiaBengal College of Pharmaceutical Sciences & Research, B.R.B. Sarani, Bidhannagar, Durgapur 713212, West Bengal, IndiaRadiopharmaceuticals Laboratory, Board of Radiation and Isotope Technology, Variable Energy Cyclotron Centre, Kolkata 700064, West Bengal, IndiaRegional Radiation and Medicine Centre, Variable Energy Cyclotron Centre, Kolkata 700064, West Bengal, IndiaInfectious Diseases and Immunology, Indian Institute of Chemical Biology, Jadavpur, Kolkata 700032, West Bengal, India
r t i c l e i n f o
rticle history:eceived 24 September 2013eceived in revised form 16 January 2014ccepted 19 January 2014vailable online 25 January 2014
eywords:tenololloating matrix tabletuar gum
a b s t r a c t
The objective of the present study was to develop, optimize, in vitro, and in vivo evaluation of floatingmatrix tablet of atenolol using polymer blend derived from Xanthomonas campesteris and Cyamop-sis tetragonolobus that are characterized by release requirements of sustained-release product and toimprove the oral bioavailability of the drug. A 32 full factorial design was employed to optimize thetablets, where content of polymer blend (X1) and ratio of xanthan gum-to-guar gum (X2) were consid-ered as independent variables. The effects of independent variables on dependent variables, i.e. floatingtime, diffusion exponent, and time to release 50% of atenolol were evaluated. The in vivo pharmacokineticparameters of the optimized formulation were compared with the marketed sustained release formula-tion of atenolol (Aten®). The optimized formulation containing 20% (w/w) of polymer blend and 50:50
ptimizationanthan gum
ratio of xanthan gum-to-guar gum was able to float more than 12 h and showed the desired sustaineddrug release from the tablets. In vivo retention studies in rabbit stomach showed the gastric residenceof tablet up to 6 h. The in vivo study of optimized tablets illustrated significant improvement in the oralbioavailability of atenolol in rabbits. It can be concluded that floating matrix tablet of atenolol preparedby using xanthan gum and guar gum has potential for sustained release of the drug as well as improved
gh en
oral bioavailability throu. Introduction
Atenolol is a cardioselective beta-1 adrenoceptor blocker devoidf intrinsic sympathomimetic and membrane-stabilizing activities1,2]. This compound has been widely used for treatment of hyper-ension, cardiac arrhythmia, and angina [3,4]. Half-life and oralioavailability of atenolol has been reported to be 6–8 h and 50%,espectively [5,6]. It has lower absorption window in the lowerastrointestinal tract [7]. Thus, it seems that an increase in gastricesidence time may increase the extent of absorption and bioavail-bility of drug. Dose dumping of certain drugs in plasma results inide effects or a reduction in drug concentration at receptor site.
ormulation of sustained release dosage form of that particularrug may not only reduce the dose dumping of the drug but alsomprove the therapeutic efficacy. The short biological half life of
∗ Corresponding author. Tel.: +919435256182.E-mail address: [email protected] (B. Mazumder).
141-8130/$ – see front matter © 2014 Elsevier B.V. All rights reserved.ttp://dx.doi.org/10.1016/j.ijbiomac.2014.01.049
hanced gastric residence time of formulation in stomach.© 2014 Elsevier B.V. All rights reserved.
atenolol makes it suitable a candidate for development of sustainedrelease formulations.
Natural gums are biodegradable and non toxic, which hydrateand swell on contact with aqueous media and these have beenused for the preparation of dosage form [8]. Xanthan gum is alinear, high molecular weight extracellular heteropolysaccharide,produced commercially by fermentation of Gram negative bac-terium Xanthomonas campesteris. It is a hydrophilic polymer widelyused as thickening agent in the food industry, and in the pharma-ceutical industry [9]. Xanthan gum has also been used as effectiveexcipients for sustained release formulation; it not only retardsdrug release, but also provides time-independent release kinetics[10,11]. Guar gum is a polysaccharide, found in the seeds of theplant Cyamopsis tetragonolobus. Researchers have been using guargum, either alone [12,13], or in combination [14,15] for fabricating
sustained release dosage forms.Systemic optimization techniques have been frequentlyemployed for the design and development of controlled-releasepharmaceutical dosage forms [16,17]. Such studies are usually

ological Macromolecules 65 (2014) 346–356 347
cipecii(s
tptaaiwtcs
wpevgiTtip
2
2
IdPsTtSf
a(
2
2m
f[ndosRdwiD
Table 1Factors combination of sustained release tablets as per the chosen experimentaldesign.
Formulation Coded factor levels
X1 X2
F1 −1 −1F2 −1 0F3 −1 1F4 0 −1F5 0 0F6 0 1F7 1 −1F8 1 0F9 1 1
Translation of coded levels in actual units
Coded level
−1 0 1
S. Dey et al. / International Journal of Bi
arried out through response surface methodology (RSM), embody-ng the use of appropriate experimental designs, generation ofolynominal relationships, and optimum search methods, gen-rally using pertinent software [18,19]. Factorial designs areonsidered to be the most efficient in estimating the influence ofndividual variables and their interactions using minimum exper-mentation. A factorial design for two factors at three levels each32) has the added advantage of determining a quadratic responseurface [20,21].
The current study was under taken to develop floating matrixablet of atenolol through incorporation of natural hydrophilicolymers derived from X. campesteris and C. tetragonolobus fromhat is able to enhance the gastric residence time of tablet in stom-ch with the aim of enhancing oral bioavailability of drug. Thisction is followed by sustained release of drug for 12 h to avoidts repetitive administration and improve patients’ compliance as
ell as minimize the incidence of its side effects. To accomplishhe above objective floating matrix tablets were prepared by directompression techniques using conventional tableting facilities in aimple and easy-to-scale-up formulation strategy.
In order to reach the goal of this study, floating matrix tabletsere prepared by using xanthan gum and guar gum and the com-uter aided optimization technique (32 full factorial design) wasmployed to investigate the effect of independent formulationariables, i.e. content of polymer blend and xanthan gum-to-guarum ratio on the various properties of tablets applicable to float-ng time, diffusion exponent, and time to release 50% of atenolol.he physical properties and in vitro drug release studies of all theablet formulations were performed. Finally, in vivo retention andn vivo pharmacokinetic study of the optimized formulation wereerformed on rabbits.
. Materials and methods
.1. Materials
Atenolol was obtained as gift sample from Cipla Ltd., Mumbai,ndia. Xanthan gum and guar gum were purchased from Hime-ia, Mumbai, India. Sodium bicarbonate was received from B.D.harmaceutical Works, Howrah, India. Citric acid and magnesiumtearate were obtained from Loba Chemie Pvt Ltd., Mumbai, India.alc was purchased from Nice Chemie Pvt. Ltd., Mumbai, India. Lac-ose was purchased from Reidel India Chemicals, Mumbai, India.ustained release marketed formulation of atenolol (Aten®, manu-actured by Zydus Cadila, India) was purchased from local market.
Technetium-99m (99mTc) was obtained from the Board of Radi-tion and Isotope Technology, Variable Energy Cyclotron CentreKolkata, India).
.2. Methods
.2.1. Calculation of theoretical release profile of atenolol fromatrix tablets
The total dose of atenolol for twice-a-day sustained releaseormulation was calculated as per Robinson Eriksson equation22] using available pharmacokinetic data [23]. Pharmacoki-etic studies have been showed that 25 mg of atenolol pro-uce expected therapeutic effects within 2 h with a half-lifef 6 h. Thus, the first order overall elimination rate con-tant, ke = 0.693/6 = 0.1155 mg/h. Hence, the availability rate,
= keD = 0.1155 × 25 = 2.8875 mg/h, where D is the initial dose of
rug. The maintenance dose, Dm = Rh = 2.8875 × 11 = 31.7625 mg,here h is the number of hours for which sustained actions desired. Thus, total dose = D + Dm = 25 + 31.7625 = 56.7525 mg.corrected = D − RtP = 56.7625 − 2.8875 × 2 = 50.9875 mg, where tP is
X1 Polymer blend (%) 10 15 20X2 Xanthan gum-to-guar gum ratio 70:30 50:50 30:70
the time period required to achieve a peak plasma level. Hencean oral controlled release formulation of atenolol should containa total dose of 50.9875 mg (≈50 mg) and should release 25 mg in1 h like conventional tablets, and 2.8875 mg per hour up to 12 hthereafter.
2.2.2. Full factorial designA two factor, three-level full factorial design (32) was employed
for optimization of tablets. The content of polymer blend (X1) andthe ratio of xanthan gum-to-guar gum (X2) were selected as inde-pendent variables. Content of polymer blend was evaluated at 10,15, and 20% of total tablet weight and the ratio of xanthan gum-to-guar gum was evaluated at 70:30, 50:50 and 30:70 of totalpolymer content. The floating time, diffusion exponent (n), andtime to release 50% of drug (t50%) were selected as dependent vari-ables. Design-expert 8.0.3. software (Stat-Ease Inc., USA) was usedfor the generation and evaluation of statistical experimental design[24]. The experimental design with corresponding formulations isoutlined in Table 1.
A statistical model, Y = b0 + b1X1 + b2X2 + b12X1X2 + b11X22 +
b22X22 incorporating interactive and polynomial terms were used to
evaluate the effects of independent variables upon the responses.Where Y is the response, b0 is the intercept, and b1, b2, b12, b11, andb22 are regression coefficients. X1 and X2 are individual effects; X2
1and X2
2 are quadratic effects; X1X2 is the interaction effect. One-way ANOVA was employed to estimate the significance of themodel (p < 0.05). The response surface plots, and contour plots wereanalysed to evaluate the effect of independent variables on themeasured responses.
2.2.3. Preparation of floating matrix tabletsFloating matrix tablets of different factorial batches were pre-
pared by direct compression technique according to the formulagiven in Table 1. Each ingredient was shifted through # 80 sieves.The specified quantity (50 mg) of atenolol was taken in a glassmortar and mixed with the required quantity of polymer blendcontaining different ratio of xanthan gum-to-guar gum, sodiumbicarbonate (14 mg), citric acid (7 mg), and lactose with the helpof pastel for 15 min. The powder blend was then mixed with talc(2.8 mg) and magnesium stearate (1.4 mg) used as glidant and
lubricant, respectively for additional 3 min. The lubricated powderblend of different batches were compressed into tablets manuallyusing single-punch tablet machine (Kilburns, Allahabad, India) at
3 iologic
cp
22tfdgw
2ts
2wwM4a
2mgrasTp1tdc(
2pamtct
2(u1flw(opsstp
2rmaH
Z
48 S. Dey et al. / International Journal of B
onstant pressure. The 6 mm of standard flat punch was set in tabletunching machine.
.2.4. Evaluation of physical parameters tablets
.2.4.1. Weight variation test. The weight variation test (n = 3) ofablets were performed by random selecting twenty tablets of eachormulation batches and the average weight of twenty tablets wasetermined using an electronic balance (Sartorius GmbH, Gottin-en, Germany) [25]. Then individual tablets were weighed and theeight of individual weight was compared with an average weight.
.2.4.2. Hardness test. For each formulation, the hardness of sixablets was determined individually using a hardness tester (Mon-ento, Mumbai, India) [25].
.2.4.3. Friability test. Six tablets of each formulation batches wereeighed together to perform the friability test (n = 3) and the tabletsere placed in the drum of a friability test apparatus (Labotech,umbai, India) [25]. The drum was adjusted to rotate 100 times in
min then the tablets were removed from the drum, dedusted, andccurately weighed. The percent weight loss was calculated.
.2.4.4. Drug content uniformity study. Three tablets of each for-ulation batches were weighed individually, then placed in a
lass mortar and powdered with the help of pestle. The tritu-ated tablet equivalent to 25 mg of atenolol was taken in a beakernd 100 mL of methanol was added. The dispersed system wastirred using magnetic stirrer (Labotech, Mumbai, India) for 2 h.he suspension was filtered through a membrane filter (0.22 �more size) and the filtrate was suitably diluted with 0.1 M HCl (pH.2). The absorbance of solution was measured using UV–vis spec-rophotometer (Shimadzu, Japan) at 225 nm. The drug content wasetermined using the regression equation obtained from standardurve of atenolol: absorbance = 0.034 × concentration of atenolol�g/mL) + 0.013 [25].
.2.4.5. In vitro buoyancy study. The in vitro buoyancy study waserformed using USP 24 type II apparatus (Timestan, Kolkata, India)t 100 rpm in 900 mL 0.1 M HCl (pH 1.2). The temperature of theedium was maintained at 37 ± 0.5 ◦C. The time required for tablet
o rise to the surface of medium and duration of time the tabletonstantly float on medium were noted as floating lag time andotal floating time, respectively [25].
.2.4.6. In vitro drug release study. The in vitro drug release studyn = 6) of tablets of different formulation batches was performedsing USP 24 type II apparatus (Timestan, Kolkata, India) at00 rpm. In vitro release study was performed in simulated gastricuid in 0.1 M HCl, pH 1.2 [26]. Each dissolution medium (900 mL)as maintained at 37 ± 0.5 ◦C throughout the study. The samples
5 mL) were withdrawn at predetermined time intervals for periodf 12 h and replaced with equal volume of fresh medium. The sam-les were filtered through membrane filter (0.45 �m pore size),uitably diluted with 0.1 M HCl (pH 1.2). The absorbance of theamples were analysed at 225 nm using UV–vis spectrophotome-er (Shimadzu, Japan). The cumulative percent drug release waslotted against time to determine the release profile.
.2.4.7. Curve fitting of release profile. In order to investigate theelease behaviour of atenolol in 0.1 M HCl (pH 1.2) from the floatingatrix tablets, the in vitro release data were evaluated kinetically
pplying various mathematical models like zero order, first order,iguchi, and Korsmeyer–Peppas model [27].
ero order Qo = Kot (1)
al Macromolecules 65 (2014) 346–356
First order log C = log C0 − K1t
2.303(2)
Higuchi kinetic Qt = Kht1/2 (3)
Korsmeyer−Peppas modelMt
M˛= ktn (4)
where Qo and Qt are the amounts of drug released initially and attime t, Co and C are the concentration of drug initially and at timet, and Ko, K1, and Kh refer to the rate constants obtained from thelinear curves of the respective models. Mt/M∞ is the fraction ofdrug release at time t, and k is the kinetic constant, n is the releaseexponent (indicating the general operating release mechanism).
2.2.4.8. Validation of experimental design. To validate the chosenexperimental design, the experimental values of the responseswere compared with predicted values and the relative error (%)was calculated using the following equation [28]:
Relative error (%) = Predicted value − Experimetal valuePredicted value
× 100(5)
2.2.4.9. Evaluation of in vivo retention of tablet in rabbit stomach.In vivo retention study in rabbits of the optimized formulation wascarried out by gamma scintigraphy study. Whole experiments werecarried out after getting approval from Institutional Animal EthicalCommittee of Indian Institute of Chemical Biology, Kolkata, India.
2.3. Radiolabeling of atenolol
The 99mTc was chosen for the radiolabeling of atenolol becauseof its short half-life (6 h) and because it allows very little electronemission [29]. It can be administered in millicurie amounts, result-ing in a very low radiation dose to the patient. Moreover, 99mTcis readily available in a sterile, pyrogen-free, and carrier-free state.Atenolol was labelled with 99mTc by the stannous reduction method[30]. A specific amount of atenolol (1 mg) was dissolved in 1 mLof 99mTc-pertechnetate (5–60 mCi) in 0.9% saline at a particularpH (3–9) in a glass vial. 2–50 �L of stannous chloride (1 mg/mL;4.4 mM) was added into the solution and the mixture was mixedthoroughly for 30 s. This mixture was allowed to incubate at roomtemperature (25 ◦C) for 30 min.
2.4. Radiochemical purity
The radiochemical yield and purity of 99mTc-labelled atenololwere determined by ascending paper chromatography techniqueusing methyl ethyl ketone (MEK) or ethanol: water: ammo-nium hydroxide mixture (EWA, 2:5:1) as developing solvent[30]. The radioactive contaminates were identified as colloidreduced/hydrolysed 99mTc compound and free 99mTc pertechne-tate. The TLC results were analysed by scanning the TLC strips undera radiometric TLC scanner (Ray Test, miniGita, Germany).
2.5. Effect of pH and stannous chloride concentration
The effect of various parameters like: pH, stannous chloride con-centration and reaction temperature on the labelling yield wereevaluated to optimize the reaction condition. In each case, oneparameter was varied keeping the other parameters constant.
2.6. In vitro stability
The in vitro stability of the radiolabel complex was performedby ascending paper chromatographic technique [30]. The labellingefficiency at different intervals was determined after incubation at37 ◦C.

ologic
2
trpwmwiwtce
2
tDmr
2
m
2
Ibat
2
oo(mtprotda
2
tf
wl(t
4spu
S. Dey et al. / International Journal of Bi
.7. Preparation of radiolabeled atenolol tablet
The dispersion of radiolabelled atenolol was filteredhrough MilliporeTM filter (0.22 �m) to remove the colloideduced/hydrolysed 99mTc compound from 99mTc-atenolol com-ound. 100 �L of the filtered pure radiolabelled atenolol (∼5 mCi)as added to the 40 mg of atenolol powder in a glass vial andixed homogenously with the help of spatula. 100 �L of acetoneas added into the slurry and the slurry was dried carefully under
nfrared lamp to evaporate moisture presented. All the excipientsere taken accurately as per formulation F8, weighed and mixed
horoughly with radiolabelled-atenolol. The powder blend wasompressed into tablet using the same method as mentionedarlier.
.8. Comparative in vitro release studies
A comparative dissolution study was performed with optimizedablet with or without radioactivity to correlate the drug release.issolution study of radioactive tablet was performed by the sameethod as mentioned earlier. The release was compared with the
elease from the tablet without radioactivity.
.9. Gamma imaging in rabbits
The gamma scintigraphy study was performed in three healthyale New Zealand albino rabbits weighing between 2.5 and 3.0 kg.
.9.1. Stability studyStability study of optimized formulation was performed as per
CH guideline. The optimized tablets were kept in polypropyleneottle and stored in a stability chambers maintained at 40 ± 2 ◦Cnd 75 ± 5% RH for six months. Samples were checked initially, afterhree months and further after six months.
.9.2. Pharmacokinetic studyThe pharmacokinetic studies were conducted under approval
f the Institutional Animal Ethical Committee of Gayatri Collegef Pharmacy, Odisha, India. For the experiment, healthy rabbitsNew Zeland albino) of either sex weighing 2.5–3.0 kg were accli-
atized in the animal house for 15 days and fasted for 12 h prioro dose administration with free access to drinking water. Theharmacokinetic study of the optimized formulation and sustainedelease marketed formulation of atenolol (Aten®) were carriedut with the following study design: Single dose, open label,wo periods, two treatments, randomized and complete crossoveresign under fasted condition. Wash out period of one week wasllowed between successive runs.
.10. Dosing and blood sample collections
Three tablets of each formulation were administered orally tohree rabbits of each group along with 10 mL of water by using aeeding tube.
The blood samples (each of about 2 mL from each animal) wereithdrawn from orbital sinus with a 24-G, 1-in. needle and col-
ected directly in tubes containing 300 �L of sodium citrate solution2%, w/v) as anti-coagulant. Blood samples were collected at 0 (pre-
reatment), 0.5, 1, 3, 6, 8, 12, 24, and 36 h.The collected blood samples were immediately centrifuged at000 × g for 10 min at 4 ◦C. The supernatant plasma sample waseparated and stored in a clean screw capped 5 mL polypropylenelasma tubes (Laxbro, Mumbai, India) at −20 ◦C in a deep freezer,ntil further analysis.
al Macromolecules 65 (2014) 346–356 349
2.11. Extraction of drug from plasma
Hundred microliter of plasma sample was taken in a 2 mL glasscentrifuge tube and 10 �L of diltiazem solution (50 �g/mL) wasadded as an internal standard (I.S.). The mixture was vortexed for10 s. Acetonitrile (1.5 mL) was added into the mixture, vortexedfor 10 min using a spinix vortexer (M37610-33, Barnstead Interna-tional, USA) and centrifuged (Biofuge Fresco centrifuge, Heraeus,Germany) for 5 min at 10,000 rpm. The organic layer was aspiratedoff and transferred to a second tube by means of disposable Pas-teur pipette. The collected organic layer was evaporated to drynessunder nitrogen gas flow using nitrogen gas evaporator (Glas-COL,USA) at 25 psi at 40 ◦C. The residue was reconstituted with 100 �Lof reconstitution solvent and the solution was vortexed for 1 minusing multi-pulse vortexer (Glas-COL, USA). The samples were fil-tered through membrane filter (0.45 �m) using syringe filter. Analiquot of 20 �L was injected into the injector of the HPLC system(Hypersil BDS C-18 column, 250 mm × 4.6 mm, 5 �m, 1 mL/min,retention time of atenolol is 8.75 ± 0.04 min, retention time of I.S.is 10.93 ± 0.02 min).
2.12. Determination of pharmacokinetic parameters and theirstatistical evaluation
The total area under plasma concentration time curve (AUC0–∞),the maximum plasma concentration (Cmax), and the time toreach the maximum plasma concentration (Tmax) were selectedas parameters for pharmacokinetic evaluation. The Cmax and Tmax
were obtained directly from the experimental data of plasma con-centration versus time [31]. AUC0–∞ was obtained by adding theAUC0–36 h, which was calculated by the linear trapezoidal methodand the area from the last experimental time point to infinite time(AUC36 h–∞) using the method as described earlier [32]. Differencesin pharmacokinetic parameters were tested statistically by usingone-way analysis of variance. The AUC0–∞ and Cmax values werelogarithmically transformed prior to the statistical analysis. In alltests, a probability value of p < 0.05 was considered statisticallysignificant.
3. Results and discussion
The atenolol has undergone rapid hepatic first-pass metabolismafter peroral administration. Therefore, the oral bioavailability ofatenolol has been reported to be 50% [6]. Atenolol has narrow ther-apeutic window in the small intestine [7]. Hence, development ofa suitable delivery system that has to be increased the residencetime of atenolol in the stomach may improve the absorption andoral bioavailability of atenolol. Gastric floating drug delivery is anapproach towards the prolonging of gastric residence time of for-mulation in the stomach [33]. In current study, floating system ofatenolol was developed by incorporation of sodium bi carbonateand citric acid as gas generating agent and the natural hydrophilicpolymers like xanthan gum and guar gum were used as releaseretardant materials. The hydrophilic natural gums hydrate andswell on contact with water and these have been widely used forthe preparation of single unit dosage forms to sustain the releaseof drug from polymer matrices [34]. As both the polymers used forthe preparation of matrices had high and rapid swelling tendency,leading to quick formation of outer gel layer, which entraps gasformed into the matrix.
3.1. Evaluation of physical parameters of tablets
3.1.1. Weight variationThe average weight of 20 tablets along with standard deviation
of entire formulations is presented in Table 2. The percentage of

350 S. Dey et al. / International Journal of Biologic
Tab
le
2Ph
ysic
o-ch
emic
al
and
buoy
ancy
pro
per
ties
of
the
tabl
ets
of
dif
fere
nt
form
ula
tion
batc
hes
(mea
n
±
S.D
.;
n
=
3).
Para
met
ers
Form
ula
tion
F1
F2
F3
F4
F5
F6
F7
F8
F9
Har
dn
ess
(kg/
cm2)
6.81
±
0.41
7.52
±
0.12
6.94
±
0.10
6.33
±
0.15
7.33
±
0.30
7.13
±
0.21
6.91
±
0.12
7.08
±
0.16
7.01
±
0.35
Wei
ght
vari
atio
n
(mg)
142.
86
±
3.35
141.
51
±
2.58
138.
25
±
0.92
139.
78
±
0.48
137.
22
±
1.53
141.
20
±
3.86
137.
33
±
1.67
139.
02
±
1.97
138.
25
±
1.54
Fria
bili
ty
(%)
0.12
±
0.00
0.23
±
0.01
0.20
±
0.01
0.09
±
0.00
0.08
±
0.01
0.17
±
0.01
0.25
±
0.01
0.05
±
0.01
0.12
±
0.00
Con
ten
t
un
ifor
mit
y
(%)
97.2
8
±
2.36
100.
97
±
1.78
102.
43
±
1.82
98.3
6
±
0.56
97.9
1
±
1.25
99.5
9
±
1.38
98.1
2
±
2.02
99.8
2
±
0.54
97.8
8
±
1.06
Floa
tin
g
lag
tim
e
(min
)
6.95
±
0.86
7.35
±
0.54
4.21
±
0.84
6.01
±
1.01
6.89
±
0.41
6.15
±
0.25
6.82
±
0.55
5.36
±
0.41
2.02
±
0.95
Floa
tin
g
tim
e
(h)
1.05
±
0.35
2.31
±
0.41
6.63
±
0.29
2.45
±
0.32
4.07
±
0.24
10.3
7
±
0.34
8.25
± 0.
35
12.2
3
±
0.44
12.9
8
±
0.70
al Macromolecules 65 (2014) 346–356
weight variation of individual tablets from the average weight wasfound to be within ±5% (w/w) which proved that the entire tabletshave passed the USP weight variation test.
3.1.2. Drug contentThe drug content of all the tablets in each batch was found to
be in the range of 97.28 ± 2.36% to 102.43 ± 1.82%. The results indi-cated that tablets of entire batches have passed the USP criteria forthe drug content of tablets.
3.1.3. HardnessThe hardness of tablets of entire batches was found to be in the
6.81 ± 0.41 kg/cm2 to 7.52 ± 0.12 kg/cm2.
3.1.4. FriabilityThe friability test of tablets of entire batches as presented in
Table 2 depicted that the tablets of entire batches had passed theUSP criteria of friability testing (<1%, w/w). The results revealedthat tablets possess good mechanical strength.
3.2. In vitro buoyancy study
The in vitro buoyancy study of tablets of entire formulationbatches are shown in Table 2. For all the formulations, the timerequired for the tablets to go from the bottom to the top of a beakercontaining 0.1 M HCl (pH 1.2) at 37 ± 0.5 ◦C was found to be less than7.35 min. The floating lag time did not differ vastly with changing inratio of xanthan gum-to-guar gum and content of polymer blend.The polymers used for the preparation of matrices had high andrapid swelling tendency [30], leading to quick formation of outergel layer, which entrapped gas formed into the matrix. Gas gener-ating agents, i.e. sodium bi carbonate and citric acid have played animportant role on floating time (buoyancy) of tablets. The gas gen-erating agents immediately evolved carbon dioxide as its come incontact with 0.1 M HCl solution (pH 1.2), resulting in formation ofpores in the polymer matrices which ultimately helped the dosageform to float above the surface of solvent [35]. Floating time of thedifferent formulations was found to be in the range of 1.05 ± 0.35 hto 12.98 ± 0.70 h. The floating time of the formulation was affectedwith the variation of content of polymer blend. As the polymerblend was increased, the floating time also increased. This mightbe due to the fact that high amount of polymer blend maintainedthe integrity of the tablets for longer duration of time by reducingthe effect of erosion, thus higher amount of polymer blend was ableto hold the carbon oxide generated inside the matrix, resulting inan increased floating time.
3.3. In vitro release study
The in vitro release studies of all floating matrix tablet of entireformulation batches were performed in simulated gastric fluid(0.1 M HCl, pH 1.2) to evaluate the release of atenolol in stom-ach for prolonged periods of time. The release profiles of tabletsof entire formulations are shown in Fig. 1. From the release profile,it was observed that the xanthan gum-to-guar gum ratio influencedthe drug release from the tablets. Varying the amount of polymerblends affected the drug release from the tablets. As the amount ofpolymer blend increased from 10% to 20%, the drug released wasdecreased due to increased in resistance for penetration of waterinto tablet matrix. From the drug release profile of batches from F1to F5 it is seen that the total amount of drug was released within10 h. Release profile of formulations F6 and F7 showed that the
entire drug was released within 12 h, while the burst drug release(65% for F6 and 55% for F7) was observed within 1 h from theseformulations. The drug release profile of batch F8 showed a supe-rior fit to the desired control drug release profile among all the
S. Dey et al. / International Journal of Biological Macromolecules 65 (2014) 346–356 351
bt6wsdfteoiif
3
emKarlftkHddfT
TRo
Fig. 1. In vitro release profile of tablets of different formulation batches (n = 6).
atches. The results of drug release profile of the batch F8 showedhe release of 33% of drug during initial 1 h, while within the first
h 64% of drug was released and the remaining 36% of the drugas released during the remaining 6 h. The tablets of batch F9 also
howed controlled release pattern but significantly less amount ofrug was released from them, so batch F9 was not considered forurther study. The target release profile parameters for proposedablet formulation were calculated as per Robinson and Eriksenquation: after 1 h, 30–35% of the drug is released; after 6 h, 60–65%f the drug is released; and finally, after 12 h, the remaining drugs released [22]. From the in vitro release profile of formulation F8,t is evident that the prepared tablet exhibited release profile thatulfilled the above mentioned release requirement.
.4. Curve fitting of release profile
The in vitro drug release data from the tablets of differ-nt formulation batches were evaluated kinetically using variousathematical models like: zero order, first order, Higuchi, and
orsmeyer–Peppas [27]. The results of the curve fitting into thesebove-mentioned mathematical models are given in Table 3. Whenespective correlation coefficients of the tablets of entire formu-ation was compared, the atenolol released from the differentormulations were found to be followed first-order kinetic, whilehe drug release from the formulation F7 followed zero-orderinetic. The high correlation coefficient value (R2 = 0.912–0.998) ofiguchi model indicated the drug released from tablets throughiffusion of polymer matrices. The value of diffusion exponent (n)
etermined from in vitro drug release data of formulations rangedrom 0.103 to 0.329, indicating Fickian drug release mechanism.he Fickian drug release mechanism demonstrated that the drugable 3esults of curve fitting of the in vitro release data from different formulation batchesf tablets in simulated gastric fluid.
Formulation Zero-order First-order Higuchi Korsemeyer–Peppas
R2 R2 R2 n R2
F1 0.986 0.995 0.998 0.103 0.995F2 0.944 0.975 0.989 0.134 0.995F3 0.881 0.966 0.952 0.138 0.983F4 0.939 0.990 0.985 0.140 0.993F5 0.897 0.989 0.963 0.169 0.984F6 0.907 0.988 0.972 0.169 0.994F7 0.959 0.896 0.992 0.232 0.994F8 0.874 0.981 0.953 0.329 0.971F9 0.815 0.962 0.912 0.327 0.939
Fig. 2. Contour plot showing the relationship between various levels of polymerblends and xanthan gum-to-guar gum ratio on floating time.
released from the tablets was through diffusion of polymer matri-ces and it was in agreement with Higuchi model.
3.5. Optimization data analysis
The effects of content of polymer blend (X1) and xanthan gum-to-guar gum ratio (X2) on floating time, diffusion exponent (n), andtime to release 50% of drug (t50%) are shown in Table 4. The DesignExpert 8.0.3 software provided suitable polynomial model equa-tions involving individual main factors and interaction factors afterfitting these data. The model equations relating floating time (h) asresponse became:
Floating time(h) = 5.13 + 3.91X1 + 3.04X2 − 0.21X1X2
+ 1.61X21 + 0.75X2
2 [R2 = 0.9484]
From the above equation it was observed that both the fac-tors had positive influence on all the response variables studied.The high value of multiple correlation coefficients (R2) clearlyindicates that the responses are strongly dependent on factors stud-ied.
Table 4 portraits that the content of polymer blend (X1) and xan-than gum-to-guar gum ratio (X2) had positive influence on floatingtime. It can be noted from the ANOVA results (Table 5) of the modelfloating time as response that the coefficients b1 and b2 had sta-tistical significance (p < 0.05) with model F-value of 11.02 and R2
value of 0.9484. The contour (Fig. 2) plot indicated the nonlinearincreased of floating time with increased of two independent vari-ables. At low and high levels of X2, Y1 did not significantly (p > 0.05)changes when X1 increased from the −1 level to +1 level. Theresponse surface plot indicated that the content of polymer blendhad greater influence on floating time as compared to xanthangum-to-guar gum ratio.
The model equation relating diffusion exponent as responsebecame:
Diffusion exponent = 0.180 + 0.085X1 + 0.027X2 + 0.015X1X2
+ 0.050X21 − 0.026X2
2 [R2 = 0.9804]
From the above equation it was noticed that as the variables X1and X2 were increased, the diffusion exponent also increased, which
might be due to the fact that increased polymer loading, which inturn delayed the water diffusion into the core of the tablet, led todecreased drug release [36]. Because of the highly viscous gel layer,more resistance to erosion was observed and these matrices could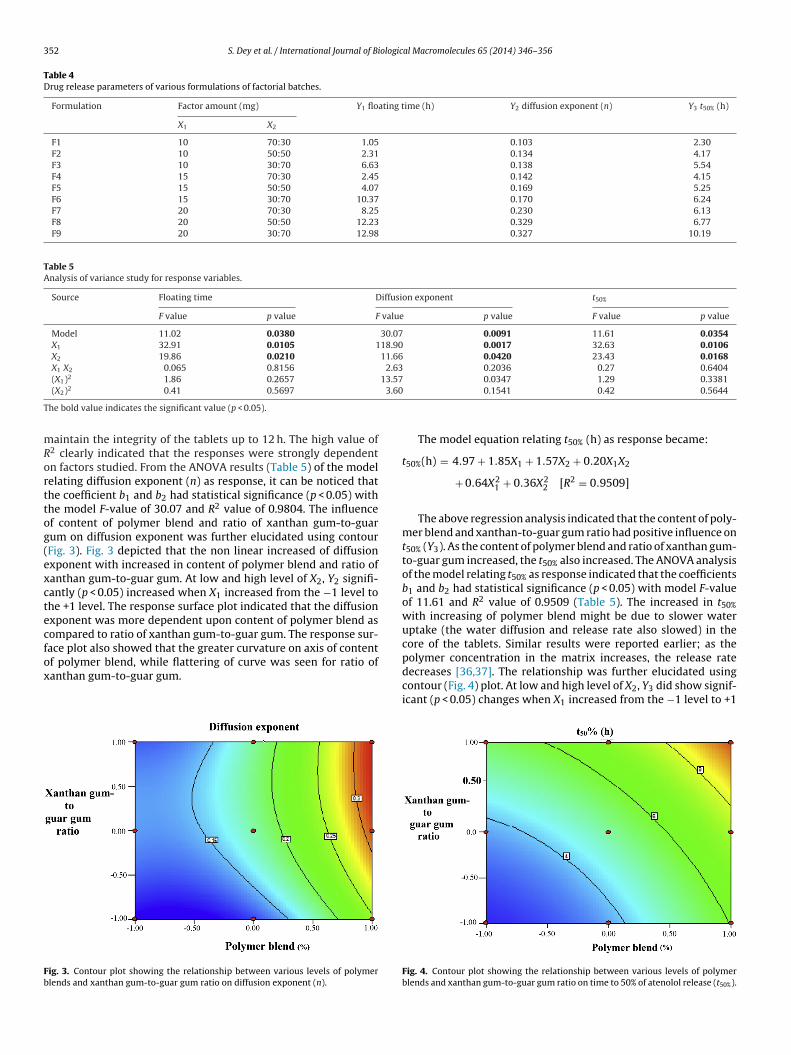
352 S. Dey et al. / International Journal of Biological Macromolecules 65 (2014) 346–356
Table 4Drug release parameters of various formulations of factorial batches.
Formulation Factor amount (mg) Y1 floating time (h) Y2 diffusion exponent (n) Y3 t50% (h)
X1 X2
F1 10 70:30 1.05 0.103 2.30F2 10 50:50 2.31 0.134 4.17F3 10 30:70 6.63 0.138 5.54F4 15 70:30 2.45 0.142 4.15F5 15 50:50 4.07 0.169 5.25F6 15 30:70 10.37 0.170 6.24F7 20 70:30 8.25 0.230 6.13F8 20 50:50 12.23 0.329 6.77F9 20 30:70 12.98 0.327 10.19
Table 5Analysis of variance study for response variables.
Source Floating time Diffusion exponent t50%
F value p value F value p value F value p value
Model 11.02 0.0380 30.07 0.0091 11.61 0.0354X1 32.91 0.0105 118.90 0.0017 32.63 0.0106X2 19.86 0.0210 11.66 0.0420 23.43 0.0168X1 X2 0.065 0.8156 2.63 0.2036 0.27 0.6404(X1)2 1.86 0.2657 13.57 0.0347 1.29 0.3381
3.60
T
mRorttog(exctecfox
Fb
(X2)2 0.41 0.5697
he bold value indicates the significant value (p < 0.05).
aintain the integrity of the tablets up to 12 h. The high value of2 clearly indicated that the responses were strongly dependentn factors studied. From the ANOVA results (Table 5) of the modelelating diffusion exponent (n) as response, it can be noticed thathe coefficient b1 and b2 had statistical significance (p < 0.05) withhe model F-value of 30.07 and R2 value of 0.9804. The influencef content of polymer blend and ratio of xanthan gum-to-guarum on diffusion exponent was further elucidated using contourFig. 3). Fig. 3 depicted that the non linear increased of diffusionxponent with increased in content of polymer blend and ratio ofanthan gum-to-guar gum. At low and high level of X2, Y2 signifi-antly (p < 0.05) increased when X1 increased from the −1 level tohe +1 level. The response surface plot indicated that the diffusionxponent was more dependent upon content of polymer blend asompared to ratio of xanthan gum-to-guar gum. The response sur-
ace plot also showed that the greater curvature on axis of contentf polymer blend, while flattering of curve was seen for ratio ofanthan gum-to-guar gum.ig. 3. Contour plot showing the relationship between various levels of polymerlends and xanthan gum-to-guar gum ratio on diffusion exponent (n).
0.1541 0.42 0.5644
The model equation relating t50% (h) as response became:
t50%(h) = 4.97 + 1.85X1 + 1.57X2 + 0.20X1X2
+ 0.64X21 + 0.36X2
2 [R2 = 0.9509]
The above regression analysis indicated that the content of poly-mer blend and xanthan-to-guar gum ratio had positive influence ont50% (Y3). As the content of polymer blend and ratio of xanthan gum-to-guar gum increased, the t50% also increased. The ANOVA analysisof the model relating t50% as response indicated that the coefficientsb1 and b2 had statistical significance (p < 0.05) with model F-valueof 11.61 and R2 value of 0.9509 (Table 5). The increased in t50%with increasing of polymer blend might be due to slower wateruptake (the water diffusion and release rate also slowed) in thecore of the tablets. Similar results were reported earlier; as the
polymer concentration in the matrix increases, the release ratedecreases [36,37]. The relationship was further elucidated usingcontour (Fig. 4) plot. At low and high level of X2, Y3 did show signif-icant (p < 0.05) changes when X1 increased from the −1 level to +1Fig. 4. Contour plot showing the relationship between various levels of polymerblends and xanthan gum-to-guar gum ratio on time to 50% of atenolol release (t50%).

S. Dey et al. / International Journal of Biological Macromolecules 65 (2014) 346–356 353
Table 6Results of experiments for confirming optimization capability.
Formulation composition Response property Experimental valuea Predicted value Percentage error
13.0/22.5:52.5 Floating time 10.39 10.4832 0.8892Diffusion exponent 0.2691 0.2693 −0.0742t50% 7.930 7.920 0.1266
12.6/23.1:53.9 Floating time 10.78 10.4623 −3.0365Diffusion exponent 0.2663 0.2660 0.1127t50% 7.920 7.908 0.1517
13.4/23.7:55.3 Floating time 10.58 10.7485 1.5681Diffusion exponent 0.2721 0.2724 −0.1101t50% 8.071 8.067 0.0495
12.2/25.2:58.8 Floating time 10.35 10.6502 2.8185Diffusion exponent 0.2627 0.2624 0.1143t50% 8.020 8.011 0.1123
12.8/24.3:56.7 Floating time 10.68 10.6867 −0.0312Diffusion exponent 0.2678 0.2675 0.1121t50% 8.034 8.027 0.0872
11.8/26.1:60.9 Floating time 10.46 10.6772 2.0345Diffusion exponent 0.2590 0.2591 −0.0385t50% 8.021 8.025 −0.0498
littgocbx
sf
F
D
t
3
aaa1stora
3
uotw
Percentage error (mean ± SD)
a The value represents the mean of three determinations.
evel. The contour plot indicated the nonlinear decreased of Y3 withncreased in content of polymer blend and ratio of xanthan gum-o-guar gum. Except a high levels of polymer blend, this decliningrend was observed until intermediate level of xanthan gum-to-uar gum ratio. The steeper ascent in the contour plot with contentf polymer blend than with ratio of xanthan gum-to-guar gum islearly discernible, indicated that the effect of content of polymerlend was comparatively more pronounced than that of ratio ofanthan gum-to-guar gum.
Model simplification was carried out by eliminating non-ignificant terms (p > 0.05) in the polynomial equation resultingrom the multiple regression analysis giving:
loating time (Y1) = 5.13 + 3.19X1 + 3.04X2 (6)
iffusion exponent (Y2) = 0.180 + 0.085X1 + 0.027X2
+ 0.050X21 (7)
50%(Y3) = 0.4970 + 1.850X1 + 1.570X2 (8)
.6. Selection of optimized formulation
After generating the polynominal equation for the dependentnd independent variables, the combination was optimized forll three responses. Upon “trading off” various response vari-bles, the following desirable ranges of responses were restricted:2 ≤ Y1 ≤ 13 h, 0.32 ≤ Y2 ≤ 0.33, and 6 ≤ Y3 ≤ 7 h. Upon comprehen-ive evaluation of feasibility search and subsequently grid searches,he formulation composition with 20% of polymer blend and 50:50f xanthan gum-to-guar gum ratio fulfilled the maximum desiredequisites. The prepared tablet formulation of batch F8 showed Y1s 12.23 h, Y2 as 0.329 and t50% as 6.77 h.
.7. Validation of response surface methodology
Table 6 records the value of observed and predicted responses
sing factorial design along with the percentage error for sixptimum formulations. From the tables the percentage error forhe response variables ranged between −3.0365 and 2.8185%,ith the mean ± standard deviation of the percentage error being0.2687 ± 1.1726
0.2687 ± 1.1726% was observed. Also the linear plots were drawnbetween the predicted and observed responses demonstrated highvalues of R2 (ranging between 0.994 and 0.998) which indicatedexcellent goodness of fit of the model. Thus, the low magnitudes oferror (less than 5%) as well as the significant values of R2 confirmedthe predictability and validity of the model.
3.8. Optimization of radiochemical method
For the optimization of the radiochemical method, the best pro-cess parameters were selected for labelling of atenolol with 99mTc.The labelling efficiency, radiochemical purity, and stability wereassessed by TLC. In the chromatography MEK was used as thedeveloping solvent, colloid reduced/hydrolysed 99mTc compoundand 99mTc-atenolol remained at the point of spotting, while free99mTcO4
− moved towards the solvent front. In EWA solvent system,99mTc-atenolol and 99mTcO4
− moved to the solvent front, whereasreduced 99mTc remained at the point of spotting. The percent radio-chemical purity or yield was calculated as follows:
Radiochemical purity or yield = 100 − (% colloid
+ % free99mTcO4−) (9)
The reduced-hydrolysed 99mTc colloid was removed by filtrationthrough membrane filter (0.22 �m) and the radiochemical purity ofthe 99mTc-atenolol compound was improved from 90% to 98%. Thelabelling yield was found to be depended on amount of atenolol andthe optimum results was obtained in 1 mg of atenolol. The requiredradiochemical purity (about 90%) was reached for the 1 mg atenolol.The effect of the stannous-chloride on radiochemical yield wasstudied between 2 and 50 �g. The highest labelling was obtainedin 10 �g of stannous chloride. The effects of pH were examinedbetween pH 3–9. The complex formation and the highest labellingyield as obtained at pH 8–9. The optimum reaction time was 30 minwhere the maximum yield was obtained. 99mTc-atenolol prepara-tion was found to be stable up to 3 h study in saline and retainedthe same radiochemical purity as found initially. Radiochemical
yield of 99mTc-atenolol preparation was about 90% at the optimumcondition. 99mTc-atenolol preparation contained technetium-99 mcolloid of about 10% and no free pertechnetate (99m TcO4−) werefound at 30 min.

354 S. Dey et al. / International Journal of Biologic
Fa
3
wptbcHrm
3
dAwpt
F(
ig. 5. Comparative in vitro drug released of the optimized tablet formulation oftenolol (with and without radioactivity) (n = 6).
.9. Comparative in vitro release study
The comparative in vitro release profile of the tablets with orithout radiolabeled with 99mTc is shown in Fig. 5. During the com-arison of in vitro release profile between both the formulations,he similarity factor (f2 value) was found to be 61.22. Hence, it cane concluded that the release of atenolol from the formulation hadlose agreement and does not leach out from the tablets in 0.1 MCl (pH 1.2). The release profile also indicated that the drug was
eleased from the formulation through the diffusion of polymeratrices.
.10. Evaluation of in vitro retention of tablet in rabbit stomach
Gamma scintigraphy studies of radiolabeled tablets were con-ucted to evaluate the retention time of tablets in rabbit stomach.
fter administrated the tablet to rabbit the posterior images ofhole rabbit body were taken at different time intervals and theictures are shown in Fig. 6. From the figures it has been seen thathe tablet retained in the stomach more than 6 h.ig. 6. Gamma scintiographic images of stomach taken at various time intervals. The blacFor interpretation of the references to color in this figure legend, the reader is referred to
al Macromolecules 65 (2014) 346–356
3.11. Stability study
The optimized formulation was evaluated for various param-eters (drug content and dissolution study) after 3 and 6 monthsof storage at accelerated stability conditions (40 ± 2 ◦C and 75 ± 5%RH). There were no significant changes in the amount of the drugswere observed in tablets after 6 months of storage at acceleratedstability conditions. The dissolution profile of formulation at initialstage was considered as the reference for dissolution study. Theresults obtained revealed that the dissolution profile of the formu-lation after 6 months of storage at accelerated condition was foundto be similar to that of reference one. Based on the results it wasopinioned that the bilayer tablet was stable after 6 months of stor-age at accelerated stability conditions. The results also revealed thatthe bilayer tablet might provide a minimum shelf life of 2 years.
3.12. Pharmacokinetic evaluation
The mean plasma concentration of atenolol versus timeprofile of optimized formulation (F8) and sustained release mar-keted formulation of atenolol (Aten®) are shown in Fig. 7.The pharmacokinetic parameters were derived from plasmaatenolol concentration versus time profile is shown in Table 7.The tmax of both the optimized formulation (3.08 ± 1.79 h) andAten® (3.13 ± 2.21 h) were found to be similar which indicatedthat the slow absorption rate of drug from both the formu-lations. The average Cmax value of optimized formulation wasincreased as compared to Aten® (27,532.19 ± 1049.61 ng mL−1 to22,699.15 ± 1482.73 ng mL−1). The AUC0–∞ of optimized formu-lation exhibited high value of (342,658.71 ± 6282.96 h ng mL−1)as compared to Aten® (278,177.18 ± 17,322.11 h ng mL−1). TheAUMC0–∞ of optimized formulation was found to be higher(2,796,505.60 ± 52,500.64 h2 ng mL−1) as compared to the lowvalue of Aten® (2,183,637.90 ± 170,640.73 h2 ng mL−1). The Kelvalue for optimized formulation and Aten® were found to be
0.09 ± 0.01 h−1 and 0.09 ± 0.09 h−1, respectively. The MRT of opti-mized formulation was found to be higher (8.16 ± 0.15 h) than thatof Aten® (7.85 ± 0.61 h). The results revealed that the drug wasmade available in the body in a controlled release manner. Thek spot and yellow background represents the tablet and rabbits body, respectively. the web version of the article.)

S. Dey et al. / International Journal of Biological Macromolecules 65 (2014) 346–356 355
Table 7Mean (±S.D.) pharmacokinetic parameters of atenolol in rabbits (n = 3), orally administered with optimized formulation (F8) and sustained release marketed formulation ofatenolol (Aten 50).
Pharmacokinetic parameter Observed value (Optimized formulation) Observed value (Aten 50)
Maximum plasma concentration, Cmax (ng mL−1) 27,532.19 ± 1049.61 22,699.15 ± 1482.73Time required to reach maximum plasma concentration, Tmax (h) 3.08 ± 1.79 3.13 ± 2.21Area under curve at 36 h, AUC0–∞ (h ng mL−1) 342,658.71 ± 6282.96 278,177.18 ± 17,322.11Area under momentum curve at 36 h, AUMC0–∞ (h2 ng mL−1) 2,796,505.60 ± 52,500.64 2,183,637.90 ± 170,640.73Plasma half life, t1/2 (h) 7.54 ± 0.64 7.88 ± 0.35Absorption rate constant, Ka (h−1)
Elimination rate constant, Kel (h−1)Mean residence time, MRT (h)
Fir
rftcsdTtmtaodswb
4
scaTmtrTtTe
[
[
[
[
[[[
[
[
[
[
[
[
[
[
[[
[[
ig. 7. Mean (±S.D.) plasma concentration profiles of atenolol following oral admin-stration of optimized (F8) and sustained release matrix tablets (Aten®) in healthyabbits (n = 3).
esults also demonstrated that the controlled release of atenololrom the optimized formulation not only delayed to reach peako peak plasma concentration, but also prolonged the plasma con-entration of atenolol up to 12 h. This showed that the both theustained release formulations effectively reduced the amount ofrug released and consequently absorbed in vivo in the initial phase.he 90% confidence interval for the ratio of the logarithmicallyransformed AUC0–∞ values of Aten® over those of optimized for-
ulation was found to lie between 0.997 and 0.991, while that ofhe logarithmically transformed Cmax values was between 0.972nd 0.992, both being within the acceptable bioequivalence limitf 0.80–1.25. These pharmacokinetic parameters indicated that therug release maintained smooth extended absorption of drug andustained steady state concentration of atenolol in plasma levelith minimal fluctuations up to 12 h as well as improved the oral
ioavailability of atenolol.
. Conclusions
In this study, atenolol gastro-retentive floating tablet wasuccessfully prepared by using polymer blends derived from X.ampesteris and C. tetragonolobus as polymeric retardant materialsnd sodium bicarbonate and citric acid as gas generating agents.he developed and optimized formulation containing 20% of poly-er blend and 50:50 ratio of xanthan gum-to-guar gum showed
he acceptable physical properties and elicited the required in vitroelease pattern that coincides with the purpose set for this study.
he in vivo retention study of the tablets in rabbit stomach revealedhat the tablets were retained in the rabbit stomach more than 6 h.he derived 90% confidence interval from pharmacokinetic param-ters of optimized formulation and Aten® indicated that they are[
[
0.12 ± 0.01 0.13 ± 0.010.09 ± 0.01 0.09 ± 0.098.16 ± 0.15 7.85 ± 0.61
bioequivalent. In summary, it can be concluded that floating matrixtablet of atenolol derived from X. campesteris and C. tetragonolobusas polymeric retardant materials has potential to sustained deliveryof atenolol and improve the oral bioavailability of drug.
References
[1] A.M. Barrett, J. Carter, J.D. Fitzgerald, R. Hull, D. Count, Brazilian Journal ofPharmacology 48 (1973) 340–342.
[2] J.D. Harry, M.F. Knapp, R.J. Linden, Brazilian Journal of Pharmacology 51 (1974)169–177.
[3] P.A. Majid, W.J.F. Vander Vijgh, P.J. De Feijter, R. Wardeh, E.E. Vander Wall, J.P.Ross, European Journal of Cardiology 9 (1979) 419–435.
[4] W.H. Frishman, New England Journal of Medicine 306 (1982) 1456–1462.[5] A. Melander, P. Stenberg, H. Liedholm, B. Schersten, E. Wahlin-Boll, European
Journal of Clinical Pharmacology 16 (1979) 327–330.[6] G.L. Amidon, H. Lennernas, V.P. Shah, J.R. Crison, Pharmaceutical Research 12
(1995) 413–420.[7] S. Dey, S. Dutta, B. Mazumder, International Journal of Pharmacy and Pharma-
ceutical Science 4 (2012) 433–437.[8] K. Kang, D. Pettitt, in: R. Whistler, J. Bemiller (Eds.), Industrial Gums: Polysac-
charides and Their Derivatives, Academic Press, London, 1993, pp. 341–397.[9] Remington, The Science and Practice of Pharmacy, Nineteenth ed., Mack Pub-
lishing Company, Pennsylvania, 1995.10] V. Dhopeshwarkar, J. Zatz, Drug Development and Industrial Pharmacy 19
(1993) 999–1017.11] L. Fu, L. Woodward, S. Borodkin, Drug Development and Industrial Pharmacy
17 (1991) 1987–2004.12] P. Khullar, R.K. Khar, S.P. Agrawal, Drug Development and Industrial Pharmacy
24 (1998) 479–483.13] E.H. Kuhrts, D.R. Friend, K. Parasrampuria, J. Yu, PCT International Application
WO96 16 (1996) 63–68.14] H.L. Bhalla, A.A. Shah, Indian Drugs 28 (1991) 420–422.15] N.K. Jain, K. Kulkarni, N. Talwar, Pharmazie 47 (1992) 277–278.16] N.B. Vatsraj, H. Zia, T. Needham, Formulation and optimization of a sustained
release tablet of ketorolac tromethamine, in: Proceedings of International Sym-posium on Controlled Release of Bioactive Materials, Paris, July 7–13, ControlledRelease Society, Paris, 2000, p. 8444.
17] M.C. Gohel, A.F. Amin, Drug Development and Industrial Pharmacy 25 (1999)247–251.
18] D.A. Doornbos, P. Haan, in: J. Swarbrick, J.C. Boylan (Eds.), Optimization Tech-niques in Formulation and Processing, Marcel Dekker, New York, 1995, pp.77–160.
19] G.A. Lewis, D. Mathieu, R. Phan-Tan-Luu, Pharmaceutical Experimental Design;Drugs and Pharmaceutical Sciences, vol. 92, Marcel Dekker, New York, 1999;B. Singh, N. Ahuja, Book review on pharmaceutical experimental design, Inter-national Journal of Pharmaceutics 195 (2000) 247–248.
20] S. Bolton, Pharmaceutical Statistics: Practical and Clinical Applications, 2ndedition, Marcel Dekker, New York, 1990, pp. 532–570.
21] N. Kettaneh-Wold, Journal of Pharmaceutical and Biomedical Analysis 9 (1991)605–610.
22] J.R. Robinson, S.P. Eriksen, Journal of Pharmaceutical Science 53 (1966)1254–1263.
23] M.B. Fowler, M. Brudenell, G. Jackson, D.W. Holt, British Journal of ClinicalPractice 38 (1984) 73–74.
24] J. Malakar, A.K. Nayak, Chemical Engineering Research and Design 90 (2012)1834–1846.
25] A.V. Singh, L.K. Nath, Saudi Pharmaceutical Journal 21 (2013) 193–200.26] R. Shakya, P. Thapa, R.N. Saha, Asian Journal of Pharmaceutical Science 8 (2013)
191–198.27] V.F. Patel, N.M. Patel, AAPS PharmSciTech 7 (2006) E1–E7.28] P. Wehrlé, P. Nobelis, A. Cuiné, A. Stamm, Drug Development and Industrial
Pharmacy 19 (1993) 1637–1653.29] Y. Sato, Y. Kawashima, H. Takeuchi, H. Yamamoto, Y. Fujibayashi, Journal of
Controlled Release 98 (2004) 75–85.30] H. Gupta, M. Aqil, R.K. Khar, A. Ali, A. Bhatnagar, G. Mittal, S. Jain, AAPS Pharm-
SciTech 10 (2009) 540–546.

3 iologic
[
[
[[
[
56 S. Dey et al. / International Journal of B
31] D.L. Weiner, in: C.R. Bucncher, J.Y. Tsay (Eds.), Design and Analysis of Bioavail-
ability Studies, Marcel Dekker, New York, 1981, pp. 205–229.32] L. Shargel, A.B.C. Yu, Applied Biopharmaceutics and Pharmacokinetics, 3rd edi-tion, Prentice Hall, New York, 1993, pp. 47–76.
33] B.M. Singh, K.H. Kim, Journal of Controlled Release 63 (2000) 235–259.34] S. Jamzad, R. Fassihi, International Journal of Pharmaceutics 312 (2006) 24–32.
[
[
al Macromolecules 65 (2014) 346–356
35] M.I. Tadros, European Journal of Pharmaceutics and Biopharmaceutics 74
(2010) 222–229.36] Y.S.R. Krishnaiah, R.S. Karthikeyan, V.G. Sankar, V. Satyanarayana, Journal ofControlled Release 81 (2002) 45–56.
37] M.V. Velasco, J.L. Ford, P. Rowe, A.R. Rajabi-Siahboomi, Journal of ControlledRelease 57 (1999) 75–85.
Related Documents